Embed Size (px)
Citation preview
Democracy and Agricultural Protection:
Parametric and Semi-parametric Matching Estimates
Alessandro Olper University of Milano
Jan Fałkowski University of Warsaw
Jo Swinnen Catholic University of Leuven
[Preliminary Draft]
Selected Paper prepared for presentation at the Agricultural & Applied Economics Association 2009 AAEA & ACCI Joint Annual Meeting
Milwaukee, Wisconsin, July 26-29, 2009
Copyright 2009 by [Alessandro Olper, Jan Falkowski and Jo Swinnen]. All rights reserved. Readers may make verbatim copies of this document for non-commercial purposes by any means, provided that this copyright notice appears on all such copies.
2
Democracy and Agricultural Protection:
Parametric and Semi-parametric Matching Estimates
Alessandro Olper* University of Milano
Jan Fałkowski University of Warsaw
Jo Swinnen Catholic University of Leuven
[Preliminary Draft]
Abstract We estimate the effect of democratic transitions on agricultural protection in a sample of 74 developing and developed countries, observed in the 1955-2005 period. We employ both differences-in-differences regressions and semi-parametric matching methods, exploiting the time series and cross-sectional variation in the data. Our semi-parametric matching estimates show that parametric methods might underestimate the true effect of democracy on agricultural protection. We find a strong increase in agricultural protection (reduce in taxation) after a country transition to democracy. Specifically a democratic transition increases agricultural protection by about 9 percent points. However, the effect is asymmetric as the effect of leaving democracy on protection is close to zero. The evidence supports the redistributive nature of democratic institutions toward the majority and, therefore, it is not inconsistent with the median voter model of political behaviour.
JEL codes: D72, F13, O13, P16, Q18
Keywords: Democratic Reforms, Agricultural Distortions, Comparative Political Economics
* Corresponding author.
3
1. Introduction
In the last decade the idea that political institutions matter for the economic policy making
has gained growing emphasis in the economic literature. Institutions, by shaping the rules
of the game, determine the context in which key functions of government, like
redistribution of income and the provision of public goods, are undertaken (Persson and
Tabellini, 2003). However, actual theory offers two contrasting views about the effect of
democratic institutions on public policy outcomes. Indeed, moving from voting models to
positive theories of public policy we reach a completely different view (see Mulligan et al.
2004).
Models based on the median voter theorem (Downs, 1957) emphasized that in
democracies the distribution of political power is more equal than the distribution of
income and wealth. As a consequence, voting models predict that democracies tend to
redistribute from the rich to the poor, and this will be exacerbated by the level of income
inequality as the middle-class have more incentive to form coalition with the poor (see
Alesina and Rodrik, 1994; Persson and Tabellini, 1994). Influential political economy
models based on this logic are those by Acemoglu and Robinson (2000; 2006) that indeed
predict redistribution from the elite to the citizen after an extension of voting rights. A
similar mechanisms that can induce different fiscal policy across democracy and
autocracy are those proposed by Olson (1993) and McGuire and Olson and (1996). The
idea is that in democracies the tax rates are lower because people can voice against it.
Differently, the aim of the autocrat is to maximize the tax rate so that he can get highest
amount of resource to devote to his private interest. Hence, autocracies in contraposition
to democracies tend to tax more and spend less for general public goods.1
A completely different view can be found in the positive theory of public policy (e.g.
Wittman, 1989) as well as in the ‘Chicago school’ of political economy (Stigler, 1971;
Peltzman, 1976; Becker, 1983). Here the voting process represents only one, and often not
the most important, mechanism that affects public policy. Indeed, what matters as a key
determinant of policy is efficiency. Political factors such as elections and voting rules are
presumed either to be unimportant or just reactions to efficiency considerations. These 1 Other models that emphasize a central role for political institutions in the economic policy-making are those developed in the recent comparative politics literature (see Persson and Tabellini, 2000). However, as their focus is on differences in the forms of democracy, they are less useful to understand differences in government policies between democracies and autocracies.
4
approaches stress that the key determinants of the policy-making are economic and
demographic factors, such as interest group structure, urban location and the technology
of tax collection, through their effects on both the public interest and the effectiveness of
interest groups. Thus, when those factors are controlled for, differences in political
regimes, if any, have only second order effects on policy outcomes (Mulligan et al. 2004).
Economic and policy consequences of democratic/autocratic institutions have recently
received much attention in the literature. It is now well known that linkages between
democracy and growth, when studied across-countries, are ambiguous and inconclusive
(see Barro, 1997; Glaeser et al. 2004). However, a growing literature exploiting the within
country variation in the data and difference-in-differences methodology (Papaioannou and
Siourounis, 2008; Rodrik and Wacziarg, 2005; Giavazzi and Tabellini, 2005; Persson and
Tabellini, 2006) also in combination with semi-parametric methods (Persson and
Tabellini, 2007), shows that the effect of democracy on growth tends to be positive and
large in magnitude2. Other important contributions to the strand of literature dealing with
the impact of political regime on public policies include, among others, Besley et al.
(2007), Acemoglu (2005), Banerji and Ghanem (1997) and Besley and Kudamatsu (2006).
The former two papers, provide some theoretical considerations regarding public goods
provision. The latter two, on the other hand, represent examples of a rich empirical
literature studying the effect of democracy on public policy outcomes. In this context,
Banerji and Ghanem (1997) show cross-country evidence supporting the view that
authoritarian regimes are associated with higher trade protectionism and greater labor
market distortions. Belsey and Kudamatsu (2006) on the other hand, using panel data find
that health policy interventions are superior in democracies.
When dealing with the influence of political regimes on policy outcomes, it is
important to note a close relationship between the emergence of democratic institutions,
the structure of the economy, and the role of agricultural sector in particular. For example,
Acemoglu and Robinson (2006) emphasize that democracy is more likely when the elites
are industrialists rather than landowners.3 Comparing this view with the one that perceives
democracy as a concession from authoritarian ruler to raise taxation (Acemoglu and
2 On the positive effect of democracy and growth, see also the recent contribution of Aghion et al. (2007), that stresses how political rights induce positive growth, especially in more advanced sectors. Differently, on the long-run interplay between income and democracy see the contribution of Acemoglu et al. (2008) and of Gundlach and Paldam (2008). 3 Already Moore (1966) and Dahl (1971) pointed that democracy was not feasible in agrarian societies and could emerge only where agricultural land commercialised and was no longer of feudal character.
5
Robinson, 2006) implies that transition to democracy may result in significant shift in
agricultural policies.
The purpose of this paper is to explore these issues further by reconsidering the link
between democracy and trade policies using a rich dataset on agricultural policy
distortions recently developed by the World Bank (see Anderson and Valenzuela, 2008).
The data cover a sample of 74 developing and developed countries in the period from
1955 to 2005. By exploiting the panel dimensions of the dataset we investigate whether
the effect of regime changes – transitions from autocracy to democracy and vice-versa –
systematically affect the taxation/subsidization patterns in agriculture protection. The key
idea behind our empirical approach is to exploit both the cross-country and time series
variation in the data (see Giavazzi and Tabellini, 2005). Specifically, we study the effect
of democratic reforms using a difference-in-difference technique, as well as by combining
it with propensity score matching methods along the line first introduced by Persson and
Tabellini (2007).
Several recent papers have investigated how democracy affect economic (trade)
liberalization at aggregated level. For example, de Haan and Sturm (2003) working on a
developing country sample, show that greater political freedom furthers economic
freedom. Similarly, Milner and Kubota (2005) show that regime change towards
democracy is associated with more trade liberalization in developing countries. More
general evidence on the relationship between regime changes and economic (trade)
liberalization can be found in Giavazzi and Tabellini (2005) and Persson (2005). The
former, using difference-in-difference estimation, show that economic liberalization tend
to precede political liberalization, and not vice-versa. The latter, using a similar estimation
strategy, shows that what matters is not the dichotomy between democracy and autocracy,
but the form of democracy. The majority of this literature focused on how democracy
affects policy (and vice versa) at the aggregated level. Differently, our focus here is at the
industry level. This difference in focus could be important as one of the key
transformation with economic development is through structural change. Thus, because
democracy and development go hand in hand, focusing (only) at aggregate level could
mask several potential sources of variation in the economic and political forces.
In the context of agricultural policy outcomes, all previous evidence but one, exploit
especially the cross-country variation in the data showing mixed and often weak evidence
on the effect of democracy on agricultural protection (see Beghin and Kherallah, 1994;
6
Swinnen et al. 2000; Olper, 2001)4. Differently, Swinnen et al. (2001), exploiting the
within-country variation show that only those democratic reforms that determine a
significant shift in the political balance towards agricultural interests – e.g. the extension
of voting rights to small farmers in Belgium in the early 20th century – induced an
increase in agricultural protection.5
Our approach has a number of attractive features. First, in contrast to cross-country
studies the difference-in-difference approach allows us to overcome several strong
identifying assumption typically made by previous literature investigating the relationship
between democracy and public policy (e.g. Mulligan et al. 2004). Second, as the more
recent micro-econometric literature have questioned the results obtained from the standard
difference-in-difference procedure (see, e.g., Abadie, 2005), by combining it with
propensity score matching we are able to investigate the causal effect of democracy on
public policy, an issue rarely covered by existing empirical studies. Third, our endogenous
variable, agricultural distortions, represent a comprehensive measure of all the distortions
that affect the agricultural industry. From this point of view, it represents an improvement
with respect to similar papers that have used as endogenous variable openness index (e.g.
Giavazzi and Tabellini, 2005) largely criticized in the literature (see Rodriquez and
Rodrik, 2001). The last point is important, as the more recent evidence on the interplay
between democracy and trade policy have emphasized the sensitivity of the results on how
openness is measured (see Tavares, 2007).
The evidence reported in this paper strongly suggests that democratization matters for
the orientation of agricultural policies. Controlling for both observed and unobserved
source of heterogeneity we find a robust positive effect of transition into democracy on
agricultural protection. Our results show that standard difference-in-difference approach
might underestimate the true effect of a democratic reform. In particular, the average
positive effect of a transition to democracy on agricultural protection is about 9 percent
points when semi-parametric methods are used, but it drops to about 5 percent points
when standard difference-in-difference regression is applied. Moreover, the relationship is
4 Important precursors of this kind of analyses can be found in the works of Bates (1983; 1989) on agrarian development in African countries. Moreover, the relationship between democracy and agricultural protection was first highlighted by Lindert (1991), who in a cross-country analysis found a positive relationship when democracy was associated with rapid agricultural decline. Other relevant institutional dimensions like ideology, land inequality and electoral rules are investigated by Olper and Raimondi (2004), Olper (2007), Thies and Porche (2007) and Henning (2008). However, given our focus on democratic reforms, we do not further discuss these interesting lines of research. 5 This result is important as it highlights the importance of drawing inferences from regime changes to more carefully capture the effect of democratization on protection (Swinnen, 2008).
7
asymmetric as the effect of leaving democracy on protection is close to zero. Overall, the
results strongly confirm the redistributive nature of democratic institutions toward the
majority and, therefore, it is not inconsistent with the median voter model of political
behaviour. Moreover, our evidence rises an important question whether the strong
taxation/subsidization switch induced on agricultural policy by democratization, could
represent one of the channels through which democracy exerts its positive effect on
growth.
The reminder of the paper is organized as follows. Section (2) presents and justifies our
empirical strategy summarizing the pros and cons of difference-in-difference regressions
and the potential advantages of propensity score matching techniques. Section (3)
carefully describes and motivates how we measure reforms into and out of democracy,
and presents the data and the basic empirical specification. In Section (4) the empirical
results are presented and discussed. Finally, Section (5) concludes.
2. Methodology
This section presents our empirical strategy finalized to estimate the causal effect of
democracy on agricultural protection. As summarized before, the existing literature
studying the effect of political institutions on agricultural policy has exploited especially
the cross-country variation in the data. The well know problem with this approach is that
the estimated correlation could reflect an omitted variable bias or reverse causation. In
theory, a potential solution to this problem is to find good instruments and run two stage
last square regressions. However, this strategy is problematic in our context because good
instruments for regime changes are not easily available (see Persson and Tabellini, 2007).
Most importantly, though, cross-country regressions leaves out important information
from the time variation in the data (see Wacziarg and Welch, 2008). Indeed, as it is clear
from figure 1 that maps the dynamics of agricultural protection averaged across
democracy and autocracy, there exists considerable variation over time in our sample.
A second possibility is to estimate panel regressions. Here the advantage is to exploit also
the time dimension in the data. However, as stressed by Giavazzi and Tabellini (2005) and
Persson and Tabellini (2007) traditional panel data approach relies on too restrictive and
untestable identifying assumptions when studying the effect of regime changes on
economic or policy outcomes, taking the form of exclusion restrictions (see below). Thus,
following recent tendencies in the comparative political economy literature we estimate
the average effect of democracy on policy outcomes relying on micro-econometric
8
approach, using difference-in-difference regressions also in combination with semi-
parametric matching methods.
2.1 Differences-in-differences regressions
Following Giavazzi and Tabellini (2005) we define regime transitions or democratic
reforms as a ‘treatment’ experienced by some countries but not others. Then we estimate
the effect of the treatment through a difference-in-difference regression. In this way we
are able to exploit both the time series and cross-sectional variation in the data. Indeed, in
our sample we include both countries that experience a regime transitions in the observed
period, called the treated, and the countries that do not experience any reforms, called the
controls. In the regression we compare agricultural protection in the treated countries,
before and after the treatment, with the agricultural protection of the control group of
countries that do not experience any reforms in the period of analysis. In this way we
exploit both the within country variation and the comparison between groups (treated and
control) of countries.
More formally, this means running panel regressions with the following specification:
tititititi DY ,,,, εθαρβ ++++= X (1)
where Yi,t denotes our measure of interest, namely agricultural protection, αi and θt are
respectively the country and year fixed effects, Xi,t is a set of control variables, and Di,t is
a dummy variable taking the value 1 under democracy and 0 otherwise. The parameter β
is the difference-in-difference estimate of the reform effect. It is obtained by comparing
average protection after democratic transition, minus protection before the transition in the
treated countries, to the change in protection in the control countries over the same period
(Persson and Tabellini, 2007). Here the control countries are those that do not experience
a transition into or out of democracy, thus those that have either Di,t = 1 or Di,t = 0 over
the entire sample period. We use regression (1) to estimate the average effect of
democratization on agricultural protection.
As stressed by Persson (2005), one problem with the interpretation of the specification
(1) is the correct econometric identification. Specifically, the coefficient β identifies the
causal effect of democratic transitions, only if countries in the various reform groups do
not have trends in Y which are different from those in the control group but unrelated to
reforms. As we will show later, the frequency of transitions into democracy (autocracy)
change quite a lot across continents. Thus, to avoid confounding such non-random
9
incidence with continents-specific trends in agricultural protection, we ensure that the
estimates of β are robust to the inclusion of a set of continent-time interaction effects.
A final econometric problem arises when the dependent variable displays a strong
positive autocorrelation. In that circumstance, Bertrand et al. (2004) show that the
estimated standard errors with difference-in-difference approach are strongly
underestimated. To overcome this issue, we follow the most conservative method of
estimating standard error by clustering at the country level, allowing arbitrary country-
specific serial correlation. Moreover, we also estimate regressions with added the lagged
dependent variable. This transforms specifications (1) into a dynamic panel model where
the lagged dependent variable allows for the strong persistence in agricultural protection.
2.2 Propensity score matching
As noted in the literature, estimates obtained from the standard difference-in-difference
procedure are based on two main restrictive assumptions (see, e.g., Abadie, 2005; Persson
and Tabellini, 2007). First, it is assumed that in the control and treated countries, absent
any regime change, the average growth in protection in the treated countries should be the
same as in control countries. This is obviously a strong assumption.6
The second restriction is related to (potential) heterogeneity in the democracy effect
on agricultural protection. In that case the unexplained component of protection, εi,t, also
includes the term (βi,t – β)Di,t, where βi,t is the country-specific effect of democracy in
country i and year t. This occurs any time a reform into democracy is, among other
relevant factors, due to the protection effect of the democratic transition itself, namely
when Di,t = 1 is more likely when βi,t > β (see, e.g., Ashenfelter, 1978; Ashenfelter and
Card, 1985).
To circumvent this issue the existing literature often interacts the democracy dummy
with other specific characteristics of the reforms, such as the specific electoral rules or
forms of government implemented by the new democracy (see Persson, 2005; Olper and
Raimondi, 2009). However, as suggested by Persson and Tabellini (2007), the problem
here is that the potential interactions or non-linearity are too numerous, relative to the few
democratic transitions. In these circumstances, semi-parametric methods could provide an
elegant solution to these problems.
6 This restriction is obviously partially tackled by adding several covariates in the vector Xi,t, with the aim to increase the ‘similarity’ between treated and control countries.
10
Accordingly, to have better insights on the effect of political regime transition on the
level of agricultural protection we combine difference-in-differences with propensity
score matching method. As such we follow the approach discussed by Smith and Todd
(2005) and Abadie (2005) and applied by Blundell et al. (2004) and Persson and Tabellini
(2007). The focus by the propensity score matching is to employ methods that would
allow to rule out the impact of unobservable factors and to relax linearity (Rosenbaum and
Rubin, 1983; Persson and Tabellini, 2003). Otherwise the effect of political regime
transition may be easily confounded with that of the factors determining this shift. Since
one does not observe what would have happened if the democratic country had remained
in autocracy (or the converse), an estimate of the counterfactual is constructed.
Conditional on number of observable characteristics the probability of regime change is
calculated for each country, the propensity score. Based on this estimate, the next step
involves evaluating the difference in the evolution of agricultural protection between the
countries with and without a regime change. Since matching relies on comparing
countries with similar values of propensity score the inferences are not distorted by
counterfactuals very different from the treated observations.
More formally this approach could be presented as follows. Denote by D = {0, 1} the
treatment indicator, equal to 1 for treated countries, i.e. those that made transition to
democracy (autocracy); and equal to 0 for control countries, i.e. those that remained
autocracies (democracies) throughout the period for which data on agricultural protection
are available. Let DtiY , represents the level of agricultural protection in country i in time t
and democratic state D. Let t = 0 corresponds to the period before the change in political
regime, and t = 1 corresponds to the period after transition. Finally denote by Xi,t a set of
observable characteristics. Following Heckman et al. (1997), Abadie (2005) and Smith
and Todd (2005) our outcome of interest could be represented as follows:
( ) ( )0,1, 1,00,
01,1,
00,
01, =−==− iiiiiiii DYYEDYYE XX . (2)
The left-hand side is the unobserved average change in agricultural protection in control
countries had they change their political regime. The right-hand side is the actual change
in agricultural protection in those countries. This formula represents the so-called
‘conditional mean independence’, which states that, conditional on the vector X, the
outcomes are independent of the selection process. In other words, if countries from the
control group (D = 0) were treated, their outcome in terms of change in agricultural
11
protection, once conditioned on X, would not differ from the expected value of outcomes
in the treated group.
Rosenbaum and Rubin (1983) showed that instead of conditioning on the X vector one
can condition on propensity score P(X) which is the probability of selection conditioned
on X,
p(Xi) = Prob (Di,1 = 1|Xi).
Provided that the probability of treatment is strictly greater than 0 and less than 1, that is,
0 < Prob(Di,1 = 1|Xi) < 1, each treated observation have the potential of an analogue in the
control group. This assures that the impact of treatment is only valid for observations not
violating the common support assumption. In these circumstances our outcome of interest
becomes:
( ) ( )0),(1),( 1,00,
01,1,
00,
01, =−==− iiiiiiii DpYYEDpYYE XX . (3)
The set of covariates X is chosen to reduce the bias attributable to unobserved factors and
thus is crucial for the quality of matching (see Becker and Ichino, 2002). Basically,
reducing the bias should be accomplished by using diversity of the conditioning variables.
However, in macroeconomic setting, i.e. in our context, where the sample is relatively
small dropping too many observations due to violation of the so-called common support
assumption (when the treatment is predicted too well) would not be desirable.
In this context, following Persson and Tabellini (2007), we decided to use limited
number of covariates that are likely to influence both regime change and level of
agricultural protection. The same variables are used when estimating the effect of
democratic transitions as well as when estimating the effect of autocratic transitions (more
on this below).
We use several control countries, to act as the matches for a treated country. The idea
is to calculate the average propensity score from a neighbourhood of propensity scores of
several control countries, match this average propensity score to the propensity score of a
treated country, and then obtain the average treatment effect. Two matching estimators
were used, namely Epanechnikov kernel and Gaussian kernel (Fan, 1992; Heckman et al.,
1997; 1998). The average estimated effect of regime transitions that we compute could be
presented as follows:
( )∑ ∑−=i
j
jiiji awa
IATT 1 (4)
12
where I stands for number of treated observations within the common support; ai is the
difference between average level of agricultural protection after and before the transition
in the treated country i; j
ia is the difference between average level of agricultural
protection in the control country j over the periods before and after the transition date in
the treated country it is matched with; and wij (wij > 0 and ∑ j wij = 1) are weights based on
the propensity score and depend on the matching estimator (Sianesi, 2001).
We allow the effect of democratic transition to differ from the effect of autocratic
transition and therefore we treat transitions from autocracy to democracy separately from
transitions from democracy to autocracy. Countries that experience transitions in both
directions are used in both these estimations however with different time coverage. For
instance, Philippines enter the autocratic transition sample for the period 1962-1985 (with
the shift occurring in 1972) and the democratic transition sample for the period 1972-2005
(with the shift occurring in 1986).
3. Data, sample and basic specification
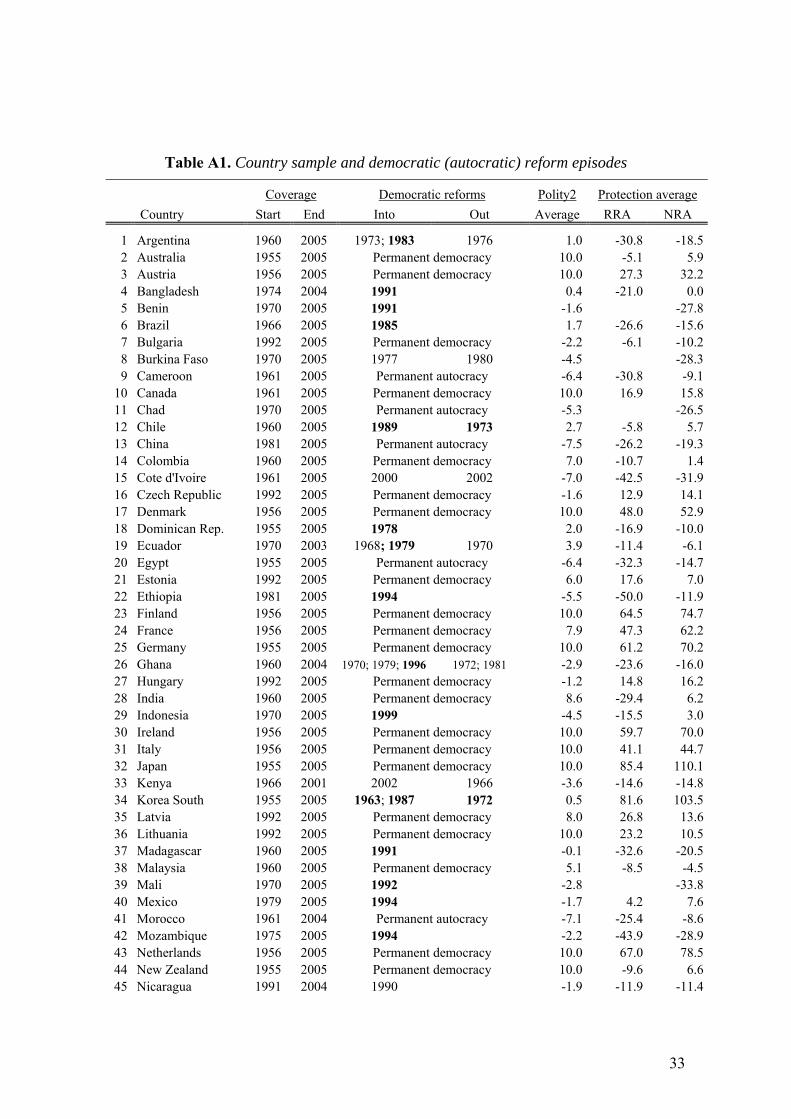
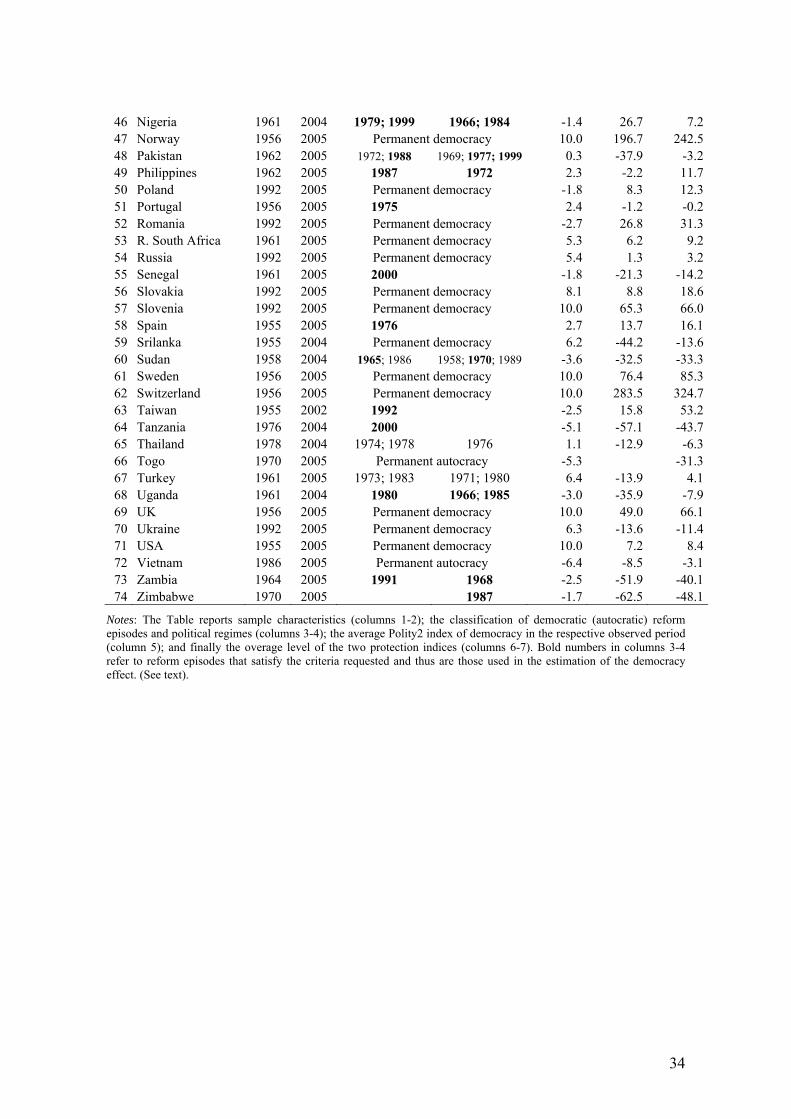
The sample refers to 74 countries, comprising yearly data from 1955 to 2005 (see Table
A.1). Not every country fulfils the whole time period, and the average number of years of
observation per country is 35. Overall we worked with an unbalanced panel with more
than 2,500 observations.
3.1 Democratic reforms and their determinants
In classifying reform episodes, the most recent literature is followed (see Giavazzi and
Tabellini, 2005; Persson, 2005; Persson and Tabellini, 2007; Papaioannou and Siourounis,
2008). Recent studies investigating the effect of democracy largely rely on the composite
Polity2 index from Polity IV database (Marshall and Jaeggers, 2007).
Countries are classified into democracy or autocracy using the Polity2 index. This
index assigns a value ranging from -10 to +10 to each country and year, with higher
values associated with better democracies on the basis of several institutional
characteristics like the openness of elections, or constraints on the executive. We code a
country as democratic in each year that the Polity2 index is strictly positive, setting a
binary indicator called democracy = 1 (0 otherwise). A reform into (or out of) democracy
occurs in a country-year when this democracy indicator switches from 0 to 1 (and vice
versa). While in theory other democracy database, like the Freedom House data, could be
used, we follow the common practise of using the Polity2 index for both comparability
13
and practical reasons. Indeed, it is the only data source that allows to maximise the
number of usable political reforms in our dataset. For example, using the Freedom House
data, quite apart from its shortcomings due to classification bias (see Papaioannou and
Siourounis, 2008), strongly limits the number of usable transitions because the
information start only in 1972.7
Overall, applying these criteria to the dataset, we reach 67 transitions into or out of
democracy, of which 41 are transition into democracy and 27 are into autocracy (see
Table A.1). The distribution of these reforms is quite uniform over time (53% before
1985) but not across continents: about 50% of the reforms are in Africa, 28% in Asia,
18% in Latin America.
To start, following Persson and Tabellini (2007), we introduce the criteria that the
outcome of interest, agricultural protection, be observed for at least four years before and
after each reform episode. Thus, by treating the first and last four year observations as
missing values, the effective number of reform episodes used in the empirical analysis
will be lower, and around to 40.8
In order to implement our matching strategy we need variables determining the shift in
political regimes. These are as follows. Variable initial polity2 takes the value of our
democracy index polity2 at the beginning of the sample. This variable is included to take
into account that countries with polity2 taking values close to zero are more likely to
change the regime. To control for the fact that the sample period varies in length across
countries and that the length of sample may be (positively) correlated with the probability
of changes in the political regime, we include also a variable length of sample (measured
in years). To capture the level of economic development a variable relative gdp is
included. It measures each country’s per capita income at the beginning of the sample
relative to US per capita income in the same year.
Finally, to take into account that change in political regime could be closely related to
the occurrence of conflicts (both internal as well as inter-state) we include also a variable
conflict years which measures the fraction of conflict years over the total period length for
7 The other usable data source on democratic transitions with a good overlapping with our sample, is that of Papaioannou and Siourounis (2008), that indeed cover the period from 1960 to 2005. However, as shown by the same authors, the differences between their transition data and those based on the Polity index are minor, and do not affect the regression results and conclusion. For a critical discussion of democracy indices, see Munck and Verkuilen (2002). 8 It is important to note that by relaxing this criteria to only two years of observable outcomes, and using almost all the reform episodes reported in Table A.1, the regression results are quantitatively and qualitatively the same. The only notable difference is a slight lower magnitude of the democracy effect, as now the sample include several doubtful or partial reform episodes.
14
which data on agricultural protection are available. These data come from the UCD/PRIO
Armed Conflict Dataset Version 4-2008 (see Gleditsch et al. 2002).
3.2 Dependent variable and other covariates
We test our hypotheses using two different dependent variables: the agricultural nominal
rate of assistance (NRA) and the relative rate of assistance (RRA), both from the World
Bank Agdistortions Database (see Anderson and Valenzuela, 2008 for calculation details).
The NRA to agriculture is measured as the weighted average of the nominal assistance at
the product level, using as a weight the industry’s value share of each product.
Differently, the RRA is calculated as the ratio between the agricultural and non-
agricultural NRA.9 One advantage of using also the RRA, is that especially in developing
countries, one important source of indirect taxation to agriculture comes from protection
of manufacturing sectors. Thus, the RRA is a more useful indicator in undertaking
international comparison over time of the extent to which a country’s policy regime has an
anti- or pro-agricultural bias (see Anderson and Valenzuela, 2008). Moreover, by
comparing the differentiated effect induces by democratic reforms on NRA instead on
RRA, allows us to better understand which kind of liberalization/protectionism effect
dominate in driving the results.
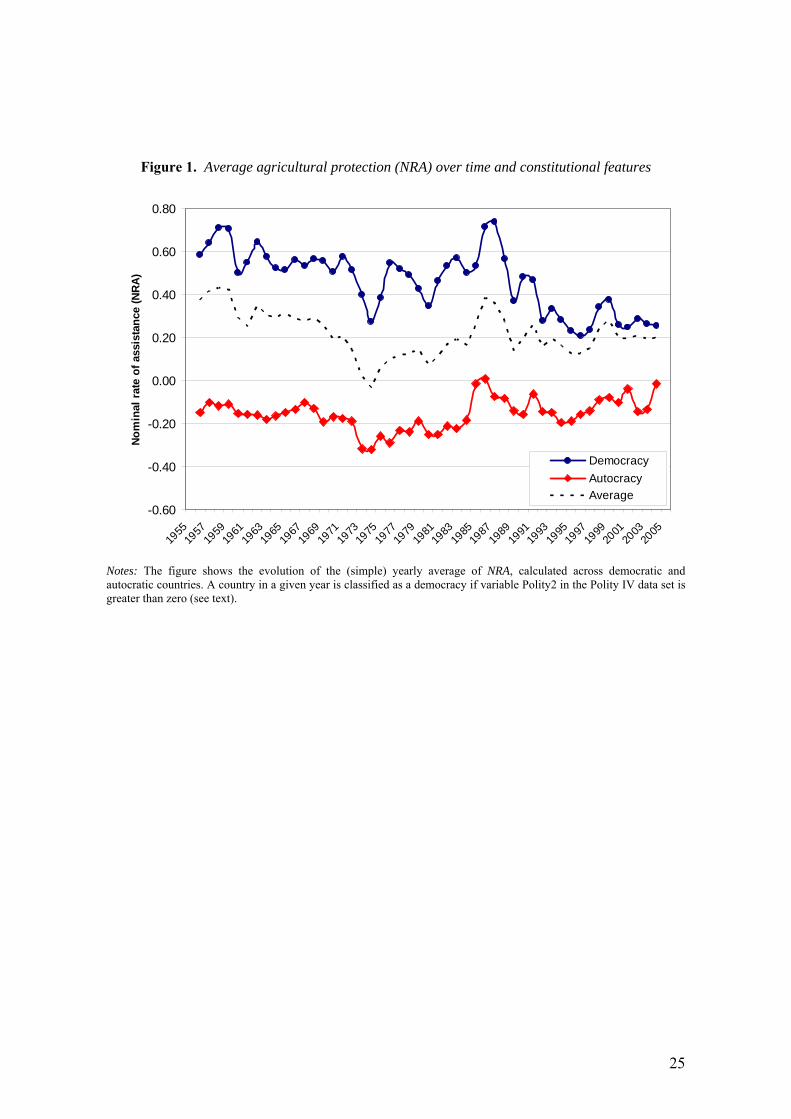
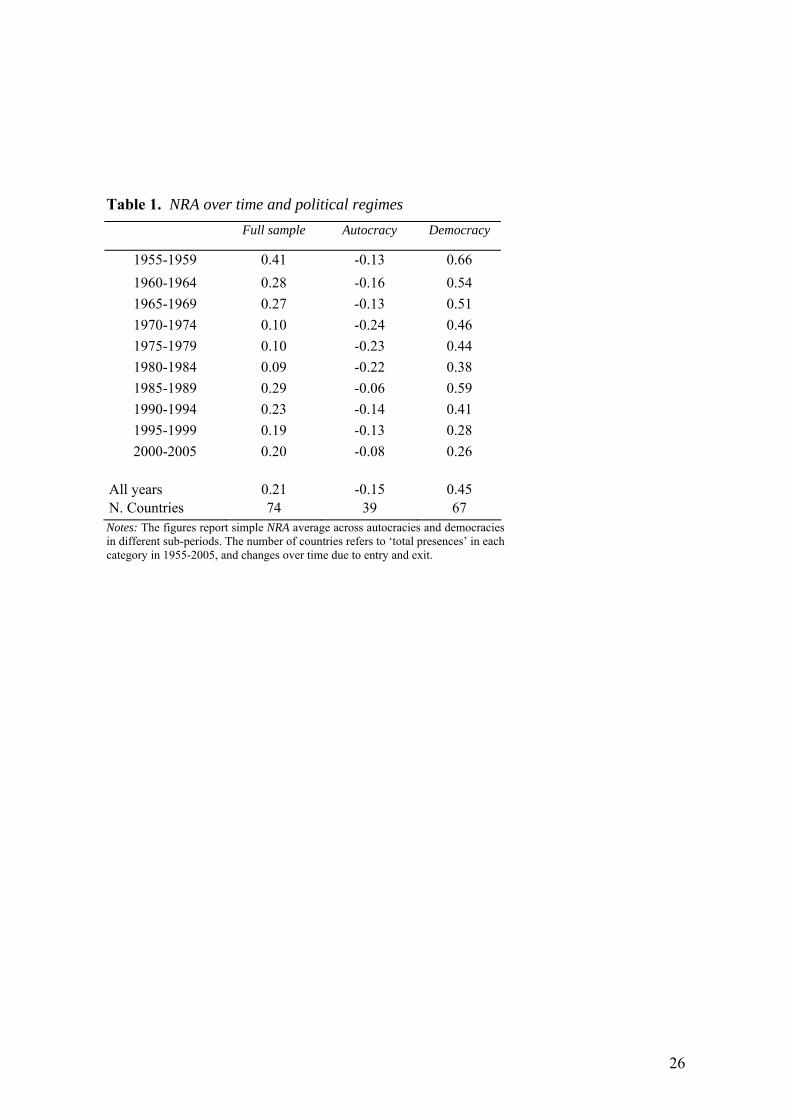
Figure 1 (and Table 1), displays the evolution of average levels of the nominal rate of
assistance in the full sample (dotted line), and splits the sample across autocracy and
democracy. Several interesting patterns emerge. First, autocratic countries have, on
average, as well as in each year considered, a negative level of agricultural protection.
Thus agriculture in these countries is always taxed at an average period rate of −15%. The
opposite applies to democratic countries, that are always strongly protected at an average
rate of 45%, though at a decreasing rate starting from the mid-eighties. Moreover, part of
the reduction in democracy protection in the last twenty years, other than to external
constraints like WTO, appears potentially determined by countries that have experienced a
transition toward democracy. Indeed, as emerges from an inspection of Figure 1, the
yearly average protection level (dotted line) is progressively closer to the level of
protection in the democracies sample.
In the empirical specification we also include additional controls that are likely to
affect the level of agricultural protection, as suggested by many previous studies (e.g.
9 Specifically, RRA is calculated as [(1 − NRAag)/(1 − NRAnonag)-1], where NRAag is the nominal assistance to agriculture and NRAnonag is the nominal assistance to non-agricultural sectors.
15
Anderson, 1995; Beghin, and Kherallah, 2004; Swinnen et al 2000; Olper, 2001).
Specifically, our basic difference-in-difference specification always includes the
following structural controls: the level of development gdppc, measured by the log of real
per capita GDP; the share of agricultural employment in total employment, empsh; the log
of agricultural land per capita, landpc; the log of total population, lpop; and, finally, given
the high persistency of agricultural protection and for reasons discussed above, in some
specification we also include the lagged dependent variable. All these variables are
computed starting from FAO and World Bank (WDI) sources, or from national statistics.
4. Estimation results
4.1 Differences-in-differences estimates
Table 2 displays the results of specification (1) estimated across different samples.
This corresponds to a standard difference-in-differences estimation on yearly data. The
specification, except for country and year fixed effects and the covariates defined above,
always includes interaction effects between continent and year dummies to control for
both differences in regional protection dynamics and the non-stationary nature of the
democracy dummy. Indeed, as emphasized by Papaioannou and Siourounis, (2008), our
democracy indicator tend to exhibit a trending behaviour, because when a country
experience a (successful) transition to democracy, the probability of a reversion to
autocracy is low. Following Persson and Tabellini (2007), regressions of Table 2
experiment with different assumptions about the treatments and the control group, testing
the effect of a democratic transition on different samples. Thanks to this we also test the
robustness of the results.10 To simplify the interpretation of the results, we express NRA
(and RRA) as a percentage. Thus, the magnitude of the estimated coefficient on our
democracy dummy measures the average percentage point changes in agricultural
protection implied by a transition into (or out of) democracy.
Regression (1) imposes the assumption that the effect on protection of a transition to
democracy is the same as the negativity of the effect of a transition to autocracy, thus
exploiting the full sample. The coefficient on democracy is positive and significant at 1% 10 The sign and significance of other covariates used in these specifications (results not shown) are as follow. First, and not surprisingly, agricultural protection is positively and significantly associated with the level of development (GDP per capita). Moreover, protection is positively related to the log of population, and negatively to both the land per capita and the employment share of agriculture. However, it is important to note that the last variables are insignificant in several specifications, suggesting that in the previous analyses they especially capture the cross-country variation in protection, here subsumed in the fixed effects.
16
level, meaning that a transition into democracy induces an increase in agricultural
protection of about 14 percent points. Thus the effect is not only statistically significant,
but also important from an economic point of view.
Regression (2) estimates only the effect of a transition into democracy, removing
reforms to autocracy from the sample, and using as control group only permanent
autocracies. The democracy coefficient is again positive, but drops somewhat in
magnitude and it is now significant at only 10 percent level by using clustered standard
errors. In regression (3), by adding also permanent democracies to the control group, the
coefficient on the democracy dummy increases and turns out to be significant at 1 percent
level. Now the estimate implies that a democratic transition induces a protection growth
effect of about 15 percent points. Regression (4) estimates the effect of a transition out of
democracy (or into autocracy), using permanent democracies as the control group. Here
the democracy coefficient is negative, thus going in an opposite direction with respect to
our prior,11 but it is statistically insignificant. Thus, we have evidence that the reform
effect is asymmetric, indeed leaving democracy do not affect the level of protection.
Columns (5) to (9), replicate the same battery of regressions using as dependent
variable the RRA. In general term, the pattern of the results are quite comparable, but with
some notable exceptions. First of all, the magnitude of the positive effect on protection of
reforms into democracy is significantly lower with a range from about 5 to 9 percent
points. In same cases the democracy coefficient is not statistically significant when
clustered standard errors are used. The democracy coefficient is always positive and
significant when the treatment measures transitions toward democracy, and the control
group also includes the permanent democracies. However, when the control group
includes only permanent autocracies, we observe a reduction in the magnitude of the
democracy effect that is now significant only using not clustered standard errors.
Similarly as before, a transition out of democracy never affects significantly the level of
agricultural protection. Finally and interesting, note that the lower magnitude of
democracy coefficient on RRA with respect to NRA regressions, suggests that what
matters after a regime change is a genuine agricultural policy reforms, instead of policy
reforms into non agricultural industry. Otherwise, we would find exactly the opposite
result.
11 It should be noted that here we are measuring the negative protection effect of a transition away from democracy.
17
Summarizing, this preliminary evidence suggests that the effect of transition to
democracy induces an increase in agricultural protection that vary from about 10-14%
using NRA, to about 5-9% using RRA. Thus, agriculture, that is discriminated and taxed in
an autocratic country, after a democratic transition will take advantage of a redistribution
process, a result consistent with historical evidence reported in Lindert (1994), Acemoglu
and Robinson (2000), and Swinnen et al. (2001). An important implication of these results
come by the fact that the average and the median values of the share of agricultural
population in countries undergoing democratic transitions is higher than 50%. Thus, the
evidence supports the notion that democratic institutions tend to redistribute toward the
majority and, therefore, it is consistent with the median voter model of political behavior.
Moreover, the fact that the same relation does not hold for transition out of democracy,
appears consistent with several stylized facts suggesting that, once implemented,
agricultural policies tend to persist for some time, even if changes in (external) conditions
made them ‘inefficient’, or not politically justifiable (see Olper and Swinnen, 2008).
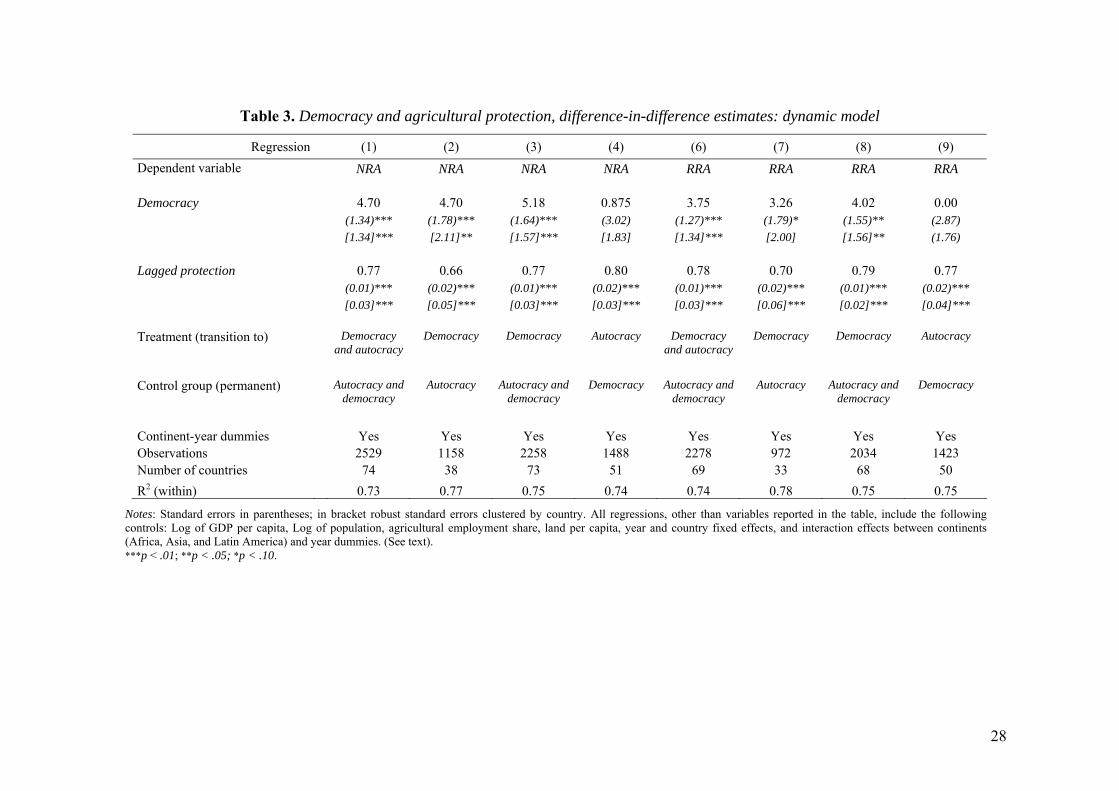
Finally, to check the robustness of our evidence, Table 3 presents results of the
dynamic version of the equation (1), estimating autoregressive specifications that control
for the persistency in agricultural protection. Note that, although the joint presence of
fixed effects and the lagged protection level could yield inconsistent estimates, our large
time period (35 years for the average countries) strongly reduces this potential source of
bias (see Papaioannou and Siourounis, 2008).12
As expected, agricultural protection is highly persistent over time, namely actual
protection is an important predictor of future protection. This version of the model shows
an expected smaller magnitude of the democracy effect, as now the large part of the
dynamics in protection is captured by the lagged depended variable. The increase in
protection after a democratization episode is about 4-5% for NRA and 3-4% for RRA, and
their significance levels are very close, and sometime higher, than in the static versions.
Once again, we have clear evidence that the reform effect is asymmetric: a transition
toward autocracy do not affect the level of protection. Thus, overall, these additional
results give a strong confirmation of our conclusions.
4.2 Matching estimates
12 Following Giavazzi and Tabellini (2005), to reduce this potential source of bias, we have also run regressions by excluding the few countries with less than 20 annual observations. These additional results are qualitatively and quantitatively closed with those reported in Table 3.
18
The results presented above already give important insights on the role that change in
political regime may have on the level of agricultural protection. However, having in
mind caveats with respect to difference-in-difference methods we proceed to results
obtained from semi-parametric methods.
The coefficients of the probit models that were used to calculate propensity scores are
presented in Table 4. The first two columns give the results for democratic transition
sample whereas the two latter ones give the results for the autocratic transition sample.
The presented results indicate that the probability of shifting towards democracy
(autocracy) increases (decreases) with the level of economic development. In addition,
transitions from democracy to autocracy are the more likely the lower the initial value of
polity2 variable. In general the chosen covariates predict shift towards autocracy much
better than transition in opposite direction, as suggested by the pseudo R2 equal to 0.51-
0.52 and 0.23-0.24, respectively.
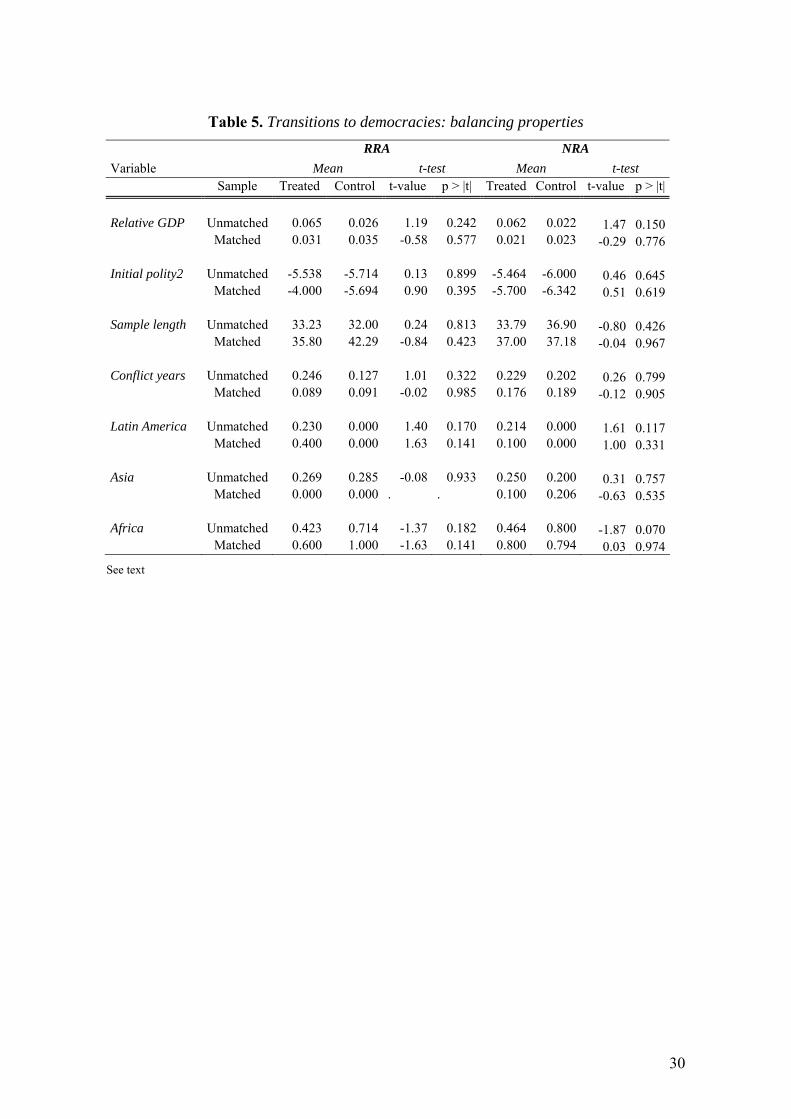
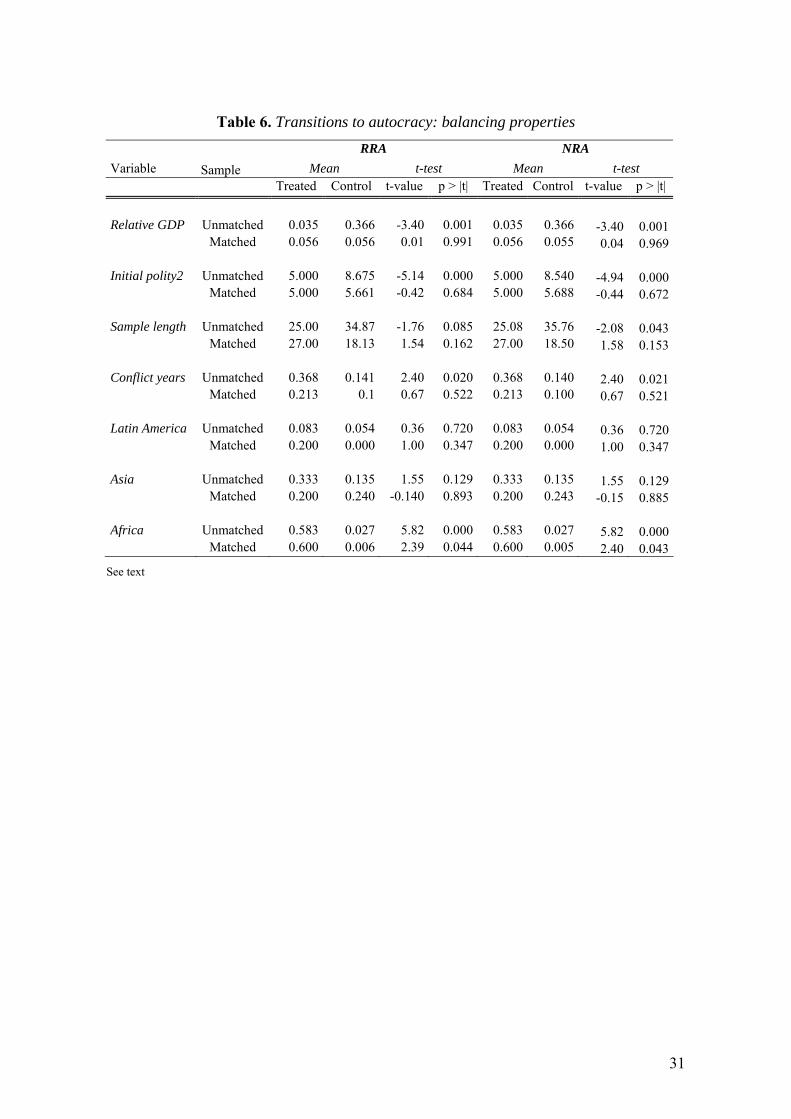
In order to check the goodness of matching we compared the distribution of observed
covariates between the countries in the treated group and the control group. The results
are shown in Tables 5 and 6. Clearly, matching did well in terms of removing significant
differences between treated and control countries especially in autocratic sample. As
regards transitions to democracy on the other hand, the treated and control groups already
before matching are not so different. Nevertheless, it seems that matching may still be
relevant here since it removes the difference in means of dummy for Africa, and reduces
the differences in means of relative GDP and conflict years.
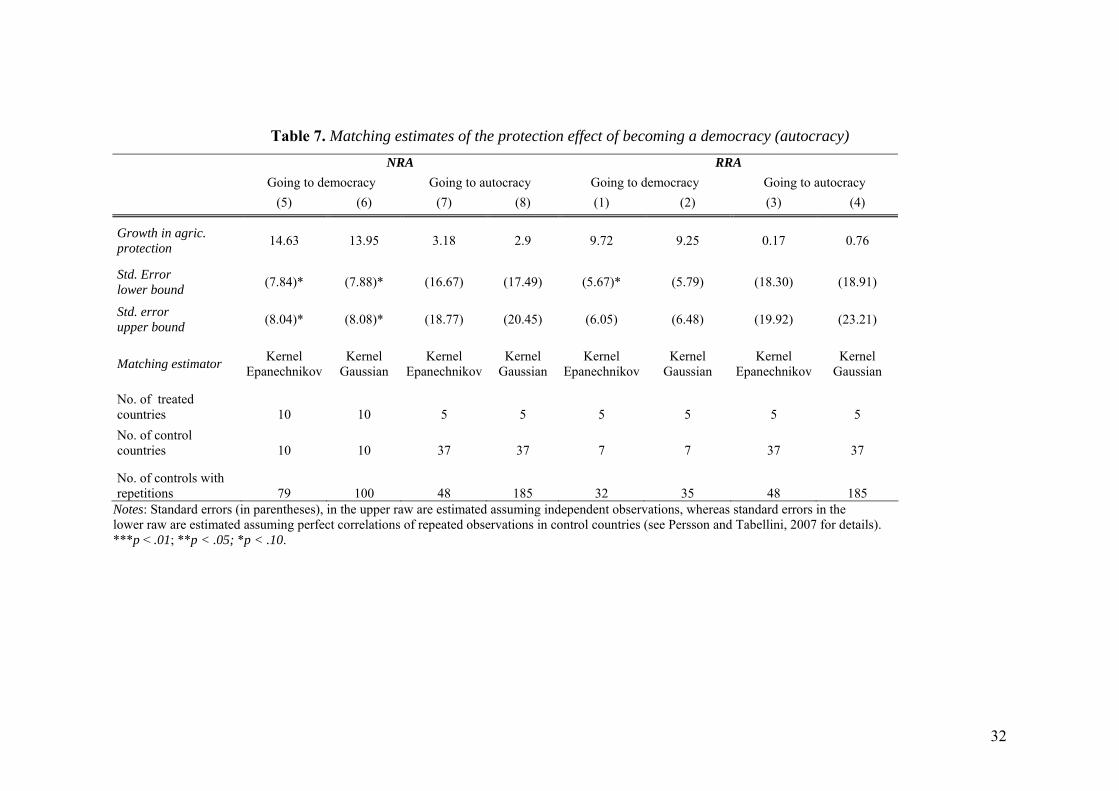
The results of matching are displayed in Table 7. Before analysing them it is important
to keep in mind the main advantage (and some caveats) of implementing matching over
difference-in-difference regressions (Persson and Tabellini, 2007). Basically, with
matching we relax linearity, allowing for any heterogeneity in the effect of democracy on
protection. However, there is a cost: the estimates are less efficient and, due to the few
usable observations in our hand, the loss in precision is a matter of fact. However and
interestingly, it seems that matching estimates are fully in line with the results obtained
from the standard difference-in-difference method. That is, the effect of transition to
democracy on the level of agricultural protection is strongly positive and statistically
significant whereas the effect of transition to autocracy does not differ from zero.
Moreover, the effect of democracy in NRA sample is larger than that observed when using
RRA sample. What is worth noting is the fact that point estimates obtained by matching
are larger than that estimated using difference-in-difference method. To see this, compare
19
matching results with the difference-in-difference benchmark reported in Table 2 (column
2 for NRA, and column 7 for RRA). Matching estimates oscillate in the region of 14% and
9% whereas the parametric ones are 10% and 4.8% for NRA and RRA respectively. This
suggests that previous parametric methods could have underestimated the true effect of
democracy on the level of agricultural protection.
What might be also noted is that, contrary to difference-in-difference method, using
matching and NRA sample, point estimates of the impact of transition towards autocracy
are positive, although insignificant. This again rises the question whether the former
approach does not underestimate the true effect of regime transition. Possible explanation
for positive effect of autocratic transition could draw on the so-called ‘divide-and-rule’
strategy adopted by the autocratic ruler who bribes politically pivotal groups so to ensure
he can stay in power (see, e.g., Acemoglu et al., 2004). Important to note here is that,
limited by the macrosetting, our matching estimates are based on relatively small sample.
Overall, the matching evidence reinforce our finding of the existence of a positive
effect of democratic transitions on agricultural protection. On the other hand, we found no
evidence that agricultural distortions are affected by autocratic transitions.
5. Conclusions
Motivated by the recent developments in comparative politics about the effect of political
institutions on public policy outcomes, we have investigated how transitions into
democracy affect agricultural protection and support. The empirical results highlight the
important role played by political regime transitions in affecting agricultural policy
distortions. In particular, using panel data analysis and differences-in-differences
estimation, alone and combined with semi-parametric matching methods, we documented
a significant positive effect of a democratic transition on agricultural protection. More
specifically, we showed that transition to democracy increases agricultural protection by
roughly 9% when propensity score matching methods were used and by roughly 5% when
difference-in-difference approach was employed. These results point to an important
conclusion that parametric methods might have underestimated the true effect of
democratic transitions on the level of agricultural distortions. Interestingly, no effect of
transition to autocracy was found regardless of the specification and approach used.
Overall, these results support the notion that democracy does matter in affecting the
adoption of structural policies. Furthermore, because in countries undergoing democratic
transitions it is probable to find many farmer incomes at the median income level, our
20
evidence gives support to the idea that a process of democratization is followed by
redistribution toward the majority and, therefore, it is not inconsistent with the median
voter model of political behavior. Finally, our evidence rises the important question
whether the strong taxation/subsidization switch induced on agricultural policy by
democratization, could represent one of the channels through which democracy exerts its
positive effect on growth.
Several further improvements should be made to better understand the interaction
between institutions and agricultural policy distortions. For example, just to cite one
potential direction, this paper has focused on the role of democracy in general. Therefore,
possible extension could explore the potential importance of various forms of democracy,
i.e. importance of various electoral rules or various government structures. Extension into
these and other directions could significantly improve our understanding of the interlink
between constitutions and public policies
21
References
Abadie, A. (2005). “Semiparametric Difference-in-Difference Estimators”. Review of Economic Studies 72, pp. 1-19.
Acemoglu (2005). Politics and economics in weak and strong states, Journal of Monetary Economics, 52(7), 1199-1226.
Acemoglu, D. and Robinson, J.A. (2000). Why did the west extend the franchise? Democracy, inequality and growth in historical perspective. Quarterly Journal of Economics, CXV, 1167-1199.
Acemoglu, D. and Robinson, J.A. (2006). Economic Origins of Dictatorship and Democracy, Cambridge University Press, MIT.
Acemoglu, D. and Robinson, J.A. (2008). Persistence of power, elites and institutions. American Economic Review, 98(1), 267-293.
Acemoglu, Daron, James Robinson, and Thierry Verdier. (2004). Kleptocracy and Divide-and-Rule: A Model of Personal Rule, Journal of the European Economic Association, 2(2-3): 162-92.
Acemoglu, D. Jhonson, S., Robinson, J.A. and Yared, P. (2008). Income and Democracy, American Economic Review, 98(3), 808-42.
Aghion, P., Alesina, A. and Trebbi, F. (2007). Democracy, technology and growth. Working Paper, May, 2007.
Alesina, A. and Rodrik, D. (1994). Distributive Politics and Economic Growth, The Quarterly Journal of Economics, 109(2), 465-490.
Anderson, K. (1995). Lobbying incentives and the pattern of protection in rich and poor countries. Economic Development and Cultural Change 43(2), 401-23.
Anderson, K., and Valenzuela E. (2008). Estimates of Distortions to Agricultural Incentives, 1955 to 2007. World Bank, Washington DC, forthcoming October. www.worldbank.org/agdistortions.
Ashenfelter, O. (1978), “Estimating the Effect of Training Programs on Earnings”, Review of Economics and Statistics, 60, 47–57.
Ashenfelter, O. and Card, D. (1985), “Using the Longitudinal Structure of Earnings to Estimate the Effects of Training Programs”, Review of Economics and Statistics, 67, 648–660.
Banerji, A. and Ghanem, H. (1997). Does the type of political regime matter for trade and labor market policies? World Bank Economic Review, 11, 171-194.
Barro, R. J. (1997). Determinants of Economic Growth: A Cross-country Empirical Study. MIT Press, Cambridge.
Bates, R. H. (1983). Patterns of market intervention in agrarian africa. Food Policy, November, 297-304.
Bates, R. H. (1989). Beyond the Miracle of the Market. The Political Economy of Agrarian Development in Kenya, Cambridge University Press, Cambridge.
Becker, G. (1983). A Theory of Competition among Pressure Groups for Political Influence, The Quarterly Journal of Economics 98, 371-400.
Becker, S. and Ichino, A. (2002). Estimation of average treatment effects based on propensity scores. Stata Journal 2(4), 358-377.
Beghin, J.C. and Kherallah, M. (1994). Political institutions and international patterns of agricultural protection. Review of Economics and Statistics, LXXVI, 482-489.
22
Bertrand, M., Duflo, E. and Mullainathan, S. (2004). How much should be trust difference-in-difference estimates? The Quarterly Journal of Economics, 119, 249-275.
Besley, T. and Kudamatsu, M. (2006). Health and Democracy. American Economic Review, 96(2), 313-18.
Besley, T., Pande, R. and Rao, V. (2007). Just Rewards? Local Politics and Public Resource Allocation in South India, Development Economics Discussion Paper Series No 49, London School of Economics and Political Science.
Blundell, R., Costa Dias, M, Meghir, C, and Van Reenen, J. (2004), “Evaluating the Employment Impact of a Mandatory Job Search Assistance Program”, Journal of the European Economic Association 2, 596-606.
Briggeman, B.C., Towe, C. and Morehart, M.J. (2008). Credit Constraints: Their Existence, Determinants, and Implications for U.S. Farm and Nonfarm Sole Proprietorships, American Journal of Agricultural Economics 90(6), 1-15.
Dabalen, A., Paternostro, S. and Pierre, G. (2004). The Returns to Participation in the Non-farm Sector in Rural Rwanda, World Bank Policy Research Paper No. 3462.
Dahl, R.A. (1971). Polyarchy: Participation and Opposition, New Heaven: Yale University Press.
De Haan, J. and Sturm, J. (2003). Does more democracy lead to greater economic freedom? New evidence for developing countries. European Journal of Political Economy, 19(3), 547-563.
Downs, A. (1957). An Economic Theory of Democracy. Harper Collins. Fan. J. (1992). Local Linear Regression Smoothers and their Minimax Efficiencies. The
Annals of Statistics 21, pp. 196-216. Giavazzi, F. and Tabellini, G. (2005). Economic and political liberalization. Journal of
Monetary Economics, 52, 1297-1330. Glaeser, E.L., La Porta, R., Lopez-de-Silane, F. and Shleifer, A. (2004). Do institutions
cause growth, Journal of Economic Growth, 9 (3), 271-304. Gleditsch, N. P., Wallensteen, P., Eriksson, M., Sollenberg, M. and Strand, H. (2002).
Armed Conflict 1946–2001: A New Dataset. Journal of Peace Research 39(5): 615–637. Gundlach, E. and Paldam, M. (2009). A farewell to critical juncture: Sorting out long-run
causality of income and democracy, European Journal of Political Economy, (Forthcoming).
Hall, R. E. and Jones, C. (1999). Why do some countries produce so much more output per worker than others? The Quarterly Journal of Economics, 114(1), 83–116.
Heckman, J., Ichimura, H. and Todd, P. (1997). Matching as an Econometric Evaluation Estimator: Evidence from Evaluation Job Training Program. Review of Economic Studies 64(4), pp. 605-654.
Heckman, J., Ichimura, H. and Todd, P. (1998). Matching as an Econometric Evaluation Estimator. Review of Economic Studies 65(2), pp. 261-294.
Henning, C.H.C.A. (2008). Determinants of agricultural protection in an International perspective: The role of political Institutions. Working Paper, February 25, 2008.
Key, N. and Roberts, M.J. (2008). Do Decoupled Payments Stimulate Production? Estimating the Effect on Program Crop Acreage Using Matching, Selected Paper at the Annual Meeting of the AAEA, Orlando, Florida, July 27-29, 2008.
Knack, S. and Keefer, P. (1995). Institutions and economic performance: Cross-country tests using alternative institutional measures. Economics and Politics, 7, 207-227.
Lindert, P.H. (1991). Historical Patterns of Agricultural Policy, in Timmer C.P. (editor). Agriculture and the State. Growth, Employment, and Poverty in Developing Countries, Cornell University Press, Ithaca, 29-83.
23
Lindert, P.H. (1994). The Rise in Social Spending, 1880–1930, Explorations in Economic History, 31, 1–37.
Marshall, M. G., and Jaggers, K. (2007). Polity IV Project: Dataset Users’ Manual. Arlington: Polity IV Project.
McGuire, M.C. and Olson M. Jr. (1996). The Economics of Autocracy and Majority Rule: The Invisible Hand and the Use of Force, Journal of Economic Literature, 34(1), 72-96.
Milner, H.V. and Kubota, K. (2005). Why the move to free trade? Democracy and trade policy in the developing countries. International Organization, 59, 107-143.
Moore, B. (1966). The Social Origins of Dictatorship and Democracy: Lord and Peasant in the Making of the Modern World, Boston: Beacon Press.
Mulligan, C.B., Gil, R. and Sala-i-Martin, X. (2004) Do democracies have different public policies than non democracies, Journal of Economic Perspective 18(1), 51-74.
Munck, G.L. and Verkuilen, J. (2002). Conceptualizing and measuring democracy: Evaluating alternative indices, Comprative Political Studies 35, 5-34.
North, D. (1990). Institutions, Institutional Change and Economic Performance, Cambridge University Press, Cambridge.
Olper, A. (2001). Determinants of agricultural protection: the role of democracy and institutional setting. Journal of Agricultural Economics, 52 (2), 75-92.
Olper, A. (2007). Land inequality, government ideology and agricultural protection. Food policy, 32, 67-83.
Olper, A. and Raimondi, V. (2004). Political institutions and milk policy outcomes in OECD countries. In: Van Huylenbroeck, G., Verbeke, W., Lauwers, L., (Eds), Role of Institutions in Rural Policies and Agricultural Markets. Elsevier, Amsterdam, 153-168.
Olper, A. and Raimondi, V. (2009). Constitutional Rules and Agricultural Policy Outcomes, in Kym Anderson (ed.) Political Economy of Distortions to Agricultural Incentives, The World Bank, Washington, D.C.. (forthcoming).
Olper, A. and Swinnen, J. (2008). The political economy of instrument choice in agricultural and food policies: Theory and evidence from OECD Countries. Agricultural Economics Paper Series No. 7, University of Milano, July 2008.
Olson, M., Jr. (1993). Dictatorship, democracy, and development. American Political Science Review 87, 567-576.
Papaioannou, E. and Siourounis, G. (2008). Democratization and growth, The Economic Journl, 118 (October), 1520-1551.
Peltzman, S. (1976). Toward a More General Theory of Regulation, Journal of Law & Economics, 19(2), 211-240.
Persson, T. (2005). Forms of democracy, policy and Economic development. Working Paper, Institute for International Economic Studies, Stockholm University, January, 2005.
Persson, T. and Tabellini, G. (1994). Is Inequality Harmful for Growth?, American Economic Review 84(3), 600-621.
Persson, T. and Tabellini, G. (2003). The Economic Effect of Constitutions. Cambridge, The MIT Press.
Persson, T. and Tabellini, G. (2006). Democracy and development: The devil in the details. American Economic Review, 96, 319-324.
Persson, T. and Tabellini, G. (2007). The growth effect of democracy: Is it heterogeneous and how can it be estimated?. IGIER Working Paper n. 322, Bocconi Univeristy, May, 2007.
Rodríguez, F. and Rodrik, D. (2001). Trade Policy and Economic Growth: A Skeptic's Guide to the Cross-National Evidence, Macroeconomics Annual 2000, eds. Ben Bernanke and Kenneth S. Rogoff, (MIT Press for NBER, Cambridge, MA).
24
Rodrik, D. and Wacziarg, R. (2005). Do democratic transitions produce bad economic outcomes? American Economic review 95, 95(2), 50-55.
Rosenbaum, P.R. and Rubin, D.B. (1983). The Central Role of the Propensity Score in Observational Studies for Casual Effects. Biometrika 71(1), pp. 41-55.
Sianesi, B. (2001). Implementing Propensity Score Matching Estimators with STATA. Paper presented at the UK Stata Users Group, VII Meeting, London, May 2001.
Smith, J. A. and Todd, P. E. (2005). Does matching overcome LaLonde's critique of nonexperimental estimators? Journal of Econometrics 125, pp. 305-353.
Stigler, G.J. (1971). The Theory of Economic Regulation, Bell Journal of Economics, 2(1), 3-21.
Swinnen, J. (2008). The political economy of distortions to agricultural incentives: A review of recent literature & implications, Paper prepared for the second stage of the World Bank project “Distortions to Agricultural Incentives”, Draft 15 Jenuary, 2008.
Swinnen, J., de Gorter, H., Rausser, G.C. and Banerjee, A. N. (2000). The political economy of public research investment and commody policy in agriculture: An empirical study. Agricultural Economics, 22, 111-122.
Swinnen, J.F., Banerjee, A.N. and de Gorter, H. (2001). Economic development, institutional change, and the political economy of agricultural protection: An econometric study of Belgium since the 19th century. Agricultural Economics, 26 (1), 25-43.
Tavares, S.C. (2007). Democracy and Trade Liberalization, Working Paper, Rochester Institute of Technology, February.
Thies, C.G. and Porche, S. (2007). The political economy of agricultural protection. Journal of Politics, 69, 116-127.
Wacziarg, R. and Welch, K.H. (2008). Trade liberalization and growth: New evidence, The World Bank Economic Review Vol. 22(2), 187-231.
Wittman, D. (1989), Why Democracies Produce Efficient Results, Journal of Political Economy, 97(6), 1395-1424.
25
Figure 1. Average agricultural protection (NRA) over time and constitutional features
-0.60
-0.40
-0.20
0.00
0.20
0.40
0.60
0.80
1955
1957
1959
1961
1963
1965
1967
1969
1971
1973
1975
1977
1979
1981
1983
1985
1987
1989
1991
1993
1995
1997
1999
2001
2003
2005
Nom
inal
rate
of a
ssis
tanc
e (N
RA)
DemocracyAutocracyAverage
Notes: The figure shows the evolution of the (simple) yearly average of NRA, calculated across democratic and autocratic countries. A country in a given year is classified as a democracy if variable Polity2 in the Polity IV data set is greater than zero (see text).
26
Table 1. NRA over time and political regimes Full sample Autocracy Democracy
1955-1959 0.41 -0.13 0.66 1960-1964 0.28 -0.16 0.54 1965-1969 0.27 -0.13 0.51 1970-1974 0.10 -0.24 0.46 1975-1979 0.10 -0.23 0.44 1980-1984 0.09 -0.22 0.38 1985-1989 0.29 -0.06 0.59 1990-1994 0.23 -0.14 0.41 1995-1999 0.19 -0.13 0.28 2000-2005 0.20 -0.08 0.26
All years 0.21 -0.15 0.45 N. Countries 74 39 67 Notes: The figures report simple NRA average across autocracies and democracies in different sub-periods. The number of countries refers to ‘total presences’ in each category in 1955-2005, and changes over time due to entry and exit.

27
Table 2. Democracy and agricultural protection, difference-in-difference estimates
(1) (2) (3) (4) (6) (7) (8) (9)
Dependent variable NRA NRA NRA NRA RRA RRA RRA RRA Democracy 14.00 10.17 15.73 -2.53 9.51 4.80 9.62 0.71
(2.09)*** (2.34)*** (2.60)*** (4.95) (1.99)*** (2.52)* (2.51)*** (4.41)
[4.62]*** [5.37]* [5.66]*** [5.66] [4.43]** [5.53] [5.37]* [6.38] Treatment (transition to) Democracy
and autocracy Democracy Democracy Autocracy Democracy
and autocracy Democracy Democracy Autocracy
Control group (permanent) Autocracy and
democracy Autocracy Autocracy and
democracy Democracy Autocracy and
democracy Autocracy Autocracy and
democracy Democracy
Continent-year mummie Yes Yes Yes Yes Yes Yes Yes Yes Observations 2565 1176 2290 1506 2314 987 2065 1444 Number of countries 74 38 73 51 69 33 68 50
R2 (within) 0.34 0.59 0.35 0.28 0.35 0.56 0.35 0.31
Notes: Standard errors in parentheses; in bracket robust standard errors clustered by country. All regressions include: Log of GDP per capita, Log of population, agricultural employment share, land per capita, year and country fixed effects, and interaction effects between continents (Africa, Asia, and Latin America) and year dummies. (See text). ***p < .01; **p < .05; *p < .10.
28
Table 3. Democracy and agricultural protection, difference-in-difference estimates: dynamic model
Regression (1) (2) (3) (4) (6) (7) (8) (9) Dependent variable NRA NRA NRA NRA RRA RRA RRA RRA Democracy 4.70 4.70 5.18 0.875 3.75 3.26 4.02 0.00 (1.34)*** (1.78)*** (1.64)*** (3.02) (1.27)*** (1.79)* (1.55)** (2.87) [1.34]*** [2.11]** [1.57]*** [1.83] [1.34]*** [2.00] [1.56]** (1.76) Lagged protection 0.77 0.66 0.77 0.80 0.78 0.70 0.79 0.77 (0.01)*** (0.02)*** (0.01)*** (0.02)*** (0.01)*** (0.02)*** (0.01)*** (0.02)*** [0.03]*** [0.05]*** [0.03]*** [0.03]*** [0.03]*** [0.06]*** [0.02]*** [0.04]*** Treatment (transition to) Democracy
and autocracy Democracy Democracy Autocracy Democracy
and autocracy Democracy Democracy Autocracy
Control group (permanent) Autocracy and
democracy Autocracy Autocracy and
democracy Democracy Autocracy and
democracy Autocracy Autocracy and
democracy Democracy
Continent-year dummies Yes Yes Yes Yes Yes Yes Yes Yes Observations 2529 1158 2258 1488 2278 972 2034 1423 Number of countries 74 38 73 51 69 33 68 50 R2 (within) 0.73 0.77 0.75 0.74 0.74 0.78 0.75 0.75
Notes: Standard errors in parentheses; in bracket robust standard errors clustered by country. All regressions, other than variables reported in the table, include the following controls: Log of GDP per capita, Log of population, agricultural employment share, land per capita, year and country fixed effects, and interaction effects between continents (Africa, Asia, and Latin America) and year dummies. (See text). ***p < .01; **p < .05; *p < .10.

29
Table 4. Estimates of the propensity score
Transitions to democracy Transitions to autocracy
RRA NRA RRA NRA
Initial polity2 0.07 0.09 -0.25 -0.25 (0.77) (1.03) (1.99)** (1.91)* Relative GDP 25.17 35.77 -17.27 -17.30 (1.84)* (1.73)* (2.28)** (2.30)** Sample length 0.01 -0.06 -0.01 -0.01 (0.13) (1.75)* (.65) (.53) Conflict years 3.30 0.85 0.18 0.11 (1.77)* (0.84) (0.17) (0.11) Constant -0.38 2.17 2.70 2.61 (0.36) (1.72)* (2.34)** (2.28)**
Observations 33 38 49 49
Pseudo R2 0.23 0.24 0.52 0.51
Notes: t-values in parentheses: ***p < .01; **p < .05; *p < .10.
30
Table 5. Transitions to democracies: balancing properties RRA NRA Variable Mean t-test Mean t-test Sample Treated Control t-value p > |t| Treated Control t-value p > |t| Relative GDP Unmatched 0.065 0.026 1.19 0.242 0.062 0.022 1.47 0.150 Matched 0.031 0.035 -0.58 0.577 0.021 0.023 -0.29 0.776 Initial polity2 Unmatched -5.538 -5.714 0.13 0.899 -5.464 -6.000 0.46 0.645 Matched -4.000 -5.694 0.90 0.395 -5.700 -6.342 0.51 0.619 Sample length Unmatched 33.23 32.00 0.24 0.813 33.79 36.90 -0.80 0.426 Matched 35.80 42.29 -0.84 0.423 37.00 37.18 -0.04 0.967 Conflict years Unmatched 0.246 0.127 1.01 0.322 0.229 0.202 0.26 0.799 Matched 0.089 0.091 -0.02 0.985 0.176 0.189 -0.12 0.905 Latin America Unmatched 0.230 0.000 1.40 0.170 0.214 0.000 1.61 0.117 Matched 0.400 0.000 1.63 0.141 0.100 0.000 1.00 0.331 Asia Unmatched 0.269 0.285 -0.08 0.933 0.250 0.200 0.31 0.757 Matched 0.000 0.000 . . 0.100 0.206 -0.63 0.535 Africa Unmatched 0.423 0.714 -1.37 0.182 0.464 0.800 -1.87 0.070 Matched 0.600 1.000 -1.63 0.141 0.800 0.794 0.03 0.974
See text
31
Table 6. Transitions to autocracy: balancing properties RRA NRA Variable Sample Mean t-test Mean t-test Treated Control t-value p > |t| Treated Control t-value p > |t| Relative GDP Unmatched 0.035 0.366 -3.40 0.001 0.035 0.366 -3.40 0.001 Matched 0.056 0.056 0.01 0.991 0.056 0.055 0.04 0.969 Initial polity2 Unmatched 5.000 8.675 -5.14 0.000 5.000 8.540 -4.94 0.000 Matched 5.000 5.661 -0.42 0.684 5.000 5.688 -0.44 0.672 Sample length Unmatched 25.00 34.87 -1.76 0.085 25.08 35.76 -2.08 0.043 Matched 27.00 18.13 1.54 0.162 27.00 18.50 1.58 0.153 Conflict years Unmatched 0.368 0.141 2.40 0.020 0.368 0.140 2.40 0.021 Matched 0.213 0.1 0.67 0.522 0.213 0.100 0.67 0.521 Latin America Unmatched 0.083 0.054 0.36 0.720 0.083 0.054 0.36 0.720 Matched 0.200 0.000 1.00 0.347 0.200 0.000 1.00 0.347 Asia Unmatched 0.333 0.135 1.55 0.129 0.333 0.135 1.55 0.129 Matched 0.200 0.240 -0.140 0.893 0.200 0.243 -0.15 0.885 Africa Unmatched 0.583 0.027 5.82 0.000 0.583 0.027 5.82 0.000 Matched 0.600 0.006 2.39 0.044 0.600 0.005 2.40 0.043
See text
32
Table 7. Matching estimates of the protection effect of becoming a democracy (autocracy)
NRA RRA Going to democracy Going to autocracy Going to democracy Going to autocracy (5) (6) (7) (8) (1) (2) (3) (4)
Growth in agric. protection 14.63 13.95 3.18 2.9 9.72 9.25 0.17 0.76
Std. Error lower bound (7.84)* (7.88)* (16.67) (17.49) (5.67)* (5.79) (18.30) (18.91)
Std. error upper bound (8.04)* (8.08)* (18.77) (20.45) (6.05) (6.48) (19.92) (23.21)
Matching estimator Kernel Epanechnikov
Kernel Gaussian
Kernel Epanechnikov
Kernel Gaussian
Kernel Epanechnikov
Kernel Gaussian
Kernel Epanechnikov
Kernel Gaussian
No. of treated countries 10 10 5 5 5 5 5 5 No. of control countries 10 10 37 37 7 7 37 37
No. of controls with repetitions 79 100 48 185 32 35 48 185
Notes: Standard errors (in parentheses), in the upper raw are estimated assuming independent observations, whereas standard errors in the lower raw are estimated assuming perfect correlations of repeated observations in control countries (see Persson and Tabellini, 2007 for details). ***p < .01; **p < .05; *p < .10.
33
Table A1. Country sample and democratic (autocratic) reform episodes
Coverage Democratic reforms Polity2 Protection average Country Start End Into Out Average RRA NRA
1 Argentina 1960 2005 1973; 1983 1976 1.0 -30.8 -18.52 Australia 1955 2005 Permanent democracy 10.0 -5.1 5.93 Austria 1956 2005 Permanent democracy 10.0 27.3 32.24 Bangladesh 1974 2004 1991 0.4 -21.0 0.05 Benin 1970 2005 1991 -1.6 -27.86 Brazil 1966 2005 1985 1.7 -26.6 -15.67 Bulgaria 1992 2005 Permanent democracy -2.2 -6.1 -10.28 Burkina Faso 1970 2005 1977 1980 -4.5 -28.39 Cameroon 1961 2005 Permanent autocracy -6.4 -30.8 -9.1
10 Canada 1961 2005 Permanent democracy 10.0 16.9 15.811 Chad 1970 2005 Permanent autocracy -5.3 -26.512 Chile 1960 2005 1989 1973 2.7 -5.8 5.713 China 1981 2005 Permanent autocracy -7.5 -26.2 -19.314 Colombia 1960 2005 Permanent democracy 7.0 -10.7 1.415 Cote d'Ivoire 1961 2005 2000 2002 -7.0 -42.5 -31.916 Czech Republic 1992 2005 Permanent democracy -1.6 12.9 14.117 Denmark 1956 2005 Permanent democracy 10.0 48.0 52.918 Dominican Rep. 1955 2005 1978 2.0 -16.9 -10.019 Ecuador 1970 2003 1968; 1979 1970 3.9 -11.4 -6.120 Egypt 1955 2005 Permanent autocracy -6.4 -32.3 -14.721 Estonia 1992 2005 Permanent democracy 6.0 17.6 7.022 Ethiopia 1981 2005 1994 -5.5 -50.0 -11.923 Finland 1956 2005 Permanent democracy 10.0 64.5 74.724 France 1956 2005 Permanent democracy 7.9 47.3 62.225 Germany 1955 2005 Permanent democracy 10.0 61.2 70.226 Ghana 1960 2004 1970; 1979; 1996 1972; 1981 -2.9 -23.6 -16.027 Hungary 1992 2005 Permanent democracy -1.2 14.8 16.228 India 1960 2005 Permanent democracy 8.6 -29.4 6.229 Indonesia 1970 2005 1999 -4.5 -15.5 3.030 Ireland 1956 2005 Permanent democracy 10.0 59.7 70.031 Italy 1956 2005 Permanent democracy 10.0 41.1 44.732 Japan 1955 2005 Permanent democracy 10.0 85.4 110.133 Kenya 1966 2001 2002 1966 -3.6 -14.6 -14.834 Korea South 1955 2005 1963; 1987 1972 0.5 81.6 103.535 Latvia 1992 2005 Permanent democracy 8.0 26.8 13.636 Lithuania 1992 2005 Permanent democracy 10.0 23.2 10.537 Madagascar 1960 2005 1991 -0.1 -32.6 -20.538 Malaysia 1960 2005 Permanent democracy 5.1 -8.5 -4.539 Mali 1970 2005 1992 -2.8 -33.840 Mexico 1979 2005 1994 -1.7 4.2 7.641 Morocco 1961 2004 Permanent autocracy -7.1 -25.4 -8.642 Mozambique 1975 2005 1994 -2.2 -43.9 -28.943 Netherlands 1956 2005 Permanent democracy 10.0 67.0 78.544 New Zealand 1955 2005 Permanent democracy 10.0 -9.6 6.645 Nicaragua 1991 2004 1990 -1.9 -11.9 -11.4
34
46 Nigeria 1961 2004 1979; 1999 1966; 1984 -1.4 26.7 7.247 Norway 1956 2005 Permanent democracy 10.0 196.7 242.548 Pakistan 1962 2005 1972; 1988 1969; 1977; 1999 0.3 -37.9 -3.249 Philippines 1962 2005 1987 1972 2.3 -2.2 11.750 Poland 1992 2005 Permanent democracy -1.8 8.3 12.351 Portugal 1956 2005 1975 2.4 -1.2 -0.252 Romania 1992 2005 Permanent democracy -2.7 26.8 31.353 R. South Africa 1961 2005 Permanent democracy 5.3 6.2 9.254 Russia 1992 2005 Permanent democracy 5.4 1.3 3.255 Senegal 1961 2005 2000 -1.8 -21.3 -14.256 Slovakia 1992 2005 Permanent democracy 8.1 8.8 18.657 Slovenia 1992 2005 Permanent democracy 10.0 65.3 66.058 Spain 1955 2005 1976 2.7 13.7 16.159 Srilanka 1955 2004 Permanent democracy 6.2 -44.2 -13.660 Sudan 1958 2004 1965; 1986 1958; 1970; 1989 -3.6 -32.5 -33.361 Sweden 1956 2005 Permanent democracy 10.0 76.4 85.362 Switzerland 1956 2005 Permanent democracy 10.0 283.5 324.763 Taiwan 1955 2002 1992 -2.5 15.8 53.264 Tanzania 1976 2004 2000 -5.1 -57.1 -43.765 Thailand 1978 2004 1974; 1978 1976 1.1 -12.9 -6.366 Togo 1970 2005 Permanent autocracy -5.3 -31.367 Turkey 1961 2005 1973; 1983 1971; 1980 6.4 -13.9 4.168 Uganda 1961 2004 1980 1966; 1985 -3.0 -35.9 -7.969 UK 1956 2005 Permanent democracy 10.0 49.0 66.170 Ukraine 1992 2005 Permanent democracy 6.3 -13.6 -11.471 USA 1955 2005 Permanent democracy 10.0 7.2 8.472 Vietnam 1986 2005 Permanent autocracy -6.4 -8.5 -3.173 Zambia 1964 2005 1991 1968 -2.5 -51.9 -40.174 Zimbabwe 1970 2005 1987 -1.7 -62.5 -48.1
Notes: The Table reports sample characteristics (columns 1-2); the classification of democratic (autocratic) reform episodes and political regimes (columns 3-4); the average Polity2 index of democracy in the respective observed period (column 5); and finally the overage level of the two protection indices (columns 6-7). Bold numbers in columns 3-4 refer to reform episodes that satisfy the criteria requested and thus are those used in the estimation of the democracy effect. (See text).