Embed Size (px)
Citation preview
The economic burden of dementia and associated research funding in the United Kingdom
A report produced by the Health Economics Research Centre, University of Oxford for the Alzheimer’s Research Trust
RAmOn LUEngO-FERnAndEz, JOsE LEAL, ALAsTAiR gRAy
www.dementia2010.org
DEMENTIA 2010
DEMENTIA 2010 full rEporT dementia2010.org
The Alzheimer’s Research Trust is the UK’s leading research charity for
dementia.
We are dedicated to funding scientific studies to find ways to treat, cure or
prevent Alzheimer’s disease, vascular dementia, dementia with Lewy Bodies
and fronto-temporal dementia.
We do not receive any government funding and instead rely on donations
from individuals, companies and charitable trusts, money raised by
individuals and gifts left in people’s Wills to fund our vital work.
Our registered charity number is 1077089.
Find out more at: www.alzheimers-research.org.uk
About the Alzheimer’s research Trust
1
Our thanks go to Jane Wolstenholme for allowing us to access resource use information from a cohort of
dementia patients. We would like to acknowledge all those charities and governmental organisations who very
helpfully responded to our requests for information. Without their help this study would not have been possible.
We are grateful to the England and Wales Charity Commission, especially Eleanor Tew, for providing us with a
comprehensive list of all charities potentially funding health research. The help received from the department
of Health, social services and Public safety of northern ireland, and Wales nHs who provided us with the
data used in this analysis is also gratefully acknowledged. Finally our thanks go to Lydia saroglou and naoki
Akahane for their assistance in collating data for this report.
Acknowledgements
ContentsForeword 2
Introduction 3
Key findings 4
Executive summary 6
Section 1 Introduction 8
Section 2 Methods: Cost of illness study 10 2.1 Introduction 10 2.2 Costs of dementia 11 2.2.1 number of dementia cases
in the UK 11
2.2.2 social care 11
2.2.3 Health care 12
2.2.4 informal care 12
2.2.5 Productivity losses 14
2.3 Costs of cancer 15 2.3.1 social care 15
2.3.2 Health care 15
2.3.3 informal care 16
2.3.4 Productivity losses 17
Section 3 Methods: Research funding 17 3.1 Introduction 17 3.2 Governmental health
research funding 17 3.3 Charity health funding 18
Section 4 Results: Costing studies 19 4.1 Costs of dementia 19 4.1.1 Prevalence of dementia in the UK 19
4.1.2 social care costs 19
4.1.3 Health care costs 19
4.1.4 informal care costs 21
4.1.5 Productivity costs 21
4.1.6 sensitivity analysis: Prevalence rates 21
4.2 Costs of cancer 22 4.2.1 social care 22
4.2.2 Health care costs 22
4.2.3 informal care costs 23
4.2.4 Productivity costs 23
4.3 Cost comparisons across diseases 23
Section 5 Results: Research funding 24 5.1 Sample 24 5.1.1 governmental agencies 24
5.1.2 Charities 24
5.2 Levels of research funding 25
Section 6 Discussion 26
References 29
Appendix 1 Charity research funding proforma 33
Appendix 2 List of included charities 34
Tables and FiguresTables1. EUROdEm prevalence rates of diagnosed and undiagnosed dementia in the UK 11
2. number of diagnosed and undiagnosed dementia cases in the UK in 2006 19
3. Costs of dementia in the UK 20
4. sensitivity analysis: hospitalisations by dementia diagnosis 20
5. sensitivity analysis: dementia deaths by cause 21
6. Costs of cancer in the UK 22
7. Total costs by disease 23
8. Reasons for exclusion of charities identified through the Charity Commission 25
9. Research funding by disease in 2007/08 25
10. Research funding, number of cases and total costs of disease 26
Figures1. Health and social care costs 23
2. distribution of costs by disease 24
3. Proportion of research funding
by disease area 26
FOREWORd
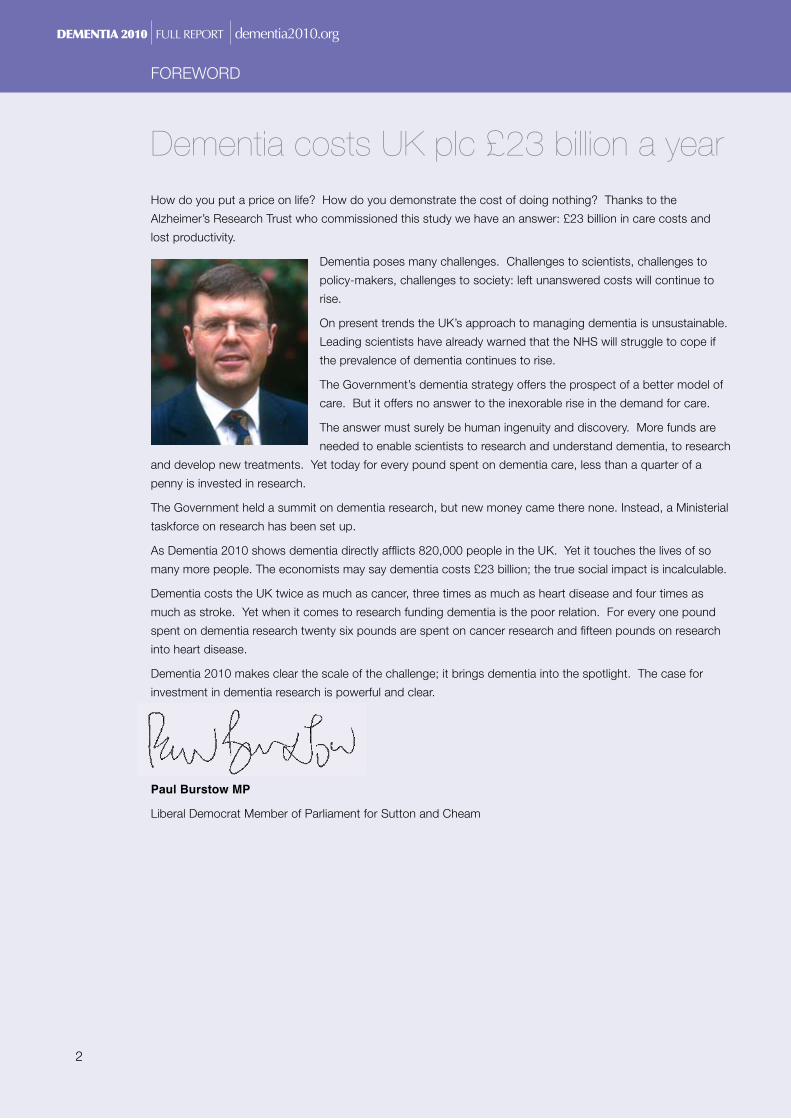
Dementia costs UK plc £23 billion a year How do you put a price on life? How do you demonstrate the cost of doing nothing? Thanks to the
Alzheimer’s Research Trust who commissioned this study we have an answer: £23 billion in care costs and
lost productivity.
dementia poses many challenges. Challenges to scientists, challenges to
policy-makers, challenges to society: left unanswered costs will continue to
rise.
On present trends the UK’s approach to managing dementia is unsustainable.
Leading scientists have already warned that the nHs will struggle to cope if
the prevalence of dementia continues to rise.
The government’s dementia strategy offers the prospect of a better model of
care. But it offers no answer to the inexorable rise in the demand for care.
The answer must surely be human ingenuity and discovery. more funds are
needed to enable scientists to research and understand dementia, to research
and develop new treatments. yet today for every pound spent on dementia care, less than a quarter of a
penny is invested in research.
The government held a summit on dementia research, but new money came there none. instead, a ministerial
taskforce on research has been set up.
As dementia 2010 shows dementia directly afflicts 820,000 people in the UK. yet it touches the lives of so
many more people. The economists may say dementia costs £23 billion; the true social impact is incalculable.
dementia costs the UK twice as much as cancer, three times as much as heart disease and four times as
much as stroke. yet when it comes to research funding dementia is the poor relation. For every one pound
spent on dementia research twenty six pounds are spent on cancer research and fifteen pounds on research
into heart disease.
dementia 2010 makes clear the scale of the challenge; it brings dementia into the spotlight. The case for
investment in dementia research is powerful and clear.
Paul Burstow MP
Liberal democrat member of Parliament for sutton and Cheam
DEMENTIA 2010 full rEporT dementia2010.org
2
3
inTROdUCTiOn
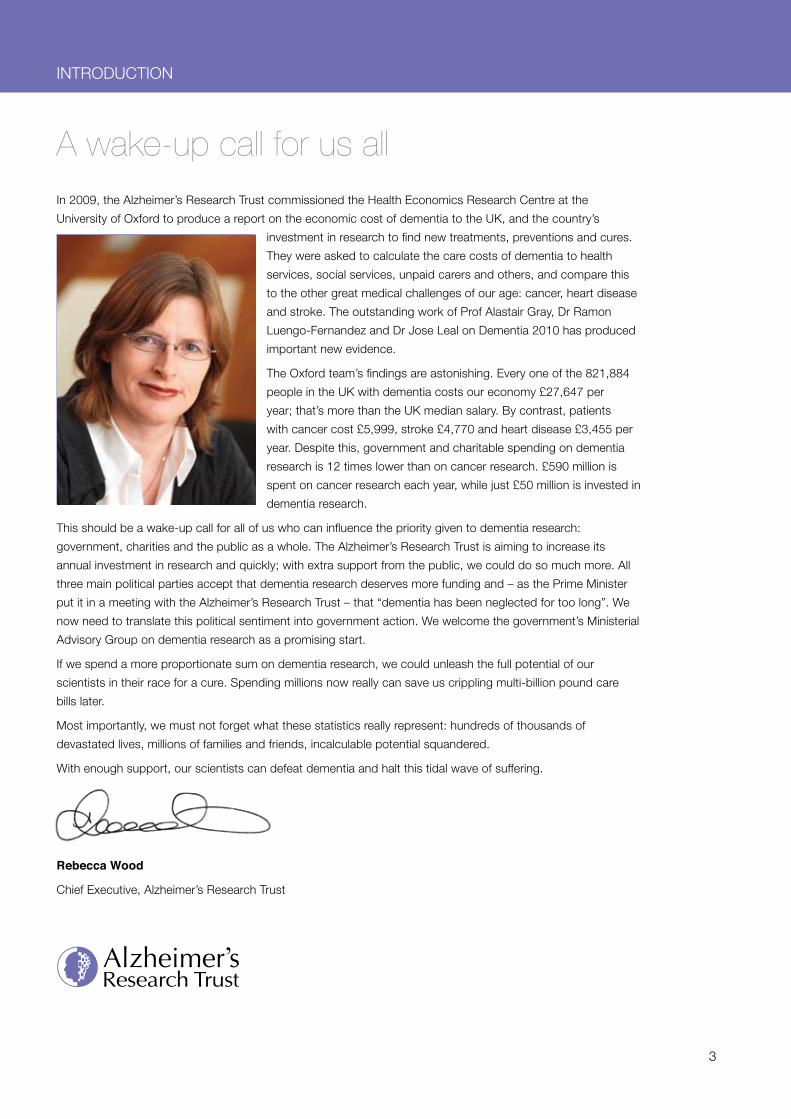
A wake-up call for us all in 2009, the Alzheimer’s Research Trust commissioned the Health Economics Research Centre at the
University of Oxford to produce a report on the economic cost of dementia to the UK, and the country’s
investment in research to find new treatments, preventions and cures.
They were asked to calculate the care costs of dementia to health
services, social services, unpaid carers and others, and compare this
to the other great medical challenges of our age: cancer, heart disease
and stroke. The outstanding work of Prof Alastair gray, dr Ramon
Luengo-Fernandez and dr Jose Leal on dementia 2010 has produced
important new evidence.
The Oxford team’s findings are astonishing. Every one of the 821,884
people in the UK with dementia costs our economy £27,647 per
year; that’s more than the UK median salary. By contrast, patients
with cancer cost £5,999, stroke £4,770 and heart disease £3,455 per
year. despite this, government and charitable spending on dementia
research is 12 times lower than on cancer research. £590 million is
spent on cancer research each year, while just £50 million is invested in
dementia research.
This should be a wake-up call for all of us who can influence the priority given to dementia research:
government, charities and the public as a whole. The Alzheimer’s Research Trust is aiming to increase its
annual investment in research and quickly; with extra support from the public, we could do so much more. All
three main political parties accept that dementia research deserves more funding and – as the Prime minister
put it in a meeting with the Alzheimer’s Research Trust – that “dementia has been neglected for too long”. We
now need to translate this political sentiment into government action. We welcome the government’s ministerial
Advisory group on dementia research as a promising start.
if we spend a more proportionate sum on dementia research, we could unleash the full potential of our
scientists in their race for a cure. spending millions now really can save us crippling multi-billion pound care
bills later.
most importantly, we must not forget what these statistics really represent: hundreds of thousands of
devastated lives, millions of families and friends, incalculable potential squandered.
With enough support, our scientists can defeat dementia and halt this tidal wave of suffering.
Rebecca Wood
Chief Executive, Alzheimer’s Research Trust
4
KEy Findings
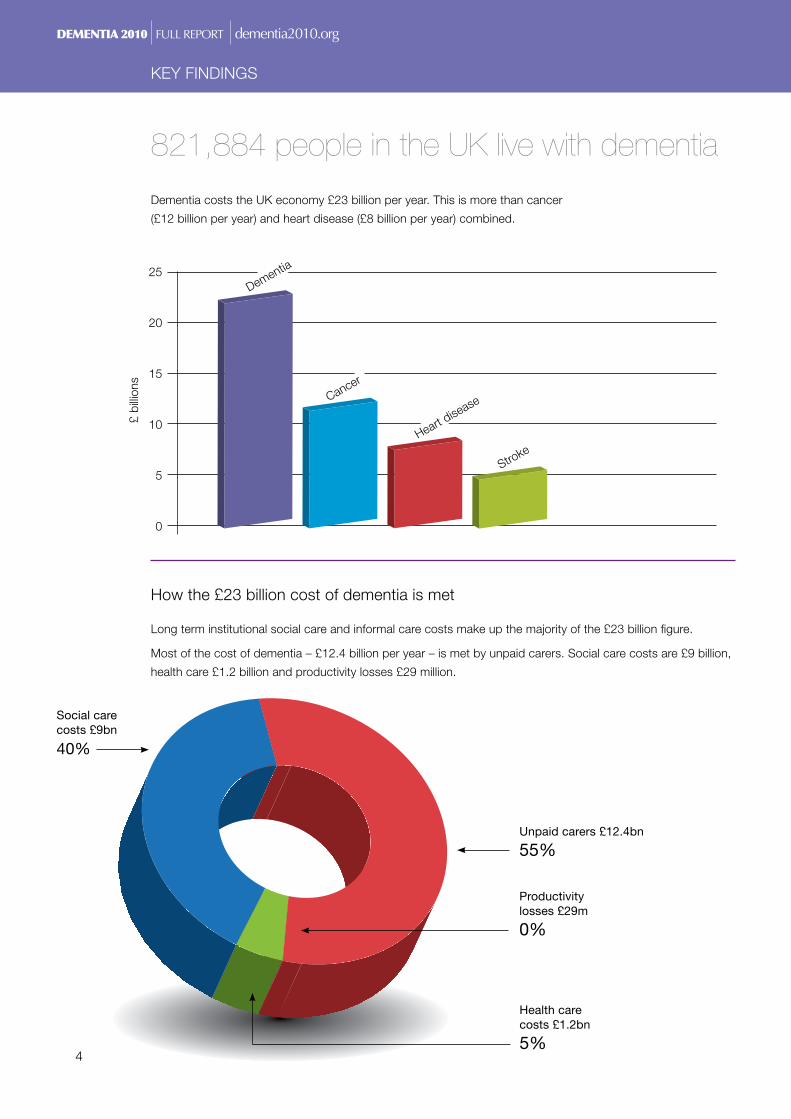
821,884 people in the UK live with dementia
dementia costs the UK economy £23 billion per year. This is more than cancer
(£12 billion per year) and heart disease (£8 billion per year) combined.
How the £23 billion cost of dementia is met
25
20
15
10
5
0
dementia
Cancer
Heart disease
stroke
Unpaid carers £12.4bn
55%
Social care costs £9bn
40%
Health care costs £1.2bn
5%
Productivity losses £29m
0%
£ bi
llions
Long term institutional social care and informal care costs make up the majority of the £23 billion figure.
most of the cost of dementia – £12.4 billion per year – is met by unpaid carers. social care costs are £9 billion,
health care £1.2 billion and productivity losses £29 million.
0
5
10
15
20
25
DEMENTIA 2010 full rEporT dementia2010.org
5
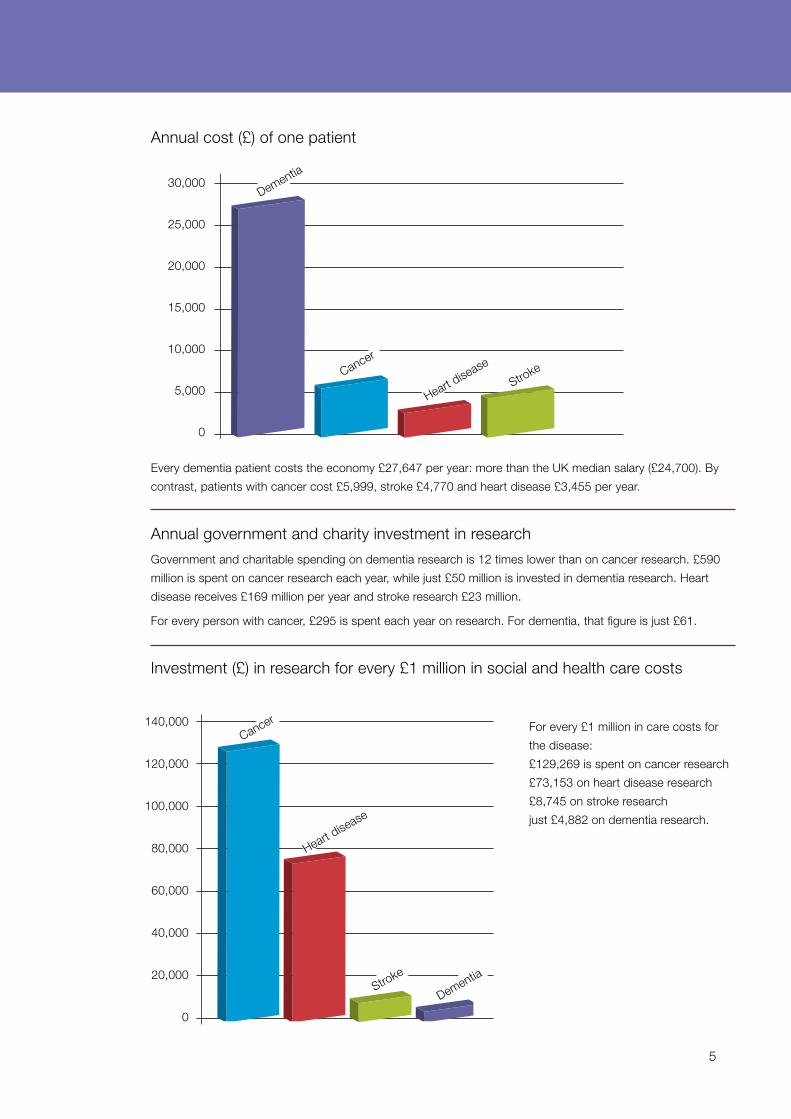
Annual cost (£) of one patient
Every dementia patient costs the economy £27,647 per year: more than the UK median salary (£24,700). By
contrast, patients with cancer cost £5,999, stroke £4,770 and heart disease £3,455 per year.
Annual government and charity investment in research
government and charitable spending on dementia research is 12 times lower than on cancer research. £590
million is spent on cancer research each year, while just £50 million is invested in dementia research. Heart
disease receives £169 million per year and stroke research £23 million.
For every person with cancer, £295 is spent each year on research. For dementia, that figure is just £61.
30,000
25,000
20,000
15,000
10,000
5,000
0
dementia
Cancer
Heart disease
stroke
140,000
120,000
100,000
80,000
60,000
40,000
20,000
0
investment (£) in research for every £1 million in social and health care costs
For every £1 million in care costs for
the disease:
£129,269 is spent on cancer research
£73,153 on heart disease research
£8,745 on stroke research
just £4,882 on dementia research.
Cancer
dementia
Heart disease
stroke
0
30000
60000
90000
120000
150000
0
5000
10000
15000
20000
25000
30000
6
Executive summaryRationale and objectives
This report is the outcome of a study commissioned
by the Alzheimer’s Research Trust to estimate the
economic burden associated with dementia to
the UK economy for the year 2008 in comparison
with other major diseases, and then to compare
the burden of these diseases with current levels of
research funding. dementia describes a group of
symptoms associated with a progressive decline of
brain functions, such as memory, understanding,
judgement, language and thinking. People with
dementia are at an increased risk of physical health
problems and become increasingly dependent on
health and social care services and other people.
Hence, dementia has a significant economic impact
on the health care system, on patients, on family
and friends who provide unpaid care, and on the
wider economy and society. The study reported
here estimates the economic burden from a societal
perspective that includes not only health care costs
but also those costs falling outside the health care
sector, such as the opportunity costs associated
with unpaid care to patients, or productivity losses
associated with premature death or absence from
work due to dementia. The aim was to compare the
economic burden of dementia with that of cancer,
coronary heart disease (CHd) and stroke using the
same methodological approach. Cancer, CHd and
stroke are the three main causes of death in Europe
and the UsA. The UK government and charity
research funding was also examined for each of
the four conditions in the financial year 2007/08.
The aim was to compare the levels of UK research
funding with the respective economic burden of
disease. it was expected that research into the
causes, treatment and prevention of a particular
disease should be broadly related to its economic
burden.
methodsEstimating the economic burden of illness
A prevalence approach was adopted whereby all
costs within the most recent year for which data
were available were measured regardless of the date
of disease onset. A “top down” approach was used
to estimate the total costs using aggregate data on
morbidity, mortality, hospital admissions, disease
related costs, and other health related indicators.
Costs categories used included health care, social
care, informal care, and productivity losses due to
premature mortality and absence from work.
dementia was defined as the international statistical
Classification of diseases and Related Health
Problems 10th Revision (iCd10) F00-F03 and g30,
which include Alzheimer’s disease, vascular and
unspecified dementia, as well as dementia in other
diseases such as Parkinson’s. Cancer was defined
as iCd-10 codes C00-d48, stroke as iCd-10 codes
i60-i69, and coronary heart disease as iCd-10
codes i20-i25.
Research fundingWe identified UK governmental agencies that
provide health research funding and contacted
them to determine the levels of funding for
dementia, cancer, CHd and stroke in the financial
year 2007/08. These agencies included research
councils, such as the medical Research Council
(mRC), and research agencies from the department
of Health and its devolved administrations, such as
the national institute for Health Research (niHR).
Charity organisations that fund health research
were also identified from the Association for
medical Research Charities (AmRC) and the Charity
Commission for England and Wales. due to the
large number of charities in the Charity Commission
register that potentially fund health research, only
the top two hundred charities in terms of their
annual income were considered in this study. These
two hundred charities accounted for over 75% of
the total income of all research funding charities.
The levels of charity research funding for each of the
four conditions were obtained from annual reports or
direct contact with the charities.
The ReportDEMENTIA 2010 full rEporT dementia2010.org
Results Economic burden of illness
The number of patients with dementia in the UK
is estimated to be 821,884, representing 1.3% of
the UK population. We estimate that 37% of all
dementia patients in the UK are in long-term care
institutions costing in excess of £9 billion per year in
social care. Health care costs are estimated at about
£1.2 billion of which hospital inpatient stay accounts
for 44% of the total. informal care is estimated to
involve 1.5 billion hours of unpaid care provided to
dementia patients living in the community, which we
value at £12 billion. Finally, productivity losses due to
dementia account for £29 million. Overall, dementia
is found to cost £23 billion in terms of health and
social care, informal care and productivity losses in
2008.
The combined health and social care costs of
dementia are estimated at £10.3 billion in 2008,
compared to £4.5 billion for cancer, £2.7 billion
for stroke and £2.3 billion for CHd. Using UK
prevalence data, the health and social care cost per
person with disease was estimated at £12,521 for
dementia, £2,559 for stroke, £2,283 for cancer, and
£1,019 for CHd. in terms of societal cost, dementia
also posed the greatest economic burden at £23
billion followed by cancer at £12 billion, CHd at £8
billion and stroke at £5 billion.
Research funding
information on the levels of research funding for
dementia, cancer, CHd and stroke in 2007/08
were obtained from seven of the eight identified
governmental agencies. A total of £405 million
of governmental funds was spent on these four
diseases, of which 66% was spent on cancer
research followed by CHd (21%), dementia (9%)
and stroke (4%). A total of 65 charities that provided
research funding for these four diseases were
identified from the Charity Commission register and
the AmRC. These charities had a combined spend
of £429 million on cancer, CHd, dementia and
stroke research. As with the governmental agencies,
most of these funds were devoted to cancer (£324
million, 76%) followed by CHd (£85 million, 20%),
dementia (£14 million, 3%) and stroke (£6 million,
1%).
in total, the combined research funding into
dementia, cancer, CHd and stroke by governmental
and charity organisations in this study was just
under £833 million. Of this total, £590 million (71%)
was devoted to cancer, £169 million (20%) to CHd,
£50 million (6%) to dementia and £23 million (4%)
to stroke. The total levels of research funding per
person with the disease were evaluated at £295
per person with cancer, £75 per person with CHd,
£61 per person with dementia and £22 per person
with stroke. Put another way, for every £1 million
of health and social care costs attributable to the
disease, cancer received £129,269 in research
funding, CHd received £73,153, stroke received
£8,745 and finally dementia received £4,882.
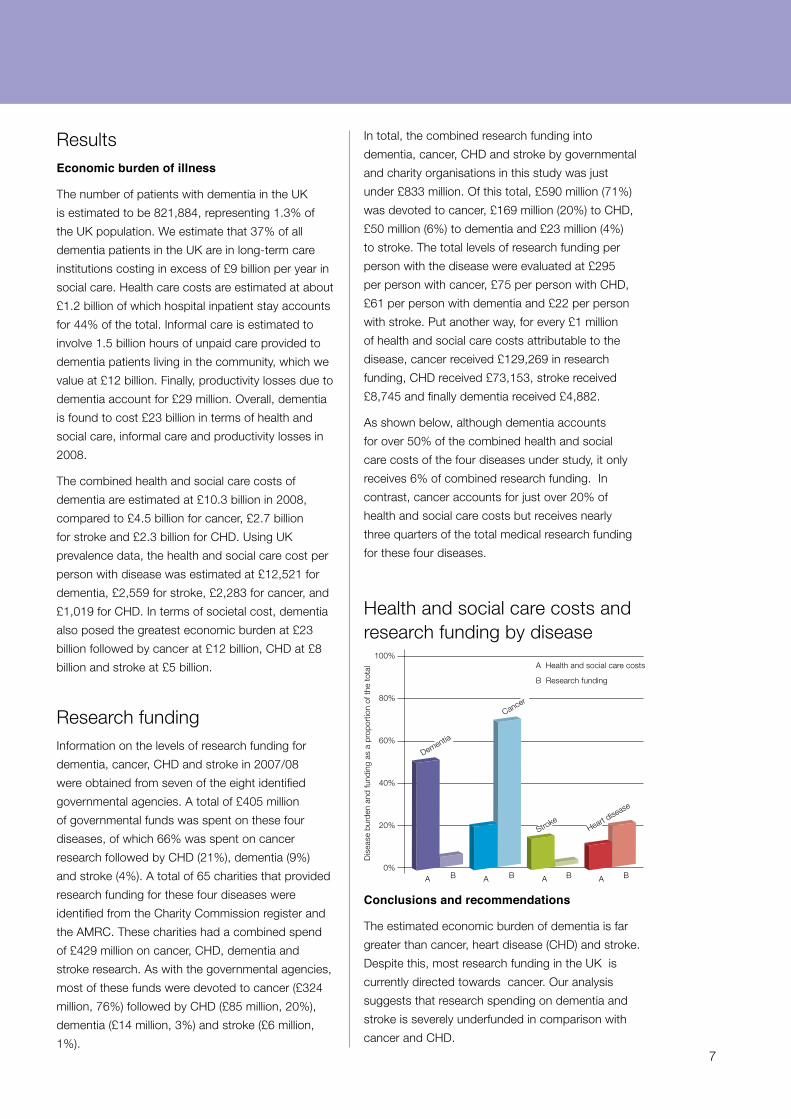
As shown below, although dementia accounts
for over 50% of the combined health and social
care costs of the four diseases under study, it only
receives 6% of combined research funding. in
contrast, cancer accounts for just over 20% of
health and social care costs but receives nearly
three quarters of the total medical research funding
for these four diseases.
Health and social care costs and research funding by disease
Conclusions and recommendations
The estimated economic burden of dementia is far
greater than cancer, heart disease (CHd) and stroke.
despite this, most research funding in the UK is
currently directed towards cancer. Our analysis
suggests that research spending on dementia and
stroke is severely underfunded in comparison with
cancer and CHd.
A Health and social care costs
B Research funding
0
10
20
30
40
50
60
70
80
100%
80%
60%
40%
20%
0%
Cancer
dementia
Heart disease
stroke
A B B B BA A A
dis
ease
bur
den
and
fund
ing
as a
pro
port
ion
of t
he t
otal
7
8
SECTION 1INTRODUCTION
dementia describes a group of symptoms caused
by the gradual death of brain cells, leading to
the progressive decline of functions such as
memory, orientation, understanding, judgement,
calculation, learning, language and thinking [iCd 10
classification]. dementia is a terminal disease where
patients are expected to live three to nine years after
diagnosis.1-4 in the United Kingdom (UK), a previous
study estimated that 683,597 people suffered
from dementia in 2005, with the total forecasted
to increase to 940,110 by 2021 and 1,735,087 by
2051.5 The disease occurs mainly in older people,
referred to as late-onset dementia, but it may also
occur in people under 65 years, referred to as
young-onset dementia.
There are several diseases that cause dementia.
in late-onset dementia, Alzheimer’s disease is the
most common disease, accounting for around 60%
of all cases, followed by cerebrovascular disease
(vascular dementia), and dementia with Lewy bodies
which together account for 15-20% of cases. in
young-onset dementia, fronto-temporal dementia is
the most common disease, followed by Alzheimer’s.
Less common diseases that may also cause
dementia include Parkinson’s and Huntington’s, HiV
and Aids, Korsakoff’s syndrome, Creutzfeldt-Jakob
disease, multiple sclerosis, and motor neurone
disease, amongst others. Recently, mixed cases
of dementia have also been identified such as
Alzheimer’s and dementia with Lewy bodies.6
Alzheimer’s disease (Ad) is a progressive condition
for which no single cause has yet been identified,
but several risk factors have been linked to it, of
which age is the most relevant. Ad progression
can be divided approximately into three stages. in
the early stage, a person with Ad experiences very
minor changes in their abilities or behaviour, e.g.
short-term memory loss, which may be mistakenly
attributed to stress or ageing. in the middle stage,
changes in ability and behaviour such as increasing
forgetfulness become more significant, and people
with Ad require more support to manage their daily
activities, such as eating, washing, dressing or using
the toilet. in the late stage, Ad patients may become
increasingly frail, have difficulty eating, lose memory
and speech abilities, and so gradually become
completely dependent on others for care. People
with vascular dementia, usually due to a series of
small strokes, experience similar symptoms as in Ad
in addition to the symptoms of stroke. However, the
symptoms may develop suddenly, remain stable for
some time and then quickly deteriorate as the result
of another stroke, or gradually decline.
Reasons for the appearance of Lewy bodies in the
brain are still unknown and no risk factors have
yet been identified. dementia with Lewy bodies
is progressive, although with some variation in
the abilities of the sufferer over small periods of
time, and is characterised by similar symptoms to
Parkinson’s disease. several genetic mutations have
been associated with fronto-temporal dementia but
more than half of all cases have no previous family
history. People with fronto-temporal dementia will
experience progressive decline associated with
extreme behavioural changes, such as apathy
and euphoria, speech and language problems,
movement disorders and, at a later stage,
symptoms similar to those in Ad which may require
nursing care.6;7
Few cases of dementia are diagnosed in early
stages, as many of the associated symptoms, e.g.
memory loss, could be attributed to other conditions
such as depression, diabetes, thyroid abnormalities,
delirium, alcoholism or simple ageing. This makes
diagnosis particularly difficult, such that it may
take up to one year or longer for a final diagnosis
to be made. Formal testing for dementia requires
mental ability tests, such as the mini mental state
Examination (mmsE), a review of medical history and
current medications, an examination of biological
markers such as levels of abnormal proteins
associated with Ad, and sometimes imaging scans
such as magnetic resonance imaging (mRi) scan to
detect changes in the brain.
There is still no cost-effective method of identifying
people with dementia through population screening.6
Early diagnosis of dementia is important, allowing
those with dementia and their carers to plan better
for their future and to start treatments that may slow
disease symptoms. There is, however, a significant
gap between the expected number of people with
dementia and the number of diagnoses made in
the UK: only 60 of the expected 122 people with
dementia per 1,000 people over 80 years of age
have been formally diagnosed.8 several barriers have
DEMENTIA 2010 full rEporT dementia2010.org
9
been identified which may explain this gap, such as
fear of the disease in the patient or family, inability to
separate dementia symptoms from normal ageing
process, gPs’ lack of training and confidence in
diagnosing dementia, unclear roles or inconsistent
approaches of specialist services such as memory
services, and variation and inconsistency in the
available diagnostic tools.8
no interventions have yet been developed that
prevent, change or reverse the progressive decline
of brain functions. There are, however, a number
of potential pharmacological (e.g. cholinesterase
inhibitors), and non-pharmacological (e.g. cognitive
behavioural therapy) interventions that focus on
treating the symptoms of dementia.6 nevertheless,
people with dementia are at an increased risk of
physical health problems and become increasingly
dependent on health and social care services
and other people. The progressive nature of the
disease associated with significant changes on
daily living activities, behaviour, appetite and eating
habits, may make people more susceptible to
other diseases. This will be translated into multiple
contacts with the national Health service and social
care services together with increased reliance on
family and friends for support. Amongst all carers,
the carers of people with dementia are one of
the most vulnerable, suffering from high levels of
burden and mental distress, depression, guilt and
psychological problems.6;9 The behavioural and
psychological symptoms of dementia patients, such
as aggression, agitation and anxiety, are particularly
difficult for carers and are a common cause for
institutionalisation of dementia patients in care
homes.5 it is therefore well recognised that dementia
has a significant economic impact on the health
care system, on patients, on family and friends who
provide unpaid care, and on the wide economy and
society.
despite the high burden of dementia, there are
concerns that its diagnosis and treatment in the
UK is generally low. An international comparison
published in 2007 suggested that the proportion
of patients receiving pharmacological treatment
in the UK was less than half the level in countries
such as sweden, ireland, France and spain.10
Furthermore, a report from the national Audit Office
in 2007 identified several problems in the services
and support for people with dementia and set up a
list of recommendations to address these.8 in 2009,
the department of Health released the first national
dementia strategy for England setting out a work
programme over five years to improve dementia
services across three areas: improved awareness,
earlier diagnosis and intervention, and higher quality
of care.11 This will involve an investment over the first
two years of £150 million to fund the implementation
of the strategy.
This report aims to estimate the economic burden
of dementia in the UK in 2008 from a societal
perspective that includes not only health care costs
but also those costs falling outside the health care
sector, such as social care costs, the opportunity
costs associated with unpaid care to patients,
and productivity losses associated with premature
death or absence from work due to dementia. Cost
of illness (COi) studies, such as this, can help to
inform research priorities by providing estimates
of the economic burden of particular public
health problems. if COi studies can be performed
consistently across several diseases it will be
possible to identify main cost components and rank
diseases according to their economic burden. This
can then be used to help plan the allocation of future
research funds towards those diseases with the
greatest burden.
However, decision and policy makers are often faced
with several COi estimates that vary considerably
within and across diseases. These variations
are likely to be due in part to the use of different
perspectives, scope and methods to estimate
costs, raising concerns about the comparability
and usefulness of COi studies to inform research
decisions.12 Using a common approach across
all diseases of interest can help overcome these
difficulties. Hence, another aim of the report was
to compare the costs of dementia with cancer,
coronary heart disease (CHd) and stroke using
the same methodological approach. These three
diseases are the main causes of death in the
Western world. The methodological framework of
our costing analysis was previously used to estimate
the economic burden of cardiovascular disease,CHd
and stroke in the UK.13-16 in this report, we provide
10
new estimates for costs of dementia and cancer
and update the previous CHd and stroke studies to
2008 prices.
in the UK, a governmental review published in
2006 investigated how public bodies should target
medical research funding.17 A recommendation
coming from the review was that the impact of
diseases on the UK population and economy
should be assessed to determine the UK health
priorities which will in turn inform UK health research
priorities. To evaluate the current funding situation in
the UK, governmental and charity research funding
was quantified for dementia, cancer, CHd and
stroke in the financial year 2007/08. The aim was to
compare the levels of UK research funding with the
respective estimated economic burden of disease
and evaluate whether health research priorities are
linked with the respective economic burden.
Structure of the report
The remainder of the report is divided into six
sections as follows:
Section 2 describes the methodology used to
estimate the economic burden of dementia and
cancer;
Section 3 describes the methodology used to
estimate the governmental and charity health
research funding for dementia, cancer, CHd and
stroke;
Section 4 estimates the costs of dementia and
cancer which are compared against CHd and
stroke;
Section 5 sets out the levels of government and
charity research funding for the four conditions and
compares research funding with disease prevalence
and economic burden; and
Section 6 discusses the results and the key
limitations of our approach.
SECTION 2METHODS: COST OF ILLNESS STUDY
2.1 INTRODUCTION
A costing study consists of the identification,
measurement and valuation of all resources related
to an illness, in which all resources consumed
by patients are measured and ascribed using a
monetary value.12 The perspective of the analysis is
fundamental in determining which resources should
be included, and how they should be measured and
valued.13 A health service perspective, for instance,
would only consider costs imposed on hospitals and
other health care providers. A societal perspective
enables a wider analysis, in which all costs are
considered, irrespective of who bears them or
where they are incurred. such a perspective not
only includes health care costs but also those costs
falling outside the health care sector, such as social
care costs, the opportunity costs associated with
unpaid (i.e. informal) care to patients, or productivity
losses associated with premature death or absence
from work due to illness.
Using a societal perspective this study evaluates
the combined costs of dementia and Alzheimer’s
disease (Ad), defined here as international statistical
Classification of diseases and Related Health
Problems 10th Revision (iCd-10)18 F00-F03 and
g30, and collectively referred to as “dementia” in
this report. These costs will then be compared to
those of cancer (iCd-10: C00-d48), stroke (iCd-10:
i60-i69), and coronary heart disease (CHd, iCd-10:
i20-i25).
The framework used to estimate health care and
non-health care costs is similar to the approach by
Leal et al (2006),13 Luengo-Fernandez et al (2006),14
Leal et al (2008),15 and Leal et al (2009)16 to estimate
the economic burden of cardiovascular disease
(CVd), CHd and stroke in the European Union and
the United Kingdom (UK). in addition, the results
of these studies were updated to 2007/08 prices
using recent unit costs,19;20 and appropriate inflation
indices for health and social care costs20 and wage
inflation indices,21;22 in order to compare these costs
with those of dementia and cancer.
DEMENTIA 2010 full rEporT dementia2010.org
11
in order to evaluate the costs of dementia and
cancer an annual time frame was adopted for our
analysis, in which all costs due to the diseases
under investigation within the most recent year
for which data were available were measured,
regardless of the time of disease onset. All health
care and non-health care costs were expressed in
2008 prices. A “top down” approach was employed
to calculate the total expenditure due to these
conditions across the UK. This approach used
aggregate data on morbidity, mortality, hospital
admissions, disease related costs, and other health
related indicators.
A variety of national sources of epidemiological
and health care utilisation data were used. Among
the sources consulted were the Office of national
statistics (Ons), the information services division
scotland (isd), the department of Health (doH),
the Health and social Care information Centre, the
department for Work and Pensions (dWP), Hospital
Episode statistics (HEs), the Labour Force survey
(LFs), the Annual survey of Hours and Earnings
(AsHE), the Hm Revenue and Customs statistical
Office, and the doH Quality and Outcomes
Framework.
2.2 COSTS OF DEMENTIA
2.2.1 Number of dementia cases in the UK
The number of cases of dementia was obtained
from the European Community Concerted Action
on the Epidemiology and Prevention of dementia
(EUROdEm) study.23;24 As part of EUROdEm, data
on the prevalence of diagnosed and undiagnosed
moderate to severe dementia in population-based
studies and surveys conducted in several European
countries, including the UK, were pooled to obtain
a set of prevalence rates for men and women in 9
different age groups (30-59, 60-64, 65-69, 70-74,
75-79, 80-84, 85-89, 90-94 and 95-99) for the UK
and 30 other European countries (Table 1).
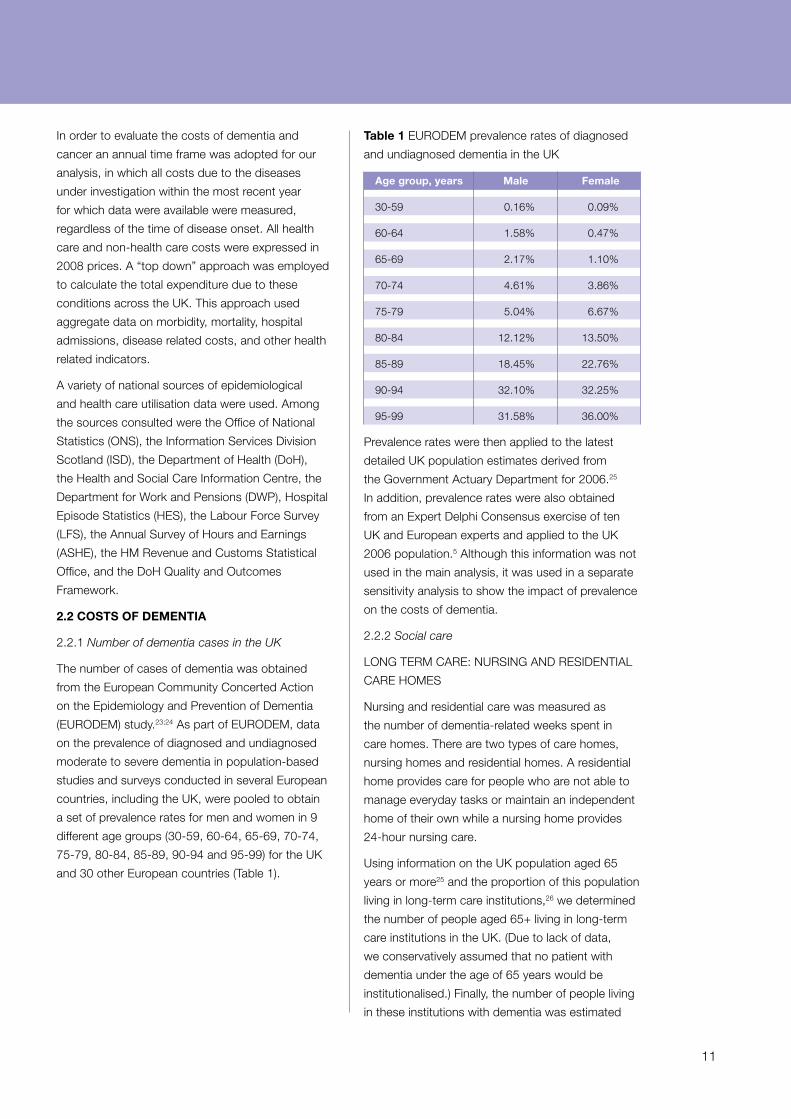
Table 1 EUROdEm prevalence rates of diagnosed
and undiagnosed dementia in the UK
Age group, years Male Female
30-59 0.16% 0.09%
60-64 1.58% 0.47%
65-69 2.17% 1.10%
70-74 4.61% 3.86%
75-79 5.04% 6.67%
80-84 12.12% 13.50%
85-89 18.45% 22.76%
90-94 32.10% 32.25%
95-99 31.58% 36.00%
Prevalence rates were then applied to the latest
detailed UK population estimates derived from
the government Actuary department for 2006.25
in addition, prevalence rates were also obtained
from an Expert delphi Consensus exercise of ten
UK and European experts and applied to the UK
2006 population.5 Although this information was not
used in the main analysis, it was used in a separate
sensitivity analysis to show the impact of prevalence
on the costs of dementia.
2.2.2 Social care
LOng TERm CARE: nURsing And REsidEnTiAL
CARE HOmEs
nursing and residential care was measured as
the number of dementia-related weeks spent in
care homes. There are two types of care homes,
nursing homes and residential homes. A residential
home provides care for people who are not able to
manage everyday tasks or maintain an independent
home of their own while a nursing home provides
24-hour nursing care.
Using information on the UK population aged 65
years or more25 and the proportion of this population
living in long-term care institutions,26 we determined
the number of people aged 65+ living in long-term
care institutions in the UK. (due to lack of data,
we conservatively assumed that no patient with
dementia under the age of 65 years would be
institutionalised.) Finally, the number of people living
in these institutions with dementia was estimated
12
using prevalence data from a UK population-based
study of 13,004 elderly people (i.e. the medical
Research Council Cognitive Function and Ageing
study – mRC CFAs).27 This study assessed the
prevalence of dementia in those living in residential
and nursing care homes on the basis of a clinically
oriented assessment interview.
The weekly costs of residential and of nursing
home care were derived from the UK Unit Costs
of Health and social Care as reported in the
year 2008 compendium.20 These two costs
were then combined into a weekly cost of long-
term institutionalised care, weighted to reflect
the proportion of patients living in each type of
institutional care, which was derived from the mRC
CFAs study.27 These costs were then converted
into annual costs, and multiplied by the number of
dementia cases living in long-term institutionalised
accommodation.
2.2.3 Health care
PRimARy CARE
Primary care activities consisted of dementia-
related visits to general practitioners (gPs), gP
home and telephone visits, nurse visits at clinic, and
nurse home visits.
The consultation rates of patients with dementia
were obtained from published evidence from a study
estimating the relationship between the costs of
dementia care and disease progression.28 Although
all patients in that study were derived from a single
geographical location in the UK, i.e. Oxfordshire, the
patient sample was shown to be representative of
the general population with regard to the distribution
of social class.29 That study provided information on
the number of primary care visits over a period of
up to 11 years from diagnosis made by 100 patients
diagnosed with either Ad or vascular dementia, with
separate consultation rates for those patients living
in the community and those living in institutionalised
care settings. These consultation rates were then
applied to the number of dementia patients living
in institutionalised settings and those living in the
community. The number of dementia patients living
in the community was estimated by subtracting the
total number of patients living in institutionalised
long-term care from the total number of estimated
dementia cases in the UK. The total number of
primary care consultations due to dementia was
then multiplied by their unit costs. Unit costs were
obtained from the UK Unit Costs of Health and
social Care for the year 2008 compendium.20
HOsPiTAL OUTPATiEnT VisiTs
Hospital outpatient care comprised all dementia-
related consultant visits taking place in outpatient
departments in acute care institutions.
The outpatient visit rates of patients with dementia
were obtained from the same study as that used
to determine primary care consultations.28 As with
primary care, visit rates were obtained separately
for those patients living in long-term care institutions
and those living in the community and were
multiplied by the estimated number of dementia
patients living in these two settings. The total
number of outpatient visits due to dementia was
then multiplied by their unit cost. Unit costs were
obtained from the nHs Reference Cost schedules
for the year 2007/08.19
ACCidEnT & EmERgEnCy VisiTs
Accident and emergency (A&E) care consisted of all
dementia-related hospital emergency visits.
Use of A&E services was derived from a study of
132 people diagnosed with dementia in south
London, of which 101 lived in the community and
31 in institutionalised settings.30 This study provided
information on the proportion of patients accessing
A&E services over the last three months, which was
then multiplied by four to obtain an annual estimate.
As the study showed no differences in A&E use
between patients living in the community or in
institutions (p=0.742), A&E visit rates were multiplied
by the total number of dementia cases in the UK,
without further stratification by living arrangements.
The total number of A&E visits due to dementia
was then multiplied by their unit cost. A&E unit
costs were obtained from the nHs Reference Cost
schedules for the year 2007/08.19
HOsPiTAL inPATiEnT CARE
Hospital inpatient care was estimated from the
number of days in hospital due to dementia, which
included rehabilitation sessions, community hospital
DEMENTIA 2010 full rEporT dementia2010.org
13
respite care and hospital day cases. Hospital
day case admissions were obtained separately
from hospital inpatient care. in England, hospital
inpatient stay and day cases were obtained from
the Hospital Episode statistics (HEs) by primary
diagnosis of dementia and Alzheimer’s disease. in
Wales, scotland and northern ireland, equivalent
information was obtained from their respective
statistical bodies.31-33 Unit costs for a hospital bed
day and day case were then obtained from nHs
Reference Cost schedules for the year 2007/08,19
using the Health Resource group (HRg) for
Alzheimer’s disease.
in addition, information was obtained from HEs, and
its counterparts in Wales, scotland and northern
ireland, on inpatient stay and day cases where
dementia and Alzheimer’s disease were underlying
causes for the hospitalisation, rather than the
primary diagnosis. Although this information was
not used in the main analysis, it was used in a
separate sensitivity analysis showing the costs of all
dementia-related hospitalisations.
mEdiCATiOns
The costs related to consumption of anti-
dementia, antipsychotic, anxiolytic, hypnotic and
antidepressant medications by dementia patients
were included in the analysis.
Costs of anti-dementia medications (i.e. donepezil,
galantamine, rivastigmine and memantine) were
derived from the Prescription Cost Analysis (PCA) for
each of the four countries in the UK 34-37. The PCA
provides details of the number of items and the net
ingredient cost of all prescriptions dispensed in the
community.
The use of antipsychotic, anxiolytic, hypnotic and
antidepressant medications amongst dementia
patients was obtained from a study of 445 people
in south East England living in nursing homes,
of which 74% had probable clinical dementia.38
The proportion of residents regularly taking these
medications was multiplied by the total number of
dementia cases in the UK. The most prescribed
drugs in each medication group were then identified
from the PCA and its annual cost per person was
multiplied by the number of dementia users.
As the PCA data does not include any dispensing
costs or fees, the drug dispensing fee per
prescription was added to the total medication costs
of dementia patients.39
PRiVATE HEALTHCARE
Currently 12.7% of all health care in the UK is
being provided privately,21 but information on the
breakdown of this by disease type is limited. We
assume here that patterns of private health care
use parallel public services, and account for this by
inflating public health care expenditure on primary,
outpatient, A&E, and hospital inpatient care by
12.7%.
2.2.4 Informal care
informal care costs are equivalent to the opportunity
cost of unpaid care. This opportunity cost can be
considered a measure of the amount of money
that carers forgo to provide unpaid care for their
spouses, friends or relatives suffering from dementia.
For this analysis we assumed that only those
patients living in the community would receive
informal care.
The average hours per week spent by relatives and
friends providing unpaid care for dementia sufferers
was obtained from schneider et al. (2002).30 This
study of 101 patients living in the community, asked
carers how much time was spent over one week
providing care in three principal forms:
1: general tasks (i.e. shopping, paperwork,
cooking, eating meals and other household
chores);
2: specific tasks (i.e. bathing, dressing, grooming
and providing transport); and
3: supervision. The average hours per week
providing informal care were then multiplied
by the number of dementia cases living in the
community, and annualised by multiplying by 52
weeks.
To value the amount of informal care provided, care
provided by employed carers was valued using the
gender-specific average wage in the UK,22 whereas
care provided by unemployed, inactive or retired
carers was valued using the minimum wage.40
To determine the employment status of the carer
we used information from the study by schneider
et al. (2002) 30 on the carer’s relationship with the
patient (spouse, son/daughter, son/daughter in law,
14
sibling, other relative or friend) and the gender of
the carer. due to the advanced age of the patient
group in this study (mean age was 80 years),
we assumed that spouses, siblings and friends
providing the care would typically be aged 65 years
of age or more, and therefore be retired. if care was
being provided by either the patients’ children or
their children’s spouses, then it was assumed that
these informal carers would be under 65 years of
age. Using gender-specific economic activity and
unemployment rates,41 we then determined the
proportion of these carers who were employed or
unemployed/economically inactive.
2.2.5 Productivity losses
mORTALiTy LOssEs
The costs associated with lost productivity due to
mortality comprised the foregone earnings from
premature death due to dementia. Age and gender
specific deaths, where the main cause was either
dementia or Alzheimer’s disease, were obtained
from UK mortality databases.42-44 deaths where
dementia or Alzheimer’s disease was the underlying
cause of death were also obtained and included in
our analysis.
UK labour statistics report economically active
individuals from age group 16-17 to 65+ years of
age.41 We used an initial working age for both men
and women of 16 years and assumed that above 70
years of age the proportion of people working would
be negligible. The number of working years lost due
to premature mortality was estimated both for males
and females, using expected working years left
by age group together with the number of deaths
broken down by age and gender. However, not
everyone of working age will be economically active
(i.e. either working or actively searching for work) or
employed. Therefore, the estimated working years
lost due to premature mortality were adjusted using
age and gender specific unemployment and activity
rates for the UK.41 The average annual earnings
of male and female workers were taken from the
Annual survey of Hours and Earnings.22 The product
of these earnings and potential working years lost
provided the mortality costs due to dementia.
As these productivity costs would be incurred in
future years, all future foregone earnings were
discounted using a 3.5% rate per annum following
current UK Hm Treasury recommendations.45
A separate sensitivity analysis was undertaken
showing by how much costs would increase if
deaths where dementia was the underlying cause
were included in the analysis.
mORBidiTy LOssEs
The morbidity costs due to dementia included the
number of days lost covered by incapacity claims,
and other working days lost.
The number of incapacity benefit working days due
to dementia was obtained from the department
of Works and Pension information Centre,46 which
provided the days of certified incapacity in the period
between April 2001 and march 2002 by gender and
diagnosis (as coded in iCd-10).
The number of working days lost not covered by
incapacity claims was obtained from a report by the
Chartered institute of Personnel and development,47
which provided the working days lost due to all-
cause illness per worker for the UK. The average
number of working days lost was then multiplied by
the total number of employed people in the UK.41 To
determine the number of working days lost due to
dementia, the total days lost was multiplied by the
proportion of incapacity days claimed for dementia
in the UK.46
The product of working days lost and average daily
earnings provided the productivity losses associated
with dementia morbidity. However, absent workers
after a certain period are likely to be replaced at
work by other workers, and so the total morbidity
loss as computed above is likely to be an upper
limit of the “real” loss from dementia. Hence, we
estimated the “friction period”, i.e. the period of
employee’s absence from work due to illness before
he or she is replaced by another worker, which is
estimated to be 90 days in Europe. The friction
period adjusted morbidity loss was then estimated
by multiplying the unadjusted productivity loss
estimates by the friction period, and dividing this
product by the average duration of each spell of
work incapacity; this was estimated in this study to
be 232 days on average, following the estimates
used by Leal et al (2006)13 and Luengo-Fernandez
et al (2006)14 when estimating the burden of
cardiovascular diseases.
DEMENTIA 2010 full rEporT dementia2010.org
15
2.3 COSTS OF CANCER
2.3.1 Social care
HOsPiCE PALLiATiVE CARE
Hospice care consisted of all cancer-related stays
in hospices providing end of life and palliative
care across the UK. We only considered stays in
independent hospices, i.e. those funded by charities
and other not-for-profit organisations, as palliative
care funded by the nHs was already included under
inpatient hospital care.
A report from the national Audit Office (nAO)
provided the annual expenditure of all independent
hospice care providers in England as well as
the proportion of total deaths due to cancer.48
The product of the annual expenditure and the
proportion of deaths due to cancer provided the
total annual hospice expenditure on cancer. By
using Ons data on the number of deaths due to
cancer in hospices44 and the proportion of hospice
care that was provided independently48 it was
possible to estimate the number of cancer-related
deaths occurring in independent hospices. The care
cost per person dying of cancer in an independent
hospice in England was estimated by dividing
the annual hospice expenditure on cancer by the
number of cancer deaths in hospices.
Assuming that the proportion of cancer-related
deaths occurring in independent hospices was the
same across England and Wales, northern ireland
and scotland, the proportion of all cancer-related
deaths in independent hospices was applied to the
total number of cancer deaths in each country.42-44
Finally, it was assumed that the cost per cancer
death in an independent hospice for England
would be the same in Wales, northern ireland and
scotland.
2.3.2 Health care
PRimARy CARE
Primary care activities consisted of cancer- related
gP visits at clinic, gP home and telephone visits,
nurse visits at clinic, and nurse home visits.
in order to obtain the number of cancer-related
primary care consultations, the proportion of
primary care visits due to cancer49 was applied to
the total number of consultations in primary care for
all diseases and conditions.50-53 The total number
of primary care consultations due to cancer was
then multiplied by their unit costs. Unit costs were
obtained from the UK Unit Costs of Health and
social Care for the year 2008 compendium.20
HOsPiTAL OUTPATiEnT VisiTs
Hospital outpatient care comprised all cancer-related
consultant visits taking place in outpatient wards in
acute care institutions.
in order to evaluate the number of cancer-related
consultant visits, the proportion of outpatient visits
due to cancer was applied to the total number
of hospital outpatient visits. The proportion of
outpatient visits in each medical speciality due to
cancer was obtained from a scottish report,54 in
which consultants working within each medical
speciality were asked to provide, based on their
expert opinion, the proportion of all visits attributable
to cancer. These proportions were then applied to
the total number of outpatient visits in each medical
speciality, which was obtained from routinely
collected UK data.55-58 The total number of cancer-
related outpatient visits in each speciality was
then multiplied by their unit cost. Unit costs were
obtained from the nHs Reference Cost schedules
for the year 2007/08.19
ACCidEnT & EmERgEnCy VisiTs
A&E care consisted of all cancer-related hospital
emergency visits. As with outpatient visits, the
proportion of total A&E visits due to cancer was
obtained from a report evaluating the costs of
cancer in scotland.54 The proportion of total A&E
visits due to cancer was then applied to total
A&E visits in the UK, again derived from routinely
collected statistics.55-58 The total number of A&E
visits due to cancer was then multiplied by their unit
cost. A&E unit costs were obtained from the nHs
Reference Cost schedules for the year 2007/08.19
HOsPiTAL inPATiEnT CARE
Hospital inpatient care was estimated from the
number of days in hospital due to cancer, which
included hospital-based palliative care and hospital
day cases. Hospital day case admissions were
obtained separately from hospital inpatient care.
16
Hospital inpatient stay and day cases by primary
diagnosis of cancer were obtained from HEs in
England,55 and from its counterparts in Wales,32
scotland, 33 and northern ireland. 59 Unit costs for a
hospital bed day and day case were then obtained
from the nHs Reference Cost schedule for the year
2007/08.19 The unit costs obtained were the cost
per bed day and day case for patients grouped in
the Health Resource groups (HRg) for cancer.
mEdiCATiOns
Costs related to consumption of medications by
cancer patients were included in the analysis.
The costs of cancer medications included all
expenditure on British national Formulary (BnF)
Chapter 8 medications, i.e. “malignant diseases
and immunosuppression”, with expenditure on
immunosuppression medications being excluded.
Expenditure on medications was obtained from the
Prescription Cost Analysis (PCA) for each of the four
countries in the UK,34-37 to which dispensing costs
were added.39
PRiVATE HEALTHCARE
As currently 12.7% of all health care in the UK is
being provided privately,21 to account for this private
spending all nHs healthcare costs (i.e. primary,
outpatient, A&E, and hospital inpatient care) were
inflated using this proportion.
2.3.3 Informal care
informal care costs were equivalent to the
opportunity cost of unpaid care. This opportunity
cost is a measure of the amount of money that
carers forgo to provide unpaid care for their
spouses, friends or relatives suffering from cancer.
For this analysis we assumed that those patients
diagnosed with non-malignant cancers (iCd 10:
d00 to d48) would not require informal care. The
total number of hours of informal care provided to
patients with cancer was obtained by multiplying the
probability of receiving informal care, the number
of hours of care provided and the total number of
patients in need of care.
The probability of receiving informal care was
evaluated for four different cancer patient groups:
1: newly diagnosed patients receiving treatment
and surviving past the first year of diagnosis;
2: newly diagnosed patients receiving treatment
and dying within the first year of diagnosis;
3: newly diagnosed patients receiving palliative
terminal care; and
4: patients whose cancer was diagnosed in the
past and who were receiving palliative terminal
care.
Using cancer registration statistics for each of the
four countries in the UK, 60-63 we obtained the total
number of malignant cancer cases in the UK. Using
UK cancer survival rates,64 we then estimated the
proportion of cases dying:
1: in the same year as that of diagnosis, and
2: one year after diagnosis. With this information
we were then able to determine from the total
number of cancer-related deaths in the UK42-44
that occurred within the same year as diagnosis
and those in which cancer was diagnosed in
previous years.
Based on information about the time cancer patients
were absent from work (more information on how
this was evaluated is provided in section 2.3.4
below), we assumed that newly diagnosed cancer
patients surviving past one year would potentially
require 44 weeks of informal care whilst they were
receiving treatment for the disease.65-71 For newly
diagnosed cancer patients dying within the first
year, we assumed that the average life expectancy
would be 6 months, with the first 3 months being
treated for the disease and the remaining 3 receiving
palliative care. Finally, for patients whose cancer
was diagnosed in previous years, we assumed they
would potentially require 3 months of informal care
whilst receiving palliative care.
The probability of receiving informal care whilst
patients were being treated for cancer and during
the palliative care phase was derived from a UK
study of 262 patients with lymphoma, breast,
colorectal or lung cancer.72 As the study did not
provide the total hours of informal care provided,
we used data from the 2001 national Censuses,73-75
assuming that the hours of informal care received
by cancer patients was the same as that provided
DEMENTIA 2010 full rEporT dementia2010.org
17
for all causes. informal care provided by employed
carers was valued using the gender-specific average
wage in the UK22, whereas care provided by
unemployed, inactive or retired carers was valued
using the minimum wage.40
2.3.4 Productivity losses
mORTALiTy LOssEs
The costs associated with lost productivity due to
mortality were calculated as the foregone earnings
from premature death due to cancer. Age and
gender specific deaths, where the main cause of
death was cancer, were obtained from UK mortality
databases.42-44 The same sources and methods
used to estimate dementia-related mortality costs
were used to estimate mortality associated with
cancer.
mORBidiTy LOssEs
The morbidity costs due to cancer included the
number of days lost due to incapacity and the
working days lost. The same sources and methods
used to estimate dementia-related morbidity costs
were used to estimate those associated with cancer,
the only difference being the friction period used: for
cancer the friction period used was 307 days, based
on results from seven studies which evaluated work
absence after cancer diagnosis.65-71
SECTION 3METHODS: RESEARCH FUNDING
3.1 INTRODUCTION
in the UK, research into health and medical sciences
is funded by a number of different organisations
including the department of Health, and its
counterparts in the devolved administrations; the
UK research councils; charities; and research
and development (R&d) investments from the
pharmaceutical and biotechnology industries.17
The aim of this analysis was to examine the levels
of research funding for dementia, cancer, CHd and
stroke for the year 2007/08. in line with other studies
evaluating the levels of UK health research funding,
research funding provided by the pharmaceutical
and biotechnology industry was excluded from the
analysis.76-79
3.2 GOVERNMENTAL HEALTH RESEARCH
FUNDING
governmental agencies responsible for funding
health research were identified from a report by
the UK Clinical Research Collaboration,76 which
evaluated UK levels of research funding during the
2004/05 financial year. governmental agencies
funding health research included: the Biotechnology
and Biological Research Council (BBRC); the
Engineering and Physical sciences Research
Council (EPsRC); the Economic and social
Research Council (EsRC); the medical Research
Council (mRC); the department of Health through
the national institute for Health Research (niHR); the
Research and development Office for the northern
ireland Health and Personal social services;
the scottish Executive Health department Chief
scientist Office; and the Wales Office of Research
and development for Health and social Care.
For each governmental agency, we sought to
determine the levels of research funding for stroke,
CHd, cancer and dementia. The first step was to
browse through each of the agencies’ websites in
order to obtain information on the research grants
funded by these organisations (i.e. title, disease
area and amount of funding received), by searching
through their annual reports and/or databases of
grants. if no annual report/database of grants
was identified, or the information was not detailed
18
enough, agencies were contacted by electronic
mail, based on the contact details provided in their
websites, and asked to provide information on
the levels of research funding in the financial year
2007/08 for the four diseases under investigation.
3.3 CHARITY HEALTH FUNDING
in order to determine the levels of research funding
on stroke, CHd, cancer and by UK charities, we
identified charities potentially funding health using
two approaches.
First, a list of all the charities that potentially funded
health research was obtained from the Charity
Commission for England and Wales. The Charity
Commission contains a register of all registered
charities holding detailed information, including
annual accounts and reports, for every registered
charity in England and Wales.80 The list of potentially
relevant charities was obtained by identifying all
the charities classified, in the Charity Commission
register, as “medical/Health/ sickness” and
providing monetary funds either by “making grants
to organisations” or “sponsoring or undertaking
research”. due to the very high number of charities
identified using this search criteria (n=6,751),
charities were ranked in terms of their annual income
and only the first two hundred charities, which had
a combined income of over 75% of the total, were
considered.
second, a list of all the charities that were part
of the Association of medical Research Charities
(AmRC) was obtained. The AmRC, an established
charity since 1987, is a membership organisation
of the leading UK charities that fund medical and
health research. in order to join the AmRC, charities
must demonstrate that they have a clear research
strategy, have a peer review process for allocating
funding, and support AmRC position statements
on issues such as payment of indirect costs in
universities and use of animals in medical research.81
At the time of this research, the AmRC consisted of
116 charities with a joint spend of over £800 million
on medical and health research in the UK.81
Charities identified either through the Charity
Commission or AmRC as potentially funding health
research were only excluded from the analysis if
they:
1: were registered in another country, regardless of
the levels of health research funding in the UK,
and were therefore under no obligation to file
their accounts and annual reports in the UK; or
2: were educational/research organisations,
such as universities, or royal colleges that
were registered as charities. Royal colleges
and educational/research organisations were
excluded as a great proportion of their income
is received through externally funded grants
rather than charitable donations, endowments
or legacies. Therefore, to minimise the potential
of double counting the same research funding,
these organisations were excluded.
For each charity, we sought to determine if the
charity funded health research and, if so, the levels
of funding for stroke, CHd, cancer and dementia.
We excluded research expenditure on support
costs such as administration and infrastructure
(e.g. research buildings), but included funded
research taking place outside of the UK. information
on whether each charity was involved in health
research, and if so, the levels of research funding on
the four diseases under investigation was obtained
in three steps with all the data extracted using
a structured proforma (Appendix 1). Firstly, the
charity’s annual report and accounts were obtained.
For charities registered in England and Wales,
a copy of the annual report and accounts was
available through the Charity Commission. Annual
reports were then reviewed to obtain information
on the research grants funded. secondly, if the
information contained within the annual report
was not detailed enough, the charity’s website
was browsed in order to identify if a database of
all the grants for health research was available.
if no relevant information was obtained from the
charity’s website, in the final third step, charities
were contacted by electronic mail and asked if
they funded health research and if so the levels of
research funding in the financial year 2007/08 for the
four diseases under investigation.
As charities included in the study could potentially
make grants to each other, the annual reports and
accounts were checked in order to identify whether
any of their research funding came from grants from
other charities already included in the analysis. This
was undertaken in a bid not to double count the
same research funding.
DEMENTIA 2010 full rEporT dementia2010.org
19
SECTION 4RESULTS: COSTING STUDIES
4.1 COSTS OF DEMENTIA
4.1.1 Prevalence of dementia in the UK
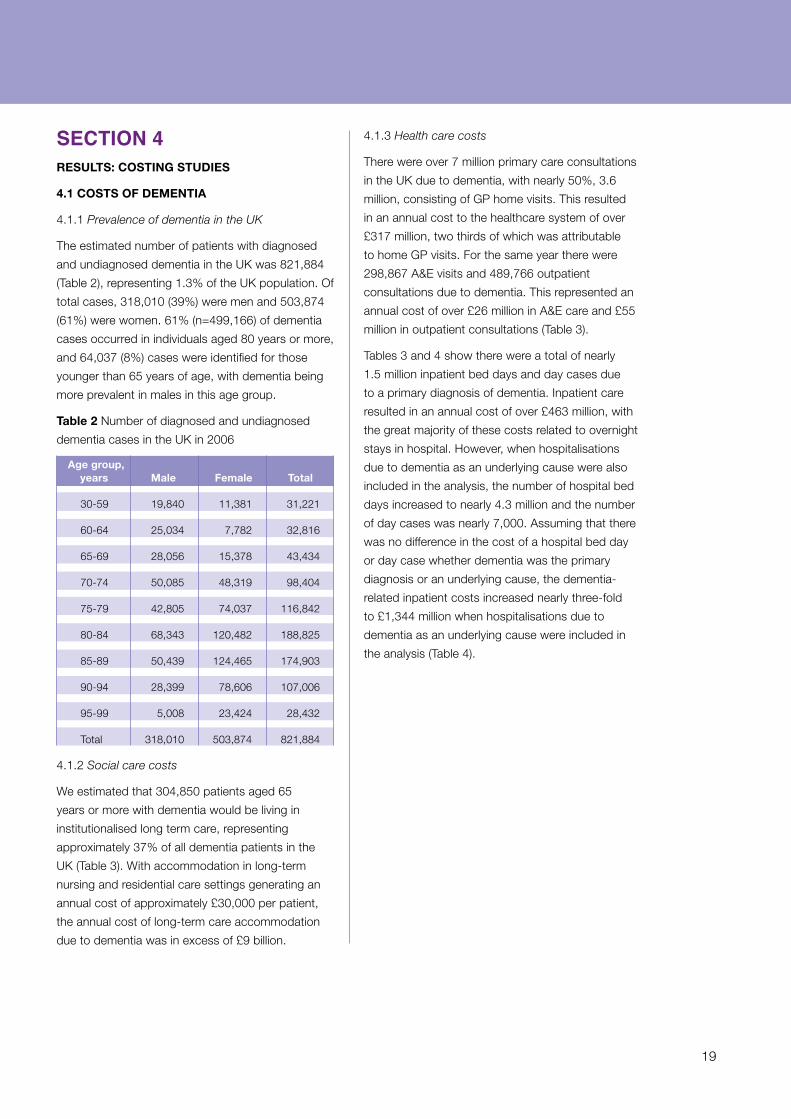
The estimated number of patients with diagnosed
and undiagnosed dementia in the UK was 821,884
(Table 2), representing 1.3% of the UK population. Of
total cases, 318,010 (39%) were men and 503,874
(61%) were women. 61% (n=499,166) of dementia
cases occurred in individuals aged 80 years or more,
and 64,037 (8%) cases were identified for those
younger than 65 years of age, with dementia being
more prevalent in males in this age group.
Table 2 number of diagnosed and undiagnosed
dementia cases in the UK in 2006
Age group, years Male Female Total
30-59 19,840 11,381 31,221
60-64 25,034 7,782 32,816
65-69 28,056 15,378 43,434
70-74 50,085 48,319 98,404
75-79 42,805 74,037 116,842
80-84 68,343 120,482 188,825
85-89 50,439 124,465 174,903
90-94 28,399 78,606 107,006
95-99 5,008 23,424 28,432
Total 318,010 503,874 821,884
4.1.2 Social care costs
We estimated that 304,850 patients aged 65
years or more with dementia would be living in
institutionalised long term care, representing
approximately 37% of all dementia patients in the
UK (Table 3). With accommodation in long-term
nursing and residential care settings generating an
annual cost of approximately £30,000 per patient,
the annual cost of long-term care accommodation
due to dementia was in excess of £9 billion.
4.1.3 Health care costs
There were over 7 million primary care consultations
in the UK due to dementia, with nearly 50%, 3.6
million, consisting of gP home visits. This resulted
in an annual cost to the healthcare system of over
£317 million, two thirds of which was attributable
to home gP visits. For the same year there were
298,867 A&E visits and 489,766 outpatient
consultations due to dementia. This represented an
annual cost of over £26 million in A&E care and £55
million in outpatient consultations (Table 3).
Tables 3 and 4 show there were a total of nearly
1.5 million inpatient bed days and day cases due
to a primary diagnosis of dementia. inpatient care
resulted in an annual cost of over £463 million, with
the great majority of these costs related to overnight
stays in hospital. However, when hospitalisations
due to dementia as an underlying cause were also
included in the analysis, the number of hospital bed
days increased to nearly 4.3 million and the number
of day cases was nearly 7,000. Assuming that there
was no difference in the cost of a hospital bed day
or day case whether dementia was the primary
diagnosis or an underlying cause, the dementia-
related inpatient costs increased nearly three-fold
to £1,344 million when hospitalisations due to
dementia as an underlying cause were included in
the analysis (Table 4).
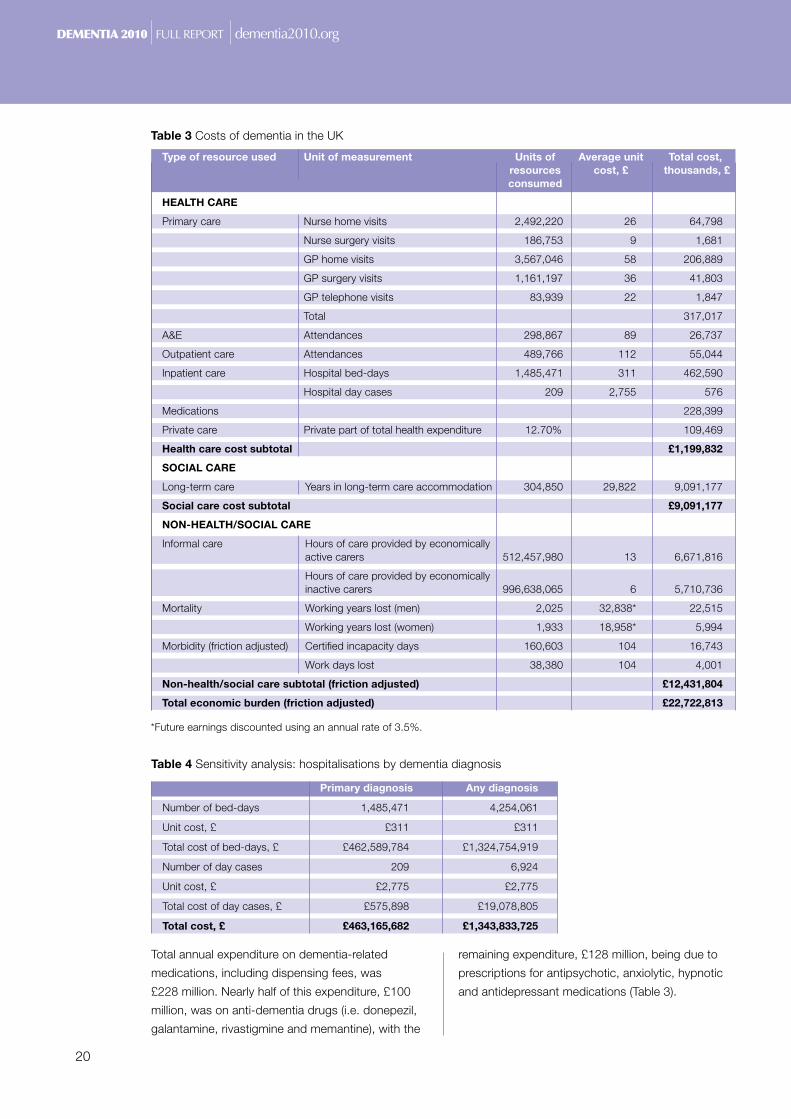
20
Total annual expenditure on dementia-related
medications, including dispensing fees, was
£228 million. nearly half of this expenditure, £100
million, was on anti-dementia drugs (i.e. donepezil,
galantamine, rivastigmine and memantine), with the
remaining expenditure, £128 million, being due to
prescriptions for antipsychotic, anxiolytic, hypnotic
and antidepressant medications (Table 3).
Table 4 sensitivity analysis: hospitalisations by dementia diagnosis
Primary diagnosis Any diagnosis
number of bed-days 1,485,471 4,254,061
Unit cost, £ £311 £311
Total cost of bed-days, £ £462,589,784 £1,324,754,919
number of day cases 209 6,924
Unit cost, £ £2,775 £2,775
Total cost of day cases, £ £575,898 £19,078,805
Total cost, £ £463,165,682 £1,343,833,725
Table 3 Costs of dementia in the UK
Type of resource used Unit of measurement Units of Average unit Total cost, resources cost, £ thousands, £ consumed
HEALTH CARE
Primary care nurse home visits 2,492,220 26 64,798
nurse surgery visits 186,753 9 1,681
gP home visits 3,567,046 58 206,889
gP surgery visits 1,161,197 36 41,803
gP telephone visits 83,939 22 1,847
Total 317,017
A&E Attendances 298,867 89 26,737
Outpatient care Attendances 489,766 112 55,044
inpatient care Hospital bed-days 1,485,471 311 462,590
Hospital day cases 209 2,755 576
medications 228,399
Private care Private part of total health expenditure 12.70% 109,469
Health care cost subtotal £1,199,832
SOCIAL CARE
Long-term care years in long-term care accommodation 304,850 29,822 9,091,177
Social care cost subtotal £9,091,177
NON-HEALTH/SOCIAL CARE
informal care Hours of care provided by economically active carers 512,457,980 13 6,671,816
Hours of care provided by economically inactive carers 996,638,065 6 5,710,736
mortality Working years lost (men) 2,025 32,838* 22,515
Working years lost (women) 1,933 18,958* 5,994
morbidity (friction adjusted) Certified incapacity days 160,603 104 16,743
Work days lost 38,380 104 4,001
Non-health/social care subtotal (friction adjusted) £12,431,804
Total economic burden (friction adjusted) £22,722,813
*Future earnings discounted using an annual rate of 3.5%.
DEMENTIA 2010 full rEporT dementia2010.org
21
Combining all healthcare costs due to dementia, the
total cost to the nHs was £1,090 million if only the
costs of hospitalisations for dementia as a primary
diagnosis were included. including private healthcare
expenditure on dementia, the total cost to the
healthcare system would increase to £1,200 million.
if however, all dementia-related hospitalisations
were included in the analysis the costs to the nHs
would increase to £1,971 million, and those to the
healthcare system to £2,192 million.
4.1.4 Informal care costs
A total of 1,509 million hours of informal care
was provided by friends and relatives of the
517,033 dementia patients living in the community.
Approximately 34% (512 million hours) of this care
was provided by economically active and employed
relatives/friends, with the majority of care (997
million hours) being provided by retired, inactive or
unemployed informal carers. Combined, the total
annual costs of informal care-giving were estimated
at £12,383 million (Table 3).
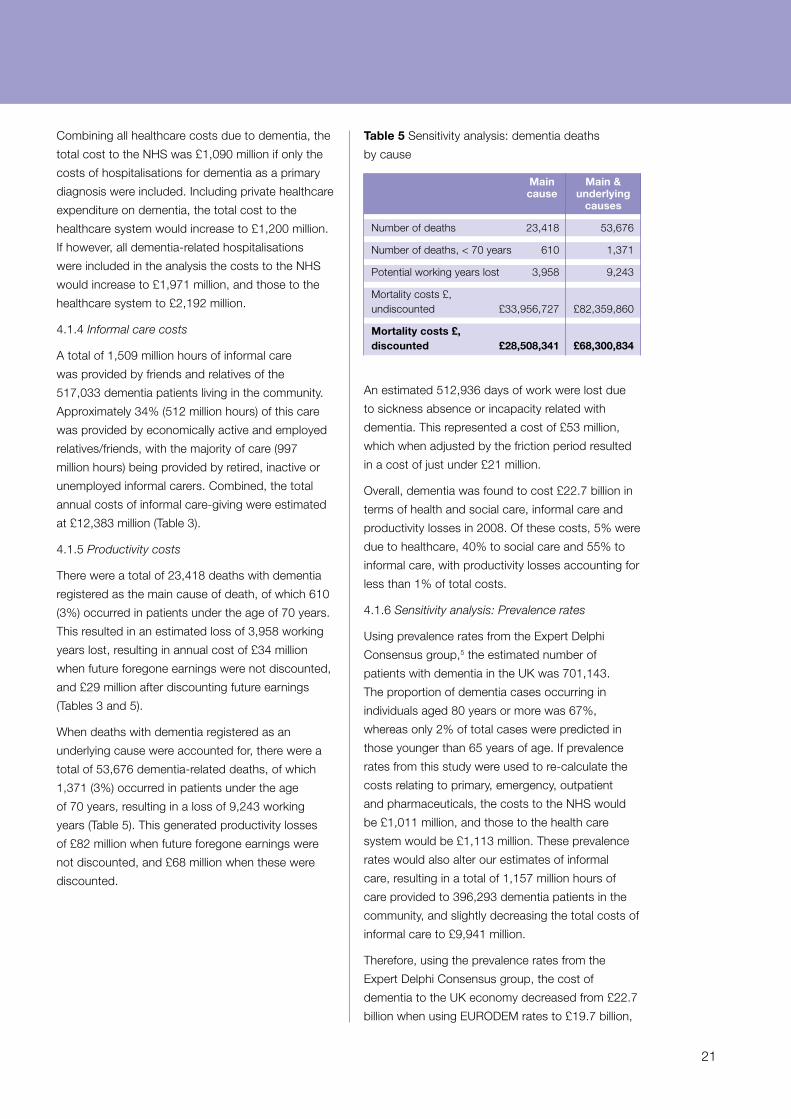
4.1.5 Productivity costs
There were a total of 23,418 deaths with dementia
registered as the main cause of death, of which 610
(3%) occurred in patients under the age of 70 years.
This resulted in an estimated loss of 3,958 working
years lost, resulting in annual cost of £34 million
when future foregone earnings were not discounted,
and £29 million after discounting future earnings
(Tables 3 and 5).
When deaths with dementia registered as an
underlying cause were accounted for, there were a
total of 53,676 dementia-related deaths, of which
1,371 (3%) occurred in patients under the age
of 70 years, resulting in a loss of 9,243 working
years (Table 5). This generated productivity losses
of £82 million when future foregone earnings were
not discounted, and £68 million when these were
discounted.
Table 5 sensitivity analysis: dementia deaths
by cause
Main Main & cause underlying causes
number of deaths 23,418 53,676
number of deaths, < 70 years 610 1,371
Potential working years lost 3,958 9,243
mortality costs £, undiscounted £33,956,727 £82,359,860
Mortality costs £, discounted £28,508,341 £68,300,834
An estimated 512,936 days of work were lost due
to sickness absence or incapacity related with
dementia. This represented a cost of £53 million,
which when adjusted by the friction period resulted
in a cost of just under £21 million.
Overall, dementia was found to cost £22.7 billion in
terms of health and social care, informal care and
productivity losses in 2008. Of these costs, 5% were
due to healthcare, 40% to social care and 55% to
informal care, with productivity losses accounting for
less than 1% of total costs.
4.1.6 Sensitivity analysis: Prevalence rates
Using prevalence rates from the Expert delphi
Consensus group,5 the estimated number of
patients with dementia in the UK was 701,143.
The proportion of dementia cases occurring in
individuals aged 80 years or more was 67%,
whereas only 2% of total cases were predicted in
those younger than 65 years of age. if prevalence
rates from this study were used to re-calculate the
costs relating to primary, emergency, outpatient
and pharmaceuticals, the costs to the nHs would
be £1,011 million, and those to the health care
system would be £1,113 million. These prevalence
rates would also alter our estimates of informal
care, resulting in a total of 1,157 million hours of
care provided to 396,293 dementia patients in the
community, and slightly decreasing the total costs of
informal care to £9,941 million.
Therefore, using the prevalence rates from the
Expert delphi Consensus group, the cost of
dementia to the UK economy decreased from £22.7
billion when using EUROdEm rates to £19.7 billion,
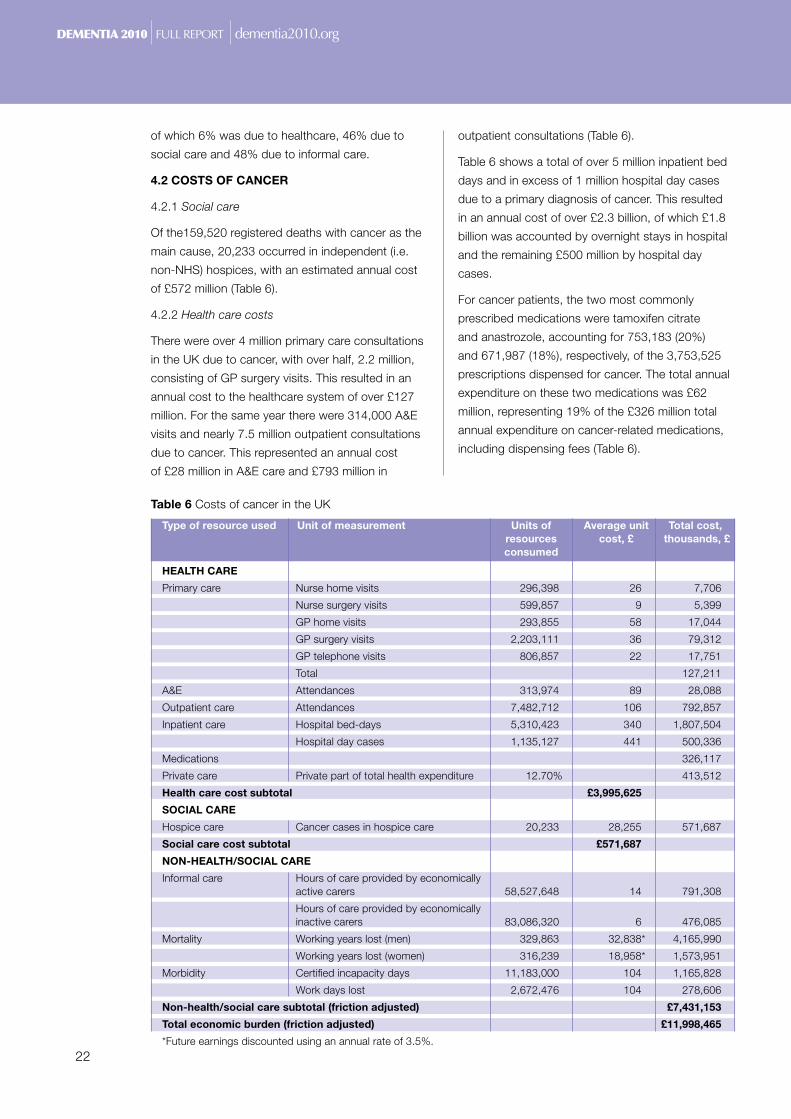
22
of which 6% was due to healthcare, 46% due to
social care and 48% due to informal care.
4.2 COSTS OF CANCER
4.2.1 Social care
Of the159,520 registered deaths with cancer as the
main cause, 20,233 occurred in independent (i.e.
non-nHs) hospices, with an estimated annual cost
of £572 million (Table 6).
4.2.2 Health care costs
There were over 4 million primary care consultations
in the UK due to cancer, with over half, 2.2 million,
consisting of gP surgery visits. This resulted in an
annual cost to the healthcare system of over £127
million. For the same year there were 314,000 A&E
visits and nearly 7.5 million outpatient consultations
due to cancer. This represented an annual cost
of £28 million in A&E care and £793 million in
outpatient consultations (Table 6).
Table 6 shows a total of over 5 million inpatient bed
days and in excess of 1 million hospital day cases
due to a primary diagnosis of cancer. This resulted
in an annual cost of over £2.3 billion, of which £1.8
billion was accounted by overnight stays in hospital
and the remaining £500 million by hospital day
cases.
For cancer patients, the two most commonly
prescribed medications were tamoxifen citrate
and anastrozole, accounting for 753,183 (20%)
and 671,987 (18%), respectively, of the 3,753,525
prescriptions dispensed for cancer. The total annual
expenditure on these two medications was £62
million, representing 19% of the £326 million total
annual expenditure on cancer-related medications,
including dispensing fees (Table 6).
Table 6 Costs of cancer in the UK
Type of resource used Unit of measurement Units of Average unit Total cost, resources cost, £ thousands, £ consumed
HEALTH CARE
Primary care nurse home visits 296,398 26 7,706
nurse surgery visits 599,857 9 5,399
gP home visits 293,855 58 17,044
gP surgery visits 2,203,111 36 79,312
gP telephone visits 806,857 22 17,751
Total 127,211
A&E Attendances 313,974 89 28,088
Outpatient care Attendances 7,482,712 106 792,857
inpatient care Hospital bed-days 5,310,423 340 1,807,504
Hospital day cases 1,135,127 441 500,336
medications 326,117
Private care Private part of total health expenditure 12.70% 413,512
Health care cost subtotal £3,995,625
SOCIAL CARE
Hospice care Cancer cases in hospice care 20,233 28,255 571,687
Social care cost subtotal £571,687
NON-HEALTH/SOCIAL CARE
informal care Hours of care provided by economically active carers 58,527,648 14 791,308
Hours of care provided by economically inactive carers 83,086,320 6 476,085
mortality Working years lost (men) 329,863 32,838* 4,165,990
Working years lost (women) 316,239 18,958* 1,573,951
morbidity Certified incapacity days 11,183,000 104 1,165,828
Work days lost 2,672,476 104 278,606
Non-health/social care subtotal (friction adjusted) £7,431,153
Total economic burden (friction adjusted) £11,998,465
*Future earnings discounted using an annual rate of 3.5%.
DEMENTIA 2010 full rEporT dementia2010.org
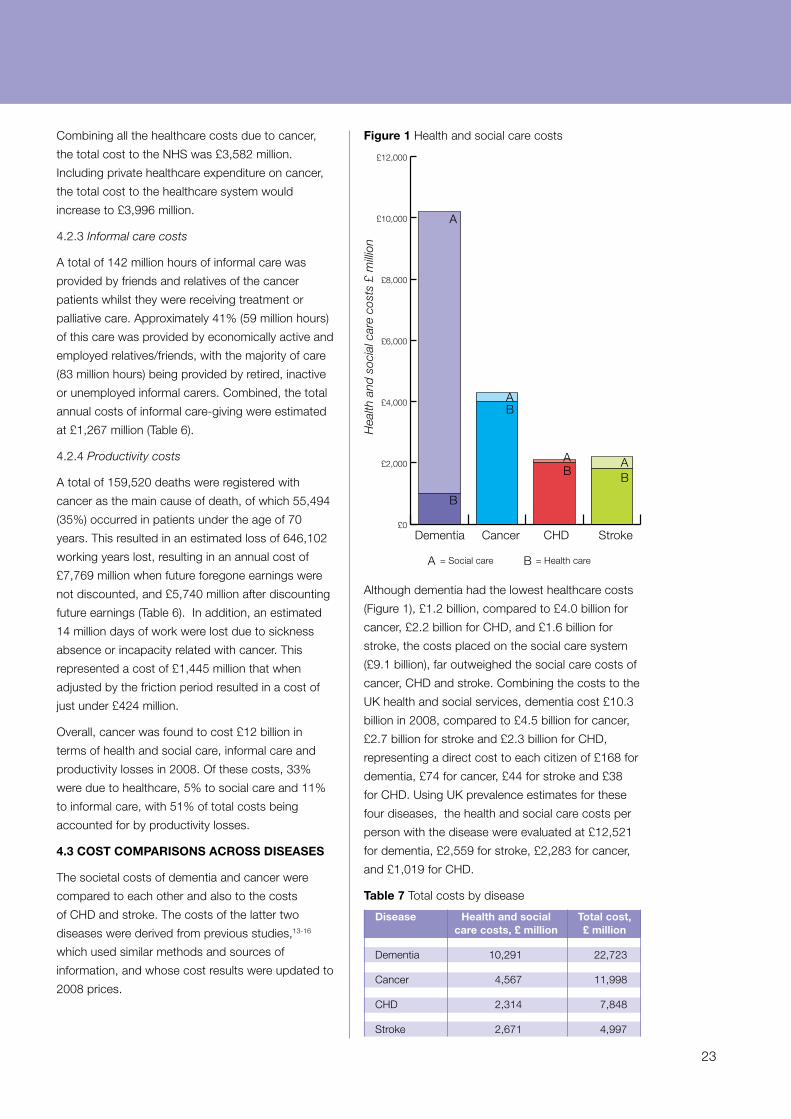
23
Combining all the healthcare costs due to cancer,
the total cost to the nHs was £3,582 million.
including private healthcare expenditure on cancer,
the total cost to the healthcare system would
increase to £3,996 million.
4.2.3 Informal care costs
A total of 142 million hours of informal care was
provided by friends and relatives of the cancer
patients whilst they were receiving treatment or
palliative care. Approximately 41% (59 million hours)
of this care was provided by economically active and
employed relatives/friends, with the majority of care
(83 million hours) being provided by retired, inactive
or unemployed informal carers. Combined, the total
annual costs of informal care-giving were estimated
at £1,267 million (Table 6).
4.2.4 Productivity costs
A total of 159,520 deaths were registered with
cancer as the main cause of death, of which 55,494
(35%) occurred in patients under the age of 70
years. This resulted in an estimated loss of 646,102
working years lost, resulting in an annual cost of
£7,769 million when future foregone earnings were
not discounted, and £5,740 million after discounting
future earnings (Table 6). in addition, an estimated
14 million days of work were lost due to sickness
absence or incapacity related with cancer. This
represented a cost of £1,445 million that when
adjusted by the friction period resulted in a cost of
just under £424 million.
Overall, cancer was found to cost £12 billion in
terms of health and social care, informal care and
productivity losses in 2008. Of these costs, 33%
were due to healthcare, 5% to social care and 11%
to informal care, with 51% of total costs being
accounted for by productivity losses.
4.3 COST COMPARISONS ACROSS DISEASES
The societal costs of dementia and cancer were
compared to each other and also to the costs
of CHd and stroke. The costs of the latter two
diseases were derived from previous studies,13-16
which used similar methods and sources of
information, and whose cost results were updated to
2008 prices.
Figure 1 Health and social care costs
Although dementia had the lowest healthcare costs
(Figure 1), £1.2 billion, compared to £4.0 billion for
cancer, £2.2 billion for CHd, and £1.6 billion for
stroke, the costs placed on the social care system
(£9.1 billion), far outweighed the social care costs of
cancer, CHd and stroke. Combining the costs to the
UK health and social services, dementia cost £10.3
billion in 2008, compared to £4.5 billion for cancer,
£2.7 billion for stroke and £2.3 billion for CHd,
representing a direct cost to each citizen of £168 for
dementia, £74 for cancer, £44 for stroke and £38
for CHd. Using UK prevalence estimates for these
four diseases, the health and social care costs per
person with the disease were evaluated at £12,521
for dementia, £2,559 for stroke, £2,283 for cancer,
and £1,019 for CHd.
Table 7 Total costs by disease
Disease Health and social Total cost, care costs, £ million £ million
dementia 10,291 22,723
Cancer 4,567 11,998
CHd 2,314 7,848
stroke 2,671 4,997
= social care = Health care
Hea
lth a
nd s
ocia
l car
e co
sts
£ m
illio
n
£0
£2,000
£4,000
£6,000
£8,000
£10,000
£12,000
dementia
A
A B
A
A A
B
B
B B
Cancer CHd stroke
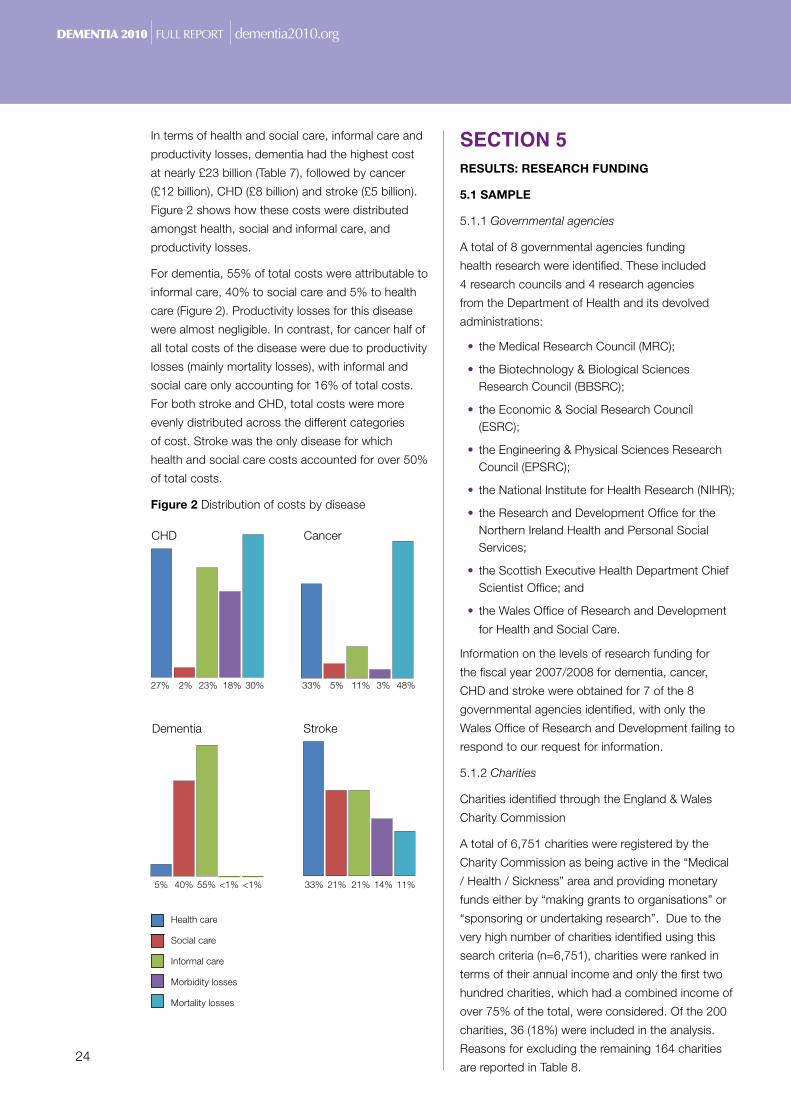
24
in terms of health and social care, informal care and
productivity losses, dementia had the highest cost
at nearly £23 billion (Table 7), followed by cancer
(£12 billion), CHd (£8 billion) and stroke (£5 billion).
Figure 2 shows how these costs were distributed
amongst health, social and informal care, and
productivity losses.
For dementia, 55% of total costs were attributable to
informal care, 40% to social care and 5% to health
care (Figure 2). Productivity losses for this disease
were almost negligible. in contrast, for cancer half of
all total costs of the disease were due to productivity
losses (mainly mortality losses), with informal and
social care only accounting for 16% of total costs.
For both stroke and CHd, total costs were more
evenly distributed across the different categories
of cost. stroke was the only disease for which
health and social care costs accounted for over 50%
of total costs.
Figure 2 distribution of costs by disease
SECTION 5RESULTS: RESEARCH FUNDING
5.1 SAMPLE
5.1.1 Governmental agencies
A total of 8 governmental agencies funding
health research were identified. These included
4 research councils and 4 research agencies
from the department of Health and its devolved
administrations:
• the medical Research Council (mRC);
• the Biotechnology & Biological sciences Research Council (BBsRC);
• the Economic & social Research Council (EsRC);
• the Engineering & Physical sciences Research Council (EPsRC);
• the national institute for Health Research (niHR);
• the Research and development Office for the northern ireland Health and Personal social services;
• the scottish Executive Health department Chief scientist Office; and
• the Wales Office of Research and development
for Health and social Care.
information on the levels of research funding for
the fiscal year 2007/2008 for dementia, cancer,
CHd and stroke were obtained for 7 of the 8
governmental agencies identified, with only the
Wales Office of Research and development failing to
respond to our request for information.
5.1.2 Charities
Charities identified through the England & Wales
Charity Commission
A total of 6,751 charities were registered by the
Charity Commission as being active in the “medical
/ Health / sickness” area and providing monetary
funds either by “making grants to organisations” or
“sponsoring or undertaking research”. due to the
very high number of charities identified using this
search criteria (n=6,751), charities were ranked in
terms of their annual income and only the first two
hundred charities, which had a combined income of
over 75% of the total, were considered. Of the 200
charities, 36 (18%) were included in the analysis.
Reasons for excluding the remaining 164 charities
are reported in Table 8.
0
5
10
15
20
25
30
0
5
10
15
20
25
30
0
5
10
15
20
25
30
0
10
20
30
40
50
0
10
20
30
40
50
60
0
5
10
15
20
25
30
35
CHd Cancer
dementia stroke
27% 2% 23% 18% 30%
5% 40% 55% <1% <1%
33% 5% 11% 3% 48%
33% 21% 21% 14% 11%
Health care
social care
informal care
morbidity losses
mortality losses
0
5
10
15
20
25
30
0
5
10
15
20
25
30
0
5
10
15
20
25
30
DEMENTIA 2010 full rEporT dementia2010.org
25
Table 8 Reasons for exclusion of charities identified
through the Charity Commission
Reason for exclusion number (%)
no health research funding 74* (45%)
no research funding in diseases of interest 51 (31%)
Funded generic health research 22 (13%)
Royal Colleges 8 (5%)
Part of another bigger charity 3 (2%)
Contacted for information, but failed to reply 2 (1%)
Only funded research infrastructure 2 (1%)
University 1 (<1%)
Refused to provide relevant health research expenditure 1 (<1%)
Total exclusions 164
* One charity included in this category was found to provide relatively small donations for research to cancer and CHd research charities. As these charities were already included in the analysis, it was decided to exclude this charity.
A total of 73 (45%) charities were excluded because
there was no evidence in their annual records and
accounts of any expenditure on health research.
31% of charities were excluded because, although
funding health research, this funding was targeted
at diseases other than dementia, cancer, CHd or
stroke. A further 22 (13%) charities were excluded
because its research funding was aimed at generic
research (e.g. genetics or lifestyle interventions that
could have an impact on a wide range of diseases
rather than one in particular). Only 3 charities were
excluded because they either failed to respond to
our contacts for information or refused to provide
the relevant information, which was not held in their
annual reports.
Charities identified through the Association for
medical Research Charities
At the time of this research, the AmRC consisted
of 116 charities. Of these charities, 44 (38%) were
included in the analysis, with the remaining 72 being
excluded. The majority of charities (n=69, 96%) were
excluded as health research funding was in diseases
other than dementia, cancer, CHd or stroke. One
charity was excluded because it was registered in
switzerland and therefore was under no obligation
to file accounts in the UK, and a further two
because they either failed to reply to our contacts
for information or refused to provide the relevant
information.
Through the AmRC and Charity Commission we
identified a total of 65 charities providing research
funding into dementia, cancer, CHd and/or stroke.
Of these 65 charities, 29 (45%) were identified
solely by the AmRC, 21 (32%) solely by the Charity
Commission, and 15 (23%) from both the AmRC
and Charity Commission. A list of all the charities
included in the analysis is reported in Appendix
2. However, the amounts of research funding into
the four diseases under investigation by individual
charities is not provided as some of this information
was provided in confidence.
5.2 LEVELS OF RESEARCH FUNDING
Of the 65 charities included in the analysis, 47
(72%) funded research into cancer, 20 (31%) funded
CHd research, 17 (26%) funded stroke research
and 15 (23%) funded research into dementia. Of
these charities, 28 (43%) were cancer-specific
charities (i.e. they only funded research into cancer).
Combined, these charities spent £429 million into
cancer, CHd, dementia and stroke research (Table
9). most of this research funding, £324 million, was
devoted to cancer, followed by CHd (£85 million),
dementia (£14 million) and stroke (£6 million).
Table 9 Research funding by disease in 2007/08
Cancer CHD Dementia Stroke TOTAL
Charity, £ thousands 323,771 85,031 13,913 5,833 428,548
(% of total) (76) (20) (3) (1) (100)
government, £ thousands 266,640 84,229 36,331 17,522 404,723
(% of total) (66) (21) (9) (4) (100)
Charity & government, £ thousands 590,411 169,260 50,244 23,355 833,270
(% of total) (71) (20) (6) (3) (100)
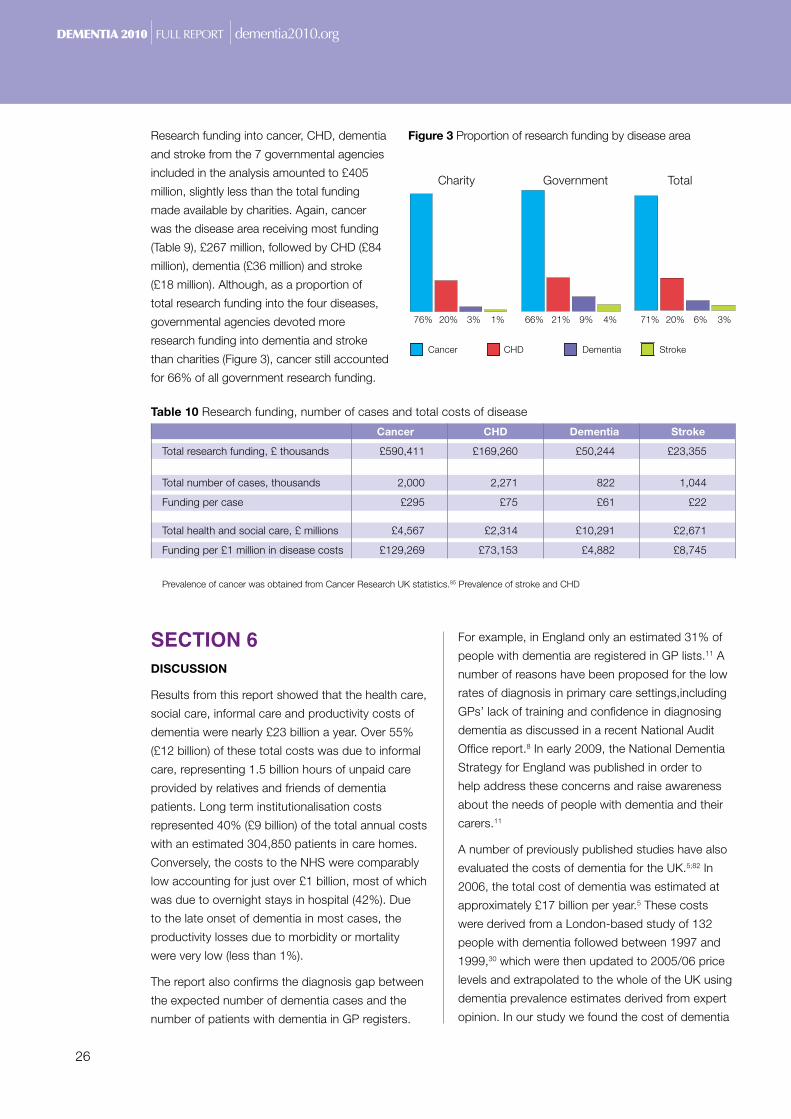
26
Research funding into cancer, CHd, dementia
and stroke from the 7 governmental agencies
included in the analysis amounted to £405
million, slightly less than the total funding
made available by charities. Again, cancer
was the disease area receiving most funding
(Table 9), £267 million, followed by CHd (£84
million), dementia (£36 million) and stroke
(£18 million). Although, as a proportion of
total research funding into the four diseases,
governmental agencies devoted more
research funding into dementia and stroke
than charities (Figure 3), cancer still accounted
for 66% of all government research funding.
Table 10 Research funding, number of cases and total costs of disease
Cancer CHD Dementia Stroke
Total research funding, £ thousands £590,411 £169,260 £50,244 £23,355
Total number of cases, thousands 2,000 2,271 822 1,044
Funding per case £295 £75 £61 £22
Total health and social care, £ millions £4,567 £2,314 £10,291 £2,671
Funding per £1 million in disease costs £129,269 £73,153 £4,882 £8,745
Prevalence of cancer was obtained from Cancer Research UK statistics.85 Prevalence of stroke and CHd
SECTION 6DISCUSSION
Results from this report showed that the health care,
social care, informal care and productivity costs of
dementia were nearly £23 billion a year. Over 55%
(£12 billion) of these total costs was due to informal
care, representing 1.5 billion hours of unpaid care
provided by relatives and friends of dementia
patients. Long term institutionalisation costs
represented 40% (£9 billion) of the total annual costs
with an estimated 304,850 patients in care homes.
Conversely, the costs to the nHs were comparably
low accounting for just over £1 billion, most of which
was due to overnight stays in hospital (42%). due
to the late onset of dementia in most cases, the
productivity losses due to morbidity or mortality
were very low (less than 1%).
The report also confirms the diagnosis gap between
the expected number of dementia cases and the
number of patients with dementia in gP registers.
For example, in England only an estimated 31% of
people with dementia are registered in gP lists.11 A
number of reasons have been proposed for the low
rates of diagnosis in primary care settings,including
gPs’ lack of training and confidence in diagnosing
dementia as discussed in a recent national Audit
Office report.8 in early 2009, the national dementia
strategy for England was published in order to
help address these concerns and raise awareness
about the needs of people with dementia and their
carers.11
A number of previously published studies have also
evaluated the costs of dementia for the UK.5;82 in
2006, the total cost of dementia was estimated at
approximately £17 billion per year.5 These costs
were derived from a London-based study of 132
people with dementia followed between 1997 and
1999,30 which were then updated to 2005/06 price
levels and extrapolated to the whole of the UK using
dementia prevalence estimates derived from expert
opinion. in our study we found the cost of dementia
Charity government Total
76% 20% 3% 1% 66% 21% 9% 4% 71% 20% 6% 3%
Cancer CHd dementia stroke
Figure 3 Proportion of research funding by disease area
DEMENTIA 2010 full rEporT dementia2010.org
27
to be approximately £5 billion more at £23 billion
for the year 2008. These differences in cost were
largely explained by the different prevalence rates
and methodological approaches used to estimate
the costs. so, for example, when prevalence rates
obtained from the expert panel in Knapp and Prince
(2007)5 were used in the sensitivity analysis of this
study the total costs of dementia decreased from
£23 billion to £20 billion. nevertheless, regardless
of the methodological approach used, the total cost
of dementia in the UK far outweighed the costs of
cancer, CHd and stroke.
in order to compare the economic burden of
different diseases, the costs associated with each
disease must be estimated using the same methods
and analytic framework. The methods used to
evaluate the costs of dementia in this report were
similar to previous approaches used to estimate
the economic burden of cardiovascular disease
(CVd), coronary heart disease (CHd) and stroke in
the European Union and the UK.13-16 After updating
the results from these studies to 2008 prices, a
direct comparison was made between the costs
of dementia with those of CHd and stroke without
concerns that the estimated variation in costs was
attributable to the use of different methodologies. in
addition, using the same methodology, we estimated
the economic of burden of cancer as no other
comparable estimates were available for the UK.
stroke and dementia were associated with relatively
low costs to the health care system (£1.6 billion
and £1.2 billion, respectively) when compared to
cancer (£4 billion) and CHd (£2.2 billion). However,
with high rates of long-term institutionalisation,
dementia generated costs to the social care system
of £9 billion per year, compared to £1 billion for
stroke, £0.5 billion for cancer and £0.1 billion for
CHd. When costs other than health and social care
were considered, such as informal care costs and
productivity losses, dementia was again estimated
to have the highest cost of all four diseases
(approximately £23 billion), which was almost twice
the cost of cancer, three times that of CHd and over
4 times that of stroke.
However, the aim of a cost-of-illness study is not
to suggest how much the UK should spend on a
particular disease. Our aim was not to estimate the
burden of disease on UK gross domestic Product
(gdP): for example, we did not include all the costs
and transfer payments associated with each of
the diseases such as home care, social services
such as meals on wheels and day care centres,
pensions and other social benefits. One of the main
aims of a cost-of-illness studies is to help monitor
policy initiatives and to inform decisions on the
distribution of research effort. This is consistent
with a recent governmental review into how public
bodies should target medical research funding.
The review recommended that an assessment of
the impact of diseases on the UK population and
economy was necessary to inform the UK health
research priorities.17 Therefore, after estimating the
costs of cancer, CHd, dementia and stroke we also
evaluated the link between the impact of these four
diseases and the allocation of research funds by
charities and governmental organisations.
The results of this report highlight that, contrary
to the estimates of the economic burden of
disease, research funding is highly dominated by
cancer followed a long way behind by CHd. Our
results, in line with those from previously published
studies, suggest that both dementia and stroke
are grossly underfunded when compared to their
prevalence and, especially, their health and social
care costs.77;78;82 Out of £833 million research funds
made available by charities and governmental
organisations for cancer, CHd, stroke and dementia
research, 71% was devoted to cancer research,
20% was devoted to CHd, 6% was devoted
to dementia and 4% to stroke. Comparing the
economic burden of these four diseases with the
amount of research funding received, results of
our study show that for every £1 million in health
and social care costs, cancer receives £129,269 in
research funding, CHd receives £73,153, followed
by stroke with £8,745 and finally dementia with
£4,882.
Possible reasons for the underfunding of both
stroke and dementia could be that both stroke and
dementia are still largely perceived as untreatable
diseases, which are difficult to research and occur
mainly in the elderly population.77;78 Contrary to
cancer and CHd, stroke is mostly treated by
generalist doctors while there is still no international
28
consensus about which medical specialty should
diagnose and treat dementia.77 This attitude towards
care of dementia and stroke patients may hamper
the research initiative of health professionals
applying for funds.78 As shown in our results, cancer
research funding by charities received an even
greater proportion of total funds than stroke, CHd
and dementia when compared to governmental
funding. This possibly reflects a public preference
towards CHd and cancer charities. it is unclear why
this happens, but ageism, with a perception that
dementia and stroke are confined to the very elderly,
has been forwarded as a possible explanation.77;78
Reflecting the historically low investment in
dementia research, there are worryingly few data
on epidemiological characteristics and use of health
and social services by people with dementia. This
lack of high quality data makes studies such as
this more difficult to conduct. The last population
based study to estimate the prevalence of dementia
in the UK was performed over 17 years ago.83;84
The EUROdEm prevalence rates were obtained
from 1980-1990 prevalence studies across
Europe.23 more recent estimates on the prevalence
of dementia, such as that by Knapp and Prince
(2007),5 were based solely on expert opinion. in
this report, we used the EUROdEm meta-analysis
prevalence rates as the baseline of our cost
estimation and compared it with the results of using
the recent expert opinion rates estimated in Knapp
and Prince (2007).5
in addition, there are no currently published large
UK based studies following cohorts of patients
with dementia and their carers to inform on their
health and social care usage. The studies that are
available have generally small sample sizes and
represent levels of care over 10 years ago.28;30
naturally, this is likely to affect the precision of our
estimates of the costs of primary care, outpatient,
and accident and emergency use in our analysis,
and estimates in previous studies such as by Knapp
and Prince (2007).5 Furthermore, as the studies
used to evaluate primary, outpatient and emergency
care usage were based on patients diagnosed with
dementia, in our study we made the assumption that
undiagnosed patients would have similar patterns
of resource usage: this may not be the case in
practice.
Another limitation of our study is that we did not
include all the costs associated with the four
diseases under question. First, the impact of disease
on informal carers was solely evaluated as the
opportunity of unpaid care. We did not account
for any health and social services usage related
to the additional demands of caring for someone.
second, due to the paucity of data and in order to
compare the cost estimates with those due to CHd,
stroke and cancer, some social care costs, such as
home and day care and meals on wheels, were not
included in the analysis. nevertheless, the main cost
drivers of health and social care in dementia patients
were included in the analysis, with the omitted costs
being a relatively small proportion of total costs.28;30
The limitations of our review on the levels of research
funding allocated by charities and governmental
organisations to cancer, stroke, CHd and dementia
should also be acknowledged. As with other studies
evaluating levels of research funding for different
diseases,76-79 our study should be viewed as giving
an estimate of the proportion of research funding
allocated to each disease, but not necessarily
reflecting the total amount of funding.
First, we did not include funding from all the
charities registered in the UK, with our analysis
being restricted to charities in the Association for
medical Research Charities (AmRC), and to the top
200 health-related charities, in terms of income,
registered with the England and Wales Charity
Commission.
second, charities registered solely in scotland or
northern ireland were identified only through the
AmRC, as the charity registers for scotland and
northern ireland did not contain sufficient detail to
identify relevant charities. However, out of the 116
charities in the AmRC, only 4 (3%) and 2 (2%) were
registered solely in scotland or northern ireland,
respectively, reflecting the fact that most of the
charities funding medical research are registered in
England and Wales.
Third, although we did our upmost to avoid double-
counting research funding, charities included in the
study could potentially make grants to each other
and this could not always be identified in annual
reports and accounts.
DEMENTIA 2010 full rEporT dementia2010.org
29
Fourthly, some relevant research funding bodies
were not included in the analysis. We were unable
to obtain any information on the levels of research
funding allocated by the Wales Office of Research
& development, and five charities either refused to
participate or did not respond to our requests for
information. However, it is unlikely that the inclusion
of the research funds made available by these
organisations would change the relative levels of
research funding across the four diseases.
Finally, as in the study by Pendlebury et al. (2004)78
we did not included basic science research funding,
as much basic science research is potentially
relevant to many disease areas rather than a single
disease. However, these limitations are unlikely
to bias any disease area in particular, and as a
result will not alter the wide disparities of funding
observed.
in conclusion, dementia creates a significant burden
mainly through the costs placed on unpaid carers
and long-term institutionalised care. The costs
associated with dementia are considerably higher
than those of cancer, CHd or stroke. Previous
studies evaluating levels of research funding have
suggested that research into both dementia and
stroke is severely underfunded. This report strongly
confirms that finding using up-to-date data, and
shows that research on dementia and stroke
remains grossly underfunded when compared to
cancer and CHd.
REFERENCES
1. ganguli m, dodge HH, shen C, Pandav Rs, deKosky
sT. Alzheimer disease and mortality: A 15-year
Epidemiological study. Arch neurol 2005;62:779-84.
2. Helzner EP, scarmeas n, Cosentino s, Tang mX,
schupf n, stern y. survival in Alzheimer disease:
A multiethnic, population-based study of incident
cases. neurology 2008;71:1489-95.
3. Larson EB, shadlen mF, Wang L, mcCormick
WC, Bowen Jd, Teri L et al. survival after initial
diagnosis of Alzheimer disease. Ann intern med
2004;140:501-9.
4. Xie J, Brayne C, matthews FE, and the medical
Research Council Cognitive Function and Ageing
study collaborators. survival times in people with
dementia: analysis from population based cohort
study with 14 year follow-up. BmJ 2008;bmj.
5. Knapp, m., Prince, m., Albanese, E., Banerjee, s.,
dhanasiri, s., Fernandez, J. L., Ferri, C., mcCrone,
P., and stewart, R. dementia UK. 2007. London,
Alzheimer’s society.
6. niCE. dementia: A niCE-sCiE guideline on
supporting people with dementia and their carers
in health and social care. national Clinical Practice
guideline number 42. national Collaborating Centre
for mental Health. 2007. The British Psychological
society and gaskell.
7. Alzheimer’s society. Factsheets: Causes of
dementia, progression and drug treatments. http://
www.alzheimers.org.uk/site/scripts/documents.
php?categoryid=200137 . 2009.
8. national Audit Office. improving services and support
for people with dementia. 2007. London, The
stationery Office.
9. schneider J, murray J, Banerjee s, mann A.
EUROCARE: a cross-national study of co-resident
spouse carers for people with Alzheimer’s disease:
i - factors associated with carer burden. int.J.geriat.
Psychiatry 1999;14:651-61.
10. Waldemar g, Phung KTT, Burns A, georges J,
Hansen FR, iliffe s et al. Access to diagnostic
evaluation and treatment for dementia in Europe.
international Journal of geriatric Psychiatry
2007;22:47-54.
11. department of Health. Living well with dementia: a
national dementia strategy. 2009.
12. Akobundu E, Ju J, Blatt L, mullins Cd. Cost-of-
illness studies: a Review of Current methods.
Pharmacoeconomics 2006;24:869-90.
30
13. Leal J, Luengo-Fernandez R, gray A, Petersen
s, Rayner m. Economic burden of cardiovascular
diseases in the enlarged European Union. Eur Heart J
2006;27:1610-9.
14. Luengo-Fernandez R, Leal J, gray A, Petersen s,
Rayner m. Cost of cardiovascular diseases in the
United Kingdom. Heart 2006;92:1384-9.
15. Leal J, Luengo-Fernandez R, gray A. Economic
Costs. in Allender s, scarborough P, Peto V, Rayner
m, eds. European cardiovascular disease statistics
2008, Oxford: European Heart network, 2008.
16. Leal J, Luengo-Fernandez R, gray A. Economic
costs. in scarborough P, Peto V, Bhatnagar P, Kaur
A, eds. stroke statistics 2009, Oxford: British Heart
Foundation and the stroke Association, 2009.
17. Cooksey, d. A review of UK health research funding.
2006. London, HmsO.
18. World Health Organization. international Classification
of diseases (iCd). http://www.who.int/classifications/
icd/en/ . 2007.
19. department of Health. nHs reference costs 2007/08.
http://www.dh.gov.uk/en/Publicationsandstatistics/
Publications/PublicationsPolicyAndguidance/
dH_098945 . 2009.
20. Curtis, L. Unit costs of health and social care 2008.
2008. Canterbury, Kent, Personal social services
Research Unit.
21. Organisation for Economic Co-operation and
development. OECd Health data 2009. 2009.
22. Office for national statistics. Annual survey of Hours
and Earnings. www.statistics.gov.uk/statBase/
product.asp?vlnk=13101 . 2009.
23. Hofman A, Rocca WA, Brayne C, Breteler mmB,
Clarke m, Cooper B et al. The prevalence of
dementia in Europe: a collaborative study of 1980-
1990 findings. int.J.Epidemiol. 1991;20:736-48.
24. Alzheimer Europe. Prevalence of dementia:
United Kingdom. http://www.dementia-in-europe.
eu/?lm2=HdgVOdnRJnWz . 2009.
25. government Actuaries department. Population by
age last birthday in five year age bands. http://www.
gad.gov.uk/demography%20data/Population/index.a
spx?y=2006&v=Principal&dataCountry=uk&chkdataT
able=cc_5y . 2009.
26. European Commission. The social situation in the
European Union 2005-2006. 2006. Luxembourg,
Office for Official Publications of the European
Communities.
27. matthews FE, dening T. Prevalence of dementia in
institutional care. Lancet 2002;360:225-6.
28. Wolstenholme J, Fenn P, gray A, Keene J, Jacoby R,
Hope T. Estimating the relationship between disease
progression and cost of care in dementia. British
Journal of Psychiatry 2002;2002:36-42.
29. Hope T, Keene J, Fairburn C. Behaviour changes
in dementia. 1: Point of entry data of a prospective
study. international Journal of geriatric Psychiatry
1997;12:1074-8.
30. schneider J, Hallam A, murray J, Foley B, Atkin L,
Banerjee s et al. Formal and informal care for people
with dementia: factors associated with service
receipt. Aging & mental Health 2002;6:255-65.
31. department of Health, social services and Public
safety. Hospital activity statistics for dementia and
Alzheimer’s disease 2007-08. 2009.
32. Health solutions Wales. PEdW statistics 2007-08.
www.wales.nhs.uk . 2009.
33. information services division scotland. Hospital
Episode statistics. 2009.
34. Health and social Care in northern ireland.
Prescription Cost Analysis 2008. http://www.
centralservicesagency.com/display/statistics . 2009.
35. information services division scotland. Prescription
Cost Analysis for scotland. http://www.isdscotland.
org/isd/information-and-statistics.jsp;jsessionid=CA9
5E7B778CC5C74571BF7C69d433d3E?pContentid
=2241&p_applic=CCC&p_service=Content.show& .
2008.
36. national Health service. Prescription Cost Analysis
2008 for England. http://www.ic.nhs.uk/statistics-
and-data-collections/primary-care/prescriptions/
prescription-cost-analysis-2008 . 2009.
37. Prescribing services. Prescription Cost Analysis
Wales 2008. http://www.wales.nhs.uk/sites3/page.
cfm?orgid=428&pid=13533 . 2009.
38. macdonald AJd, Carpenter i, Box O, Roberts
A, sahu s. dementia and use of psychotropic
medication in non-’Elderly mentally infirm’ nursing
homes in south East England. Age and Ageing
2002;31:58-64.
39. Health and social Care information Centre.
general pharmaceutical services in England and
Wales 1998-99 to 2007-08. http://www.ic.nhs.uk/
webfiles/publications/pharmserv9808/general%20
Pharmaceutical%20services%20England%20
and%20Wales%202007-08.pdf . 2008.
DEMENTIA 2010 full rEporT dementia2010.org
31
40. Hm Revenues and Customs. national minimum
wage. http://www.hmrc.gov.uk/nmw/archived_rates.
htm . 2009.
41. Office for national statistics. Labour Force
survey. www.statistics.gov.uk/statBase/source.
asp?vlnk=358&more=y . 2009.
42. general Register for scotland. deaths. www.gro-
scotland.gov.uk/statistics/deaths/index.html . 2009.
43. northern ireland statistics Research Agency. deaths
by cause. www.nisra.gov.uk/demography/default.
asp14.htm . 2009.
44. Office for national statistics. deaths registered in
England and Wales. http://www.statistics.gov.uk/
statbase/Product.asp?vlnk=15096 . 2009.
45. Hm Treasury. green book, appraisal and evaluation in
central government. 2008.
46. department for Works and Pensions. days of certified
incapacity in the period 01.04.01 to 31.03.02,
analysed by sex and diagnosis. 2006.
47. Chartered institute of Personnel and
development. Absence management.
Annual survey report 2008. 2008. http://
www.cipd.co.uk/nR/rdonlyres/6d0CC654-
1622-4445-8178-4A5E071B63EF/0/
absencemanagementsurveyreport2008.pdf.
48. national Audit Office. End of Life Care. 2008.
London, The stationery Office.
49. Royal College of Practitioners. morbidity statistics
from general practice: fourth national study 1991-92.
mcCorkmick, A., Fleming, d., and Charlton, J. 1995.
London, HmsO.
50. national Health service. Trends in consultation rates
in general Practices 1995-2008. http://www.ic.nhs.
uk/statistics-and-data-collections/primary-care/
general-practice/qresearch-report-on-trends-in-
consultation-rates-in-general-practices-1995-2008 .
2008.
51. Welsh Assembly government. Health service Use.
http://wales.gov.uk/topics/statistics/publications/
healthsurvey2007/?lang=en . 2008.
52. northern ireland statistics Research Agency.
Consultations with an nHs gP in the previous 14
days by sex and age, 1983 to 2008-09. http://www.
csu.nisra.gov.uk/Consultations_with_a_nHs_gP_
in_the_14_days_before_interveiw_by_sex_and_age_
Trend.htm . 2009.
53. information services division scotland. general
Practice - Practice Team information. http://www.
isdscotland.org/isd/1044.html . 2009.
54. graham, B. J. m. The cost of cancer care in scotland
2002. 2003. information services division scotland.
55. Health and social Care information Centre. Hospital
Episode statistics. http://www.hesonline.nhs.uk/ .
2009.
56. information services division scotland. specialty
costs and activity - consultant clinics, by specialty,
by hospital. http://www.isdscotland.org/isd/costs-
book-detailed-tables.jsp?pContentid=3606&p_
applic=CCC&p_service=Content.show& . 2008.
57. department of Health, social services and Public
safety. Outpatient speciality Tables. http://www.
dhsspsni.gov.uk/volume_2b_outpatient_activity.pdf .
2009.
58. Welsh Assembly government. Consultant lead out-
patient clinics: summary data, all specialties. http://
statswales.wales.gov.uk/index.htm . 2009.
59. department of Health, social services and Public
safety. Hospital activity statistics for cancer 2007-08.
2009.
60. information services division scotland. Cancer
incidence 2005. http://www.isdscotland.org/
isd/5670.html . 2008.
61. Office for national statistics. Cancer registration
statistics 2006. http://www.statistics.gov.uk/
statbase/Product.asp?vlnk=8843 . 2008.
62. Queen’s University Belfast. northern ireland Cancer
2005 Registry. http://www.qub.ac.uk/research-
centres/nicr/data/Onlinestatistics/AllCancers/ . 2009.
63. Welsh Cancer intelligence and service Unit. Cancer
incidence in Wales 2003-07. http://www.wales.nhs.
uk/sites3/documents/242/Cancer%20incidence%20
in%20Wales%202003-2007.pdf . 2009.
64. Cancer Research UK. Cancer survival statistics by
age. http://info.cancerresearchuk.org/cancerstats/
survival/age/ . 2006.
65. Balak F, Roelen CAm, Koopmans PC, ten Berge EE,
groothoff JW. Return to work after early-stage breast
cancer: A cohort study into the effects of treatment
and cancer-related symptoms. J Occup Rehabil
2008;18:267-72.
66. Roelen CAm, Koopmans PC, de graaf JH, Balak F,
groothoff JW. sickness absence and return to work
rates in women with breast cancer. int Arch Occup
Environ Health 2009;82:543-6.
67. Amir z, moran T, Walsh L, iddenden R, Luker
K. Return to paid work after cancer: A British
experience. J Cancer surviv 2007;1:129-36.
68. Kennedy F, Haslam C, munir F, Pryce J. Returning
to work following cancer: A qualitative exploratory
study into the experience of returning to work
following cancer. European Journal of Cancer Care
2009;16:17-25.
32
69. main ds, nowels CT, Cavender TA, Etschmaier
m, steiner JF. A qualitative study of work and
work return in cancer survivors. Psycho-Oncology
2005;14:992-1004.
70. spelten ER, Verbeek JHAm, Uitterhoeve ALJ,
Ansink AC, van der Lelie J, de Reijke Tm et al.
Cancer, fatigue and the return of patients to work
- a prospective cohort study. European Journal of
Cancer 2003;39:1562-7.
71. drolet m, maunsell E, mondor m, Brisson C,
Brisson J, masse B et al. Work absence after breast
cancer diagnosis: A population-based study. CmAJ
2005;173:dOi:10.1503/cmaj.050178.
72. Thomas C, morris sm, Harman JC. Companions
through cancer: the care given by informal carers
in cancer contexts. social science & medicine
2002;54:529-44.
73. general Register for scotland. 2001 Census. http://
www.gro-scotland.gov.uk/census/censushm/index.
html . 2009.
74. northern ireland statistics Research Agency.
northern ireland Census of Population. http://www.
nisranew.nisra.gov.uk/census/start.html . 2009.
75. Office for national statistics. Census 2001. http://
www.statistics.gov.uk/census2001/access_results.
asp . 2008.
76. UK Clinical Research Collaboration. UK health
research analysis. 2006. London, UK Clinical
Research Collaboration.
77. Rothwell Pm. The high cost of not funding stroke
research: a comparison with heart disease and
cancer. Lancet 2001;357:1612-6.
78. Pendlebury sT, Rothwell Pm, Algra A, Ariesen m-J,
Bakac g, Czlonkowska A et al. Underfunding of
stroke research: a Europe-wide problem. stroke
2004;35:2368-71.
79. national Cancer Research institute. strategic analysis
2002: An overview of cancer research in the UK
directly funded by the nCRi partner organisations.
2002. London, national Cancer Research institute.
80. Charity Commission. About the Charity Commission.
http://www.charitycommission.gov.uk . 2009.
81. Association of medical Research Charities. About the
Association for medical Research Charities. www.
amrc.org.uk/ . 2009.
82. Lowin A, Knapp m, mcCrone P. Alzheimer’s disease
in the UK: comparative evidence on cost of illness
and volume of health services research funding. int J
geriatrPsychiatry 2001;16:1143-8.
83. saunders P, Copeland J, dewey m, gilmore C, Larkin
B, Phaterpekar H et al. The Prevalence of dementia,
depression and neurosis in Later Life: The Liverpool
mRC-ALPHA study. int.J.Epidemiol. 1993;22:838-
47.
84. The medical Research Council Cognitive Function
and Ageing study (mRC CFAs). Cognitive function
and dementia in six areas of England and Wales:
the distribution of mmsE and prevalence of gms
organicity level in the mRC CFA study. Psychological
medicine 1998;28:319-35.
85. Cancer Research UK. UK estimates of total cancer
prevalence. http://info.cancerresearchuk.org/
cancerstats/incidence/prevalence/ . 2009
86. Health and social Care information Centre. Quality
and Outcomes Framework 2007/08. http://www.qof.
ic.nhs.uk/index.asp . 2009
DEMENTIA 2010 full rEporT dementia2010.org
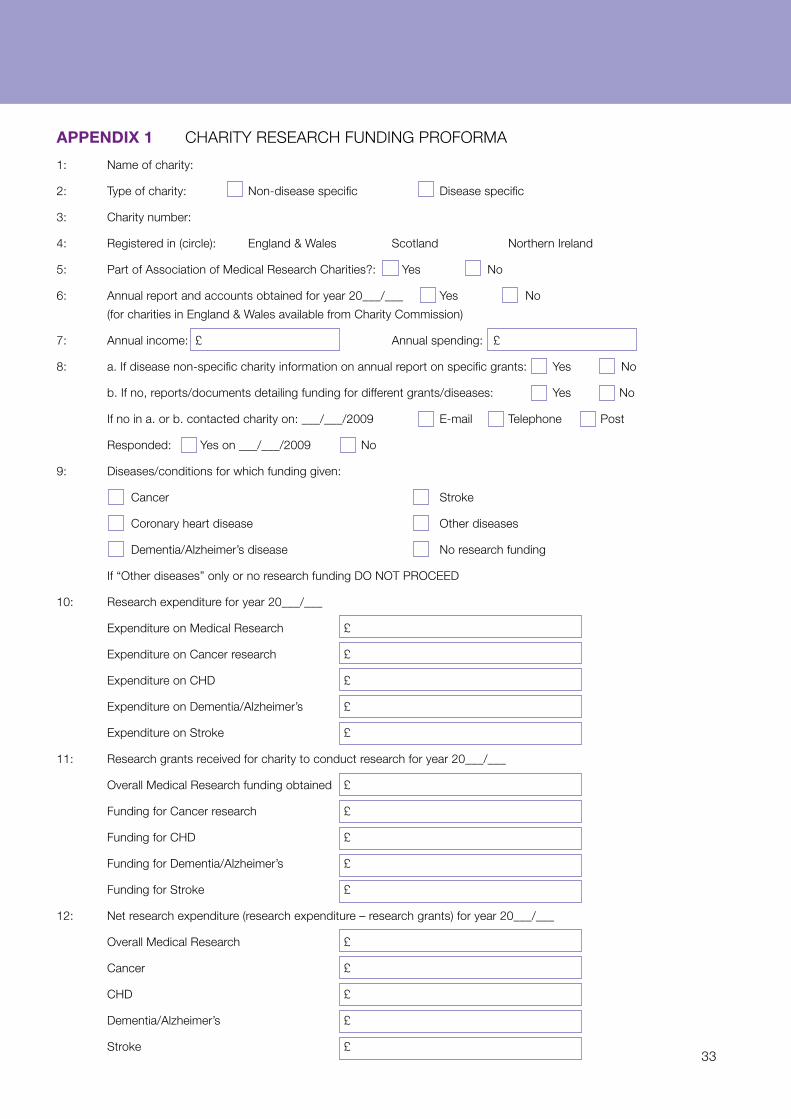
33
APPENDIX 1 CHARiTy REsEARCH FUnding PROFORmA
1: name of charity:
2: Type of charity: non-disease specific disease specific
3: Charity number:
4: Registered in (circle): England & Wales scotland northern ireland
5: Part of Association of medical Research Charities?: yes no
6: Annual report and accounts obtained for year 20___/___ yes no
(for charities in England & Wales available from Charity Commission)
7: Annual income: £ Annual spending: £
8: a. if disease non-specific charity information on annual report on specific grants: yes no
b. if no, reports/documents detailing funding for different grants/diseases: yes no
if no in a. or b. contacted charity on: ___/___/2009 E-mail Telephone Post
Responded: yes on ___/___/2009 no
9: diseases/conditions for which funding given:
Cancer stroke
Coronary heart disease Other diseases
dementia/Alzheimer’s disease no research funding
if “Other diseases” only or no research funding dO nOT PROCEEd
10: Research expenditure for year 20___/___
Expenditure on medical Research £
Expenditure on Cancer research £
Expenditure on CHd £
Expenditure on dementia/Alzheimer’s £
Expenditure on stroke £
11: Research grants received for charity to conduct research for year 20___/___
Overall medical Research funding obtained £
Funding for Cancer research £
Funding for CHd £
Funding for dementia/Alzheimer’s £
Funding for stroke £
12: net research expenditure (research expenditure – research grants) for year 20___/___
Overall medical Research £
Cancer £
CHd £
dementia/Alzheimer’s £
stroke £
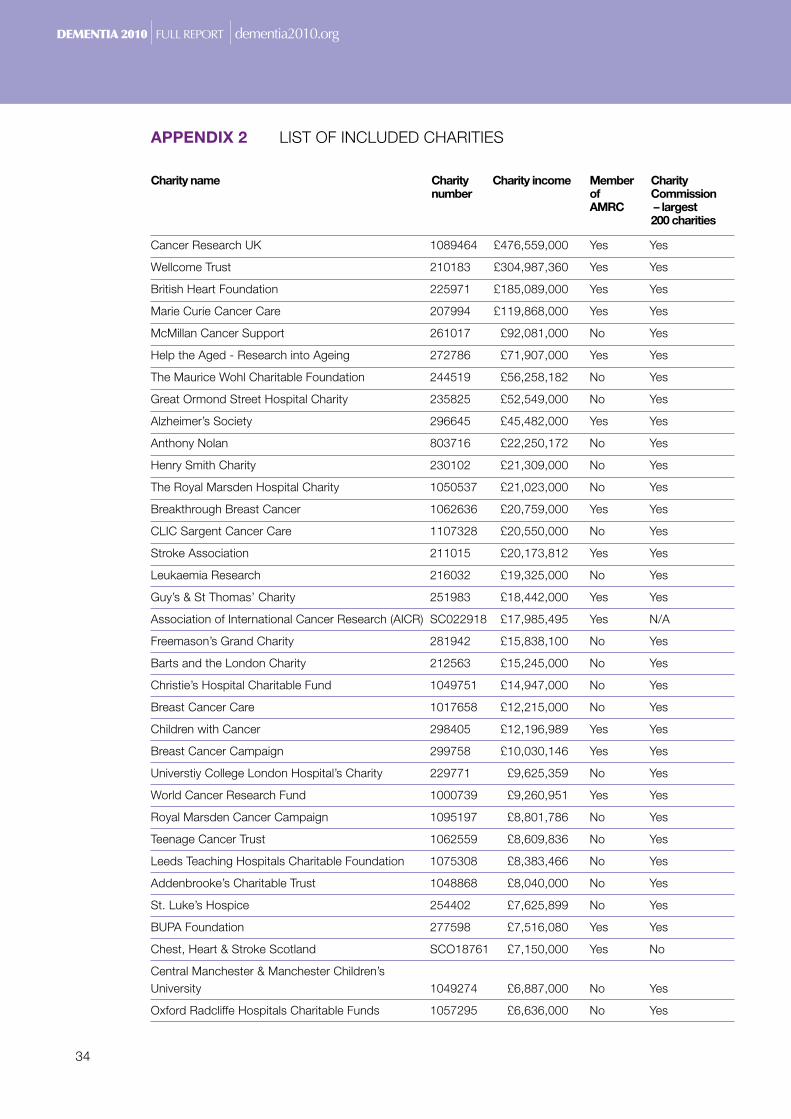
34
APPENDIX 2 LisT OF inCLUdEd CHARiTiEs
Charity name Charity Charity income Member Charity number of Commission AMRC – largest 200 charities
Cancer Research UK 1089464 £476,559,000 yes yes
Wellcome Trust 210183 £304,987,360 yes yes
British Heart Foundation 225971 £185,089,000 yes yes
marie Curie Cancer Care 207994 £119,868,000 yes yes
mcmillan Cancer support 261017 £92,081,000 no yes
Help the Aged - Research into Ageing 272786 £71,907,000 yes yes
The maurice Wohl Charitable Foundation 244519 £56,258,182 no yes
great Ormond street Hospital Charity 235825 £52,549,000 no yes
Alzheimer’s society 296645 £45,482,000 yes yes
Anthony nolan 803716 £22,250,172 no yes
Henry smith Charity 230102 £21,309,000 no yes
The Royal marsden Hospital Charity 1050537 £21,023,000 no yes
Breakthrough Breast Cancer 1062636 £20,759,000 yes yes
CLiC sargent Cancer Care 1107328 £20,550,000 no yes
stroke Association 211015 £20,173,812 yes yes
Leukaemia Research 216032 £19,325,000 no yes
guy’s & st Thomas’ Charity 251983 £18,442,000 yes yes
Association of international Cancer Research (AiCR) sC022918 £17,985,495 yes n/A
Freemason’s grand Charity 281942 £15,838,100 no yes
Barts and the London Charity 212563 £15,245,000 no yes
Christie’s Hospital Charitable Fund 1049751 £14,947,000 no yes
Breast Cancer Care 1017658 £12,215,000 no yes
Children with Cancer 298405 £12,196,989 yes yes
Breast Cancer Campaign 299758 £10,030,146 yes yes
Universtiy College London Hospital’s Charity 229771 £9,625,359 no yes
World Cancer Research Fund 1000739 £9,260,951 yes yes
Royal marsden Cancer Campaign 1095197 £8,801,786 no yes
Teenage Cancer Trust 1062559 £8,609,836 no yes
Leeds Teaching Hospitals Charitable Foundation 1075308 £8,383,466 no yes
Addenbrooke’s Charitable Trust 1048868 £8,040,000 no yes
st. Luke’s Hospice 254402 £7,625,899 no yes
BUPA Foundation 277598 £7,516,080 yes yes
Chest, Heart & stroke scotland sCO18761 £7,150,000 yes no
Central manchester & manchester Children’s University 1049274 £6,887,000 no yes
Oxford Radcliffe Hospitals Charitable Funds 1057295 £6,636,000 no yes
DEMENTIA 2010 full rEporT dementia2010.org
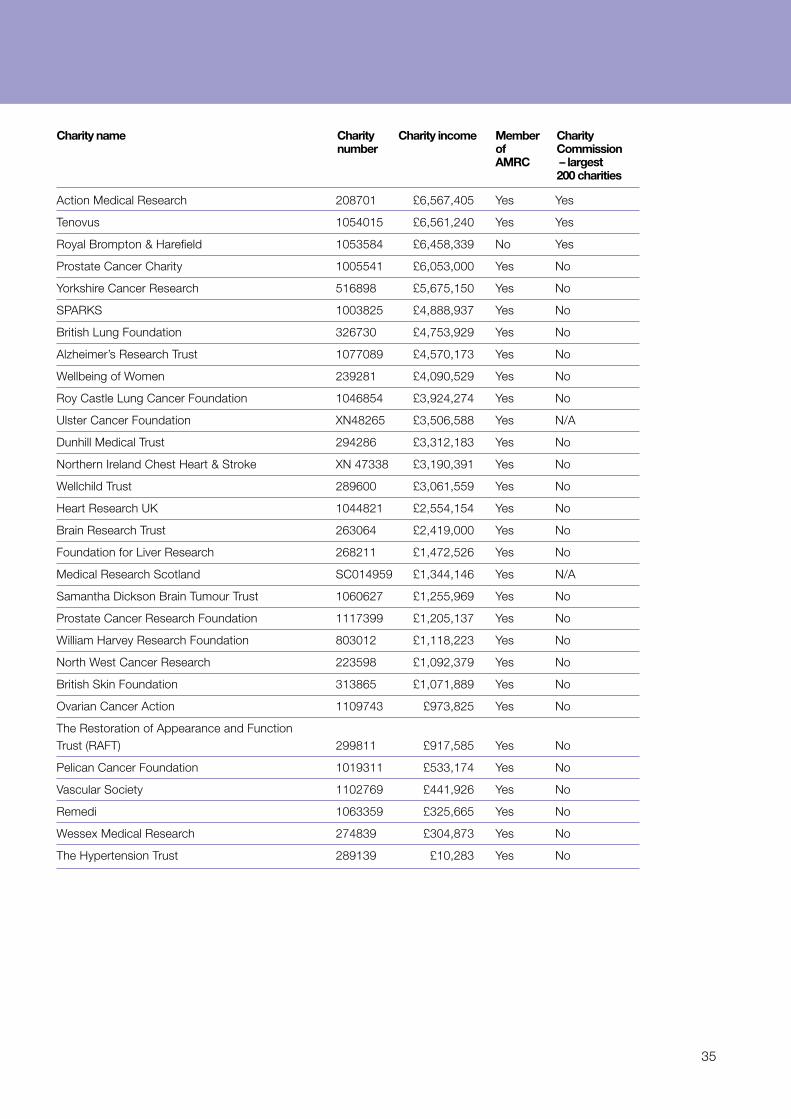
35
Charity name Charity Charity income Member Charity number of Commission AMRC – largest 200 charities
Action medical Research 208701 £6,567,405 yes yes
Tenovus 1054015 £6,561,240 yes yes
Royal Brompton & Harefield 1053584 £6,458,339 no yes
Prostate Cancer Charity 1005541 £6,053,000 yes no
yorkshire Cancer Research 516898 £5,675,150 yes no
sPARKs 1003825 £4,888,937 yes no
British Lung Foundation 326730 £4,753,929 yes no
Alzheimer’s Research Trust 1077089 £4,570,173 yes no
Wellbeing of Women 239281 £4,090,529 yes no
Roy Castle Lung Cancer Foundation 1046854 £3,924,274 yes no
Ulster Cancer Foundation Xn48265 £3,506,588 yes n/A
dunhill medical Trust 294286 £3,312,183 yes no
northern ireland Chest Heart & stroke Xn 47338 £3,190,391 yes no
Wellchild Trust 289600 £3,061,559 yes no
Heart Research UK 1044821 £2,554,154 yes no
Brain Research Trust 263064 £2,419,000 yes no
Foundation for Liver Research 268211 £1,472,526 yes no
medical Research scotland sC014959 £1,344,146 yes n/A
samantha dickson Brain Tumour Trust 1060627 £1,255,969 yes no
Prostate Cancer Research Foundation 1117399 £1,205,137 yes no
William Harvey Research Foundation 803012 £1,118,223 yes no
north West Cancer Research 223598 £1,092,379 yes no
British skin Foundation 313865 £1,071,889 yes no
Ovarian Cancer Action 1109743 £973,825 yes no
The Restoration of Appearance and Function Trust (RAFT) 299811 £917,585 yes no
Pelican Cancer Foundation 1019311 £533,174 yes no
Vascular society 1102769 £441,926 yes no
Remedi 1063359 £325,665 yes no
Wessex medical Research 274839 £304,873 yes no
The Hypertension Trust 289139 £10,283 yes no
The Stables, Station Road, Great Shelford, Cambridge CB22 5LR
Tel: 01223 843899
www.alzheimers-research.org.uk
Our registered charity number is 1077089
Copyright 2010 Alzheimer’s Research Trust - First published by the Alzheimer’s Research Trust