Embed Size (px)
Citation preview

Demandware Shopping Index | © 2015 Demandware, Inc. The shopping index is not indicative of Demand-ware’s operational performance or its reported financial metrics including GMV growth and comparable GMV growth. This document contains archival information which should not be considered current and may no longer be accurate. Approved for unlimited distribution.
DemandwareShopping Index2015 Q2
Analyzing the activity of over 200 million shoppers, this report
measures Digital Commerce growth, and the trends and sources
that are driving that growth.
As shoppers evolve their shopping patterns, it is critical for retailers
to change their approach to servicing shoppers and guiding their
experience. More than ever before, that experience must be
seamless across channels and devices.
Demandware Shopping Index
The Demandware Shopping Index measures digital commerce growth and is based
on an analysis of the shopping activity of over 200 million shoppers worldwide. This
index considers shopper frequency, conversion, average order values and net change
in shoppers.
Shopper Spend: 16%
The product of shopper frequency, conversion and average order value, contributes
16% of the growth in digital commerce.
Shopping Attraction: 84%
The change in number of shoppers visiting a site contributes 84% of the growth in
digital commerce.
The shopping index is not indicative of Demandware’s operational performance or its reported financial metrics including GMV growth and comparable GMV growth. The analysis reflects a comparison of digital commerce sites transacting in Q2 2015 and Q2 2014 and activity of registered users.
16%
84%
The product of shopper frequency, conversion and average order value contributes 16% of the growth in digital commerce.
The change in number of shoppers visiting a site contributes 84% of the
growth in digital commerce.
31%

Phones Prosper
The analysis reflects a comparison of digital commerce sites transacting in Q2 2015 and Q2 2014.
Phones are the driving force of digital commerce growth. Shoppers do much more
than browse; they are creating more baskets and ordering more than ever before, right
from the palm of their hand.
In fact, phones accounted for 94% of the year-over-year increase in traffic, 74% of the
increase in basket creation and 47% of the order growth.
What Really Matters
Clearly, the time to employ a mobile-first strategy is here. Retailers that force shoppers
to pinch and zoom through their shopping journey are not only deteriorating their
brand, they are missing a revenue opportunity.
Device Contribution on Digital Commerce Growth Metrics
Phone Tablet and Computer
Visits Baskets Orders

Phones Fuel Growth
Phones are quickly becoming the device of choice for shopping. Here are some of the key metrics on the soon-to-be most popular
shopping device.
The analysis reflects a comparison of digital commerce sites transacting in Q2 2015 and Q2 2014.
THE BATTLE BETWEEN OPERATING SYSTEMS LEVELS OFF
Device Trends
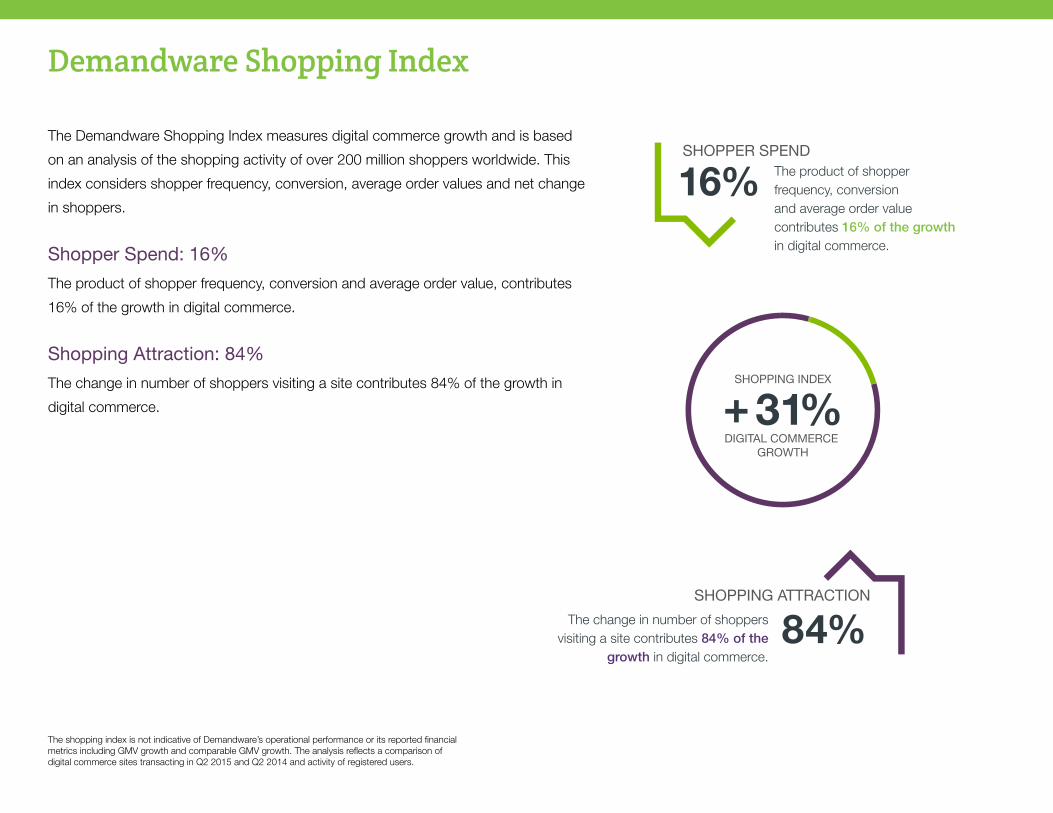
The rapid migration of traffic from computers to phones continues, with
the share on phones up 44% and order share growing even faster at
54%. Phones remain on track to becoming the most popular device for
driving digital commerce traffic by the end of 2015. Interestingly, tablet
shopping has cooled and shows signs of maturation, as order share
dipped slightly on a worldwide basis. Phones are not simply taking share
from computers, but tablets, too.
What Really Matters
Retailers have effectively used phones to alleviate friction in the shopping
process by distributing product information to shoppers anywhere,
anytime. To best position for growth, retailers should identify and
eliminate additional points of friction, such as payment, in the shopping
journey. Also, phones unlock omni-channel shopping via the simplest of
digital commerce utilities - the shopping basket. The basket is the on-
demand wish list from home to store and in between.
The analysis reflects a comparison of digital commerce sites transacting in Q2 2015 and Q2 2014. Percentages are rounded and may not always sum to 100%.
Global Traffic and Order Share by DeviceFor country-specific values, see appendix.
49%
65%
39%
19%
13%
15%

Time on Site
What were once idle moments, waiting for a train, sitting at the doctor’s office
or standing in line, are now filled with digital engagement. People spend
these brief, quiet moments with their phone in their hand and, as a result, we
continue to see a decrease in duration of shopping visits.
What Really Matters
As visit duration falls, it is vital that retailers use their time with shoppers
wisely. In particular, each shopper visit should pick up where the previous
visit left off– this means creating a more connected strategy for cross-
device shopping. Marketing can help get a jump on the shopper journey
by effectively personalizing vehicles like email messages, and ensuring
that landing pages accelerate the journey deep into the shopping and site
experience.
The analysis reflects a comparison of digital commerce sites transacting in Q2 2015 and Q2 2014.
AVERAGE TIME PER VISIT, Q2 2015 (GLOBAL)
AVERAGE TIME PER PHONE VISIT, Q2 2015 (GLOBAL)
9.4 mins, down 28%
8.5 mins, down 37%
For country-specific values, see appendix.
9.4
8.5
28%
37%
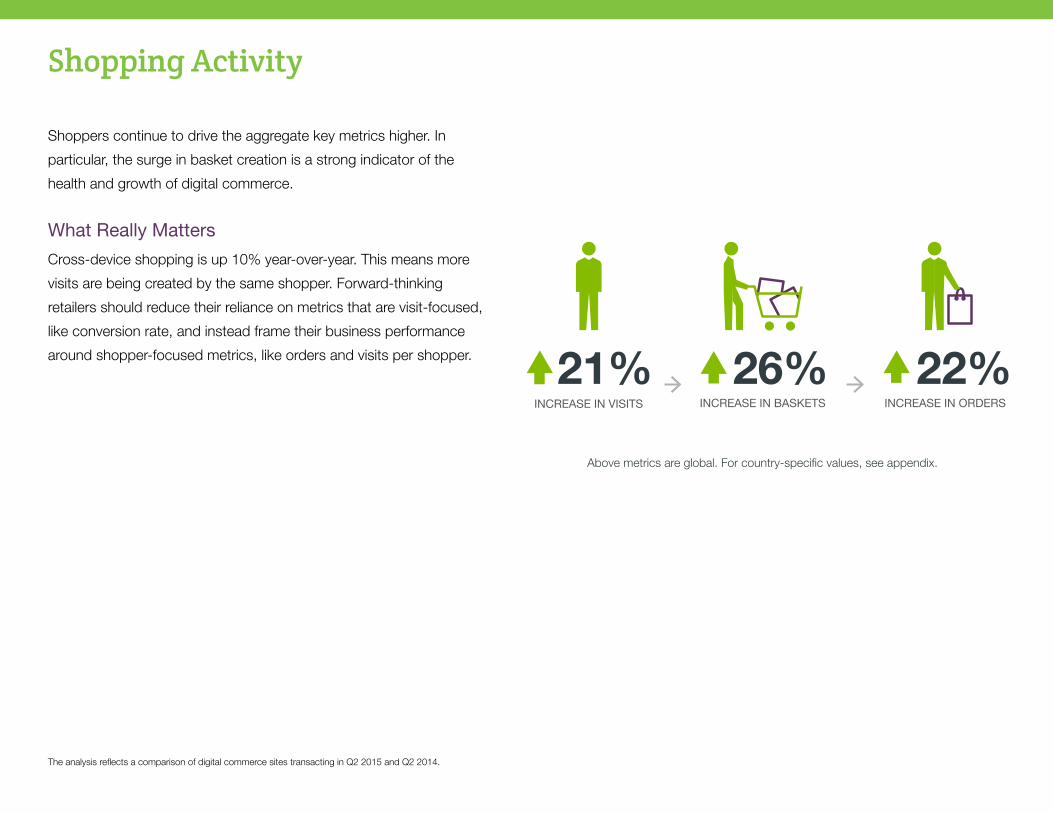
Shopping Activity
Shoppers continue to drive the aggregate key metrics higher. In
particular, the surge in basket creation is a strong indicator of the
health and growth of digital commerce.
What Really Matters
Cross-device shopping is up 10% year-over-year. This means more
visits are being created by the same shopper. Forward-thinking
retailers should reduce their reliance on metrics that are visit-focused,
like conversion rate, and instead frame their business performance
around shopper-focused metrics, like orders and visits per shopper.
The analysis reflects a comparison of digital commerce sites transacting in Q2 2015 and Q2 2014.
Above metrics are global. For country-specific values, see appendix.
21% 26% 22%
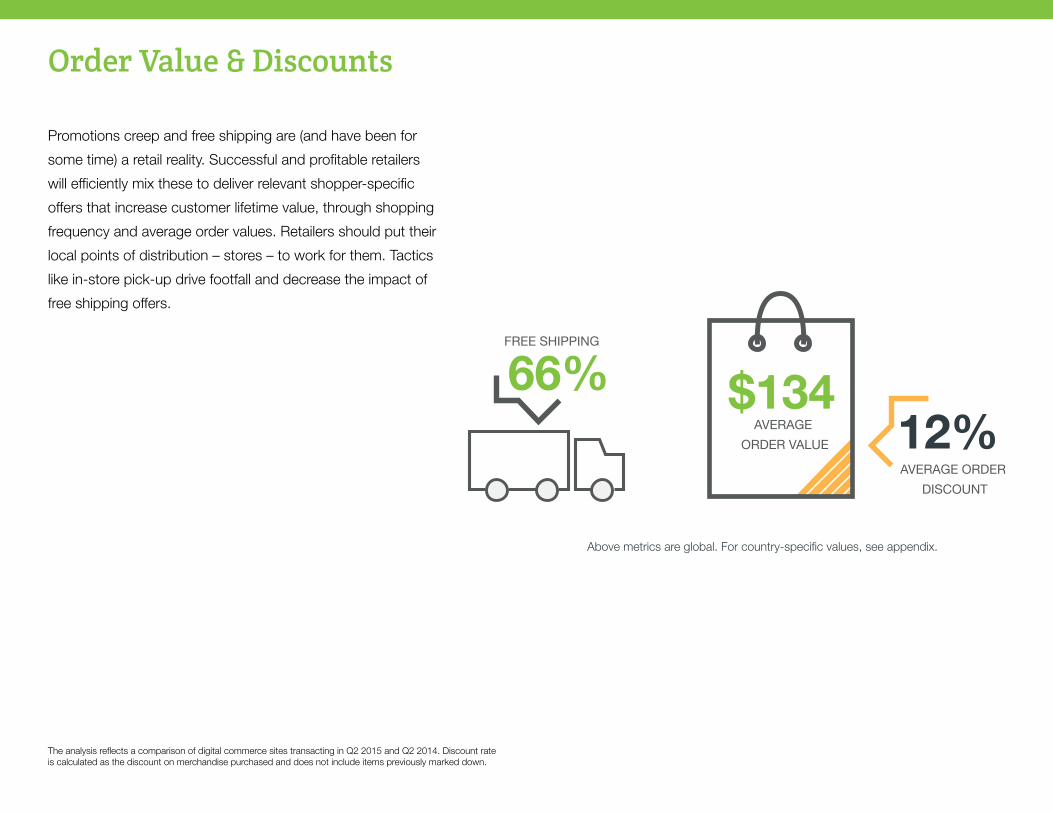
Order Value & Discounts
Promotions creep and free shipping are (and have been for
some time) a retail reality. Successful and profitable retailers
will efficiently mix these to deliver relevant shopper-specific
offers that increase customer lifetime value, through shopping
frequency and average order values. Retailers should put their
local points of distribution – stores – to work for them. Tactics
like in-store pick-up drive footfall and decrease the impact of
free shipping offers.
The analysis reflects a comparison of digital commerce sites transacting in Q2 2015 and Q2 2014. Discount rate is calculated as the discount on merchandise purchased and does not include items previously marked down.
Above metrics are global. For country-specific values, see appendix.
66% $13412%
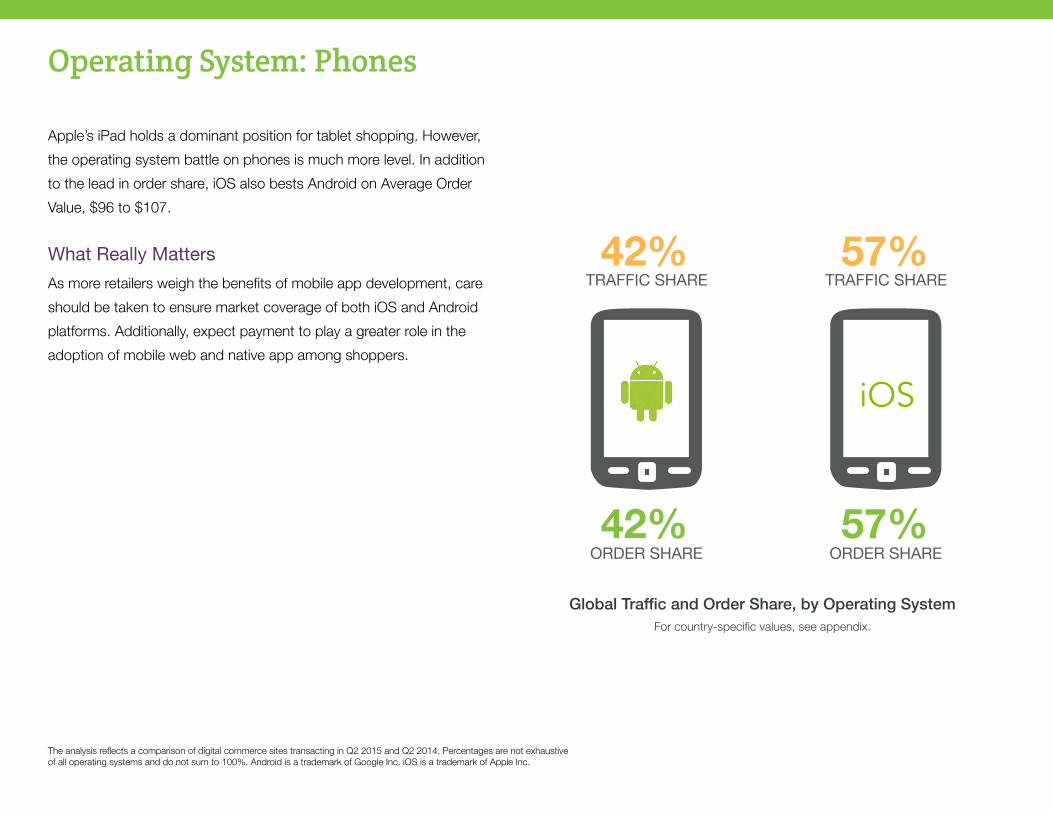
Operating System: Phones
Apple’s iPad holds a dominant position for tablet shopping. However,
the operating system battle on phones is much more level. In addition
to the lead in order share, iOS also bests Android on Average Order
Value, $96 to $107.
What Really Matters
As more retailers weigh the benefits of mobile app development, care
should be taken to ensure market coverage of both iOS and Android
platforms. Additionally, expect payment to play a greater role in the
adoption of mobile web and native app among shoppers.
The analysis reflects a comparison of digital commerce sites transacting in Q2 2015 and Q2 2014. Percentages are not exhaustive of all operating systems and do not sum to 100%. Android is a trademark of Google Inc. iOS is a trademark of Apple Inc.
Global Traffic and Order Share, by Operating SystemFor country-specific values, see appendix.
42%
42%
57%
57%

About the Shopping Index
This comprehensive report analyzes activity of over 200 million
shoppers worldwide to identify trends and opportunities for
retailers to elevate the shopper experience and grow revenue.
The Demandware Shopping Index measures the pace of digital
shopping growth, assigning a numerical value to crucial shopper
metrics.
As a leader in enterprise digital commerce with more than
1,300 global retail sites running on Demandware Commerce
and processing billions of dollars in gross merchandise value,
Demandware is uniquely positioned to offer actionable insights
into shopping behavior.
The Demandware Shopping Index is published quarterly. Data
footnotes are noted inline throughout the report to provide
additional clarity on the analysis.
The Shopping Index is not indicative of Demandware’s
operational performance or its reported financial metrics including
GMV growth and comparable GMV growth.

© 2015 Demandware, Inc. This document contains archival information which should not be considered current and may no longer be accurate. Approved for unlimited distribution.
Appendix
TrafficShare
2015 Q2 2014 Q2 YoY
Country Computer Tablet Phone Computer Tablet PhoneComputer -
YoYTablet -
YoYPhone -
YoY
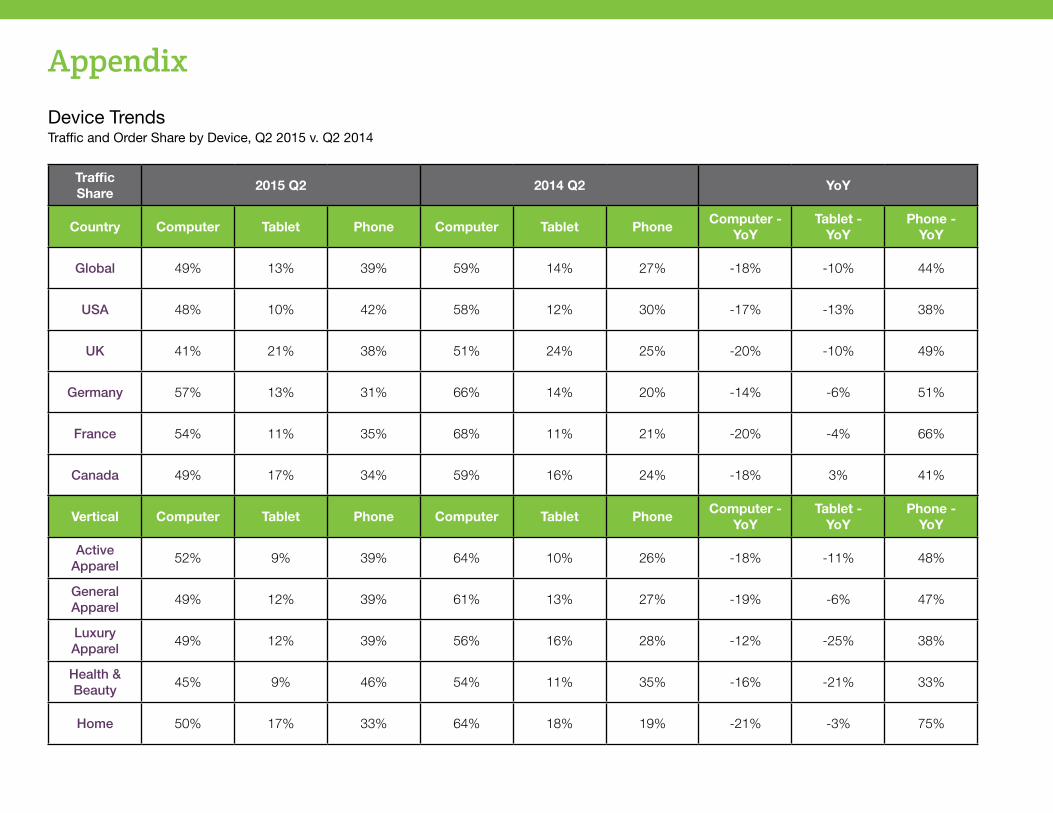
Global 49% 13% 39% 59% 14% 27% -18% -10% 44%
USA 48% 10% 42% 58% 12% 30% -17% -13% 38%
UK 41% 21% 38% 51% 24% 25% -20% -10% 49%
Germany 57% 13% 31% 66% 14% 20% -14% -6% 51%
France 54% 11% 35% 68% 11% 21% -20% -4% 66%
Canada 49% 17% 34% 59% 16% 24% -18% 3% 41%
Vertical Computer Tablet Phone Computer Tablet PhoneComputer -
YoYTablet -
YoYPhone -
YoY
Active Apparel
52% 9% 39% 64% 10% 26% -18% -11% 48%
General Apparel
49% 12% 39% 61% 13% 27% -19% -6% 47%
Luxury Apparel
49% 12% 39% 56% 16% 28% -12% -25% 38%
Health & Beauty
45% 9% 46% 54% 11% 35% -16% -21% 33%
Home 50% 17% 33% 64% 18% 19% -21% -3% 75%
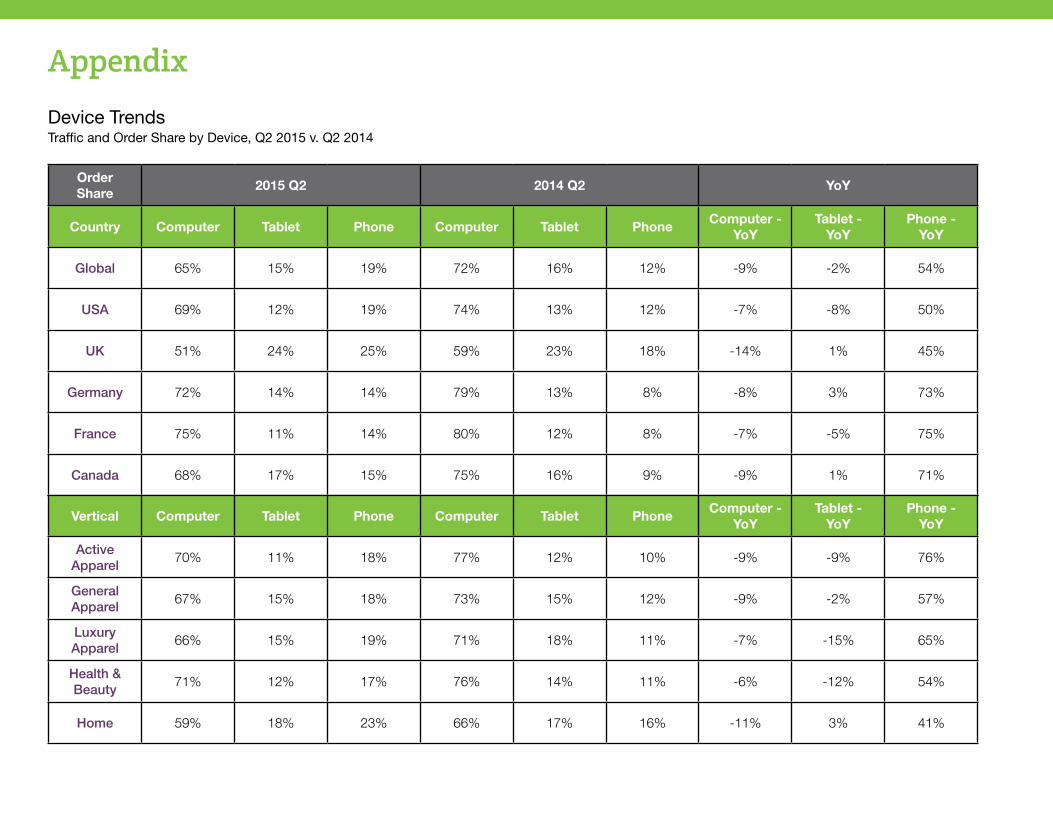
Device TrendsTraffic and Order Share by Device, Q2 2015 v. Q2 2014
Appendix
Order Share
2015 Q2 2014 Q2 YoY
Country Computer Tablet Phone Computer Tablet PhoneComputer -
YoYTablet -
YoYPhone -
YoY
Global 65% 15% 19% 72% 16% 12% -9% -2% 54%
USA 69% 12% 19% 74% 13% 12% -7% -8% 50%
UK 51% 24% 25% 59% 23% 18% -14% 1% 45%
Germany 72% 14% 14% 79% 13% 8% -8% 3% 73%
France 75% 11% 14% 80% 12% 8% -7% -5% 75%
Canada 68% 17% 15% 75% 16% 9% -9% 1% 71%
Vertical Computer Tablet Phone Computer Tablet PhoneComputer -
YoYTablet -
YoYPhone -
YoY
Active Apparel
70% 11% 18% 77% 12% 10% -9% -9% 76%
General Apparel
67% 15% 18% 73% 15% 12% -9% -2% 57%
Luxury Apparel
66% 15% 19% 71% 18% 11% -7% -15% 65%
Health & Beauty
71% 12% 17% 76% 14% 11% -6% -12% 54%
Home 59% 18% 23% 66% 17% 16% -11% 3% 41%
Device TrendsTraffic and Order Share by Device, Q2 2015 v. Q2 2014

Appendix
Time on Site, by deviceVisit Duration in Minutes, Q2 2015 v. Q2 2014
Country 2015 Q2 2014 Q2 YoY 2015 Q2 2014 Q2 YoY 2015 Q2 2014 Q2 YoY
Global 9.8 12.7 -23% 10.3 13.8 -25% 8.5 13.4 -37%
USA 9.3 13.4 -31% 9.9 13.0 -24% 8.5 13.5 -37%
UK 11.3 13.5 -16% 11.7 16.4 -29% 8.4 13.8 -39%
Germany 10.0 10.1 -1% 9.6 11.2 -14% 8.5 11.8 -28%
France 8.5 9.6 -11% 9.0 12.8 -30% 7.4 12.0 -38%
Canada 9.7 10.6 -8% 8.2 11.0 -25% 7.8 11.5 -32%
Vertical 2015 Q2 2014 Q2 YoY 2015 Q2 2014 Q2 YoY 2015 Q2 2014 Q2 YoY
Active Apparel
11.0 12.9 -15% 10.7 14.4 -26% 8.7 13.3 -35%
General Apparel
10.2 13.2 -23% 10.2 13.2 -23% 9.2 13.8 -33%
Luxury Apparel
8.7 12.5 -30% 10.0 14.7 -32% 7.9 13.3 -41%
Health & Beauty
7.6 9.9 -23% 8.3 11.5 -28% 6.7 10.7 -37%
Home 10.2 13.3 -23% 10.0 13.0 -23% 8.7 12.8 -32%
Appendix
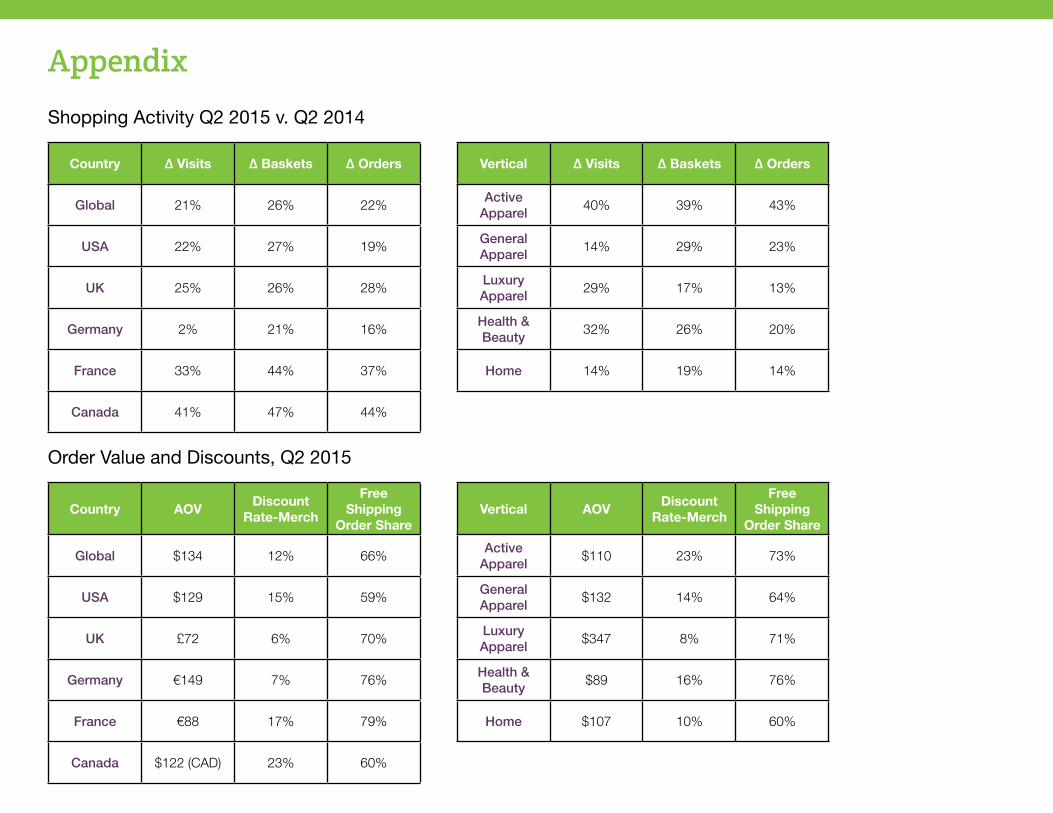
Shopping Activity Q2 2015 v. Q2 2014
Order Value and Discounts, Q2 2015
Country ∆ Visits ∆ Baskets ∆ Orders
Global 21% 26% 22%
USA 22% 27% 19%
UK 25% 26% 28%
Germany 2% 21% 16%
France 33% 44% 37%
Canada 41% 47% 44%
Country AOVDiscount
Rate-Merch
Free Shipping
Order Share
Global $134 12% 66%
USA $129 15% 59%
UK £72 6% 70%
Germany €149 7% 76%
France €88 17% 79%
Canada $122 (CAD) 23% 60%
Vertical ∆ Visits ∆ Baskets ∆ Orders
Active Apparel
40% 39% 43%
General Apparel
14% 29% 23%
Luxury Apparel
29% 17% 13%
Health & Beauty
32% 26% 20%
Home 14% 19% 14%
Vertical AOVDiscount
Rate-Merch
Free Shipping
Order Share
Active Apparel
$110 23% 73%
General Apparel
$132 14% 64%
Luxury Apparel
$347 8% 71%
Health & Beauty
$89 16% 76%
Home $107 10% 60%

Appendix
TrafficShare
2015 Q2 2014 Q2 YoY
Country Android iOS Android iOSAndroid -
YoYiOS - YoY
Global 42% 57% 44% 56% -3% 3%
USA 39% 61% 41% 59% -5% 4%
UK 39% 60% 38% 60% 2% 0%
Germany 58% 42% 60% 40% -3% 5%
France 48% 52% 52% 47% -8% 10%
Canada 36% 64% 33% 66% 9% -3%
Vertical Android iOS Android iOSAndroid -
YoYiOS - YoY
Active Apparel
49% 50% 54% 45% -9% 12%
General Apparel
42% 58% 43% 56% -3% 2%
Luxury Apparel
25% 75% 26% 74% -4% 2%
Health & Beauty
41% 59% 43% 56% -5% 4%
Home 45% 55% 42% 58% 8% -5%
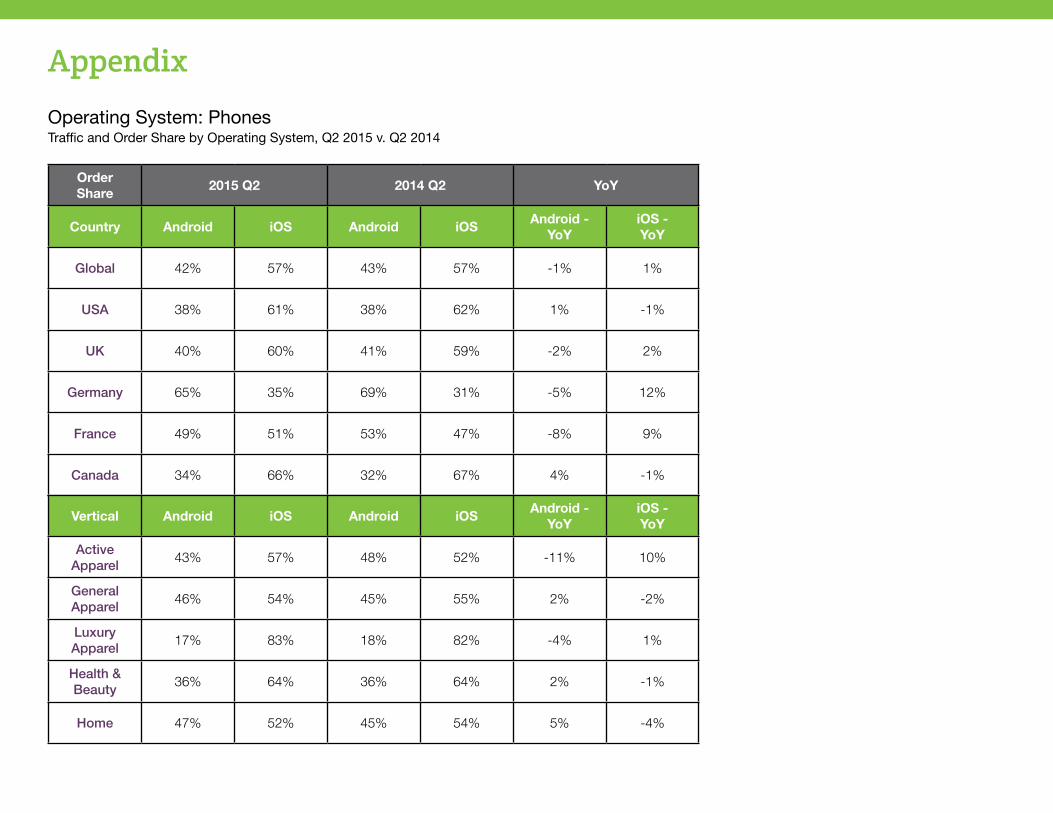
Operating System: PhonesTraffic and Order Share by Operating System, Q2 2015 v. Q2 2014
Appendix
Order Share
2015 Q2 2014 Q2 YoY
Country Android iOS Android iOSAndroid -
YoYiOS - YoY
Global 42% 57% 43% 57% -1% 1%
USA 38% 61% 38% 62% 1% -1%
UK 40% 60% 41% 59% -2% 2%
Germany 65% 35% 69% 31% -5% 12%
France 49% 51% 53% 47% -8% 9%
Canada 34% 66% 32% 67% 4% -1%
Vertical Android iOS Android iOSAndroid -
YoYiOS - YoY
Active Apparel
43% 57% 48% 52% -11% 10%
General Apparel
46% 54% 45% 55% 2% -2%
Luxury Apparel
17% 83% 18% 82% -4% 1%
Health & Beauty
36% 64% 36% 64% 2% -1%
Home 47% 52% 45% 54% 5% -4%
Operating System: PhonesTraffic and Order Share by Operating System, Q2 2015 v. Q2 2014

![INDEX [ptgmedia.pearsoncmg.com] · 2009-06-09 · Index 735 resources for, 714–715 SHOPPING CHART (F3), 369–376 Beliefnet conferences available through, 125 sidebar use on, 525](https://img.pdfslide.us/doc/110x75/5f0c81127e708231d435bbe8/index-2009-06-09-index-735-resources-for-714a715-shopping-chart-f3-369a376.jpg)