Embed Size (px)
Citation preview

Purdue UniversityPurdue e-Pubs
Open Access Dissertations Theses and Dissertations
8-2016
Demand uncertainty and investment in therestaurant industryJayoung SohnPurdue University
Follow this and additional works at: https://docs.lib.purdue.edu/open_access_dissertations
Part of the Finance Commons, and the Management Sciences and Quantitative MethodsCommons
This document has been made available through Purdue e-Pubs, a service of the Purdue University Libraries. Please contact [email protected] foradditional information.
Recommended CitationSohn, Jayoung, "Demand uncertainty and investment in the restaurant industry" (2016). Open Access Dissertations. 849.https://docs.lib.purdue.edu/open_access_dissertations/849

Graduate School Form30 Updated
PURDUE UNIVERSITYGRADUATE SCHOOL
Thesis/Dissertation Acceptance
This is to certify that the thesis/dissertation preparedBy Entitled
For the degree of
Is approved by the final examining committee:
To the best of my knowledge and as understood by the student in the Thesis/Dissertation Agreement, Publication Delay, and Certification Disclaimer (Graduate School Form 32), this thesis/dissertation adheres to the provisions of Purdue University’s “Policy of Integrity in Research” and the use of copyright material.
Approved by Major Professor(s):
Approved by:Head of the Departmental Graduate Program Date


i
DEMAND UNCERTAINTY AND INVESTMENT
IN THE RESTAURANT INDUSTRY
A Dissertation
Submitted to the Faculty
of
Purdue University
by
Jayoung Sohn
In Partial Fulfillment of the
Requirements for the Degree
of
Doctor of Philosophy
August 2016
Purdue University
West Lafayette, Indiana

ii
To my family for their unfailing love, support, and encouragement
변함없이 나를 사랑해주고 지지해주고 웃게 하는, 언제나 돌아갈 안식처가
되어주는 소중한 가족들에게 저의 졸업 논문을 헌정합니다.

iii
ACKNOWLEDGEMENTS
I would like to express my appreciation and respect for my committee members.
Without their help and guidance, the completion of this dissertation would not have been
possible. Particularly, I am deeply indebted to my advisors, Professors Chun-Hung (Hugo)
Tang and SooCheong (Shawn) Jang, for their guidance, support, patience, and
encouragement throughout this journey. They have not only challenged me to dig deeper
and think harder but also inspired me to develop my own research path. Their sincere and
passionate attitude toward research and students that I learned from our countless meetings
and discussions is scored in my mind.
I am also very grateful to the other committee members, Professors Huseyin Gulen
and Carl Behnke. Professor Gulen guided me through investment theories and offered
pointed advice when it was most needed. Professor Behnke helped me view my research
from the practitioner’s perspective, which is very important in our field.
My gratitude extends to Professor Richard Ghiselli, the Department Head, and
Professor Barbara Almanza, the Director of Graduate Program, and the School of
Hospitality and Tourism Management. I feel blessed to meet awesome colleagues, who
added delightful flavors to my life at Purdue. Lastly, I thank God for my husband, Jinhak
Kim, a wonderful father, my best buddy and lifelong discussion partner.

iv
TABLE OF CONTENTS
Page
LIST OF TABLES ............................................................................................................ vii
LIST OF FIGURES ......................................................................................................... viii
ABSTRACT ....................................................................................................................... ix
CHAPTER 1. INTRODUCTION ................................................................................. 1
1.1 Introduction ........................................................................................................... 1
CHAPTER 2. INDUSTRY BACKGROUND AND INVESTMENT THEORIES ..... 5
2.1 U.S. Economy and the Restaurant Industry .......................................................... 5
2.1.1 Economic Cycles of the U.S. Over the Last Two Decade ...........................5
2.1.2 Economic Cycles and the Restaurant Industry ............................................8
Full-Service and Limited-Service Restaurants ............................... 10
Franchising and Nonfranchising Restaurants ................................. 13
2.2 Theory of Investment .......................................................................................... 16
2.2.1 The q Theory ..............................................................................................16
2.2.2 Capital Market Imperfections and Investment...........................................19
CHAPTER 3. DEMAND UNCERTAINTY AND INVESTMENT .......................... 23
3.1 Introduction ......................................................................................................... 23
3.2 Theoretical Background and Hypotheses ............................................................ 24
3.2.1 Uncertainty and Risk .................................................................................24
3.2.2 Demand Uncertainty ..................................................................................24
3.2.3 Uncertainty and Investment .......................................................................26
Theory ............................................................................................. 26
Empirical Evidence ......................................................................... 27
Demand Uncertainty and Capital Investment in the Restaurant
Industry ........................................................................................................ 29
Nonlinear Relationship Between Demand Uncertainty and
Investment ..................................................................................................... 30
3.2.4 Conditional Effects of Firm Characteristics ..............................................33
Franchise ......................................................................................... 34
Segment .......................................................................................... 35
3.3 Methodology ....................................................................................................... 36

v
Page
3.3.1 Data ......................................................................................................36
3.3.2 Models ......................................................................................................37
Estimating Demand Uncertainty in the Restaurant Industry .......... 37
The Effect of Demand Uncertainty on Investment ......................... 41
The Conditional Effect of Franchising and Segment ..................... 43
3.4 Results ................................................................................................................. 44
3.4.1 Descriptive Analysis ..................................................................................44
3.4.2 Main Results ..............................................................................................48
3.5 Conclusion ........................................................................................................... 63
CHAPTER 4. PEER EFFECT ON INVESTMENT ................................................... 67
4.1 Introduction ......................................................................................................... 67
4.2 Theoretical Background and Hypotheses ............................................................ 68
4.2.1 Peer Effect on Investment ..........................................................................68
4.2.2 Identification of Peers ................................................................................74
4.2.3 Motives for Following Peers .....................................................................77
4.2.4 Investment Outcomes of Peer-Sensitive Firms ..........................................79
4.3 Methodology ....................................................................................................... 81
4.3.1 Estimating Peer Effect on Investment .......................................................81
4.3.2 Motives for Following Peers .....................................................................82
4.3.3 Investment Outcomes of Peer-Sensitive Firms ..........................................83
4.4 Results ................................................................................................................. 84
4.4.1 Descriptive Analysis ..................................................................................84
4.4.2 Main Results ..............................................................................................85
4.5 Conclusion ........................................................................................................... 91
CHAPTER 5. FINANCIAL IMPLICATIONS OF INVESTMENT UNDER
DEMAND UNCERTAINTY............................................................................................ 94
5.1 Introduction ......................................................................................................... 94
5.2 Theoretical Background and Hypotheses ............................................................ 95
5.2.1 Financial Implication of Investment Under Uncertainty ...........................95
5.2.2 Moderating Effect of Financial Constraint ................................................98
5.3 Methodology ..................................................................................................... 100
5.3.1 Variables ..................................................................................................100
Investment Outcomes ................................................................... 100
Financial Constraint ...................................................................... 101
5.3.2 Models ....................................................................................................102
5.4 Results ............................................................................................................... 103
5.4.1 Descriptive Analysis ................................................................................103

vi
Page
5.4.2 Main Results ............................................................................................106
5.5 Conclusion ......................................................................................................... 109
CHAPTER 6. CONCLUSION ................................................................................. 112
6.1 Conclusions ....................................................................................................... 112
REFERENCES ............................................................................................................... 119
APPENDIX ..................................................................................................................... 137
VITA ............................................................................................................................... 139
PUBLICATIONS ............................................................................................................ 140

vii
LIST OF TABLES
Table .............................................................................................................................. Page
Table 3.1 Lag length determination .................................................................................. 39
Table 3.2 AR (15) model .................................................................................................. 40
Table 3.3 GARCH (1, 1) results ....................................................................................... 40
Table 3.4 Descriptive statistics (Total) ............................................................................. 45
Table 3.5 Descriptive statistics by franchising ................................................................. 45
Table 3.6 Descriptive statistics by segment ...................................................................... 46
Table 3.7 Correlation matrix ............................................................................................. 47
Table 3.8 Uncertainty effect on investment ...................................................................... 49
Table 3.9 Uncertainty, economy conditions, and investment ........................................... 52
Table 3.10 Two-way descriptive statistics ........................................................................ 55
Table 3.11 Interaction model (Uncertainty and franchising) ............................................ 57
Table 3.12 Two-way descriptive statistics ........................................................................ 60
Table 3.13 Interaction model (Uncertainty and segment) ................................................ 61
Table 4.1 Summary statistics ............................................................................................ 85
Table 4.2 Peer effect on investment .................................................................................. 86
Table 4.3 Descriptive statistics for leaders and followers ................................................ 88
Table 4.4 Who follows whom? ......................................................................................... 89
Table 4.5 Investment effect on market share of peer-sensitive firms ............................... 90
Table 5.1 Summary statistics .......................................................................................... 104
Table 5.2 Correlation matrix ........................................................................................... 105
Table 5.3 Effects of investment, uncertainty and financial constraint on market share . 107
Table 5.4 Effect of investment, uncertainty and financial constraint on profit margin .. 108

viii
LIST OF FIGURES
Figure ............................................................................................................................. Page
Figure 2.1 Historical returns of the market index and restaurant stocks ............................ 9
Figure 2.2 Historical demand uncertainty in the restaurant industry ................................ 10
Figure 2.3 Sales of meals and snacks away from home by type of outlet ........................ 12
Figure 2.4 Percentage of sales of meals and snacks away from home by type of outlet .. 13
Figure 2.5 Yearly average stock returns ........................................................................... 15
Figure 2.6 Yearly standard deviation of stock returns ...................................................... 16
Figure 3.1 Historical demand uncertainty and average investment .................................. 48
Figure 3.2 Demand uncertainty and investment ............................................................... 50
Figure 3.3 Demand uncertainty and GDP growth ............................................................ 53
Figure 3.4 Demand uncertainty, franchising, and investment .......................................... 59
Figure 3.5 Demand uncertainty, segment, and investment ............................................... 63
ix
ABSTRACT
Sohn, Jayoung. Ph.D., Purdue University, August 2016. Demand Uncertainty and
Investment in the Restaurant Industry. Major Professors: Chun-Hung (Hugo) Tang and
SooCheong (Shawn) Jang.
Since the collapse of the housing market, the prolonged economic uncertainty
lingering in the U.S. economy has dampened restaurant performance. Economic
uncertainty affects consumer sentiment and spending, turning into demand uncertainty.
Nevertheless, the highly competitive nature of the restaurant industry does not allow much
room for restaurants to actively control prices, leaving most foodservice firms exposed to
demand uncertainty. To investigate the impact of demand uncertainty in the restaurant
industry, this study focused on the implications of demand uncertainty for investment.
The first essay in chapter 3 examined the impact of demand uncertainty on
investment and how the impact varies with industry-specific features: franchising and
segment. The results showed that the investment rate decreases with the level of uncertainty
and the association is nonlinear. That is, the investment drops more rapidly as the level of
uncertainty increases. This study further revealed that there is no significant moderating
effect of franchising on the uncertainty-investment relationship. When it comes to segment,
full-service restaurants are more adversely affected by demand uncertainty than limited-
service restaurants.

x
The second essay in chapter 4 explored how managers cope with uncertainty when
making investment decisions. In the absence of a clear imperative of what is efficient,
managers are likely to scan other peers in the market and mimic their behavior. Focusing
on this idea, it tested whether the investment is influenced by peers’ investment activities
and whether peer-sensitive firms produce better investment outcomes. Consistent with the
hypotheses, sample restaurant firms appeared to be affected by their peers in making
investments. The results also indicate that uncertainty is a powerful force that leads firms
to follow peers. In addition, it was seen that investment of peer-sensitive firms is not as
effective as that of less-sensitive firms in growing market share.
Lastly, the final piece of dissertation in chapter 5 analyzed the effectiveness of
investment made under uncertainty. The findings indicate that a rise in investment in times
of high uncertainty leads to a larger market share, suggesting that well-targeted investment
can help firms turn crisis into opportunity to pull ahead of competitors who retreat in the
face of uncertainty. However, increased depreciation costs and dwindling sales can hurt
the profit margin in uncertain times.

1
CHAPTER 1. INTRODUCTION
1.1 Introduction
The prolonged economic uncertainty lingering in the U.S. has directly dampened
restaurant performance (Gasparro, 2012a). The recent recession, caused by the collapse of
the housing market, resulted in a chain-reaction that changed the business landscape.
Although the National Bureau of Economic Research reported that the recession ended in
2009, shadows of uncertainty in the housing market and government policy still loom over
the economy, dragging down recovery (Izzo, 2010; McNabb, 2013; Morath & Hudson,
2014; Zuckerman, 2014). When consumers feel insecure about their future income, their
spending mirrors that attitude, translating economic uncertainty into demand uncertainty.
Moreover, the instability and unpredictability inherent in consumer spending and
preferences render demand uncertainty as the most obvious and significant source of
uncertainty that cannot be eliminated (Arda & Hennet, 2006; March, 1978). Nevertheless,
the highly competitive nature of the restaurant industry does not allow much room for
restaurants to actively control price, leaving most foodservice firms acutely exposed to
demand uncertainty (Gasparro, 2012a). Although the industry groans about demand
uncertainty, not much is known about its impact on the restaurant industries unique
business structure (Harrington, 2001).

2
This dissertation focuses on the impact of demand uncertainty on investment as an
attempt to address the need. Particularly, the current thesis investigates investment
behavior and the effectiveness of investment made under uncertainty in the restaurant
industry. As in other industries, investment is indispensable for the existence and growth
of foodservice businesses. In 2012, the number of total restaurants increased by more than
4,000 units in the United States (NPD, 2013). It is important to understand investment
behavior because investment is directly linked to expansion and contraction not only at the
firm level, but also at the industry level.
The first essay investigates how restaurant firms coordinate their capital investment
in the face of demand uncertainty. According to the real option theory, uncertainty restrains
capital investment. Due to asset specificity, firms incur larger costs when they reverse
investments than when they expand. Irreversibility and the resulting asymmetric
adjustment costs of fixed assets increase with uncertainty, and accordingly uncertainty
leads firms to postpone investment. Though demand uncertainty affects the entire
restaurant industry, the degree of impact varies per conditions and resource positions of
individual firms. Once the general impact of demand uncertainty is examined, conditional
effects of restaurant industry-specific factors are tested. Two characteristics are chosen:
franchising and segmentation. The findings will shed some light on how the unique features
of the restaurant industry moderates the relationship of demand uncertainty to investment.
The second essay explores the way restaurants cope with demand uncertainty when
making investment decisions. More specifically, this study probes the effect that peers have
on investment decisions. Traditional investment theories argue that investment decisions

3
should be based on marginal profitability of individual projects. However, limited human
capacity to consider all the complexity and uncertainty in the entire set of alternatives and
environmental constraints makes it difficult for managers to make rationally optimal
decisions. Accordingly, individuals are naturally led to follow cues from successful
competitors and imitate them. This will save time in terms of information search and
computational cost and will provide legitimacy to their decisions (Banerjee, 1992; Conlisk,
1980). Furthermore, a manager’s inclination to prevent the worst scenario of falling behind
the average performance can also drive organizations to behave likewise, creating a
competitive bandwagon pressure. Using this line of reasoning, the second essay examines
the human-side of corporate management and whether a firm’s investment decisions are
affected by those of its peers. If so, who imitates whom? What drives them to mimic others?
What are the performance implications of investment of peer-sensitive firms? These are
additional follow-up question explored in this section.
Lastly, the final topic is geared towards the financial implications of investment
made under demand uncertainty. As previously argued, a common approach taken by firms
facing demand uncertainty is to delay or reduce investments. Whether this practice is a
financially favorable choice is another issue that must be analyzed. Uncertainty can raise
strategic value of an investment because the time when most firms retreat can be a chance
to move forward. In hopes of drawing practical suggestions for managers agonizing over
investment, this study will examine the effectiveness of investment under demand
uncertainty. Fresh renovation of restaurants can give an edge over rivals and the
effectiveness would be more pronounced when the competition clutter is reduced.

4
Nonetheless, if the financial status is fragile, taking more risks from converting liquid
resources into irreversible assets may not be a desirable choice. It suggests that the
effectiveness of investment in times of uncertainty should be carefully examined in
consideration of the firm’s financial position.
The findings will widen our understanding of how industry-based demand
uncertainty shapes investment policies of restaurants and about the resulting performance
implications. Investigating the interplay between demand uncertainty and characteristics
of the foodservice industry infuses unique conditional effects into the general discussion
on uncertainty and investment in corporate finance. In addition, the current thesis is
expected to cast some light on the human factor of investment decisions, which has not
attracted much attention from traditional investment literature. Investigation of the so-
called peer effect would suggest another piece of evidence for managers’ bounded
rationality and thereby contribute to the literature on managerial decision-making. Lastly,
but probably the most meaningful, the purpose of this thesis is to provide an opportunity
for managers to ponder the theoretical implications and the performance consequences of
investments made in times of uncertainty.

5
CHAPTER 2. INDUSTRY BACKGROUND AND INVESTMENT THEORIES
2.1 U.S. Economy and the Restaurant Industry
2.1.1 Economic Cycles of the U.S. Over the Last Two Decade
In 1994, the U.S. economy entered the recovery phase of the recession: GDP
growth surged, new jobs were created every year, investment and consumption regained
lost confidence. The unemployment rate that once was as high as 7.8 percent in 1992 fell
to just over 4 percent for the first time since 1973, and 2.5million jobs were added to the
economy each year since 1991 (Boehne,2000). Despite such dramatic expansion, inflation
was not significant, which was partly due to an interest rate increase (from 3 percent to 6
percent) by the Federal Reserve. It was also due to the production capacity that expanded
rapidly commensurate to increasing demand. The financial crises in Asia lowered prices of
commodities, including oil (Boehne, 2000).
Another virtue of this prosperity was reduction in the budget deficit. The Omnibus
Budget Reconciliation Act of 1990, Omnibus Budget Reconciliation Act of 1993, and
Balanced Budget Act of 1997, were deficit reduction packages that included tax increases
and spending cuts. This legislature allowed the federal government to turn a $290 billion
deficit in 1992 into a $236 billion surplus in 2000 (Konigsberg, 2007; Peach, 2001).

6
According to the NBER, this is the longest economic expansion in the history of the United
States, lasting ten years from 1991 to 2001.
In mid-1990s, the rise of commercial growth of internet bred a number of internet
companies (“dot-coms”). Combined with low interest rates in 1998-1999, substantial
venture capital flowed into internet start-ups. Market confidence and aggressive investment
in internet-based businesses led to the upsurge in equity prices. Between 1990 and mid-
2000, stock prices soared nearly fivefold, and the growth rate of equity prices accelerated
from 10.4 percent per year between 1990 and 1995 to 21.2 percent per year between 1995
and 2000 (Kraay & Ventura, 2007). Most dot-com companies, however, operated on losses
in hopes of recouping their initial investment later. Nevertheless, many investors
overlooked traditional evaluation measures, such as P/E ratio, and speculated on stocks
starting with “e-” prefix. Promising companies made initial public offerings (IPO) and
raised considerable funds even though they had never made any profit. Finally, the
“irrational exuberance” burst in March 2000, which was followed by the early 2000’s
recession.
According to the NBER, the early 2000’s recession continued only for 8 months
from March to November 2001. During this period, the September 11th attacks where
Islamic terrorist attacks against the World Trade Center complexes and Pentagon occurred
to bewilderment of the United States. Though the unheard-of attacks stirred global stock
markets and consumer confidence, the direct aftermath to economy did not last for long.
Timely action by the Federal Reserve, the City and State of New York, and the Federal
7
Emergency Management Agency kept the shock from turning into a financial crisis
(Makinen, 2011).
Low interest rates and an ease in the credit market stimulated investment and
growth, which heated up the housing market in 2000’s. Nontraditional loans with fewer
requirements for application were granted to buyers who would otherwise have not been
qualified for traditional loans. Moreover, these loans required little or no down payment
(Byun, 2010). Lax management of mortgages and speculative investment in residential
structures finally came to an end in 2006 and 2007. Home prices, measured as Case-Shiller
10-City Composite Home Price Index, plummeted from 226.29 in June 2006 to 150.44 in
April 2009, a 33.5 percent decrease (http://us.spindices.com). A sharp decline of housing
prices drove many homeowners into default on their mortgage payments in 2007. The U.S.
mortgage-backed securities (MBS) were marketed in global markets, as they offered higher
returns than U.S. government bonds. Accordingly, the subprime mortgage crisis brought
about disastrous damage to most financial institutions that invested in MBS, including
Lehman Brothers and Bear Sterns, and further threw the global economy into a state of
shock.
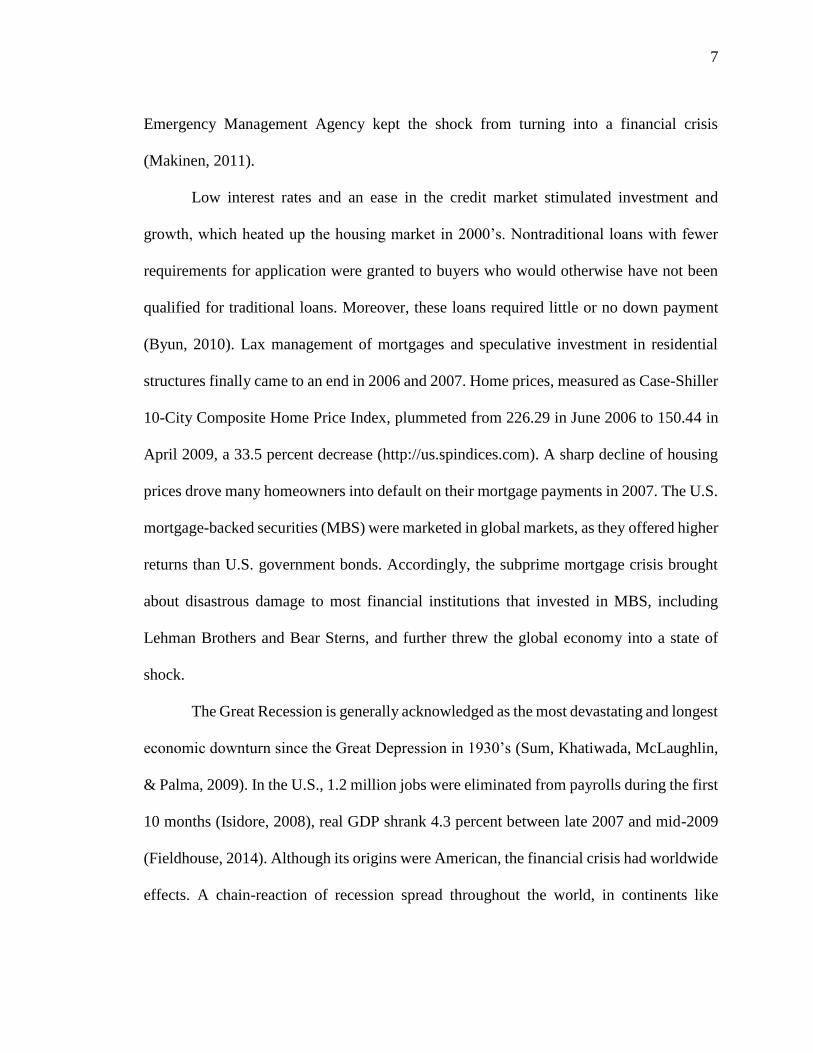
The Great Recession is generally acknowledged as the most devastating and longest
economic downturn since the Great Depression in 1930’s (Sum, Khatiwada, McLaughlin,
& Palma, 2009). In the U.S., 1.2 million jobs were eliminated from payrolls during the first
10 months (Isidore, 2008), real GDP shrank 4.3 percent between late 2007 and mid-2009
(Fieldhouse, 2014). Although its origins were American, the financial crisis had worldwide
effects. A chain-reaction of recession spread throughout the world, in continents like

8
Europe, South America, and Asia. The financial crisis also inflated fears about public debt
levels, leading to the sovereign debt crises in Greece and Ireland in 2010.
The NBER defined the duration as December 2007 through June 2009, but the Wall
Street Journal/NBC News poll showed that 57 percent of Americans still believe the
economy was in depression (O’connor, 2014). Although the economy gradually recovered
from the Great Recession, there are still difficult problems the U.S. economy should tackle.
One of them is the unprecedented federal deficit. During 2000’s, federal spending sharply
increased in areas of medical expenses, income security, and subsidies to individuals and
businesses in need whereas tax revenue decreased (Wall Street Journal, 2010).
2.1.2 Economic Cycles and the Restaurant Industry
Figure 2.1 depicts historical returns of a market index (S&P Composite index) and
sample restaurant stocks. Monthly stock return data were retrieved from the Center for
Research in Security Prices and firms with the Standard Industrial Code of 5812 were used
as sample. Observations with monthly return that exceeds 100 percent were excluded from
the sample. The graph clearly shows cyclicality and larger volatility of restaurant firm
performance in comparison to the market. Average foodservice company stock returns
plunged and soared more dramatically than the market index.

9
Figure 2.1 Historical returns of the market index and restaurant stocks
Figure 2.2 shows demand uncertainty of the U.S. restaurant industry over the last
two decades. The U.S. monthly retail sales of food services and drinking places were
retrieved from the U.S. Census Bureau (http://www.census.gov/retail/), and demand
uncertainty was calculated using GARCH (1, 1), as specified later in Chapter 3. The graph
reveals ups and downs of demand uncertainty in the industry and its negative association
with the business cycle. Consistent with Bloom (2014), the uncertainty tends to rise in
recessionary periods and subside in booming periods. The following subsections will
examine the impact of economic changes upon the
restaurant industry.
-5.00%
-4.00%
-3.00%
-2.00%
-1.00%
0.00%
1.00%
2.00%
3.00%
4.00%
5.00%
19
91
19
92
19
93
19
94
19
95
19
96
19
97
19
98
19
99
20
00
20
01
20
02
2003
20
04
20
05
20
06
20
07
2008
20
09
20
10
20
11
20
12
2013
S&P Composite Index Restaurant industry

10
Source: the U.S. Census Bureau (http://www.census.gov/retail/)
Monthly uncertainty is estimated using GARCH (1, 1)
Figure 2.2 Historical demand uncertainty in the restaurant industry
Full-Service and Limited-Service Restaurants
The performance of a restaurant business largely depends on the business cycle (Gu,
1993). However, the impacts of economic changes on performance may not be the same
between segments due to differing characteristics, in terms of styles of operation, menu
items, target customers, and financial characteristics (Gu, 1996; Zheng, Farrish, & Wang,
2013).
Full-service restaurants target high-income customers. The average check for fine-
dining restaurants was $28.55 in 2013 and $13.75 for casual-dining brands, compared to
$5.32 for quick-service eating places (Brandau, 2014b). Thus, along with quality food,
-0.04
-0.03
-0.02
-0.01
0
0.01
0.02
0.03
0.04
0.05
0.06
0.1
0.15
0.2
0.25
0.3
0.35
0.4
0.45
0.5
0.55
0.6
1992
1993
1994
1995
1996
1997
1998
1999
2000
2001
2002
2003
2004
2005
2006
2007
2008
2009
2010
2011
2012
2013
2014
Demand uncertainty Real GDP growth
(Uncertainty) (GDP growth)

11
sophisticated atmosphere and experienced and committed employees are key factors
driving sales. Due to the high price range, full-service restaurants are the first to feel a
upcoming recession (Youn & Gu, 2009). Fine-dining restaurants especially suffered from
slowing consumer spending and decreasing corporate travel and entertainment expenses
(Liddle, 2009). Morton’s Restaurant Group closed three steakhouses and its revenue fell
18.9 percent while in-store sales dropped 24.9 percent in 2008 and 2009 (Liddle, 2009).
The good news is, however, that the full-service segment is the first to feel any economic
blossoming. Full-service restaurant sales grew faster than limited-service restaurants in
2011 and 2012. During the early years of recovery when the unemployment rate was still
high, upper-income classes increased their economic position faster than middle-income
and low-income classes. Improved corporate spending also fuels quick recovery of the full-
service sector (Thorn, 2014). Patronage to fine-dining restaurants grew 4 percent in both
2012 and 2011, whereas quick-service eateries reported only a 1 percent increase (Brandau,
2014b).

12
Source: Calculated by the Economic Research Service, USDA, from various data sets
from the U.S. Census Bureau and the Bureau of Labor Statistics.
(http://www.ers.usda.gov)
Figure 2.3 Sales of meals and snacks away from home by type of outlet
Compared to the full-service segment, the limited-service segment exhibits lower
elasticity to economic ups and downs. Limited-service restaurants rely on massive sales
volume to make up for low profit margin (Youn & Gu, 2009). The affordable menu prices
appeal to price-sensitive consumers during times of recession. Zheng et al. (2013) observed
that limited-service restaurant stocks are recession-proof and the segment stock index
outperformed that of full-service segment and the S&P 500 index from 2005 to 2010.
However, it also takes longer to enjoy growing demand in post-recession period. Quick
service restaurants fell behind full service establishments in 2011-2012 but outpaced them
in growth of sales and employment in 2013, aided by the declining unemployment rate and
an increase in payroll employment (IHS Economics, 2014).
50,000
100,000
150,000
200,000
250,000
300,000
19
91
19
92
19
93
19
94
19
95
19
96
1997
19
98
19
99
20
00
20
01
20
02
20
03
20
04
20
05
20
06
2007
20
08
20
09
20
10
20
11
20
12
Full-service restaurants Limited-service eating places
($mil)

13
Source: Calculated by the Economic Research Service, USDA, from various data sets
from the U.S. Census Bureau and the Bureau of Labor Statistics.
(http://www.ers.usda.gov)
Figure 2.4 Percentage of sales of meals and snacks away from home by type of outlet
Franchising and Nonfranchising Restaurants
Franchising is a lucrative business model that yields relatively higher return on
invested capital at lower risk (Koh, Lee, & Boo, 2009). In return for using the franchisor’s
brand, operation system, and marketing programs, franchisees pay royalties. Since the
marginal cost of sharing a brand with an additional unit is nearly zero, franchise royalty
delivers enhanced profitability. Moreover, as it is proportional to unit sales as opposed to
profits, franchisors can collect royalties as long as franchisees earn revenue. A franchising
fee, which is relatively less volatile than cash flow streams from company-owned units,
contributes to risk-reduction as well. While the operating loss of company-owned
properties are transferred directly to the nonfranchisors’ bottom line, franchisors can still
realize profit since the ongoing fee is positive as long as franchised restaurants make
30.0
32.0
34.0
36.0
38.0
40.0
42.0
44.0
19
91
19
92
19
93
19
94
19
95
19
96
19
97
19
98
19
99
20
00
20
01
20
02
20
03
20
04
20
05
20
06
20
07
20
08
20
09
20
10
20
11
20
12
Full-service restaurants1 Limited-service eating places1
(%)

14
revenue. A lower volatility of earnings leads to lower financial costs, including financial
distress (Smith & Stulz, 1985), underinvestment (Bessembinder, 1991), and taxes (Graham
& Rogers, 2002).
Low operating leverage also works in favor for franchise firms in downturns. Non-
franchise firms that generate revenue from owned/leased properties should invest a
substantial portion of their resources in fixed assets, which would increase the portion of
fixed costs like depreciation and interest expenses. Since fixed costs do not vary with sales,
even a small variation in sales has a snowball effect on the bottom line in firms with high
operating leverage. Furthermore, Zhang (2005) argues that asymmetric adjustment costs
and irreversibility of investment make assets-in-place riskier than growth options in bad
times. During challenging economic times, firms try to dispose of their idle assets, but the
high cost of disinvestment deprives them of adjustment flexibility, leaving them stuck with
unproductive assets. Accordingly, the firms with larger fixed-asset holdings could be hit
harder by economic meltdowns. On the contrary, franchise firms that hold relatively fewer
corporate units have more buffer to adverse economic shocks, reducing their market risk
exposure (Tuzel, 2010). Moreover, smaller asset size enhances profitability (e.g. ROA and
ROI) and efficiency measures (e.g. sales turnover), which generally is a good sign
according to analysts and investors.
Figure 2.5 presents the average historical stock returns since 1991. As seen in the
graph, the return of non-franchise restaurant equity exhibits greater fluctuation than that of
franchise restaurants. Particularly, nonfranchisors are hit harder by downturns, showing a
steep plunge at the trough of recessions. On the contrary, franchise stocks show a relatively

15
stable movement. They generally have a similar track record with the S&P Composite
Index but sometimes show a bigger spike than the market index. In the 2000’s, franchise
stocks outperformed the S&P most of the time, especially during the Great Recession.
Figure 2.5 Yearly average stock returns
Figure 2.6 presents the annual volatility of stock returns. As suggested by the
trajectory of returns in Figure 2.5, nonfranchising firms have more significant fluctuations
than franchise stocks and the market index. Whether it is a franchisor or not, restaurant
stocks have a higher volatility than the market, and the gap tends to widen during a period
of economic depression.
-8.00%
-6.00%
-4.00%
-2.00%
0.00%
2.00%
4.00%
6.00%
8.00%1991
1992
1993
1994
1995
1996
1997
1998
1999
2000
2001
2002
2003
2004
2005
2006
2007
2008
2009
2010
2011
2012
2013
Non-fran Fran S&P Composite Index

16
Figure 2.6 Yearly standard deviation of stock returns
Aliouche, Kaen, and Schlentrich (2012) observed that franchise firms across all
service industries outperformed the market benchmark on a risk-adjusted basis. Similarly,
Hua and Dalbor (2013) revealed that restaurant franchisors yielded higher returns than
nonfranchisors over the long term.
2.2 Theory of Investment
2.2.1 The q Theory
According to the q theory of investment, suggested by Tobin (1969) and Tobin and
Brainard (1977), the rate of investment is determined by the marginal q ratio, which is the
market value of additional unit of capital stock to its replacement cost. The q investment
function derives the optimal rate of investment from the firm’s profit maximization
0.00%
5.00%
10.00%
15.00%
20.00%
25.00%
30.00%
19
91
19
92
19
93
19
94
19
95
19
96
19
97
19
98
19
99
20
00
20
01
20
02
20
03
20
04
2005
20
06
20
07
20
08
20
09
20
10
20
11
20
12
20
13
Non-fran Fran S&P Composite Index

17
condition. The derivation comes from (Lewellen & Lewellen, 2013). The value of the firm
can be expressed as below.
Vt = Π(𝐾𝑡, 𝑠𝑡) − 𝐼𝑡 − 𝐶(𝐼𝑡, 𝐾𝑡, 𝜆𝑡) + 𝐸𝑡[𝑉𝑡+1] Eq. 2.1
Π(𝐾𝑡, 𝑠𝑡) denotes profit as a function of the capital stock at the beginning of period
(𝐾𝑡) and with a state variable (𝑠𝑡). 𝐼𝑡 is the investment and 𝐶(𝐼𝑡, 𝐾𝑡 , 𝜆𝑡) is the adjustment
cost of investment, where 𝜆𝑡 is an exogenous stochastic parameter, e.g. technology shock.
It is assumed that 𝛽 is constant and the exogenous variables 𝑠𝑡 and 𝜆𝑡 are Markov
processes. Capital depreciates at a rate of δ, such that the capital at time t+1 is Kt+1 =
(1 − δ)Kt + 𝐼𝑡. The firm value can be rewritten as Vt = V(𝐾𝑡, 𝑠𝑡, 𝜆𝑡). Then the first-order
condition for value maximization is
1 + 𝐶𝐼(𝐼𝑡, 𝐾𝑡, 𝜆𝑡) = 𝐸𝑡[VK(𝐾𝑡+1, 𝑠𝑡+1, 𝜆𝑡+1) Eq. 2.2
𝐶𝐼 and 𝑉𝐾 are partial derivatives. The left-hand side is the marginal cost of investment and
the right-hand side is the present value of an additional dollar of capital, which is the
marginal q. The adjustment cost C is further assumed to be quadratic in 𝐼𝑡/𝐾𝑡. For instance,
C = 0.5α(𝐼𝑡 𝐾𝑡⁄ − 𝜆𝑡)2𝐾𝑡. The first-order derivative is CI = α(𝐼𝑡 𝐾𝑡⁄ − 𝜆𝑡). Plugging into
(2) yields the following equation.
𝐼𝑡 𝐾𝑡⁄ = − 1 𝛼⁄ + (1 𝛼⁄ )𝑞 + 𝜆𝑡 Eq. 2.3
Equation 2.3 implies that an individual firm’s value is maximized when investment
is pushed until the marginal cost of investment is equal to the present value of an additional

18
dollar of capital. An individual firm’s stock price incorporates expectations of future
variables that affect investment decisions. Thus, a firm’s share price should signal the
correct level of investment to managers (Schaan, 2007). Simply put, there should be a direct
relationship between the firm’s level of investment and the firm’s market valuation.
Assuming that firms can freely adjust their capital stock, firms would increase or
decrease capital stock until they reach the optimal q ratio of unity. A marginal q ratio
greater than one stimulates investment whereas a ratio less than one deters investment.
However, marginal q is usually not observable. Thus, average q, the ratio of market value
of total existing capital stock to its replacement cost, is widely used in empirical studies as
a proxy for marginal q. Hayashi (1982) derived a relationship between marginal and
average q. If the firm is a price taker with constant returns to scale in both input and output
markets, marginal q can be replaced by average q. However, if the firm is a price maker,
then the average q is larger than the marginal q by the size of the monopoly rent.
Unfortunately, despite its theoretical appeal, the q theory does not successfully
explain corporate investment behavior in reality (Chirinko, 1993; Schaan, 2007). For
example, investigating the response of investment to two stock market crashes in 1929 and
1987, Blanchard, Rhee, and Summers (1993) argue that given fundamentals, market
valuation plays a limited role in the determination of investment decisions. They observed
that before and after the crash in 1929, firms adjusted investment to a greater extent than
the level implied by market valuation, that is, firms increased investments less but
decreased more than what was predicted by the theoretical relation between stock price and
investment. With regard to 1987, firms appeared to ignore market valuation. Chirinko

19
(1993) also notes low statistical significance of q and model fit in most recent empirical
research. Moreover, the presence of significant serial correlation among residuals suggests
a possible misspecification of the q model. He suggests two caveats behind the
disappointing empirical power of q models. First, potential measurement errors
surrounding components of average q. For instance, investment sentiment, such as fads,
speculative bubbles, or excessive volatility, can create problems for q models. In addition,
imperfect competition in the product market may distort the association between the
shadow price of capital and the market value of the firm. In the presence of imperfect
competition, the shadow price of capital is not equal to its market valuation anymore,
leading to a discrepancy between marginal and average q.
2.2.2 Capital Market Imperfections and Investment
The q model previously described rests on the assumption of no financial frictions
(Hubbard, 1998; Lewellen & Lewellen, 2013). However, if the firm faces financing
constraints, cash flow can be important for investment decisions. Firms make investments
through three financing sources: internal funds (cash flows), debt, and equity. According
to Modigliani and Miller’s (1958) irrelevance theory, in a perfect capital market, where
firms can freely get access to external capital at no cost, a firm’s investment is independent
of its capital structure. Alternatively, the pecking order theory argues that internal funds
and external funds are not perfect substitutes. Due to transaction costs associated with
issuance of stock or bond and information asymmetry between insiders and outside
investors, a premium wedge is created between the cost of internal and external capital.

20
Therefore, firms are likely to use the least expensive fund first, which is the internal fund,
then liability and stockholders’ equity as a last resort (Myers, 1984). Moreover, shocks to
current earnings may influence future net worth of the firm and thereby current credit
conditions, which affects investment. Accordingly, if the internal funds run low, more
financially constrained firms would find it more difficult to finance investments than less
constrained firms, and thus should shrink or even forgo investment projects.
Following such argument, Fazzari, Hubbard, and Petersen (1988) reveal that cash
flow and other cash-related measures can explain investment. More specifically, they show
that investment is much more sensitive to fluctuations of cash flow in firms with a high
earnings retention ratio and low dividend payout ratio, which are considered more
financially constrained. The test model of FHP is as follows.
(𝐼 𝐾⁄ )𝑖𝑡 = 𝛼 + 𝛽𝑄𝑖𝑡 + 𝛾(𝐶𝐹 𝐾⁄ )𝑖𝑡 + 휀𝑖𝑡 Eq. 2.4
CF is cash flow, a proxy for changes in net worth of the firm.
But for capital market frictions, 𝛾 would not be significantly different from zero
given that investment opportunities are captured by Q. Subsequent studies have confirmed
a significant role of cash flow in the q model for firms that are likely to resort on external
funds (Bond & Meghir, 1994; Gilchrist & Himmelberg, 1995; Hubbard, Kashyap, &
Whited, 1995; Lewellen & Lewellen, 2013)
Kaplan and Zingales (1997) reexamined the low dividend paying group defined by
FHP and reclassified the firms based on not only quantitative data but also qualitative facts
from 10-K reports. They observe that the sensitivity of investment to cash flow is lowest

21
in the most financially constrained group, contrary to the finding of FHP, and argue that
the investment-cash flow sensitivity is not a valid measure of financing constraints.
However, their argument is limited due to several caveats. First, small sample size (49
firms) and the concomitant insufficient heterogeneity among samples deters detection of
meaningful differences. In addition, according to their sample-splitting criteria, the most
constrained firms were actually financially distressed firms. Since the use of internal funds
are usually restricted by creditors, the investment-cash flow sensitivity can be low in the
most financially constrained firms (Fazzari, Hubbard, & Petersen, 2000; Hubbard, 1998).
The q model, which draws on the assumption of perfect capital market, may not be
suitable in the presence of asymmetric information problems. This problem could be more
serious in younger and low-dividend payout firms. As an attempt to address the problem,
Hubbard et al. (1995) examined manufacturing firms’ investment and internal finance
employing the Euler equation. As the Euler equation does not require measuring marginal
q, it is less subjective to troubles stemming from inaccurate measurement of q. Their
findings show that the standard neoclassical investment model based on the perfect capital
market assumption works less satisfactorily for low-dividend payout (“more constrained”)
firms than for high-dividend payout firms. They further demonstrate that the rejection of
the standard investment model does not depend on size or maturity of the firm, implying
that the effect of internal funds is not traceable to the free cash flow hypothesis suggested
by (Jensen, 1986). Other studies yield similar results using the Euler equation (Bond &
Meghir, 1994; Gilchrist, 1990; Whited, 1992).

22
Another possible explanation for the significant role of cash flow is that cash flow
might measure investment opportunities better than q (Hubbard, 1998). Gilchrist and
Himmelberg (1995) examine whether cash flow played a fundamental role in investment
decision or simply predicted investment opportunities. To bypass the problems pertaining
to the measurement of q, they developed an alternative proxy for the expected discounted
marginal profit of investment (“Fundamental Q”) using the vector auto-regression (VAR)
model. By adopting cash flow as one of explanatory variables for the Fundamental Q, they
control the effect of cash flow as an indicator of investment opportunities. Consistent with
FHP and subsequent empirical research, Gilchrist and Himmelberg (1995) confirm cash
flow is an important predictor of investment. They find that investment of firms with bond
rating and access to commercial market papers are satisfactorily accounted for by the
perfect capital market model of investment. In contrast, firms that have a limited access to
external capital markets exhibit excessive sensitivity of investment to the volatility of cash
flow.
In summary, empirical studies of firm investments generally lend strong support
for the links between changes in net worth and investment arising from information
asymmetry in financial markets.

23
CHAPTER 3. DEMAND UNCERTAINTY AND INVESTMENT
3.1 Introduction
According to the contingency and resource dependency theories, organizations
must be designed to cope with, and change to keep up with, the uncertainty of their
environments (Burns & Stalker, 1961; Scott, 1981; Thompson, 1967). Therefore,
uncertainty has received more attention in the literature than any other dimension of
environment (Dess & Beard, 1984; Duncan, 1973; Khandwalla, 1977)
The restaurant industry is highly sensitive to external economic factors (Enz, 2009;
Neuman, 2009). As the restaurant business depends on consumer disposable income, the
uncertainty over demand directly affects the restaurant performance. Nevertheless,
academia has been silent about the impact of demand uncertainty in the restaurant business
(Harrington, 2001). A strand of research on revenue management has suggested indirect
ways to cope with demand fluctuation by maximizing revenue in a given situation, but
other than that, much remains unexplored. Designed to fill the void in understanding how
demand uncertainty affects restaurant businesses, this study examines the impact of
demand uncertainty on restaurant investment. More specifically, it focuses on how
restaurant firms facing uncertain demand adjust their fixed investment activity.

24
3.2 Theoretical Background and Hypotheses
3.2.1 Uncertainty and Risk
Risk and uncertainty are both related to the randomness of future outcomes. Though
many researchers agree that they are not identical concepts, no unanimous definition has
been made yet. Instead, the definitions are rather context or discipline dependent (Samson,
Reneke, & Wiecek, 2009). According to Samson et al.’s (2009) review of multidisciplinary
perspectives on uncertainty and risk, risk and uncertainty are either used interchangeably
or distinguished from each other. Researchers who distinguish the two concepts seem to
follow Willett’s (1901) early definition. He regards risk as the “objectified uncertainty
regarding the occurrence of an undesirable event” and thus is quantifiable, whereas
subjective uncertainty is “resulting from the imperfection of man’s knowledge.” As
uncertainty arises when imperfect knowledge makes it difficult to predict the future
(Beckman, Haunschild, & Phillips, 2004), some scholars regard uncertainty as a state of
the mind relying on subjective belief and knowledge (Pfeffer, 1956). Nevertheless, most
studies that examine uncertainty and investment do not distinguish the two concepts and
attempt to quantify uncertainty using observable data.
3.2.2 Demand Uncertainty
Demand uncertainty is the most obvious and significant source of uncertainty for
most systems (Arda & Hennet, 2006). The instability and unpredictability inherent in
consumer taste and preferences renders demand uncertainty a consistent source of
ambiguity that cannot be eliminated (March, 1978). The restaurant is no exception.

25
Moreover, economic uncertainty takes a toll on restaurants (Gasparro, 2012a; Jargon,
2013). Economic uncertainty affects consumer sentiment, translated into demand
uncertainty. Highly intense competition in the foodservice market, however, does not allow
much discretion for restaurants to actively control prices in response to uncertain demand.
Nevertheless, it has not attracted much attention from hospitality management researchers
(Harrington, 2001). Although a line of revenue management research has prescribed
several ways for restaurants to maximize revenue in a given situation (Kimes, 1999; Kimes,
Chase, Choi, Lee, & Ngonzi, 1998), their analysis is done at a micro-level for a particular
restaurant unit rather than a macroscopic examination of the impact of demand uncertainty
in the restaurant industry.
This study investigates how restaurant firms adjust the level of investment in the
presence of industry demand uncertainty. In addition, firm characteristics that affect a
firm’s susceptibility to uncertainty will be explored as well. The findings will reveal what
types of firms are more bound to industrial uncertainty when making investments.
The match of industry-level uncertainty and firm-level investment data will better
capture the causal relationship between uncertainty and investment because uncertainty in
the industry is usually uncontrollable for most firms. A major problem of using firm-level
uncertainty and investment data is endogeneity (Fuss & Vermeulen, 2008). When a firm
starts an investment project whose profitability is unknown, it can increase the uncertainty
of the firm. However, it is not reasonable to assume that a firm’s investment project would
increase the industry’s uncertainty, particularly in a highly fragmented market like the

26
foodservice industry. The idiosyncratic impact of most restaurant firms’ investment policy
on industry demand would be diffused at the industry level.
3.2.3 Uncertainty and Investment
Theory
The impact of uncertainty on corporate investment has long been researched in
finance. According to one line of research, initiated by (Hartman, 1972) and (Abel, 1983),
greater uncertainty increases investment. Assuming that the marginal revenue product of
capital is convex in the output price, output price uncertainty can raise the marginal
profitability of capital and thus increase investment. An increase in the variance of output
price without a change in the mean raises the expected profitability of capital, leading to
an increase in investment. This applies to firms that operate in competitive markets and
have no problem in reversing investment with constant returns to scale.
Caballero (1991) demonstrates how the association between uncertainty and
investment changes according to different assumptions about marginal return to capital and
adjustment cost. He argues that the positive association, claimed by Hartman (1972) and
Abel (1983), is robust even to irreversible investment under the assumptions of perfect
competition and nondecreasing returns to scale. He suggests that in a very competitive
market, today’s investment decision only depends on the marginal profitability of capital.
The asymmetry of adjustment cost has nothing to do with the sign of today’s investment.
Thus, as long as the convexity of marginal return of capital with respect to price uncertainty
holds, uncertainty encourages investment. However, when the adjustment cost asymmetry

27
is combined with decreasing marginal return to capital (because of imperfect competition
or decreasing returns to scale), the association can turn negative.
Another view, which emphasizes the role of irreversibility projects a negative
relationship between uncertainty and investment. Once put into use, capital (or fixed) assets,
such as plant and equipment, are hard to reverse to their former physical state without cost
because the asset is likely to be tied to specific configuration requirements or contractual
provisions of the firm, diminishing the reusable value of the asset. Accordingly, firms incur
larger costs when they disinvest than when they expand. Because of the irreversibility of
investment and asymmetric adjustment cost, Pindyck (1991) and Bernanke (1983) argue
that firms unsure of future demand can benefit from delaying investment until the
uncertainty at least partly dissolves away. Firms can make better-informed investment
decisions by waiting for new information and reevaluating investment projects, implying
a negative association between uncertainty and investment (Dixit & Pindyck, 1994;
Pindyck, 1991). Abel, Dixit, Eberly, and Pindyck (1996) expand Pindyck (1991) and Dixit
and Pindyck (1994) and consider a more general case. When investment is not necessarily
irreversible, uncertainty increases both the value of waiting and the value of the reversing
option, and thus the ultimate effect is not obvious. However, the effect would be negative
as investment is more irreversible.
Empirical Evidence
As investment decisions are forward-looking (Carruth, Dickerson, & Henley, 2000),
uncertainty of any economic factor related with costs or return of the investment can impact

28
investment. Several sources of uncertainty have been examined, and the general consensus
is that uncertainty has a negative effect on investment.
Campa (1993) investigated the impact of exchange rate variability on foreign direct
investment (FDI). Because of sunk costs in capacity (i.e., the degree of irreversibility), FDI
exhibits hysteresis effects, the phenomenon that the level of exchange rate at which a firm
exits a foreign market does not come back to the level at which the firm first entered the
market. For the firm to leave the market, the exchange rate should be lower than the level
that induced entry. Consequently, firms would have an incentive to defer entry as the
exchange rate becomes more volatile (Dixit, 1989). Campa (1993) empirically finds
exchange rate volatility to be negatively related with the number of FDI, and the negative
effect is more pronounced for industries where the extent of investment irreversibility is
relatively high. Cushman (1988) observes that expected appreciation of the dollar is
negatively correlated with foreign investment in the United States. However, Goldberg
(1993) suggests a weak impact of the currency rate volatility on U.S. aggregate investment.
The overall relationship is not significant and weakly positive in the manufacturing durable
sectors.
Huizinga (1993) examined inflation uncertainty and investment in the U.S.
manufacturing sectors. Inflation uncertainty leads to uncertainty in real cost of production,
such as real wages, as well as the uncertainty in relative price of final products and the
profit rate, effecting uncertainty about real returns from investment projects. The empirical
results show inconsistent associations of different types of uncertainties with aggregate
investment. While uncertainty about real wage and output price induce a drop in investment,

29
uncertainty about the profit rate leads to increased capital expenditure. Byrne and Davis
(2004) also found that inflation uncertainty has a depressant impact on investment, either
the uncertainty is temporary or permanent.
Rodrik (1991) demonstrates how perceived uncertainty about policy reforms acts
as an implicit tax on investment. Uncertainty regarding the implications of a new policy
freezes entrepreneurs’ investment sentiment, leading them to withhold projects until the
uncertainty partially dissolves. Pástor and Veronesi (2013) argue that political uncertainty
diminishes government protection for capital markets, raising the equity risk premium. The
phenomenon is more significant in a fragile economy. Gulen and Ion (2016) also reveal a
negative association of economic policy uncertainty and investment. They further show
that policy uncertainty exerts a stronger impact on firms that operate in competitive
industries and that are more financially constrained.
Episcopos (1995) investigated the impact on fixed investment of five major
uncertainty variables: the growth rates of real interest rate, consumer spending, composite
index of leading indicators, stock price index, and GDP inflator. He also observed that the
various proxy measures of economic uncertainty are inversely related to fixed investment.
Demand Uncertainty and Capital Investment in the Restaurant Industry
Capital investment generally refers to investment in physical long-term assets (e.g.
property, plant and equipment) that are utilized for production. Mergers and acquisitions
are also regarded as a part of capital investment. Capital expenditure in restaurant
businesses mostly involves development of new restaurants and improvement of existing
properties. Other capital expenditures include investments in information technology

30
systems and production facilities. In terms of amount, the restaurant industry is placed in
the middle between manufacturing and pure service-oriented industries. For example, the
amount of capital expenditure by an average restaurant firm was $107K as of January 2014,
whereas the same figure was $646K in the automotive industry, and $37K in the computer
software industry (Damodaran, 2014).
Capital investment in the restaurant industry bears a certain level of industry-
specificity and irreversibility. Under the U.S. GAAP, capital expenditure is capitalized and
depreciated over the life of the asset, leading to an increase in operating leverage. Moreover,
given that restaurant firms tend to finance their fixed assets through long-term debt (Jang
& Ryu, 2006), making capital expenditures likely increases financial leverage as well. Thus,
if future demand for new restaurants turns out to be insufficient to cover the investment
expenditures, the restaurant firms would be burdened with idle capacity and debt. This
suggests that restaurant chains would be reluctant to make capital investment as they see
industry demand uncertainty increases.
Nonlinear Relationship Between Demand Uncertainty and Investment
As previously argued, most empirical studies commonly report a negative
relationship between uncertainty and investment, dominated by the concept of
irreversibility of investment and real option (Pindyck, 1991). There are two common
features in the aforementioned empirical research. One is that most of them focus on
manufacturing industries (Koetse, de Groot, & Florax, 2009) and the other is that they
implicitly assume a linear association. However, because of unique characteristics of the
restaurant industry this study suspects a nonlinear relationship between demand uncertainty

31
and investment. That is, the negative impact of uncertainty may be insignificant or
moderate for low levels of uncertainty but be more severe for high levels of uncertainty.
According to Kahneman and Tversky (1979), individuals maintain an asymmetric
attitude toward risks according to the size of loss. They observe a risk-seeking behavior
over the domain of small losses when the utility of an agent depends on gains and losses
rather than on the state of final outcomes. Thus, in the investment function derived from a
nonlinear utility function, a firm may be willing to take risks for a range of small losses
arising in the low level of uncertainty (Bo & Lensin, 2005).
On top of that, the unique conditions of the restaurant industry provide additional
support for a nonlinear relationship. Kulatilaca and Perotti (1998) argue that the impact of
uncertainty on investment depends on the strategic value of investment, such as preemption
and dissuasion of entry, and the value of not investing (the value of flexibility). As is well
known, the restaurant industry is highly competitive. In the presence of competition, the
impact of uncertainty between on investment depends not only on the degree of
irreversibility but also on the value of strategic investment (Ghosal & Loungani, 1996).
The real option theory claims that companies facing uncertainty are better off waiting
before they make investment expenditures. This is because delaying allows the firm
opportunities to reevaluate a project based on new information about price, costs, and other
market conditions before committing resources (Pindyck, 1991). Such a claim implicitly
assumes that the firm has an exclusive property right on the project that other firms cannot
take over; however, that is not always guaranteed. When the firm shares growth
opportunities with the firm’s rivals, the firm may need to invest quickly to preempt

32
investment by competitors or at least to maintain its competitiveness in the market. A
myriad of research shows that the value of real options quickly deteriorates with
competition (Baldursson, 1998; Bulan, Mayer, & Somerville, 2009; Grenadier, 1996, 2002;
Kulatilaka & Perotti, 1998; Lambrecht & Perraudin, 2003). In line with this reasoning,
Akdoğu and MacKay (2008) examine how industry competitiveness affects firms’
investment behavior. The results revealed that firms competing in oligopolistic and
competitive industries show a larger investment-q sensitivity and a faster investment speed
than firms in monopolistic industries.
What makes capital investment risky under uncertainty is the irreversibility. Firms
usually cannot disinvest or even if they can, the loss of time and value reduces the resale
value of used capital far below its replacement cost (Ramey & Shapiro, 2001). The degree
of irreversibility is one of the most obvious sources of heterogeneity in the relationship
between uncertainty and investment (Koetse et al., 2009); the lower the cost to reverse the
investment, the smaller the sensitivity of the investment to uncertainty. In manufacturing
industries, capacity expansion is usually lumpy and requires a huge capital commitment
and a years-long construction period. Moreover, the layout of a factory and equipment are
specifically designed for and customized to what is produced. Thus, in 1981 Ford Motor
Company had to close its gigantic Michigan Casting Center in Flat Rock built only 12 years
previously at a cost of more than $150 million (New York Times, 1981; Tuzel, 2010). After
more than three years of being closed, the plant was torn down so that another car maker
Mazda Motor Manufacturing could construct a factory on the same site. However, the level
of irreversibility is lower in the restaurant industry. As the investment is generally
33
undertaken on a unit restaurant basis, the capital investment can be split into a series of
multiple projects. Furthermore, compared with building a new factory, opening a new
restaurant can be done in a shorter time span with less cash. So does closing unprofitable
units.
Intense competition and relatively low disinvestment costs are restaurant industry-
specific features that work against the dampening impact of uncertainty. Thus, when
uncertainty is low or moderate, those two factors, combined with human nature, which is
generous to small losses, may dilute the inhibiting effect of demand uncertainty on
investment. However, as uncertainty continues to increase, concerns about being stuck with
unwanted equipment and loss-making outlets would discourage restaurant firms from
making new investments. In other words, the investment rate falls slowly for low levels of
uncertainty but it drops more rapidly as the level of uncertainty continues to go up.
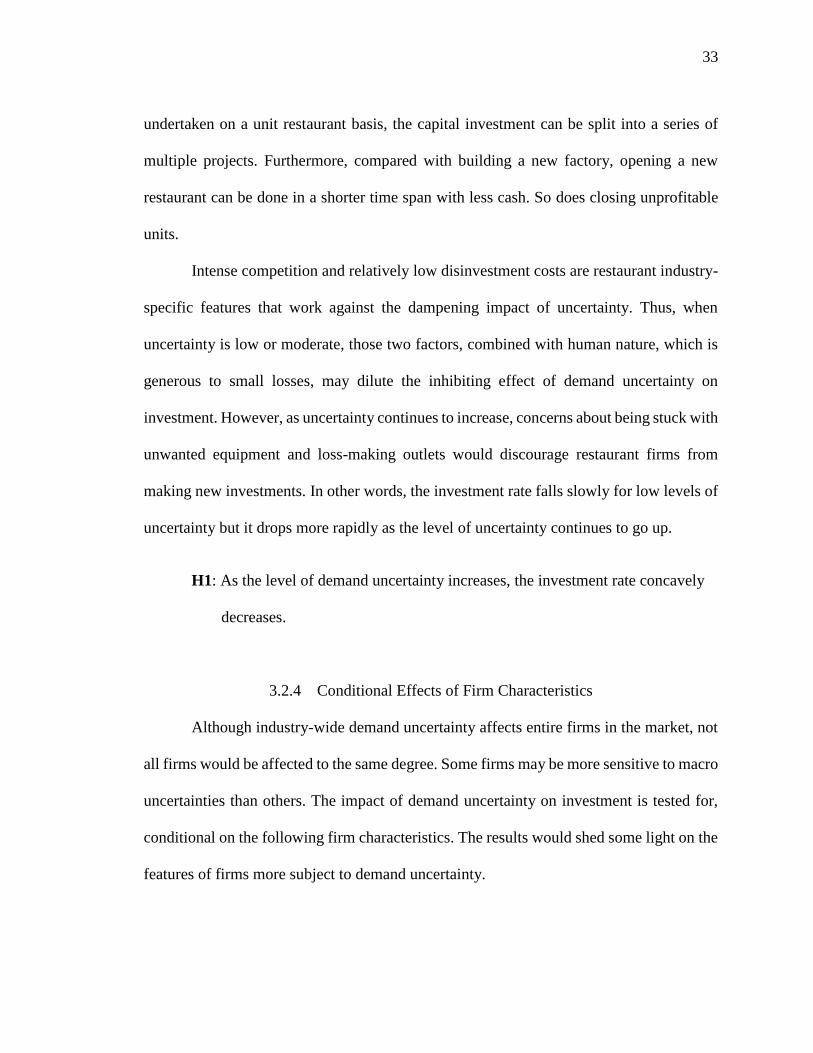
H1: As the level of demand uncertainty increases, the investment rate concavely
decreases.
3.2.4 Conditional Effects of Firm Characteristics
Although industry-wide demand uncertainty affects entire firms in the market, not
all firms would be affected to the same degree. Some firms may be more sensitive to macro
uncertainties than others. The impact of demand uncertainty on investment is tested for,
conditional on the following firm characteristics. The results would shed some light on the
features of firms more subject to demand uncertainty.

34
Franchise
Next is an examination of the conditional effect of franchise on the relation between
demand uncertainty and investment. Franchisors share business risk with franchisees as
they rely on franchisees’ capital and human resources. By investing their resources,
franchisees share the business risk with franchisors (Martin, 1988). The product of
investment would be shared with franchisees as well. It is implemented through franchise
fees, which are relatively more stable than operating income from company-owned outlets,
and low operating leverage, which would dilute the effect of fluctuations in demand on the
bottom line.
Uncertainty dampens investment because of irreversibility inherent in investment,
suggesting that the impact of uncertainty on investment is proportional to the extent of
investment irreversibility. Thus, firms whose investment bears a larger sunk cost would be
more sensitive to uncertainty shocks (Gulen & Ion, 2016). One of the proxy measures of
irreversibility is a fixed asset ratio because fixed assets, such as property and equipment,
are costly to reverse, and incur large sunk costs as a form of depreciation expense (Gulen
& Ion, 2016). Franchising restaurants have a lower operating leverage than nonfranchisors
(i.e., lower irreversibility of investment) as it is usually franchisees who own and manage
units.
Relatively stable cash flow obtained from franchise royalties is an important route
that intervenes between uncertainty and investment. Froot, Scharfstein, and Stein (1993)
argue that the goal of risk management is to align the inflow of cash with the demand for
investment funding. Imperfections of capital markets, such as information asymmetry

35
between managers and investors and default risk arising from debt, create a cost wedge
between external capital (equity and debt) and internal fund (retained earnings). Thus,
managers prefer internal funds to relatively expensive external funds in financing
investment projects. They even forgo profitable projects when in-house capital is not
sufficient. Indeed, it has been shown that investment is highly correlated with cash flow
(Fazzari et al., 1988; Hovakimian, 2009; Kaplan & Zingales, 1997). Therefore, it is
predicted that if a firm is concerned with its volatile cash flow stream, the firm would be
cautious to make capital investments and it would be all the more so as the level of
uncertainty rises. However, franchising firms, by securing a more stable cash flow stream,
would be able to push forward investment projects as planned. This is the point where
franchising can tackle the dampening impact of demand uncertainty on investment.
H2a: Franchising restaurants are less susceptible to demand uncertainty in
implementing investment projects than nonfranchising restaurants.
Segment
As described in Chapter 2.1, the impacts of economic changes on performance
differ between segments. Because of the high price range, full-service restaurants are the
first to feel the onset of recession and the first to see the end of recession (Youn & Gu,
2009). During the early years of recovery, when the unemployment rate is still high, the
upper-income class increases their economic position faster than the middle-income and
low-income classes (Thorn, 2014). In contrast, the limited-service segment exhibits lower
cyclicality than the full-service segment. Limited-service restaurant stocks appear to be
recession-proof and the segment stock index outperformed that of the full-service segment

36
and the market during the recent Great Recession. However, it also takes longer to benefit
from increasing demand in the post-recession period.
Less cyclical businesses have a greater temporal inertia (Steenkamp & Fang, 2011),
which would offer a larger shield against the dampening effect of demand uncertainty.
Conversely, highly cyclical businesses have to deal with sharp fluctuations in demand, and
thus should be more cautious in making decisions that are fairly irreversible. In this regard,
it is predicted that the full-service restaurants would be more susceptible to demand
uncertainty than limited-service counterparts.
H2b: Full-service restaurants are more susceptible to demand uncertainty in
implementing investment projects than limited-service restaurants.
3.3 Methodology
3.3.1 Data
The U.S. monthly retail sales of food services and drinking places were retrieved
from the U.S. Census Bureau (http://www.census.gov/retail/). They provide seasonally
adjusted monthly estimates of segmental (full-service, limited-service, and drinking places)
as well as total sales since 1992. Firm accounting data were obtained from the Compustat
database. Franchising data were manually collected from 10-K reports. Lastly, the annual
U.S. Real GDP growth rate data were retrieved from the U.S. Bureau of Economic Analysis
for (http://www.bea.gov/national/index.htm#gdp).

37
3.3.2 Models
Estimating Demand Uncertainty in the Restaurant Industry
In this study, a two-faceted measure of demand uncertainty based on historical
industrial sales data was develped. First, uncertainty was estimate as the variance forecast
of industry sales using a Generalized Autoregressive Conditional Heteroscedasticity
(GARCH) model. It states that the best predictor of variance in the current period is the
weighted sum of the long-run average variance, the variance predicted for the previous
period, and the most recent squared residual, which is to reflect new information that
arrived in the previous period so was not available when the previous forecast was made
(Engle, 2001).
One feature of GARCH is that recent squared deviations are assigned larger
weights than distant squared deviations and the weights gradually decline as observations
recede in time (Ederington & Guan, 2006). Huizinga (1993) claims that what matters in
investment decisions is not deviations from the average value that can be reliably predicted
but rather fluctuations about an expected future trend, and that the use of an ARCH-based
model fits the need for extracting unexpected shock from unconditional variance of a series.
In the case of restaurant demand, the factors affecting restaurant sales are likely to
be persistent over time. For example, critical to the success of restaurant businesses,
economic conditions gradually shift. The U.S. economy has not yet completely overcome
the Great Recession of the late 2000s. In addition, consumers’ preference shifts also tend
to persist over a few years. For example, increasing demand toward healthy diet and
sustainable businesses is expected to continue (Zwolak, 2010). What they imply in

38
common is that the variance of restaurant demand today, this month, or this year would be
likely to resemble those of yesterday, last month, or last year. For these reasons, the demand
uncertainty was estimated using a GARCH (1, 1) model. The variance forecast of demand
would be a proxy measure for demand uncertainty.
𝐷𝑡 = 𝛼0 + ∑ 𝛼𝑖𝐷𝑡−𝑖
𝑞
𝑖=1
+ 𝑢𝑡 Eq. 3.1
𝜎𝑡2 = 𝛾0 + 𝛾1𝑢𝑡−1
2 + 𝛿𝜎𝑡−12 Eq. 3.2
This is the simplest but mostly widely used form of GARCH model, GARCH (1,
1). The weights 𝛾0, 𝛾1, and 𝛿 determine the speed at which the forecast variance reflects
new information and the speed at which it converts to the long-run average (Engle, 2004).
GARCH (1, 1) is easy to estimate, parsimonious (compared with qth-order ARCH model)
while successful in forecasting conditional variances. The GARCH reaction parameter (𝛾1)
indicates the degree to which the volatility of the last period feeds through to the current
period’s volatility, and generally ranges from 0.05 (relatively stable market) to 0.1
(relatively volatile and nervous market). The GARCH persistence parameter (𝛿 ) falls
between 0.85 and 0.98, with smaller values related to higher 𝛾1. Thus, the lower 𝛿 and the
higher 𝛾1, the more spiky and jumpy is the volatility (Alexander, 2008).
The estimation starts with finding the best-fitting AR model, which turns out to be
AR (15) in this study. The lag length of an AR model should be long enough to capture the
full cycle of the data. So in the case of monthly data, there should be a minimum of 12 lags.
Moreover, to consider some seasonality carried over from year to year and across months,

39
lag lengths of 13–15 months are commonly used (Brandt & Williams, 2007). The results
of information criteria for AR models with different lag lengths are presented in Table 3.1.
Table 3.1 Lag length determination
lag AIC HQIC SBIC
0 21.061 21.066 21.075
1 17.871 17.882 17.898
2 17.604 17.621 17.646
3 17.593 17.615 17.648
4 17.590 17.618 17.659
5 17.551 17.584 17.634
6 17.512 17.551 17.608
7 17.148 17.193 17.259
8 17.114 17.164 17.238
9 16.896 16.952 17.035
10 16.904 16.965 17.056
11 16.773 16.840 16.939
12 16.160 16.232 16.340
13 15.870 15.948 16.064
14 15.772 15.855 15.979
15 15.627* 15.716* 15.848*
16 15.634 15.729 15.869
17 15.640 15.741 15.890
18 15.645 15.750 15.908
19 15.636 15.747 15.913
20 15.638 15.755 15.928

40
Then, a GARCH (1, 1) model was estimated using the residuals produced by the
AR (15) model, and the variance forecast of demand would be a proxy measure for monthly
demand uncertainty.
Table 3.2 AR (15) model
Coefficient Std. Dev.
L1. 0.231*** 0.062
L2. 0.211*** 0.061
L3. 0.380*** 0.066
L4. -0.046 0.041
L5. 0.105** 0.041
L6. -0.108*** 0.041
L7. 0.017 0.045
L8. 0.022 0.047
L9. 0.035 0.042
L10. -0.033 0.046
L11. 0.096** 0.037
L12. 0.866*** 0.038
L13. -0.216*** 0.067
L14. -0.182*** 0.060
L15. -0.370*** 0.066
cons 35.205 137.907
Note: ***: significant at 0.01 level; **: significant at 0.05 level; *: significant at 0.1 level.
Table 3.3 shows the coefficients of the GARCH (1, 1) model. The GARCH reaction
parameter (𝛾1) is significant at α = 0.10, validating the use of the GARCH model in
estimating monthly demand uncertainty. High 𝛿 and low 𝛾1 indicate that the restaurant
industry demand is relatively stable (Alexander, 2008). To match the frequency of the

41
monthly demand uncertainty index to the yearly accounting data, monthly indices are
averaged, equally-weighted, into a yearly average.
Table 3.3 GARCH (1, 1) results
Coeff. Std. Dev
𝛾1 0.044* 0.026
𝛿 0.947*** 0.045
cons 3737.350 5857.664
chi-sq 68123.17
Note: ***: significant at 0.01 level; **: significant at 0.05 level; *: significant at 0.1 level.
The Effect of Demand Uncertainty on Investment
Based on the theoretical literature about investment model in Chapter 2, the
following baseline investment model is presented:
𝐼𝑁𝑉𝑖,𝑡 = α𝑖 + α1𝑈𝑁𝐶𝐸𝑅𝑖,𝑡−1 + α2(𝑈𝑁𝐶𝐸𝑅𝑖,𝑡−1)2 + 𝛼3𝑄𝑖,𝑡−1 + 𝛼4𝐶𝐹𝑖,𝑡−1
+ α5𝐼𝑁𝐷𝑆𝐺𝑡−1 + α6𝐺𝐷𝑃𝑡−1 + 휀𝑖,𝑡 Eq. 3.3
INV is the logarithm of capital expenditure net of depreciation expense scaled by previous
period’s total assets (Lang, Ofek, & Stulz, 1996); UNCER is the measure of industry-wide
demand uncertainty. Along the uncertainty measure, several control variables were
considered. Q is the Tobin’s q to control for firm-specific investment opportunity and
variation in business conditions (Stein & Stone, 2012). It is calculated following (Chung
& Pruitt, 1994); CF is cash flow defined as the ratio of earnings before extraordinary items
plus depreciation and minus dividends deflated by previous period’s total assets; INDSG
is industry sales growth, which is a log difference of the U.S annual retail sales of food

42
services and drinking places; GDP is the real GDP growth rate. Firm growth, industry sales
growth and real GDP growth are to control for investment opportunities that might not
have been captured by Q (Gulen & Ion, 2016). The subscript i indexes firms, and t, time.
To match the time period between the uncertainty and the investment and ensure
the uncertainty precedes the investment, this study calculated two uncertainty estimates for
every year. One is over the period from January to December (Uncer12), and the other
from July to June (Uncer6). Then, we pair accounting data of firms whose fiscal year
ending month falls between June and November with the uncertainty index that covers July
through June (Uncer6). For example, the accounting data in 1995 of a firm whose fiscal
year ending month is August were matched with the uncertainty estimate that covers July
1993 through June 1994, whereas the data of a firm whose fiscal year ends in December
1995 were linked with the uncertainty estimate that covers January to December in 1994.
However, this variation is subtle because the majority of sample firms face the same level
of industry-wide uncertainty in every fiscal year. Thus, the equation does not include time-
fixed effects to prevent time variables from absorbing the effect of uncertainty (Gulen &
Ion, 2016).
Lastly, all firm-specific variables were winsorized at the 1st and 99th percentiles to
minimize the impact of data errors and outliers. To improve normality, INV and UNCER
were logarithmically transformed.
The Hausman test and Wooldridge test for autocorrelation results indicated the
presence of unobserved firm-specific effect and first-order serial correlation among
residuals. Serial correlation in the panel-data models causes bias in the standard errors and

43
consequently makes the results less efficient (Drukker, 2003). Accordingly, the models
were estimated using fixed-effect regression with AR (1) disturbances (Baltagi & Wu,
1999).
The Conditional Effect of Franchising and Segment
The following model was developed to test the moderating effect of franchising.
𝐼𝑁𝑉𝑖,𝑡 = 𝛾𝑖 + 𝛾1𝑈𝑁𝐶𝐸𝑅𝑡−1 + 𝛾2(𝑈𝑁𝐶𝐸𝑅𝑡−1)2 + 𝛾3𝐹𝑅𝐴𝑁𝑖,𝑡−1 + 𝛾4𝑈𝑁𝐶𝐸𝑅𝑡−1 ×
𝐹𝑅𝐴𝑁𝑖,𝑡−1 + 𝛾5(𝑈𝑁𝐶𝐸𝑅𝑡−1)2 × 𝐹𝑅𝐴𝑁𝑖,𝑡−1 + 𝛾6𝑄𝑖,𝑡−1 + 𝛾7𝐶𝐹𝑖,𝑡−1 +
𝛾8𝐼𝑁𝐷𝑆𝐺𝑖,𝑡−1 + 𝛾9𝐺𝐷𝑃𝑖,𝑡−1 + 휀𝑖,𝑡 Eq. 3.4
FRAN indicates the franchise dummy (1 = Franchisors, 0 = Nonfranchisors). Franchisors
are defined here as the firms with positive franchising-related revenue: royalty and other
franchise fees.
The following equation is to test the moderating role of the segment.
𝐼𝑁𝑉𝑖,𝑡 = 𝛾𝑖 + 𝛾1𝑈𝑁𝐶𝐸𝑅𝑡−1 + 𝛾2(𝑈𝑁𝐶𝐸𝑅𝑡−1)2 + 𝛾3𝑆𝐸𝐺𝑖,𝑡−1 + 𝛾4𝑈𝑁𝐶𝐸𝑅𝑡−1 ×
𝑆𝐸𝐺𝑖,𝑡−1 + 𝛾5(𝑈𝑁𝐶𝐸𝑅𝑡−1)2 × 𝑆𝐸𝐺𝑖,𝑡−1 + 𝛾6𝑄𝑖,𝑡−1 + 𝛾7𝐶𝐹𝑖,𝑡−1 +
𝛾8𝐼𝑁𝐷𝑆𝐺𝑖,𝑡−1 + 𝛾9𝐺𝐷𝑃𝑖,𝑡−1 + 휀𝑖,𝑡 Eq. 3.5
SEG is the segment indicator (1 = Full service, 0 = Limited-service).
Since fixed-effect model automatically washes away the effect of time-invariant
regressors, the Hausman-Taylor estimator was used, which is a transformed random-effect
model (Hausman & Taylor, 1981). A general random effect model assumes that
unobserved individual effects are not correlated with predictor variables, while a fixed

44
effect model allows for endogeneity of regressors and individual effects. Hausman and
Taylor propose a random-effect model where some independent variables, either time-
variant or invariant, are correlated with the unobserved individual effects. In the presence
of endogeneity among regressors, there is substantial bias in the random-effect estimators
(Baltagi, Bresson, & Pirotte, 2003). The Hausman-Taylor estimator addresses this problem
by allowing the correlation between some predictor variables and the individual effects.
3.4 Results
3.4.1 Descriptive Analysis
Descriptive statistics for the main variables are summarized in Tables 3.4 through
3.6. For descriptive purposes, natural (unlogged) numbers are reported for INV and UNCER.
It is shown that a typical public restaurant chain makes 7.4 percent of investment a year.
The average Q is 2.926 and there is a large variation in Q from 0.02 to 19.45, showing that
even within the single industry stock market evaluation can substantially vary across firms.
The annual sales of the U.S. foodservice and drinking places have grown at 4.7 percent on
average.

45
Table 3.4 Descriptive statistics (Total)
Obs Mean Std. Dev. Min Max
INV 1352 0.074 0.124 -0.101 0.644
UNCER 1424 0.305 0.103 0.182 0.579
Q 1409 2.926 3.789 0.020 19.445
CF 1348 0.106 0.112 -0.432 0.333
INDGR 1303 0.047 0.016 -0.004 0.068
GDP 1424 0.027 0.018 -0.028 0.050
Table 3.5 compares average investment rate, Q, and cash flow between
nonfranchisors and franchisors. Given that franchisees are responsible for investment, it is
not surprising that nonfranchisors invest more than franchisors. Franchisors report higher
Q than nonfranchisors but no significant difference in cash flow amount.
Table 3.5 Descriptive statistics by franchising
Nonfranchisors Franchisors t-test
(μ1 = μ2) Obs Mean Std. Dev. Obs Mean Std. Dev.
INV 559 0.096 0.144 793 0.059 0.104 5.43***
Q 585 2.717 3.745 824 3.073 3.817 -2.12**
CF 562 0.101 0.107 786 0.110 0.115 -1.62
UNCER 596 0.287 0.093 828 0.318 0.108 -5.64***
Descriptive information by segment is presented in Table 3.6. Limited-service
restaurants invest less in fixed assets than their full-service counterparts. This fact can be
explained by the gap in the franchise ratio. The franchise ratio of the full-service chains is
less than half of the same ratio of the limited-service chains. In terms of Q, limited-service

46
firms surpass full-service firms. This is due to the well-established fast-food chains and
outstanding performance of fast-casual eateries. As of May 2016, the market-to-book ratio
of Chipotle Mexican Grill is 8.59, Panera Bread 12.06, and McDonald’s 28.47, whereas
Darden Restaurants is 4.35 and Cracker Barrel Old Country Store 6.30 (Yahoo Finance,
2016). In terms of cash flow, the full-service restaurants have a deeper pocket.
Table 3.6 Descriptive statistics by segment
Limited-service Full-service t-test
(μ1 = μ2) Obs Mean Std. Dev. Obs Mean Std. Dev.
INV 384 0.062 0.123 909 0.090 0.130 -3.58***
Q 408 3.500 4.581 944 2.510 3.238 4.52***
CF 392 0.095 0.125 904 0.113 0.097 -2.77***
FR 355 0.949 0.220 917 0.458 0.499 17.90***
UNCER 414 0.307 0.104 953 0.299 0.099 1.35
Note: FR is the franchise ratio, number of franchising firm-year observations divided by the number
of total firm-year observations in that segment.
Table 3.7 displays the pairwise correlation matrix of variables. As expected,
investment is negatively related with uncertainty but positively with Q, cash flow, GDP
growth, and industry growth. Uncertainty has a negative association with real GDP growth,
meaning that as the economy declines the uncertainty is on the rise. This is consistent with
the finding in Bloom (2014). It is also shown that demand uncertainty suppresses industry
sales growth.

47
Table 3.7 Correlation matrix
INV UNCER Q CF INDGR GDP FRAN
UNCER
-0.270
***
Q
0.169
***
0.234
***
CF
0.217
***
-0.007
0.300
***
INDGR
0.105
***
-0.355
***
-0.011
0.097
***
GDP
0.141
***
-0.558
***
-0.109
***
0.080
***
0.411
***
FRAN
-0.124
***
0.107
***
0.080
***
0.042
-0.015
-0.090
***
SEG
0.159
***
-0.067
**
-0.137
***
0.036
0.032
0.040
-0.469
***
Note: ***: significant at 0.01 level; **: significant at 0.05 level; *: significant at 0.1 level.
Figure 3.1 exhibits the historical demand uncertainty and industry average
investment rate in the restaurant industry from 1992 to 2014. There is a negative
association between the industry demand uncertainty and the investment rate. After the
recent Great Recession, investment has not fully recovered to the previous level.

48
Figure 3.1 Historical demand uncertainty and average investment
3.4.2 Main Results
The regression outcomes of the unconditional baseline model are presented in Table
3.8. Three specifications of Eq.3.3 are estimated: column (1) includes only control
variables, column (2) adds a linear uncertainty term, and finally column (3) estimates the
full model, augmented by the squared uncertainty term.
In column (1), traditional investment determinants Q and CF are positively
significant. After the inclusion of UNCER in column (2), the uncertainty term is
significantly negative, confirming the inhibiting impact of demand uncertainty on
investment. The full model estimation outcomes are shown in column (3). Although the
coefficient decreases, the linear uncertainty term still contains statistical significance. The
squared uncertainty term, of primary interest, emerges to be negatively significant after
0
0.1
0.2
0.3
0.4
0.5
0.6
0
0.02
0.04
0.06
0.08
0.1
0.12
199
2
199
3
199
4
199
5
199
6
199
7
199
8
199
9
200
0
200
1
200
2
200
3
200
4
2005
200
6
200
7
200
8
200
9
201
0
201
1
201
2
201
3
201
4
Investment (Mean) Demand Uncertainty

49
controlling for the effect of Q, CF, industry and GDP growth, consistent with the
hypothesis.
Table 3.8 Uncertainty effect on investment
(1) (2) (3)
UNCER -1.204*** -0.821***
(0.215) (0.229)
UNCER2
-2.409***
(0.546)
Q 0.047* 0.073*** 0.071***
(0.024) (0.024) (0.024)
CF 1.514** 1.499** 1.610***
(0.595) (0.585) (0.578)
INDGR -4.661* -5.724** -12.096***
(2.585) (2.543) (2.885)
GDP 4.158 -0.369 6.775**
(2.547) (2.644) (3.076)
cons -3.439*** -3.330*** -2.932***
(0.086) (0.089) (0.100)
F-value 3.82 9.69 11.91
Prob>F <.001 <.001 <.001
obs 743 743 743
Note: ***: significant at 0.01 level; **: significant at 0.05 level; *: significant at 0.1 level.
Numbers in parentheses are the standard error of the coefficients.

50
Figure 3.2 Demand uncertainty and investment
Based on the coefficients in column (3), the quadratic uncertainty–investment
model is graphed in Figure 3.2 across one and a half standard deviations above and below
the mean uncertainty. Combined with the results in Table 3.8, This suggests that the
association of demand uncertainty and investment is not linear. Rather, under low levels of
uncertainty, investment even slightly increases and then turns to a decrease with increasing
uncertainty.
Though not reported here, the model was run for low and high levels of uncertainty
respectively, and there was a significantly positive relationship of uncertainty to investment
over the range of uncertainty from the lower bound to the inflection point. According to
Sarkar (2000), uncertainty influences investment in two ways. On one hand, uncertainty
decreases investment as the real option theory predicts. On the other hand, uncertainty can
increase the probability that the investment threshold will be reached, and thereby have a
positive impact on investment. He further analytically demonstrates that for low-growth
-4
-3.8
-3.6
-3.4
-3.2
-3
-2.8
-2.6Low Uncer High Uncer

51
and low-risk projects, the probability of investing actually increases for low levels of
volatility but after a certain point it decreases with the level of volatility. Abel and Eberly
(1999) argue that when the user cost effect and the hangover effect are considered, there is
an inverted U curve relation between the level of uncertainty and expected capital stock.
Bo and Lensin (2005) also found an inverted U-shaped relationship between uncertainty
and investment.
Table 3.9 shows the effect of the interplay between the economic condition and
demand uncertainty on investment. Before making the multiplicative interaction term, two
variables of interest, INV and GDP, were centered on each mean. In column (2), the
interaction model coefficients are reported. Both uncertainty variables are significant.
When it comes to the interaction terms, the linear interaction coefficient is positively
significant but not the quadratic coefficient.

52
Table 3.9 Uncertainty, economy conditions, and investment
(1) (2)
UNCER -0.821*** -0.811***
(0.229) (0.264)
UNCER2
-2.409***
(0.546)
-2.068***
(0.570)
GDP 6.775** 9.391***
(3.076) (3.133)
UNCER×GDP 32.295***
(12.255)
UNCER2×GDP
1.509
(21.447)
Q 0.071*** 0.069***
(0.024) (0.023)
CF 1.610*** 1.641***
(0.578) (0.570)
INDGR -12.096*** -14.784***
(2.885) (2.879)
cons -2.932*** -2.516***
(0.100) (0.109)
F-value 11.91 11.53
Prob>F <.001 <.001
obs 743 743
Note: ***: significant at 0.01 level; **: significant at 0.05 level; *: significant at 0.1 level.
Numbers in parentheses are the standard error of the coefficients.

53
Figure 3.3 Demand uncertainty and GDP growth
To facilitate interpretation of the quadratic interaction term, Figure 3.3 was created
the curvilinear relationship of uncertainty to investment between the two economic
conditions, following the procedures suggested by Aiken, West, and Reno (1991).
Investment rates in cases of low and high GDP growth, predicted by the interaction model,
are depicted across one and a half standard deviations above and below the mean
uncertainty. Though the quadratic interaction term is not statistically significant, in Figure
3.3 there is a moderating effect of economic condition on the association between
uncertainty and investment within the sample data range. At the same level of increase in
uncertainty, investment rate falls more steeply in the relatively soft economy marked with
low GDP growth than in the strong economy. That is, restaurant firms’ investment responds
to demand uncertainty more sensitively in recession periods.
-4
-3.8
-3.6
-3.4
-3.2
-3
-2.8
-2.6
-2.4
-2.2
-2
Low Uncer High Uncer
Low GDP HighGDP
54
Next, the conditional effects of franchising were examined. To estimate a pristine
effect of franchising, local master franchisees, who operate franchising restaurants in a
region under a contract with franchisors, were excluded from the analysis. They are
engaged in the franchising business but do not earn franchising-related revenue. Because
of the mixed nature of the business, they were removed from the sample. However,
inclusion of those firms hardly alters the results. First, this study divided the estimated
demand uncertainty into quintiles and compared the average investment between
franchisors and nonfranchisors across the quintiles. Although both groups reduce
investment in the face of increasing uncertainty, there is a notable gap in the degree of
responsiveness. When uncertainty is low, there is no significant difference between the two.
However, as the uncertainty rises, franchising restaurant firms cut investment to a greater
extent than nonfranchising firms. In addition, franchising firms show a more dramatic
adjustment of investment across different levels of uncertainty than nonfranchising
counterparts.

55
Table 3.10 Two-way descriptive statistics
Uncertainty level1 ANCOVA
(F-value) 1 2 3 4 5 Total
Non-
franchise
Mean -2.497 -2.355 -2.305 -2.380 -3.245 -2.495 9.67
Med -2.329 -2.138 -2.243 -2.355 -3.070 -2.393 ***
obs 99 96 79 92 52 418
Franchise Mean -2.524 -2.550 -2.620 -2.706 -3.753 -2.818 80.87
Med -2.379 -2.525 -2.420 -2.665 -3.542 -2.672 ***
obs 103 108 127 109 103 550
Total Mean -2.511 -2.458 -2.499 -2.557 -3.583 -2.678 84.03
Med -2.343 -2.298 -2.401 -2.495 -3.352 -2.543 ***
obs 202 204 206 201 155 968
Difference
(NF-F)
0.027 0.195 0.315 0.326 0.508 0.322
t-test 0.169 1.294
*
2.022
**
2.138
***
2.567
***
4.415
***
Note: ***: significant at 0.01 level; **: significant at 0.05 level; *: significant at 0.1 level.
Table 3.11 reports the results of the interaction model. To test for moderating
effects of franchising on the nonlinear effect of uncertainty on investment, two interaction
variables were included: a linear-by-linear interaction term (UNCER×FRAN) and a
quadratic-by-linear interaction term (UNCER2×FRAN). Evidence of a moderation effect is
found when the quadratic interaction term is significant and the model fit improves (Golden
& Veiga, 2005).
1 Quintiles of demand uncertainty estimate

56
Panel A presents coefficients of the baseline and the interaction model estimated
by the Hausman–Taylor regression and Panel B the main model outcomes estimated by
fixed effect with AR (1) disturbance for nonfranchisors and franchisors respectively. In the
baseline model, two uncertainty terms are both significantly negative but franchise dummy
is not. However, once the interaction terms are included, the first-order uncertainty term
becomes insignificant. As to the interaction terms, only the linear interaction coefficient
still maintains statistical significance. Two separate regression analyses were additionally
performed for nonfranchisors and franchisors. As hinted by the interaction model results,
for nonfranchisors only the quadratic term is statistically significant whereas both
uncertainty variables are significant for franchisors. The findings indicate that the
investment functions of the two groups are not different in terms of the degree of curvature
but in terms of location. Because the quadratic interaction term is insignificant, it fails to
reject the null hypothesis that there is no moderating effect of franchising.

57
Table 3.11 Interaction model (Uncertainty and franchising)
Panel A Panel B
Base Interaction Non-
franchisor Franchisor
UNCER -0.654*** -0.240 -0.335 -1.145***
(0.171) (0.232) (0.366) (0.309)
UNCER2 -2.146*** -2.539*** -2.747*** -2.386***
(0.411) (0.597) (0.883) (0.724)
FRAN -0.188 -0.286
(0.169) (0.178)
UNCER×FRAN -0.693***
(0.261)
UNCER2×FRAN 0.759
(0.684)
Q .095*** 0.095*** .065* .085***
(0.015) (0.016) (0.037) (0.030)
CF 2.759*** 2.886*** 1.724 0.956
(0.469) (0.491) (1.080) (0.803)
INDGR -5.113* -5.158* -11.898*** -14.694***
(2.820) (2.850) (4.583) (4.052)
GDP 11.126*** 10.821*** 9.150* 7.243*
(2.895) (2.910) (4.739) (4.334)
cons -3.255*** -3.196*** -2.881*** -2.801***
(0.200) (0.204) (0.143) (0.162)
chi2 (Prob.>chi2) F (Prob.>F)
205.57 210.25 3.49 9.42
<.0001 <.0001 <.0001 <.0001
obs 801 790 269 426
Note: ***: significant at 0.01 level; **: significant at 0.05 level; *: significant at 0.1 level.
Numbers in parentheses are the standard error of the coefficients.

58
The results are not consistent with the hypothesis that predicts that the restraining
impact of demand uncertainty would be mitigated in franchising firms. This phenomenon
can be explained as an agency problem. Though the guideline of investment is specified in
a franchise agreement, certain investments like remodeling “depend(s) on the ability, and
willingness, of franchisees to accelerate the remodeling of their existing restaurants”
(Burger King Worldwide Inc., 2013), implying that franchisees have discretion, to some
degree, over capital investment decisions. When a franchisee upgrades its restaurant, the
benefits, for which the franchisee pays the full cost, would be shared with other franchisees
through shared brand.Thus, each franchisee would be inclined to refrain from making an
investment and free-ride on other franchisees’ investments (Brickley & Dark, 1987;
Williamson, 1989). This free ride problem applies to all investments that strengthen the
brand and that cannot be specified by the franchisor (Mathewson & Winter, 1985). A
similar argument applies between the franchisor and franchisees. Certain investments the
franchisor makes will have some spillover benefits to franchisees. Thus, suspecting
franchisees’ free-riding behavior, the franchisor may avoid making investments, and it can
be expected that this tendency would be reinforced when the profitability of investment
cannot be guaranteed due to high uncertainty. However, for nonfranchisors spillovers are
maintained within the firm. As they do not share the gains with franchisees, they are likely
to invest more, and it seems to allow more room for nonfranchisors to take risks and
increase investments in a low to moderate uncertainty environment, as shown in Figure 3.4.
In a similar vein, Michael (2000) shows that advertising falls with the degree of franchising
in both hotel and restaurant industries.

59
Figure 3.4 Demand uncertainty, franchising, and investment
Next, it was examined whether the effect of demand uncertainty on investment
varies between limited- and full-service restaurants. To improve homogeneity of the
sample, data of nonalcoholic beverage bars (NAICS 722515) and buffet chains were
excluded from the sample. Table 3.12 displays two-way descriptive statistics of two
segments across different levels of uncertainty. As hinted in the previous results, no
significant change in investment is detected between the low- and medium-level
uncertainties. Both segments considerably decrease investment in times of high uncertainty.
When compared by the uncertainty level, however, the difference in investment between
the two segments is not crystal clear. When uncertainty is low full-service restaurants
significantly invest more, but the gap becomes less apparent with increasing uncertainty.
-4.5
-4.3
-4.1
-3.9
-3.7
-3.5
-3.3
-3.1Low Uncer High Uncer
Non- Franchisors Franchisors

60
Table 3.12 Two-way descriptive statistics
Uncertainty level ANCOVA
1 2 3 4 5 Total (F-value)
Limited Mean -2.812 -2.844 -2.597 -2.551 -3.618 -2.885 15.46
Med -2.585 -2.740 -2.422 -2.717 -3.352 -2.762 ***
obs 52 50 57 54 55 268
Full Mean -2.390 -2.323 -2.421 -2.410 -3.519 -2.525 47.11
Med -2.280 -2.238 -2.309 -2.316 -3.359 -2.379 ***
obs 151 152 146 148 84 680
Total Mean -2.498 -2.452 -2.470 -2.448 -3.558 -2.627 66.86
Med -2.344 -2.298 -2.393 -2.363 -3.352 -2.492 ***
obs 203 202 203 202 139 949
Difference
(L-F)
-0.423 -0.521 -0.176 -0.141 -0.099 -0.360
t-test -2.356
***
-3.049
***
-1.018 -0.803 -0.471 -4.264
Note: ***: significant at 0.01 level; **: significant at 0.05 level; *: significant at 0.1 level.
In Table 3.13, this study run four specifications to test the conditional effect of the
segment. As in the test of the moderating effect of franchising, Panel A is the Hausman–
Taylor estimators and Panel B is the fixed-effect estimators with AR (1) disturbances.
Panel A presents the regression coefficients of the baseline model and the interaction model
extended by the interaction term.

61
Table 3.13 Interaction model (Uncertainty and segment)
Panel A Panel B
Base Interaction Limited Full
UNCER -0.628*** -0.828*** -1.310** -0.689***
(0.179) (0.284) (0.510) (0.271)
UNCER2 -2.021*** -0.858 0.168 -3.038***
(0.430) (0.702) (1.304) (0.628)
SEG 0.377* 0.506**
(0.198) (0.210)
UNCER×SEG 0.220
(0.295)
UNCER2×SEG -1.574**
(0.760)
Q .088*** 0.089*** .095** .049
(0.016) (0.017) (0.040) (0.031)
CF 3.298*** 3.200*** 1.289 2.204***
(0.505) (0.503) (1.159) (0. 148)
INDGR -5.532* -5.188* -4.500 -15.628***
(3.008) (2.924) (7.230) (3.398)
GDP 11.462*** 11.220*** 3.963 9.266**
(3.008) (3.002) (7.344) (3.620)
cons -3.653*** -3.748*** -3.827*** -2.625***
(0.235) (0.240) (0.322) (0.111)
chi2 (Prob.>chi2) F (Prob.>F)
186.53 191.01 2.97 9.59
<.0001 <.0001 0.009 <.0001
obs 747 747 177 469
Note: ***: significant at 0.01 level; **: significant at 0.05 level; *: significant at 0.1 level.
Numbers in parentheses are the standard error of the coefficients.

62
In comparison with the base model, in the interaction model, the linear uncertainty term
(UNCER) is negatively significant but the quadratic term (UNCER2) lost
its significance.
When it comes to interaction terms, only the quadratic-by-linear interaction
coefficient (UNCER2×SEG) is statistically significant. The negative coefficient indicates
that compared with limited-service restaurants the average investment of full-service
restaurants falls more rapidly as the uncertainty increases, implying that full-service
restaurants’ investments are more adversely affected by demand uncertainty than limited-
service restaurants and the gap widens along with the growing uncertainty.
Figure 3.5 visualizes the moderating effect of segment. As suggested by the
negative coefficient of the quadratic-by-linear interaction term (UNCER2×SEG) in Table
3.13, the investment rate of full-service restaurants drops more steeply than that of limited-
service restaurants for moderate to high levels of uncertainty.

63
Figure 3.5 Demand uncertainty, segment, and investment
3.5 Conclusion
This study investigated how restaurant firms coordinate their fixed investment in
the face of demand uncertainty. Four principal findings emerged: The sign of the demand
uncertainty–investment relationship is negative. Consistent with prior studies, restaurant
firms postpone fixed investment when it is hard to predict the industry demand. The
association, however, is not linear. More specifically, the restricting effect of uncertainty
is trivial or moderate for low levels of uncertainty but becomes stronger for high levels of
uncertainty. Put differently, investment outlay drops more quickly in periods of high
uncertainty. Follow-up tests checked whether the uncertainty–investment relationship is
conditional on industry-specific nature: franchising and segment. According to the results,
-4.8
-4.6
-4.4
-4.2
-4
-3.8
-3.6
-3.4
-3.2
-3
-2.8
Low Uncer High Uncer
Limited-service Full-service

64
franchising chains consistently make smaller investments than nonfranchisors but there is
no significant difference between the two groups in terms of the degree of the
responsiveness of investment to uncertainty. When it comes to segment, full-service
restaurants are more adversely affected by demand uncertainty than limited-service
restaurants, a finding that is in line with previous literature which argues that limited-
service restaurant chains have a lower income elasticity of demand and thus outperform
full-service counterparts in recessions (Youn & Gu, 2009).
The current study offers evidence that the impact of uncertainty on investment is
not simply linear as implicitly assumed by most prior empirical research. However,
because of the fact that the data are from a single industry, the generalizability of the
conclusion is limited. Hence, future research that applies the nonlinear relationship to other
industries and with other kinds of uncertainty is warranted to verify whether it is a general
phenomenon or a unique situation of the restaurant industry. Furthermore, although this
paper provides theoretical support for the nonlinear association of demand uncertainty and
investment, the dynamics between competition, irreversibility, and uncertainty has yet to
be verified.
It has been argued that franchise contracts allow franchisors to reduce their business
risk with franchisees through a sharing agreement. Franchisors share in the success of
franchisees through royalty fees, which are tied to sales revenue of a franchised outlet and
thus are more predictable and free from any cost inefficiency on the franchisee’s side
(Caves & Murphy, 1976). Similarly, Koh, Rhou, Lee, and Singal (2015) argue that
franchising restaurant chains have a lower earnings volatility, and are less vulnerable to

65
economic conditions. Moreover, franchisors can spread their business risk by
opportunistically owning profitable stores while franchising unwanted units (Martin, 1988).
In this aspect of the risk-sharing element of franchising, it was initially assumed that
franchisors would be less affected by the adversity of demand uncertainty. However, the
results do not confirm such a shield effect of franchising. Franchising companies exhibit
the same responsiveness to uncertainty as nonfranchising firms. A potential reason lies in
the free-riding problem. Because the fruits of investment spill over to other franchisees
through a shared brand, a franchisee has an incentive to free ride on other franchisees and
franchisor’s investment. This phenomenon would be strengthened when uncertainty is high
and thus it becomes more difficult to anticipate other franchisees’ actions. Concerned about
such an opportunistic behavior of franchisees, a franchisor may refrain from investment.
Under the franchising agreement, a franchisor shares both risks and benefits with
franchisees. The findings here suggest that the advantages of franchising may be swamped
by the perceived cost associated with free-riding behavior of franchisees.
Some additional results warrant discussion. According to the analysis of the
conditional effect of segment, the quadratic term of uncertainty is insignificant for limited-
service chains. This indicates that the nonlinear relationship is caused by full-service
restaurants. As mentioned before, the value of real option erodes in a competitive market
characterized by low seller concentration (Grenadier, 2002). While the limited-service
segment is dominated by a small number of gigantic chains, such as McDonald’s and Yum
Brand, the full-service segment is a comparatively more atomistic market. In 2013, 13
limited-service chains in the sample account for 10.3 percent of the market, whereas 23

66
full-service chains account for 4.7 percent, suggesting fiercer competition among the full-
service firms. Hence, when uncertainty is low, the fear of preemption may offset the value
of waiting, loosening the uncertainty–investment relationship in full-service restaurants.
Another explanation can be found the degree of heterogeneity of products. If two
firms sell similar products, they attract the same groups of customers. Hence, shocks on
demand would affect the firms’ demand functions in mostly the same manner. Conversely,
if the goods are differentiated, the firms deal with different types of customers. This
suggests that the heterogeneity of the products decreases the correlation between demand
functions of different firms, and thus the firms’ demand functions would respond
differently to shocks on the demand side (Raith, 1996). Compared to the full-service
restaurants, the limited-service restaurants are more standardized in terms of menu
offerings, service quality, and atmosphere. Aware that other firms in the same segment face
similar demand curves, limited-service restaurants may find it risky to be aggressive in
making fixed investments because if the market gets worse it will be difficult to dispose of
idle equipment as everybody else would struggle too. However, the more variation exists
in demand curves among firms in the segment, the greater possibility would be there that
unwanted used equipment can be sold to other companies, reducing the risk associated with
investment made when the environment is uncertain.

67
CHAPTER 4. PEER EFFECT ON INVESTMENT
4.1 Introduction
When making a decision on investment projects, most corporate finance textbooks
suggest calculating the net present value (NPV). If the NPV of the project is greater than
zero, that is, the sum of discounted future cash flows to be generated by the project is larger
than the initial cost, the standard rule-of-thumb is to make that investment. Otherwise,
disregard the plan. The q theory of investment is logically similar to the NPV rule. An
investment project should be undertaken if and only if the market value of the project
exceeds the cost. So for values of q, which is the market value of the capital relative to its
replacement cost, greater than 1 promote investment, but values less than 1 deter
investments (Tobin & Brainard, 1977). What is common between the two theories is that
an investment plan should be appraised based on its expected value and cost. However, as
described further on, there are theories that indicate a firm’s investment behavior cannot
be understood in isolation.
In the presence of a clear imperative about what is efficient, managers would be
able to see the imperative and respond accordingly (Roberts & Greenwood, 1997).
However, combined with managers’ bounded rationality, increases in ambiguity about the
economic efficacy of a decision make it nearly impossible for decision makers to

68
assess the full-range of possible situations and predict the consequences of their decisions
(Lieberman & Asaba, 2006). Accordingly, managers are led to search for cues from
successful competitors or past actions and depend on social norms for guidance (Nickerson
& Silverman, 2003; Oliver, 1997).
No firm exists in a vacuum. As long as it participates in a market with others, they
inevitably influence and are influenced by each other. Thus, without taking the peer effect
into account, our understanding of corporate behavior must be limited. Based on this line
of reasoning, this study purports to examine the peer effect on corporate investment in the
restaurant industry- whether a firm’s investment is affected by its peers’ investment
activities; if so, what motivates them to do so?; and are the investment outcomes different
between peer-sensitive and less-sensitive firms? These are the main questions to be
explored.
4.2 Theoretical Background and Hypotheses
4.2.1 Peer Effect on Investment
Tarnishing the economists’ long-standing belief in the rational agent, behavioral
economists offer abundant evidence about bounded rationality (Conlisk, 1996). Simon
(1955, 1972) point out the limits of rationality and proposes bounded rationality as the
replacement. Rationality can be bounded for several reasons. Uncertainty and risk
associated with demand or input factors and incomplete information about alternatives
make it difficult to calculate the optimum. Moreover, human capacity for computation for

69
finding the optimum has its limit in considering all the complexity inherent in the cost
function and other environmental constraints. Thus, individuals are naturally led to settle
for approximate optimal solutions given the tradeoff between judgmental accuracy and
information search and computational cost (Pitz & Sachs, 1984; Smith & Walker, 1993).
It is not difficult to find empirical evidence that shows corporate investment
decisions are subject to managers’ bounded rationality. According to the survey from
(Graham & Harvey, 2001), CFOs indicate that they shy away from the NPV method,
probably the most well-known investment criterion. Despite the theoretical superiority of
NPV, CFOs actually prefer internal rate of return and payback period methods, which are
much less sophisticated than NPV and do not require calculation of cost of capital and
future cash flows. The authors additionally find that among managers who use discount
methods, an overall firm-level discount rate is more widely adopted than a project-specific
discount rate. Krüger, Landier, and Thesmar (2011) argue that such practice can lead to
investment distortions. They provide evidence that firms using a single discount rate within
the firm tend to overinvest in risky departments and underinvest in safe ones. The
investment rate is positively associated with the spread between department beta and firm
beta.
Another theoretical background of the peer effect can be found in institutional
theories. Institutional theorists view organizations as “living” forms that are adaptively
changing in response to influences and constraints imposed by external environment and
to the characteristics and behavior of other participants functioning in the environment
(Selznick, 1957). A common feature observed in multiple perspectives on

70
institutionalization is that institutionalization is regarded as a social process by which
participants come to accept shared norms, irrespective of the actor’s own beliefs or actions.
The norms are taken for granted as the “way things are” or the “way things are to be” (Scott,
1987). As Zucker (1983) puts it, institutionalization is rooted in conformity in search of
legitimacy. The mere fact that many peer organizations adopt a certain innovation can grant
legitimacy to the adoption of the innovation even without information about the economic
gain to be earned from it. When this happens, non-adopters under the institutional pressure
come to follow the similar path not because of economic interest but because of fear of
being regarded as illegitimate or abnormal and thereby losing access to external resources
(Meyer & Rowan, 1977).
Institutional isomorphism explains an organization’s isomorphic changes triggered
by its need for conformity. Isomorphism refers to “a constraining process that forces one
organization in a population to resemble other organizations that face the same set of
environmental conditions” (Hawley, 1968; Siegel, Agrawal, & Rigsby, 1997). The process
of isomorphism implies that organizations operating in the same field become increasingly
homogeneous over time. Institutional isomorphism accounts for a considerable portion of
corporate decisions that cannot be explained solely by rationality-based economic theory,
such as transaction cost economics (TCE), as organizational endeavors towards conformity
does not necessarily result in enhanced efficiency (Jones, Kosnik, & George, 1993; Moran
& Ghoshal, 1996). Martinez and Dacin (1999) argue that the efficiency maximization of
TCE is more suited for managerial decision-making that involves more certain and
identifiable transaction costs but not for decisions featured with uncertainty surrounding
71
the costs or outcomes, such as innovation (Moran & Ghosal, 1996). Investment involves
uncertainty in that the expected payoff may or may not materialize. As previously
mentioned, high irreversibility of capital investment can aggravate the influence of
uncertainty associated with investment.
Not only institutional forces but also managers’ personal concerns about their
reputation can lead them to behave similarly to other peers. Hirshleifer (1993) argues that
managers may exploit investment projects as a way of establishing their reputation. Since
managers care about their reputation as a decision maker, they are reluctant to deviate from
other managers even if the decision is against substantive private information about the
investment project. They choose to “follow the herd” and share loss with many others
rather than to be an eccentric who unconventionally succeeds (Scharfstein & Stein, 1990).
Lastly, competition can also stimulate mimetic behavior among firms. According
to the prospect theory, for most individuals, a bad outcome outweighs a good outcome of
same utility (Kahneman & Tversky, 1979). Borrowing this schema, Abrahamson and
Rosenkopf (1993) argue that organizations would choose to avoid being at a competitive
disadvantage rather than to achieve a competitive advantage with equal returns. Such
inclination to prevent the worst scenario of falling behind the average performance may
drive organizations to behave likewise, creating a competitive bandwagon pressure.
Similarly, Gilbert and Lieberman (1987) show that firms make investments to protect their
share in the industry. This implies that capital investment of some firms would provoke
their competitors to increase capacity so that there is no significant variation in market
shares. If competitors provide more value to customers through investment, the firm would

72
feel urged to do the same thing in order to be on a par with its competitors. Behind the rush
of burger giants’ costly cosmetic remodeling, lies a fear of being left behind (Nichols,
2013). Such a desperate situation facing the restaurant industry is well summarized in the
following comment.
“In the ailing restaurant industry, it’s a game of market share in the U.S. With
little room to open new restaurants in a country…, growth comes from stealing
customers from one another” (Jargon, 2012 as cited by Gara, 2012).
Akdoğu and MacKay (2012) demonstrate that competitive market forces lead firms
to coordinate investment. In their setting, firms tend to make similar investments when the
risk of falling behind outweighs the cost of duplication. The restaurant industry is
characterized with intense competition, low entry barrier (Zwolak, 2010), and short life
cycle of product (Tse & Olsen, 1988). Switching cost of customers is also relatively low
compared to other consumer service industries, such as banking and telephone
communications. Thus, restaurant firms constantly invest and transform themselves in
order to not be left behind in the saturated market (Nichols, 2013). By contrast, the cost of
duplication is relatively low. Compared to manufacturing or high-technology industries of
which capacity expansion is usually lumpy requiring huge capital commitment and a years-
long construction period, opening a new restaurant can be done in a shorter time span with
less cash.
H1: A restaurant firm’s investment is positively affected by the investment of its
peers.

73
Individuals are more likely to imitate others when optimization is costly or time-
consuming and their own information is noisy (Banerjee, 1992; Conlisk, 1980).
Uncertainty makes it difficult for managers to assess the full range of possible situations
and to predict the consequences of their decisions (Lieberman & Asaba, 2006). DiMaggio
and Powell (1983) argue that uncertainty is a powerful force that encourages imitation.
When an organization struggles with a problem with ambiguous causes or unclear solutions,
problemistic search may yield a viable solution with little expense (Cyert & March, 1963).
A line of research in asset pricing literature lends empirical support to the idea. Avery and
Zemsky (1998) specify the dimensions of uncertainty and show that the herding behavior
increases as each uncertainty dimension is added. Chan, Hwang, and Mian (2005) observe
that mutual fund managers tend to show herding behavior when they lack reliable
information about the stocks.
Chief executive officers interviewed by Daft, Sormunen, and Parks (1988) indicate
customers, competitors, and economic sector impose the most considerable strategic
uncertainty, which is measured in terms of importance, complexity and rate of change. The
same paper also reports that the greater strategic uncertainty in environmental sectors, the
more frequently managers scan them (Daft et al., 1988). High-performing firms show
consistently high correlation between strategic uncertainty and scanning frequency. Daft
et al. (1998) reveal that companies view competitors as a source of significant strategic
uncertainty and routinely scan their behavior.

74
As managers perceive higher uncertainty in the competitor sector, they perform scanning
more frequently. For these reasons, the second hypothesis is formulated as follows.
H2: The peer effect is more pronounced when uncertainty is high.
4.2.2 Identification of Peers
The Merriam-Webster defines a peer as “a person who belongs to the same age
group or social group as someone else”. Translated to a business nomenclature, peers
broadly refer to organizations that operate in the same industry or market. In a narrower
sense, peers would probably be regarded as a group of firms doing business in similar
circumstances, such as serving similar groups of customers and deploying similar resources.
Since firms situated in a similar environment are likely to evolve into competitors, this
study relies on the literature for competitor identification and the situation of the restaurant
industry in defining peers.
Chen (2006) defines competitors as “firms operating in the same industry, offering
similar products, and targeting similar customers.” Competitor identification involves
classifying firms on the basis of relevant similarities. A variety of perspectives have been
suggested to conceptualize the “similarities.” For example, resource similarity or market
commonality (Chen, 1996), the supply-based attributes (characteristics of firms) versus the
demand-based attributes (characteristics of consumers) (Clark & Montgomery, 1999), and
market-based and resource-based comparisons (Peteraf & Bergen, 2003).
This study defined quick-service restaurants (QSR), fast casual brands, and casual
dining chains as the sample for testing peer effect. First of all, they compete against each

75
other for similar target customers. According to the industry report by Technomic, a
Chicago-based market research firm, 85 percent of survey respondents reported that they
visit fast-casual brands at least once a month, and 82 percent said they eat at casual-dining
restaurants once a month (Technomic 2013 as cited by Brandau, 2013). That is, fast-casual
brands and casual-dining chains are both available options for many customers.
Particularly, when the economy collapses, many diners trade down for more affordable
dining options; competition among the three segments is more intensified. Indeed, as
casual-dining traffic counts declined considerably during and after the recent recession,
QSRs and fast-casual brands were targeting the customers in limbo and trying to gain
market shares. To attract the customers who are price-minded but concerned about the
quality of food and environment at the same time, limited-service restaurants infused
casual-dining traditions into their menu, dining-experience, and environment while
maintaining key appealing features including convenience, efficiency, and affordability
(Brandau, 2014c).
Strategic similarity increasingly observed in those three segments is another reason
for the peer identification in this essay. Gimeno and Woo (1996) argue that inter-firm
rivalry increases with the degree of strategic similarity and multimarket contact. Given the
even level of multimarket contact, strategic similarity intensifies rivalry because strategic
similarity is often associated with greater product substitutability (d'Aspremont,
Gabszewicz, & Thisse, 1979) and the lack of unique resources. Explosive growth of the
fast-casual segment has outshined the overall restaurant industry over the past few years.
Total U.S. sales revenue of fast casual restaurants has consistently grown from to $30

76
billion in 2013, and is still pictured with rosy forecasts of a 26.7 percent of growth, reaching
$38 billion in 2018 (Mintel, 2013). Inspired and partly threatened by the success of fast-
casual restaurants, QSRs have been scrambling to adopt fast-casual concepts, such as
healthful menus featuring low-calorie and high-protein items, customization options, and
sophisticated décor (Mintel, 2013; Ries, 2013; Walkup, 2007). Casual dining restaurants
have also aggressively penetrated this segment via diverse limited time offers and low-
priced and small-portion menus (Mintel, 2013). A comment of a restaurant analyst
manifests the tension in this segment, "Fast casual concepts have been stealing share from
fast food and they have raised the bar for fast-food restaurants, which are trying to step up
and compete," said Bonnie Riggs, restaurant analyst for NPD Group Inc. (Jargon, 2012).
All the evidence implies that QSRs, fast casuals, and casual dining restaurants experience
the isomorphic pressure.
Lastly, strategic movement is easily noticed and imitable in most cases. This means
that innovative strategies can spread quickly and thus are likely to be institutionalized in a
relatively short period. For instance, McDonald’s inventive introduction of breakfast items
and coffee beverages was quickly copied by Burger King, Wendy’s, Jack in the Box and
Taco Bell (Jennings, 2014). Renovation is no exception. Not only QSRs but also many
casual dining brands have joined the rally of renovation to rejuvenate the brand and boost
sales (Ruggless, 2012, 2013). New restaurant interior concepts and the news of remodeling
projects and outcomes are quickly distributed through trade magazines and industry news
media.

77
Lastly, size is considered as one more criterion of peer identification. Firm size has
been regarded as an important characteristic in organizational research (Chen & Hambrick,
1995) and has been referred to as one of classification variables in strategic groups research
(Lewis & Thomas, 1990). Clark and Montgomery (1999) reported that size was one of top
ten attributes managers used in identifying competitors. To improve the similarity in size,
the firms in the top and bottom deciles of the distribution of net sales revenue were
excluded from the sample. This step decreased the variance of size from $2,860 to $469
million.
4.2.3 Motives for Following Peers
Mimetic isomorphism emphasizes the role of uncertainty as a strong facilitator of
imitation (DiMaggio & Powell, 1983). Ambiguity and uncertainty surrounding goals or
environments can lead organizations to model themselves on other organizations that they
perceive to be successful. When uncertainty hinders a search for optimal solutions,
imitating well-established institutions would fetch them legitimacy, which comes to be
critical for organizational survival. Thus, the greater the need for legitimacy, the more
prone is the organization to mimetic isomorphism.
It is likely that organizations with concerns for survival imitate successful
competitors to achieve legitimacy and thereby get access to necessary resources. Firms that
face immediate concerns for survival would put higher priority on legitimacy
considerations than on efficiency considerations (Meyer & Rowan, 1977). When survival
is less assured, the need to acquire critical resources can lead the firm to weigh and act on

78
certain imperatives, such as legitimacy, at the sacrifice of long-run efficiency (Martinez &
Dacin, 1999). Similarly, Leary and Roberts (2014) argue that firms that have greater
learning motives and perhaps greater need to earn reputation tend to follow successful
leaders in setting capital structure. They found that less successful firms are sensitive to
changes in capital structure of leaders but not vice versa.
In a similar vein, making decisions to expand or stay still is not always clear.
Despite their logical appeal, it is a general notion that NPV and q theory do not come in
handy for managers. For example, in case of NPV, it is not a simple task to estimate the
future cash flow stream and relevant cost of capital of a particular project. Moreover, NPV
does not take into consideration the value of real option attached to the project. When it
comes to q theory, calculating the marginal market value to be created by a focal project is
usually not feasible. Furthermore, stock prices can be contaminated by fads and bubbles.
Such difficulty would be more prevalent amongst young, small, and less successful firms
that probably do not have well-established process for investment decision making.
Consequently, it is predicted that less successful firms would follow their successful peers
in making investment decisions but not vice versa. Stated formally,
H3: Less successful firms are responsive to the investment activity of successful
peers but not vice versa.
The hypothesis testing results for H1 and H3 would cast light on the underlying
reasons for peer effect. If the null hypothesis of only H1 and not of H3, is rejected,
competition-based view or managers’ reputation concerns can explain the imitation

79
behavior. On the other hand, if both null hypotheses are rejected, learning or legitimacy-
seeking motives would provide additional account for the mimicry.
4.2.4 Investment Outcomes of Peer-Sensitive Firms
So far it has been argued that restaurant firms’ investments are influenced by those
of peers. Managers would be left with a final question whether I should follow my peers
or invest against the tide. Answering the question requires assessing the investment
outcomes of peer-influenced group and of the counterpart. However, it is not a simple task
to single out firms that actually follow other peer firms through an indirect approach using
secondary data. This study gets around this problem by evaluating the investment outcomes
of peer-sensitive and less sensitive firms, where the sensitivity is measured as correlation.
Firms whose investment spending is influenced by their peers are likely to have a high
correlation with that of peers, but the opposite does not necessarily hold. Therefore, by
investigating the performance implications of investment of peer-sensitive and less-
sensitive firms, the current study can indirectly examine the consequences of following
peers.
Banerjee (1992) argues that herding behavior suppresses the use of personally-
collected information and thus causes a reduction of informativeness, harming social
welfare and impairing decision making. In this setting, society may benefit from businesses
making individual decisions based on their own information gathering. Consequently,
imitating behavior leads to inferior information aggregation and overall impaired decisions
(Banerjee, 1992; Bikhchandani, Hirshleifer, & Welch, 1992; Welch, 1992). Lieberman and

80
Asaba (2006) argue that by reducing the variation in firms’ strategies mimetic behavior
inflates the collective risk of the industry when the environment is uncertain. Firms that
pursue a differentiation strategy and market position can be insulated from the actions of
rivals. This can lower the likelihood of mimicry and improve profitability.
Renovating or opening restaurants around the same time with competitors will
increase competitive interference, diminishing the returns on investment. As previously
mentioned, a significant number of QSRs and casual dining restaurants have carried out
large renewal projects. The renovation concept is quite similar between brands: updated
exteriors and modernized dining areas decorated with features such as wall-mounted TVs,
Wifi and lounge seating (Nichols, 2013). The similarity of renovation designs across
different chains may take away the limelight of each brand’s fresh reimaged units, causing
a detrimental effect on the effectiveness of investment (Burke & Srull, 1988). In addition,
rivalry-based imitation raises the intensity of competition and reduces profitability (Barreto
& Baden‐Fuller, 2006; Deephouse, 1999). In a study that examines the branching behavior
of the Portuguese banking industry, Barreto and Baden-Fuller (2006) found that mimetic
branching imposes a negative effect on the profit margin.
H4: Investment of peer-sensitive firms is not as effective as that of less peer-
sensitive firms.

81
4.3 Methodology
4.3.1 Estimating Peer Effect on Investment
The specification can be represented by the following investment model extended
by the variables of demand uncertainty and peers’ average investment:
𝐼𝑁𝑉𝑖,𝑡 = 𝛼𝑖 + 𝛽1𝐼𝑁𝑉̅̅ ̅̅−̅𝑖,𝑡−1 + 𝛽2𝑈𝑁𝐶𝐸𝑅𝑡−1 + 𝛽3𝑄𝑖,𝑡−1 + 𝛽4𝐶𝐹𝑖,𝑡−1 +
𝛽5𝐼𝑁𝐷𝐺𝑅𝑡−1 + 𝛽6𝐺𝐷𝑃𝑡−1 + 휀𝑖,𝑡 Eq. 4.1
INV is the capital expenditure net of depreciation expense, scaled by total assets in the
previous period; 𝐼𝑁𝑉̅̅ ̅̅−̅𝑖 is the average of the investment ratio of peers excluding that of the
own firm; Q is the Tobin’s Q, which is the market value of assets to the replacement cost.
It was calculated following Chung and Pruitt (1994); CF is cash flow defined as the ratio
of earnings before extraordinary items plus depreciation and minus dividends to the total
assets in the previous period; INDSG is industry sales growth, which is the log difference
of the U.S annual retail sales of limited-service eating places; GDP is the annual real GDP
growth rate.
A major issue in assessing peer effect is to control for the possibility that the peer
effect falsely picks up the impact of other investment determinants. Differently put, firms
can make similar investments not because they imitate competitors but because they see
similar opportunities. To prevent such “spurious” peer effect, this study included average
Q, industry sales growth, and real GDP growth, all of which were to control the firm’s
investment opportunities. Theoretically, Q should capture all investment opportunities and
challenges a firm is faced because the value of all information relevant to the firm, either

82
it is public or private, should be appropriately reflected in the firm’s stock price (Fama,
1970; Tobin & Brainard, 1977). Nevertheless, two more filters were added, industry and
GDP growth. They help to capture the investment opportunity that all firms face, and Q is
to reflect residual firm-specific investment opportunities. Lastly, the model was augmented
by CF, which was to control for the resource for investment.
Furthermore, additional moderating models were tested in order to check that
demand uncertainty plays a role on peer-driven investment.
𝐼𝑁𝑉𝑖,𝑡 = 𝛾i + 𝛽1𝐼𝑁𝑉̅̅ ̅̅−̅𝑖,𝑡−1 + 𝛽2𝑈𝑁𝐶𝐸𝑅𝑡−1 + 𝛽3𝐼𝑁𝑉̅̅ ̅̅
−̅𝑖,𝑡−1 × 𝑈𝑁𝐶𝐸𝑅𝑡−1 + 𝛽4𝑄𝑖,𝑡−1
+ 𝛽5𝐶𝐹𝑖,𝑡−1 + 𝛽6𝐼𝑁𝐷𝐺𝑅𝑡−1 + 𝛽7𝐺𝐷𝑃𝑡−1 + 휀𝑖,𝑡 Eq. 4.2
4.3.2 Motives for Following Peers
In reference to Leary and Roberts (2014), sample firms were classified into two
groups, leaders and followers, according to three criteria: size, profitability, and q. More
specifically, sample firms were divided into quintiles each year based on their ranking in
the three performance measures: the top two quintiles were regarded as “leaders” and the
bottom two deciles as “followers”. Then, the investment rates of followers were regressed
on those of leaders and vice versa.
𝐹𝐼𝑁𝑉𝑖,𝑡 = 𝛼𝑖 + 𝛽1𝐿𝐼𝑁𝑉̅̅ ̅̅ ̅̅−̅𝑖,𝑡−1 + 𝛽2𝑈𝑁𝐶𝐸𝑅𝑡−1 + 𝛽3𝑄𝑖,𝑡−1 + 𝛽4𝐶𝐹𝑖,𝑡−1 + 𝛽5𝐼𝑁𝐷𝐺𝑅𝑡−1
+ 𝛽6𝐺𝐷𝑃𝑡−1 + 휀𝑖,𝑡 Eq. 4.3
𝐿𝐼𝑁𝑉𝑖,𝑡 = 𝛼𝑖 + 𝛽1𝐹𝐼𝑁𝑉̅̅ ̅̅ ̅̅−̅𝑖,𝑡−1 + 𝛽2𝑈𝑁𝐶𝐸𝑅𝑡−1 + 𝛽3𝑄𝑖,𝑡−1 + 𝛽4𝐶𝐹𝑖,𝑡−1 + 𝛽5𝐼𝑁𝐷𝐺𝑅𝑡−1
+ 𝛽6𝐺𝐷𝑃𝑡−1 + 휀𝑖,𝑡 Eq. 4.4

83
FINV (LINV) is the investment rate of a firm in the follower (leader) group; 𝐿𝐼𝑁𝑉̅̅ ̅̅ ̅̅ ̅
(𝐹𝐼𝑁𝑉̅̅ ̅̅ ̅̅ ̅) is the leader (follower) firm average investment rate.
4.3.3 Investment Outcomes of Peer-Sensitive Firms
The sensitivity of investment of the focal firm to its peers was captured by the
correlation between the firm’s investments at time t and its peers average investment rates
at time t-1. Firms whose data points are less than five were excluded from the correlation
calculation. Once the correlation coefficients were obtained for each firm, the sample firms
were divided into three groups, and the firms on top (bottom) third are denoted as peer-
sensitive (less peer-sensitive) firms. Based on the classification, a binary indicator is
created.
𝑃𝑆 (𝑃𝑒𝑒𝑟‐ 𝑆𝑒𝑛𝑠𝑖𝑡𝑖𝑣𝑒)𝑖,𝑡 = {1 𝑓𝑜𝑟 𝑝𝑒𝑒𝑟‐ 𝑠𝑒𝑛𝑠𝑖𝑡𝑖𝑣𝑒 𝑓𝑖𝑟𝑚𝑠 0 𝑓𝑜𝑟 𝑙𝑒𝑠𝑠 𝑝𝑒𝑒𝑟‐ 𝑠𝑒𝑛𝑠𝑖𝑡𝑖𝑣𝑒 𝑓𝑖𝑟𝑚𝑠
To test whether there is a significant difference in the investment outcome, here it
is market share, the following multiplicative interaction model is developed.
𝑀𝑆𝑖,𝑡 = 𝛼 + 𝛽1𝑀𝑆i,t−1 + 𝛽2𝐼𝑁𝑉𝑖,𝑡−1 + 𝛽3𝑃𝑆𝑖,𝑡−1 + 𝛽4𝑃𝑆𝑖,𝑡−1 × 𝐼𝑁𝑉𝑖,𝑡 +
𝛽5𝑃𝑅𝑂𝐹 + 𝛽6𝐺𝐷𝑃 + 휀𝑖,𝑡 Eq. 4.5
MS is expressed as a fraction and is calculated as the firm’s sales revenue divided by the
U.S. retail sales of food services and drinking places; and PROF is the operating profit
margin, which is operating income after depreciation over sales revenue; GDP is the annual

84
real GDP growth. The subscript i indexes firms, and t, time. To mitigate skewness, the
natural log-transformation was taken for the variables MS and INV.
To prevent the fixed-effect model automatically removing the effect of time-
invariant regressors, the Hausman-Taylor estimator was used as in the first study (Hausman
& Taylor, 1981).
4.4 Results
4.4.1 Descriptive Analysis
Table 4.1 presents summary statistics for the main variables. For descriptive
purposes, natural (unlogged) numbers are reported for INV and PEER. The variable PEER
has a smaller variance than INV because PEER is an aggregated investment rate of entire
firms but the focal firm in the group. PS is the correlation between the investment rate of
focal firm and its peers over the sample period. Firms whose data points are less than five
were excluded from the correlation calculation. There is a large variation in PS from the
lowest -0.959 to the highest 0.906.

85
Table 4.1 Summary statistics
Obs Mean Std. Dev. Min Max
INV 999 0.089 0.132 -0.101 0.645
Q 994 2.687 3.636 0.020 19.445
CF 988 0.114 0.098 -0.431 0.333
PEER 999 0.053 0.025 0.013 0.107
MS 999 0.001 0.001 0.00009 0.008
PROF 999 0.066 0.064 -0.261 0.264
PS 84 0.186 0.496 -0.959 0.906
4.4.2 Main Results
The fixed effect regression results are summarized in Table 4.2. Coefficients and
corresponding standard errors are reported. Column (1) and (2) show the baseline results.
As expected, a focal firm’s investment is negatively associated with demand uncertainty
but positively with peer’s investment. Even after controlling for industry expansion,
economic growth and the firm’s unique investment opportunities and financial resources,
peer effect is significant, suggesting that sample firms adjust investment following their
peers in the market.
Next the conditional effect of uncertainty was examined. Consistent with the
hypothesis, a positive moderating effect of uncertainty is observed in column (3). The
investment model results were also compared between the cases of high and low
uncertainty in column (4) and (5). Observations in the top (bottom) third of uncertainty
estimate distribution were assigned to the high (low) uncertainty group.

86
Table 4.2 Peer effect on investment
(1)
(2)
(3)
(4)
Low
uncertainty
(5)
High
uncertainty
PEER 0.888*** 0.764*** 0.254 1.902***
(0.178) (0.186) (0.498) (0.575)
UNCER -1.329*** -0.668** -0.345 2.114 -0.698*
(0.286) (0.308) (0.338) (1.562) (1.021)
PEER×UNCER 1.091**
(0.486)
Q .084*** 0.098*** 0.096*** 0.303*** -0.006
(0.030) (0.029) (0.029) (0.079) (0.090)
CF 0.613 0.805 0.872 0.590 -1.852
(0.779) (0.765) (0.762) (0.866) (2.498)
INDGR -6.537** -6.333** -11.649*** -23.596** -21.685**
(3.255) (3.191) (3.961) (10.690) (8.752)
GDP 0.452 4.509 7.988** -21.312 33.349***
(3.464) (3.494) (3.807) (21.293) (9.054)
cons -3.110*** -3.231*** -2.941*** 0.015** -1.443***
(0. 118) (0.124) (0.142) (1.003) (0.472)
F-value 6.61*** 10.78*** 10.05*** 3.30*** 4.86***
obs 519 518 518 139 127
Note: ***: significant at 0.01 level; **: significant at 0.05 level; *: significant at 0.1 level.
Numbers in parentheses are the standard error of the coefficients.
In column (4), the PEER coefficient is insignificant, meaning that sample restaurant
firms do not pay much attention to peers’ movement if the market demand is moderately
uncertain. The significant coefficient of Q indicates that investments are made based upon
the firm’s investment opportunities. Conversely, when uncertainty is considerably high,

87
sample firms become highly responsive to peer investment behavior. The fact that Q loses
its statistical significance implies that traditional determinants of investment may be of
little use in explaining investment behavior when managerial decisions are tainted by
substantial uncertainty. All in all, the results support that uncertainty prevalent in the
industry works as a strong motive to imitate peers.
To examine the motive behind the peer effect, the analysis was rerun using the
sample of leaders and followers. Identification of leaders and followers is based on three
criteria: market share, profitability and Q. For each year, this study ranked sample firms
based on their market share and assigned those firms in the top two quintiles as leaders and
those in the bottom two as followers. The same procedure was repeated in terms of
profitability and Q. Table 4.3 presents descriptive summary for leaders and followers.
Leaders are commonly marked with larger market share, higher profitability, Q and cash
flow. The only factor the three criteria do not agree is investment. While leaders based on
profitability and Q make more investments than followers, market share leaders appear to
make less investment. It is probably because several rising stars with small market share
but armed with superior margins and growth prospect are aggressive in investment
activities.

88
Table 4.3 Descriptive statistics for leaders and followers
M/S Profitability Q
Leader Follower Leader Follower Leader Follower
INV Mean -2.885 -2.476 -2.468 -2.745 -2.419 -2.836
Med -2.705 -2.320 -2.344 -2.648 -2.272 -2.706
obs 391 340 455 302 432 324
M/S Mean 0.0065 0.0002 0.0052 0.0009 0.0047 0.0007
Med 0.0030 0.0002 0.0018 0.0003 0.0019 0.0003
obs 531 532 532 528 528 523
PROF Mean 0.094 0.028 0.125 0.003 0.094 0.034
Med 0.084 0.036 0.107 0.020 0.091 0.037
obs 531 532 553 554 546 547
Q Mean 4.137 1.643 4.589 1.347 5.787 0.567
Med 2.876 0.728 3.112 0.757 4.159 0.567
obs 527 521 548 543 546 547
CF Mean 0.130 0.086 0.161 0.047 0.148 0.081
Med 0.133 0.109 0.167 0.071 0.166 0.096
obs 509 495 513 527 506 528
Once leaders and followers were defined, the investment rates of followers were
regressed on the average investment rate of leaders and vice versa in order to see whether
each group is sensitive to the counterpart’s investment activity. The results are reported in
Table 4.4.

89
Table 4.4 Who follows whom?
Market share Profitability Q
Leader Follower Leader Follower Leader Follower
Leader 0.758*** 0.637** 0.290**
(0.243) (0.276) (0.131)
Follower 0.349*** 0.110*** 0.112**
(0.090) (0.033) (0.047)
UNCER -0.333 0.032 -1.182*** -0.993 -0.680* -1.038*
(0.411) (0.551) (0.393) (0.711) (0.401) (0.548)
Q .051 0.151* -0.018 0.204** 0.038 -0.714
(0.042) (0.088) (0.032) (0.087) (0.030) (0.558)
CF 4.559*** 2.950*** -0.127 3.093*** 2.523 3.054*
(1.565) (1.078) (1.641) (1.065) (1.575) (1.715)
INDGR -7.042* -9.300 -5.860 -3.313 -7.069 -22.817***
(4.119) (6.879) (4.119) (8.485) (5.174) (6.466)
GDP 1.798 6.987 3.370 -7.829 6.870* 0.415
(3.842) (7.256) (4.003) (8.719) (3.883) (7.303)
cons -2.868*** -0.734 -2.427*** -1.238*** -3.184*** -1.139***
(0. 159) (0.477) (0.129) (0.384) (0.130) (0.345)
F-value 7.07*** 4.00*** 7.72*** 3.75*** 3.89*** 4.65***
obs 249 192 189 117 203 158
Note: ***: significant at 0.01 level; **: significant at 0.05 level; *: significant at 0.1 level.
Numbers in parentheses are the standard error of the coefficients.
According to the results, both groups are sensitive to each other’s investment
activity. Regardless of performance level, restaurant firms appear to affect and be affected
by one another’s behavior, and this means that the null H3 is rejected. The fact that the
leader group’s investment is still influenced by the follower group suggests that even

90
superior performers are concerned with maintaining the quality and size of their facilities
at par with others and protecting their market share.
Table 4.5 Investment effect on market share of peer-sensitive firms
(1) (2) (3)
MSt-1 0.719*** 0.820*** 0.808***
(0.027) (0.015) (0.015)
INV 0.041*** 0.063***
(0.006) (0.010)
PS 0.138** 0.158**
(0.060) (0.063)
INV×PS -0.036***
(0.012)
PROF 0.502* 0.214 0.215
(0.293) (0.195) (0.193)
GDP -0.528 -0.167 -0.054
(0.486) (0.398) (0.395)
cons -1.957*** -1.289*** -1.385***
(0. 112) (0.122) (0.125)
F (Prob.>F) chi2 (Prob.>chi2)
241.00***a 3525.68*** 3573.43***
obs 558 419 419
Note: ***: significant at 0.01 level; **: significant at 0.05 level; *: significant at 0.1 level.
Numbers in parentheses are the standard error of the coefficients. a Because the Hausman-Taylor requires at least one time-invariant variable in the model, it cannot
be used for the base model with only control variables. Here the fixed-effect model with AR (1) is
employed.
Table 4.5 shows the estimated coefficients of Eq. 4.5. In column (2), the main
effects are reported. Investment and peer-sensitive indicator are both positively associated

91
with market share. That means firms whose investment is relatively more sensitive to
competitors tend to be larger firms. The moderating effect of peer-sensitivity of investment
is presented in column (3). The interaction coefficient of INV*PS is negatively significant,
suggesting that the positive effect of investment on market share is smaller for peer-
sensitive firms. That is, firms whose investment spending moves together with that of rivals
yield a smaller investment return than firms whose investments are less sensitive to peers.
4.5 Conclusion
This study purports to examine the peer effect on corporate investment in the
restaurant industry. Consistent with the hypotheses, restaurant firms appeare to be
influenced by their peers in making investments. After controlling for the effect of Q, cash
flow and industry and economy growth and, the so-called peer-effect emerges as significant.
That is, firms make investment decisions based not only on investment opportunities and
resources they have but also on peers’ investments. The results further reveal that
uncertainty is a powerful force that leads firms to follow peers in making investments.
Additional tests were performed to identify the underlying motives for mimicking
investment behavior. The results reveal that mimetic behavior does not work in one
direction but rather in bilateral direction. This implies that the mimicry is not driven by
learning motives or legitimacy-seeking of less successful players but rather by competitive
motives of firms.
92
Lastly, this study tested the performance implications of investments by peer-
sensitive firms; whether they make better investment decisions. The results suggest that
investment of peer-sensitive firms is not as effective as that of less-sensitive firms in
growing market share. Opening or renovating restaurants simultaneously with rivals can
increase the competitive interference among the brands, and thus may erode the
profitability of investment. This finding, combined with the results associated with H3,
suggests that investment driven by a competitive motive can produce poor returns. This is
in line with extant research that argues the risk of “hop on an investment bandwagon”
(Barreto & Baden‐Fuller, 2006; Grundvåg Ottesen & Grønhaug, 2006). There is a caveat
related to the methodology, however. Here the peer sensitivity was captured by correlation
in a sense that firms following peers are likely to have a high correlation with them.
However, the opposite is not necessarily true. Therefore, the current analysis can offer a
glimpse of the consequences of following peers but does not allows us to reach a definitive
statement.
With regards to this finding, it is worth noting a pitfall of following peers. In 2000’s
most well-known QSR brands competitively carry out large-scale renovation projects, a
convincing example of peer effect. In 2015, Wendy’s sued DavCo, the fourth largest
franchisee, over its refusal to renovate restaurants. DavCo files counterclaim arguing that
the franchisor’s “Image Activation” program is economically infeasible. DavCo claims
that remodeling may create a jump in sales right after re-opening but has failed to yield
sustained return on investment. Moreover, the fact that there have been eight different
remodel designs only in four years since the onset of the renovation project implies that

93
the reimaging initiative had been made in a hasty manner rather than being a well-thought-
out plan (Maze, 2015). This case raises another research topic of worth exploring; examine
how the return on investment has evolved with time and whether it is a sustainable strategy
in the long run.
The findings deepen our understanding about the investment behavior of restaurant
firms under uncertainty. This study casts some light on the human factor of corporate
investment decisions, which has not attracted much attention from hospitality finance
literature. In addition, it contributes to the line of research on managerial decision making.
For example, Tversky and Kahneman (1974) discussed heuristics and biases that are used
by individuals to make decisions under uncertainty, challenging the economists’ long-
standing belief in the rational agent. The peer effect observed in the current study provides
another piece of evidence for managers’ bounded rationality.
In testing the peer effect, the current study took an indirect approach using the
secondary data rather than conduct a direct observation of imitating behavior. Although
well-known investment determinants were controlled, the possibility cannot be completely
ruled out that the peer variable might spuriously capture other residual investment
opportunities. Thus, researchers interested in imitating behavior among businesses may
find real settings in which they can directly monitor a mimicking behavior.
94
CHAPTER 5. FINANCIAL IMPLICATIONS OF INVESTMENT
UNDER DEMAND UNCERTAINTY
5.1 Introduction
As previously argued, delay or retreat of investment is a common approach taken
by firms facing demand uncertainty. In fact, in the face of the recent economic turmoil,
capital expenditure in the restaurant industry plummeted to a record-low level (Lockyer,
2009). However, is this truly the best policy to be pursued?
Uncertainty poses a dilemma for businesses: whether to cut costs and investment
to protect survival in the short-term at the sacrifice of future returns or to maintain (or
increase) investment at the risk of liquidity deficit, hoping to occupy an advantageous
position once the demand bounces back (Silberston, 1983). One line of research that deals
with retrenchment points out the aftermath of retrenchment strategy. By reducing or
forgoing investment projects, firms run the risk not only of losing market share to
competitors but also of threatening foundations for future growth. In a similar vein, another
line of research argues about the strategic value of proactive investment. Firms that regard
crises as opportunities and undertake proactive investment can expand their businesses and
strengthen their competitive advantages over weaker rivals, who are waiting for the
recession to pass.

95
In the line of this reasoning, this final essay examines the effectiveness of
investment made under uncertainty. More specifically, it aims at providing theoretical and
empirical implications and the long-term performance consequences of investment made
under demand uncertainty in terms of growth in sales, market share, and
profit margin.
5.2 Theoretical Background and Hypotheses
5.2.1 Financial Implication of Investment Under Uncertainty
Although there are no direct empirical findings about demand uncertainty and the
effectiveness of investment, given that economic uncertainty rises in recessions and falls
in expansions (Bloom, 2014), the literature on countercyclical effectiveness of investment
indirectly offers a theoretical background.
Retrenchment strategies involve cutting costs or trimming noncore assets (Kitching,
Blackburn, Smallbone, & Dixon, 2009). Studies indicate that retrenchment is a typical
response to performance declines (Denis & Kruse, 2000; Geroski & Gregg, 1997; Robbins
& Pearce, 1992). Declining firms initially need to retrench to stabilize declining
performance with the objective of sustaining the firm's survival and attaining positive cash
flows (Robbins & Pearce, 1992). Shrinking investment might enhance liquidity over the
short run, but is not a panacea. Scholars have noted the long-term hazard of cutback
initiatives. By disposing of assets or forgoing investment plans, firms risk losing the
foundations for growth for post-recession expansion.

96
Geroski and Gregg (1997) found that firms that implemented cutting back practices
or abandoned their investment plans were hit harder and experienced greater difficulties
during recovery. In contrast, firms that engaged in new product development, process
innovation and training to solidify their competitive strengths outperformed rivals.
Similarly, Accenture, a market research firm, reported that the top performers in the period
following the early‐1990s recession were those who made strategic investments, developed
new market or customer niches, and experimented with new business models (Accenture,
2003).
Srinivasan, Rangaswamy, and Lilien (2005) proposed a concept of proactive
investment, which is the development and execution of investment initiatives in downturns
as the reflection of the firm’s interpretation of recession as an opportunity to strengthen
and establish their advantages over weaker competitors. They examined the antecedents
and consequences of proactive investment in terms of marketing, and found that firms that
have a proactive marketing response in a downturn achieve superior performance even
before the downturn ends. Similarly, other scholars observe firms that have a strategic
emphasis on proactive marketing and R&D achieve superior business performance after,
even during, the recession (Andras & Srinivasan, 2003; Deleersnyder, Dekimpe,
Steenkamp, & Leeflang, 2009; Steenkamp & Fang, 2011).
In addition, the production cost falls along with decreases in demand for investment
activities. For example, during the recent economic turmoil, rents dropped nearly 66
percent in prime locations (Schrambling, 2009). Moreover, as the average chef salary
decreased 4–16 percent in 2007–2009 (Bell & Martinelli, 2010), restaurant owners could

97
tap a huge pool of talented chefs who were willing to work at a lower wage and gain the
upper hand in negotiations with service vendors (Schrambling, 2009).
Capital investment in the restaurant industry mostly involves construction,
acquisition, maintenance, and refurbishing of restaurants. Other capital expenditures
include investments in information technology systems and production facilities. It has
been argued that the physical environment plays a pivotal role in restaurant patrons’
emotions (Jang & Namkung, 2009; Liu & Jang, 2009), perceived value (Jang & Namkung,
2009; Liu & Jang, 2009), brand image (Ryu, Lee, & Kim, 2012), and behavioral intention
(Auty, 1992). Don Thompson, the Chief Executive Officer of McDonald’s Corp succinctly
puts the importance of physical atmosphere “The look and feel of the restaurants has a
more significant impact on the brand in the near-term People eat with their eyes first”
(Gasparro, 2012b). Alex Macedo, the president of Burger King’s North American system,
said “We recognize that when our guests drive down the street today, they have many
dining options In a competitive market, having a fresh new image is one of the main
ways we can differentiate ourselves” (Brandau, 2014a). Taken together, these findings
suggest that remodeling can be an effective tool for differentiating brands and increasing
the value of the dining experience. Such reimaging efforts would be more easily noted in
times of high uncertainty when competition interference is reduced as most companies
shrink capital expenditure (Danaher, Bonfrer, & Dhar, 2008).
H1: As the level of uncertainty increases, firms that increase the level of
investment would experience better operating performance compared with
when they do in times of low uncertainty.

98
5.2.2 Moderating Effect of Financial Constraint
We have reviewed academic findings of countercyclical effectiveness of
investment. However, is this argument applicable for firms with different conditions?
Probably not. For financially constrained firms such claim may sound like a luxury. It may
be a better choice for them to delay investment projects and reserve funds to get ready for
worse scenarios that might happen.
In the face of demand shocks, financially constrained firms would be more passive
and defensive due to the risk of bankruptcy. Chevalier and Scharfstein (1996) indicate that
firms with high financial leverage tend to shrink investment for building long-term market
share in response to negative shocks to demand because of greater probability of default
while less constrained firms become aggressive in investment to take advantage of the
situation. Investigating the causal relationship between capital structure and pricing
behavior in the supermarket industry during the recession in early 1990’s, Chevalier and
Scharfstein (1996) found that national chains (less financially constrained) dropped
product prices to a greater extent than local or regional chains (relatively more constrained).
Rather, highly leveraged chains increased prices to boost short term profits, resulting in
countercyclical markups. The fact that financially constrained firms become passive in
investment implies that the attractiveness of investment may dissipate in financially fragile
firms.
From the liquidity management perspective, making investments is associated with
increased default risk. Acquisition or construction of new restaurants and remodeling of
existing outlets usually require long-term planning, and execution and commitment of

99
sizable financial resources. Under the U.S. GAAP, capital expenditure is capitalized and
depreciated over the life of the asset, leading to an increase in operating leverage ceteris
paribus. Moreover, given that restaurant firms tend to finance their capital requirements
largely via cash from operations (Basham, 2009) or long-term debt (Jang & Ryu, 2006),
capital expenditures are likely to increase financial burden. When the future prospect of
the market is foggy, maintaining operational and financial flexibility are considered key
objectives (Denis, 2011; Grewal & Tansuhaj, 2001). Thus, extending rigidity of operating
leverage and capital structure in the presence of uncertainty may result in greater default
risk.
Arguably, the less confident (more uncertain) about the future, the greater the need
for flexibility (Jones & Ostroy, 1984). Jones and Ostroy (1984) demonstrate that in the
presence of uncertainty the preference for cash surpasses that for any other type of assets
even when money is dominated by all other assets in terms of return and the reversing cost
of illiquid assets is modest. Particularly, a thirst for liquidity is strong in the foodservice
industry. Parsa, Self, Njite, and King (2005) argue that early failure of restaurants is partly
attributed to the lack of resources that allow them to be flexible and adapt to changing
environments. Moreover, most restaurant businesses operate with a thin level of working
capital and large amount of short-term debt (Mun & Jang, 2015). Given the evidence, it is
predicted that the value of investment would depend on the financial status of the company.
Formally put, the effectiveness of investment will not be as high for financially constrained
firms as for non-financially constrained firms due to the increased default risk involved
with investment spending.

100
H2: For financially constrained restaurant chains, it is lower the positive
interaction effect of demand uncertainty and investment on the firm’s
operating performance.
5.3 Methodology
5.3.1 Variables
Investment Outcomes
This study has argued that firms making investments when others retreat can pull
ahead competitors, suggesting that uncertainty increases the strategic value of investments.
The strategic value can be measured in the context of relative performance. Under
imperfect competition, the commitment of an irreversible investment creates a preemptive
effect, which is discouraging entrants and new investments of competitors, leading to a
gain in market share (Gilbert, 1989). Market share reflects relative performance among
firms and the competitive position of the focal firm within the particular industry. In an
extreme case it is possible to record an increase in market share even when sales growth is
negative if the entire industry suffers from decreasing demand. Market share is expressed
as a fraction and is calculated as the firm’s sales revenue divided by the U.S. retail sales of
food services and drinking places.
𝑀𝑆𝑖,𝑡 =𝑆𝑎𝑙𝑒𝑠 𝑟𝑒𝑣𝑒𝑛𝑢𝑒𝑖,𝑡
𝐼𝑛𝑑𝑢𝑠𝑡𝑟𝑦 𝑠𝑎𝑙𝑒𝑠 𝑟𝑒𝑣𝑒𝑛𝑢𝑒𝑡 Eq. 5.1

101
Another measure of investment effect is operating profit margin. Companies can
take advantage of low investment costs in times of increasing uncertainty as the demand
for investment dwindles. This cost-saving effect would manifest as a form of reduced
depreciation expense, leading to an improved bottom line. However, because most firms
adopt the accelerated-depreciation method (Jagels & Ralston, 2007), it would probably
take time for the cost-saving effect to materialize.
𝑃𝑅𝑂𝐹𝑖,𝑡 =𝑂𝑝𝑒𝑟𝑎𝑡𝑖𝑛𝑔 𝑖𝑛𝑐𝑜𝑚𝑒 𝑎𝑓𝑡𝑒𝑟 𝑑𝑒𝑝𝑟𝑒𝑐𝑖𝑎𝑡𝑖𝑜𝑛𝑖,𝑡
𝑁𝑒𝑡 𝑆𝑎𝑙𝑒𝑠 𝑅𝑒𝑣𝑒𝑛𝑢𝑒𝑖,𝑡 Eq. 5.2
Financial Constraint
Extant literature has relied on individual firm’s susceptibility to capital market
imperfections as a classification scheme for financially constrained firms (Cleary, 2006).
Whited-Wu (WW) index, proposed by Whited and Wu (2006), is a weighted sum of ratios
to estimate the degree of external financing constraint. The higher the index, the more
difficult the firms to obtain external financing.
𝑊𝑊 𝑖𝑛𝑑𝑒𝑥𝑖,𝑡 = −0.091 ×𝐶𝑎𝑠ℎ 𝑓𝑙𝑜𝑤𝑖,𝑡
𝑇𝑜𝑡𝑎𝑙 𝑎𝑠𝑠𝑒𝑡𝑠𝑖,𝑡− 0.062 × 𝐷𝐼𝑉𝑖,𝑡 + 0.021
×𝐿𝑜𝑛𝑔 𝑡𝑒𝑟𝑚 𝑑𝑒𝑏𝑡𝑖,𝑡
𝑇𝑜𝑡𝑎𝑙 𝑎𝑠𝑠𝑒𝑡𝑠𝑖,𝑡− 0.044 × 𝐿𝑛(𝑇𝑜𝑡𝑎𝑙 𝑎𝑠𝑠𝑒𝑡𝑠($𝑚𝑖𝑙)𝑖,𝑡) + 0.102
× (𝐼𝑛𝑑𝑢𝑠𝑡𝑦 𝑠𝑎𝑙𝑒𝑠 𝑔𝑟𝑜𝑤𝑡ℎ𝑡) − 0.035 × (𝑆𝑎𝑙𝑒𝑠 𝑔𝑟𝑜𝑤𝑡ℎ𝑖,𝑡) Eq. 5.3

102
5.3.2 Models
To test H1, the following models were created.
𝑀𝑆𝑖,𝑡 = 𝛼 + 𝛽1𝐼𝑁𝑉𝑖,𝑡−1 + 𝛽2𝑈𝑁𝐶𝐸𝑅𝑖,𝑡−1 + 𝛽3𝐼𝑁𝑉𝑖,𝑡−1 × 𝑈𝑁𝐶𝐸𝑅𝑖,𝑡−1 + 𝛽4𝑃𝑅𝑂𝐹𝑖,𝑡−1 +
𝛽5𝐿𝐸𝑉𝑖,𝑡−1 + 𝛽6𝐼𝑁𝐷𝐺𝑅𝑡−1 + 𝜖𝑖,𝑡 Eq. 5.4
𝑃𝑅𝑂𝐹𝑖,𝑡 = 𝛼 + 𝛽1𝐼𝑁𝑉𝑖,𝑡−1 + 𝛽2𝑈𝑁𝐶𝐸𝑅𝑖,𝑡−1 + 𝛽3𝐼𝑁𝑉𝑖,𝑡−1 × 𝑈𝑁𝐶𝐸𝑅𝑖,𝑡−1 +
𝛽4𝑆𝐼𝑍𝐸𝑖,𝑡−1 + 𝛽5𝐼𝑁𝐷𝐺𝑅𝑡−1 + 𝜖𝑖,𝑡 Eq. 5.5
Then, the models were expanded to further consider the role of financial constraint.
𝑀𝑆𝑖,𝑡 = 𝛼 + 𝛽1𝐼𝑁𝑉𝑖,𝑡−1 + 𝛽2𝑈𝑁𝐶𝐸𝑅𝑖,𝑡−1 + 𝛽3𝑊𝑊𝑖,𝑡−1 + 𝛽4(𝐼𝑁𝑉𝑖,𝑡−1 × 𝑈𝑁𝐶𝐸𝑅𝑖,𝑡−1) +
𝛽5(𝑈𝑁𝐶𝐸𝑅𝑖,𝑡−1 × 𝑊𝑊𝑖,𝑡−1) + 𝛽6(𝑊𝑊𝑖,𝑡−1 × 𝐼𝑁𝑉𝑖,𝑡−1) + 𝛽7(𝐼𝑁𝑉𝑖,𝑡−1 ×
𝑈𝑁𝐶𝐸𝑅𝑖,𝑡−1 × 𝑊𝑊𝑖,𝑡−1) + 𝛽8𝑃𝑅𝑂𝐹𝑖,𝑡−1 + 𝛽9𝐿𝐸𝑉𝑖,𝑡−1 + 𝛽10𝐼𝑁𝐷𝐺𝑅𝑡−1 + 𝜖𝑖,𝑡
Eq. 5.6
𝑃𝑅𝑂𝐹𝑖,𝑡 = 𝛼 + 𝛽1𝐼𝑁𝑉𝑖,𝑡−1 + 𝛽2𝑈𝑁𝐶𝐸𝑅𝑖,𝑡−1 + 𝛽3𝑊𝑊𝑖,𝑡−1 + 𝛽4𝐼𝑁𝑉𝑖,𝑡−1 ×
𝑈𝑁𝐶𝐸𝑅𝑖,𝑡−1 + 𝛽5𝑈𝑁𝐶𝐸𝑅𝑖,𝑡−1 × 𝑊𝑊𝑖,𝑡−1 + 𝛽6𝑊𝑊𝑖,𝑡−1 × 𝐼𝑁𝑉𝑖,𝑡−1 +
𝛽7𝐼𝑁𝑉𝑖,𝑡−1 × 𝑈𝑁𝐶𝐸𝑅𝑖,𝑡−1 × 𝑊𝑊𝑖,𝑡−1 + 𝛽8𝑆𝐼𝑍𝐸𝑖,𝑡−1 + 𝛽9𝐼𝑁𝐷𝐺𝑅𝑡−1 + 𝜖𝑖,𝑡
Eq. 5.7
MS is the market share; INV is the capital expenditure net of depreciation expenses divided
by total assets in the previous period; UNCER is the industry-wide demand uncertainty;
WW is the Whited-Wu index; PROF is the operating margin, which is operating income
after depreciation over sales revenue; LEV is the long-term debt leverage over the total

103
assets; SIZE is the net sales revenue on a log scale; INDGR is the annual industry sales
growth. The subscript i indexes firms, and t, time. To improve the normality of the series,
the natural log-transformation was taken for the variables MS, INV, and UNCER. Along
with the interaction models above, baseline and two-way interaction models were tested as
well.
Wooldridge test for autocorrelation in panel data indicated that the disturbance term
is first-order autoregressive. Therefore, to address the unobserved firm-specific effects and
the autocorrelation in error terms, the equations were estimated using fixed-effect
regression with AR (1) disturbances (Baltagi & Wu, 1999).
5.4 Results
5.4.1 Descriptive Analysis
Table 5.1 presents summary statistics for the main variables. For descriptive
purposes, natural (unlogged) numbers are reported for INV and UNCER. The average
market share of restaurant chains is 0.3 percent. Even the largest is 5.5 percent, implying
that the U.S. restaurant industry is highly fragmented among public chains and a number
of local restaurants. On average, U.S. restaurant firms spend 7.7% of the amount of total
assets as capital expenditure.

104
Table 5.1 Summary statistics
Obs Mean Std. Dev. Min Max
MS 1562 0.003 0.007 0.00002 0.055
PROF 1628 0.061 0.073 -0.261 0.264
INV 1533 0.077 0.129 -0.101 0.645
UNCER 1562 0.301 0.100 0.182 0.579
WW 1537 0.396 0.092 0.145 0.597
SIZE 1628 5.508 1.644 -.708 10.244
LEV 1622 0.247 0.314 0 1.308
INDGR 906 0.038 0.327 -2.103 1.181
Table 5.2 summarizes the pairwise correlation coefficients between variables. First
of all, UNCER is negatively correlated with INV, as expected. The intriguing point is that
UNCER has a positive association with market share (MS). Given that the sample firms are
public restaurant chains, it can be interpreted as small, nonpublic restaurants are hit
relatively harder by demand uncertainty than their large, public counterparts. The
dampening effect of uncertainty on growth can be found in the negative correlation
between UNCER and market share growth (∆MS). UNCER has a positive association with
PROF. Though the results are not reported here, to identify the reason for this seemingly
puzzling outcome, it was calculated the correlation between UNCER and gross margin,
operating expense ratio, and depreciation expense ratio. The results showed that there is a
negative correlation between UNCER and sales, general, and administrative expense ratio.
What this indicates is that in the face of demand uncertainty restaurant firms cut their

105
marketing and administrative expenses first to protect the bottom line, consistent with
previous research (Deleersnyder et al., 2009; Steenkamp & Fang, 2011).
Table 5.2 Correlation matrix
UNCER INV MS ∆MS PROF WW LEV SIZE
INV -0.260 ***
MS 0.169 ***
-0.141 ***
∆MS -0.138 ***
0.415 ***
-0.074 **
PROF 0.061 **
0.053 *
0.495 ***
0.096 ***
WW -0.238 ***
0.128 ***
-0.903 ***
-0.037
-0.589 ***
LEV 0.026
-0.185 ***
0.212 ***
-0.148 ***
0.122 ***
-0.066 ***
SIZE 0.282 ***
-0.205 ***
0.984 ***
-0.102 ***
0.482 ***
-0.911 ***
0.211 ***
INDGR -0.347 ***
0.099 ***
-0.056 **
0.018
0.023
0.044 *
-0.034
-0.080 ***
Note: ***: significant at 0.01 level; **: significant at 0.05 level; *: significant at 0.1 level.
The negative correlation between MS and INV suggests that large firms tend to
spend a smaller fraction of their resources in investment. This can be explained by the
fact that large and well-known restaurant chains are heavily engaged in franchising.
Because it is franchisees who are mainly responsible for capital investment, franchisors
exhibit a lower investment rate than nonfranchisors. Investment is positively correlated
with the Whited-Wu index. The WW index has three components associated with
leverage, liquidity, and dividend payment. Given that making investment inevitably
entails cash outlay or issuance of new debt, it is not surprising to observe a positive

106
association between them. WW is negatively related to UNCER, indicating that it is more
difficult to get access to external capital when the environment is uncertain.
5.4.2 Main Results
Table 5.3 reports the effects of uncertainty, investment, and financial constraint on
market share. Panel A presents the test results of the two-way interaction between
uncertainty and investment. As expected, INV has a positive but UNCER has a negative
impact on market share. Consistent with H1, the interaction term is significantly positive,
indicating that firms making investments in times of high uncertainty reach a larger market
share than when they do in times of low uncertainty.
In Panel B, the role of financial constraints is factored in. In column (3), the main
effect of UNCER, INV, and financial constraint (WW) are examined. As expected, INV has
a positive but UNCER and WW have a negative impact on market share. The negative
coefficient of WW is in line with Chevalier and Scharfstein’s (1996) finding that during a
recession financially constrained firms get cold feet for fear of default and lose market
share to less-constrained firms.
Two-way interaction model results are shown in column (4). Only the INV×UNCER
has a positively significant coefficient. The three-way interaction term in the full model,
shown in column (5), is negatively significant. Given that the WW measures the extent to
which a firm is financially constrained, the negative coefficient means that the positive
interaction effect of UNCER and INV is reduced for financially constrained firms.

107
Table 5.3 Effects of investment, uncertainty and financial constraint on market share
DV: Market Share Panel A Panel B
(1) (2) (3) (4) (5)
INV 0.133*** 0.137*** 0.142*** 0.143*** 0.129***
(0.020) (0.021) (0.023) (0.023) (0.024)
UNCER -0.418*** -0.358*** -0.560*** -0.525*** -0.547***
(0.111) (0.113) (0.114) (0.124) (0.124)
WW -7.653*** -7.890*** -8.112***
(0.897) (0.900) (0.908)
INV×UNCER 0.164*** 0.194*** 0.174***
(0.057) (0.065) (0.065)
UNCER×WW -1.140 -2.059*
(1.096) (1.186)
WW×INV 0.014 0.041
(0.268) (0.267)
INV×UNCER×WW -1.596**
(0.788)
PROF -3.819*** -3.545*** -6.486*** -5.922*** -5.919***
(0.739) (0.759) (0.855) (0.865) (0.863)
LEV -0.521** -0.508** -0.576** -0.539** -0.575**
(0.221) (0.223) (0.230) (0.230) (0.230)
INDGR -9.123*** -9.772*** -11.607*** -12.091*** -12.133***
(1.169) (1.193) (1.316) (1.328) (1.324)
cons -6.200*** -6.171*** -6.071*** -6.083*** -6.080***
(0.034) (0.036) (0.052) (0.054) (0.054)
F-value 33.99*** 30.44*** 44.98*** 31.79*** 29.12***
obs 790 790 788 788 788
Note: ***: significant at 0.01 level; **: significant at 0.05 level; *: significant at 0.1 level.
Numbers in parentheses are the standard error of the coefficients.

108
Table 5.4 Effect of investment, uncertainty and financial constraint on profit margin
DV: PROF Panel A Panel B
(1) (2) (3) (4) (5)
INV 0.002* 0.002 0.002** 0.002* 0.002**
(0.001) (0.001) (0.001) (0.001) (0.001)
UNCER 0.006 0.003 0.005 0.001 0.002
(0.006) (0.006) (0.006) (0.006) (0.006)
WW 0.051 0.032 0.041
(0.044) (0.044) (0.045)
INV×UNCER -0.007** -0.008*** -0.008**
(0.003) (0.003) (0.003)
UNCER×WW -0.032 0.002
(0.052) (0.056)
WW×INV -0.028** -0.029**
(0.013) (0.013)
INV×UNCER×WW 0.058
(0.039)
SIZE 0.004* 0.003 0.006** 0.006** 0.006**
(0.002) (0.002) (0.003) (0.003) (0.003)
INDGR 0.076 0.097 0.072 0.097 0.100
(0.073) (0.073) (0.070) (0.071) (0.071)
cons 0.047*** 0.049*** 0.034*** 0.034*** 0.034***
(0.009) (0.009) (0.008) (0.009) (0.008)
F-value 2.42** 3.06*** 2.89** 2.83*** 2.76***
obs 793 793 788 788 788
Note: ***: significant at 0.01 level; **: significant at 0.05 level; *: significant at 0.1 level.
Numbers in parentheses are the standard error of the coefficients.

109
In Table 5.4, the estimation results of Eq. 5.5 and 5.7 are reported. What attracts
our attention is the negative coefficient of INV×UNCER in column (2). Fixed investment
incurs depreciation expense, which is usually large at first and decreases over time
according to the accelerated-depreciation method. When consumers refrain from dining
out, a substantially increased depreciation expense from a new investment, combined with
falling revenue, can hammer the bottom line.
Panel B presents the three-way interaction model results. In column (4), in
addition to INV×UNCER, WW×INV is also negatively related to PROF. This indicates
that for financially constrained firms the positive impact of investment on profit margin is
less than for less-constrained firms. When it comes to the three-way interaction effect, the
negative moderating effect of uncertainty on the effectiveness of investment does not
depend on the firm’s financial constraint status.
5.5 Conclusion
The final essay analyzes the financial implications of investment made under
uncertainty. The results partially confirmed the hypotheses. There is a positive moderating
effect of demand uncertainty on the investment’s impact on market share. That is, the firms
undertaking investment under increasing uncertainty gain a larger market share than when
the uncertainty level is relatively low. This shows that well-targeted investments can help
firms turn crisis into opportunity to pull ahead of competitors who retreat in the face of
uncertainty. However, as far as profit margin is concerned, making fixed investment in

110
times of high uncertainty appears to be detrimental to the bottom line. Regardless of sales
volume, fixed assets incur depreciation expenses, which are usually high at the early stage
of the useful life of the asset. Combined with dwindling sales, capital investment decreases
the operating profit margin in the following year.
Next, this study further considers the impact of financial constraint. Here, financial
constraint indicates how difficult it is to obtain external financing. Construction and
remodeling of restaurants usually require the commitment of sizable financial resources,
and thus likely increase financial burden. Because of the increased financial risk involved
with investment spending, it was hypothesized that the effectiveness of investment would
be lower for financially constrained firms than for non-financially constrained firms. The
findings reveal that for financially constrained firms, increasing investment when demand
is uncertain results in a lower market share than for relatively less constrained firms.
The findings provide several implications for practitioners. Considering the
chances hidden in uncertain times as hinted by this study, they should develop strategies to
find the opportunities and take advantage of tough times. Nevertheless, given that
investment can hurt profit margins in uncertain times, managers should design investment
plans in a way that can minimize the adverse impact of depreciation expenses on the profit
rate. For example, to protect the profit margin from adverse shocks to sales, it is important
to have a high proportion of variable costs relative to fixed costs. Because variable costs
are linked to sales volume, the profit margin of companies with a high level of variable
costs compared to fixed costs is generally less volatile (Jagels & Ralston, 2007). In this
regard, designing a restaurant concept that has a relatively higher portion of variable costs

111
relative to fixed costs cannot only instill flexibility in the investment project but also
preserve the profit margin. It is also recommended to find high-impact elements that can
deliver a larger payoff. In addition, the management of financially vulnerable firms should
carefully calculate direct and indirect costs of investment beforehand. Indirect costs include
potential increased default risk and return of other options, such as reserving cash internally
or investing in financial assets.
Given that the data are from the U.S. restaurant industry, the results and discussions
cannot be generalized without caution to other countries in different economic situations
from the United States. For example, Japan had experienced an unprecedented long
economic slump over two decades after the collapse of asset price bubbles within the
Japanese economy. In such a prolonged depression being proactive may entail more risk
and uncertainty, which might put the firms on the verge of default. Therefore, more studies
performed in different countries are warranted to further investigate complex implications
of the interplay between uncertainty, economy, and investment.
For future studies, it is worthwhile to examine what causes a difference in a
company’s stance on uncertainty. While some firms take aggressive actions for the future,
other firms exhibit a passive and cautious movement in the face of the same degree of
uncertainty. What drives them to behave differently? What are the long-term consequences?
Answers to these questions would enhance our understanding of the restaurant firms’
growth strategy and uncertainty management.

112
CHAPTER 6. CONCLUSION
6.1 Conclusions
Uncertainty arises when imperfect knowledge makes it difficult to predict the future
(Beckman et al., 2004). The instability and unpredictability inherent in consumer taste and
preferences renders “demand uncertainty” as a consistent “source of uncertainty” (March,
1978). The competitive market nature, however, does not allow much room to control price
in response to fluctuating demand, implying that the restaurant business is exposed to
demand uncertainty. Indeed, the hospitality industry is known to have a high demand
uncertainty (Dyer, Furr, & Lefrandt, 2014). Nevertheless, this issue has not received due
attention from the hospitality field. As an attempt to investigate the impact of demand
uncertainty in the restaurant industry, this study examines the implications of demand
uncertainty for capital investment.
The first essay investigated the effect of demand uncertainty on capital investment
in the restaurant industry. Consistent with extant literature rooted in the concept of
investment irreversibility and real option, the results confirmed a dampening impact of
demand uncertainty on investment. Restaurant firms postpone fixed investments when it is
hard to predict industry demand.

113
In addition, this study found that the relationship between uncertainty and investment is
not a linear one as assumed by most previous empirical research. The significantly negative
quadratic uncertainty term suggests that the influence of uncertainty is not constant but
becomes more severe as the uncertainty rises. Both uncertainty terms, linear and quadratic,
are significant even after controlling conventional determinants of investment, including
Q, cash flows and industry and economy growth. Within the range of estimated uncertainty,
it was further revealed that investment freezes more rapidly in periods of comparatively
low GDP growth than in periods of high growth. In other words, uncertainties about
demand is more detrimental to investment activities in recessionary periods when the
margin for error is thin.
After analyzing the general effect of uncertainty, it was examined how the effect
interacts with industry-specific nature: franchising and segmentation. According to the
results, franchising chains consistently invest less than nonfranchisors but there is no
significant difference between the two groups in terms of the degree of the responsiveness
of investment to uncertainty. When it comes to segment, full-service restaurants are more
adversely affected by demand uncertainty than limited-service restaurants. This finding is
in line with previous literature which argues that limited-service restaurant chains have a
lower income elasticity of demand and thus outperform full-service counterparts in a lean
economy.
This study expands the realm of uncertainty-investment research, which has
exclusively focused on manufacturing industries, into a service industry. Investment in the
restaurant industry is unlike investment in the manufacturing industries. It is less lumpy

114
and split into multiple small projects as investment is implemented on a unit restaurant
basis. The risk of irreversibility is lower as well. Such differences are presumed to cause a
nonlinear association between uncertainty and investment. Except for a few studies (Bo &
Lensin, 2005), most empirical research implicitly assumes a linear relationship even though
several theoretical studies suggest the impact of uncertainty on investment is not monotonic
(Abel & Eberly, 1999; French & Sichel, 1993; Kulatilaka & Perotti, 1998; Sarkar, 2000).
Our findings provide empirical evidence for the theoretical argument of the previous
studies and imply that the uncertainty-investment relationship should be understood in light
of other factors, such as competition, strategic value of growth options, and the degree of
irreversibility.
The second study examined how restaurant firms behave under uncertainty. How
do the managers make investment decisions in times of high uncertainty?
It explored how restaurant firms cope with demand uncertainty when making investments.
Although conventional investment rules argue that each investment project be evaluated
based on its own profits and costs, this activity is usually not probable due to the bounded
rationality of managers. In the absence of a clear imperative of what is efficient, managers
are likely to scan other peers in the market and mimic their behavior. Moreover, when the
market is fiercely competitive, managers would be more sensitive to peer competitors’
movement, not only to defend their customer base but also to achieve conformity.
To test this idea, this study formed a peer sample comprised of quick service, fast
casual, and casual dining chains. Consumers’ increasing needs for healthful quality foods
at affordable prices have weakened the boundaries between the segments and made them

115
pursue similar strategies. Consistent with the hypotheses, sample restaurant firms appeared
to be affected by peers in making investments. After controlling for traditional investment
determinants, Q, cash flow, industry and economy growth, peer effect was still significant.
The results further showed that as the demand uncertainty increases, that is, as it becomes
more difficult to guarantee the profitability of an investment project, the more sample
restaurant firms are inclined to follow peer investment behaviors. This indicates that
uncertainty is a driving force that leads firms to follow peers.
To verify what drives the mimicking investment behavior, additional tests were
conducted. The findings show that either leaders or followers take into account the other’s
investment activity when making investment decisions, indicating that the mimetic
behavior does not work in one direction but rather in the bilateral direction between leaders
and followers. This implies that the peer effect does not arise from learning or legitimacy-
seeking motives (of less successful firms), but rather from competitive motives.
This essay reveals a human side of corporate investment decision. It shows that
investment outlays are not simply determined by economic reasons, but are influenced by
competitors’ actions. Under atomistic competition like the restaurant industry, each firm is
expected neither to influence nor to be influenced by another firm (Hart, 1985; Wolinsky,
1986). Campbell (2011) argues against this notion and demonstrates that strategic
interactions lie at the heart of restaurant pricing and turnover. This study extends
Campbell’s (2011) argument by showing that restaurant firms consider other peer firms in
making investment decisions as well. Moreover, the fact that the peer effect is more

116
pronounced in periods of high uncertainty supplies evidence for the managers’ bounded
rationality.
Lastly, this study compared the investment outcomes between peer-sensitive and
less-sensitive firms. According to the findings, capital expenditures of firms whose
investment outlay is highly correlated with their peers are less effective in expanding
market share than that of firms with a low correlation. Investments undertaken
simultaneously would increase competition clutter, which can decrease the profitability of
investment.
In relation to this point, a word of caution is warranted for managers who consider
basing their investment decisions on other firms. Every firm is situated differently in terms
of products, resources, competitive advantages etcetera. Thus, before referring to other
peers’ behavior, the firm must evaluate whether the investment plan is economically
feasible and sustainable. As hinted by the aforementioned case of DavCo and Wendy’s, a
roughly designed investment plan that does not go through a thorough test to ensure the
long-term economic feasibility may cause negative outcomes.
In the final piece of the dissertation, the effectiveness of investment made under
uncertainty was analyzed. Extant research delving into the countercyclical effectiveness of
investment, commonly warns against the backlash of cutback practices and predicts greater
investment returns in the post-recession periods. Firms that actively search for
opportunities in difficult times and make an aggressive investment can achieve superior
performance afterwards. Inspired by this line of research, this study examined the financial
implications of investment made under uncertainty. The results showed that a rise in
117
investment in times of high uncertainty leads to a larger market share. It shows that well-
targeted investments can help firms turn crisis into opportunity to get the jump on
competitors. However, it also has to be noted that increased depreciation costs and
dwindling sales can hurt the profit margin in uncertain times.
Most research that deals with countercyclical value of investment focus on
intangible investment, such as marketing and R&D. Now it has been shown that not only
soft but also fixed investments have a similar effect. Moreover, this study discovered that
investment effectiveness is moderated not only by the economic conditions but also by the
degree of demand uncertainty. In addition, this study added one more layer of complexity,
financial constraint. The findings suggest that although capital investments made under
uncertainty generate greater returns, its association with the firm’s financial condition
should also be considered.
Taken together, the first and last essays suggest that uncertainty is not always a
“bad” thing to be afraid of. As Sarkar (2000) points out, uncertainty depresses investment
but it can also increase the probability that the investment threshold will be hit (Sarkar,
2000). Indeed, the nonlinear relationship surfaced in this thesis implies that many
restaurant firms increase investment for low levels of uncertainty. Hence, if demand
uncertainty is low to moderate, managers should aggressively search for investment
opportunities and carefully weigh the strategic value of investment against the hidden cost
of investment (a form of flexibility) rather than merely waiting until the uncertainty
subsides.

118
The current thesis is an early attempt to deal with demand uncertainty in the
restaurant industry. This means that research on uncertainty in the foodservice industry is
at the very beginning stage and there is much more to explore. A few research directions
worthy of investigation include 1) estimating the exposure of firm value to industry
uncertainty; 2) identifying the operational and financial characteristics of firms with greater
vulnerabilities to uncertainty in order to suggest some practical hedging tactics for
hospitality businesses; 3) verifying the determinants of industry and firm-level uncertainty,
which would involve various factors, such as the economy, intra-industry competition,
input price volatility, to name a few; and 4) developing different kinds of uncertainty
measures to attain a more comprehensive understanding of the uncertainty inherent in the
hospitality industry.

REFERENCES

119
REFERENCES
Abel, A. B. (1983). Optimal investment under uncertainty. The American Economic
Review, 73(1), 228-233.
Abel, A. B., Dixit, A. K., Eberly, J. C., & Pindyck, R. S. (1996). Options, the value of
capital, and investment. The Quarterly Journal of Economics, 111(3), 753-777.
Abel, A. B., & Eberly, J. C. (1999). The effects of irreversibility and uncertainty on
capital accumulation. Journal of Monetary Economics, 44(3), 339-377.
Abrahamson, E., & Rosenkopf, L. (1993). Institutional and competitive bandwagons:
using mathematical modeling as a tool to explore innovation diffusion. Academy
of Management, 18(3), 487-517.
Accenture (2003) Innovating for the Upturn, Retrieved from
http://www.accenture.com/NR/rdonlyres/4C61218F‐476A‐488A‐88C6‐3B9C12D18BBA/0/upturn.pdf
Aiken, L. S., West, S. G., & Reno, R. R. (1991). Multiple regression: Testing and
interpreting interactions: Sage.
Akdoğu, E., & MacKay, P. (2012). Product markets and corporate investment: Theory
and evidence. Journal of Banking & Finance, 36(2), 439-453.
Alexander, C. (2008). Market Risk Analysis: Pricing, Hedging and Trading Financial
Instruments, vol III: Wiley: New York.
Aliouche, E. H., Kaen, F., & Schlentrich, U. (2012). The market performance of
franchise stock portfolios. International Journal of Contemporary Hospitality
Management, 24(5), 791-809.
Andras, T. L., & Srinivasan, S. S. (2003). Advertising intensity and R&D intensity:
Differences across industries and their impact on firm’s performance.
International Journal of Business and Economics, 2(2), 81-90.
Arda, Y., & Hennet, J.-C. (2006). Inventory control in a multi-supplier system.
International Journal of Production Economics, 104(2), 249-259.

120
Auty, S. (1992). Consumer choice and segmentation in the restaurant industry. Service
Industries Journal, 12(3), 324-339.
Avery, C., & Zemsky, P. (1998). Multidimensional Uncertainty and Herd Behavior in
Financial Markets. The American Economic Review, 88(4), 724-748.
Baldursson, F. M. (1998). Irreversible investment under uncertainty in oligopoly. Journal
of Economic Dynamics and Control, 22(4), 627-644.
Baltagi, B. H., Bresson, G., & Pirotte, A. (2003). Fixed effects, random effects or
Hausman–Taylor?: A pretest estimator. Economics Letters, 79(3), 361-369.
Baltagi, B. H., & Wu, P. X. (1999). Unequally spaced panel data regressions with AR(1)
disturbances. Econometric Theory, 15(6), 814-823.
Baldursson, F. (1998). Irreversible investment under uncertainty in oligopoly. Journal of
Economic Dynamics & Control 22, 627-644.
Banerjee, A. V. (1992). A simple model of herd behavior. The Quarterly Journal of
Economics, 107(3), 797-817.
Barreto, I., & Baden‐Fuller, C. (2006). To conform or to perform? Mimetic behaviour,
legitimacy‐based groups and performance consequences. Journal of Management
Studies, 43(7), 1559-1581.
Beckman, C. M., Haunschild, P. R., & Phillips, D. J. (2004). Friends or Strangers? Firm-
Specific Uncertainty, Market Uncertainty, and Network Partner Selection.
Organization Science, 15(3), 259-275.
Bell, E., & Martinelli, K. (2010). 2009 StarChefs.com salary survey. Retrieved from
http://www.starchefs.com/features/editors_dish/salary_survey/2009/
Bernanke, B. S. (1983). Irreversibility, Uncertainty, and Cyclical Investment. The
Quarterly Journal of Economics, 98(1), 85-106.
Bessembinder, H. (1991). Forward contracts and firm value: Investment incentive and
contracting effects. Journal of Financial and Quantitative Analysis, 26(4), 519-
532.
Bewley, R. A. (1979). The direct estimation of the equilibrium response in a linear
dynamic model. Economics Letters, 3(4), 357-361.
Bikhchandani, S., Hirshleifer, D., & Welch, I. (1992). A theory of fads, fashion, custom,
and cultural change as informational cascades. Journal of Political Economy,
100(5), 992-1026.
Blanchard, O., Rhee, C., & Summers, L. (1993). The Stock Market, Profit, and
Investment. The Quarterly Journal of Economics, 108(1), 115-136.

121
Bloom, N. (2014). Fluctuations in Uncertainty. The Journal of Economic Perspectives,
28(2), 153-175.
Bo, H., & Lensin, R. (2005). Is the Investment-Uncertainty Relationship Nonlinear? An
Empirical Analysis for the Netherlands. Economica, 72(286), 307-331.
Boehne, E. (January 19, 2000). The US economy in 2000. A speech presented at 2000
Economic Forecast Breakfast. Federal Reserve Bank of Philadelphia. Main Line
Chamber of Commerce, Berwyn, PA. Retrieved from
https://www.philadelphiafed.org/publications/speeches/boehne/2000/01-19-
00_main-line-chamber
Bond, S., & Meghir, C. (1994). Dynamic investment models and the firm's financial
policy. The Review of Economic Studies, 61(2), 197-222.
Bonoma, T. V. (1986). Marketing subversives. Harvard Business Review, 64(6), 113-
118.
Brandau, M. (February 11, 2013). Casual-dining, fast-casual concepts stealing market
share. Retrieved from http://nrn.com/latest-headlines/casual-dining-fast-casual-
concepts-stealing-market-share
Brandau, M. (February 13, 2014a). Burger King reaps benefits of refranchising.
Retrieved from http://nrn.com/franchising/burger-king-reaps-benefits-
refranchising
Brandau, M. (April 11, 2014b). Fine dining traffic growth outpaces other segments.
Retrieved from http://nrn.com/consumer-trends/fine-dining-traffic-growth-
outpaces-other-segments
Brandau, M. (May 19, 2014c). The journey from fine dining to fast casual. Retrieved
from http://nrn.com/fast-casual/journey-fine-dining-fast-casual
Brandt, P. T., & Williams, J. T. (2007). Multiple time series models: Sage.
Brickley, J. A., & Dark, F. H. (1987). The choice of organizational form the case of
franchising. Journal of Financial Economics, 18(2), 401-420.
Bulan, L., Mayer, C., & Somerville, C. T. (2009). Irreversible investment, real options,
and competition: Evidence from real estate development. Journal of Urban
Economics, 65(3), 237-251.
Burger King Worldwide Inc. (2013). 10-K Report. Retrieved from
http://www.sec.gov/Archives/edgar/data/1547282/000119312514061827/d648966
d10k.htm
Burke, R. R., & Srull, T. K. (1988). Competitive interference and consumer memory for
advertising. Journal of Consumer Research, 15(1), 55-68.

122
Burns, T. E., & Stalker, G. M. (1961). The management of innovation. University of
Illinois at Urbana-Champaign's Academy for Entrepreneurial Leadership
Historical Research Reference in Entrepreneurship.
Byrne, J. P., & Davis, E. P. (2004). Permanent and temporary inflation uncertainty and
investment in the United States. Economics Letters, 85(2), 271-277.
doi:http://dx.doi.org/10.1016/j.econlet.2004.04.015
Byun, C. (December, 2010). The U.S. housing bubble and bust: Impacts on employment.
Monthly Labor Review, 3-17.
Caballero, R. J. (1991). On the sign of the investment-uncertainty relationship. The
American Economic Review, 81(1), 279-288.
Campa, J. M. (1993). Entry by foreign firms in the United States under exchange rate
uncertainty. The Review of Economics and Statistics, 75(4), 614-622.
Campbell, J. R. (2011). Competition in large markets. Journal of Applied Econometrics,
26(7), 1113-1136.
Carruth, A., Dickerson, A., & Henley, A. (2000). What do We Know About Investment
Under Uncertainty? Journal of Economic Surveys, 14(2), 119-154.
doi:10.1111/1467-6419.00107
Caves, R. E., & Murphy, W. F. (1976). Franchising: Firms, markets, and intangible
assets. Southern Economic Journal, 42(4), 572-586.
CBRL: Key statistics for Cracker Barrel Old Country Store, Inc. (n.d.) Retrieved May 25,
2016 from http://finance.yahoo.com/q/ks?s=CBRL+Key+Statistics
Chan, K., Hwang, C.-Y., & Mian, G. M. (2005). Mutual fund herding and dispersion of
analysts' earnings forecasts. Available at SSRN 675562.
Chen, M.-J. (1996). Competitor Analysis and Interfirm Rivalry: Toward a Theoretical
Integration. The Academy of Management Review, 21(1), 100-134.
Chen, M.-J., & Hambrick, D. C. (1995). Speed, stealth, and selective attack: How small
firms differ from large firms in competitive behavior. Academy of Management
Journal, 38(2), 453-482.
Chevalier, J. A., & Scharfstein, D. S. (1996). Capital-market imperfections and
countercyclical markups: Theory and evidence. The American Economic Review,
86(4), 703-725.
Chirinko, R. S. (1993). Business fixed investment spending: Modeling strategies,
empirical results, and policy implications. Journal of Economic Literature, 31(4),
1875-1911.

123
Chung, K. H., & Pruitt, S. W. (1994). A simple approximation of Tobin's q. Financial
Management, 23(3), 70-74.
Clark, B. H., & Montgomery, D. B. (1999). Managerial identification of competitors. The
Journal of Marketing, 63(3), 67-83.
Cleary, S. (2006). International corporate investment and the relationships between
financial constraint measures. Journal of Banking & Finance, 30(5), 1559-1580.
doi:http://dx.doi.org/10.1016/j.jbankfin.2005.03.023
CMG: Key statistics for Chipotle Mexican Grill, Inc. (n.d.) Retrieved May 25, 2016 from
http://finance.yahoo.com/q/ks?s=CMG+Key+Statistics
Conlisk, J. (1980). Costly optimizers versus cheap imitators. Journal of Economic
Behavior & Organization, 1(3), 275-293. doi:http://dx.doi.org/10.1016/0167-
2681(80)90004-9
Conlisk, J. (1996). Why Bounded Rationality? Journal of Economic Literature, 34(2),
669-700.
Cushman, D. O. (1988). Exchange-rate uncertainty and foreign direct investment in the
United States. Weltwirtschaftliches Archiv, 124(2), 322-336.
Cyert, R. M., & March, J. G. (1963). A behavioral theory of the firm. Englewood Cliffs,
NJ, 2.
d'Aspremont, C., Gabszewicz, J. J., & Thisse, J. F. (1979). On Hotelling's" stability in
competition". Econometrica: Journal of the Econometric Society, 47(5), 1145-
1150.
Daft, R. L., Sormunen, J., & Parks, D. (1988). Chief executive scanning, environmental
characteristics, and company performance: An empirical study. Strategic
Management Journal, 9(2), 123-139.
Damodaran, A. (2014). Capital Expenditures, Depreciation, Reinvestment Rate and Sales
to Capital Ratios by Industry [Data file]. Retrieved from
http://pages.stern.nyu.edu/~adamodar/New_Home_Page/dataarchived.html
Danaher, P. J., Bonfrer, A., & Dhar, S. (2008). The effect of competitive advertising
interference on sales for packaged goods. Journal of Marketing Research, 45(2),
211-225.
Deephouse, D. L. (1999). To be different, or to be the same? It’s a question(and theory)
of strategic balance. Strategic Management Journal, 20(2), 147-166.
Deleersnyder, B., Dekimpe, M. G., Steenkamp, J.-B. E. M., & Leeflang, P. S. H. (2009).
The role of national culture in advertising's sensitivity to business cycles: An
investigation across continents. Journal of Marketing Research, 46(5), 623-636.

124
Denis, D. J. (2011). Financial flexibility and corporate liquidity. Journal of Corporate
Finance, 17(3), 667-674.
Denis, D. J., & Kruse, T. A. (2000). Managerial discipline and corporate restructuring
following performance declines. Journal of Financial Economics, 55(3), 391-424.
doi:http://dx.doi.org/10.1016/S0304-405X(99)00055-0
Dess, G. G., & Beard, D. W. (1984). Dimensions of organizational task environments.
Administrative Science Quarterly, 29(1), 52-73.
DiMaggio, P. J., & Powell, W. W. (1983). The iron cage revisited: Institutional
isomorphism and collective rationality in organizational fields. American
Sociological Review, 48(2), 147-160.
Dixit, A. (1989). Entry and exit decisions under uncertainty. Journal of Political
Economy, 97(3), 620-638.
Dixit, A. K., & Pindyck, R. S. (1994). Investment under uncertainty, 1994. Princeton UP,
Princeton.
DRI: Key statistics for Darden Restaurants, Inc. (n.d.) Retrieved May 25, 2016 from
http://finance.yahoo.com/q/ks?s=DRI+Key+Statistics
Drukker, D. M. (2003). Testing for serial correlation in linear panel-data models. Stata
Journal, 3(2), 168-177.
Duncan, R. B. (1973). Multiple decision-making structures in adapting to environmental
uncertainty: The impact on organizational effectiveness. Human Relations.
Dyer, J., Furr, N., & Lefrandt, C. (2014). The industries plagued by the most uncertainty.
Harvard Business Review, digital article, 11.
Ederington, L. H., & Guan, W. (2006). Measuring historical volatility. Journal of Applied
Finance, 16(1), 5-14.
Engle, R. (2001). GARCH 101: The use of ARCH/GARCH models in applied
econometrics. Journal of Economic Perspectives, 15(4), 157-168.
Engle, R. (2004). Risk and volatility: Econometric models and financial practice.
American Economic Review, 94(3), 405-420.
Episcopos, A. (1995). Evidence on the relationship between uncertainty and irreversible
investment. The Quarterly Review of Economics and Finance, 35(1), 41-52.
Enz, C. A. (2009). Hospitality strategic management: Concepts and cases (2nd ed.). New
York, NY: John Wiley & Sons.

125
Fama, E. F. (1970). Efficient capital markets: A review of theory and empirical work*.
The journal of Finance, 25(2), 383-417.
Fama, E. F., & French, K. R. (1993). Common risk factors in the returns on stocks and
bonds. Journal of financial economics, 33(1), 3-56.
Fazzari, S., Hubbard, R. G., & Petersen, B. C. (1988). Financing constraints and
corporate investment. National Bureau of Economic Research Cambridge, Mass.,
USA.
Fazzari, S. M., Hubbard, R. G., & Petersen, B. C. (2000). Investment-cash flow
sensitivities are useful: A comment on Kaplan and Zingales. The Quarterly
Journal of Economics, 115(2), 695-705.
Fieldhouse, A. (2014, June 26). 5 years after the great recession, our economy still far
from recovered. Retrieved from http://www.huffingtonpost.com/andrew-
fieldhouse/five-years-after-the-grea_b_5530597.html
French, M. W., & Sichel, D. E. (1993). Cyclical patterns in the variance of economic
activity. Journal of Business & Economic Statistics, 11(1), 113-119.
Froot, K. A., Scharfstein, D. S., & Stein, J. C. (1993). Risk managements coordinating
corporate investment and financing policies. the Journal of Finance, 48(5), 1629-
1658.
Fuss, C., & Vermeulen, P. (2008). Firms’ investment decisions in response to demand
and price uncertainty. Applied Economics, 40(18), 2337-2351.
Gara, T. (November 8, 2012). Competition is behind Mcdonalds’ falling sales, but McRib
may redeem. Retrieved from http://blogs.wsj.com/corporate-
intelligence/2012/11/08/competition-is-behind-mcdonalds-falling-sales-but-
mcrib-may-redeem/
Gasparro, A. (July 27, 2012a). Slower GDP growth weighs on restaurants. Retrieved
from
http://www.wsj.com/articles/SB1000087239639044393140457755336181447736
8
Gasparro, A. (November 13, 2012b). McDonald's says tough economy is 'new normal'.
Retrieved from
http://online.wsj.com/news/articles/SB10001424127887324735104578117103850
395288
Geroski, P. A., & Gregg, P. (1997). Coping with Recession: UK company performance in
adversity (Vol. 38): Cambridge University Press.

126
Ghosal, V., & Loungani, P. (1996). Product Market Competition and the Impact of Price
Uncertainty on Investment: Some Evidence from US Manufacturing Industries.
Journal of Industrial Economics, 44(2), 217-228.
Gilbert, R. J. (1989). Mobility Barriers and the Value of Incumbency, Handbook of
Industrial Organization, Vol. 1, capo 8, ed. R. Schmalensee e R. Willig.
Arnsterdarn: North-Holland.
Gilbert, R. J., & Lieberman, M. (1987). Investment and coordination in oligopolistic
industries. The RAND Journal of Economics, 18(1), 17-33.
Gilchrist, S. (1990). An empirical analysis of corporate investment and financing
hierarchies using firm level panel data. unpublished, Board of Governors.
Gilchrist, S., & Himmelberg, C. P. (1995). Evidence on the role of cash flow for
investment. Journal of monetary Economics, 36(3), 541-572.
Gimeno, J., & Woo, C. Y. (1996). Hypercompetition in a multimarket environment: The
role of strategic similarity and multimarket contact in competitive de-escalation.
Organization Science, 7(3), 322-341.
Goldberg, L. S. (1993). Exchange rates and investment in United States industry. The
Review of Economics and Statistics, 75(4), 575-588.
Golden, T. D., & Veiga, J. F. (2005). The impact of extent of telecommuting on job
satisfaction: Resolving inconsistent findings. Journal of Management, 31(2), 301-
318.
Graham, J. R., & Harvey, C. R. (2001). The theory and practice of corporate finance:
Evidence from the field. Journal of Financial Economics, 60(2), 187-243.
Graham, J. R., & Rogers, D. A. (2002). Do firms hedge in response to tax incentives? The
Journal of finance, 57(2), 815-839.
Grenadier, S. R. (1996). The strategic exercise of options: Development cascades and
overbuilding in real estate markets. The Journal of Finance, 51(5), 1653-1679.
Grenadier, S. R. (2002). Option exercise games: An application to the equilibrium
investment strategies of firms. Review of Financial Studies, 15(3), 691-721.
Grewal, R., & Tansuhaj, P. (2001). Building organizational capabilities for managing
economic crisis: The role of market orientation and strategic flexibility. Journal of
Marketing, 65(2), 67-80.
Grundvåg Ottesen, G., & Grønhaug, K. (2006). Pursuing opportunities: Why so many fail
and so few succeed. European Journal of Marketing, 40(1/2), 100-112.

127
Gu, Z. (1993). Debt use and profitability: A reality check for the restaurant industry.
Foodservice Research International, 7(3), 135-147.
Gu, Z. (1996). Financial ratios of the restaurant industry by types of operations: before
and after the recent recession. Bottomline, 11(3), 20-22.
Gulen, H., & Ion, M. (2016). Policy uncertainty and corporate investment. Review of
Financial Studies, 29(3), 523-564.
Harrington, R. (2001). Environmental uncertainty within the hospitality industry:
Exploring the measure of dynamism and complexity between restaurant segments.
Journal of Hospitality & Tourism Research, 25(4), 386-398.
Hart, O. D. (1985). Monopolistic competition in the spirit of Chamberlin: A general
model. The Review of Economic Studies, 52(4), 529-546.
Hartman, R. (1972). The effects of price and cost uncertainty on investment. Journal of
economic theory, 5(2), 258-266.
Hausman, J. A., & Taylor, W. E. (1981). Panel data and unobservable individual effects.
Econometrica: Journal of the Econometric Society, 49(6), 1377-1398.
Hawley, A. H. (1968). Human Ecology//International Encyclopedia of Social Sciences.
L. NY: Mancmillan, 328-337.
Hayashi, F. (1982). Tobin's marginal q and average q: A neoclassical interpretation.
Econometrica: Journal of the Econometric Society, 50(1), 213-224.
Hirshleifer, D. (1993). Managerial reputation and corporate investment decisions.
Financial Management, 22, 145-145.
Horovitz, B. (March 5, 2014). Consumers plan to spend less eating out. USA Today.
Retrieved from
http://www.usatoday.com/story/money/business/2014/03/05/restaurant-traffic-
eating-out-less/6027247/
Hovakimian, G. (2009). Determinants of Investment Cash Flow Sensitivity. Financial
Management, 38(1), 161-183. doi:10.1111/j.1755-053X.2009.01032.x
Hua, N., & Dalbor, M. C. (2013). Evidence of franchising on outperformance in the
restaurant industry: A long term analysis and perspective. International Journal of
Contemporary Hospitality Management, 25(5), 723-739.
Hubbard, R. G. (1998). Capital-market imperfections and investment. Journal of
Economic Literature, 36(1), 193-225.
Hubbard, R. G., Kashyap, A. K., & Whited, T. M. (1995). Internal Finance and Firm
Investment. Journal of Money, Credit and Banking, 27(3), 683-701.
128
Huizinga, J. (1993). Inflation uncertainty, relative price uncertainty, and investment in
US manufacturing. Journal of Money, Credit and Banking, 25(3), 521-549.
Isidore, C. (2008, December 1). It's official: Recession since Dec. '07. Retrieved from
http://money.cnn.com/2008/12/01/news/economy/recession/index.htm?postversio
n=2008120112
Izzo, P. (September 20, 2010). Recession over in June 2009. The Wall Street Journal.
Retrieved from http://blogs.wsj.com/economics/2010/09/20/nber-recession-
ended-in-june-2009/
Jagels, M. G., & Ralston, C. E. (2007). Hospitality management accounting (Vol.
831154902): John Wiley & Sons New York, NY.
Jang, S. S., & Namkung, Y. (2009). Perceived quality, emotions, and behavioral
intentions: Application of an extended Mehrabian–Russell model to restaurants.
Journal of Business Research, 62(4), 451-460.
Jang, S. S., & Ryu, K. (2006). Cross-balance sheet interdependencies of restaurant firms:
a canonical correlation analysis. International Journal of Hospitality
Management, 25(1), 159-166.
Jargon, J. (October 10, 2012). Fast food aspires to 'fast casual’. Retrieved from
http://online.wsj.com/news/articles/SB10000872396390444657804578048651773
669168
Jargon, J. (January 23, 2013). McDonald's says economic uncertainty weighs on sales.
The Wall Street Journal. Retrieved from
http://www.wsj.com/articles/SB1000142412788732353980457825951175570414
2
Jennings, L. (March 17, 2014). QSR breakfast battle escalates. Retrieved from
http://nrn.com/quick-service/qsr-breakfast-battle-escalates
Jensen, M. C. (1986). Agency costs of free cash flow, corporate finance, and takeovers.
The American Economic Review, 76(2), 323-329.
Jones, G. R., Kosnik, R. D., & George, J. M. (1993). Internalization and the firm's growth
path: On the psychology of organizational contracting. Research in
Organizational Change and Development, 105-136.
Jones, R. A., & Ostroy, J. M. (1984). Flexibility and Uncertainty. The Review of
Economic Studies, 51(1), 13-32.
Kahneman, D., & Tversky, A. (1979). Prospect theory: An analysis of decision under
risk. Econometrica: Journal of the Econometric Society, 47(2), 263-291.

129
Kaplan, S. N., & Zingales, L. (1997). Do investment-cash flow sensitivities provide
useful measures of financing constraints? Quarterly Journal of Economics,
112(1), pp. 169-215.
Khandwalla, P. N. (1977). The design of organizations (Vol. 260): Harcourt Brace
Jovanovich New York.
Kim, H., & Gu, Z. (2003). Risk-adjusted performance: a sector analysis of restaurant
firms. Journal of Hospitality & Tourism Research, 27(2), 200-216.
Kimes, S. E. (1999). Implementing restaurant revenue management: a five-step approach.
The Cornell Hotel and Restaurant Administration Quarterly, 40(3), 16-11.
Kimes, S. E., Chase, R. B., Choi, S., Lee, P. Y., & Ngonzi, E. N. (1998). Restaurant
revenue management applying yield management to the restaurant industry.
Cornell Hotel and Restaurant Administration Quarterly, 39(3), 32-39.
Kitching, J., Blackburn, R., Smallbone, D., & Dixon, S. (2009). Business strategies and
performance during difficult economic conditions. Retrieved from
http://eprints.kingston.ac.uk/5852/1/Kitching-J-5852.pdf
Kline, D. (February 4, 2014). McDonald's coffee vs. Starbucks -- can McCafe make a
dent?. Retrieved from
http://www.fool.com/investing/general/2014/02/04/mcdonalds-coffee-vs-
starbucks-can-mccafe-make-a-de.aspx?source=isesitlnk0000001&mrr=0.17
Koetse, M. J., de Groot, H. L. F., & Florax, R. J. G. M. (2009). A Meta‐Analysis of the
Investment‐Uncertainty Relationship. Southern Economic Journal, 76(1), 283-
306.
Koh, Y., Lee, S., & Boo, S. (2009). Does franchising help restaurant firm value?
International Journal of Hospitality Management, 28(2), 289-296.
Koh, Y., Rhou, Y., Lee, S., & Singal, M. (2015). Does Franchising Alleviate Restaurants’
Vulnerability to Economic Conditions? Journal of Hospitality & Tourism
Research.
Konigsberg, C. (2007). America's Priorities: How the US Government Raises and Spends
$3,000,000,000,000 (trillion) Per Year: AuthorHouse.
Kraay, A., & Ventura, J. (2007). The Dot-Com Bubble, the Bush Deficits, and the US
Current Account. NBER Chapters, 457-496.
Krüger, P., Landier, A., & Thesmar, D. (2011). The WACC fallacy: The real effects of
using a unique discount rate. Journal of Finance, 70(3), 1253-1285.
Kulatilaka, N., & Perotti, E. C. (1998). Strategic growth options. Management Science,
44(8), 1021-1031.

130
Lambrecht, B., & Perraudin, W. (2003). Real options and preemption under incomplete
information. Journal of Economic dynamics and Control, 27(4), 619-643.
Lang, L., Ofek, E., & Stulz, R. (1996). Leverage, investment, and firm growth. Journal of
financial Economics, 40(1), 3-29.
Leary, M. T., & Roberts, M. R. (2014). Do peer firms affect corporate financial policy?
The Journal of Finance, 69(1), 139-178.
Leung, S. (October 1, 2003). A glutted market is leaving food chains hungry for sites.
Retrieved from http://online.wsj.com/news/articles/SB10649642768823100
Lewellen, J., & Lewellen, K. (2013). Investment and cashflow: New evidence.
Forthcoming in Journal of Financial and Quantitative Analysis.
Lewis, P., & Thomas, H. (1990). The linkage between strategy, strategic groups, and
performance in the UK retail grocery industry. Strategic Management Journal,
11(5), 385-397.
Liddle, A.J. (2009, August 17). Recession batters upscale chains as sales, traffic dips sap
profits. Retrieved from http://nrn.com/corporate/recession-batters-upscale-chains-
sales-traffic-dips-sap-profits
Lieberman, M. B., & Asaba, S. (2006). Why do firms imitate each other? Academy of
Management Review, 31(2), 366-385.
Liu, Y., & Jang, S. S. (2009). The effects of dining atmospherics: an extended
Mehrabian–Russell model. International Journal of Hospitality Management,
28(4), 494-503.
Lockyer, S. E. (January 12, 2009). NRA survey reveals record-low capital spending in
Nov. Nation's Restaurant News 43(2), 12-12 1/5
Makinen, G. (2011). Economic effects of 9/11: A retrospective assessment: DIANE
Publishing.
March, J. G. (1978). Bounded rationality, ambiguity, and the engineering of choice. The
Bell Journal of Economics, 9(2), 587-608.
Martin, R. E. (1988). Franchising and Risk Management. The American Economic
Review, 78(5), 954-968.
Martinez, R. J., & Dacin, M. T. (1999). Efficiency motives and normative forces:
Combining transactions costs and institutional logic. Journal of Management,
25(1), 75-96.
Mathewson, G., & Winter, R. (1985). The Economics of Franchise Contracts. Journal of
Law & Economics, 28(3), 503-526.

131
Maze, J. (February 20, 2015). Wendy’s franchisee files counterclaim over remodels.
Retrieved from http://nrn.com/corporate-news/wendy-s-franchisee-files-
counterclaim-over-remodels
MCD: Key statistics for McDonald’s Crop. (n.d.) Retrieved May 25, 2016 from
http://finance.yahoo.com/q/ks?s=MCD+Key+Statistics
McNabb, B. (April 28, 2013). Uncertainty is the enemy of recovery. The Wall Street
Journal. Retrieved from
http://www.wsj.com/articles/SB1000142412788732378970457844343127788952
0
Meyer, J. W., & Rowan, B. (1977). Institutionalized organizations: Formal structure as
myth and ceremony. American Journal of Sociology, 83(2), 340-363.
Michael, S. C. (2000). Do franchised chains advertise enough? Journal of Retailing,
75(4), 461-478.
Mintel (2013, October). Fast Casual Restaurants. Retrieved from Mintel Market
Research Reports database.
Modigliani, F., & Miller, M. H. (1958). The cost of capital, corporation finance and the
theory of investment. The American Economic Review, 48(3), 261-297.
Moran, P., & Ghoshal, S. (1996). Theories of economic organization: The case for
realism and balance. Academy of Management Review, 21(1), 58-72.
Morath, W., & Hudson, K. (July 24, 2014). New-home slowdown pressures economy.
The Wall Street Journal. Retrieved from http://www.wsj.com/articles/new-home-
sales-fall-in-june-1406210849
Mun, S. G., & Jang, S. (2015). Working capital, cash holding, and profitability of
restaurant firms. International Journal of Hospitality Management, 48(0), 1-11.
Myers, S. C. (1984). The capital structure puzzle. Journal of Finance, 39(3), 574-592.
Neuman, W. (June 24, 2009). Discounts have restaurants eating own lunch. Retrieved
from http://www.nytimes.com/2009/06/24/business/24casual.html
New York Times. (September 15, 1981). Ford will close unit in Flat Rock. New York
Times. Retrieved from http://www.nytimes.com/1981/09/15/business/ford-will-
close-unit-in-flat-rock.html
Nichols, C. (2013). Burger giants roll out remodels, but are you noticing?. Retrieved from
http://finance.yahoo.com/blogs/the-exchange/burger-giants-roll-remodels-
noticing-150243628.html

132
Nickerson, J. A., & Silverman, B. S. (2003). Why firms want to organize efficiently and
what keeps them from doing so: Inappropriate governance, performance, and
adaptation in a deregulated industry. Administrative science quarterly, 48(3), 433-
465.
NPD Group. (January 23, 2013). U.S. total restaurant count increases by 4,442 units over
last year, reports NPD. Retrieved from
https://www.npd.com/wps/portal/npd/us/news/press-releases/us-total-restaurant-
count-increases-by-4442-units-over-last-year-reports-npd/
O’connor, P. (2014, March 12). WSJ/NBC news poll: Obama's approval rating hits new
low. The Wall Street Journal. Retrieved from
http://online.wsj.com/news/articles/SB10001424052702304250204579433533118
580224
Oliver, C. (1997). Sustainable competitive advantage: Combining institutional and
resource-based views. Strategic management journal, 18(9), 697-713.
Parekh, R. (2009). When will this end? Advertising Age (February 16). Retrieved from
http://adage.com/article/news/p-g-unilever-colgate-coke-a-b-cutting-
budgets/134634/
Parsa, H. G., Self, J. T., Njite, D., & King, T. (2005). Why restaurants fail. Cornell Hotel
and Restaurant Administration Quarterly, 46(3), 304-322.
Peach, R. W. (2001). The Evolution of the Federal Budget and Fiscal Rules. Available at
SSRN 2094470.
Peteraf, M. A., & Bergen, M. E. (2003). Scanning dynamic competitive landscapes: a
market‐based and resource‐based framework. Strategic Management Journal,
24(10), 1027-1041.
Pfeffer, I. (1956). Insurance and economic theory: Pub. for SS Huebner Foundation for
Insurance Education, Univ. of Pennsylvania, by RD Irwin.
Phillips, P. C. B., & Perron, P. (1988). Testing for a unit root in time series regression.
Biometrika, 75(2), 335-346.
Pindyck, R. S. (1991). IRREVERSIBILITY, UNCERTAINTY, AND INVESTMENT.
Journal of Economic Literature, 29, 1110-1148.
Pitz, G. F., & Sachs, N. J. (1984). Judgment and decision: Theory and application.
Annual Review of Psychology, 35(1), 139-164.
PNRA: Key statistics for Panera Bread Company. (n.d.) Retrieved May 25, 2016 from
http://finance.yahoo.com/q/ks?s=PNRA+Key+Statistics

133
Pástor, Ľ., & Veronesi, P. (2013). Political uncertainty and risk premia. Journal of
Financial Economics, 110(3), 520-545.
Raith, M. (1996). Product differentiation, uncertainty and the stability of collusion. LSE
STICERD Research Paper No. EI16.
Ramey, V. A., & Shapiro, M. D. (2001). Displaced capital: A study of aerospace plant
closings. Journal of Political Economy, 109(5), 958-992.
Ries, L. (July 8, 2013). Menu proliferation can lead to identity crisis. Retrieved from
http://nrn.com/advertising/menu-proliferation-can-lead-identity-crisis
Robbins, D. K., & Pearce, J. A. (1992). Turnaround: Retrenchment and recovery.
Strategic Management Journal, 13(4), 287-309. doi:10.1002/smj.4250130404
Roberts, P. W., & Greenwood, R. (1997). Integrating transaction cost and institutional
theories: Toward a constrained-efficiency framework for understanding
organizational design adoption. Academy of Management Review, 22(2), 346-373.
Rodrik, D. (1991). Policy uncertainty and private investment in developing countries.
Journal of Development Economics, 36(2), 229-242.
Ruggless, R. (August 9, 2012). Brinker: 4Q earnings rise on reimaging. Retrieved from
http://nrn.com/latest-headlines/brinker-4q-earnings-rise-reimaging
Ruggless, R. (January 15, 2013). Schlotzsky’s sees growth with reimaged units.
Retrieved from http://nrn.com/latest-headlines/schlotzsky-s-sees-grows-reimaged-
units?page=1
Ryu, K., Lee, H.-R., & Kim, W. G. (2012). The influence of the quality of the physical
environment, food, and service on restaurant image, customer perceived value,
customer satisfaction, and behavioral intentions. International Journal of
Contemporary Hospitality Management, 24(2), 200-223.
Samson, S., Reneke, J. A., & Wiecek, M. M. (2009). A review of different perspectives
on uncertainty and risk and an alternative modeling paradigm. Reliability
Engineering & System Safety, 94(2), 558-567.
Sarkar, S. (2000). On the investment–uncertainty relationship in a real options model.
Journal of Economic Dynamics and Control, 24(2), 219-225.
Schaan, D. N. (2007). An Empirical Investigation of Corporate Investment Decisions:
ProQuest.
Scharfstein, D. S., & Stein, J. C. (1990). Herd Behavior and Investment. The American
Economic Review, 80(3), 465-479.

134
Scherer, F. (1980). Industrial market structure and economic performance. Chicago, IL:
Rand McNally.
Schrambling, R. (November 2, 2009). Why now is the time to open a restaurant.
Retrieved from https://www.entrepreneur.com/article/203700
Scott, W. R. (1981). Developments in organization theory, 1960-1980. The American
Behavioral Scientist, 24(3), 407-422.
Scott, W. R. (1987). The adolescence of institutional theory. Administrative science
quarterly, 32(4), 493-511.
Selznick, P. (1957). Leadership in administration: A sociological interpretation.
Evanston, IL: Pew, Peterson, and Co
Siegel, P. H., Agrawal, S., & Rigsby, J. T. (1997). Organizational and professional
socialization: Institutional isomorphism in an accounting context. The Mid-
Atlantic Journal of Business, 33(1), 49-68.
Silberston, A. (1983). Efficiency and the Individual Firm'. Microeconomic Efficiency and
Macroeconomic Performance, Philip Allen, London.
Simon, H. A. (1955). A behavioral model of rational choice. The Quarterly Journal of
Economics, 69(1), 99-118.
Simon, H. A. (1972). Theories of bounded rationality. Decision and organization, 1(1),
161-176.
Smith, C. W., & Stulz, R. M. (1985). The determinants of firms' hedging policies.
Journal of financial and quantitative analysis, 20(4), 391-405.
Smith, V. L., & Walker, J. M. (1993). Monetary rewards and decision cost in
experimental economics. Economic Inquiry, 31(2), 245-261.
Snel, A. (August 6, 2011). Quick-service restaurants hit customers' sweet tooth.
Retrieved from http://nrn.com/archive/quick-service-restaurants-hit-customers-
sweet-tooth
Srinivasan, R., Rangaswamy, A., & Lilien, G. L. (2005). Turning adversity into
advantage: Does proactive marketing during a recession pay off? International
Journal of Research in Marketing, 22(2), 109-125.
Steenkamp, J.-B. E. M., & Fang, E. (2011). The impact of economic contractions on the
effectiveness of R&D and advertising: Evidence from US companies spanning
three decades. Marketing Science, 30(4), 628-645.
Stein, L. C. D., & Stone, E. C. (2012). The effect of uncertainty on investment, hiring,
and R&D: Causal evidence from equity options. Arizona State University.

135
Stynes, T. (September 29, 2010). DineEquity Nears Deal to Refranchise 86 Applebee's.
Retrieved from
http://online.wsj.com/news/articles/SB10001424052748704116004575522273054
978664
Sum, A., Khatiwada, I., McLaughlin, J., & Palma, S. (2009). The economic recession of
2007-2009: A comparative perspective on its duration and the severity of its labor
market impacts. Documento de trabajo del Center for Labor Market Studies,
Northeastern University.[Links].
Thompson, J. D. (1967). Organizations in action: Social science bases of administrative
theory: Transaction publishers.
Thorn, B. (2014, January 9). Fine-dining restaurants poised for growth in 2014. Retrieved
from http://nrn.com/fine-dining/fine-dining-restaurants-poised-growth-2014
Tobin, J. (1969). A general equilibrium approach to monetary theory. Journal of money,
credit and banking, 1(1), 15-29.
Tobin, J., & Brainard, W. C. (1977). Asset markets and the cost of capital. Economic
Progress, Private Values, and Public Economic Journal, 96, 120-138.
Tse, E. C.-Y., & Olsen, M. D. (1988). The impact of strategy and structure on the
organizational performance of restaurant firms. Journal of Hospitality & Tourism
Research, 12(2), 265-276.
Tuzel, S. (2010). Corporate real estate holdings and the cross-section of stock returns.
Review of Financial Studies, 23(6), 2268-2302.
Tversky, A., & Kahneman, D. (1974). Judgment under Uncertainty: Heuristics and
Biases. Science, 185(4157), 1124-1131.
Walkup, C. (March 29, 2007). Fast feeders work to revitalize brands through unit
remodelings. Retrieved from http://nrn.com/archive/fast-feeders-work-revitalize-
brands-through-unit-remodelings-0
Wall Street Journal. (2010, January 27). The Obama fisc. The Wall Street Journal.
Retrieved from
http://online.wsj.com/articles/SB100014240527487039062045750271816563629
48
Welch, I. (1992). Sequential sales, learning, and cascades. The Journal of finance, 47(2),
695-732.
Whited, T. M. (1992). Debt, liquidity constraints, and corporate investment: Evidence
from panel data. The Journal of Finance, 47(4), 1425-1460.

136
Whited, T. M., & Wu, G. (2006). Financial Constraints Risk. Review of Financial
Studies, 19(2), 531-559.
Willett, A. H. (1901). The economic theory of risk and insurance: The Columbia
university press.
Williamson, O. E. (1989). Transaction cost economics. Handbook of industrial
organization, 1, 135-182.
Williamson, S. (1981), The moral hazard theory of corporate financial structure: An
empirical test, Unpublished Ph.D. Dissertation, MIT.
Wolinsky, A. (1986). True monopolistic competition as a result of imperfect information.
The Quarterly Journal of Economics, 101(3), 493-511.
Youn, H., & Gu, Z. (2009). US restaurant firm performance check: An examination of
the impact of the recent recession. The Journal of Hospitality Financial
Management, 17(2), 35-53.
Zhang, L. (2005). The value premium. The Journal of Finance, 60(1), 67-103.
Zheng, T., Farrish, J., & Wang, X. (2013). How did different restaurant segments perform
differently through the recession?: An ARIMA with intervention analysis on US
restaurant stock indices. Journal of Hospitality Financial Management, 20(2), 1.
Zillman, C. (2014, April 23). Will the real McDonald's please stand up?. Retrieved from
http://fortune.com/2014/04/23/will-the-real-mcdonalds-please-stand-up/
Zucker, L. G. (1983). Organizations as institutions. Research in the Sociology of
Organizations, 2(1), 1-47. Zuckerman, G. (August 2, 2014). Real estate’s epic
rebound starts to cool. The Wall Street Journal. Retrieved from
http://www.wsj.com/articles/real-estates-epic-rebound-starts-to-cool-1407034789
Zwolak, R., (2010). IBISWorld Industry Report 72211. Full-service restaurants in the
US. Retrieved from IBISWorld database.

APPENDIX

137
APPENDIX
The list of restaurant chains used in Study 1 and 2 is presented below. Firm-year
observations less than five are excluded from the sample.
Quick service
Back Yard Burgers Inc
Burger King Worldwide Inc
Carrols Restaurant Group Inc
Checkers Drive-In Restaurant
Cke Restaurants Inc
Davco Restaurants Inc
Domino's Pizza Inc
Good Times Restaurants Inc
Jack In The Box Inc
Krystal Co
Mcdonald's Corp
Meritage Hospitality Group
Morgans Foods Inc
Nathan's Famous Inc
Papa Johns International Inc
Pj America Inc
Rallys Hamburgers Inc
Santa Barbara Restaurant Grp
Sonic Corp
Wendy's Co
Wendy's International Inc
Yum Brands Inc
Fast casual
Boston Chicken Inc
Chipotle Mexican Grill Inc
Cosi Inc
Miami Subs Corp
Panera Bread Co
Pollo Tropical Inc
Rubio's Restaurants Inc
Schlotzsky's Inc
Taco Cabana
Wall Street Deli Inc
Fine dining
Mccormick & Schmicks Seafood
Mortons Restaurant Group Inc
Ruths Hospitality Group Inc
Smith & Wollensky Rstrnt Grp

138
Casual dining
Applebees Intl Inc
Ark Restaurants Corp
Avado Brands Inc
Back Bay Restaurant Grp Inc
Bayport Restaurant Gp
Benihana Inc
Bertuccis Inc
Biglari Holdings Inc
Bj's Restaurants Inc
Bob Evans Farms
Boston Restaurant Assoc Inc
Bravo Brio Restaurant Gp Inc
Brinker Intl Inc
Buca Inc
Buffalo Wild Wings Inc
California Pizza Kitchen Inc
Cec Entertainment Inc
Champps Entmt Inc
Cheesecake Factory Inc
Chefs International Inc
Cooker Restaurant/Oh
Cracker Barrel Old Ctry Stor
Cucos Inc
Darden Restaurants Inc
Dennys Corp
Dineequity Inc
Eateries Inc
El Chico Restaurants Inc
Elephant & Castle Group Inc
Elmer's Restaurants Inc
Famous Daves Of America Inc
Flanigans Enterprises Inc
Fox & Hound Restaurant Group
Friendly Ice Cream Corp
Frisch's Restaurants Inc
J. Alexander's Corp
Jerrys Famous Deli Inc
Kona Grill Inc
Koo Koo Roo Inc
Landrys Restaurants Inc
Lone Star Steakhouse Saloon
Lubys Inc
Main Street Restaurant Group
Max & Ermas Restaurants
Mexican Restaurants Inc
O'charley's Inc
Osi Restaurant Partners Inc
P F Changs China Bistro Inc
Perkins Family Rests
Phoenix Restaurant Group Inc
Piccadilly Cafeterias Inc
Rainforest Cafe Inc
Rare Hospitality Intl Inc
Red Robin Gourmet Burgers
Roadhouse Grill Inc
Rock Bottom Restaurants Inc
Ruby Tuesday Inc
Rudys Restaurant Group Inc
Sbarro Inc
Shoney's Inc
Silver Diner Inc
Skyline Chili Inc
Spaghetti Warehouse Inc
Summit Family Restaurnts Inc
Texas Roadhouse Inc
Timber Lodge Steakhouse Inc
Uno Restaurant Corp
Vicorp Restaurants Inc
Worldwide Restaurant Concept
Granite City Food & Brewery

VITA

139
VITA
EDUCATION
Ph.D. Hospitality and Tourism Management August, 2016
Purdue University West Lafayette, IN
M.S. Hospitality Business Management May, 2010
Michigan State University East Lansing, MI
B.A. Public Administration and Business Administration Aug, 2004
Sungkyunkwan University Seoul, South Korea
PROFESSIONAL EXPERIENCE
Assistant Consultant May, 2007-June, 2008
Franwise Consulting Seoul, South Korea
Associate January, 2005-April, 2007
Financial Management Department
Digital Printing Division
Samsung Electronics Co., Ltd.,
Suwon, South Korea
RESEARCH INTEREST
Uncertainty and Risk Management, Investment, Franchising
TEACHING INTEREST
Managerial/Financial Accounting, Strategic Management, Revenue Management,
Research Methods, Data Analysis

PUBLICATIONS

140
PUBLICATIONS
Sohn, J., Tang, C.H., & Jang, S.C. (2014) The asymmetric effect of the asset-light & fee-
oriented strategy: The business cycle matters! International Journal of Hospitality
Management, 40, 100-108. doi:http://dx.doi.org/10.1016/j.ijhm.2014.03.007
Sohn, J., Tang, C.H., & Jang, S.C. (2013). Does the asset-light & fee-oriented strategy
create value? International Journal of Hospitality Management, 32, 270-277.
doi:http://dx.doi.org/10.1016/j.ijhm.2012.07.004


![Ambulance Deployment under Demand Uncertainty - · PDF fileAmbulance Deployment under Demand Uncertainty . ... EMS appliance and manpower scheduling and shift planning[5,15] Ope](https://img.pdfslide.us/doc/110x75/5ab5a1b07f8b9ab7638cfc75/ambulance-deployment-under-demand-uncertainty-deployment-under-demand-uncertainty.jpg)