Embed Size (px)
Citation preview

Demand &
Supply
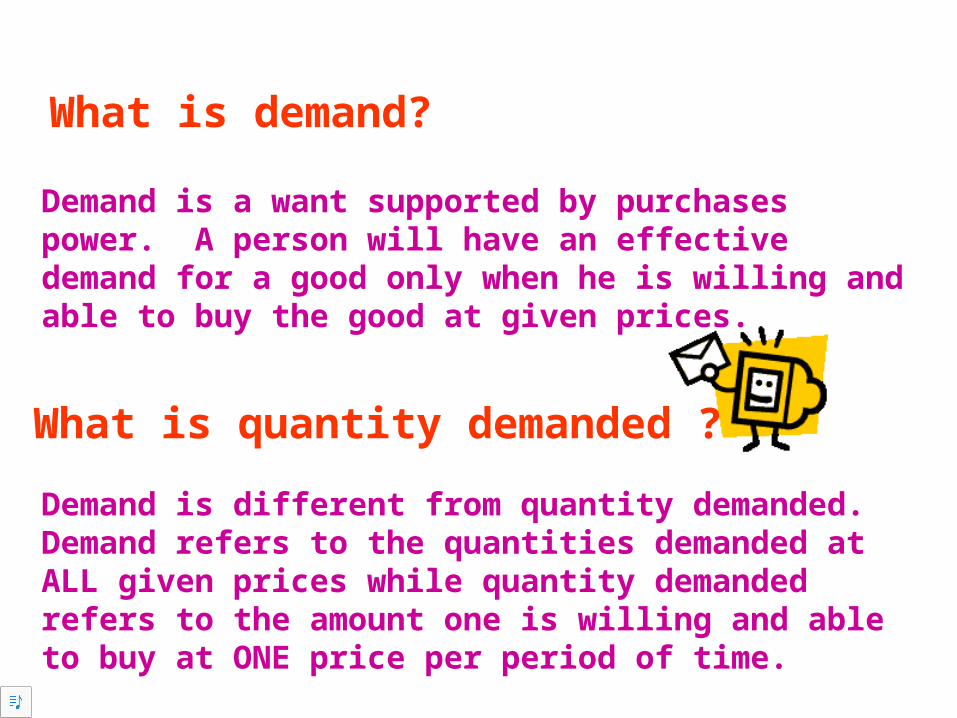
Demand is different from quantity demanded. Demand refers to the quantities demanded at ALL given prices while quantity demanded refers to the amount one is willing and able to buy at ONE price per period of time.
Demand is a want supported by purchases power. A person will have an effective demand for a good only when he is willing and able to buy the good at given prices.
What is demand?
What is quantity demanded ?
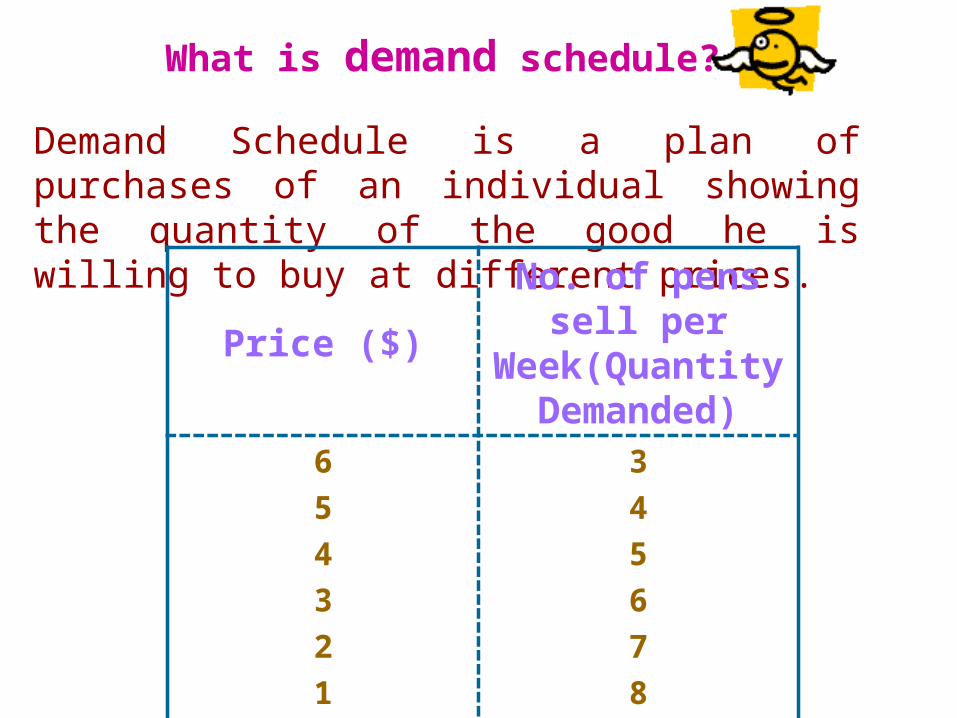
Demand Schedule is a plan of purchases of an individual showing the quantity of the good he is willing to buy at different prices.
What is demand schedule?
Price ($)No. of pens sell per
Week(Quantity Demanded)
6
5
4
3
2
1
3
4
5
6
7
8
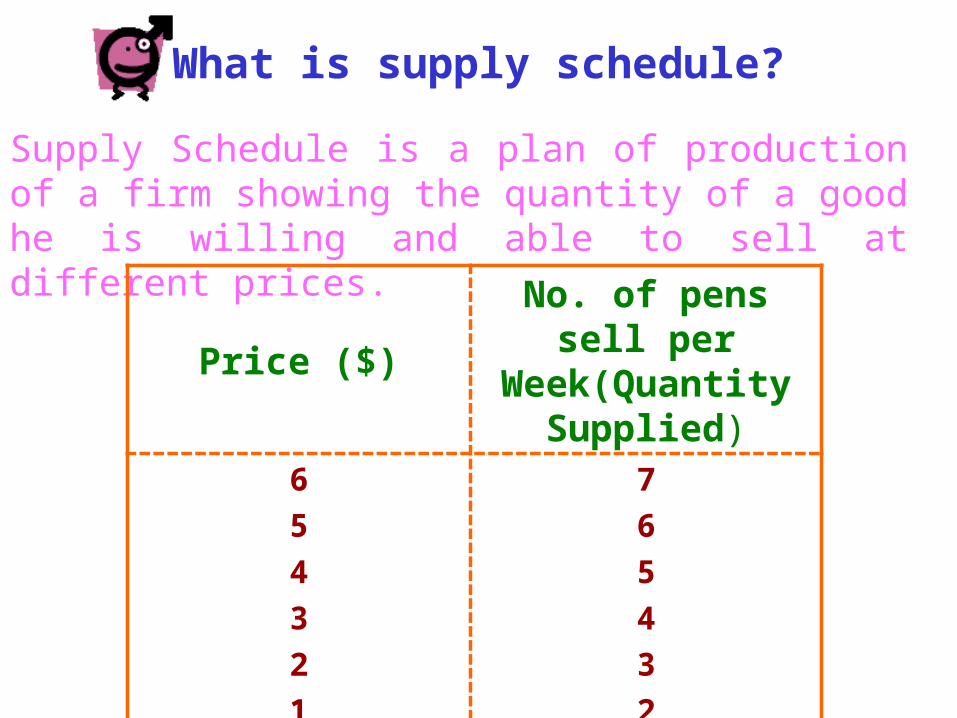
Supply Schedule is a plan of production of a firm showing the quantity of a good he is willing and able to sell at different prices.
What is supply schedule?
Price ($)No. of pens sell per
Week(Quantity Supplied)
6
5
4
3
2
1
7
6
5
4
3
2
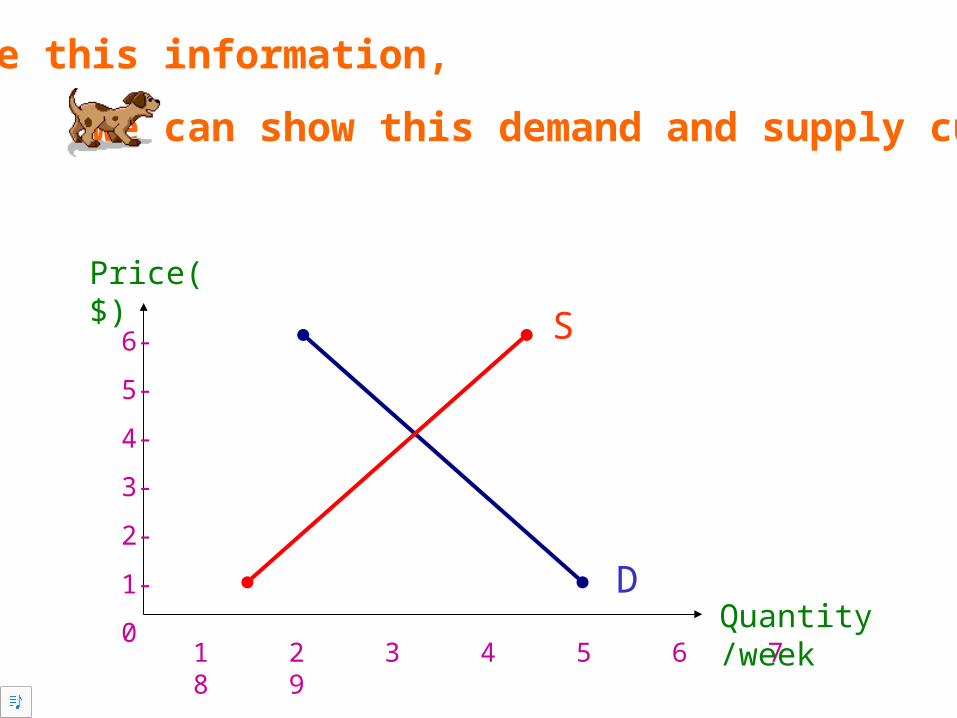
Use this information,
we can show this demand and supply curve.
S
D
6-
5-
4-
3-
2-
1-
01 2 3 4 5 6 7 8 9
Price($)
Quantity/week
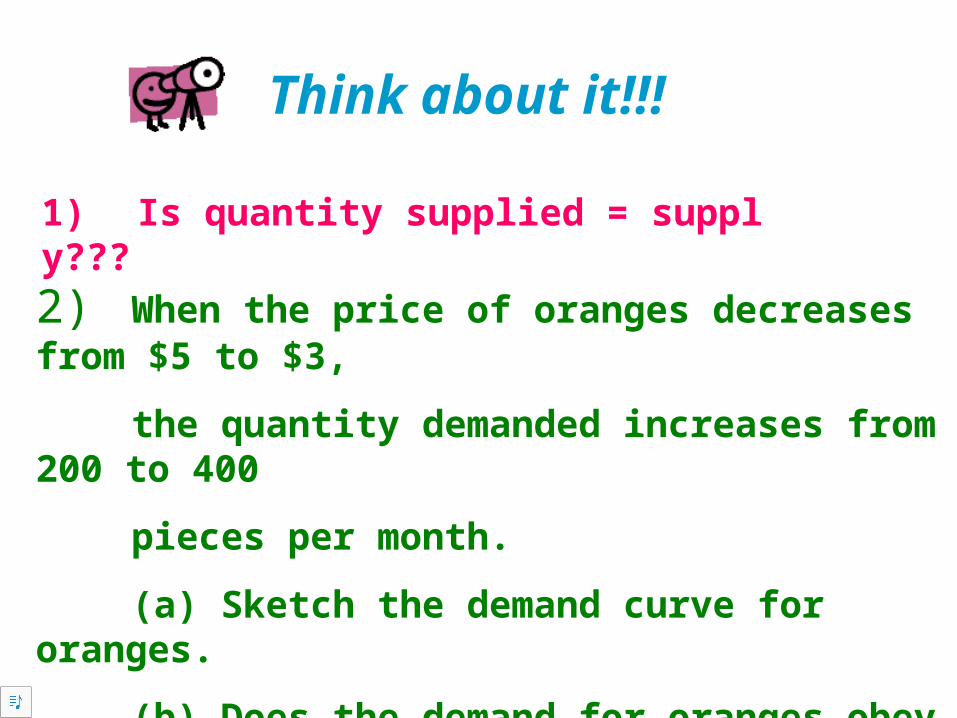
2) When the price of oranges decreases from $5 to $3,
the quantity demanded increases from 200 to 400
pieces per month.
(a) Sketch the demand curve for oranges.
(b) Does the demand for oranges obey the law of demand?
1) Is quantity supplied = supply???
Think about it!!!
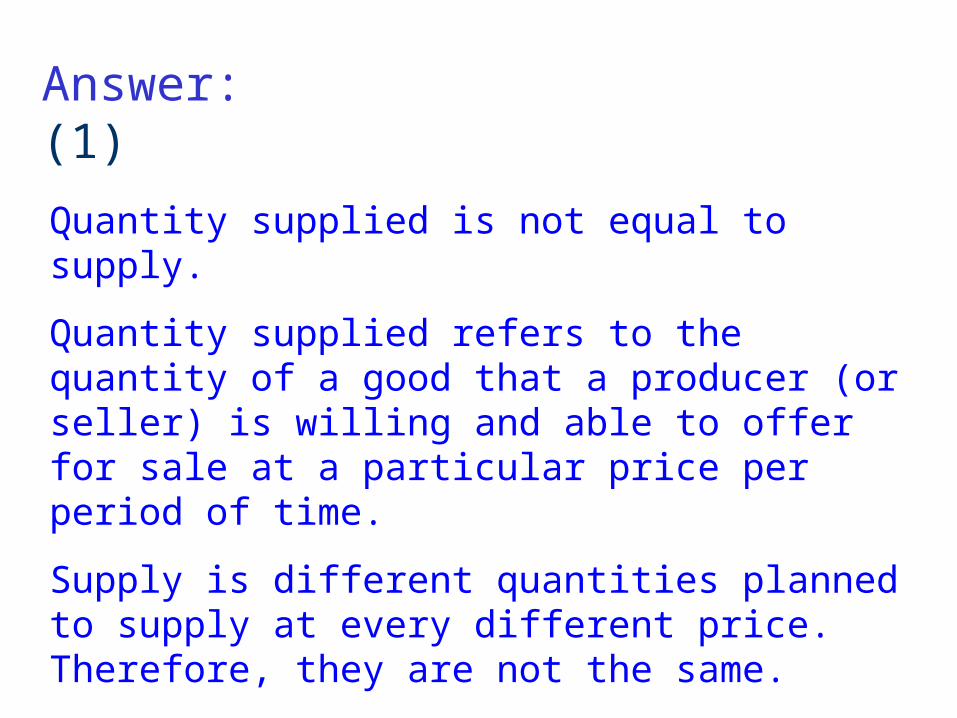
Answer: (1)
Quantity supplied is not equal to supply.
Quantity supplied refers to the quantity of a good that a producer (or seller) is willing and able to offer for sale at a particular price per period of time.
Supply is different quantities planned to supply at every different price. Therefore, they are not the same.
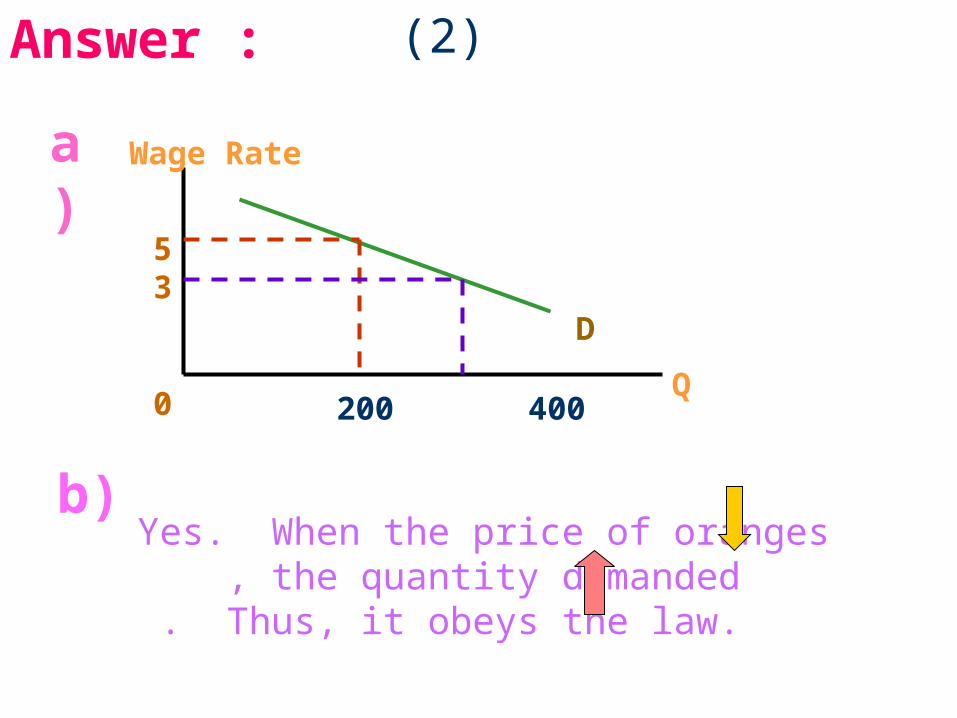
Answer :
a) Wage Rate
Q
D
53
0 200 400
b)Yes. When the price of oranges , the quantity demanded . Thus, it obeys the law.
(2)
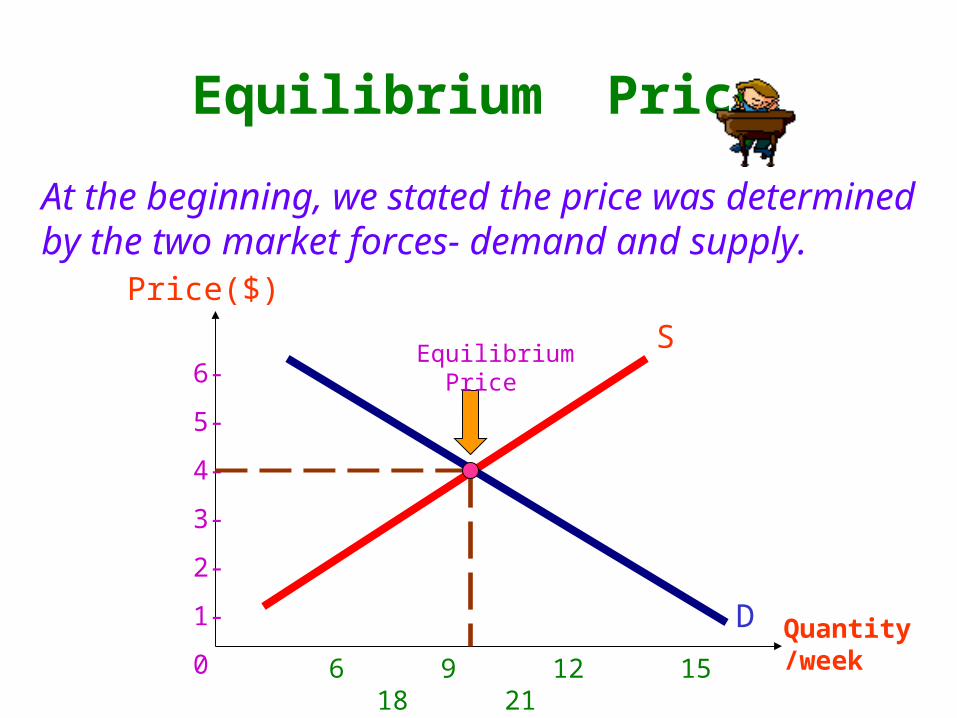
At the beginning, we stated the price was determined by the two market forces- demand and supply.
Equilibrium Price
S
Price($)
6-
5-
4-
3-
2-
1-
0 6 9 12 15 18 21
D Quantity/week
Equilibrium Price
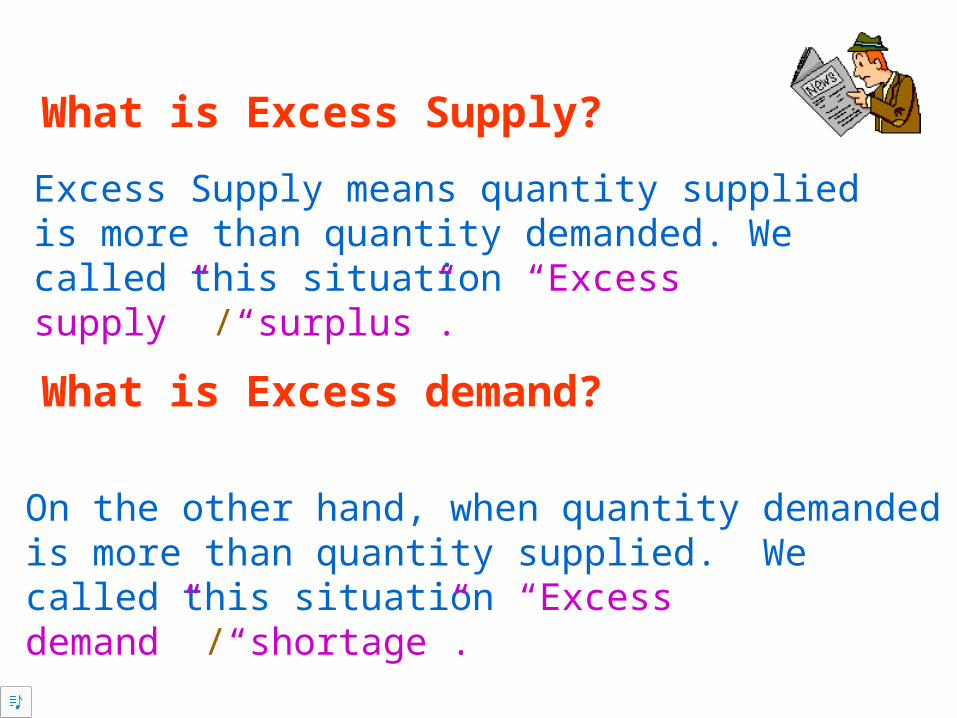
On the other hand, when quantity demanded is more than quantity supplied. We called this situation “Excess demand” /“shortage”.
What is Excess Supply?
Excess Supply means quantity supplied is more than quantity demanded. We called this situation “Excess supply” /“surplus”.
What is Excess demand?
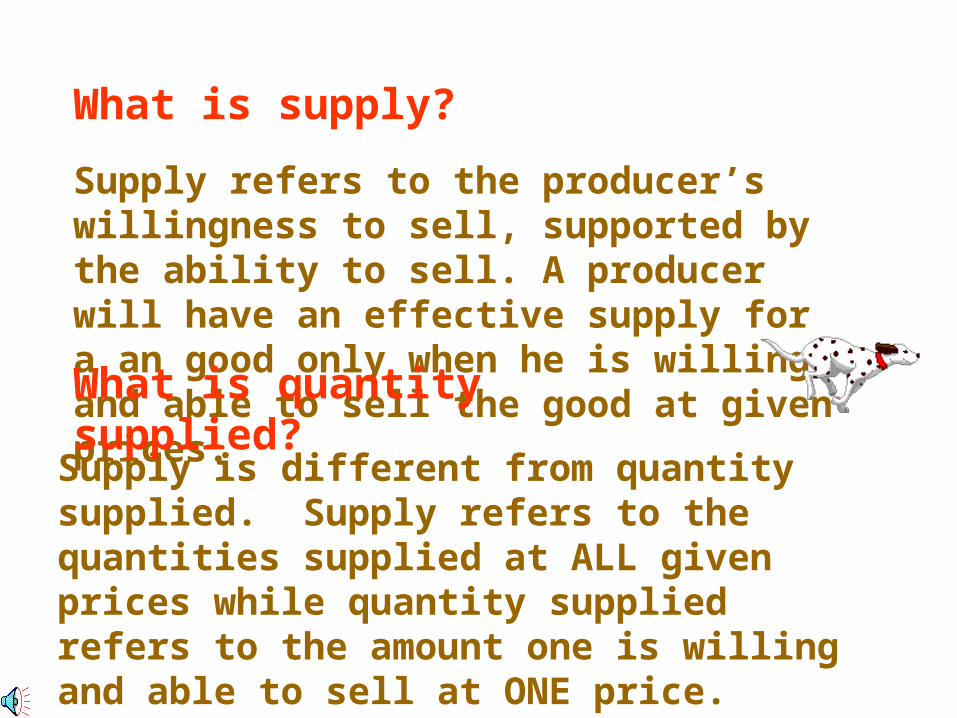
Supply is different from quantity supplied. Supply refers to the quantities supplied at ALL given prices while quantity supplied refers to the amount one is willing and able to sell at ONE price.
What is supply?
Supply refers to the producer’s willingness to sell, supported by the ability to sell. A producer will have an effective supply for a an good only when he is willing and able to sell the good at given prices.
What is quantity supplied?
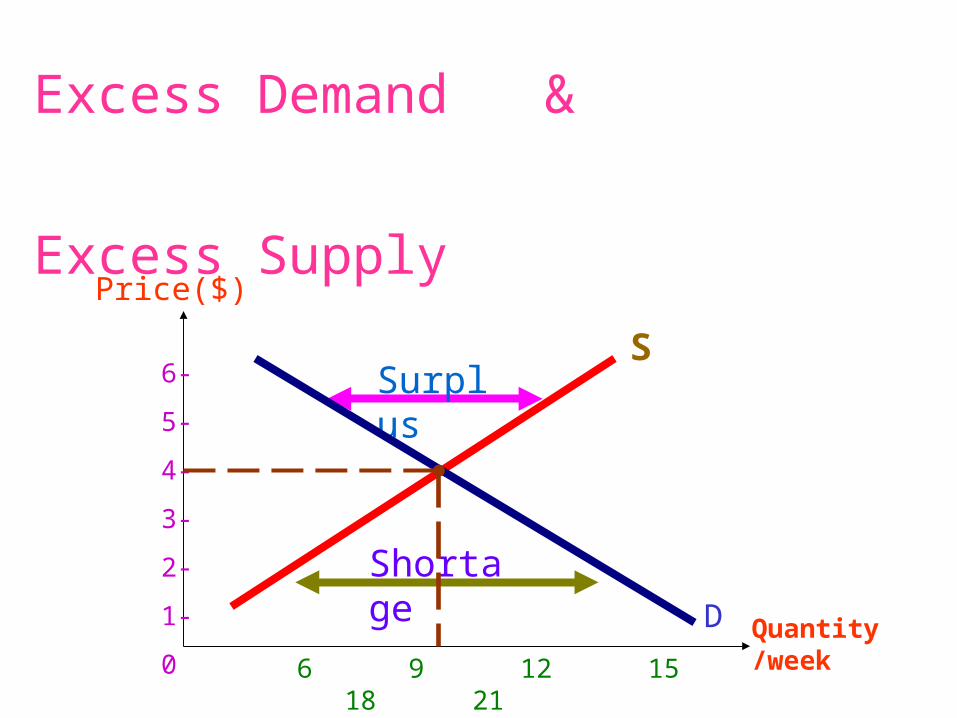
Excess Demand &
Excess Supply
Surplus
Shortage
Price($)
6-
5-
4-
3-
2-
1-
0 6 9 12 15 18 21
D Quantity/week
S
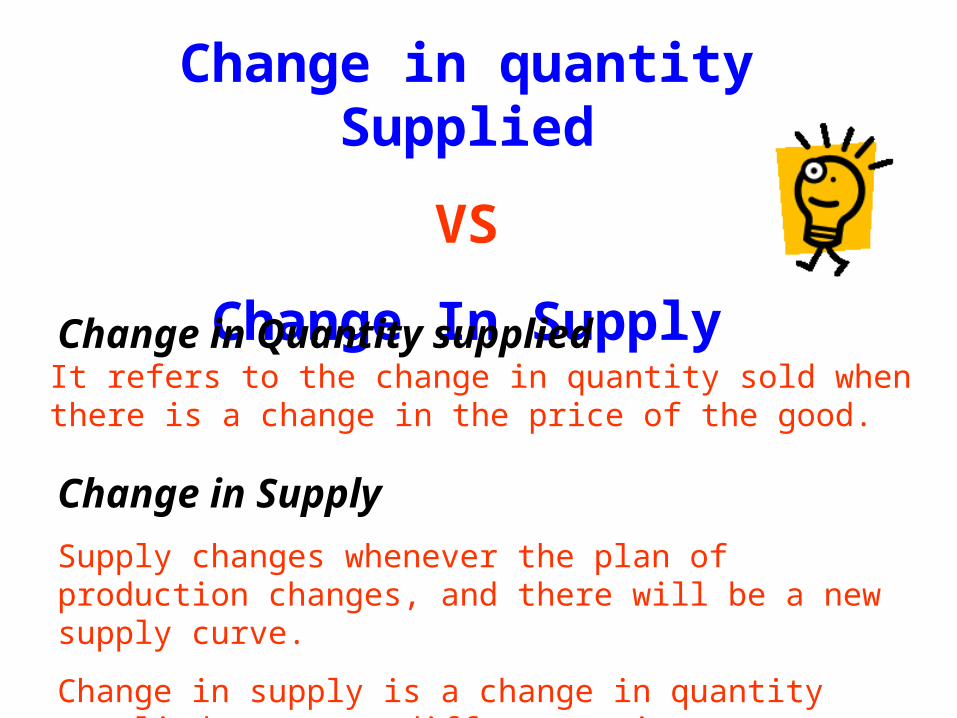
Change in Supply
Supply changes whenever the plan of production changes, and there will be a new supply curve.
Change in supply is a change in quantity supplied at every different price.
Change in quantity Supplied
VS
Change In SupplyChange in Quantity suppliedIt refers to the change in quantity sold when there is a change in the price of the good.

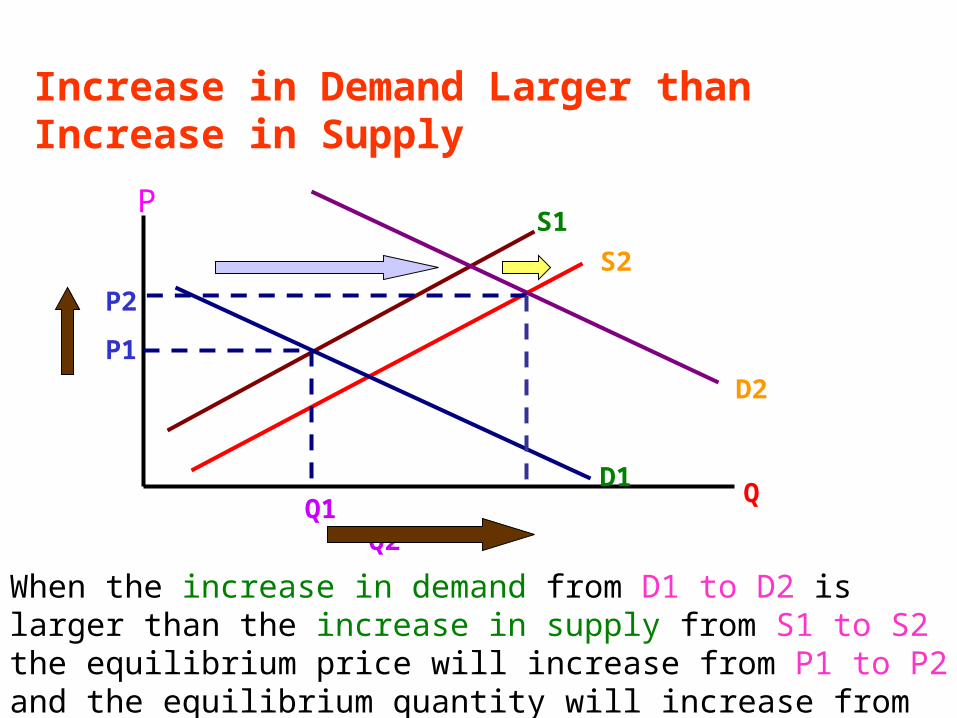
Increase in Demand Larger than Increase in Supply
When the increase in demand from D1 to D2 is larger than the increase in supply from S1 to S2 the equilibrium price will increase from P1 to P2 and the equilibrium quantity will increase from Q1 to Q2.
S1
S2
D1
D2
P
Q
P2
P1
Q1 Q2
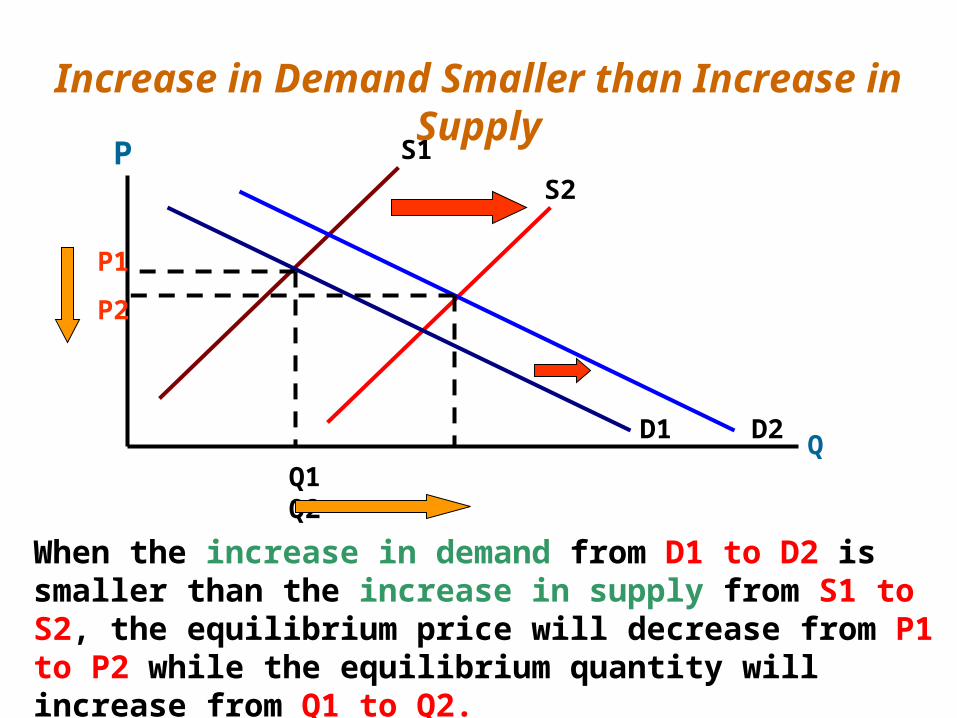
When the increase in demand from D1 to D2 is smaller than the increase in supply from S1 to S2, the equilibrium price will decrease from P1 to P2 while the equilibrium quantity will increase from Q1 to Q2.
Increase in Demand Smaller than Increase in Supply
D2
D1
S1
S2
P1
P2
Q1 Q2Q
P
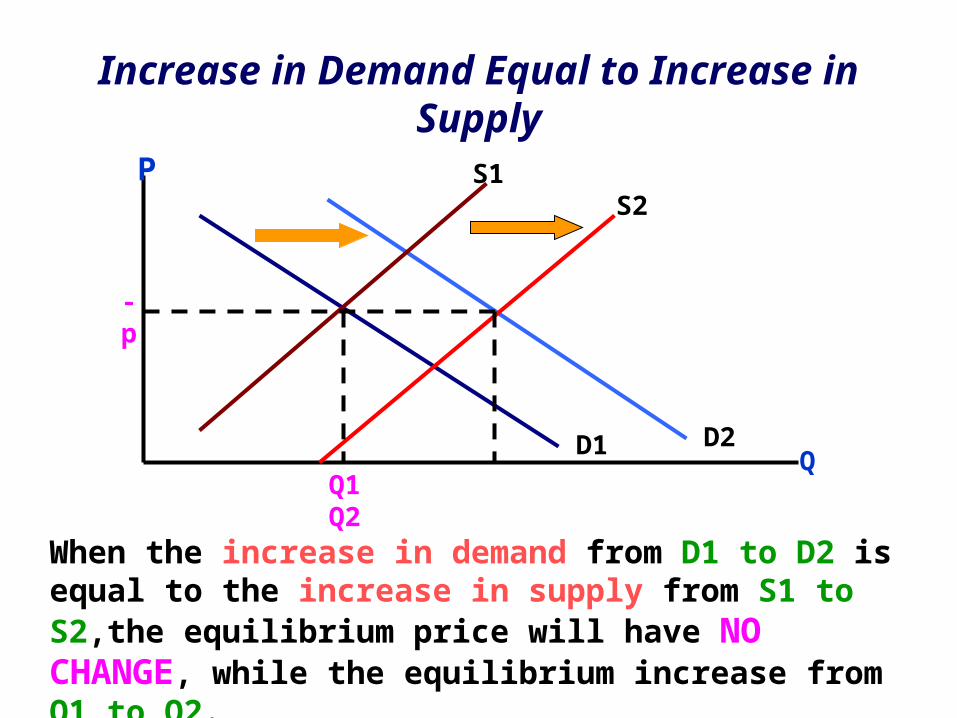
When the increase in demand from D1 to D2 is equal to the increase in supply from S1 to S2,the equilibrium price will have NO CHANGE, while the equilibrium increase from Q1 to Q2.
Increase in Demand Equal to Increase in Supply
-p
Q1 Q2
S1S2
D2D1
P
Q
Think about it !!
2. When the mad cow disease broke out in 1996, many cows were destroyed. With the aid of diagram, describes the effects on the beef market.
1. The popularity of mobile telephone service has increased recently and the government has more licenses to new operators.
With the aid of a supply demand diagram, explain why the charge per minute of the mobile telephone service would have decreased.
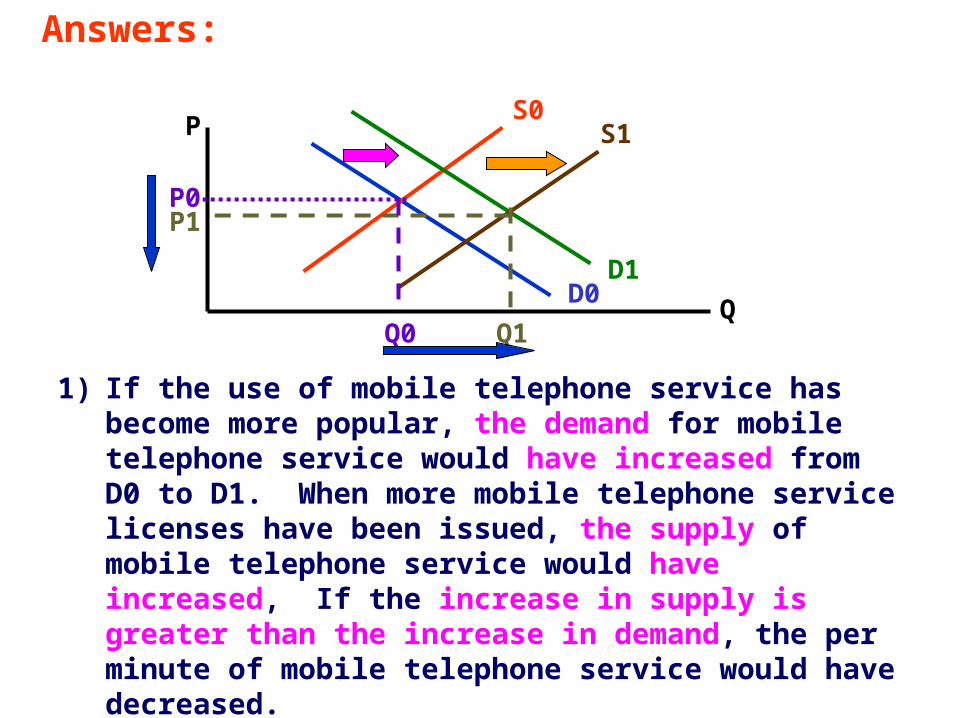
Answers:
1) If the use of mobile telephone service has become more popular, the demand for mobile telephone service would have increased from D0 to D1. When more mobile telephone service licenses have been issued, the supply of mobile telephone service would have increased, If the increase in supply is greater than the increase in demand, the per minute of mobile telephone service would have decreased.
P
QD0
S0
D1
S1
P0
Q0
P1
Q1

Answer : P
Q
D1
S1
D2
S2
P1
Q1
P2
Q20
Suppose the mad cow disease broke out, when there is decrease in supply fromS1 to S2 ,the supply curve shift to the left. And people don’t want to eat the mad cow, so the demand also decrease from D1 to D2, the demand curve shift to the left.
As a result,the equilibrium price will decrease from P1 to P2 and the quantity transacted will also decrease from Q1 to Q2.

Group Member:4B
Ivy Chan (4)
Phoebe Lai (20)
Emily Li (25)
Karen Ngan (30)