Embed Size (px)
Citation preview
45 ©2014 Pearson Education, Inc.
4 Demand, Supply, and Market Equilibrium
Chapter Summary In this chapter, we’ve seen how demand and supply determine prices. We also learned how to predict the effects of changes in demand or supply on prices and quantities. Here are the main points of the chapter:
• A market demand curve shows the relationship between the quantity demanded and price, ceteris paribus.
• A market supply curve shows the relationship between the quantity supplied and price, ceteris paribus.
• Equilibrium in a market is shown by the intersection of the demand curve and the supply curve. When a market reaches equilibrium, there is no pressure to change the price.
• A change in demand changes price and quantity in the same direction: An increase in demand increases the equilibrium price and quantity; a decrease in demand decreases the equilibrium price and quantity.
• A change in supply changes price and quantity in opposite directions: An increase in supply decreases price and increases quantity; a decrease in supply increases price and decreases quantity.
Study Tip In this chapter, pay careful attention to factors that shift the position of the demand and supply curves.
Learning Objectives
1. Describe and explain the law of demand. 2. Describe and explain the law of supply. 3. Explain the role of price in reaching a market equilibrium. 4. Describe the effect of a change in demand on the equilibrium price. 5. Describe the effect of a change in supply on the equilibrium price. 6. Use information on price and quantity to determine what caused a change in price.
46 O'Sullivan/Sheffrin/Perez, Macroeconomics, 8e
©2014 Pearson Education, Inc.
The model of supply and demand assumes that we have a perfectly competitive market. A perfectly competitive market is one with many sellers and buyers of a homogeneous product and no barriers to entry. In practice, this means that no single buyer or seller can affect the market price of the product. 4.1 The Demand Curve The quantity demanded of a particular good is the amount of a product that consumers are willing and able to buy. A number of factors affect how much of a good a consumer wants to purchase:
• The price of the product • The consumer’s income • The price of substitute goods • The price of complementary goods • The consumer’s preferences or tastes • The consumer’s expectations of future prices
To begin, we examine a demand schedule, a table that shows the relationship between the price of a product and the quantity demanded of that product. When we talk about a demand schedule, we assume that all of the other factors listed above (tastes, income, etc.) are held constant and only the price of the good changes. Figure 4.1 of the text shows both the demand schedule and the demand curve. The demand curve is a graphical representation of the demand schedule. The curve shows the relationship between the price of a good and the quantity demanded of that good. An individual demand curve shows the relationship between the price of a good and the quantity demanded by an individual consumer. A market demand curve shows the relationship between price and quantity demanded by all consumers. This is illustrated in Figure 4.2 of your text.
Think of the students in your microeconomics class. Each of you has some desired number of music downloads that you would purchase each month at a variety of prices. The relationship
between price and how many downloads you purchase in a month is your individual demand curve. If your class represented the entire market for music downloads, the market demand curve would be the total number of music downloads that people in the class would buy at a particular price. This exercise gives us the market quantity demanded at that price. When we do this for a number of different prices, we can find the market demand schedule or the market demand curve. As the price of a good rises, the quantity demanded decreases. This is known as the law of demand. Formally, the law of demand states that there is a negative relationship between price and quantity demanded, ceteris paribus. The movement along a demand curve is known as a change in quantity demanded. This refers to how the quantity purchased changes in response to a change in the price of a good. Let’s review an Application that answers a key question:
1. What is the law of demand?
APPLICATION 1: LAW OF DEMAND AND CIGARETTES This Application shows how a reduction in cigarette taxes in Canada led to an increase in the number of youths who smoked. As you would expect, lower cigarette prices lead current smokers to smoke more and encourages some nonsmokers to begin smoking.
Chapter 4: Demand, Supply, and Market Equilibrium 47
©2014 Pearson Education, Inc.
4.2 The Supply Curve Much of the logic for demand also applies to the supply side of the market. The quantity supplied is the amount of a product that firms are willing and able to sell. A number of factors affect the decision of the sellers:
• The price of the product • The wage paid to workers • The price of materials • The cost of capital • The state of production technology • Expectations about future prices • Government taxes and subsidies
As Figure 4.3 in the text illustrates, we define a supply schedule as a table that shows the relationship between the price of a product and quantity supplied (holding all the other supply factors constant), and a supply curve as a curve showing the relationship between price and quantity supplied. Notice that these definitions are similar to the ones you learned for the demand schedule and the demand curve. The law of supply states that there is a positive relationship between price and quantity supplied. This is true of both the individual supply curve, which shows the relationship between price and quantity supplied by an individual firm, and the market supply curve, which shows the relationship between price and quantity supplied by all firms. As output increases, the cost of producing each additional unit increases. This leads to an upward-sloping supply curve. This is an application of the marginal principle:
Marginal Principle Increase the level of an activity as long as its marginal benefit exceeds its marginal cost. Choose the level at which the marginal benefit equals the marginal cost.
As a way of thinking about supply, consider the market in which you are a supplier, the labor market. An employer offers you a wage (the price of labor), and you determine how many hours you are
willing to work in exchange for that wage. If an employer offers you too little money (say $8 per hour), you will choose not to work at all. The price is below your minimum supply price, the lowest price at which a product will be supplied. As the wage offers increase, you will become willing to work, and at higher prices you will be willing to offer more hours of labor. You may be willing to work five hours per week for $10 per hour, but if the wage is $13 per hour, you may be willing to work 15 hours per week. The market supply curve would illustrate the number of hours that all workers in the market would be willing to supply at each wage rate. Let’s review an Application that answers a key question:
2. What is the law of supply?
APPLICATION 2: LAW OF SUPPLY AND WOOLYMPICS This Application shows how a decrease in the price of wool led to less wool being offered for sale. In fact, low wool prices have encouraged producers to take land out of wool production and convert it to other uses.
48 O'Sullivan/Sheffrin/Perez, Macroeconomics, 8e
©2014 Pearson Education, Inc.
4.3 Market Equilibrium: Bringing Demand and Supply Together We have seen that at each price, the quantity demanded tells us how many units buyers are willing to buy and the quantity supplied tells us how many units sellers are willing to sell. Market equilibrium occurs at the price where the quantity demanded is equal to the quantity supplied. The price at which this occurs is called the equilibrium price because it is the price that balances the quantity demanded and the quantity supplied. At this price buyers are buying all the goods they desire, sellers are selling all the goods they desire, and there is no pressure for the market price to change. At prices other than the equilibrium, there is an imbalance between the quantity supplied and the quantity demanded. You can see this in Figure 4.6 in the text. At prices below $8, buyers want to buy more pizzas per month than sellers want to sell. This situation is known as excess demand, or a shortage, a situation where the quantity demanded exceeds the quantity supplied at the prevailing price. In a situation of excess demand, the price for a good will increase, causing the quantity demanded to fall and the quantity supplied to rise until they are in equilibrium. A price ceiling (prices capped by law below equilibrium) will create excess demand in the affected market. Rent control would be an example of a price ceiling. At prices above $8, suppliers are willing to sell more pizzas per month than demanders wish to purchase at those prices. This is known as an excess supply, or surplus, a situation in which the quantity supplied exceeds the quantity demanded at the prevailing price. A price floor (prices held above equilibrium by law) will create excess supply in the affected market. A minimum wage is an example of a price floor.
To get a picture of this situation, imagine a concert coming to your campus. Now imagine people standing in line for concert tickets, with those in the front of the line having the highest
willingness to pay and those at the back of the line the lowest willingness to pay. The face value for the tickets is $25, and we will assume, for simplicity, that each person in line wants to buy one ticket. If the number of people in line exceeds the number of tickets available, then the ticket window will close while people are still waiting in line to buy tickets. This is a situation of excess demand and indicates that the face value for the tickets is too low relative to equilibrium. Some buyers will be unhappy because they will not be able to buy a ticket. If the last person in line buys a ticket and the ticket office still has tickets available to sell, we have a surplus and we can infer that the price of the tickets is too high: There are more tickets available at that price than there are buyers for the tickets. The seller will be unhappy because they will not be able to sell all their tickets. At the equilibrium price, the last person in line will buy the last ticket available. All buyers and sellers will be happy as they are all able to make a trade at this price. Let’s review an Application that answers a key question:
3. What are the consequences of a price above the equilibrium price?
APPLICATION 3: SHRINKING WINE LAKES This Application shows how prices above the equilibrium price encourage producers to supply more than consumers wish to purchase. This Application shows that as European price supports have disappeared, so has the excess supply in some of the previously price supported markets.
Chapter 4: Demand, Supply, and Market Equilibrium 49
©2014 Pearson Education, Inc.
4.4 Market Effects of Changes in Demand A change in demand occurs when a variable other than the price of the product changes. This is illustrated in panel (A) of Figure 4.7. When demand changes, people want to buy more or less of a product at the same price. This is illustrated in panel (B) of Figure 4.7. Since the price of the good has not changed, the demand curve must have shifted. An increase in demand occurs when consumers want to buy more of a good holding the price constant. An increase in demand causes the equilibrium price and quantity to increase. Here are factors that increase demand:
• Increase in income. If a good is a normal good, an increase in income increases demand for the good. Restaurant meals would be an example of normal goods.
• Decrease in income. If a good is an inferior good, a decrease in income will increase demand. Store-brand cola would be an example of an inferior good.
• Increase in the price of a substitute. A substitute is a good for which an increase in the price of one good increases the demand for another good. As the price of coffee increases, we expect the demand for tea to increase, holding the price of tea constant.
• Decrease in the price of a complement. A complement is a good for which a decrease in the price of one good increases the demand for the other good. As the price of French fries falls, people will demand more ketchup, holding the price of ketchup constant.
• Increase in population. As more people enter the market, the amount of a good demanded at any price will increase. If 1,000 new students enroll at your university, the demand for spiral bound notebooks at the campus bookstore will increase, holding the price of the notebooks constant.
• Shift in consumer preferences. When a celebrity advertises a product, more people may want that product, holding the price of the product constant.
• Expectations of higher future prices. If we anticipate that the price of a good is going to increase in the future, we will demand more of the good, at its current price.
Figure 4.8 shows the impact on market price and quantity of an increase in demand. Notice that both the market price and quantity increase as demand increases. In general, market price and quantity increase when demand increases and decrease when demand decreases. A decrease in demand occurs when consumers want to buy less of a good holding the price constant. A decrease in demand lowers the equilibrium quantity and price in the market. Here are the factors that decrease demand:
• Decrease in income. Consumers will buy fewer normal goods when their incomes decrease. • Increase in income. Consumers will buy fewer inferior goods when their incomes increase. • Decrease in the price of a substitute good. If the price of going to the movies falls, there will be
an increase in the quantity demanded of movies. Consumers will rent fewer movies, holding the price of movie rentals constant.
• Increase in the price of a complementary good. If the price of coffee increases, leading people to decrease their quantity demanded of coffee, the demand for cream will fall. People will buy less cream, holding the price of cream constant.
• Decrease in population. If the number of people in a market decreases, there will be fewer units of a good demanded, holding the price of the good constant.
• Shift in consumer tastes. A health scare, such as E. coli in fresh spinach and mad cow disease in beef, will cause people to want to buy fewer units of these goods, holding the price of the good constant.
50 O'Sullivan/Sheffrin/Perez, Macroeconomics, 8e
©2014 Pearson Education, Inc.
• Expectation of lower future prices. If people anticipate that the price of a good will fall in future periods, they will want to buy fewer units of that good at any price in the current period. This often happens with consumer electronics as people hold off purchasing new technology in anticipation of lower future prices.
Figure 4.9 shows the impact of a decrease in demand. Notice that both the market price and quantity fall as demand decreases.
Remember When demand changes, equilibrium price and quantity move in the same direction as demand. An increase in demand increases price and quantity. A decrease in demand decreases price and quantity. When something changes in a market, be careful to ask yourself whether the change will cause people to want to buy a different amount of the good holding the price constant. If the answer is yes, then the demand curve will shift. If the answer is no, the demand curve remains constant.
Caution! Be very careful to understand the difference between a movement along a demand or curve and a change in demand. A movement along a demand curve is caused only by a change in the price of that good. A change in demand is caused by a change in some factor other than the price of the good changing. One way to keep the difference straight is to understand that when we move along a curve, both the price of the good and the quantity of the good are changing. When a curve shifts, people want to buy a different amount of the good, holding the price constant.
Let’s review an Application that answers a key question:
4. How does a change in demand affect the equilibrium price?
APPLICATION 4: CHINESE DEMAND AND PECAN PRICES This Application shows how a change in consumer preferences for pecans led to an increase in the demand for pecans in China. As a result of the increased demand, pecan prices increased by about 50 percent.
Chapter 4: Demand, Supply, and Market Equilibrium 51
©2014 Pearson Education, Inc.
4.5 Market Effects of Changes in Supply A change in supply is caused by a change in a variable other than the price of the product. A change in supply means that holding the price constant, suppliers now want to sell more or less of their product. Since the price has not changed, the supply curve must have shifted. An increase in supply means that firms are willing to sell more units at any given price. When supply increases, the equilibrium price of the good falls, and the equilibrium quantity of the good increases. Here are the factors that increase supply:
• Decreases in input prices. When the firm can pay lower prices for its workers or materials, it is willing to sell more of a good, holding the price of the good constant.
• Technological advance. Better technology allows a firm to produce (and sell) more units of a good, holding the price constant.
• Government subsidy. If the government gives money to a firm for each unit it produces, the firm can sell its goods at a lower price in the market (the downward idea of the supply shift).
• Expected future price. If the firm anticipates that the price of its product is going to fall in the future, it will be willing to sell more units of the good now, holding the price constant.
• An increase in the number of producers. As more firms enter the market, there will be more units of the good available for sale, holding the price of the good constant.
Figure 4.11 shows the impact on market price and quantity from an increase in supply. Notice that as supply increases, market price falls and quantity increases. In general, market price will move in the opposite direction of a supply change, and quantity will move in the same direction. A decrease in supply means that firms want to sell fewer units of a good, holding the price of the good constant. A decrease in supply lowers the equilibrium quantity of the good and raises the equilibrium price. Here are the factors that decrease supply:
• Increases in wages and prices of materials. When the costs of producing output increase, firms require a higher price to sell any given number of units.
• Tax. If the government requires the firm to pay a tax each time it sells a unit of a good, the price required to sell any number of units of the good will increase.
• Higher future prices. If the firm expects the price of the good to increase in the future, it will be willing to sell fewer units of the good in the current period, holding the price of the good constant.
• A decrease in the number of producers. As firms stop producing a good and leave the market, there will be fewer units of a good available, holding the price of the good constant.
Figure 4.12 shows the impact on market price and quantity of a decrease in supply in the market.
52 O'Sullivan/Sheffrin/Perez, Macroeconomics, 8e
©2014 Pearson Education, Inc.
Remember It is sometimes helpful to think of supply changes in this way: Supply increases when a firm is willing to sell the same output for a lower price. If the wages paid to a worker fall, a firm is able to sell its output for a lower price. Graphically, this shifts the supply curve down—indicating that the price required to sell any quantity will decrease—and to the right—indicating that the firm will sell more holding the price constant. See Table 4.3 of the text. In the same way, if the wages paid to a worker increase, the firm now needs to sell its product at a higher price to be willing to sell the same quantity. Graphically, the supply curve shifts up—indicating that the price required to sell any quantity has increased—and to the left—indicating that at a constant price the firm is willing to sell fewer units of the good. See Table 4.4 of the text. When supply changes, equilibrium quantity moves in the same direction as supply and equilibrium price moves in the opposite direction. An increase in supply increases quantity and decreases price.
Study Tip When something changes in a market, ask yourself whether the change will make suppliers want to sell a different amount of the goods holding the price constant. If the answer is yes, then the supply curve will shift. If the answer is no, the supply curve remains constant.
When both supply and demand change, the impact on either price or quantity will be ambiguous without knowing the magnitude of the changes. Figure 4.13 illustrates this. In this figure, both demand and supply are increasing. An increase in demand and an increase in supply will both increase the market quantity, and so we can say that quantity will increase in the market. An increase in demand leads to higher prices where an increase in supply leads to lower prices. What happens to the price depends upon whether the supply change or the demand change has the larger impact. In panel (A) the demand increase has the larger impact and market price rises. In panel (B) the supply impact is larger and market price falls. Let’s review an Application that answers a key question:
5. How does a change in supply affect the equilibrium price?
APPLICATION 5: HONEYBEES AND THE PRICE OF ICE CREAM While honeybees and ice cream may not seem to have anything to do with one another, growers of fruits, vegetables, and nuts depend on honeybees to pollinate their plants. As the number of honeybees has decreased, the supply of strawberries, raspberries, and almonds has decreased. With the decrease in supply comes a higher price for these products. Strawberries, raspberries, and almonds are inputs into the production of ice cream. As the price of the inputs has increased, the supply curve of ice cream has shifted to the left, leading to a higher price and lower quantity of ice cream using these ingredients. Figure 4.14 illustrates this.
4.6 Predicting and Explaining Market Changes
Chapter 4: Demand, Supply, and Market Equilibrium 53
©2014 Pearson Education, Inc.
We use our knowledge of demand and supply changes to both predict future price and quantity movements and to explain past price and quantity movements. Examples:
• An increase in price occurs when demand increases or supply decreases. • A decrease in price occurs when demand decreases or supply increases. • An increase in quantity occurs when demand increases or supply increases. • A decrease in quantity occurs when demand decreases or supply decreases.
Caution! If both curves are shifting at the same time, you will be able to predict only the movement of quantity or price—not both. For instance, an increase in demand combined with an increase in supply will increase the market quantity. However, the two shifts have offsetting price effects, and you won’t be able to forecast the price movement. After the two shifts have occurred, you will be able to determine which effect was stronger. If the price in the market increases, you know that the increase in demand was stronger than the increase in supply. An increase in demand will cause a movement along the supply curve. Suppliers will offer more goods in the market, but this is a result of a higher price being offered. A demand change can’t cause the supply curve to shift. Similarly, a change in supply will cause a movement along the demand curve but won’t cause the demand curve to shift.
Let’s review an Application that answers a key question:
6. What explains a decrease in price?
APPLICATION 6: WHY LOWER DRUG PRICES? This Application illustrates that a decrease in price can come from either an increase in supply (holding demand constant) or a decrease in demand (holding supply constant). In the example given, since quantity also decreased, we would believe that the price decrease was due to a drop in demand because that would also lead to a lower quantity traded.
54 O'Sullivan/Sheffrin/Perez, Macroeconomics, 8e
©2014 Pearson Education, Inc.
Activity Price Quantity Quantity (2) $2.00 $1.75 $1.50 $1.25 $1.00 $0.75 $0.50 $0.25 $0.00 a. Fill in the quantity of downloads you would want to purchase each month in the column marked
Quantity. b. Suppose that your income increased by $100 per week from its current level. In the column marked
Quantity (2), indicate how many downloads you would be willing to purchase per month at each price. c. On a graph, draw the demand curves corresponding to the Quantity and Quantity (2) columns. d. Indicate in the table and graph a change in quantity demanded. e. Indicate in the table and graph a change in demand.
Answers d. This would be a move along a demand curve or within a quantity column. e. This would be a move from one demand curve to the other, or from one quantity column to the other,
holding price constant.
Key Terms Change in demand: A shift of the demand curve caused by a change in a variable other than the price of the product. Change in quantity demanded: A change in the quantity consumers are willing and able to buy when the price changes; represented graphically by movement along the demand curve. Change in quantity supplied: A change in the quantity firms are willing and able to sell when the price changes; represented graphically by movement along the supply curve.
Chapter 4: Demand, Supply, and Market Equilibrium 55
©2014 Pearson Education, Inc.
Change in supply: A shift of the supply curve caused by a change in a variable other than the price of the product. Complements: Two goods for which a decrease in the price of one good increases the demand for the other good. Demand schedule: A table that shows the relationship between the price of a product and the quantity demanded, ceteris paribus. Excess demand (shortage): A situation in which, at the prevailing price, the quantity demanded exceeds the quantity supplied. Excess supply (surplus): A situation in which the quantity supplied exceeds the quantity demanded at the prevailing price. Individual demand curve: A curve that shows the relationship between the price of a good and quantity demanded by an individual, ceteris paribus. Individual supply curve: A curve showing the relationship between price and quantity supplied by a single firm, ceteris paribus. Inferior good: A good for which an increase in income decreases demand.
Law of demand: There is a negative relationship between price and quantity demanded, ceteris paribus. Law of supply: There is a positive relationship between price and quantity supplied, ceteris paribus. Market demand curve: A curve showing the relationship between price and quantity demanded by all consumers, ceteris paribus. Market equilibrium: A situation in which the quantity demanded equals the quantity supplied at the prevailing market price. Market supply curve: A curve showing the relationship between the market price and the quantity supplied by all firms, ceteris paribus. Minimum supply price: The lowest price at which a product will be supplied. Normal good: A good for which an increase in income increases demand. Perfectly competitive market: A market with many sellers and buyers of a homogeneous product and no barriers to entry. Quantity demanded: The amount of a product that consumers are willing and able to buy. Quantity supplied: The amount of a product that firms are willing and able to sell. Substitutes: Two goods for which an increase in the price of one good increases the demand for the other good.
56 O'Sullivan/Sheffrin/Perez, Macroeconomics, 8e
©2014 Pearson Education, Inc.
Supply schedule: A table that shows the relationship between the price of a product and quantity supplied, ceteris paribus.
Practice Quiz (Answers are provided at the end of the Practice Quiz.) 1. The model of supply and demand explains how a perfectly competitive market operates. Which of the
following is a characteristic of a perfectly competitive market? a. The market has a very large number of firms. b. The market has very few buyers so firms have to compete for them. c. In this market, large business firms produce large amounts of output and have a strong influence
over price. d. All of the above
2. The demand schedule is a. a curve that shows the relationship between price and quantity demanded, ceteris paribus. b. a table that shows the relationship between price and quantity demanded, ceteris paribus. c. a list of time periods during which the quantity of a good is demanded. d. the order in which individual consumers arrive to demand a good or service.
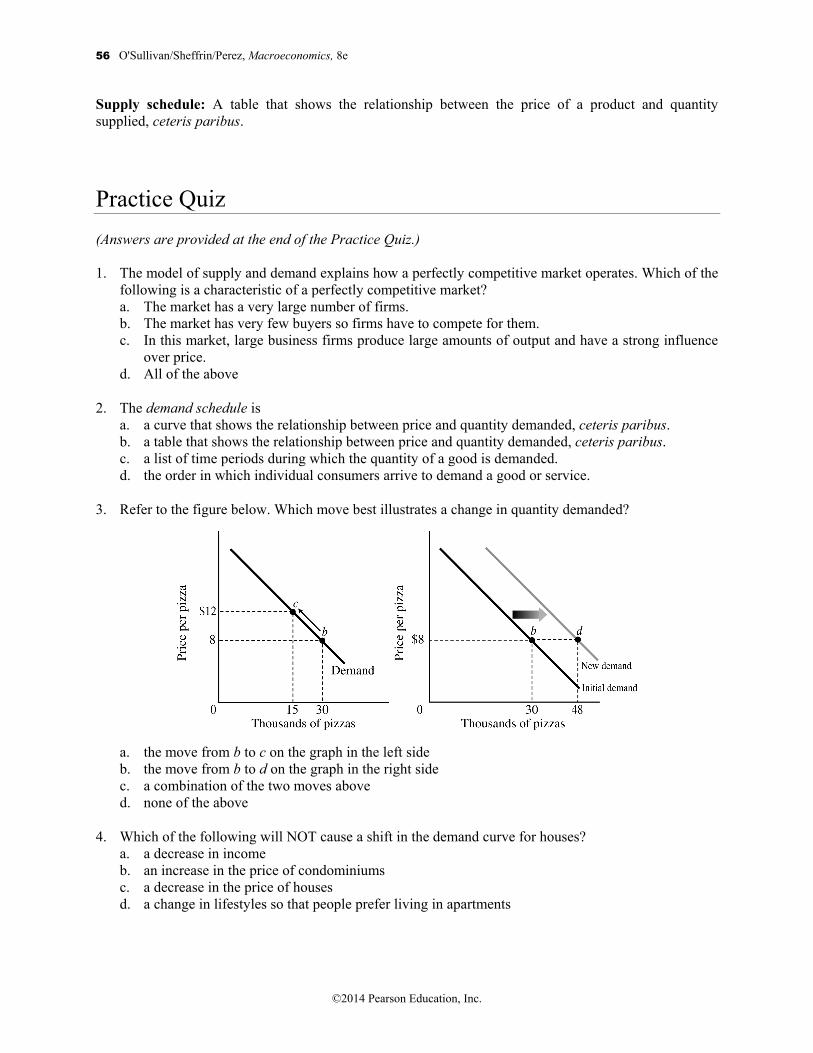
3. Refer to the figure below. Which move best illustrates a change in quantity demanded?
a. the move from b to c on the graph in the left side b. the move from b to d on the graph in the right side c. a combination of the two moves above d. none of the above
4. Which of the following will NOT cause a shift in the demand curve for houses? a. a decrease in income b. an increase in the price of condominiums c. a decrease in the price of houses d. a change in lifestyles so that people prefer living in apartments
Chapter 4: Demand, Supply, and Market Equilibrium 57
©2014 Pearson Education, Inc.
5. Which of the following variables has an effect on the decisions of sellers, using the market for pizza as an example?
a. producer expectations about the future price of pizza b. the cost of the inputs used to produce the product, for example, wages paid to workers and the
cost of the pizza oven c. the state of production technology, such as the knowledge used in making pizza d. all of the above
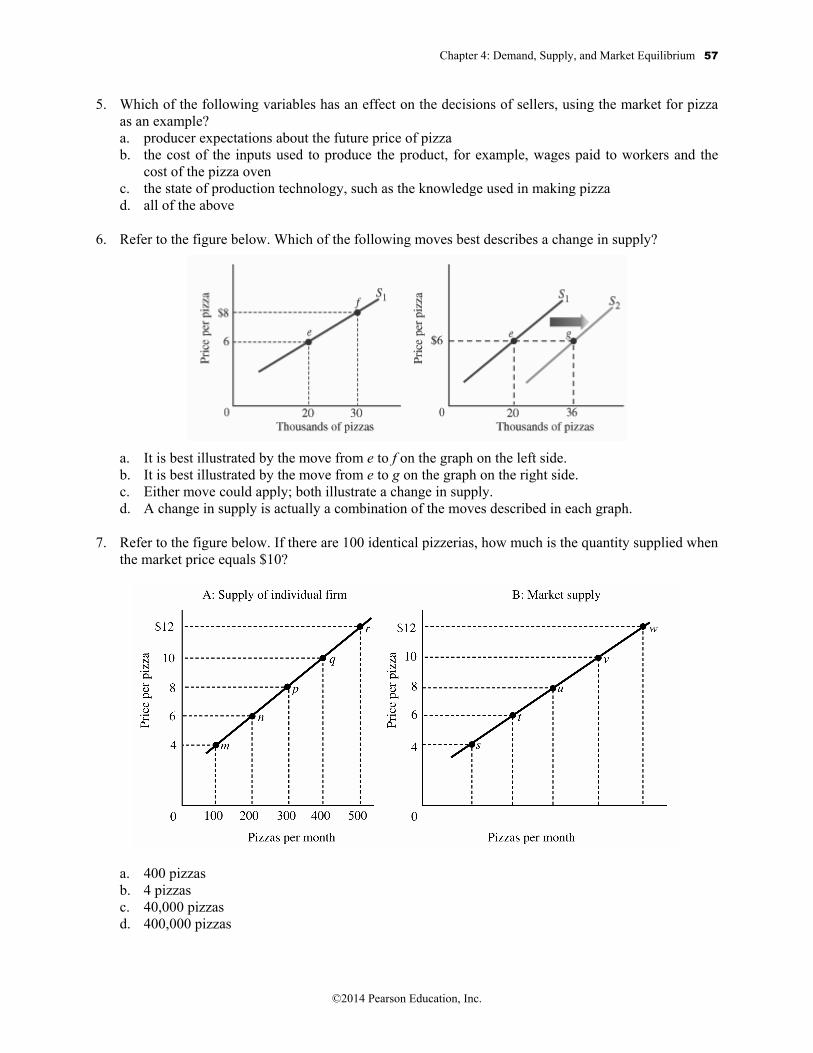
6. Refer to the figure below. Which of the following moves best describes a change in supply?
a. It is best illustrated by the move from e to f on the graph on the left side. b. It is best illustrated by the move from e to g on the graph on the right side. c. Either move could apply; both illustrate a change in supply. d. A change in supply is actually a combination of the moves described in each graph.
7. Refer to the figure below. If there are 100 identical pizzerias, how much is the quantity supplied when the market price equals $10?
a. 400 pizzas b. 4 pizzas c. 40,000 pizzas d. 400,000 pizzas
58 O'Sullivan/Sheffrin/Perez, Macroeconomics, 8e
©2014 Pearson Education, Inc.
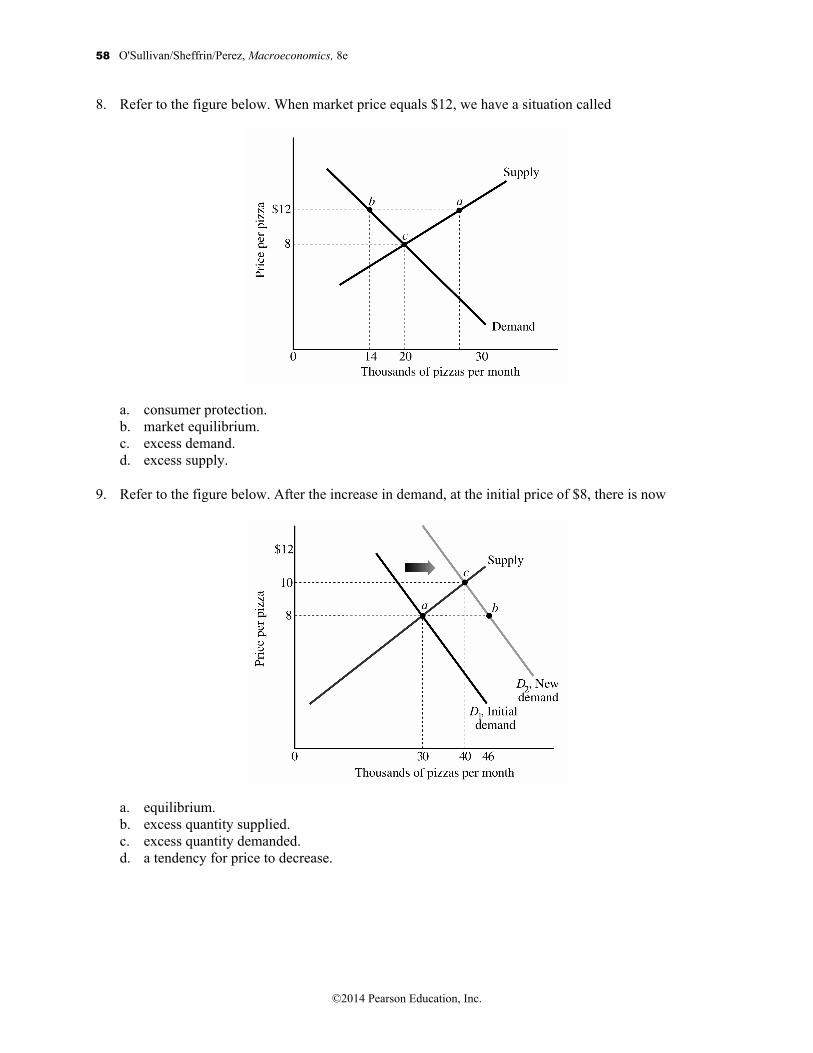
8. Refer to the figure below. When market price equals $12, we have a situation called
a. consumer protection. b. market equilibrium. c. excess demand. d. excess supply.
9. Refer to the figure below. After the increase in demand, at the initial price of $8, there is now
a. equilibrium. b. excess quantity supplied. c. excess quantity demanded. d. a tendency for price to decrease.
Chapter 4: Demand, Supply, and Market Equilibrium 59
©2014 Pearson Education, Inc.
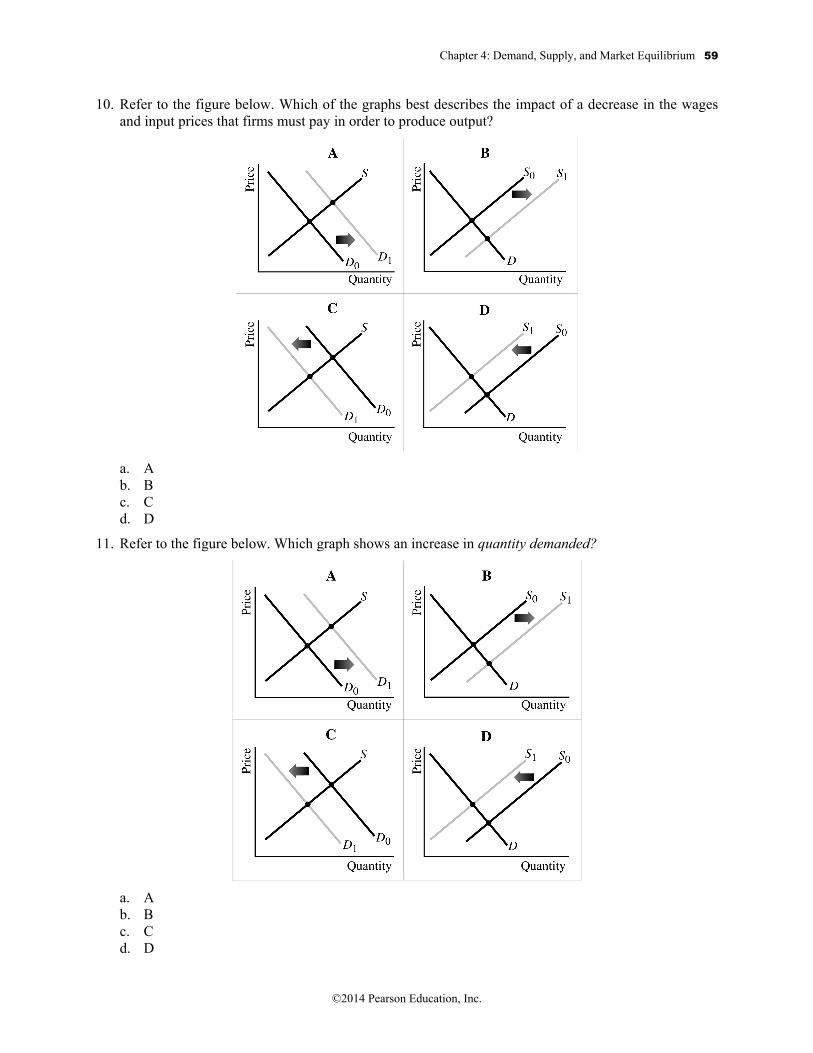
10. Refer to the figure below. Which of the graphs best describes the impact of a decrease in the wages and input prices that firms must pay in order to produce output?
a. A b. B c. C d. D
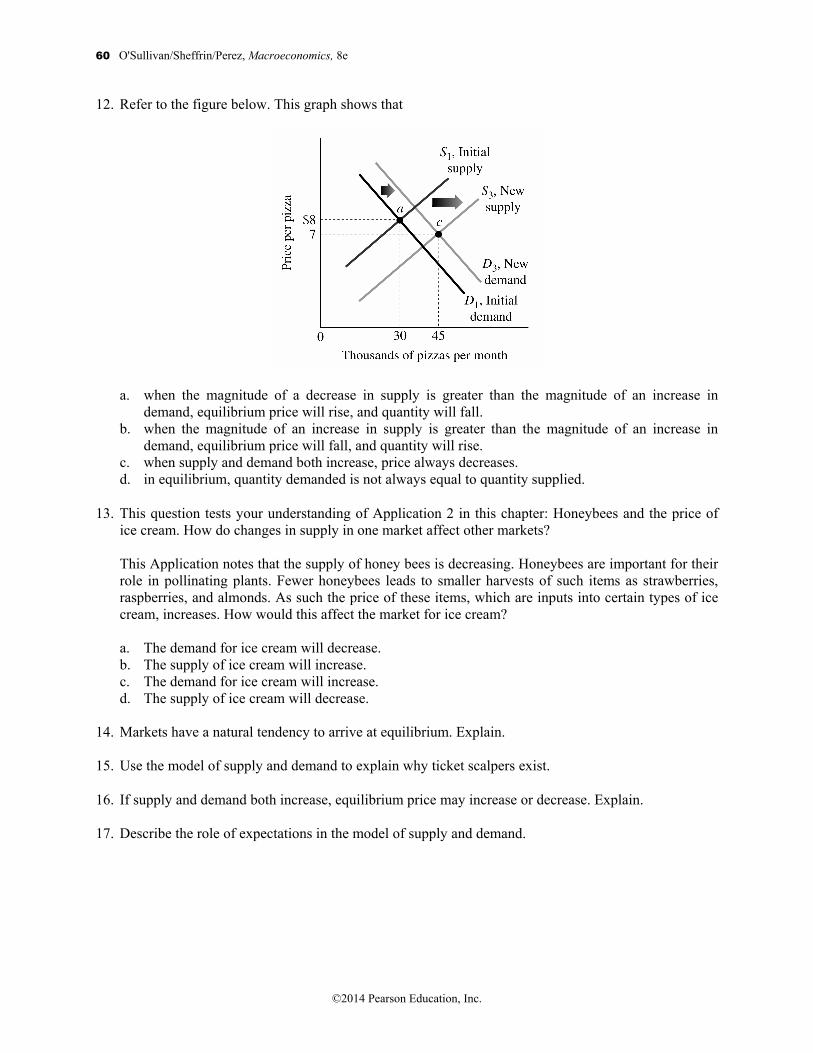
11. Refer to the figure below. Which graph shows an increase in quantity demanded?
a. A b. B c. C d. D
60 O'Sullivan/Sheffrin/Perez, Macroeconomics, 8e
©2014 Pearson Education, Inc.
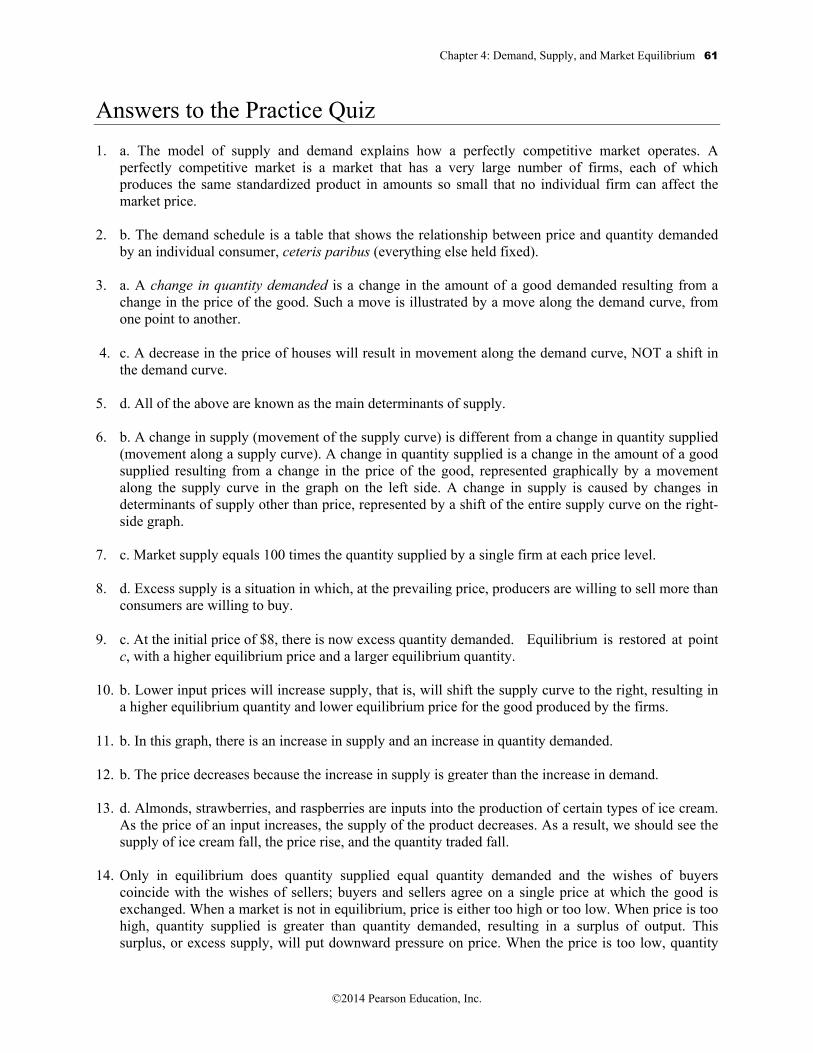
12. Refer to the figure below. This graph shows that
a. when the magnitude of a decrease in supply is greater than the magnitude of an increase in demand, equilibrium price will rise, and quantity will fall.
b. when the magnitude of an increase in supply is greater than the magnitude of an increase in demand, equilibrium price will fall, and quantity will rise.
c. when supply and demand both increase, price always decreases. d. in equilibrium, quantity demanded is not always equal to quantity supplied.
13. This question tests your understanding of Application 2 in this chapter: Honeybees and the price of ice cream. How do changes in supply in one market affect other markets?
This Application notes that the supply of honey bees is decreasing. Honeybees are important for their
role in pollinating plants. Fewer honeybees leads to smaller harvests of such items as strawberries, raspberries, and almonds. As such the price of these items, which are inputs into certain types of ice cream, increases. How would this affect the market for ice cream?
a. The demand for ice cream will decrease. b. The supply of ice cream will increase. c. The demand for ice cream will increase. d. The supply of ice cream will decrease.
14. Markets have a natural tendency to arrive at equilibrium. Explain. 15. Use the model of supply and demand to explain why ticket scalpers exist.
16. If supply and demand both increase, equilibrium price may increase or decrease. Explain. 17. Describe the role of expectations in the model of supply and demand.
Chapter 4: Demand, Supply, and Market Equilibrium 61
©2014 Pearson Education, Inc.
Answers to the Practice Quiz 1. a. The model of supply and demand explains how a perfectly competitive market operates. A
perfectly competitive market is a market that has a very large number of firms, each of which produces the same standardized product in amounts so small that no individual firm can affect the market price.
2. b. The demand schedule is a table that shows the relationship between price and quantity demanded
by an individual consumer, ceteris paribus (everything else held fixed). 3. a. A change in quantity demanded is a change in the amount of a good demanded resulting from a
change in the price of the good. Such a move is illustrated by a move along the demand curve, from one point to another.
4. c. A decrease in the price of houses will result in movement along the demand curve, NOT a shift in the demand curve.
5. d. All of the above are known as the main determinants of supply. 6. b. A change in supply (movement of the supply curve) is different from a change in quantity supplied
(movement along a supply curve). A change in quantity supplied is a change in the amount of a good supplied resulting from a change in the price of the good, represented graphically by a movement along the supply curve in the graph on the left side. A change in supply is caused by changes in determinants of supply other than price, represented by a shift of the entire supply curve on the right-side graph.
7. c. Market supply equals 100 times the quantity supplied by a single firm at each price level. 8. d. Excess supply is a situation in which, at the prevailing price, producers are willing to sell more than
consumers are willing to buy.
9. c. At the initial price of $8, there is now excess quantity demanded. Equilibrium is restored at point c, with a higher equilibrium price and a larger equilibrium quantity.
10. b. Lower input prices will increase supply, that is, will shift the supply curve to the right, resulting in
a higher equilibrium quantity and lower equilibrium price for the good produced by the firms.
11. b. In this graph, there is an increase in supply and an increase in quantity demanded. 12. b. The price decreases because the increase in supply is greater than the increase in demand. 13. d. Almonds, strawberries, and raspberries are inputs into the production of certain types of ice cream.
As the price of an input increases, the supply of the product decreases. As a result, we should see the supply of ice cream fall, the price rise, and the quantity traded fall.
14. Only in equilibrium does quantity supplied equal quantity demanded and the wishes of buyers
coincide with the wishes of sellers; buyers and sellers agree on a single price at which the good is exchanged. When a market is not in equilibrium, price is either too high or too low. When price is too high, quantity supplied is greater than quantity demanded, resulting in a surplus of output. This surplus, or excess supply, will put downward pressure on price. When the price is too low, quantity
62 O'Sullivan/Sheffrin/Perez, Macroeconomics, 8e
©2014 Pearson Education, Inc.
demanded will exceed quantity supplied. Excess demand will put upward pressure on price. In either case, the market has a natural tendency to move toward equilibrium.
15. When a stadium sells tickets for a popular event, it issues a number of tickets equal to the number of
seats available. The stadium assumes that quantity supplied will equal quantity demanded once the tickets are sold out. Ticket scalpers, however, have a hunch that the quantity demanded greatly exceeds the quantity supplied at the price determined by the stadium. In other words, they assume that the equilibrium price is higher than the price determined by the stadium. The excess of quantity demanded over quantity supplied means that someone must be willing to pay a higher price than the official price. Scalpers are first in line to buy the tickets at the official price, then they go out in the streets to look for those who are willing to pay a price closer to the equilibrium market price.
16. In order to establish the impact on price from a change in supply and demand, we must examine the
magnitudes of the change in each. By itself an increase in supply pushes price down while an increase in demand by itself pushes price up. If supply increases more than demand does, equilibrium price will fall. If demand increases more than supply does, equilibrium price will rise. And if the magnitudes of change are the same, price will remain the same; only equilibrium quantity will change.
17. Expectations are an important component of both supply and demand. On the demand side,
expectations determine whether buyers will buy more of a good today or wait until tomorrow. Expectations are built into all rational household decisions. Decisions about how much to buy, how much to save, and how much labor to supply take into account both the present and the future. If households feel optimistic about the future, they may increase their present consumption. Pessimism, on the other hand, will cause households to hold back on their consumption expenditures. On the supply side, expectations also play a major role in decision making. Business firms decide what and how much output to produce based on a plan. This plan includes a forecast of future expected input and output prices. If producers are optimistic about the future, they will plan to expand capacity and increase production in future periods. If they feel pessimistic, they may plan to reduce capacity and output in the future. It is important to understand that the expectations of producers and consumers are independent. This means that producers do not have complete control of production and investment decisions.