Embed Size (px)
Citation preview
Creating a level playing field for network Demand Management in the National Electricity Market
ManagementIncentives
Demand
Review

INSTITUTE FOR SUSTAINABLE FUTURES
ABOUT THE AUTHORS The Institute for Sustainable Futures (ISF) was established by the University of Technology Sydney in 1996 to work with industry, government and the community to develop sustainable futures through research and consultancy. Our mission is to create change toward sustainable futures that protect and enhance the environment, human wellbeing and social equity. For further information visit: www.isf.uts.edu.au
ACKNOWLEDGEMENTS ISF would like to express its appreciation to the Australian Renewable Energy Agency (ARENA) for funding the Demand Management Incentives Review (DM Incentives Review). This report draws heavily on, and builds upon, the two submissions made by ISF to the AER’s Demand Management Incentive Scheme process. See: https://www.aer.gov.au/networks-pipelines/guidelines-schemes-models-reviews/demand-management-incentive-scheme-and-innovation-allowance-mechanism
The research team would also like to thank partner organisations and their staff who have contributed to the development of the DM Incentives Review model and this report, both through the Study Reference Group (see Appendix F) and through stakeholder consultation events. The authors greatly value the diversity of views that was brought to this study from across the energy sector including, network businesses, Decentralised Energy Resource and Demand Management service providers, government, regulators and industry experts.
The responsibility for the contents of this report remains with ISF.
This report has been submitted to ARENA as part of the DM Incentives Review (contract number P01051):
ACCESSING THE DMIR MODEL To access the Demand Management Incentives Review Model (DMIR Model), which was used for the analysis in this report, please request a copy by emailing ISF at: [email protected]
CITATION Please cite this repot as: Dunstan, C., Alexander, D., Morris, T., Langham, E., Jazbec, M., 2017, Demand Management Incentives Review: Creating a level playing field for network DM in the National Electricity Market (Prepared by the Institute for Sustainable Futures, University of Technology Sydney).
DISCLAIMER: This report is based on the findings of the DM Incentives Review and reflects the assessment and judgment of the research team only and does not necessarily represent the opinions of other stakeholders who have contributed to the study. Readers are reminded of the need to ensure that the information upon which they rely is up to date and appropriate. The authors have used all due care and skill to ensure the material is accurate at the date of this submission. ISF and the authors do not accept any responsibility for any loss that may arise by anyone relying upon its contents.
INSTITUTE FOR SUSTAINABLE FUTURES
University of Technology Sydney PO Box 123 Broadway, NSW, 2007 www.isf.edu.au
© UTS June 2017
Demand Management Incentives Review June 2017 i
INSTITUTE FOR SUSTAINABLE FUTURES
CONTENTS SUMMARY............................................................................................................................ iii
1 The importance of DM ...................................................................................................... 1
1.1 What is Demand Management? ........................................................................... 1 1.2 DM in Australia ................................................................................................... 1 1.3 DM = “Duck Management”? ................................................................................ 4
2 Regulatory Incentives and DM ........................................................................................... 7
2.1 Barriers to DM..................................................................................................... 7 2.2 The DM Incentives Review ................................................................................... 9 2.3 Modelling Results .............................................................................................. 11 2.4 DM bias and net market benefits ....................................................................... 15 2.5 Disaggregating the elements of bias against DM ................................................ 16
3 Designing the DM Incentive Scheme ................................................................................ 18
3.1 Principles and metrics for a DM Incentive Scheme .............................................. 18 3.2 Normalising DM cost recovery ........................................................................... 19 3.3 Proposed structure of a DM incentive ................................................................ 20 3.4 Setting the level of the DM incentive ................................................................. 20 3.5 Timing of delivery and recovery of the DM incentive .......................................... 24 3.6 Including price-based DM .................................................................................. 25 3.7 Information and reporting requirements ........................................................... 25 3.8 Estimating the value of net market benefits ....................................................... 26
4 Competition in DM services ............................................................................................. 29
5 DM Innovation Allowance ............................................................................................... 30
6 Transitional DM Measures .............................................................................................. 31
6.1 The rationale for transitional measures.............................................................. 31 6.2 Clearly defined deliverables ............................................................................... 33 6.3 Targetting and exclusions .................................................................................. 33 6.4 Available or dispatched capacity? ...................................................................... 34 6.5 Clearly defined scale and budget ....................................................................... 34 6.6 Relevant precedents .......................................................................................... 35
APPENDICES ........................................................................................................................ 36
Appendix A: DMIR Study Scope ........................................................................................... 37
Appendix B: DM Incentives Review Model - Dashboard ...................................................... 40
Appendix C: Results from the Modelling .............................................................................. 41
Appendix D: US Electricity Efficiency Spending ..................................................................... 47
Appendix E: DMIR Study Reference Group ........................................................................... 49
Demand Management Incentives Review June 2017 ii
INSTITUTE FOR SUSTAINABLE FUTURES
SUMMARY Demand Management: The missing link in Australian electricity reform Electricity Demand Management (DM) is deliberate action by power utilities to encourage consumers to reduce or shift their electricity use as an alternative to providing new electricity supply. The absence of balanced incentives for efficient DM has been a major gap in Australia’s National Electricity Market (NEM) since its establishment in 1998. The cost to energy consumers of this gap has likely run to hundreds of millions dollars or more, due to unnecessarily high electricity bills and excessive generation and network infrastructure spending.
To illustrate, if the NEM had access to the same proportion of DM as the average for states of the USA, it would have about 3000MW of DM. This is almost twice the total capacity of the recently retired 1600 MW Hazelwood coal fired power station, and is more than the total combined capacity proposed in the recent announcements by the South Australian Government, Our Energy Plan (up to 350 MW1) and the Australian Government’s Snowy 2.0 (estimated 2000 MW).
Following a change to the National Electricity Rules in 2015, the Australian Energy Regulator (AER) is required to develop a Demand Management Incentive Scheme (DMIS) and the Demand Management Innovation Allowance (DMIA). This crucial reform represents the best chance in the history of the Australian electricity supply system to facilitate widespread, efficient and cost-effective DM by distribution network businesses.
To support the AER in developing the new DM Incentive Scheme, the Australian Renewable Energy Agency (ARENA) commissioned the Institute for Sustainable Futures at UTS (ISF) to undertake this DM Incentives Review. The review’s purpose is, for the first time, to assess and quantify the financial barriers to DM created by existing economic regulatory incentives for distribution network businesses.
It is crucial that when network businesses are making their procurement decisions, they are subject to fair and balanced incentives. Where regulatory incentives are efficient and balanced, the network business should achieve higher net profits if they undertake measures that deliver higher net benefits to their customers. If regulatory incentives are inefficient and biased against DM, a network business may receive a lower net profit from a DM solution that would deliver a higher net benefit for customers.
The key findings from this DM Incentives Review are: 1) In distribution network regulation, there are currently significant barriers to implementing
cost effective DM. These barriers include: a) Recovery of DM operating expenditure (opex) is treated less favourably than recovery
of non-DM network opex, and less favourably than network capital expenditure (capex) and;
b) There is a bias in favour of network capex, relative to DM and other opex; and c) Future ‘option value’ is generally excluded when considering DM solutions.
All three barriers are important, but the first appears to be the most significant.
1 Up to 250MW of temporary diesel and new gas fired generation and 100 MW of battery storage, South Australian Government, Our Energy Plan, http://ourenergyplan.sa.gov.au/assets/our-energy-plan-sa-web.pdf
Demand Management Incentives Review June 2017 iii
INSTITUTE FOR SUSTAINABLE FUTURES
2) In addition to the bias in the regulation of distribution network businesses, there are other net market benefits of Network DM that are not currently accessible by any market participants.
3) To correct for these inefficiencies in regulatory settings, an effective DM Incentive Scheme should be applied.
4) An effective DM incentive would both offset the current regulatory bias against DM and allow distribution network businesses to retain a share of the non-network net market benefits, and thereby deliver benefits to consumers by stimulating efficient network DM. This would perform an analogous role to the existing Efficiency Benefits Sharing Scheme (EBSS), the Capital Expenditure Sharing Scheme (CESS) and the Service Target Performance Incentive Scheme (STPIS) which share benefits between distribution network businesses and customers.
5) The DM incentive should be structured one of the following two ways:
a) as a performance-based DM “Incentive Payment” (DMIP), in terms of dollars per kilowatt of peak demand reduction per year; that is, $/kWpeak per year or $/kVApeak per year; or,
b) as a DM “Cost Uplift” (DMCU), in terms of a dollars of additional cost recovery, proportional to the cost to the distribution network business of the DM solution.
6) Of these two options, the performance-based DMIP is more directly linked to demand reduction and value created, but the DMCU is easier for the AER to administer, and offers more flexibility and certainty for distribution network businesses.
7) Given the importance of DM opex cost recovery, ISF recommends a ‘two-pronged’ approach to a DM Incentive Scheme:
a) “Normalising DM cost recovery”, which treats proposed DM opex in a regulatory assessment on terms equal to capex and non-DM opex; and
b) A DM incentive, to provide a financial benefit to encourage distribution network businesses to undertake DM opex.
8) On balance, it is probably most efficient to set a DM incentive at the same level for all DM in all network territories for the entire forthcoming network regulatory determinations (from 2019 to 2025).
9) The stipulated level of a DMIP should be set in the range of $50 to $100/kWpeak per year; alternatively, a DMCU should be set in the range 40% to 90% of the DM cost to the distribution network business.
10) The bias against DM opex relative to other opex is mainly because opex has not traditionally formed a significant proportion of total opex. The more that DM is built into the normal opex planning budget, the less the bias will be. The distribution network businesses should therefore be encouraged by the AER to develop and submit detailed DM Plans of proposed DM action as part of their five-yearly regulatory proposals.
11) The DM incentive should be made available to distribution network businesses both for DM which is proposed in their DM Plans and regulatory proposals, and for other DM opportunities that are subsequently identified during the regulatory period.
12) Payment of the DM incentive to a network business should be contingent on the network business publicly demonstrating a net benefit to customers.
Demand Management Incentives Review June 2017 iv
INSTITUTE FOR SUSTAINABLE FUTURES
13) In cases where the stipulated level of the DM incentive exceeds the expected net benefit to consumers, network businesses should be permitted to recover less than the maximum stipulated level of DM incentive in order ensure net benefits to customers.
14) There is a strong case for state and territory governments to establish transitional DM incentives, both to expedite the delivery of benefits from DM to their communities, and to facilitate a smooth transition to the full introduction of the new DM Incentive Scheme between now and 2021.
15) While this Review’s scope included only the impact of economic regulatory incentives, there are other important non-regulatory drivers and potential biases in the decisions of distribution network businesses. These relate to network businesses’ culture, conventions, expertise and risk management. The AER should also consider the impact of these other drivers and biases in setting the DMIS.
Our study method
This study, the DM Incentives Review, was designed to test the following hypothesis:
Study hypothesis to be tested:
Consider a situation where a distribution network business faces a network constraint with two equally reliable solutions – a network capex (capital expenditure) solution and a DM opex (operating expenditure) solution. The current regulatory incentives will deliver the distribution network business a higher net profit from the network capex solution, even in cases where the customers would receive a higher net benefit from the DM opex solution.
This DM Incentives Review was intended to identify and quantify economic regulatory barriers to network businesses transitioning towards a more decentralised and service-oriented business model, and recommend appropriate incentives to address these barriers. The foundation of the Review is a complex spreadsheet model. This model analyses how current AER regulations impact on the financial incentives for network businesses in choosing between network investment and DM solutions. In other words, the model examines how network and DM solutions to network constraints impact on network businesses’ costs, revenues and profits.
Why DM is particularly important now
Since the NEM was established in 1998, there have been several major missed opportunities to apply DM in order to trim billions of dollars of supply infrastructure costs and energy bills. Notwithstanding these “sunk costs” in infrastructure, there are now major emerging trends in the electricity sector which mean that establishing balanced incentives for DM is more important than ever. These major trends include:
1. The rapid growth of variable output renewable power generation such as wind and solar, for which flexible DM is likely to be the most cost-effective complement.
2. The rise in small-scale decentralised generation, such as rooftop solar photovoltaics (PV), which creates both challenges and opportunities for managing energy supply and demand in the local low voltage network.
3. The rise in low-cost decentralised energy storage, in particular batteries, both in standalone units and in electric vehicles. These provide both a load and a generation resource. If well
Demand Management Incentives Review June 2017 v

INSTITUTE FOR SUSTAINABLE FUTURES
managed, batteries could deliver lower costs and greater reliability for consumers. But if not well coordinated, including through DM, these new technologies could also impose major costs to consumers and adversely impact supply reliability.
4. The emergence of smart energy management, including through “internet of things” technologies, offers very large potential to reduce costs to consumers. Smart remote monitoring and control of appliances and equipment, such as Demand Response Enabling Devices, are already installed in many air conditioners, pool pumps, water heaters, etc. Tapping this technology, in conjunction with large-scale, intelligent, real-time consumer-responsive software (such as applied by ride sharing services like UBER), could offer large cost savings for consumers and major economic development opportunities.
These new decentralised technologies and services are likely to be best developed in a vibrant, competitive market for DM, which will require both available supply of DM services and effective demand for these services. Potential DM service providers already exist, as illustrated by numerous precedents including the response to the recent AEMO and ARENA proposals for Demand Response for reliability purposes. While demand for wholesale and energy market DM is growing in the context of more cost reflective pricing, the demand for network DM services has to date been very limited.
Network DM depends on detailed information related to specific network constraints, for which the network business is the ultimate planner and procurer. Consequently, the market demand for network DM can only come from network businesses. But network businesses may only be expected to create such demand where it is in their commercial interests to do so. As network businesses are regulated monopolies, these interests are strongly driven by the incentives created by regulation.
The future of an affordable, reliable and clean power supply in Australia depends on creating an effective market for network DM services. This market needs the AER to apply a balanced set of regulatory incentives through an effective DM Incentive Scheme, and complementary DM policies by state and territory governments to expedite the creation of this market.
Demand Management Incentives Review June 2017 vi
INSTITUTE FOR SUSTAINABLE FUTURES
1 THE IMPORTANCE OF DM
1.1 What is Demand Management? Electricity Demand Management (DM) means deliberate action taken by those responsible for electricity supply to reduce or shift demand for electricity, as an alternative to providing supply to meet that demand. Therefore, DM does not include involuntary load shedding or “blackouts”, or independent decisions by consumers to lower their demand or manage their energy use.
DM can facilitate low cost carbon emission reduction, both directly by helping consumers to reduce energy consumption, and indirectly, by providing flexible demand to complement variable output renewable wind and solar generation.
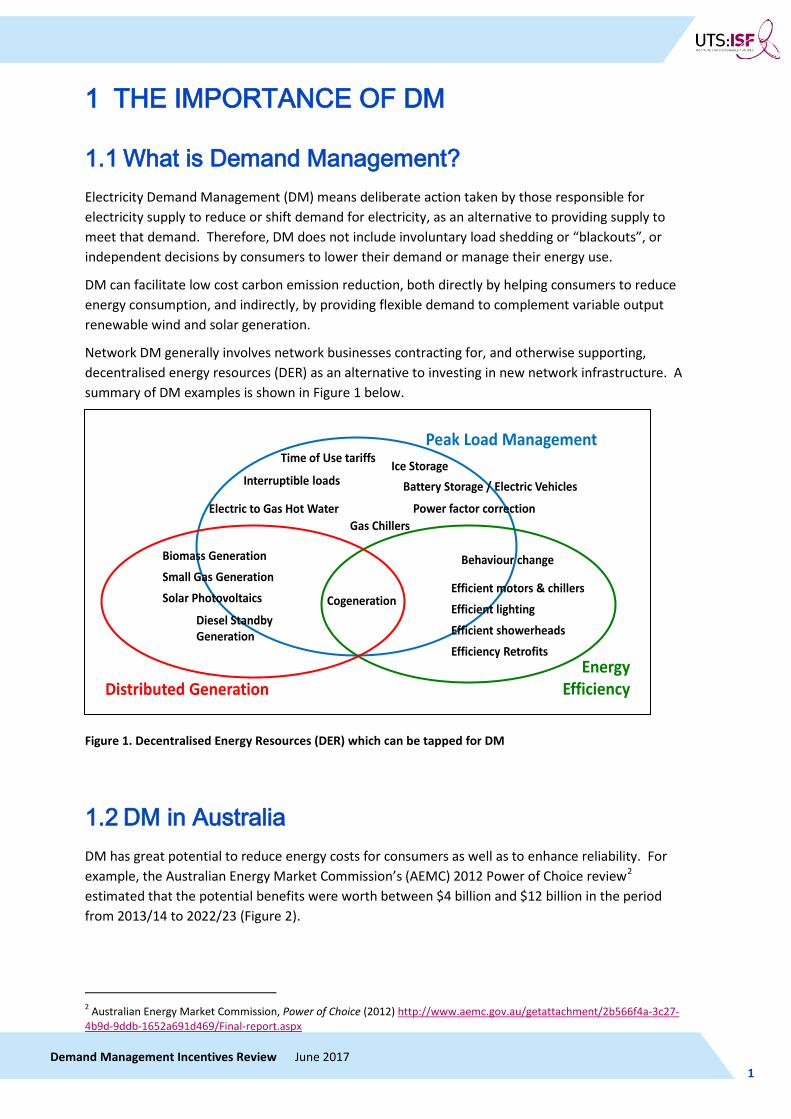
Network DM generally involves network businesses contracting for, and otherwise supporting, decentralised energy resources (DER) as an alternative to investing in new network infrastructure. A summary of DM examples is shown in Figure 1 below.
Figure 1. Decentralised Energy Resources (DER) which can be tapped for DM
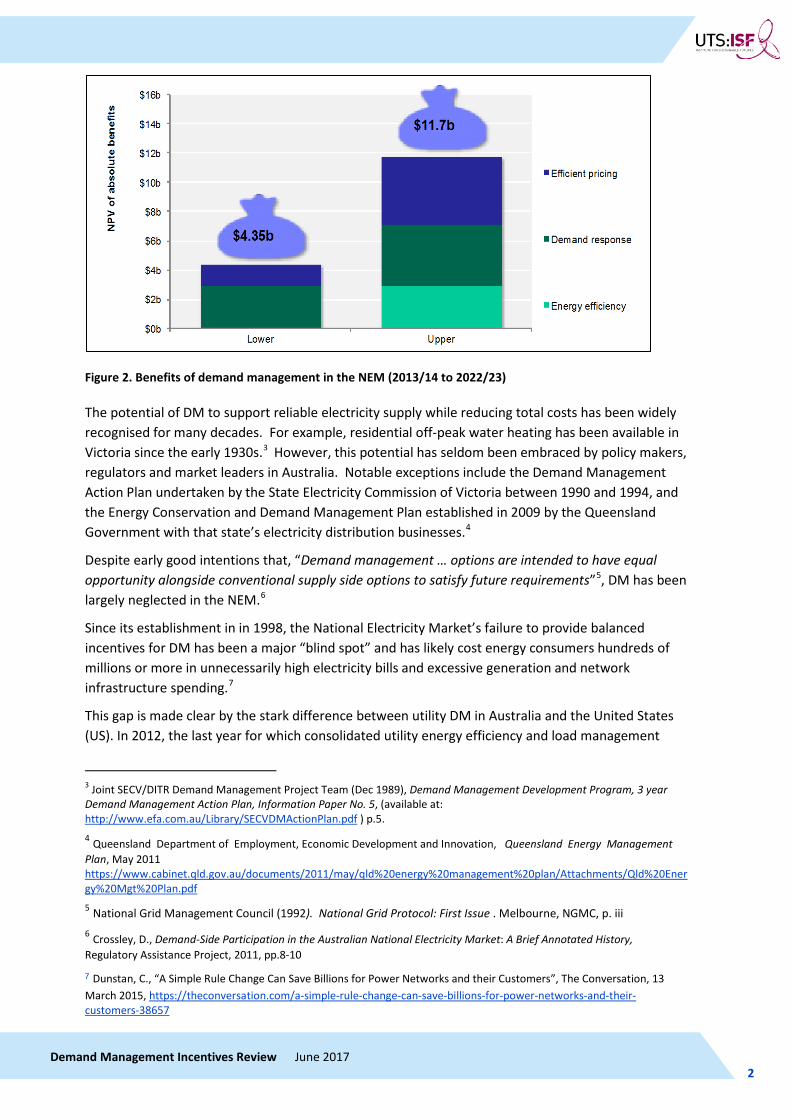
1.2 DM in Australia DM has great potential to reduce energy costs for consumers as well as to enhance reliability. For example, the Australian Energy Market Commission’s (AEMC) 2012 Power of Choice review2 estimated that the potential benefits were worth between $4 billion and $12 billion in the period from 2013/14 to 2022/23 (Figure 2).
2 Australian Energy Market Commission, Power of Choice (2012) http://www.aemc.gov.au/getattachment/2b566f4a-3c27-4b9d-9ddb-1652a691d469/Final-report.aspx
Peak Load Management
Interruptible loads
Power factor correction
Ice Storage
Electric to Gas Hot Water
Time of Use tariffs
Battery Storage / Electric Vehicles
Energy Efficiency
Behaviour change
Efficient motors & chillersEfficient lightingEfficient showerheadsEfficiency Retrofits
Distributed Generation
Biomass GenerationSmall Gas GenerationSolar Photovoltaics
Diesel Standby Generation
Cogeneration
Gas Chillers
Demand Management Incentives Review June 2017 1
INSTITUTE FOR SUSTAINABLE FUTURES
Figure 2. Benefits of demand management in the NEM (2013/14 to 2022/23)
The potential of DM to support reliable electricity supply while reducing total costs has been widely recognised for many decades. For example, residential off-peak water heating has been available in Victoria since the early 1930s.3 However, this potential has seldom been embraced by policy makers, regulators and market leaders in Australia. Notable exceptions include the Demand Management Action Plan undertaken by the State Electricity Commission of Victoria between 1990 and 1994, and the Energy Conservation and Demand Management Plan established in 2009 by the Queensland Government with that state’s electricity distribution businesses.4
Despite early good intentions that, “Demand management … options are intended to have equal opportunity alongside conventional supply side options to satisfy future requirements”5, DM has been largely neglected in the NEM.6
Since its establishment in in 1998, the National Electricity Market’s failure to provide balanced incentives for DM has been a major “blind spot” and has likely cost energy consumers hundreds of millions or more in unnecessarily high electricity bills and excessive generation and network infrastructure spending.7
This gap is made clear by the stark difference between utility DM in Australia and the United States (US). In 2012, the last year for which consolidated utility energy efficiency and load management
3 Joint SECV/DITR Demand Management Project Team (Dec 1989), Demand Management Development Program, 3 year Demand Management Action Plan, Information Paper No. 5, (available at: http://www.efa.com.au/Library/SECVDMActionPlan.pdf ) p.5. 4 Queensland Department of Employment, Economic Development and Innovation, Queensland Energy Management Plan, May 2011 https://www.cabinet.qld.gov.au/documents/2011/may/qld%20energy%20management%20plan/Attachments/Qld%20Energy%20Mgt%20Plan.pdf 5 National Grid Management Council (1992). National Grid Protocol: First Issue . Melbourne, NGMC, p. iii 6 Crossley, D., Demand-Side Participation in the Australian National Electricity Market: A Brief Annotated History, Regulatory Assistance Project, 2011, pp.8-10 7 Dunstan, C., “A Simple Rule Change Can Save Billions for Power Networks and their Customers”, The Conversation, 13 March 2015, https://theconversation.com/a-simple-rule-change-can-save-billions-for-power-networks-and-their-customers-38657
Demand Management Incentives Review June 2017 2
INSTITUTE FOR SUSTAINABLE FUTURES
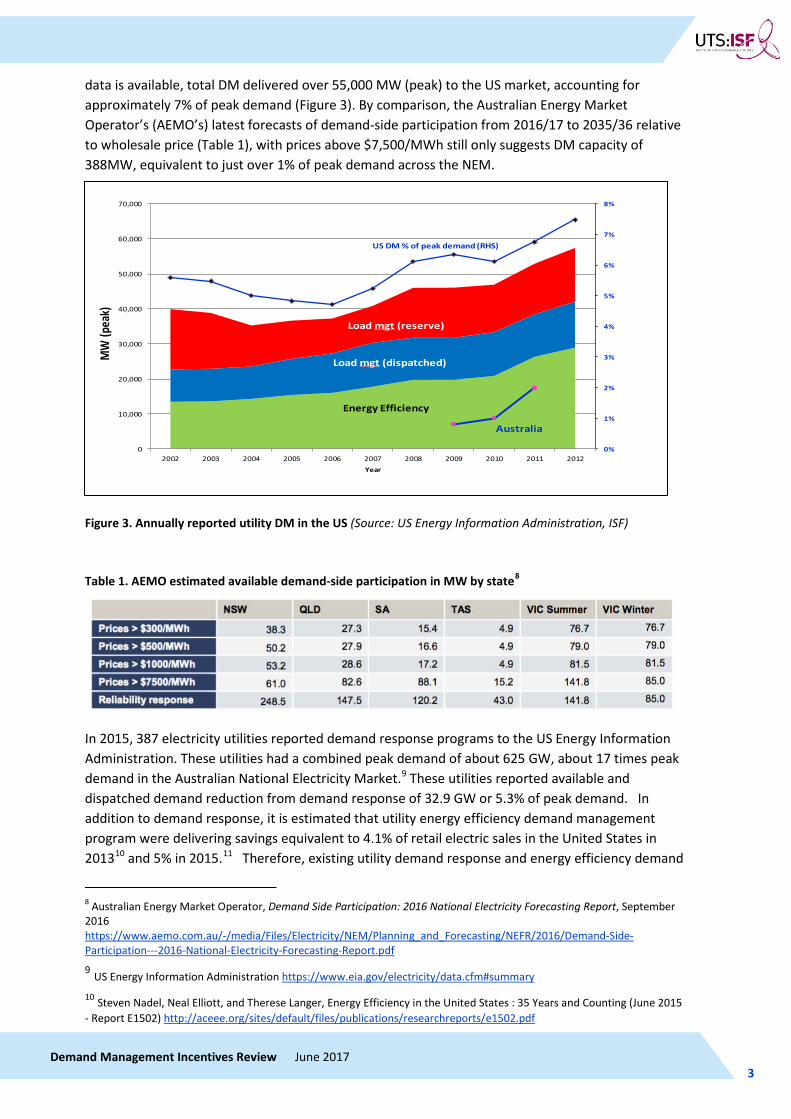
data is available, total DM delivered over 55,000 MW (peak) to the US market, accounting for approximately 7% of peak demand (Figure 3). By comparison, the Australian Energy Market Operator’s (AEMO’s) latest forecasts of demand-side participation from 2016/17 to 2035/36 relative to wholesale price (Table 1), with prices above $7,500/MWh still only suggests DM capacity of 388MW, equivalent to just over 1% of peak demand across the NEM.
Figure 3. Annually reported utility DM in the US (Source: US Energy Information Administration, ISF)
Table 1. AEMO estimated available demand-side participation in MW by state8
In 2015, 387 electricity utilities reported demand response programs to the US Energy Information Administration. These utilities had a combined peak demand of about 625 GW, about 17 times peak demand in the Australian National Electricity Market.9 These utilities reported available and dispatched demand reduction from demand response of 32.9 GW or 5.3% of peak demand. In addition to demand response, it is estimated that utility energy efficiency demand management program were delivering savings equivalent to 4.1% of retail electric sales in the United States in 201310 and 5% in 2015.11 Therefore, existing utility demand response and energy efficiency demand
8 Australian Energy Market Operator, Demand Side Participation: 2016 National Electricity Forecasting Report, September 2016 https://www.aemo.com.au/-/media/Files/Electricity/NEM/Planning_and_Forecasting/NEFR/2016/Demand-Side-Participation---2016-National-Electricity-Forecasting-Report.pdf
9 US Energy Information Administration https://www.eia.gov/electricity/data.cfm#summary 10 Steven Nadel, Neal Elliott, and Therese Langer, Energy Efficiency in the United States : 35 Years and Counting (June 2015 - Report E1502) http://aceee.org/sites/default/files/publications/researchreports/e1502.pdf
0%
1%
2%
3%
4%
5%
6%
7%
8%
0
10,000
20,000
30,000
40,000
50,000
60,000
70,000
2002 2003 2004 2005 2006 2007 2008 2009 2010 2011 2012
MW
(pea
k)
Year
Energy Efficiency
US DM % of peak demand (RHS)
Load mgt (dispatched)
Load mgt (reserve)
Australia
Demand Management Incentives Review June 2017 3
INSTITUTE FOR SUSTAINABLE FUTURES
management programs in the US are estimated to be offering peak demand reduction equivalent to over 55 GW or 9% of peak demand. It should also be noted that these are only average figures and the best performing utilities are delivering DM outcomes more than twice this amount. For more data on DM programs in the United States, please refer to Appendix E.
If the NEM were to establish a proportionally equivalent level of DM to the US average, this would represent potential demand reduction of over 3000MW of demand management capacity. This is equivalent to almost twice the total capacity of the recently retired 1600 MW Hazelwood coal fired power station and more than the combined new capacity proposed in the recent announcements by the South Australian Government (up to 350 MW12) and the Australian Government’s Snowy 2.0 (estimated 2000 MW13). The impact of providing this additional 3000 MW of DM capacity on reducing power prices is likely to be significant, given that removing the 1600 MW capacity of the Hazelwood power station will raise electricity prices by an estimated 7.2 per cent in South Australia14 and 9 per cent across the market.15
It is a positive sign that Australian network businesses are increasingly recognising the importance of supporting DM (utilising DERs such as demand response, energy efficiency, distributed generation and storage) as a means of providing higher value, lower cost and more reliable network services for consumers. This new focus on DM is highlighted in the Energy Network Australia/CSIRO Network Transformation Roadmap.16
The Australian Energy Regulator (AER) now has a unique opportunity to tap this enthusiasm, and redress the longstanding gap in the demand side of Australia's electricity system, through its DM Incentive Scheme and Innovation Allowance Mechanism.
1.3 DM = “Duck Management”? The development of the AER’s DM Incentive Scheme comes at a critical time for energy networks as the electricity system transitions towards a greater proportion of distributed and renewable generation. DM is not just about providing low cost energy resources and reducing consumer energy bills. It is also about ensuring reliable supply in an increasingly complex electricity system.
The emergence of the so-called “duck curve” (as illustrated for California in Figure 4) shows the changing pattern of net demand on the grid as increased renewable uptake, in particular solar PV, may lead to over-generation at times of low load and very steep ramp-up rates to times of peak
11 S. Nadel, Demand Response programs can reduce utilities’ peak demand an average of 10%, complementing savings from energy efficiency programs, http://aceee.org/blog/2017/02/demand-response-programs-can-reduce, Blog, February 09, 2017 12 Up to 250MW of temporary diesel and new gas fired generation and 100 MW of battery storage, South Australian Government, Our Energy Plan, http://ourenergyplan.sa.gov.au/assets/our-energy-plan-sa-web.pdf 13 James Massola, 'Snowy Hydro 2.0': Malcolm Turnbull announces plans for $2 billion expansion, Sydney Morning Herald, 15 March 2017 14 Nick Harmsen, South Australian power bills to increase by $115 after Hazelwood Power Station closure , ABC News Online, Updated 14 Dec 2016, 6:45am, http://www.abc.net.au/news/2016-12-14/sa-power-bills-to-rise-after-hazelwoods-closure,-report-says/8117334 15 Adam Morton and Brian Robins, Hazelwood closure could force power prices up, Sydney Morning Herald , 28 May 2016, http://www.smh.com.au/business/energy/hazelwood-closure-to-force-power-prices-up-20160527-gp583e.html 16 ENA and CSIRO, Network Transformation Roadmap, 2017, http://www.energynetworks.com.au/electricity-network-transformation-roadmap
Demand Management Incentives Review June 2017 4
INSTITUTE FOR SUSTAINABLE FUTURES
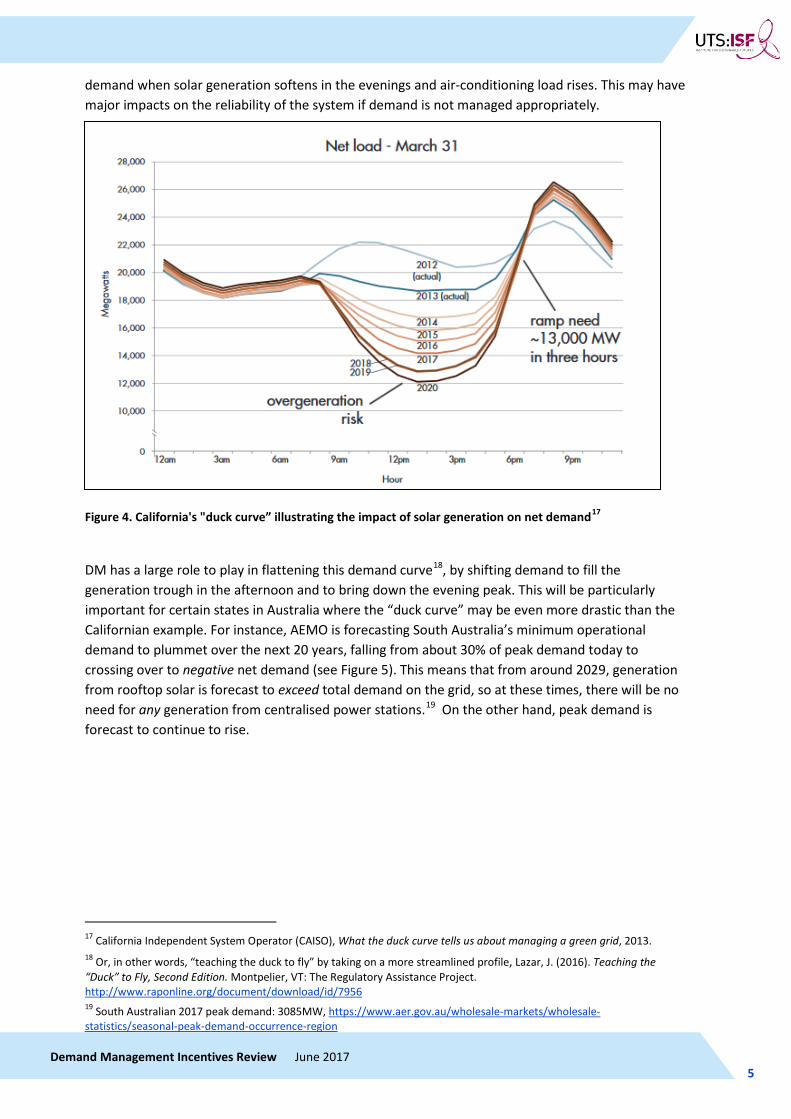
demand when solar generation softens in the evenings and air-conditioning load rises. This may have major impacts on the reliability of the system if demand is not managed appropriately.
Figure 4. California's "duck curve” illustrating the impact of solar generation on net demand17
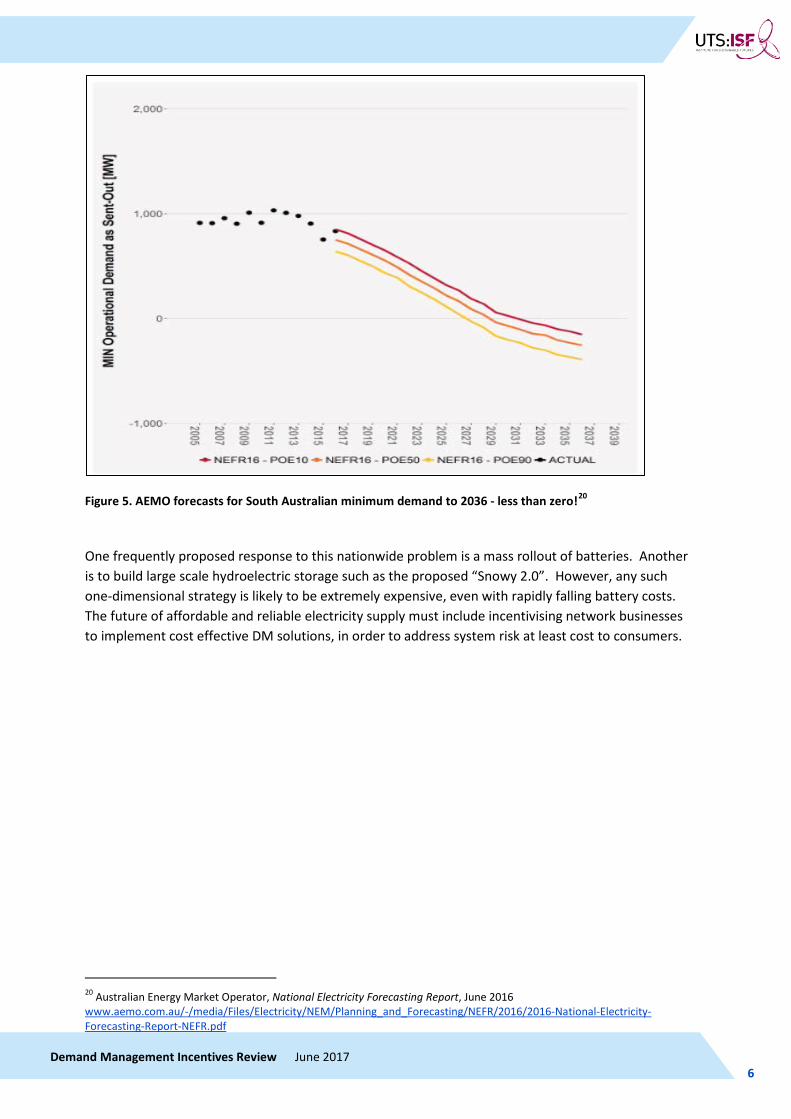
DM has a large role to play in flattening this demand curve18, by shifting demand to fill the generation trough in the afternoon and to bring down the evening peak. This will be particularly important for certain states in Australia where the “duck curve” may be even more drastic than the Californian example. For instance, AEMO is forecasting South Australia’s minimum operational demand to plummet over the next 20 years, falling from about 30% of peak demand today to crossing over to negative net demand (see Figure 5). This means that from around 2029, generation from rooftop solar is forecast to exceed total demand on the grid, so at these times, there will be no need for any generation from centralised power stations.19 On the other hand, peak demand is forecast to continue to rise.
17 California Independent System Operator (CAISO), What the duck curve tells us about managing a green grid, 2013. 18 Or, in other words, “teaching the duck to fly” by taking on a more streamlined profile, Lazar, J. (2016). Teaching the “Duck” to Fly, Second Edition. Montpelier, VT: The Regulatory Assistance Project. http://www.raponline.org/document/download/id/7956 19 South Australian 2017 peak demand: 3085MW, https://www.aer.gov.au/wholesale-markets/wholesale-statistics/seasonal-peak-demand-occurrence-region
Demand Management Incentives Review June 2017 5
INSTITUTE FOR SUSTAINABLE FUTURES
Figure 5. AEMO forecasts for South Australian minimum demand to 2036 - less than zero!20
One frequently proposed response to this nationwide problem is a mass rollout of batteries. Another is to build large scale hydroelectric storage such as the proposed “Snowy 2.0”. However, any such one-dimensional strategy is likely to be extremely expensive, even with rapidly falling battery costs. The future of affordable and reliable electricity supply must include incentivising network businesses to implement cost effective DM solutions, in order to address system risk at least cost to consumers.
20 Australian Energy Market Operator, National Electricity Forecasting Report, June 2016 www.aemo.com.au/-/media/Files/Electricity/NEM/Planning_and_Forecasting/NEFR/2016/2016-National-Electricity-Forecasting-Report-NEFR.pdf
Demand Management Incentives Review June 2017 6
INSTITUTE FOR SUSTAINABLE FUTURES
2 REGULATORY INCENTIVES AND DM
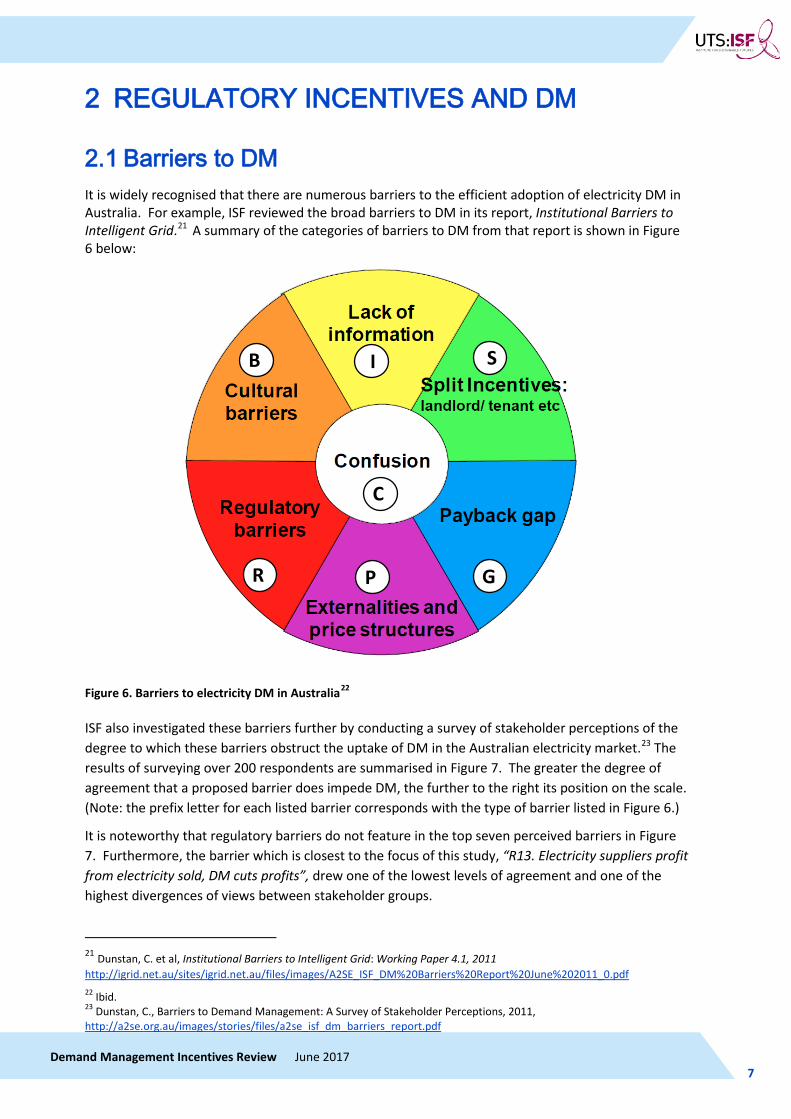
2.1 Barriers to DM It is widely recognised that there are numerous barriers to the efficient adoption of electricity DM in Australia. For example, ISF reviewed the broad barriers to DM in its report, Institutional Barriers to Intelligent Grid.21 A summary of the categories of barriers to DM from that report is shown in Figure 6 below:
Figure 6. Barriers to electricity DM in Australia22
ISF also investigated these barriers further by conducting a survey of stakeholder perceptions of the degree to which these barriers obstruct the uptake of DM in the Australian electricity market.23 The results of surveying over 200 respondents are summarised in Figure 7. The greater the degree of agreement that a proposed barrier does impede DM, the further to the right its position on the scale. (Note: the prefix letter for each listed barrier corresponds with the type of barrier listed in Figure 6.)
It is noteworthy that regulatory barriers do not feature in the top seven perceived barriers in Figure 7. Furthermore, the barrier which is closest to the focus of this study, “R13. Electricity suppliers profit from electricity sold, DM cuts profits”, drew one of the lowest levels of agreement and one of the highest divergences of views between stakeholder groups.
21 Dunstan, C. et al, Institutional Barriers to Intelligent Grid: Working Paper 4.1, 2011 http://igrid.net.au/sites/igrid.net.au/files/images/A2SE_ISF_DM%20Barriers%20Report%20June%202011_0.pdf 22 Ibid. 23 Dunstan, C., Barriers to Demand Management: A Survey of Stakeholder Perceptions, 2011, http://a2se.org.au/images/stories/files/a2se_isf_dm_barriers_report.pdf
I
C
B
P
S
G R
Demand Management Incentives Review June 2017 7

INSTITUTE FOR SUSTAINABLE FUTURES
On the other hand, seven of the top ten barriers, (P12, B19, S4, S5, R15, P11 and I3) are directly related to the behaviour of the electricity suppliers. So, while their effects may be less obvious, regulatory incentives that discourage utilities from undertaking DM are likely to have a powerful impact on limiting the uptake of DM.
Figure 7. Barriers to DM in Australia, (in order of level of respondent agreement, 2011)
Demand Management Incentives Review June 2017 8
INSTITUTE FOR SUSTAINABLE FUTURES
2.2 The DM Incentives Review In its 2012 Power of Choice Review, the AEMC recognised that regulatory incentives faced by network businesses are crucial to the development of an efficient DM market, and so it recommended changing the National Electricity Rules to strengthen such incentives. The subsequent rule change was adopted in 201524, giving the AER responsibility for creating an effective DM Incentive Scheme and Innovation Allowance.
In the context of the AER developing this new DM Incentive Scheme, the Australian Renewable Energy Agency (ARENA) commissioned ISF to undertake this DM Incentives Review to assess quantitatively the financial barriers to distribution network DM that are created by existing economic regulatory incentives. This Review involved extensive consultation with a range of stakeholders including extensive consultation with network businesses, demand management providers, regulators, government and consumer representatives, including via a Study Reference Group ( see Appendix E). This Report draws heavily on the two submissions that ISF made to the AER DMIS consultation process25.
It should be noted that it is not the purpose of the DMIR Model and this study to examine the relative economic merits of DM solutions compared to network solutions. While this is an important question that deserves more attention, it is not the focus of this review. Accordingly, this review does not conclude or suggest that DM is always a lower-cost solution for consumers than network capex. Rather, the purpose of this analysis is to ask: In a range of plausible scenarios where DM could deliver lower cost and higher value to customers, does the current regulatory system create financial disincentives to choosing DM and thereby discourage network businesses from adopting DM?
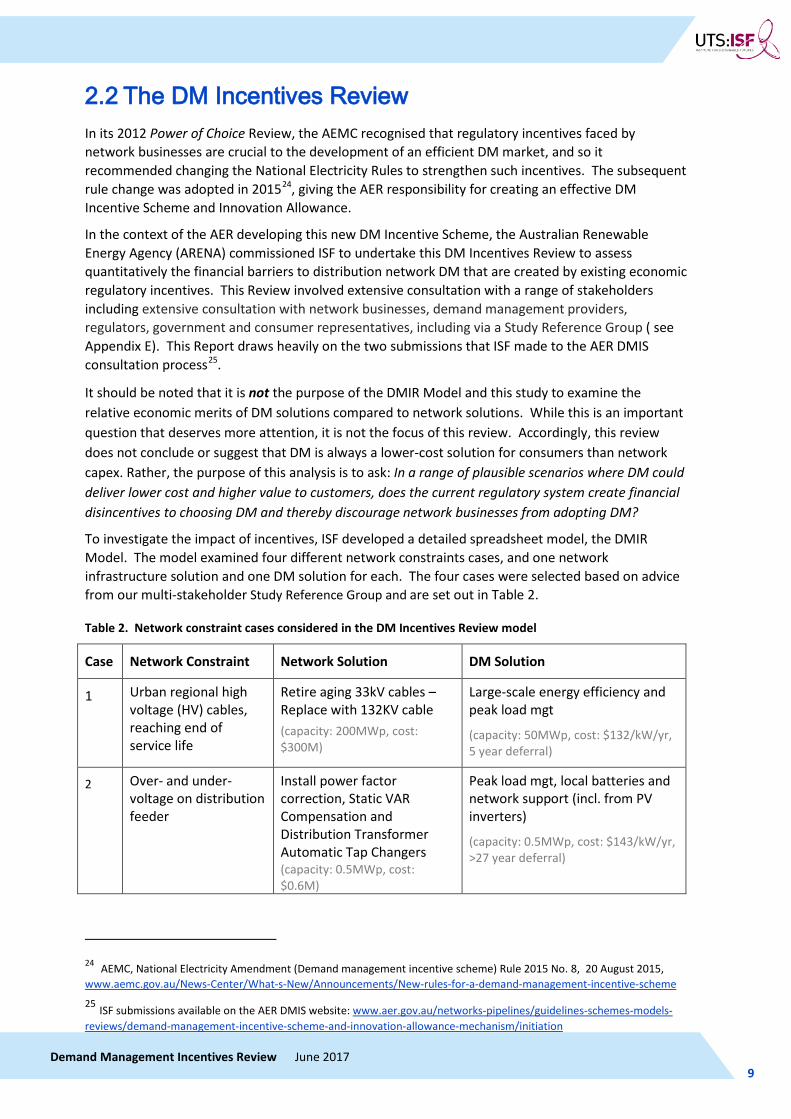
To investigate the impact of incentives, ISF developed a detailed spreadsheet model, the DMIR Model. The model examined four different network constraints cases, and one network infrastructure solution and one DM solution for each. The four cases were selected based on advice from our multi-stakeholder Study Reference Group and are set out in Table 2.
Table 2. Network constraint cases considered in the DM Incentives Review model
Case Network Constraint Network Solution DM Solution
1 Urban regional high voltage (HV) cables, reaching end of service life
Retire aging 33kV cables – Replace with 132KV cable (capacity: 200MWp, cost: $300M)
Large-scale energy efficiency and peak load mgt
(capacity: 50MWp, cost: $132/kW/yr, 5 year deferral)
2 Over- and under-voltage on distribution feeder
Install power factor correction, Static VAR Compensation and Distribution Transformer Automatic Tap Changers (capacity: 0.5MWp, cost: $0.6M)
Peak load mgt, local batteries and network support (incl. from PV inverters)
(capacity: 0.5MWp, cost: $143/kW/yr, >27 year deferral)
24 AEMC, National Electricity Amendment (Demand management incentive scheme) Rule 2015 No. 8, 20 August 2015, www.aemc.gov.au/News-Center/What-s-New/Announcements/New-rules-for-a-demand-management-incentive-scheme
25 ISF submissions available on the AER DMIS website: www.aer.gov.au/networks-pipelines/guidelines-schemes-models-reviews/demand-management-incentive-scheme-and-innovation-allowance-mechanism/initiation
Demand Management Incentives Review June 2017 9
INSTITUTE FOR SUSTAINABLE FUTURES
3 Distribution zone approaching capacity on urban fringe
New zone substation for new residential estate (capacity: 10MWp, cost: $30M)
Establish mini-grid (energy efficiency, load mgt, PV, batteries & diesel back up) for new subdivision; maintain connection to main grid (capacity: 10MWp, cost: $113/kW/yr, >27 year deferral)
4 Unreliable distribution feeder to community on rural fringe-of-grid
Retire existing feeder - replace like for like (capacity: 5MWp, cost: $5M)
Establish mini-grid (energy efficiency, load mgt, PV, batteries & diesel back up) – keep existing feeder as back up (capacity: 5MWp, cost: $113/kW/yr, >27 year deferral)
The model conducts net present value benefit/cost analysis over five-year and 30-year timeframes, approximating a single regulatory period and a typical network asset lifetime.
The DM solutions draw on the following decentralised energy resources: 1. peak load management (demand response, dynamic peak pricing, direct load control, etc.) 2. energy efficiency 3. battery storage 4. dispatchable local generation 5. (local) variable renewable generation.
The regulatory parameters considered in the Model include:
1. Key inputs: discount rate, weighted average cost of capital (WACC), tax rate, cost of debt, return on equity and Value of Customer Reliability (VCR)
2. Key regulatory features: depreciation, capital expenditure (capex) rollover to Regulatory Asset Base (RAB), operating expenditure (opex) recovery, reductions in expected unserved energy (EUSE)
3. Incentive mechanisms including: • STPIS - Service Target Performance Incentive Scheme • EBSS - Efficiency Benefit Sharing Scheme • CESS - Capital Expenditure Sharing Scheme
4. Net market benefits (that is, benefits that accrue to stakeholders other than directly to distribution network businesses and their customers) including:
• the value of avoided transmission, generation and storage capacity • the value of avoided carbon emissions • the network option value, that is, the value associated with deferring network costs
that may be lower or avoidable in future. 5. (Please note: These factors were estimated but are generally not included in the cost-benefit
analysis below, except where explicitly stated.)Net market benefits that are not considered include:
• the value of customer energy savings (i.e. other than distribution network charges) • the value of non-network reduced EUSE • the impacts on wholesale pool prices.
Reflecting the complexity of the modelling task, there are many assumptions about both data and mathematical relationships in this modelling. The network constraints and solutions used in the model are hypothetical, but ISF drew on real world references and precedents wherever available. Within the limited time available and budget constraints of the project, ISF endeavoured to apply
Demand Management Incentives Review June 2017 10
INSTITUTE FOR SUSTAINABLE FUTURES
transparent and unbiased estimates. To allow stakeholders to consider, understand, and challenge these assumptions, ISF has made the full DMIR model freely and publicly available on request, as outlined at the beginning of this report.
There are numerous remaining relevant and interesting issues that ISF would like to examine further if time and resources were available. For example, the treatment in the model of the Service Target Performance Incentive Scheme (STPIS) and expected unserved energy (EUSE), though adequate for this analysis (as the reliability of DM and network solutions are assumed to be equivalent), is rudimentary and would benefit from refinement for future analysis.
2.3 Modelling Results The outputs of the model focused on:
• the benefits and costs accruing to customers • the revenue, costs and net profit accruing to the network businesses • the return on assets for network businesses.26
These values were calculated for both the network (capex) solution and the DM (opex) solution, using a baseline of no action to address the network constraint as the common point of reference.
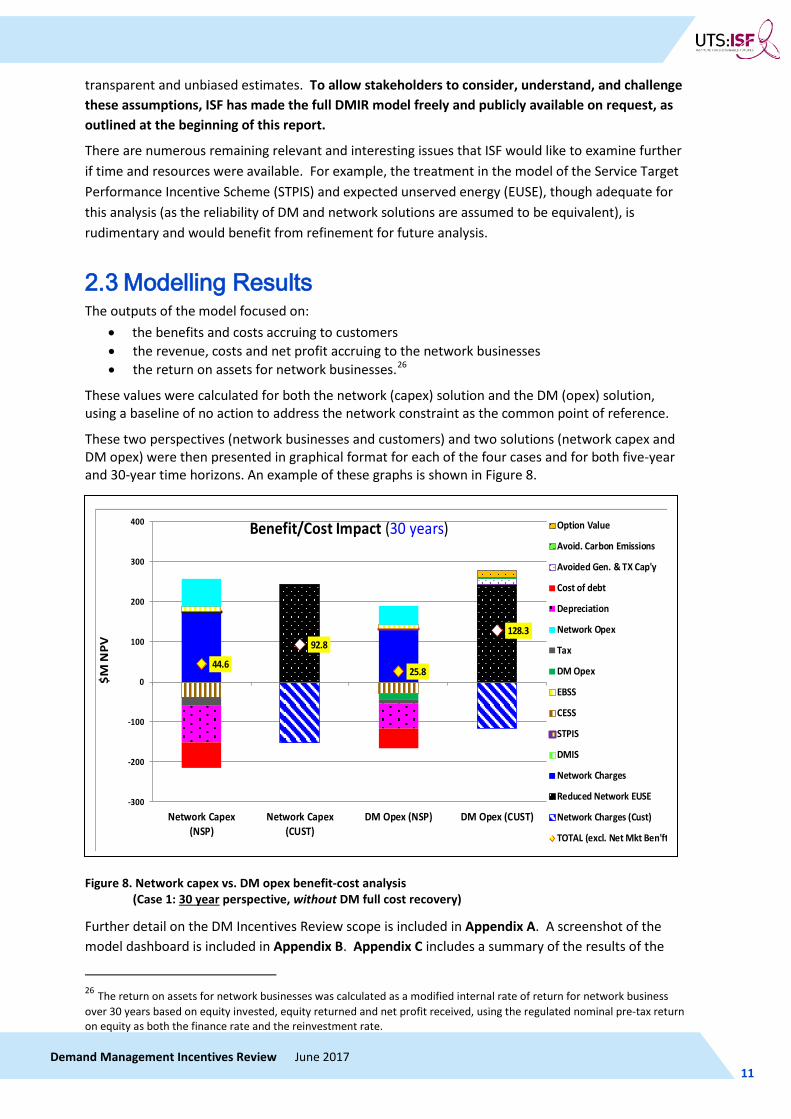
These two perspectives (network businesses and customers) and two solutions (network capex and DM opex) were then presented in graphical format for each of the four cases and for both five-year and 30-year time horizons. An example of these graphs is shown in Figure 8.
Figure 8. Network capex vs. DM opex benefit-cost analysis (Case 1: 30 year perspective, without DM full cost recovery)
Further detail on the DM Incentives Review scope is included in Appendix A. A screenshot of the model dashboard is included in Appendix B. Appendix C includes a summary of the results of the
26 The return on assets for network businesses was calculated as a modified internal rate of return for network business over 30 years based on equity invested, equity returned and net profit received, using the regulated nominal pre-tax return on equity as both the finance rate and the reinvestment rate.
44.6
92.8
25.8
128.3
-300
-200
-100
0
100
200
300
400
Network Capex(NSP)
Network Capex(CUST)
DM Opex (NSP) DM Opex (CUST)
$M N
PV
Benefit/Cost Impact (30 years) Option Value
Avoid. Carbon Emissions
Avoided Gen. & TX Cap'y
Cost of debt
Depreciation
Network Opex
Tax
DM Opex
EBSS
CESS
STPIS
DMIS
Network Charges
Reduced Network EUSE
Network Charges (Cust)
TOTAL (excl. Net Mkt Ben'ft
Demand Management Incentives Review June 2017 11
INSTITUTE FOR SUSTAINABLE FUTURES
modelling for each case both, without a DM incentive, and with key sensitivity analyses of estimates of break-even levels for the DM Incentive Payment needed to neutralise the current regulatory bias.
As illustrated in Figure 8, in Case 1 for the 30-year horizon, the DM opex solution delivers lower costs and higher net benefits ($128.3 million) to customers than the network capex solution ($92.8 million). If the regulatory system was working efficiently, then the network business should be incentivised to adopt the DM solution to the network constraint. However, from the network business’s perspective, the network capex solution is the more profitable option ($44.6 million net profit compared to only $25.8 million net profit for the DM opex solution). If return on equity for the network business is considered as the decisive parameter, instead of net profit, this also favours the network capex solution (4.9%), compared to the DM opex solution (4.7%). All of the above values exclude the additional value of “net market benefits” that DM can provide (see Section 2.4).
A similar pattern of “what is good for distribution network businesses is bad for customers” is observed in two of the four network constraint case studies (over 30 years), if net market benefits are excluded, and in all four case studies (over 30 years) if net market benefits are included. This suggests a significant bias in favour of network capex solutions and against DM opex solutions.
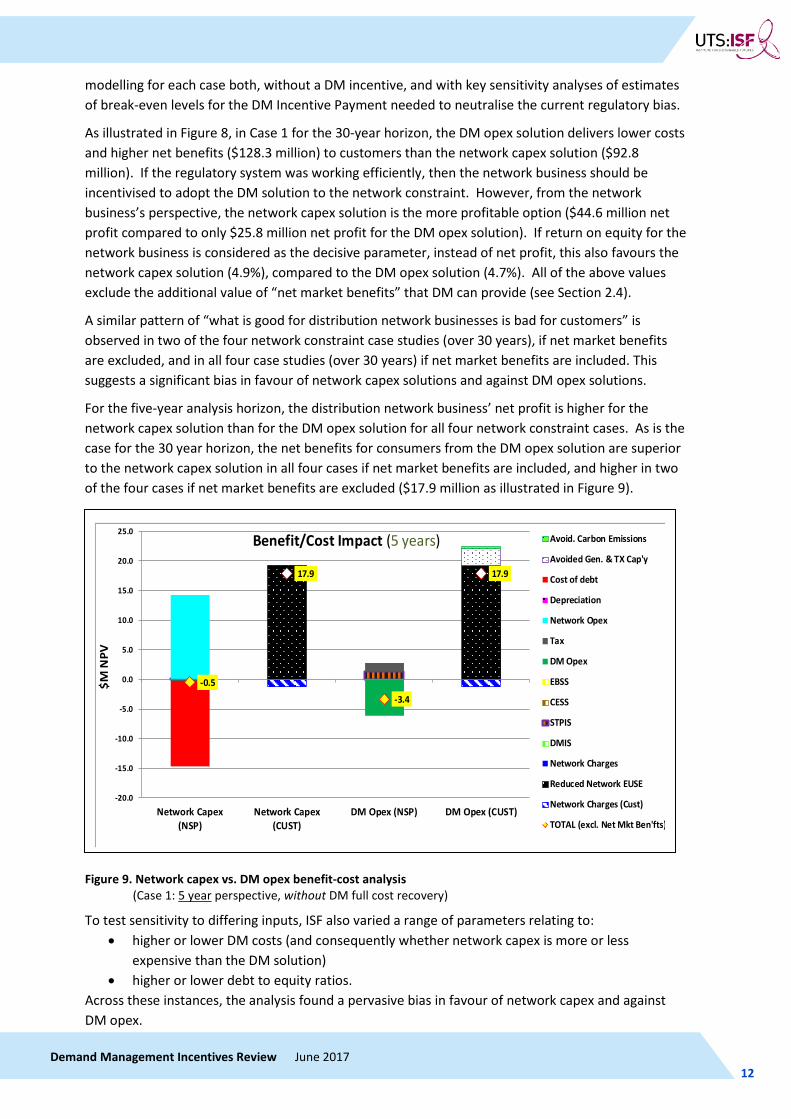
For the five-year analysis horizon, the distribution network business’ net profit is higher for the network capex solution than for the DM opex solution for all four network constraint cases. As is the case for the 30 year horizon, the net benefits for consumers from the DM opex solution are superior to the network capex solution in all four cases if net market benefits are included, and higher in two of the four cases if net market benefits are excluded ($17.9 million as illustrated in Figure 9).
Figure 9. Network capex vs. DM opex benefit-cost analysis (Case 1: 5 year perspective, without DM full cost recovery)
To test sensitivity to differing inputs, ISF also varied a range of parameters relating to: • higher or lower DM costs (and consequently whether network capex is more or less
expensive than the DM solution) • higher or lower debt to equity ratios.
Across these instances, the analysis found a pervasive bias in favour of network capex and against DM opex.
-0.5
17.9
-3.4
17.9
-20.0
-15.0
-10.0
-5.0
0.0
5.0
10.0
15.0
20.0
25.0
Network Capex(NSP)
Network Capex(CUST)
DM Opex (NSP) DM Opex (CUST)
$M N
PV
Benefit/Cost Impact (5 years) Avoid. Carbon Emissions
Avoided Gen. & TX Cap'y
Cost of debt
Depreciation
Network Opex
Tax
DM Opex
EBSS
CESS
STPIS
DMIS
Network Charges
Reduced Network EUSE
Network Charges (Cust)
TOTAL (excl. Net Mkt Ben'fts)
Demand Management Incentives Review June 2017 12
INSTITUTE FOR SUSTAINABLE FUTURES
In summary, the modelling found strong evidence that there are significant financial barriers to network DM in the current regulatory structure. These barriers were found to include:
a. A bias in favour of capex e.g. network infrastructure, relative to opex b. Less favourable treatment of DM opex recovery, compared to capex and other opex c. An exclusion of future “option value” when considering DM solutions. For example,
undertaking DM to defer expensive network capex may lead to major savings in the future if demand conditions change so that the network capex is no longer required.
(Note that this third barrier is not an intrinsic element of the current regulatory system, but a consequence of how the current regulations are applied.)
The first two barriers are discussed briefly below, while option value is discussed in Section 2.4.
The impact of the capex bias depends largely on the extent to which the regulated cost of capital exceeds the actual cost of capital. This bias may be significant, and is often the most contentious issue in regulatory determinations conducted by the AER. This often takes the form of debates about the appropriate weighted cost of capital (WACC). Indeed, the tendency for monopoly economic regulation to be biased in favour of capex, and to encourage excessive capex, has been an area of lively debate at least since the 1960s. 27 However, it was beyond the scope of this study to investigate this element of capex bias.
The most significant barrier appears to be the relatively unfavourable treatment of cost recovery for DM opex relative to network capex and other non-DM network opex. Capex cost recovery is based on the principle of the network business putting a capex proposal to the AER and the AER assessing the proposal on its merits. If the capex is deemed prudent, the full value of the capex, plus a return on capital, is allowed to be recovered. On the other hand, DM opex, like other opex, is based on modified extrapolation of past expenditure, the so-called “base-step-trend” approach. However, because DM opex has generally been very small in past expenditure, this tends to perpetuate low DM expenditure. The network business can argue to the AER for a specific “step change” in DM opex, but this in turn involves another process for the network business to work through in order to justify DM opex which creates more uncertainty about DM cost recovery.
A second dimension of the unfavourable treatment of DM opex cost recovery relates to how it is justified. Typically, network capex is justifiable where it is shown to cost-effectively improve customer reliability and reduce expected unserved energy (EUSE). By contrast, DM opex is typically only justifiable where it is shown to cost-effectively avoid or defer network capex. This makes DM subordinate to the higher-priority network capex solution, and it does not allow the two solutions to be compared equally, according to their ability to meet customer needs. This is an important distinction. There are likely to be very many instances where DM can create value for network customers by improving reliability and reducing unserved energy, well in advance of the time when new large and “lumpy” network infrastructure would be cost effective. A requirement that network DM can only be justified where it defers or avoids specific network capex denies customers access to better service and lower costs.
It should be recognised that the current regulatory structure does allow partial delayed cost recovery for DM opex in the subsequent regulatory period, so long as DM opex occurs in the forecast base year. However, our modelling found that, allowing for the time value of money associated with this delayed cost recovery and other offsetting factors via the EBSS, the effective level of DM opex cost
27 See for example, Averch, Harvey; Johnson, Leland L. (1962). "Behavior of the Firm Under Regulatory Constraint”, American Economic Review. 52 (5): 1052–1069.
Demand Management Incentives Review June 2017 13
INSTITUTE FOR SUSTAINABLE FUTURES
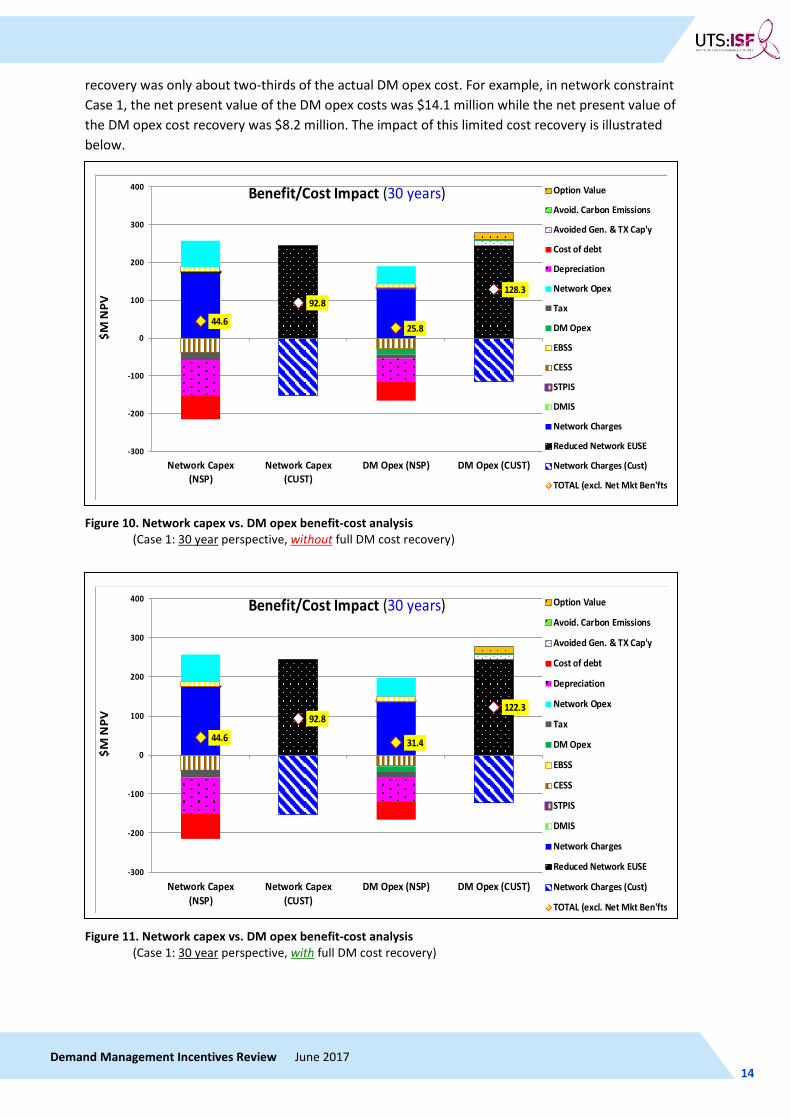
recovery was only about two-thirds of the actual DM opex cost. For example, in network constraint Case 1, the net present value of the DM opex costs was $14.1 million while the net present value of the DM opex cost recovery was $8.2 million. The impact of this limited cost recovery is illustrated below.
Figure 10. Network capex vs. DM opex benefit-cost analysis (Case 1: 30 year perspective, without full DM cost recovery)
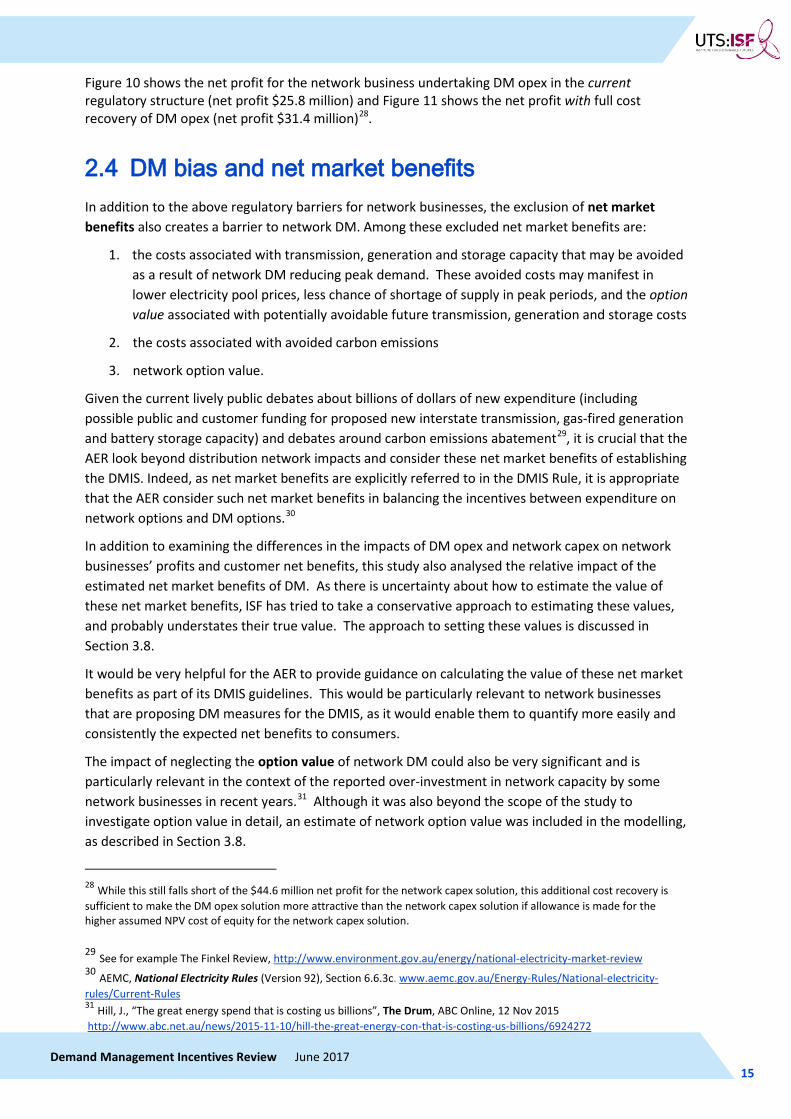
Figure 11. Network capex vs. DM opex benefit-cost analysis (Case 1: 30 year perspective, with full DM cost recovery)
44.6
92.8
25.8
128.3
-300
-200
-100
0
100
200
300
400
Network Capex(NSP)
Network Capex(CUST)
DM Opex (NSP) DM Opex (CUST)
$M N
PV
Benefit/Cost Impact (30 years) Option Value
Avoid. Carbon Emissions
Avoided Gen. & TX Cap'y
Cost of debt
Depreciation
Network Opex
Tax
DM Opex
EBSS
CESS
STPIS
DMIS
Network Charges
Reduced Network EUSE
Network Charges (Cust)
TOTAL (excl. Net Mkt Ben'fts
44.6
92.8
31.4
122.3
-300
-200
-100
0
100
200
300
400
Network Capex(NSP)
Network Capex(CUST)
DM Opex (NSP) DM Opex (CUST)
$M N
PV
Benefit/Cost Impact (30 years) Option Value
Avoid. Carbon Emissions
Avoided Gen. & TX Cap'y
Cost of debt
Depreciation
Network Opex
Tax
DM Opex
EBSS
CESS
STPIS
DMIS
Network Charges
Reduced Network EUSE
Network Charges (Cust)
TOTAL (excl. Net Mkt Ben'fts
Demand Management Incentives Review June 2017 14
INSTITUTE FOR SUSTAINABLE FUTURES
Figure 10 shows the net profit for the network business undertaking DM opex in the current regulatory structure (net profit $25.8 million) and Figure 11 shows the net profit with full cost recovery of DM opex (net profit $31.4 million)28.
2.4 DM bias and net market benefits In addition to the above regulatory barriers for network businesses, the exclusion of net market benefits also creates a barrier to network DM. Among these excluded net market benefits are:
1. the costs associated with transmission, generation and storage capacity that may be avoided as a result of network DM reducing peak demand. These avoided costs may manifest in lower electricity pool prices, less chance of shortage of supply in peak periods, and the option value associated with potentially avoidable future transmission, generation and storage costs
2. the costs associated with avoided carbon emissions
3. network option value.
Given the current lively public debates about billions of dollars of new expenditure (including possible public and customer funding for proposed new interstate transmission, gas-fired generation and battery storage capacity) and debates around carbon emissions abatement29, it is crucial that the AER look beyond distribution network impacts and consider these net market benefits of establishing the DMIS. Indeed, as net market benefits are explicitly referred to in the DMIS Rule, it is appropriate that the AER consider such net market benefits in balancing the incentives between expenditure on network options and DM options.30
In addition to examining the differences in the impacts of DM opex and network capex on network businesses’ profits and customer net benefits, this study also analysed the relative impact of the estimated net market benefits of DM. As there is uncertainty about how to estimate the value of these net market benefits, ISF has tried to take a conservative approach to estimating these values, and probably understates their true value. The approach to setting these values is discussed in Section 3.8.
It would be very helpful for the AER to provide guidance on calculating the value of these net market benefits as part of its DMIS guidelines. This would be particularly relevant to network businesses that are proposing DM measures for the DMIS, as it would enable them to quantify more easily and consistently the expected net benefits to consumers.
The impact of neglecting the option value of network DM could also be very significant and is particularly relevant in the context of the reported over-investment in network capacity by some network businesses in recent years.31 Although it was also beyond the scope of the study to investigate option value in detail, an estimate of network option value was included in the modelling, as described in Section 3.8.
28 While this still falls short of the $44.6 million net profit for the network capex solution, this additional cost recovery is sufficient to make the DM opex solution more attractive than the network capex solution if allowance is made for the higher assumed NPV cost of equity for the network capex solution. 29 See for example The Finkel Review, http://www.environment.gov.au/energy/national-electricity-market-review 30 AEMC, National Electricity Rules (Version 92), Section 6.6.3c. www.aemc.gov.au/Energy-Rules/National-electricity-rules/Current-Rules 31 Hill, J., “The great energy spend that is costing us billions”, The Drum, ABC Online, 12 Nov 2015 http://www.abc.net.au/news/2015-11-10/hill-the-great-energy-con-that-is-costing-us-billions/6924272
Demand Management Incentives Review June 2017 15
INSTITUTE FOR SUSTAINABLE FUTURES
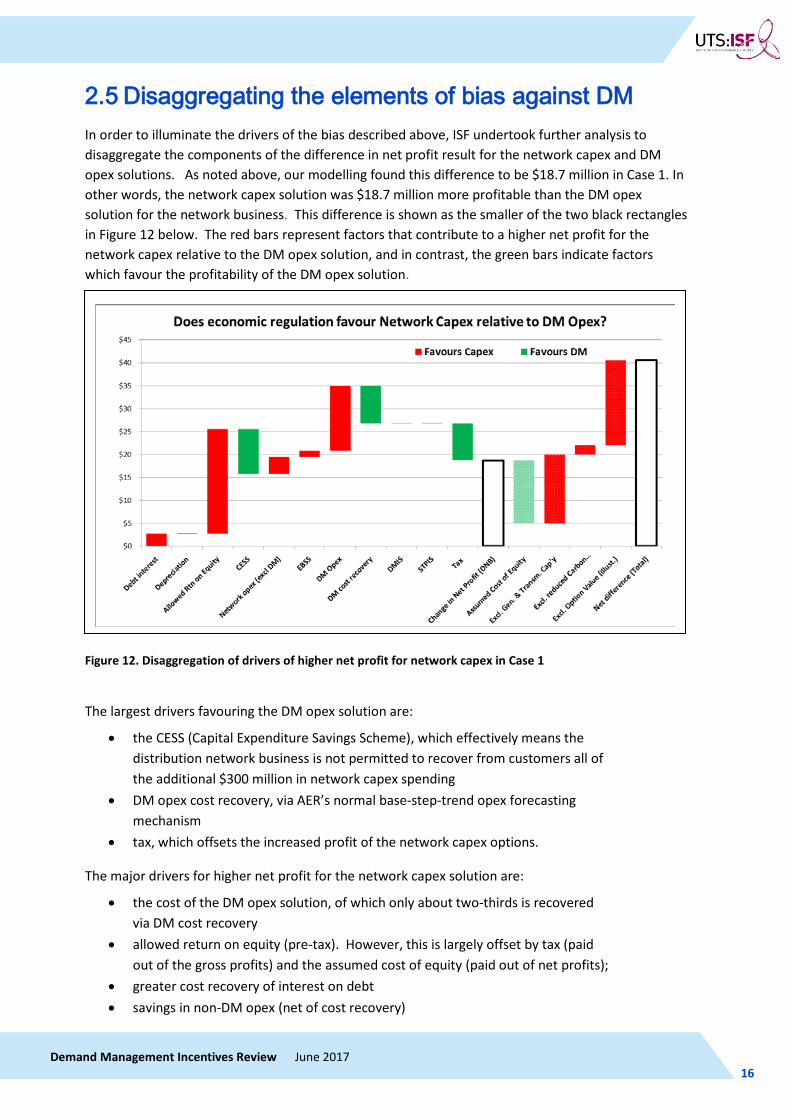
2.5 Disaggregating the elements of bias against DM In order to illuminate the drivers of the bias described above, ISF undertook further analysis to disaggregate the components of the difference in net profit result for the network capex and DM opex solutions. As noted above, our modelling found this difference to be $18.7 million in Case 1. In other words, the network capex solution was $18.7 million more profitable than the DM opex solution for the network business. This difference is shown as the smaller of the two black rectangles in Figure 12 below. The red bars represent factors that contribute to a higher net profit for the network capex relative to the DM opex solution, and in contrast, the green bars indicate factors which favour the profitability of the DM opex solution.
Figure 12. Disaggregation of drivers of higher net profit for network capex in Case 1
The largest drivers favouring the DM opex solution are:
• the CESS (Capital Expenditure Savings Scheme), which effectively means the distribution network business is not permitted to recover from customers all of the additional $300 million in network capex spending
• DM opex cost recovery, via AER’s normal base-step-trend opex forecasting mechanism
• tax, which offsets the increased profit of the network capex options.
The major drivers for higher net profit for the network capex solution are:
• the cost of the DM opex solution, of which only about two-thirds is recovered via DM cost recovery
• allowed return on equity (pre-tax). However, this is largely offset by tax (paid out of the gross profits) and the assumed cost of equity (paid out of net profits);
• greater cost recovery of interest on debt • savings in non-DM opex (net of cost recovery)
Demand Management Incentives Review June 2017 16
INSTITUTE FOR SUSTAINABLE FUTURES
• the EBSS (Efficiency Benefits Sharing Scheme) as described above.
As noted in Figure 6, there are other important barriers to network DM beyond the regulatory incentives considered by this DM Incentives Review. It is likely that the existing regulatory disincentives to DM have helped to entrench and reinforce these other non-regulatory barriers, and that a well-designed DM Incentive Scheme would help to redress these other barriers over time.
This review does not provide a complete analysis of all potential biases against DM that are relevant to the AER’s deliberations. For example, this modelling does not take account of the following potential biases:
• Opex cost pass through is largely based on actual expenditure, via the base-step-trend opex forecasting approach, while capex pass through is largely based on regulatory estimates of the cost of capital. This may give the distribution network business more capacity to increase profit via capex rather than opex. for example:
o Cost of debt may be less than that assumed by the regulatory model. o Cost of equity may be lower than that assumed by the regulatory model.
• Cultural preferences within the distribution network business for network capex over DM opex, due to for example:
o greater familiarity and organisational expertise with network capex solutions o greater confidence in the network capex solution to perform as expected o greater familiarity and confidence with the cost recovery mechanism for network
capex o an expectation that DM is only a stop gap measure, and that a network capex
solution “will ultimately be needed anyway” o a concern that delaying the network capex solution could lead to increased costs in
easement acquisition, materials, labour, etc. o concerns about customer engagement, how to value DM cost and benefits, and how
to share these with customers.
As a minimum, the AER should use the DM Incentive Scheme to remove the existing regulatory barriers. However, the AER should also ensure that the DM incentive is high enough to address rapidly the other non-regulatory barriers to DM. Our analysis indicates that there is ample scope to do this, while at the same time ensuring that customers can still receive major net benefits from network DM.
Our analysis has identified significant barriers to network DM both in the regulatory structure and elsewhere. However, we do not find that these barriers are an intrinsic or necessary feature of the electricity market. Accordingly, if the DM Incentive Scheme can effectively address these barriers in the short to medium term (say, over two five-year regulatory periods), then the DM Incentive Scheme will not need to be a permanent feature of the regulatory regime.
Demand Management Incentives Review June 2017 17
INSTITUTE FOR SUSTAINABLE FUTURES
3 DESIGNING THE DM INCENTIVE SCHEME
3.1 Principles and metrics for a DM Incentive Scheme The DM Incentive Scheme should recognise (and monetise) the value that network DM creates for customers by reducing overall network charges and costs of electricity supply. In this respect, the DM Incentive Scheme would be analogous to the existing Efficiency Benefits Sharing Scheme (EBSS), the Capital Expenditure Sharing Scheme (CESS) and the Service Target Performance Incentive Scheme (STPIS), which also offer financial benefits to network businesses in return for delivering greater benefits to consumers.
In support of the scheme assessment criteria in the National Electricity Rules, the following principles for the DM Incentive Scheme are proposed. The DM Incentive Scheme should:
1. maximise long-term benefits for consumers
2. enhance competition, in particular by allowing DM to compete fairly with network options
3. recognise that there are regulatory and non-regulatory barriers to efficient network DM
4. ensure that DM incentives are sufficient to develop an effective and efficient DM market
5. encourage efficient delivery of DM
6. require transparent and consistent information provision and reporting
7. include a holistic consideration of all relevant benefits, including net market benefits beyond those directly related to the distribution network businesses.
Relevant net market benefits that should be considered include:
• the value of deferred or avoided of transmission, generation and storage capacity (including the option value of potentially avoidable future network, generation and storage costs); and
• the value of avoided carbon emissions.
As the dominant driver of costs for electricity network businesses is annual peak demand, the primary performance measure for the DM Incentive Scheme should be reducing annual peak demand on the network. Accordingly, ISF proposes a performance-based DM incentive payment structured as dollars per kilowatt (or kilovolt amp) of peak demand reduction per year, that is, $/kWpeak per year, or $/kVApeak per year.
However, the AER has also argued that a “DM Cost Uplift”, that pays the network business in proportion to DM expenditure rather than in proportion to peak demand, may be more flexible, offer greater certainty to network businesses and be easier for the AER to administer.32 While ISF considers the performance-based DMIP to be more directly linked to demand reduction and value created, the DM Cost Uplift could also be effective, provided it is accompanied with appropriate performance reporting and accountability, particularly regarding delivery of net benefits to consumers.
32 See for example: AER, Options Day Slide Pack, 6 April 2017, www.aer.gov.au/system/files/AER%20-%20Slide%20pack%20-%20Demand%20Management%20Options%20Day%20-%206%20April%202017.pdf
Demand Management Incentives Review June 2017 18
INSTITUTE FOR SUSTAINABLE FUTURES
Other performance metrics that will be useful for monitoring network DM performance are outlined in Section 3.7.
Given the significance of the imbalance in DM opex cost recovery in the current regulatory structure, it is crucial that the AER directly addresses this issue in the context of implementing the DM Incentive Scheme. To encourage all cost-effective forms of network DM, in both the short and long term, ISF recommends that the AER adopt the following “two-pronged” approach in implementing the Scheme:
1. Normalising DM cost recovery: This approach treats proposed DM expenditure in the network business’s five-yearly regulatory proposal on the same terms as capex and non-DM opex.
2. A DM incentive: This approach involves offering a financial benefit to network businesses that recognise the value that DM delivers to customers in reducing overall network charges and costs of electricity supply.
3.2 Normalising DM cost recovery The DM incentive Scheme should not be regarded solely as an incentive payment to respond to existing biases and barriers to DM. Rather, the DM Incentive Scheme should be developed as part of a coordinated strategy to encourage cost-effective DM as a normal part of running a network business, that is, as normal business expenditure. Such an approach would involve the AER treating DM opex initiatives proposed in the network business’s five-yearly regulatory proposal on an equitable basis with capex and non-DM opex.
To implement this approach, the AER should encourage each distribution network business to develop a detailed five-year DM Plan as part of its regulatory proposal. A DM Plan should identify DM solutions to network constraints and provide a business case to demonstrate the solutions’ cost effectiveness. Cost effectiveness could be demonstrated either by reference to avoided or deferred network capex or by reference to other factors that are conventionally used to justify network capex or non-DM opex. These other factors could include specific, quantified customer benefits in service improvements, reliability or reduced expected unserved energy.
Given that this is a new approach to planning DM, the AER should give clear, timely guidance to network businesses on what information is required for DM Plans. Information requirements should be no more onerous than for other proposed network expenditure.
DM Plans should include both price-based DM and non price-based DM. There should be no cap on the allowable cost of DM in aggregate, or on a $/kW per year basis, but all DM measures included should be cost effective and should demonstrate net benefits to consumers. DM Plans should be subject to the same review processes as other proposed capex and opex. It is recognised that the AER may need to draw on specialised DM consulting expertise to undertake such DM expenditure reviews, just as it does for the capex and opex expenditure reviews.
If the AER approves the proposed DM expenditure (for example as an alternative to a more costly network capex solution), the associated DM opex should be added to the network allowable opex for the forthcoming regulatory period. In cases where the proposed DM expenditure is rejected, the cost of the network capex solution should be added to the network business’s allowable capex. (Such capex should, of course, be subject the normal expenditure review process.)
A network business should be able to receive the DM incentive both for DM projects included in its DM Plan and for DM projects not included in its DM Plan. However, DM projects not included in its
Demand Management Incentives Review June 2017 19
INSTITUTE FOR SUSTAINABLE FUTURES
DM Plan should be subject to a separate test in order to determine whether the project delivers net benefits to consumers.
While normalising DM opex and requiring DM Plans will help to address the unequal treatment of DM opex relative to other opex cost recovery, it will do little to address the capex/opex bias and other non-regulatory barriers. Furthermore, given that the scale of such DM Plans will likely be modest at least initially, normalising DM opex and requiring DM Plans would do little to realise the net market benefits of network DM. For these reasons, a separate DM incentive is required.
3.3 Proposed structure of a DM incentive The DM incentive should be structured either:
• as a performance-based DM “Incentive Payment” (DMIP), in terms of dollars per kilowatt of peak demand reduction per year; that is, $/kWpeak per year or $/kVApeak per year; or
• as a DM “Cost Uplift” (DMCU), in terms of dollars of additional cost recovery, proportional to the cost to the distribution network business of the DM solution.
Of these two options, the DM cost uplift option is more consistent with existing AER processes, and may therefore seem easier to administer. However, the DM cost uplift is also less directly linked to efficient DM outcomes. If the AER chooses this option, it will need to ensure that there are effective monitoring and reporting arrangements in place to ensure the DM solutions adopted also deliver net benefits to consumers.
As noted in Section 2.3, one of the advantages of DM is its ability to be deployed more flexibly, in smaller “lumps” and with shorter lead times in response to changing demand conditions. It is therefore impractical and inefficient to expect networks to plan all DM activity up to 6 years in advance in their five-yearly DM Plans. This is particularly relevant where network businesses currently have limited experience and expertise in procuring network DM, and where technology is evolving rapidly. Therefore, the DM incentive should also be available to support DM with a short planning lead time.
3.4 Setting the level of the DM incentive A DM incentive should be set at a level which is high enough to motivate the network businesses to implement cost-effective network DM (without which there would be no benefits to share with customers), but low enough to deliver significant net benefits to consumers. It is not possible to determine an “ideal level” in advance, as the net benefits available from DM in each case depend on many variables, including the nature of the network constraint and cost of the available network and DM solutions.
It would be cumbersome, costly and inefficient to determine the appropriate level of the DM incentive for each network constraint, in each location, for each network business. It is therefore likely to be more practical and efficient to stipulate a uniform DM incentive at a default level for all DM in all network territories for the duration of the forthcoming network regulatory determinations (2019–2025).
Therefore, in setting the DM incentive, the AER will need to balance these competing demands by selecting a DM incentive that is high enough to maximise the implementation of cost-effective DM in the first place, but which is also as low as possible to maximise the share of DM benefits that accrues to consumers.
Demand Management Incentives Review June 2017 20
INSTITUTE FOR SUSTAINABLE FUTURES
One relatively straightforward approach for setting a DM incentive would be to apply the same proportional benefit sharing as currently applies to the EBSS and the CESS – that is, about 30% share to network business and about 70% to customers. Since the DM Incentive Scheme should aim to encourage cost-effective DM, the average cost of DM would be expected to be no more than the average cost of network capacity.
Setting the value for a DM Incentive Payment
The following example illustrates how this 30:70 value share approach could be applied to setting the value of a DM Incentive Payment.
Illustration: Calculating value of a DM Incentive Payment, using 30:70 value share rule of thumb
The long-run average cost of network capacity (measured in $/kWpeak per year) can be estimated by dividing the total annual cost of providing network services (that is, total annual network revenue) by the peak demand being served each year. Based on the total annual network revenue and annual peak demand, the long-run average cost of capacity for New South Wales distribution network businesses ranges from $170/kWpeak per year for Endeavour Energy, to about $330/kWpeak per year for Essential Energy, with a weighted average of $250 kWpeak per year. Applying the 30% network share of these avoided costs gives a range of approximately $50 to $100/kWpeak per year and an average of about $75/kWpeak per year. The figures for other states and territories will vary, but are likely to fit broadly within the NSW range.
This provides a plausible indication of the scale of a DM incentive payment.
A more sophisticated way to estimate the appropriate level for the DMIP is to calculate the “break-even level” of the DMIP which would mean that the Network Capex solution and the DM Opex solution would be equally financially attractive to the distribution network business. We have used the DMIP Model to calculate these levels for each of the four modelled network constraints. However, a key question is break-even in what? There are different possible measures for financial neutrality for distribution network businesses. The most obvious of these is “net profit”. That is: what level of DMIP would be required that ensure that the distribution network business receives the same level of post-tax profit for the DM opex solution as for the network capex solution? These values are shown in the “Medium” column in Table 3 below, and range from $62 to $119/kW per year (average $87/kW per year).
However, the net profit measure overlooks the fact that the distribution network businesses generally need to invest more in the network capex solutions than in the DM opex, and shareholders will expect to earn a competitive financial return on this additional equity. Unlike debt servicing and depreciation, this Return on Equity (RoE) is paid out of post-tax profit. So if we adjust the net profit to account for this additional RoE in both the network capex and DM opex solutions, then the break-even DMIP for “Net Profit less Return on in Equity” falls to a range of between $16 and $59/kW per year (average $38/kW per year). This is shown in the “Low” column in Table 3.
It is important to note that there are several key reasons why this level should be considered too low for a DMIP. These reasons include:
• It makes no provision for the value of net market benefits.
• It does nothing to overcome cultural and other non-regulatory barriers to DM.
Demand Management Incentives Review June 2017 21
INSTITUTE FOR SUSTAINABLE FUTURES
• It assumes that the regulated return on equity is set appropriately, even though regulators and customer advocates have often asserted that the regulated return on equity has generally been set too high.
• The stipulated DMIP level should set a cap on the scale of the DMIP, allowing distribution network businesses to claim a lower level where this would deliver net benefits to consumers. Setting an excessively low DMIP will foreclose on distribution network businesses’ capacity and willingness to deliver such benefits to consumers in many cases.
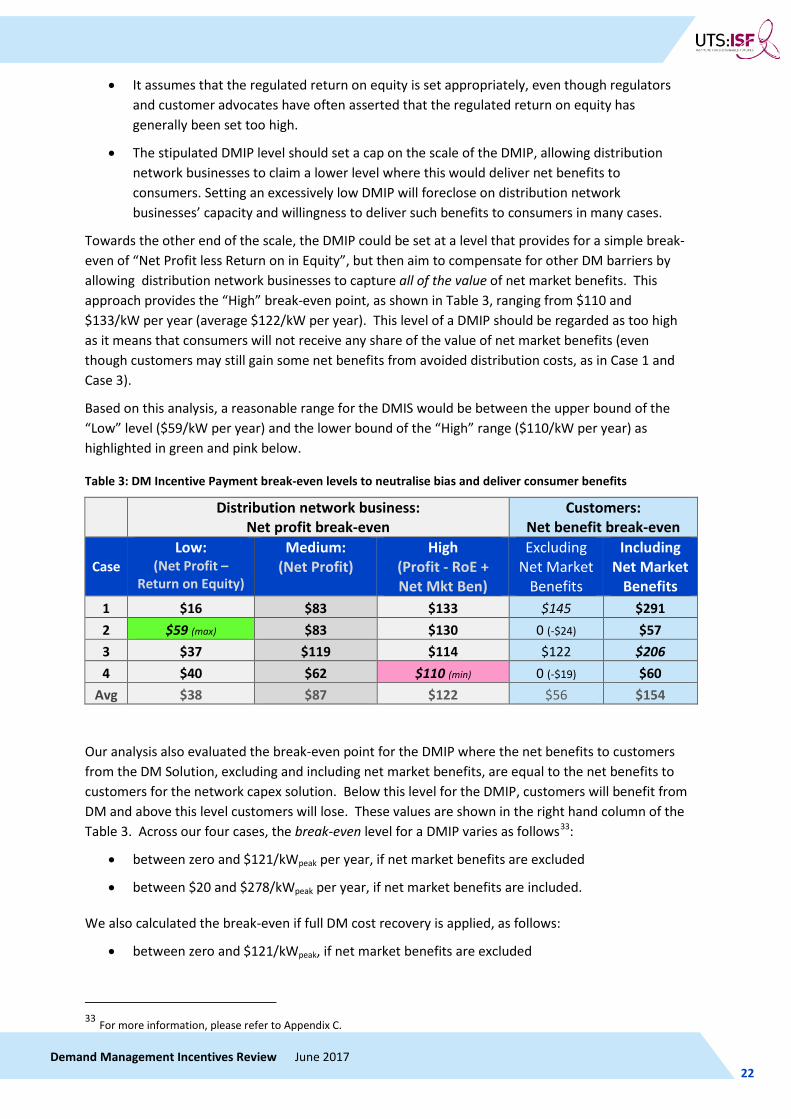
Towards the other end of the scale, the DMIP could be set at a level that provides for a simple break-even of “Net Profit less Return on in Equity”, but then aim to compensate for other DM barriers by allowing distribution network businesses to capture all of the value of net market benefits. This approach provides the “High” break-even point, as shown in Table 3, ranging from $110 and $133/kW per year (average $122/kW per year). This level of a DMIP should be regarded as too high as it means that consumers will not receive any share of the value of net market benefits (even though customers may still gain some net benefits from avoided distribution costs, as in Case 1 and Case 3).
Based on this analysis, a reasonable range for the DMIS would be between the upper bound of the “Low” level ($59/kW per year) and the lower bound of the “High” range ($110/kW per year) as highlighted in green and pink below.
Table 3: DM Incentive Payment break-even levels to neutralise bias and deliver consumer benefits
Distribution network business:
Net profit break-even Customers:
Net benefit break-even
Case Low:
(Net Profit – Return on Equity)
Medium: (Net Profit)
High (Profit - RoE + Net Mkt Ben)
Excluding Net Market
Benefits
Including Net Market
Benefits 1 $16 $83 $133 $145 $291 2 $59 (max) $83 $130 0 (-$24) $57 3 $37 $119 $114 $122 $206 4 $40 $62 $110 (min) 0 (-$19) $60
Avg $38 $87 $122 $56 $154
Our analysis also evaluated the break-even point for the DMIP where the net benefits to customers from the DM Solution, excluding and including net market benefits, are equal to the net benefits to customers for the network capex solution. Below this level for the DMIP, customers will benefit from DM and above this level customers will lose. These values are shown in the right hand column of the Table 3. Across our four cases, the break-even level for a DMIP varies as follows33:
• between zero and $121/kWpeak per year, if net market benefits are excluded
• between $20 and $278/kWpeak per year, if net market benefits are included.
We also calculated the break-even if full DM cost recovery is applied, as follows:
• between zero and $121/kWpeak, if net market benefits are excluded
33 For more information, please refer to Appendix C.
Demand Management Incentives Review June 2017 22

INSTITUTE FOR SUSTAINABLE FUTURES
• between zero and $278/kWpeak, if net market benefits are included.
This indicates a lower DM incentive will be required if full cost recovery of DM is applied. So as DM cost recovery is normalised, the need for a DM incentive is reduced. Conversely, if DM full cost recovery is not applied, a higher DM incentive is warranted to account for net market benefits in the assessment.
For details of these calculations see Appendix C.
Please note that, provided the requirement that the network business demonstrate net customer benefit is applied, the higher end of the above ranges is arguably more relevant than the lower end in setting the DMIP. For cases with a customer net benefit of zero, this implies that the DM Solution is more expensive than the network capex solution, so a net customer benefit for DM does not exist. In such cases, providing a DM incentive would not be justified, regardless of the stipulated maximum level of the DM Incentive Payment.
Based on the available evidence and ISF’s analysis of a range of network constraints, a DM Incentive Payment should be set somewhere in the range from $50 to $100/kWpeak per year in order to stimulate cost-effective network DM while ensuring significant net benefits are still delivered to customers.
Anecdotal feedback, during the consultation around this study, also suggested that a DMIP below $40 to $50 /kWpeak per year (roughly 20% of the average cost of distribution network services) would be unlikely to motivate network business to actively support DM.
A DMIP at this $50 to $100/kWpeak per year level would also be broadly consistent with the level for DM incentives in other jurisdictions. For example, in Ontario, the peak demand-related component of their conservation and demand management (CDM) incentive ranges between CAD$13.50 and CAD$81/kWpeak per year.34
Setting the value for a DM Cost Uplift
The AER has indicated through the DMIS consultation process, its interest in a DM Cost Uplift (DMCU), as an alternative to a DMIP. To assist the AER’s deliberations, ISF undertook a similar analysis to our DMIS assessment, to estimate an appropriate level for a DMCU as a percentage of the cost of the DM measure to the distribution network business.
The results of this analysis for break-even from the distribution network business’s perspective are:
• the “Low” DMCU ranges from 27% to 41% (average 34%).
• the “Medium” DMCU ranges from 55% to 141% of the cost of DM to the distribution network business (average 90%).
• the “High” DMCU ranges from 91% to 223% (average 128%).
The results for each network constraint case are summarised in Error! Reference source not found..
34 Macdonald, C. , Power Stream Application for a CDM Performance Incentive Payment to Ontario Energy Board, 2016 http://www.rds.ontarioenergyboard.ca/webdrawer/webdrawer.dll/webdrawer/rec/526430/view/
Demand Management Incentives Review June 2017 23
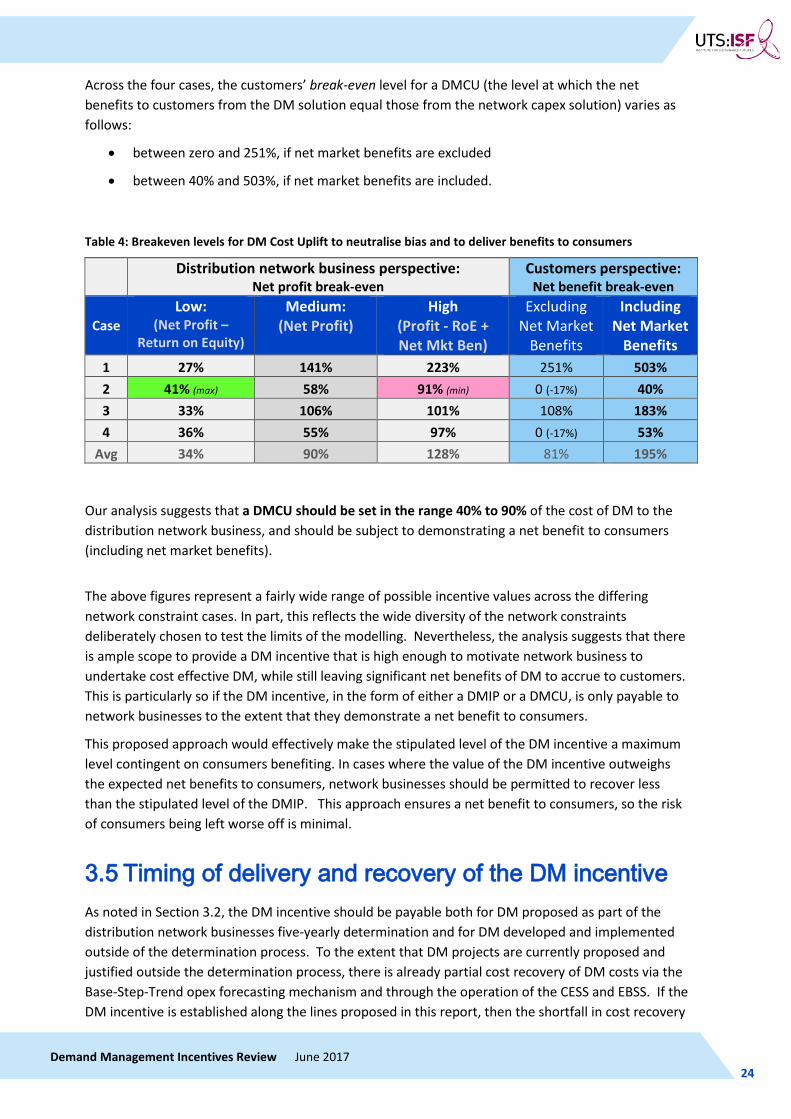
INSTITUTE FOR SUSTAINABLE FUTURES
Across the four cases, the customers’ break-even level for a DMCU (the level at which the net benefits to customers from the DM solution equal those from the network capex solution) varies as follows:
• between zero and 251%, if net market benefits are excluded
• between 40% and 503%, if net market benefits are included.
Table 4: Breakeven levels for DM Cost Uplift to neutralise bias and to deliver benefits to consumers
Distribution network business perspective:
Net profit break-even Customers perspective:
Net benefit break-even
Case Low:
(Net Profit – Return on Equity)
Medium: (Net Profit)
High (Profit - RoE + Net Mkt Ben)
Excluding Net Market
Benefits
Including Net Market
Benefits 1 27% 141% 223% 251% 503% 2 41% (max) 58% 91% (min) 0 (-17%) 40% 3 33% 106% 101% 108% 183% 4 36% 55% 97% 0 (-17%) 53%
Avg 34% 90% 128% 81% 195%
Our analysis suggests that a DMCU should be set in the range 40% to 90% of the cost of DM to the distribution network business, and should be subject to demonstrating a net benefit to consumers (including net market benefits).
The above figures represent a fairly wide range of possible incentive values across the differing network constraint cases. In part, this reflects the wide diversity of the network constraints deliberately chosen to test the limits of the modelling. Nevertheless, the analysis suggests that there is ample scope to provide a DM incentive that is high enough to motivate network business to undertake cost effective DM, while still leaving significant net benefits of DM to accrue to customers. This is particularly so if the DM incentive, in the form of either a DMIP or a DMCU, is only payable to network businesses to the extent that they demonstrate a net benefit to consumers.
This proposed approach would effectively make the stipulated level of the DM incentive a maximum level contingent on consumers benefiting. In cases where the value of the DM incentive outweighs the expected net benefits to consumers, network businesses should be permitted to recover less than the stipulated level of the DMIP. This approach ensures a net benefit to consumers, so the risk of consumers being left worse off is minimal.
3.5 Timing of delivery and recovery of the DM incentive As noted in Section 3.2, the DM incentive should be payable both for DM proposed as part of the distribution network businesses five-yearly determination and for DM developed and implemented outside of the determination process. To the extent that DM projects are currently proposed and justified outside the determination process, there is already partial cost recovery of DM costs via the Base-Step-Trend opex forecasting mechanism and through the operation of the CESS and EBSS. If the DM incentive is established along the lines proposed in this report, then the shortfall in cost recovery
Demand Management Incentives Review June 2017 24
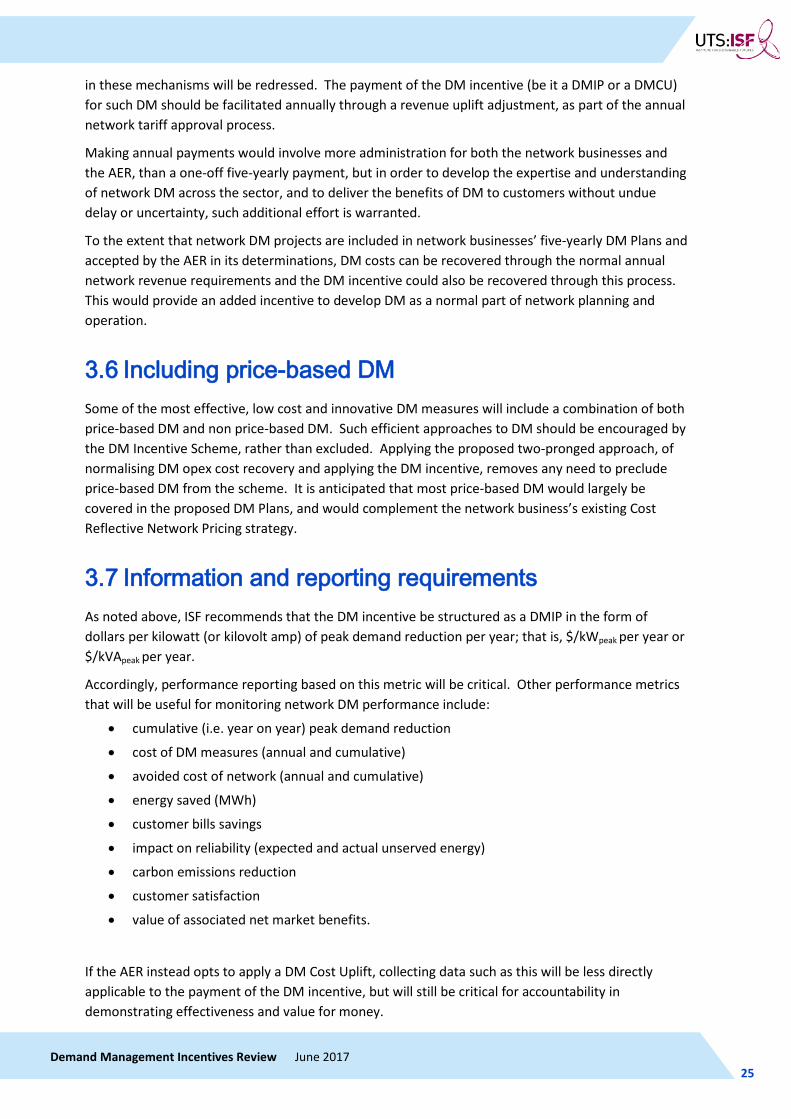
INSTITUTE FOR SUSTAINABLE FUTURES
in these mechanisms will be redressed. The payment of the DM incentive (be it a DMIP or a DMCU) for such DM should be facilitated annually through a revenue uplift adjustment, as part of the annual network tariff approval process.
Making annual payments would involve more administration for both the network businesses and the AER, than a one-off five-yearly payment, but in order to develop the expertise and understanding of network DM across the sector, and to deliver the benefits of DM to customers without undue delay or uncertainty, such additional effort is warranted.
To the extent that network DM projects are included in network businesses’ five-yearly DM Plans and accepted by the AER in its determinations, DM costs can be recovered through the normal annual network revenue requirements and the DM incentive could also be recovered through this process. This would provide an added incentive to develop DM as a normal part of network planning and operation.
3.6 Including price-based DM Some of the most effective, low cost and innovative DM measures will include a combination of both price-based DM and non price-based DM. Such efficient approaches to DM should be encouraged by the DM Incentive Scheme, rather than excluded. Applying the proposed two-pronged approach, of normalising DM opex cost recovery and applying the DM incentive, removes any need to preclude price-based DM from the scheme. It is anticipated that most price-based DM would largely be covered in the proposed DM Plans, and would complement the network business’s existing Cost Reflective Network Pricing strategy.
3.7 Information and reporting requirements As noted above, ISF recommends that the DM incentive be structured as a DMIP in the form of dollars per kilowatt (or kilovolt amp) of peak demand reduction per year; that is, $/kWpeak per year or $/kVApeak per year.
Accordingly, performance reporting based on this metric will be critical. Other performance metrics that will be useful for monitoring network DM performance include:
• cumulative (i.e. year on year) peak demand reduction
• cost of DM measures (annual and cumulative)
• avoided cost of network (annual and cumulative)
• energy saved (MWh)
• customer bills savings
• impact on reliability (expected and actual unserved energy)
• carbon emissions reduction
• customer satisfaction
• value of associated net market benefits.
If the AER instead opts to apply a DM Cost Uplift, collecting data such as this will be less directly applicable to the payment of the DM incentive, but will still be critical for accountability in demonstrating effectiveness and value for money.
Demand Management Incentives Review June 2017 25

INSTITUTE FOR SUSTAINABLE FUTURES
3.8 Estimating the value of net market benefits Using the DMIS to allow distribution network businesses to share in the value of net market benefits was advocated by the AEMC in its 2012 Power of Choice Report and is referred to in the DMIS Rule.35 This section sets out how some key net market benefits have been quantified in the DMIR Model and how a similar quantification could be applied to the DMIS itself.
In its modelling, ISF has attributed values for the following net market benefits:
1. Value of avoided transmission capacity (and the associated option value)
The average value for avoided transmission capacity can be approximated by dividing the total transmission network business revenue by the peak demand served by these businesses. Alternatively, other estimates are available, such as the one calculated for incremental transmission cost in the report, Building our Savings.36 This figure is $950/kVApeak. Once amortised over 30 years, this equates to $70/kW per year. However, there is no guarantee that the local network constraint will occur at precisely the same time as the constraint on the transmission network. In the absence of available data, we have assumed an arbitrary peak demand diversity factor of 50% between distribution and transmission constraints. This reduces the avoided transmission cost to $35/kW per year. ISF used this figure in the model.
A strong case can be made for extending the DM Incentive Scheme to apply to transmission networks as well as distribution network businesses, but this is not included in the National Electricity Rules at present. If an effective and appropriate DM Incentive Scheme were also to apply to transmission network businesses, then there would be no need to include a net market benefit value for transmission capacity in setting the DM Incentive Scheme for distribution networks. Until this occurs, it is appropriate to include a value for avoided transmission capacity in the DMIS for distribution network businesses.
2. Value of avoided generation (and storage) capacity (and the associated option value)
The value of avoided generation (and storage) capacity provides a proxy for:
• the value of reduced expected unserved energy (EUSE) in the wholesale energy market; and • the impacts on wholesale pool price and consequently retail energy prices. It was a concern over the lack of an efficient DM market in the National Electricity Market wholesale market that led the COAG Energy Council to request a rule change to create a “Demand Response Mechanism”.37 The failure to implement this rule change suggests that the underlying inefficiency remains.
35 AEMC, National Electricity Rules (Version 92), Section 6.6.3c. www.aemc.gov.au/Energy-Rules/National-electricity-rules/Current-Rules 36 Langham, E., Dunstan, C.,Walgenwitz, G., Denvir, P., Lederwasch, A., and Landler, J. 2010, BUILDING OUR SAVINGS: Reduced Infrastructure Costs from Improving Building Energy Efficiency. Prepared for the Department of Climate Change and Energy Efficiency by the Institute for Sustainable Futures, University of Technology Sydney and Energetics., https://opus.lib.uts.edu.au/bitstream/10453/16813/1/2010003238OK.pdf 37 AEMC, Demand Response Mechanism and Ancillary Services Unbundling: Final Determination http://www.aemc.gov.au/Rule-Changes/Demand-Response-Mechanism/Final/AEMC-Documents/Information-sheet-%E2%80%93-Final-determination.aspx
Demand Management Incentives Review June 2017 26
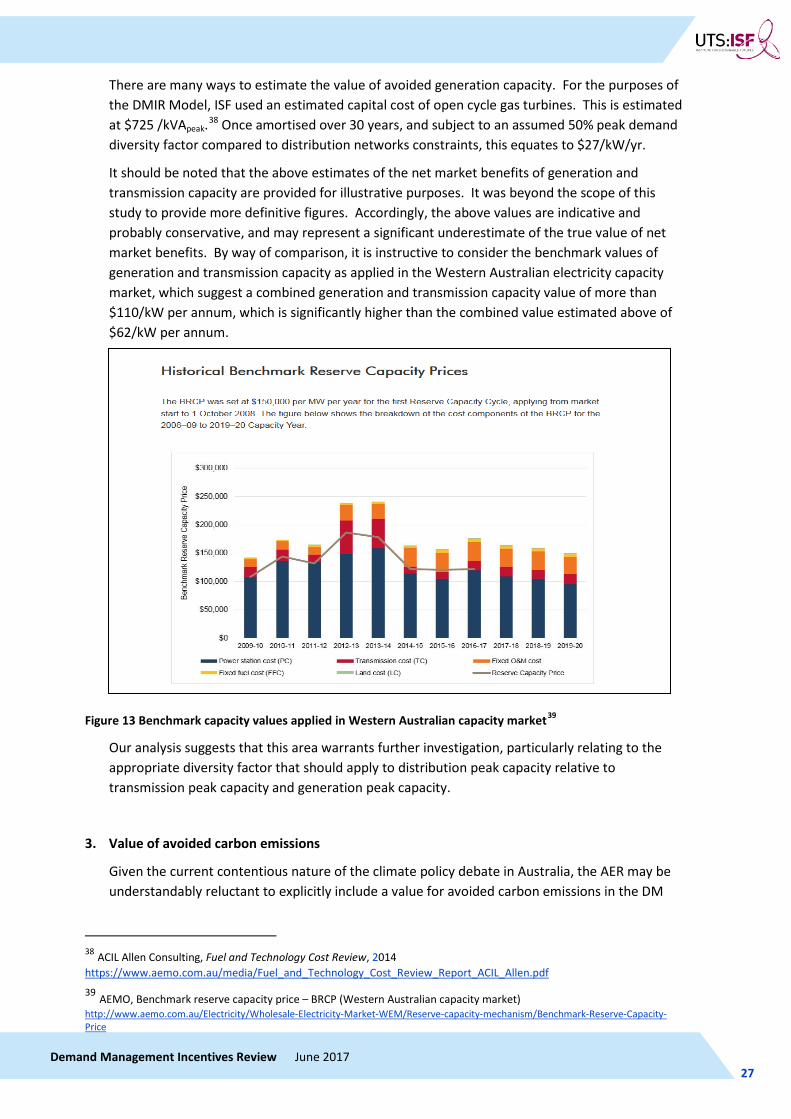
INSTITUTE FOR SUSTAINABLE FUTURES
There are many ways to estimate the value of avoided generation capacity. For the purposes of the DMIR Model, ISF used an estimated capital cost of open cycle gas turbines. This is estimated at $725 /kVApeak.38 Once amortised over 30 years, and subject to an assumed 50% peak demand diversity factor compared to distribution networks constraints, this equates to $27/kW/yr.
It should be noted that the above estimates of the net market benefits of generation and transmission capacity are provided for illustrative purposes. It was beyond the scope of this study to provide more definitive figures. Accordingly, the above values are indicative and probably conservative, and may represent a significant underestimate of the true value of net market benefits. By way of comparison, it is instructive to consider the benchmark values of generation and transmission capacity as applied in the Western Australian electricity capacity market, which suggest a combined generation and transmission capacity value of more than $110/kW per annum, which is significantly higher than the combined value estimated above of $62/kW per annum.
Figure 13 Benchmark capacity values applied in Western Australian capacity market39
Our analysis suggests that this area warrants further investigation, particularly relating to the appropriate diversity factor that should apply to distribution peak capacity relative to transmission peak capacity and generation peak capacity.
3. Value of avoided carbon emissions
Given the current contentious nature of the climate policy debate in Australia, the AER may be understandably reluctant to explicitly include a value for avoided carbon emissions in the DM
38 ACIL Allen Consulting, Fuel and Technology Cost Review, 2014 https://www.aemo.com.au/media/Fuel_and_Technology_Cost_Review_Report_ACIL_Allen.pdf 39 AEMO, Benchmark reserve capacity price – BRCP (Western Australian capacity market) http://www.aemo.com.au/Electricity/Wholesale-Electricity-Market-WEM/Reserve-capacity-mechanism/Benchmark-Reserve-Capacity-Price
Demand Management Incentives Review June 2017 27
INSTITUTE FOR SUSTAINABLE FUTURES
Incentive Scheme. However it could, as a minimum, publish an estimate of the value for avoided carbon emissions, so that avoided carbon emissions could be accounted for even if not included in the calculations for the DMIS.
The Australian Government has effectively already attributed such a value through the auctions under the Emission Reduction Fund (ERF). The market-clearing price for the most recent ERF auction was $10.69/t CO2equivalent.40 ISF used this figure in the DMIR Model.
4. Network Option Value
The current value of an asset or option associated with the possibility that it may be worth more in the future is its option value. DM solutions have option value where they involve the possibility of avoiding costs to a later date, due to changed circumstances.
DM solutions are usually valued based directly on their capacity to avoid or defer specific imminent supply capex. However, DM often has another significant but less obvious option value. By deferring specific supply infrastructure expenditure, DM solutions also create time for circumstances to change. During this time period, the need for the supply capex solution (or the DM opex) may be reduced or deferred, or it may disappear altogether.
For the purposes of our modelling, we have simply included an arbitrary 10% chance of circumstances changing (e.g. peak demand reducing) so that the anticipated network constraint disappears five years after it is first expected to occur. This leads to a major option value in Case 1, associated with avoiding the need for a major network augmentation, and a minor option value in Cases 2 and 3, associated with removing the need to continue the DM opex activity. There is no option value in Case 4, as this case involves eventually relying fully on the DM solution to provide electricity supply via a standalone mini-grid, as an alternative to replacing centralised grid supply to the fringe-of-grid community.
40 Australian Government Emission Reductions Fund, 4th Auction, Nov 2016, http://www.cleanenergyregulator.gov.au/ERF/Auctions-results/November-2016
Demand Management Incentives Review June 2017 28
INSTITUTE FOR SUSTAINABLE FUTURES
4 COMPETITION IN DM SERVICES The AER has suggested that “enhancing competition” should be considered as an additional criterion in implementing the rules for establishing the DM Incentive Scheme41. ISF strongly supports this additional criterion, provided that it serves the purpose of improving the outcomes for all customers and vulnerable customers in particular.
At present, there is very little competition in the Australian network DM market as there is currently little demand from network businesses for these services. Network DM depends on detailed information regarding network conditions and the timing, scale and nature of the network constraint. Moreover, given the recent adoption of the final Electricity Ring-fencing Guidelines, the network businesses will normally be expected to contract with a third-party provider of DM services.42
Simply regulating network businesses, or directing them to provide information to the market, or directing them to contract for cost-effective DM services, is very unlikely to result in the development of DM services. This is particularly so in the current regulatory environment where there is evidence through our modelling that it is contrary to the network business’s financial interest to do introduce DM measures.
In these circumstances, it is very difficult to develop an effective DM market unless the network is incentivised to do so.
It is desirable to develop a vibrant, efficient and competitive market for network DM services, particularly in the context of the rapid development of decentralised energy technologies. To this end, network businesses should be encouraged by the DM Incentive Scheme to procure network DM services from a range of DM service providers.
Decentralised energy resources that provide DM services to network businesses are also likely to be able to provide DM services, now or in the future, to other parts of the electricity market, such as:
• to the market operator as ancillary services, and • to retailers and pool price-exposed customers as a hedge against high price events.
It is therefore important that contractual arrangements for providing DM services to network businesses do not preclude the business from providing these services to other parties, as some anecdotal evidence suggests may have occurred.
It should also be noted that accounting for and including net market benefits in a DM Incentive Scheme in no way reduces the availability of these benefits to other market participants, for two reasons. Firstly, the benefits considered above (value of transmission, generation and storage capacity, option value and value of avoided carbon emissions) are generally unavailable to other parties at present. Secondly, even if this were not the case, an allowance for the net market benefits included in a DM Incentive Scheme would be funded by all network customers, rather than by those seeking to access these other net market benefits.
41 See Section 4.1, Australian Electricity Regulator, Consultation paper: Demand management incentive scheme and innovation allowance mechanism, (Jan 2017) 42 Australian Electricity Regulator, Ring-fencing Guideline, Electricity Distribution, (Nov 2016), https://www.aer.gov.au/system/files/AER%20Ring-fencing%20Guideline%20-%2030%20November%202016.pdf
Demand Management Incentives Review June 2017 29
INSTITUTE FOR SUSTAINABLE FUTURES
5 DM INNOVATION ALLOWANCE It was outside the scope of this DM Incentives Review to address the DM Innovation Allowance. However, ISF offers the following brief comments on the DM Innovation Allowance as they are also relevant to issue of the DM Incentive Scheme.
ISF supports the AER in its conclusion that the existing Innovation Allowance “has not been effective in encouraging an efficient level of demand management activity”. ISF strongly supports providing funding for innovative DM projects and research through mechanisms like a DM Innovation Allowance. If DM is delivered by a performance-based DM Incentive Payment (focused on a metric of dollars per kilowatt (or per kilovolt amp) of peak demand reduction per year), it may be desirable to expand the role of the DM Innovation Allowance to support delivery of other important but less easily quantified non-peak demand related benefits of DM. These may include benefits related to voltage management, power factor management and non-peak related reliability. Of course, if a cost-related DM Cost Uplift is applied instead, then this argument does not apply.
In any case, the DM Innovation Allowance must be applied in a constructive and effective manner. Indeed, it is plausible that to date, the current DM Innovation Allowance has actually been counterproductive to the development of DM by:
• potentially signalling to network businesses and others that the AER regards DM as small-scale, immature and uncommercial;
• distracting network businesses and the AER from less “innovative” but more cost-effective opportunities for DM;
• confining funding of network DM research to network businesses only.
As outlined by the AER, competition is a key driver of innovation. The DM Innovation Allowance may be more successful if the funding is more open to competitive bids. One option to achieve this would be if the DM Innovation Allowance funds from network businesses were to be pooled and made available on a competitive basis, including among network businesses.
ISF recommends that the AER draw on the following lessons from its experience of the DM Incentive Allowance, when developing a DM Incentive Scheme:
• DM needs to be treated as a serious resource for assisting the network business to provide services to their customers.
• Available expenditure and cost recovery for network DM needs to be commensurate with the scale of the opportunity.
• Transparent, consistent and effective measurement, verification and reporting of performance is crucial. This monitoring needs to be focused on maximising benefits for consumers. Reporting structures should be in place to ensure that future projects deliver efficient and cost-effective DM initiatives, and facilitate knowledge sharing.
Demand Management Incentives Review June 2017 30

INSTITUTE FOR SUSTAINABLE FUTURES
6 TRANSITIONAL DM MEASURES
6.1 The rationale for transitional measures The DM Incentive Scheme is intended to be introduced in the next network regulatory period in each NEM jurisdiction. This means the new DM Incentive Scheme will be introduced as follows:
DM Incentive Scheme commencement date Jurisdiction
July 2019 NSW, ACT, NT
July 2020 SA, Queensland, Tasmania
Jan 2021 Victoria
This means that there is still a period of between two and four years (including up to four summer peak periods) before the new DM Incentive Scheme is fully implemented. Meanwhile, recent events have highlighted the urgency of increasing the provision of load reduction and flexible capacity that DM can provide. These recent developments include:
• the South Australian statewide blackout in September 2016 and the smaller blackout of 90,000 customers in February 2017
• the subsequent South Australian electricity reform package announced by Premier Weatherill in March 2017
• the “near miss” high peak demand day in March 2017 where NSW narrowly averted a blackout by relying on a range of resources, including emergency DM in the form of large-scale interruptible supply contract at Tomago aluminium smelter and public appeals for consumers to moderate demand
• the closure of eight coal fired power stations across the NEM, plus the closure of the 2000MW Hazelwood power station in Victoria
• a suite of warnings of possible generation capacity shortfalls, including by AEMO • the rapid growth in both small-scale and large-scale variable-output renewable energy
capacity being developed in the NEM, particularly driven by the Renewable Energy Target.
Given these trends, there is a strong value and reliability imperative for complementary interim DM mechanisms to be established to avoid lost opportunities between now and 2021. Some jurisdictions have recognised the importance of accelerating the development of DM in this context.
For example, the NSW Government has indicated its intention to “jump start the demand management market in NSW” in its Climate Change Fund Draft Strategic Plan, as set out below:
Reduce peak demand through battery storage and other demand management measures
The NSW Government will support a strong demand management market to reduce infrastructure costs and greenhouse gas emissions.
Potential actions include:
Demand Management Incentives Review June 2017 31
INSTITUTE FOR SUSTAINABLE FUTURES
» engage with the COAG Energy Council to reform the National Electricity Rules to reduce barriers to broad-based demand management
» advocate to the Australian Energy Regulator for greater implementation of demand management by network businesses
» jump start the demand management market during the current regulatory cycle with reverse auctions to reduce peak demand through technologies such as appliance demand response and battery storage
» work with network businesses and energy efficiency service providers to coordinate information required to target energy savings at grid constrained areas.43
Similarly, the Victorian Government has committed to “work with the Community and industry to develop a Victorian energy demand management framework”. In writing to the Chair of the AER, the Victorian Minister for Energy and Resources, Hon. Lily D’Ambrosio MP, indicated,
As the only jurisdiction to have undertaken a rollout of smart meters, Victoria is in a unique position to deploy a range of technologies and services to manage electricity demand. This framework will identify measures to assist households and small businesses to manage their demand more effectively, particularly in peak periods. This will be developed to complement national schemes, such as the Demand Management Incentive Scheme, which is scheduled to apply in Victoria from 2021.44
In developing such interim DM incentive mechanisms, there are several key principles that should be observed. These include:
1. Maximise benefits to customers, both in terms of supporting electricity supply reliability and the value of savings.
2. Support least cost outcomes, in the mix of decentralised energy resources and network resources deployed, in seeking efficient resource delivery, and in the scale of activity supported.
3. Avoid lost opportunities that may otherwise arise due to the delay in the implementation of the DM Incentive Scheme,
4. Seek to maximise the consistency and complementarity between the interim DM measures and the new DM Incentive Scheme, both in relation the type of DM supported and in the pace that it is developed.
5. Support capacity building within the network businesses and the decentralised energy/DM product and service suppliers, in order to facilitate a smooth and rapid transition to the DM Incentive Scheme.
As the costs of such interim DM measures are unlikely to be funded via cost recovery from the network business prior to the next regulatory periods, other sources of funding and cost recovery will be required. The most obvious source of such funding is from state government budget funding. While general government budget funding is often scarce, this is the source that has been proposed for the NSW Climate Change Fund (via the Climate Change Levy on energy consumers), the South Australian Energy Plan and the “Snowy 2.0” pumped hydro storage facility, so there are strong precedents for such an approach.
43 NSW Government, Climate Change Fund Draft Strategic Plan (Nov 2016) http://www.environment.nsw.gov.au/resources/climatechange/Environmentalfuturefundingpackage/draft-climate-change-fund-strategic-plan-160438.pdf 44 Victorian Minister for Energy and Resources, Hon Lily D’Ambrosio, Letter to Paula Conboy , Chair of the Australian Energy Regulator, 21 December 2015 https://www.aer.gov.au/system/files/Victorian%20Energy%20Minister%20-%20Distribution%20network%20pricing%20arrangements%20-%2021%20December%202015.pdf
Demand Management Incentives Review June 2017 32

INSTITUTE FOR SUSTAINABLE FUTURES
Given the underdeveloped state of the DM market in Australia at present, it is appropriate that funding should start at a modest level and be gradually increased in line with development of the market. There is also merit in using a competitive procurement process in order to maximise the cost effectiveness in selecting projects. Combining these two principles of moderate initial scale and competitive procurement, a reverse auction as proposed by the NSW Government’s Climate Change Fund Draft Strategic Plan may be an appropriate approach.45
The use of reverse auctions or similar competitive processes for procuring DM is quite common. Indeed, the RIT-D process requires such a competitive request for proposal process, including for DM services, as a precondition for approval of network augmentation projects greater than $5 million in value. The NSW Energy Savings Fund held two large successful reverse auctions for DM projects in 2005 and 2006. (See “useful precedents” below.)
ARENA and AEMO are also currently collaborating in a similar competitive process to procure Demand Response through the AEMO’s Reliability and Emergency Reserve Trader (RERT) facility.
To conduct a successful reverse auction a number of key elements are required. Several of these elements are discussed below.
6.2 Clearly defined deliverables It is recommended that DM services requested by the reverse auction be defined primarily in terms of the volume of kilowatts (or kilovolt amps) of peak demand reduction per year. Accordingly, the cost-effectiveness measure should be defined primarily in terms of dollars of funding requested per of kilowatt (or kilovolt amp) of peak demand reduction per year. This would still be workable even if the AER adopted a cost-based DM Cost Uplift.
As discussed in Section 3.3, while this kilowatt of peak demand reduction per year metric does not capture all possible value of DM services, such as voltage and power factor management and non-peak demand related reliability, it is the most uniform and practical metric for comparative purposes. Other relevant metrics include the value of network savings, the value of customer bill reductions and the quantity of energy saved (MWh) or carbon emissions avoided. However, value estimates involve a range of variables that are harder to measure and compare.
The quantity of energy measure saved would likely overlap with existing energy efficiency incentives schemes like the Victorian Energy Efficiency Target and the NSW and ACT Energy Savings Scheme. The carbon emissions measure may overlap with the Commonwealth Emissions Reduction Fund.
6.3 Targetting and exclusions Given the limited scale of the transitional DM incentives, governments may choose to target those areas of DM that are considered to have the greatest need, value or potential. For example, there may be merit in targeting residential air conditioning load control, and pre-cooling, as an area of focus, given residential air conditioning is the biggest driver of peak demand and is a major prospective area of new energy management technology development for DM. Alternatively, the transitional DM incentives may seek to achieve a balance of residential, commercial and industrial
45 Unlike a normal auction that involves multiple buyers competing to bid the highest market clearing price level, a reverse auction involves multiple providers competing to bid to the lowest market clearing price level to provide a defined service, in this case a given level of DM.
Demand Management Incentives Review June 2017 33
INSTITUTE FOR SUSTAINABLE FUTURES
DM. The transitional DM incentives could also be targeted to achieve other objectives, such as innovation, equity, reliability and security.
Conversely, the transitional DM incentives may deliberately seek to exclude certain types of DM on the grounds that they are either already relatively well developed or risk double counting, or “free riders”. For example, transitional DM incentives could exclude DM that is already in place or under contract, or whole categories for which it is hard to identify and exclude such free riders, such as large-scale industrial interruptible load. The transitional DM incentives may also wish to avoid technologies that are already well supported through other government programs, such as battery storage, or technologies that may be considered as having adverse environmental impacts such as diesel generation in densely populated areas.
The above targeting or exclusions are illustrative and are not necessarily recommended, but are presented here as possible considerations in developing transitional DM incentives.
6.4 Available or dispatched capacity? Many DM resources, particularly interruptible load or “demand response”, are only called on to be used or “dispatched” in circumstances of supply constraint. This is an efficient use of the resources as there is usually a significant cost and/or inconvenience for electricity customers in dispatching these resources. So in general, it is appropriate that such resources should be paid separately for their availability and for their dispatch. However, for the purposes of a government funded program to develop the DM market and build confidence, there is likely to be merit in requiring that all resources supported by the incentives should be dispatched in earnest at least once per year.
6.5 Clearly defined scale and budget Transitional DM incentives will be subject to budget constraints, particularly if resourced by general government funding. Such budget constraints will need to be carefully managed. The budget will also need to be matched to the scale of the policy objective. If the primary intent is to develop the DER/DM market to a level at which it can smoothly transition to a full DM Incentive Scheme, then the scale of the transitional DM incentives will need to ramped up to achieve this.
To illustrate the scale of funding that may be appropriate, let us assume that DM Incentive Scheme aims to achieve, by about the end of the next regulatory periods, a level comparable to the current average level of DM in the USA – roughly 9% of peak demand. This would entail an NEM-wide target of about 3000 MWpeak of DM capacity by about 2025.46 Let us further assume that the transitional DM incentives aim to achieve just 10 per cent of this level by 2020. This would imply a target of 300 MWpeak of DM capacity by 2020. Assuming a DM incentive cost of $75/kWp per year (in the middle of our recommended range of $50–100 /kWp per year – see Section 3), and a conservative average life of DM measures of three years, this would amount to an annual incentive cost of about $22.5 million per annum between 2018 and 2020. Administration and direct market development costs would be in addition to this.
46 This is a relatively modest target compared to the roughly 6000MW of new renewable energy capacity to be built in Australia by 2020 in order to meet the Renewable Energy Target, according to the Clean Energy Council, https://www.cleanenergycouncil.org.au/policy-advocacy/renewable-energy-target.html . It should also be borne in mind that the higher is the level of variable output renewable energy capacity, then the higher is the potential need for flexible DM to complement this capacity.
Demand Management Incentives Review June 2017 34
INSTITUTE FOR SUSTAINABLE FUTURES
6.6 Relevant precedents While it is beyond the scope of this study to review DM programs in detail, the following programs provide useful precedents and illustrate the capacity for Australian governments and utilities to run successful cost-effective DM programs.
Victorian Demand Management Action Plan
The ground-breaking Victorian Demand Management Action Plan was established in 1990 by the State Electricity Commission of Victoria to investigate strategies to moderate the demand for electricity. At the time, this was by far the largest and most comprehensive DM program undertaken in Australia to date. The Demand Management Action Plan identified and demonstrated many cost-effective measures for consumers to save energy. Between 1990 and 1993, $27.5 million was expended, delivering an estimated net economic benefit of $44.5 million.47
Queensland Energy Conservation and Demand Management Program
In 2009, the Queensland Government committed $44.7 million in budget funds to the Queensland Energy Conservation and Demand Management Program. This program was implemented in collaboration with the two Queensland distribution network businesses, Energex and Ergon Energy and aimed to reduce peak demand by 40 MW, and deliver an expected saving of $120 million in transmission, distribution and generation infrastructure.48 This program and its legacy are largely responsible for Queensland distribution network businesses currently being widely regarded as the leaders in network DM in Australia.
NSW Energy Savings Fund
The NSW Energy Savings Fund was established in 2005 to provide $40 million per annum over five years49 in incentives to “encourage innovative and practical investment in measures such as energy efficiency, peak load management and localised generation”.50 In its first two years of operation, $29 million was allocated, delivering estimated savings of 189,000 MWh per annum at a cost of $15 per MWh, and 46,560 kW per annum of demand reduction at an estimated cost of $61/kW per annum.51,52 This is a relatively low cost for demand reduction, particularly given that peak demand reduction was not the primary focus for the Energy Savings Fund.
47 Electricity Services Victoria, Demand Management Action Plan, Final Report, Book 1, September 1994 48 Queensland Department of Employment, Economic Development and Innovation, Queensland Energy Management
Plan, May 2011, www.environment.nsw.gov.au/resources/grants/08626_ccfannualreport.pdf 49 Sydney Morning Herald, NSW Government to Promote Energy, Water Saving, 5 April 2005 http://www.smh.com.au/news/Business/NSW-govt-to-promote-energy-water-savings/2005/04/05/1112489481575.html 50 NSW Government, Energy Savings Fund, guide for applicants, Round one , September 2015 51 Assuming the same 10 year average life for demand reductions implied by the cost of energy savings. 52 NSW Department of Environment and Climate Change, NSW Climate Change Fund, Annual Report 2007-2008, Dec 2008
http://www.environment.nsw.gov.au/resources/grants/08626_ccfannualreport.pdf
Demand Management Incentives Review June 2017 35

INSTITUTE FOR SUSTAINABLE FUTURES
APPENDICES
Demand Management Incentives Review June 2017 36
INSTITUTE FOR SUSTAINABLE FUTURES
APPENDIX A: DMIR STUDY SCOPE
Introduction
In future, network businesses will need to ensure an efficient balance between centralised and decentralised energy resources, and between network and non-network options, including demand management (DM). In principle, network businesses are already required to ensure a balanced approach to network investment and DM through their “demand side engagement strategies” and in particular, through their Regulatory Investment Test (RIT) process. However, the extent to which network businesses undertake DM and directly support DER is variable and depends in part on ring-fencing provisions. In any case, network businesses are a pivotal party in expanding the focus of electricity sector investment to include DER alternatives via DM.
It is therefore essential that network businesses are offered fair and balanced incentives when making their procurement decisions. If regulatory incentives are efficient, the business should achieve higher net profit, if they undertake measures that deliver higher net benefits to their customers. However, if regulatory incentives are inefficient and biased, a network business may achieve a lower net profit from a DM (opex) solution that delivers a higher net benefit for customers (or vice versa).
Thus, the DM Incentives Review was designed to test the following hypothesis.
STUDY HYPOTHESIS
In a situation where a network business faces a network constraint with two equally reliable solutions – a network (capex) and a DM (opex) solution – the current regulatory incentives will allow the network business to achieve a higher net profit from the capex solution, even in the case that the opex solution delivers lower cost and/or higher net benefit for customers.
The DM Incentives Review investigated the following research questions in order to test the hypothesis:
• Are current network regulatory incentives for DM fit for purpose to deliver least cost, reliable outcomes for electricity consumers?
• If not, how should these regulatory incentives change? • How should network businesses compare DER with network options to maximise overall
value for electricity consumers?
The DM Incentives Review concept was developed through ARENA’s A-Lab ‘incubation’ process. The co-design team included: ARENA, A-Lab facilitators; the University of Technology Sydney’s Institute for Sustainable Futures (ISF); Energy Networks Australia (ENA); two network core partners; three DER providers; and other consultants. The outcome of the process is the structure outlined in Figure 14 below.
Demand Management Incentives Review June 2017 37
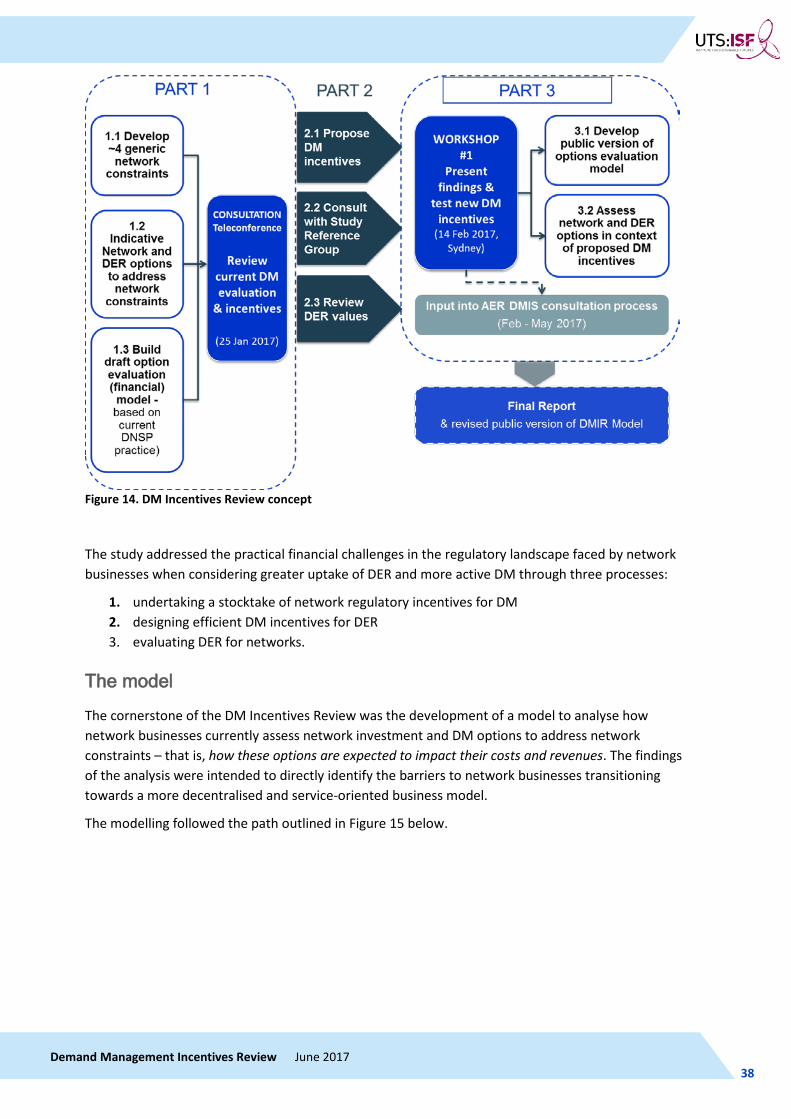
INSTITUTE FOR SUSTAINABLE FUTURES
Figure 14. DM Incentives Review concept
The study addressed the practical financial challenges in the regulatory landscape faced by network businesses when considering greater uptake of DER and more active DM through three processes:
1. undertaking a stocktake of network regulatory incentives for DM 2. designing efficient DM incentives for DER 3. evaluating DER for networks.
The model
The cornerstone of the DM Incentives Review was the development of a model to analyse how network businesses currently assess network investment and DM options to address network constraints – that is, how these options are expected to impact their costs and revenues. The findings of the analysis were intended to directly identify the barriers to network businesses transitioning towards a more decentralised and service-oriented business model.
The modelling followed the path outlined in Figure 15 below.
Demand Management Incentives Review June 2017 38

INSTITUTE FOR SUSTAINABLE FUTURES
Figure 15. DM Incentives Review modelling method
The model:
• accounts for capex, opex, debt, equity, depreciation and tax • includes the EBSS, CESS, STPIS and a proposed DM Incentive Scheme53 • accounts for reliability via impacts on Expected Unserved Energy (EUSE) • considers load growth over time • includes estimated values for net market benefits, but does not include these in the cost-
benefit analysis, except where explicitly stated for complementary analysis.
53 EBSS = Efficiency Benefit Sharing Scheme; CESS = Capital Expenditure Sharing Scheme; STPIS = Service Target Performance Incentive Scheme; DMIS = Demand Management Incentive Scheme
1. Develop four hypothetical
network constraints
2. Develop appropriate
network solutions to constraints
3. Collate DER data
4. Develop appropriate
DER/DM solutions to constraints
5. Identify and quantify existing
regulatory incentives
6. Model and analye benefit/cost
of options (NPV discounted)
7. Graph outcomes of modelling
8. Analyse bias and propose
appropriate DMIS
9. Evaluate proposed DMIS to
offset bias
Demand Management Incentives Review June 2017 39
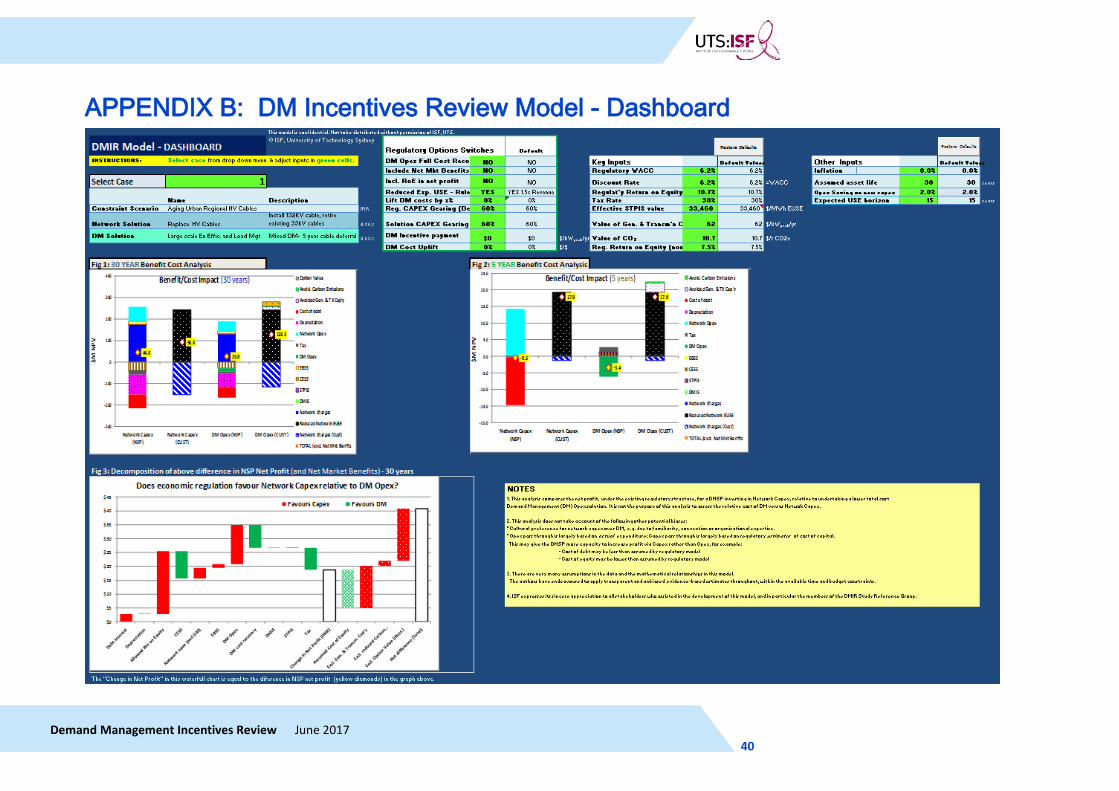
INSTITUTE FOR SUSTAINABLE FUTURES
APPENDIX B: DM Incentives Review Model - Dashboard
Demand Management Incentives Review June 2017 40
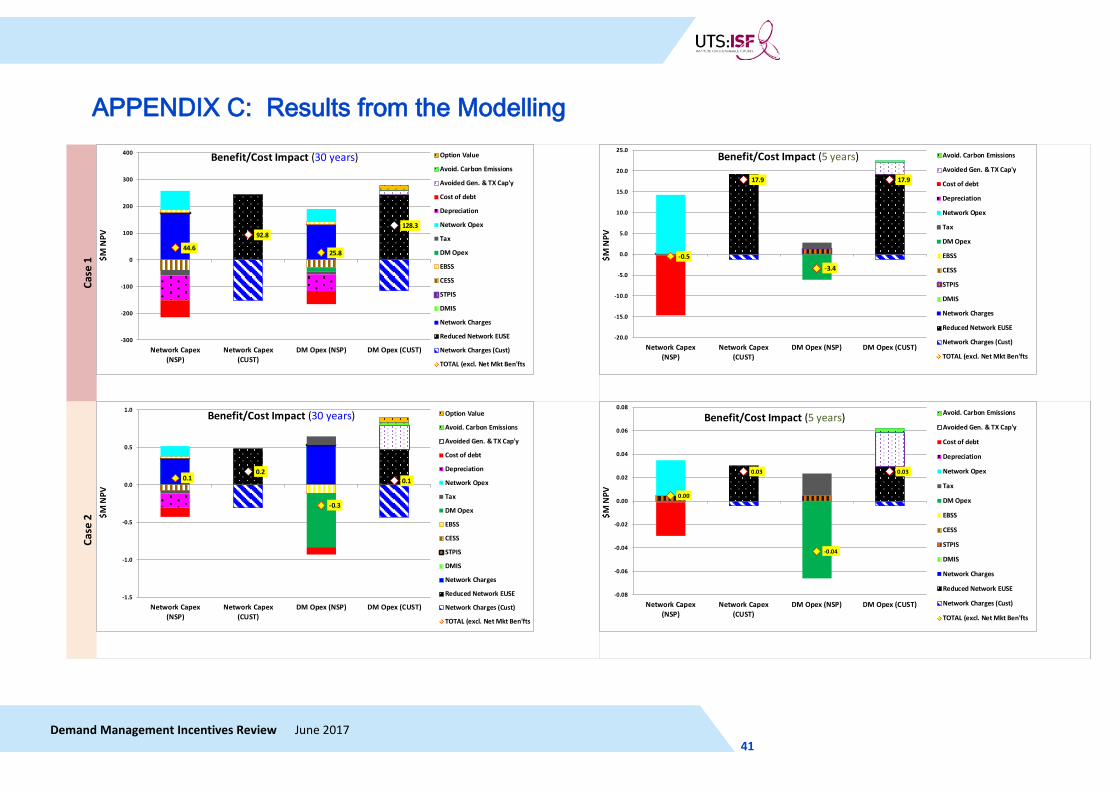
INSTITUTE FOR SUSTAINABLE FUTURES
APPENDIX C: Results from the Modelling
Case
1Ca
se 2
44.6
92.8
25.8
128.3
-300
-200
-100
0
100
200
300
400
Network Capex(NSP)
Network Capex(CUST)
DM Opex (NSP) DM Opex (CUST)
$M N
PV
Benefit/Cost Impact (30 years) Option Value
Avoid. Carbon Emissions
Avoided Gen. & TX Cap'y
Cost of debt
Depreciation
Network Opex
Tax
DM Opex
EBSS
CESS
STPIS
DMIS
Network Charges
Reduced Network EUSE
Network Charges (Cust)
TOTAL (excl. Net Mkt Ben'fts
0.10.2
-0.3
0.1
-1.5
-1.0
-0.5
0.0
0.5
1.0
Network Capex(NSP)
Network Capex(CUST)
DM Opex (NSP) DM Opex (CUST)
$M N
PV
Benefit/Cost Impact (30 years) Option Value
Avoid. Carbon Emissions
Avoided Gen. & TX Cap'y
Cost of debt
Depreciation
Network Opex
Tax
DM Opex
EBSS
CESS
STPIS
DMIS
Network Charges
Reduced Network EUSE
Network Charges (Cust)
TOTAL (excl. Net Mkt Ben'fts
-0.5
17.9
-3.4
17.9
-20.0
-15.0
-10.0
-5.0
0.0
5.0
10.0
15.0
20.0
25.0
Network Capex(NSP)
Network Capex(CUST)
DM Opex (NSP) DM Opex (CUST)
$M N
PV
Benefit/Cost Impact (5 years) Avoid. Carbon Emissions
Avoided Gen. & TX Cap'y
Cost of debt
Depreciation
Network Opex
Tax
DM Opex
EBSS
CESS
STPIS
DMIS
Network Charges
Reduced Network EUSE
Network Charges (Cust)
TOTAL (excl. Net Mkt Ben'fts
0.00
0.03
-0.04
0.03
-0.08
-0.06
-0.04
-0.02
0.00
0.02
0.04
0.06
0.08
Network Capex(NSP)
Network Capex(CUST)
DM Opex (NSP) DM Opex (CUST)$M
NPV
Benefit/Cost Impact (5 years) Avoid. Carbon Emissions
Avoided Gen. & TX Cap'y
Cost of debt
Depreciation
Network Opex
Tax
DM Opex
EBSS
CESS
STPIS
DMIS
Network Charges
Reduced Network EUSE
Network Charges (Cust)
TOTAL (excl. Net Mkt Ben'fts
Demand Management Incentives Review June 2017 41
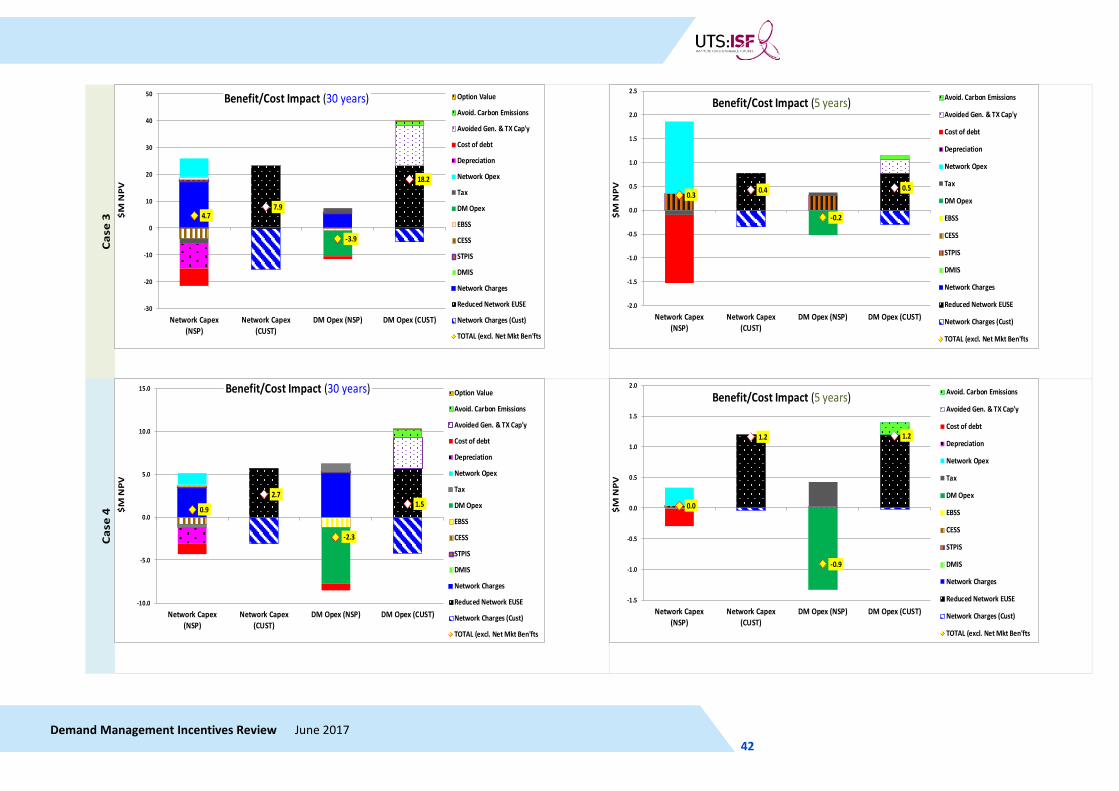
INSTITUTE FOR SUSTAINABLE FUTURES
Case
3Ca
se 4
4.77.9
-3.9
18.2
-30
-20
-10
0
10
20
30
40
50
Network Capex(NSP)
Network Capex(CUST)
DM Opex (NSP) DM Opex (CUST)
$M N
PV
Benefit/Cost Impact (30 years) Option Value
Avoid. Carbon Emissions
Avoided Gen. & TX Cap'y
Cost of debt
Depreciation
Network Opex
Tax
DM Opex
EBSS
CESS
STPIS
DMIS
Network Charges
Reduced Network EUSE
Network Charges (Cust)
TOTAL (excl. Net Mkt Ben'fts
0.9
2.7
-2.3
1.5
-10.0
-5.0
0.0
5.0
10.0
15.0
Network Capex(NSP)
Network Capex(CUST)
DM Opex (NSP) DM Opex (CUST)
$M N
PV
Benefit/Cost Impact (30 years) Option Value
Avoid. Carbon Emissions
Avoided Gen. & TX Cap'y
Cost of debt
Depreciation
Network Opex
Tax
DM Opex
EBSS
CESS
STPIS
DMIS
Network Charges
Reduced Network EUSE
Network Charges (Cust)
TOTAL (excl. Net Mkt Ben'fts
0.3 0.4
-0.2
0.5
-2.0
-1.5
-1.0
-0.5
0.0
0.5
1.0
1.5
2.0
2.5
Network Capex(NSP)
Network Capex(CUST)
DM Opex (NSP) DM Opex (CUST)
$M N
PV
Benefit/Cost Impact (5 years) Avoid. Carbon Emissions
Avoided Gen. & TX Cap'y
Cost of debt
Depreciation
Network Opex
Tax
DM Opex
EBSS
CESS
STPIS
DMIS
Network Charges
Reduced Network EUSE
Network Charges (Cust)
TOTAL (excl. Net Mkt Ben'fts
0.0
1.2
-0.9
1.2
-1.5
-1.0
-0.5
0.0
0.5
1.0
1.5
2.0
Network Capex(NSP)
Network Capex(CUST)
DM Opex (NSP) DM Opex (CUST)$M
NPV
Benefit/Cost Impact (5 years) Avoid. Carbon Emissions
Avoided Gen. & TX Cap'y
Cost of debt
Depreciation
Network Opex
Tax
DM Opex
EBSS
CESS
STPIS
DMIS
Network Charges
Reduced Network EUSE
Network Charges (Cust)
TOTAL (excl. Net Mkt Ben'fts
Demand Management Incentives Review June 2017 42

INSTITUTE FOR SUSTAINABLE FUTURES
Sensitivity and break-even analysis for DMIP
Case 1: 30 year modelling results Network solution DM solution Impact of DM
DM full cost
recovery?
DMIP value
($/kWp/yr)
DNB net profit ($m)
DNB return on
equity
Customers net benefit
($m)
DNB net profit ($m)
DNB return on
equity
Customers net benefit
($m)
No DMIP (without full DM Cost recovery) No 0 44.56 4.86% 92.8 25.84 4.7%
128.3 (+35.9 NMB)
Customers large gain, DNB loses
Equalise DNB net profit No 83 44.56 4.86% 92.8 44.56 5.1% 107.9 Customers gain,
DNB neutral (excl. RoE)
Equalise DNB return on equity No 44 44.56 4.86% 92.8 35.71 4.86% 117.5 Customers gain,
DNB neutral (RoE)
Equalise cust. net benefit (excl. NMB) No 145 44.56 4.86% 92.8 58.50 5.4% 92.8
Customers neutral (excl. NMB), DNB gain
Equalise cust. net benefit (incl. NMB) No 292 44.56 4.86% 92.8 91.47 6.1%
57.0 (+35.9 NMB)
Customers neutral (incl. NMB), DNB large gain
No DMIP (with full DM Cost recovery) Yes 0 44.56 4.86% 92.8 31.52 4.8%
122.3 (+35.9 NMB)
Customers gain, DNB loses
Equalise DNB net profit Yes 58 44.56 4.86% 92.8 44.56 5.1% 108.2 Customers gain,
DNB neutral (excl. RoE)
Equalise DNB return on equity Yes 14 44.56 4.86% 92.8 34.67 4.86% 118.9
Customers gain, DNB neutral (RoE)
Equalise cust. net benefit (excl. NMB) Yes 121 44.56 4.86% 92.8 58.71 5.4% 92.8
Customers neutral (excl. NMB), DNB gain
Equalise cust. net benefit (incl. NMB) Yes 267 44.56 4.86% 92.8 91.67 6.2%
57.0 (+35.9 NMB)
Customers neutral (incl. NMB), DNB large gain)
DMIP = Demand Management Incentive Payment DNB = Network Service Provider NMB = Net market benefits RoE = Return on Equity
Demand Management Incentives Review June 2017 43
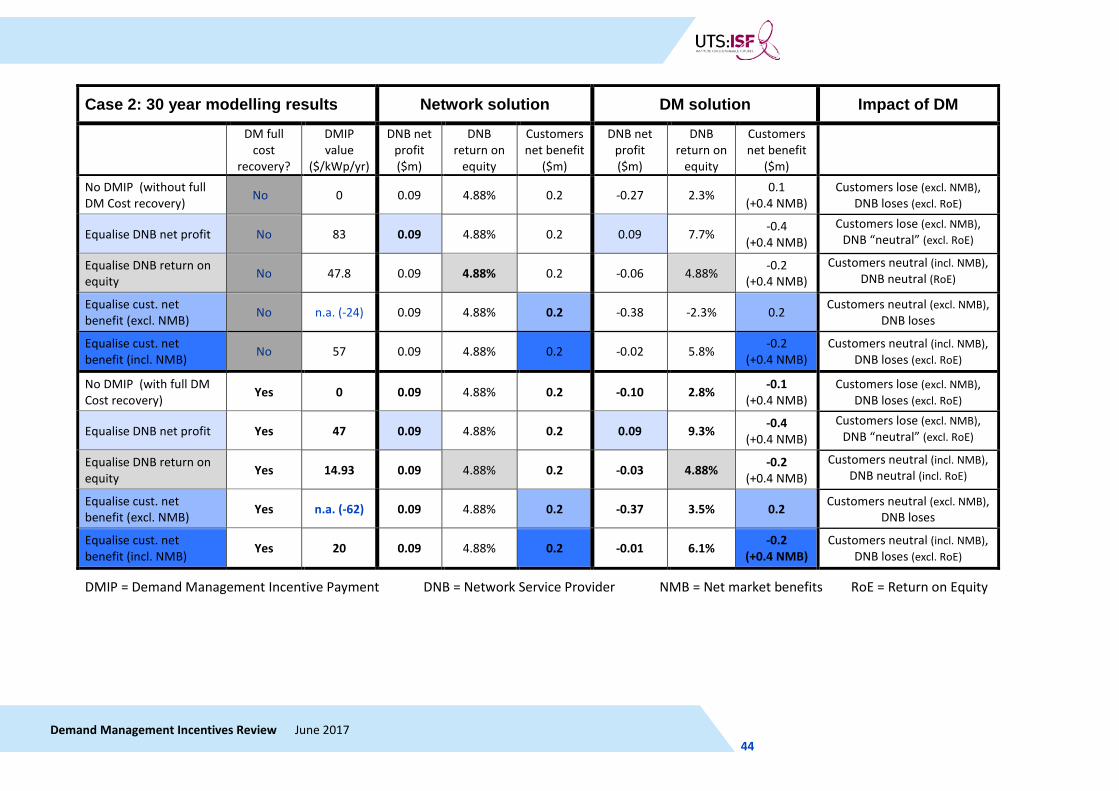
INSTITUTE FOR SUSTAINABLE FUTURES
Case 2: 30 year modelling results Network solution DM solution Impact of DM
DM full cost
recovery?
DMIP value
($/kWp/yr)
DNB net profit ($m)
DNB return on
equity
Customers net benefit
($m)
DNB net profit ($m)
DNB return on
equity
Customers net benefit
($m)
No DMIP (without full DM Cost recovery) No 0 0.09 4.88% 0.2 -0.27 2.3% 0.1
(+0.4 NMB) Customers lose (excl. NMB),
DNB loses (excl. RoE)
Equalise DNB net profit No 83 0.09 4.88% 0.2 0.09 7.7% -0.4 (+0.4 NMB)
Customers lose (excl. NMB), DNB “neutral” (excl. RoE)
Equalise DNB return on equity No 47.8 0.09 4.88% 0.2 -0.06 4.88% -0.2
(+0.4 NMB) Customers neutral (incl. NMB),
DNB neutral (RoE)
Equalise cust. net benefit (excl. NMB) No n.a. (-24) 0.09 4.88% 0.2 -0.38 -2.3% 0.2 Customers neutral (excl. NMB),
DNB loses
Equalise cust. net benefit (incl. NMB) No 57 0.09 4.88% 0.2 -0.02 5.8% -0.2
(+0.4 NMB) Customers neutral (incl. NMB),
DNB loses (excl. RoE)
No DMIP (with full DM Cost recovery) Yes 0 0.09 4.88% 0.2 -0.10 2.8% -0.1
(+0.4 NMB) Customers lose (excl. NMB),
DNB loses (excl. RoE)
Equalise DNB net profit Yes 47 0.09 4.88% 0.2 0.09 9.3% -0.4 (+0.4 NMB)
Customers lose (excl. NMB), DNB “neutral” (excl. RoE)
Equalise DNB return on equity Yes 14.93 0.09 4.88% 0.2 -0.03 4.88% -0.2
(+0.4 NMB) Customers neutral (incl. NMB),
DNB neutral (incl. RoE)
Equalise cust. net benefit (excl. NMB) Yes n.a. (-62) 0.09 4.88% 0.2 -0.37 3.5% 0.2 Customers neutral (excl. NMB),
DNB loses
Equalise cust. net benefit (incl. NMB) Yes 20 0.09 4.88% 0.2 -0.01 6.1% -0.2
(+0.4 NMB) Customers neutral (incl. NMB),
DNB loses (excl. RoE)
DMIP = Demand Management Incentive Payment DNB = Network Service Provider NMB = Net market benefits RoE = Return on Equity
Demand Management Incentives Review June 2017 44
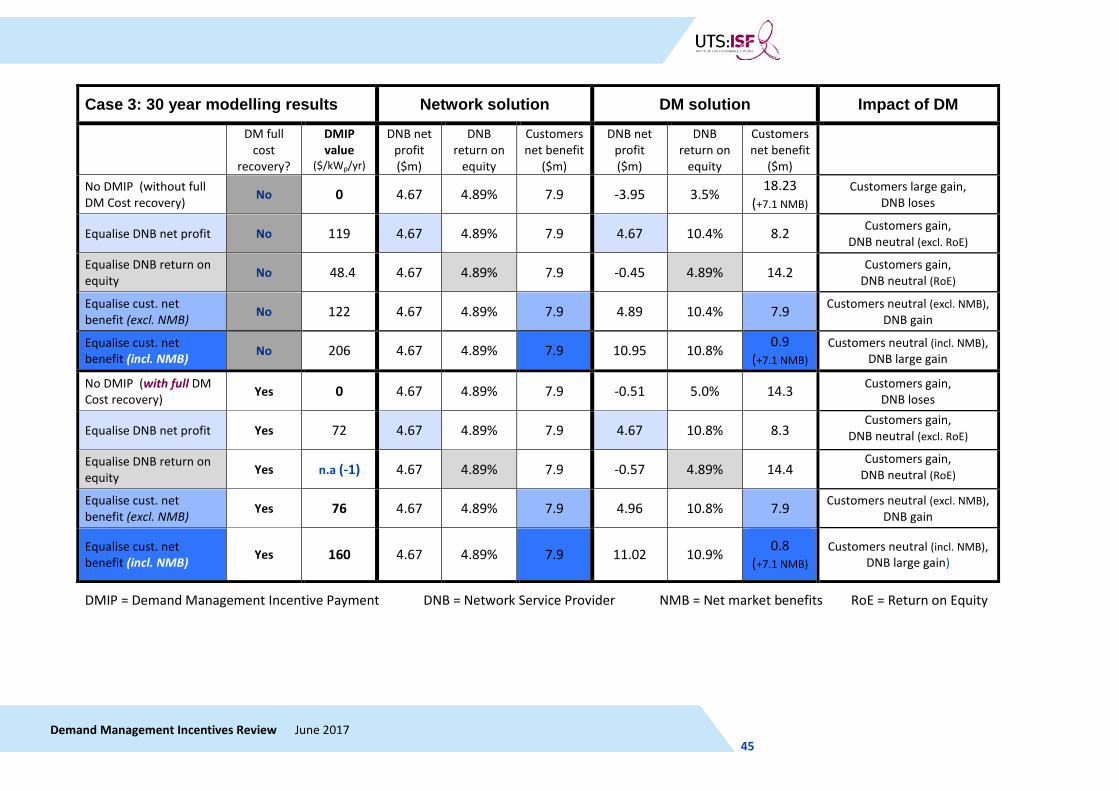
INSTITUTE FOR SUSTAINABLE FUTURES
Case 3: 30 year modelling results Network solution DM solution Impact of DM
DM full cost
recovery?
DMIP value
($/kWp/yr)
DNB net profit ($m)
DNB return on
equity
Customers net benefit
($m)
DNB net profit ($m)
DNB return on
equity
Customers net benefit
($m) No DMIP (without full DM Cost recovery) No 0 4.67 4.89% 7.9 -3.95 3.5%
18.23 (+7.1 NMB)
Customers large gain, DNB loses
Equalise DNB net profit No 119 4.67 4.89% 7.9 4.67 10.4% 8.2 Customers gain,
DNB neutral (excl. RoE)
Equalise DNB return on equity No 48.4 4.67 4.89% 7.9 -0.45 4.89% 14.2
Customers gain, DNB neutral (RoE)
Equalise cust. net benefit (excl. NMB) No 122 4.67 4.89% 7.9 4.89 10.4% 7.9
Customers neutral (excl. NMB), DNB gain
Equalise cust. net benefit (incl. NMB) No 206 4.67 4.89% 7.9 10.95 10.8%
0.9 (+7.1 NMB)
Customers neutral (incl. NMB), DNB large gain
No DMIP (with full DM Cost recovery) Yes 0 4.67 4.89% 7.9 -0.51 5.0% 14.3 Customers gain,
DNB loses
Equalise DNB net profit Yes 72 4.67 4.89% 7.9 4.67 10.8% 8.3 Customers gain,
DNB neutral (excl. RoE)
Equalise DNB return on equity Yes n.a (-1) 4.67 4.89% 7.9 -0.57 4.89% 14.4
Customers gain, DNB neutral (RoE)
Equalise cust. net benefit (excl. NMB) Yes 76 4.67 4.89% 7.9 4.96 10.8% 7.9
Customers neutral (excl. NMB), DNB gain
Equalise cust. net benefit (incl. NMB) Yes 160 4.67 4.89% 7.9 11.02 10.9%
0.8 (+7.1 NMB)
Customers neutral (incl. NMB), DNB large gain)
DMIP = Demand Management Incentive Payment DNB = Network Service Provider NMB = Net market benefits RoE = Return on Equity
Demand Management Incentives Review June 2017 45
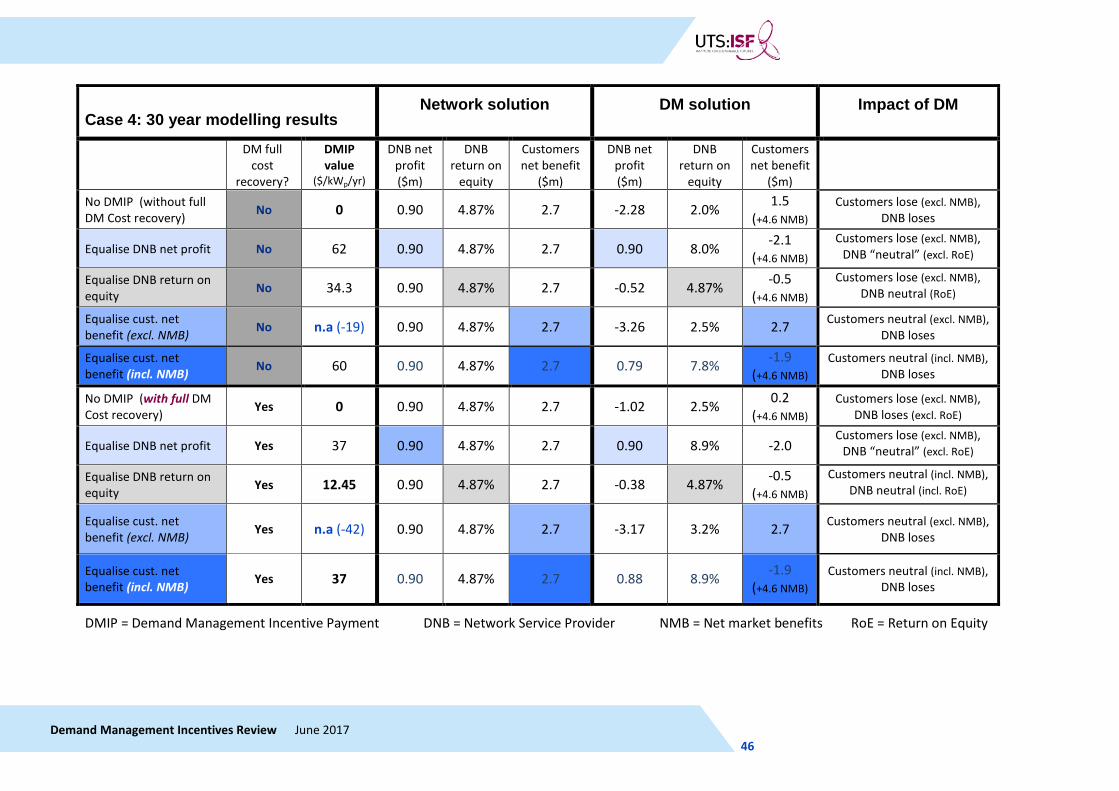
INSTITUTE FOR SUSTAINABLE FUTURES
Case 4: 30 year modelling results
Network solution DM solution Impact of DM
DM full cost
recovery?
DMIP value
($/kWp/yr)
DNB net profit ($m)
DNB return on
equity
Customers net benefit
($m)
DNB net profit ($m)
DNB return on
equity
Customers net benefit
($m) No DMIP (without full DM Cost recovery) No 0 0.90 4.87% 2.7 -2.28 2.0%
1.5 (+4.6 NMB)
Customers lose (excl. NMB), DNB loses
Equalise DNB net profit No 62 0.90 4.87% 2.7 0.90 8.0% -2.1
(+4.6 NMB) Customers lose (excl. NMB),
DNB “neutral” (excl. RoE)
Equalise DNB return on equity No 34.3 0.90 4.87% 2.7 -0.52 4.87% -0.5
(+4.6 NMB) Customers lose (excl. NMB),
DNB neutral (RoE)
Equalise cust. net benefit (excl. NMB) No n.a (-19) 0.90 4.87% 2.7 -3.26 2.5% 2.7
Customers neutral (excl. NMB), DNB loses
Equalise cust. net benefit (incl. NMB) No 60 0.90 4.87% 2.7 0.79 7.8%
-1.9 (+4.6 NMB)
Customers neutral (incl. NMB), DNB loses
No DMIP (with full DM Cost recovery) Yes 0 0.90 4.87% 2.7 -1.02 2.5%
0.2 (+4.6 NMB)
Customers lose (excl. NMB), DNB loses (excl. RoE)
Equalise DNB net profit Yes 37 0.90 4.87% 2.7 0.90 8.9% -2.0 Customers lose (excl. NMB),
DNB “neutral” (excl. RoE)
Equalise DNB return on equity Yes 12.45 0.90 4.87% 2.7 -0.38 4.87%
-0.5 (+4.6 NMB)
Customers neutral (incl. NMB), DNB neutral (incl. RoE)
Equalise cust. net benefit (excl. NMB) Yes n.a (-42) 0.90 4.87% 2.7 -3.17 3.2% 2.7
Customers neutral (excl. NMB), DNB loses
Equalise cust. net benefit (incl. NMB) Yes 37 0.90 4.87% 2.7 0.88 8.9%
-1.9 (+4.6 NMB)
Customers neutral (incl. NMB), DNB loses
DMIP = Demand Management Incentive Payment DNB = Network Service Provider NMB = Net market benefits RoE = Return on Equity
Demand Management Incentives Review June 2017 46
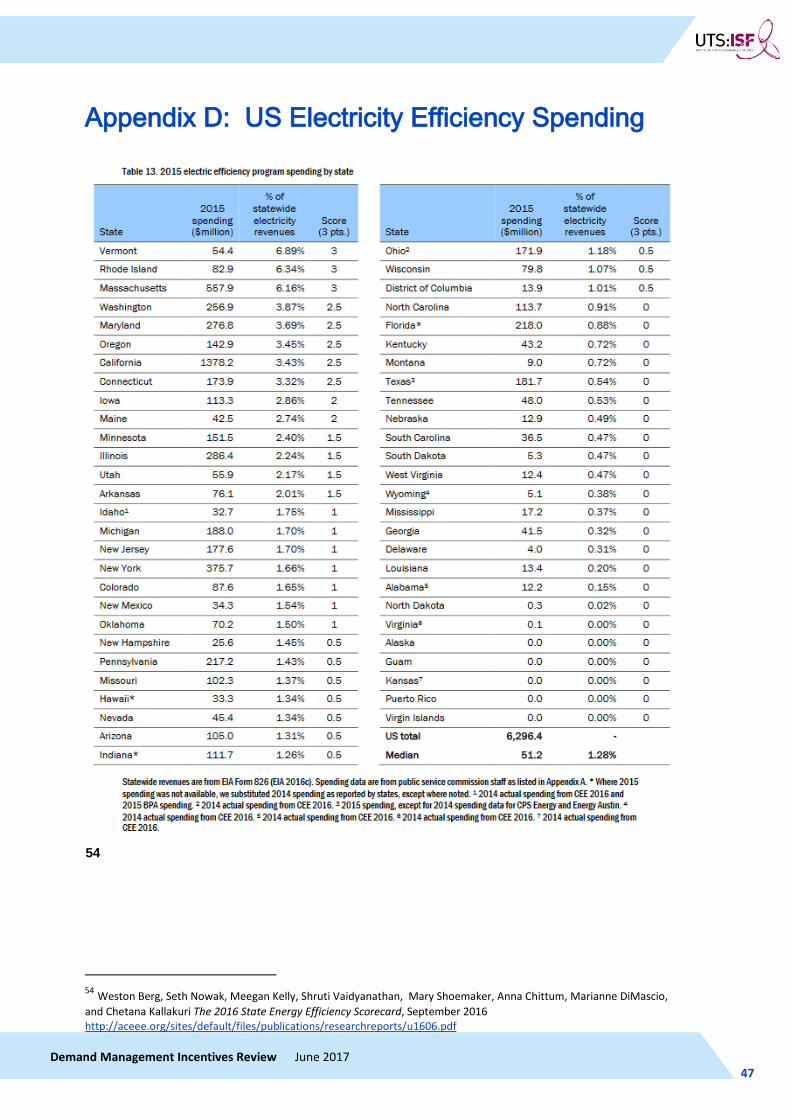
INSTITUTE FOR SUSTAINABLE FUTURES
Appendix D: US Electricity Efficiency Spending
54
54 Weston Berg, Seth Nowak, Meegan Kelly, Shruti Vaidyanathan, Mary Shoemaker, Anna Chittum, Marianne DiMascio, and Chetana Kallakuri The 2016 State Energy Efficiency Scorecard, September 2016 http://aceee.org/sites/default/files/publications/researchreports/u1606.pdf
Demand Management Incentives Review June 2017 47
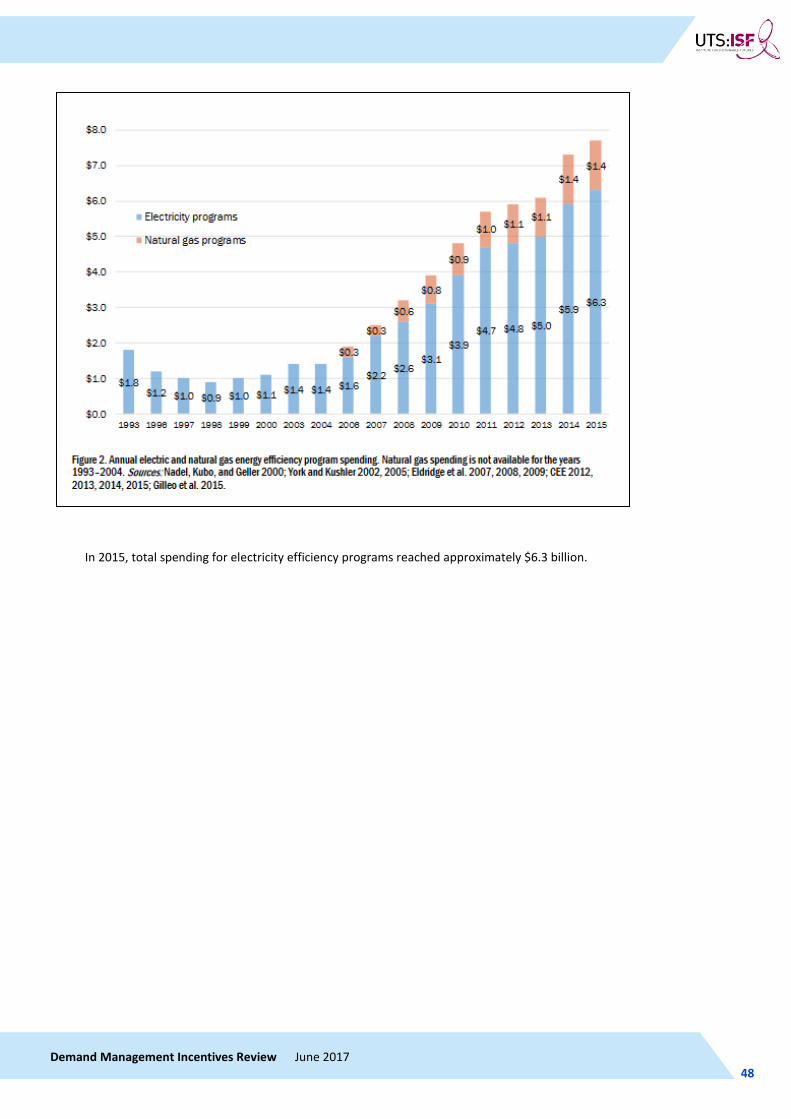
INSTITUTE FOR SUSTAINABLE FUTURES
In 2015, total spending for electricity efficiency programs reached approximately $6.3 billion.
Demand Management Incentives Review June 2017 48
INSTITUTE FOR SUSTAINABLE FUTURES
APPENDIX E: DMIR Study Reference Group Representatives of the following organisations participated in the Study Reference Group (SRG) for this project. .
ActewAGL ARENA Ausgrid
AusNet Services Citipower/Powercor Energy Networks Australia EnerNOC
EnergyQ (Ergon and Energex) GreenSync SA Power Networks Schneider Electric
UTS Institute for Sustainable Futures (ISF) Victorian Department of Energy, Land, Water & Planning (DELWP) Oakley Greenwood (Observer)
The SRG provided very valuable input and feedback to the project team. ISF is very grateful to all those who contributed to the Study Reference Group. However, ISF is solely responsible for the content of this report and it does not necessarily represent the views of any other organisation listed above.
The SRG held three teleconferences between December 2016 and March 2017 and participated in email based dialogue and the broader stakeholders’ consultation, including a half-day face-to-face workshop.
ISF DMIR Project Team:
Chris Dunstan, Dani Alexander, Tom Morris, Ed Langham, Melita Jazbec.
The project team also wishes to thank UTS colleagues who assisted in the project: Paul Brown, Bridget McIntosh, Stuart White, Xavier Mayes, Tui Prichard, Lawrie McIntosh and Jenni Downes.
Demand Management Incentives Review June 2017 49

INSTITUTE FOR SUSTAINABLE FUTURES
Demand Management Incentives Review June 2017 50