Embed Size (px)
Citation preview
Acta Polytechnica Hungarica Vol. 18, No. 8, 2021
– 123 –
Demand Forecasting in Python: Deep Learning
Model Based on LSTM Architecture versus
Statistical Models
Ing. Andrea Kolková, Ph.D., Ing. Miroslav Navrátil
VSB Technical University of Ostrava, Faculty of Economics, Department of
Business Administration, Sokolská třída 33, Ostrava, Czech Republic
[email protected], [email protected]
Abstract: Demand forecasting for business practice is one of the biggest challenges of
current business research. However, the discussion on the use of forecasting methods in
business is still at the beginning. Forecasting methods are becoming more accurate.
Accuracy is often the only criterion for forecasting. In the reality of business practice or
management is also influenced by other factors such as runtime, computing demand, but
also the knowledge of the manager. The goal of this article is to verify the possibilities
demand forecasting using deep learning and statistical methods. Suitable methods are
determined on based multi-criteria evaluation. Accuracy according to MSE and MAE,
runtime and computing demand and knowledge requirements of the manager were chosen
as the criteria. This study used univariate data from an e-commerce entity. It was realized
90-days and 365-days demand forecasting. Statistical methods Seasonal naïve, TBATS,
Facebook Prophet and SARIMA was used. These models will be compared with a deep
learning model based on recurrent neural network with Long short-term memory (LSTM)
layer architecture. The Python code used in all experiments and data is available on
GitHub (https://github.com/mrnavrc/demand_forecasting). The results show that all
selected methods surpassed the benchmark in their accuracy. However, the differences in
the other criteria were large. Models based on deep learning have proven to be the worst
on runtime and computing demand. Therefore, they cannot be recommended for business
practice. As a best practice model has proven Prophet model developed at Facebook.
Keywords: demand forecasting; deep learning model; TBATS; Prophet; SARIMA
1 Introduction and Literature Revue
At present, demand forecasting is gaining prominence in business economics
research. Demand forecasting is now an integral part of corporate management,
both operational and strategic management. Today, companies have to forecast a
number of variables to be successful in the market, whether it is the number of

A. Kolková et al. Demand Forecasting in Python: Deep Learning Model Based on LSTM Architecture versus Statistical Models
– 124 –
passengers for train seat planning [3], air traffic demand [28], electricity demand
[10], demand forecasting in bike-sharing system [31], performing arts [25],
forecasting call centre arrivals [23], LCD monitor market [17], or tourism [1]. The
analysis of sales and demand is now insufficient and correct forecasting is a key
source of information for companies.
This area of business management is also constantly expanding and increasing
demands are being placed on the accuracy of forecasting. In this sense, researchers
around the world have been developing new and expanding existing methods.
Increasing studies are addressing the question whether methods based on machine
learning can overcome the existing statistical models. An important contribution
in this discussion is a study conducted by Makridakis [19], which has pointed out
that machine learning methods cannot itself beat the statistical models in the
accuracy of the forecasting. Another study [25], which focuses on the comparison
of forecastign methods of COVID-19 active cases, also confirms the above-
mentioned results. On the other hand, a study [7] conducted at the University of
Porto concluded that the study presented by Makridakis is biased with low sample
size. Each of the studies used different types of time series for its results.
Statistical methods are still used in business practice, namely, more complex or
simple naïve methods or exponential smoothing. The ARIMA method is an often
used example for forecasting in tourism in [1]. Already in the last century,
statisticians have looked at whether simpler methods are better or worse than more
complex ones [15], and at the beginning of this century, Zellner wrote about the
need for simplicity of models in practice [32]. In 2018, Makridakis reopened this
idea [19]. Time series forecasting is a topic that connects many disciplines [2],
[26]. So far, no research has clearly identified the most appropriate method.
The goal of this article is to verify possibilities demand forecasting using deep-
learnign and statistical methods. This methods will be used for of the company's
90-days and 365-days demand forecasting.
In this work, the naïve method will be used, it will also serve as a benchmark.
Second method used is TBATS based on a study by DeLivera [8]. Another
method used is Prophet, developed in practice by a team of experts from Facebook
[29], and subsequently verified, for example [23]. Next method which will be used
is SARIMAX, which is based on the Box-Jenkins model [6] and is used in
pandemic predictions, for example H1N1 [16]. The last model, which will be
used, is a deep learning model based on recurrent neural network with Long
Short-Term Memory (hereafter only LSTM) layer architecture.
It is also important to mention that the resulting accuracy of the prediction is not
necessarily a sign of the quality and usability of the model, but it is necessary to
look at other factors, such as the computational demand of the prediction or the
financial cost of maintaining such a model in real business operations. Gilliland
[9], for example, states in his published discussion that even possibly increased
accuracy of prediction, when using highly complex machine learning models, may

Acta Polytechnica Hungarica Vol. 18, No. 8, 2021
– 125 –
not have its justification in practical use, due to the above-mentioned factors.
Among other things, this study aims to point out that future forecasting
competitions should include more evaluation criteria and should focus more on
real business usability.
2 Data Description and Methodology
The selected data set is divided into training data set and test data set, in the ratio
2/3: 1/3. As benchmark are used forecasting by the seasonal naïve forecast.
This method are used to evaluate other advanced models.
All forecasts are modelled using Python. Python is being developed as an open
source programming language with a number of other packages. It is an
interpreted general-purpose project. It is often used for data analytics, but is also
used for backend applications. For retrieve data is applied Pandas library, it is
developed by Wes McKinney [20].
Pandas operate with the Numpy package, is is array-processing package and
fundamental tool for Python scientific research. Used stucture is caled data frame,
it can used a table or a two-dimensional array-like structure.
StatsModels and PmdArima (also called PyramidArima) libraries were also used
in this study. Statsmodels was used for statistical tests and statistical data
exploration.
2.1 Data Description
This study uses data from an e-commerce entity. E-shop is focused in the outdoor
supplies for professional athletes. This company organizes outdoor training
courses, seminars and competitions too. A lot of customers are in the B2B.
Individual daily demand form a data set. It is started at 1st September 2014 and
ended 22th August 2020. Data set is geted using Google Analytics. Data set
contains daily data of demand (number of conversions per day). Data is available
at https://github.com/mrnavrc/demand_forecasting. All values was divided with
the secret coefficient for trade secret, leading to a reduction in the size of demand
in absolute terms. Does not change the trend, cycles and parameters necessary for
forecasting. This was confirmed by the decomposition of the data.
This decomposition confirmed the growing demand in the observed months in the
summer months and in the period before Christmas. The cyclical development did
not change throughout the observed period. Historical demand is graphically
shown in Figure 1.

A. Kolková et al. Demand Forecasting in Python: Deep Learning Model Based on LSTM Architecture versus Statistical Models
– 126 –
Figure 1
Demand of e-commerce entity from 1st September 2014 to 22th August 2020
Before forecasting, it is necessary to perform a statistical description and analysis
of missing values and outliers. Missing values do not appear in the selected data
file. There are some outliers. After analysis of the robustness of the selected
models we decided let the outliers in the data set. In the histogram in Figure 2 we
see the distribution of data around its mean value.
Figure 2
Histogram of demand of e-commerce entity
2.2 Applied Methods
The seasonal naïve forecast is based on the idea that the forecast will be equal to
the previous period according to the selected time frame of the forecast. It is
declarated [22]. This method is based on a simple formula (1).
, where (1)
m is the seasonal period and k is the integer part of (h−1)/m (i.e. the number of
complete years in the forecast period prior to time T+h.)

Acta Polytechnica Hungarica Vol. 18, No. 8, 2021
– 127 –
We make a demand forecast for the outdoor equipment, so can be expected a
strong seasonal character. This could mean that this method will be too simple and
less suitable for this data [12].
TBATS is acronym from the other models: Trigonometric seasonality, Box-Cox
transformation, ARMA errors, Trend and Seasonal components [14]. This
designation must be supplemented by appropriate arguments (ϖ, ϕ, p, q, m1,
m2………mT) to define Cox - Box parameters and damping parameters p and q to
express the parameter of ARMA models and seasonal periodicity is expressed by
arguments m1, m2………mT. TBATS for modelling prediction automatically
considers different models Box-Cox transformation. The best accuracy model will
be chosen using Akaike information criterion [22]. The TBATS model is
described by the relation (2).
, where (2)
L is the lag operator, is det(I−F∙L), = w∙adj(I−F∙L) g∙L+det(I−208F∙L),
and are polynomials of length p and q.
For this forecast we need around 298-461 seconds. TBATS is known for its high
computational demand. The model applied grid research and no genetic evolution
to set parameters faster.
Prophet is an open source library designed especially for business data
forecasting. The prophet was developed by Facebook and has already been used in
research [23]. Prophet uses the scikits-learn (SKlearn) library. It´s open-source
library and contains functions for machine learning and statistical modelling. The
model comes from a relationship (3).
, where (3)
is the trend function, is periodic changes, is the effect of the holiday and
is error.
It is possible to import public holidays and other events that affect demand into
the Prophet model.
Based on the decomposition, it was found that this e-shop is significantly affected
by Christmas, so it is included in the model. Other factors influencing the demand
for sporting goods are sporting events such as the championship, Olympics, etc.
The event can also be entered in prophet as an interval, many sporting events have
an impact on demand many days before and after the event.
Model Prophet accuracy is based on a cross-validation function. In the model we
can used accuracy by mean squared error (hereafter onlyMSE), root mean squared

A. Kolková et al. Demand Forecasting in Python: Deep Learning Model Based on LSTM Architecture versus Statistical Models
– 128 –
erron (hereafter only RMSE), mean absolute error (hereafter only MAE), mean
absolute percentage error (hereafter only MAPE) and coverage.
The PmdArima library contains the auto_arima function, which was used to
calculate the SARIMA model. The model is based on arima models according to
the relationship (4).
(4)
Auto_arima work like grid-search. Defines a model in the form SARIMA (p, q, d).
It means, that various sets of p and q (also P and Q for seasonal models)
parameters are tested. The company sets whether it wants to select a model based
on minimizes the Akaike information criterion (hereafter only AIC) or Bayesian
information criterion (hereafter only BIC).
The parameters p and q are selected by the function itself using an automated
iterative procedure. Parameter d must be set according to the stationarity tests,
which are also part of the package. Prophet, for example, offers the augmented
Dickey-Fuller test to test the stationarity and the Canova-Hansen test to test the
seasonality.
This approach model parameters making is very time-consuming. It is better the
stepwise function use. This stepwise function is definated by the strategy provided
by Hyndman and Khandakar [13]. This model is currently considered to be the
best model for step-in training process.
After determining the best model according to auto_arima, the SARIMAX function
is used. This is part of the Statsmodels library. The result of SARIMAX is a
diagnostic overview that can find a mistake or shortcoming in the
semiautomatically approach [22]. After the diagnostic verified, a separate demand
forecasting can be created.
The next model used is Deep Learning. For a deep learning model demand
forecast it is used the Keras library. Keras library is high-level neural network
application programming interface (hereafter only API). This library is created in
Python. Keras supports convolutional networks, recurrent networks and their
combinations too [22].
For demand forecasting by a deep learning using Keras, is difficult to adjust input
data. Data set must be preprocessing and it must be converted to tensors. This is
done by using the time series generator function. The deep learning model for
demand forecasting can be demanding expertise and computing-time.

Acta Polytechnica Hungarica Vol. 18, No. 8, 2021
– 129 –
2.3 Multicriteria Approach to Method Evaluation
As mentioned, the prediction calculations will be performed for a period of 90
days and then for 365 days. The final evaluation is carried out on the basis of a
multicriteria approach. The first evaluation criterion will be the degree of accuracy
of the model.
Accuracy expresses the basic criterion for evaluating the quality of a model.
In business practice, several indicators MAE, RMSE, MAPE and many others are
used. The degree of accuracy decreases with the length of the forecast period.
Forecasting can never be completely accurate, there is a certain amount of random
component in each time series. MAE and MSE will be used in this study.
The mean absolute error (MAE), described relationship (5).
(5)
Some authors [18] point to the impossibility of comparing accuracy results
between different time series. The MAE result is in units of original demand.
In this paper, however, we have a time series of the same parameters, so the use of
this criterion is possible.
The second accuracy used is MSE. This indicator is described by the relation (6).
. (6)
In the business situation, where the big error exponentially increases financial
costs, is this parameter very important [4].
Another of the parameters of multicriteria comparison are runtime and computing
demand. Not only the best accuracy is necessary to select the most suitable
forecasting methods. Businesses usually do not have unlimited runtime or
computing demand. Sometimes what can be calculated and predicted on campus,
with the potential of using supercomputers and excellent computer equipment, is
not realistic for business practice. These parameters are therefore crucial for
evaluating the effectiveness of the methods used.
The last criterion is the complexity of the researcher's knowledge. Not all
companies have top statistical experts and systems engineers. It is therefore
necessary that financial and logistics managers be able to interpret or set methods
in the company. Today, it is common for methods to be created by companies
themselves (such as Google or Facebook), mainly due to the complexity of
methods created in academic research.

A. Kolková et al. Demand Forecasting in Python: Deep Learning Model Based on LSTM Architecture versus Statistical Models
– 130 –
3 Results
The results of the 90-days demand forecast according to the seasonal naïve
method are shown in Figure 3 and Figure 4 for the 365-days demand forecast.
Figure 3
Results of 90-days demand forecasting using seasonal naïve method
Figure 4
Results of 365-days demand forecasting using seasonal naïve method
Demand forecasting in Figure 4 shows, it will be very difficult to overcome the
seasonal naïve forecast. Since the last period the demand changed only a little on
data set and the seasonal patterns in demand stay constant. This is a problem with
a change of weather in different seasons. This could mean a significant demand
shift. Subsequently, there could be insufficient or, on the contrary, excessive
supply and subsequent logistical problems.
When forecasting according to the TBATS method, an estimator including
settings to handle multi-seasonality was selected based on the Akaike information
Acta Polytechnica Hungarica Vol. 18, No. 8, 2021
– 131 –
criterion, estimator = 7,365. Annual and weekly seasonality are including in
estimator.
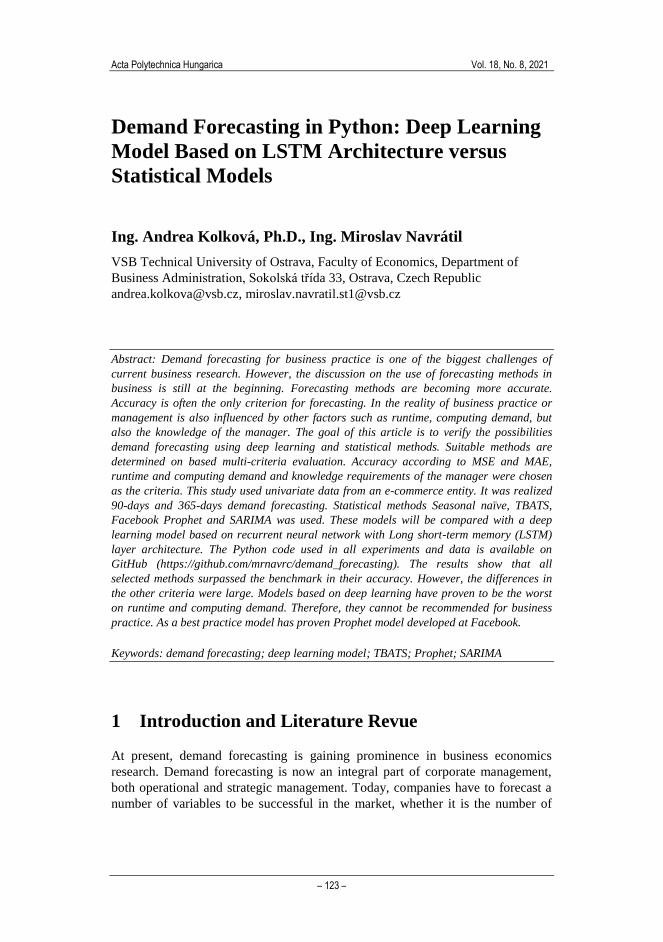
The results of this forecast are shown in Figures 5 and 6. Figure 5 expresses a 90-
day demand forecast, Figure 6 for 365-days demand forecast.
Figure 5
Results of 90-days demand forecasting using TBATS method
Figure 6
Results of 365-days demand forecasting using TBATS method
Based on the Prophet model, 90 and 365-days demand forecasts were again
performed. The results are shown in Figures 7 and 8.

A. Kolková et al. Demand Forecasting in Python: Deep Learning Model Based on LSTM Architecture versus Statistical Models
– 132 –
Figure 7
Results of 90-days demand forecasting using Prophet method
Figure 8
Results of 365-days demand forecasting using Prophet method
According to the methodology, the SARIMAX model was created. When
evaluating the models, a model with parameters for 90 days,
SARIMAX (0, 1, 1) x (1, 1, 1, 7)
was selected by an automated process. For 365-days forecast,
SARIMAX (0, 0, 2) x (0, 1, 1, 7).
The resulting forecast is shown in Figures 9 and 10.

Acta Polytechnica Hungarica Vol. 18, No. 8, 2021
– 133 –
Figure 9
Results of 90-days demand forecasting using SARIMAX method
Figure 10
Results of 365-days demand forecasting using SARIMAX method
For Deep learning models, it is necessary to set more parameters. The calculation
is therefore relatively demanding on the researcher's experience. Two models were
chosen to solve the forecast using deep learning. The model A is based on shallow
layers. Model B contains multiple hidden layer, so it is a deep neural network
model to be able to compare both deep learning models. The only thing that will
change will be the number of layers, and at the same time, both models must set
around 360,000 parameters. This model should include more information, and be
better to forecast demand curve [30]. This has not been confirmed. The model
parameters are listed in Table 1.

A. Kolková et al. Demand Forecasting in Python: Deep Learning Model Based on LSTM Architecture versus Statistical Models
– 134 –
Table 1
Parametrs Deep Learning models
batch size hidden layers neurons dropout optimizer epochs
10 1 300 0.1 Adam 100
batch size hidden layers neurons dropout optimizer epochs
10 3 405 0.1 Adam 100
batch size hidden layers neurons dropout optimizer epochs
10 1 30 0.1 Adam 100
batch size hidden layers neurons dropout optimizer epochs
10 2 80 0.1 Adam 100
90
-da
ys d
em
an
d
foreca
sting
pa
ra
mete
rs
36
5-d
ay
s dem
an
d
foreca
sting
pa
ra
mete
rs
Shallow Layers (model A)
Deep Layers (model B)
Shallow Layers (model A)
Deep Layers (model B)
The result of the deep learning MODEL A – shallow layer model for the 90-days
forecast is shown in Figure 11 and of the deep learning MODEL B – deep layer in
Figure 12.
Figure 11
Results of 90-days demand forecasting using Deep learning MODEL A – shallow layer method

Acta Polytechnica Hungarica Vol. 18, No. 8, 2021
– 135 –
Figure 12
Results of 90-days demand forecast using deep learning MODEL B – deep layer method
The results of demand forecasting show that deep neural networks are not suitable
for a simple univariete time series. Those models can be better for complex
forecasting problems with mutlivariate data. The calculation of this model is even
on an univariate date too time consuming, for this particular forecast the total
computer time was 56 minutes. Therefore, it is not effective to continue
optimizing for a possible improvement in accuracy.
For 365-days forecast and shallow layer, the results are shown in Figure 13 and
deep layers in Figure 14.
Figure 13
Results of Deep learning MODEL A – shallow layer method for 365-days demand forecast

A. Kolková et al. Demand Forecasting in Python: Deep Learning Model Based on LSTM Architecture versus Statistical Models
– 136 –
Figure 14
Results of Deep learning MODEL B – deep layer method for 365-days demand forecast
All models were evaluated on the basis of a multicriteria approach. Those criteria
were the evaluation of MAE, MSE, runtime and computing demand and the
knowledge and experience requirements of the researcher. All models based on
the evaluation of accuracy (MAE, MSE) exceeded the benchmark of seasonal
naive method. The individual criteria were evaluated in the order they received in
the given criterion. Subsequently, the sum of the results of the individual orders
was performed (lower is better).
As already mentioned, 5 criteria were evaluated, namely MAE, MSE, runtime,
computing demand and researcher's expirence, namely on 90-days demand
forecast and 365-days demand forecast.
In Table 2 are the results of multicriterial approach, which was applied in this
study, based 90-days demand forecast. The Prophet model is under these criteria
the best.
Table 2
Results of multicriteria evaluation models for 90-days demand forecast
MAE Rank MSE Rank Runtime Rank
Computing
demand -
rank
Researcher's
experience -
rank
Total
Rank
4.81 5 40.3 6 0.03s 1 1 1 14
2.59 2 10.84 2 461.91s 4 4 2 14
2.51 1 10.63 1 5.18s 2 2 2 8
2.94 3 12.98 3 17.94s 3 3 2 14
Shallow Layers 2.94 3 14.6 4 2550.10s 5 5 3 20
Deep Layers 3.94 4 24.09 5 3400.00s 6 6 3 24
Model
Deep
Learning
90-days demand forecast
TBATS
Prophet
SARIMA
Seasonal naive model

Acta Polytechnica Hungarica Vol. 18, No. 8, 2021
– 137 –
Prophet also showed great results in the 365-days demand forecast, as shown in
Table 3. In addition, the practical use of the Prophet model is supported by the
conclusions of the already mentioned study, which suggested that information on
promotions, holidays and events is very useful. This information can be very
easily implemented into Prophet, so it further increases the possibility of use in
practice. On the other hand, the exogenous time series that must be predicted
(weather, macroeconomic data, etc.) did not bring any significant benefits [5].
And this is an area that needs more testing.
The worst results by this conditions achieved Deep learning model based on
shallow layers and deep layers too. Especially for the 365-days demand forecast
models using recurrent neural network showed the worst results, see Table 3.
By 365-days demand forecasting is the best model Prophet, as well as by 90-days
demand forecasting.
Table 3
Results of multicriteria evaluation models for 365-days demand forecast
MAE Rank MSE Rank Runtime Rank
Computing
demand -
rank
Researcher's
experience -
rank
Total
Rank
5.38 6 48.5 6 0.04s 1 1 1 15
3.2 2 17.99 2 298.28s 4 4 2 14
3.22 1 17.69 1 5.39s 2 2 2 8
3.64 3 24.84 3 88.62s 3 3 2 14
Shallow Layers 5.27 5 46.33 5 1600.00s 5 5 3 23
Deep Layers 4.85 4 37.5 4 3000.00s 6 6 3 23
SARIMA
Deep
Learning
365-days demand forecast
Model
Seasonal naive model
TBATS
Prophet
Conclusions
The goal of this article was to verify the possibility demand forecasting using deep
learning and statistical methods. Suitable methods are determined based on
multicriteria evaluation. Accuracy according to MSE and MAE, runtime,
computing demand and knowledge requirements of the manager were chosen as
criteria. In this study was counted the forecast based on a deep learning method
and based on statistical methods. Was realized by the e-commerce company 90-
days and 365- days demand forecasting. Statistical methods Seasonal naïve,
TBATS, Facebook Prophet and SARIMA were used. These models will be
compared with a deep learning model based on recurrent neural network with
Long short-term memory (LSTM) layer architecture.
The seasonal naïve model was chosen as a benchmark in this study. Visual
presentation of the prediction indicated that it would be difficult to overcome this
benchmark in univariate data. However, based on accuracy measures, the seasonal
naïve model was eventually surpassed by all models.

A. Kolková et al. Demand Forecasting in Python: Deep Learning Model Based on LSTM Architecture versus Statistical Models
– 138 –
The Propet model appears to be the most advantageous model for a company in
the category of small and medium-sized enterprises. His demands for runtime,
computing demand and researcher's experience were at a very good level. These
parameters were surpassed only by the seasonal naive method, which had the
worst accuracy. Prophet accuracy was the best for both the 90-days and 365-days
demand forecast models. Therefore, the resulting multi-criteria comparison rated
Prophet as the best.
The TBATS model according to the results can be called the second best.
Its accuracy is comparable to the best model. However, TBATS is generally more
computationally intensive and therefore its practical business use is likely to have
its limitations.
Furthermore, this demand forecast indicate that SARIMA dont capture multi-
seasonality and daily data. This is declareted other researches too [11]. SARIMA
is also not suitable for practical use for demand forecasting due to its high degree
of expertise of the processor and the manager working with the results of the
model. Even though the resulting forecasting error is not so large, SARIMA
cannot be recommended for wider business use.
The deep learning models exceeded the benchmark in the evaluation of accuracy
measures and from this point of view they seemed applicable. However, their
runtime and the need for high expertise put them in the last place. Small and
medium-sized companies, such as the analysed one, usually do not have such
computing capacity or relevant knowledge. The deep learning model can be
improved. One option may be, setting better parameters as a study, which
analysed Kaggles forecasting competitions, pointed out that a key to good
performance of many machine learning models is the appropriate selection of
hyperparameters and features [5]. However, this is not the subject of this study,
because this study focuses only on comparing models in the basic setup without
further optimization.
It may also indicated that machine learning models are not suitable for practical
use in small and medium-sized companies due to high demands on finance and
knowledge.
This is in in accordance with the results of the previous study by Makridakis [19].
His study declareted that on univariate time series classic statistical models is
better to use than machine learning models.
Thus, this study supports the conclusion of a study that analysed Wikipedia web
traffic and found that one of the weaknesses of recurrent neural networks is in
modelling long-term dependencies such as yearly seasonality [5]. However, large
multinational companies and companies engaged in professional forecasting
invest a lot of money in the development of demand forecasting models.
Therefore, neural networks may not be completely excluded now, their further
development and possible further use for univariete data can be expected.

Acta Polytechnica Hungarica Vol. 18, No. 8, 2021
– 139 –
For smaller companies, however, this is not feasible. It is possible for them to use
models only in the basic settings. Therefore deep learning models can be very
helpful in predicting complex time series data with many exogenous inputs.
Especially with the simultaneous use of statistical methods. After all, this was also
confirmed by the M4 forecasting competition, where the best models include
those based on a hybrid approach. In addition, another study suggests that the
requirement for a successful use of machine learning models is cross-learning.
That means using many time series to train a single model [27].
Acknowledgement
This work was supported by the Czech Science Foundation (GACR Project
GA18-13951S).
References
[1] Andreeski, C. and Mechakaroska, D. Modelling, Forecasting and Testing
Decisions for Seasonal Time Series in Tourism. Acta Polytechnica
Hungarica, 2020, 17(10), pp. 149-171
[2] Farooq, U., Gu, J., Balas, V., Abbas, G., Asad, M. and Balas, M. A Hybrid
Time Series Forecasting Model for Disturbance Storm Time Index using a
Competitive Brain Emotional Neural Network and Neo-Fuzzy Neurons.
Acta Polytechica Hungarica, 2019, 16(4), pp. 213-229
[3] Banerjee, N., Morton, A. and Akartunali, K. Passenger Demand
Forecasting in Scheduled Transportation. European Journal of Operational
Research, 2020, 286(3), pp. 797-810
[4] Barbieri, N. Approaches to Recommendations. 2014, California: Morgan
and Claypool Publishers
[5] Bojer, C. and Meldgaard, J. Learnings from Kaggle’s Forecasting
Competitions. 2020, Work. Paper
[6] Box, G. E. P., Jenkins, G. M. and Reinsel, G. C. Time Series Analysis:
Forecasting and Control. 1976, New York: John Wiley and Sons Inc.
[7] Cerqueira, V., Torgo, L. and Soares, C. Machine Learning vs. Statistical
Methods for Time Series Forecasting: Size Matters. Machine Learning.
ArXiv, 2019, abs/1909.13316
[8] DeLivera, A., Hyndman, R. J. and Snydera, R. D. Forecasting Time Series
with Complex Seasonal Patterns Using Exponential Smoothing. Journal of
the American Statistical Association, 2011, 106(496), pp. 1513-1527
[9] Gilliland, M. The Value Added by Machine Learning Approaches in
Forecasting. International Journal of Forecasting, 2019, 36(1), pp. 161-166
[10] He, Y. X., Wang, M. Y., Guang, F. T. and Zhao, W. B. Research on the
Method of Electricity Demand Analysis and Forecasting: The Case Of
China. Electric Power Systems Research, 2020, 187

A. Kolková et al. Demand Forecasting in Python: Deep Learning Model Based on LSTM Architecture versus Statistical Models
– 140 –
[11] Hyndman, R. Forecasting with Long Seasonal Periods. 2020, available at:
https://robjhyndman.com/hyndsight/longseasonality/
[12] Hyndman, R. and Athanasopoulos, G. Forecasting, Principles and Practise.
2018, Middletown: Otext.
[13] Hyndman, R. and Khandakar, Y. Automatic Time Series Forecasting: The
forecast Package for R. Journal of Statistical Software, 2008, 27(3)
[14] Hochreiter, S. and Schmidhuber, J. Long Short-term Memory. Neural
computation, 1997, 9 (8), 1735-1780
[15] Chatfield, C. Simple is Best? International Journal of Forecasting, 1986, 2,
pp. 401-402
[16] Choi S. B. and Ahn I. Forecasting Seasonal Influenza-Like Illness in South
Korea after 2 And 30weeks Using Google Trends and Influenza Data From
Argentina. PLoS ONE, 2020, 15(7)
[17] Lo, S. L, Wang, F. K. and Lin, J. T. Forecasting for the LCD Monitor
Market. Journal of Forecasting, 2008, 27(4), pp. 341-356
[18] Macurová, P., Klabusayová, N. and Tvrdoň, L. Logistika, 2nd edition, 2018,
Ostrava: VŠB-TU Ostrava
[19] Makridakis S, Spiliotis E. and Assimakopoulos V. Statistical and Machine
Learning Forecasting Methods: Concerns and Ways Forward. PLOS ONE,
2018, 13(3)
[20] McKinney, W. Python for Data Analysis Book,: Data Wrangling with
Pandas, NumPy, and IPython, 2nd edition, 2017, Sebastopol: O’Reilly
Media, Inc.
[21] Millan-Ruiz, D. and Hidalgo, J. I. Forecasting Call Centre Arrivals. Journal
of Forecasting, 2013, 32(7), pp. 628-638
[22] Navrátil, M. (2019) Comparison of Statistical Models with Deep Learning
in Business Practice. Diploma thesis, VŠB –TU Ostrava, Department of
Business Administration
[23] Navrátil, M. and Kolková, A. Decomposition and Forecasting Time Series
in the Business Economy Using Prophet Forecasting Model. Central
European Business Review, 2019, 8(4), pp. 26-39
[24] Ozhegov, E. M. and Ozhegova, A. Regression Tree Model for Prediction of
Demand with Heterogeneity and Censorship. Journal of Forecasting, 2020,
39, pp. 489-500
[25] Papastefanopoulos, V., Linardatos, P. and Kotsiantis, S. COVID-19: A
Comparison of Time Series Methods to Forecast Percentage of Active
Cases per Population. Applied Sciences, 2020, 10(11)

Acta Polytechnica Hungarica Vol. 18, No. 8, 2021
– 141 –
[26] Parra, J., Fuentes, O., Anthony, E. and Kreinovich, V. Use of Machine
Learning to Analyze and –Hopefully – Predict Volcano Activity. Acta
Polytechnica Hungarica, 2020, 14(3), pp. 209-221
[27] Smyl, S. A Hybrid Method of Exponential Smoothing and Recurrent
Neural Networks for Time Series Forecasting. International Journal of
Forecasting, 2019, 36(1), pp. 75-85
[28] Solvoll, G., Mathisen, T. and Welde, M. Forecasting Air Traffic Demand
for Major Infrastructure Changes. Research in Transportation Economics,
2020, 82
[29] Taylor, S. and Letham, B. Forecasting at Scale. The American Statistician,
2018, 72, pp. 37-45
[30] Wei, A. and Wei, J. Deep Learning Essentials: Your Hands-On Guide to
the Fundamentals of Deep Learning and Neural Network Modelling. 2018,
Birmingham: Pack Publishing
[31] Yang, Y. X., Heppenstall, A., Turner, A. and Comber, A. Using Graph
Structural Information About Flows to Enhance Short-Term Demand
Prediction in Bike-Sharing Systems. Computers Environment and Urban
Systems, 2020, 83
[32] Zellner, A. Keep it sophisticatedly simple. Simplicity, Inference and
Modelling: Keep it Sophisticatedly Simple, 2001, Cambridge: Cambridge
University Press, pp. 242-262