Embed Size (px)
Citation preview
Munich Personal RePEc Archive
Demand for private tuition classes under
the free education policy. Evidence based
on Sri Lanka
Pallegedara, Asankha
July 2011
Online at https://mpra.ub.uni-muenchen.de/31969/
MPRA Paper No. 31969, posted 03 Jul 2011 13:55 UTC
Demand for private tuition classes
under the free education policy.
Evidence based on Sri Lanka.
Pallegedara Asankha
National Graduate Institute for Policy Studies (GRIPS)
Tokyo, Japan
Abstract
Private tuition classes are growing phenomenon in Sri Lanka especially among students
who prepare for competitive national school qualifying examinations. It is one of major
education issues under the free education policy in Sri Lanka. It can tarnish the real
purpose of free education policy. In this paper, I examine the demand for private tuition
classes in Sri Lanka by using two waves of Household Income and Expenditure Surveys
(HIES) conducted by the Department of Census and Statistics (DCS) of Sri Lanka in
1995/96 and 2006/07.I find that the demand for private tuition classes has increased in
recent time among households. It seems that the private tuition expenditure has changed
from a luxury good in 1995/96 to a necessity good in 2006/07. If the increased demand
for private tuition classes is reflecting parents’ concerns on inadequate and poor, but free
education in public schools, the Sri Lanka government needs to reconsider its free
education policy.
Keywords: Private tuition classes, Household expenditure, Free education policies, Tobit
estimator.
2
1. Introduction
Sri Lanka is one of a few countries in the world that offer free education from primary
school leads to university level. Sri Lankans have been benefiting the free education
policy started in 1945.Although per capita GDP is low, Sri Lanka has archived high
literacy, school enrollment and school completion rates comparable to those of developed
countries. Not only school fees are free but some other generous incentives are also given
to Sri Lankan students. For instance, public schools provide free text books up to junior
secondary school and free uniforms up to senior secondary school. Moreover, free meals
are also provided for needy students. All these benefits reduce the cost of education and
help students to study without facing burden from education related costs. While all these
generous incentives help to improve education level in Sri Lanka, education has become
highly competitive as the labor wage depends more on the education level of the labors
(Ranasinghe and Hartog, 1997).In Sri Lanka, national school qualifying examinations are
highly competitive. Thus, the high competition has created a recent and growing
phenomenon called ‘private tuition classes’. These private tuition classes are not
governed by the government or any other local government authorities. The private
tuition classes are held both weekends and weekday after school mainly in urban cities.
Students attend these private tuition classes to obtain additional skills and techniques to
pass the highly competitive school qualifying examinations. Many parents send their
children to these tuition classes by paying tuition fees.
Private tuition classes are common, not only in developing countries like Sri Lanka but
in many other developed countries. For example, students in developed countries, like
Japan, South Korea, the United States, and the United Kingdom, are also taking
3
additional private tuition classes. Bray (2007) emphasizes that many students in
developing countries, especially in Asia, are attending private tuition classes and that
trend of attending tuition classes is growing in most of the countries. Although private
tuition classes have become a large scale education industry, the implications and other
cultural effects of the private tuition classes have not been investigated rigorously by
policy makers and educational planners due to unavailability of high-quality data.
Private tuition classes are one of a major education issue under the free education
policy in Sri Lanka. However, to my knowledge, no quantitative research has
investigated the determinants of household private tuition expenditure using nationwide
household level survey data. Therefore, this study attempts to examine the determinants
of private tuition expenditure in Sri Lanka. The data used in this paper come from two
nationwide Household Income and Expenditure Surveys(HIES) in Sri Lanka surveyed in
1995/96 and 2006/07.Using both descriptive and econometric analysis, I investigate the
determinants of private tuition expenditure and economic burden for private tuition
expenditure at the household level. I also try to explore the change of household private
tuition expenditure situation over the time. The major findings of this paper are as
follows: household private tuition expenditure has changed from a luxury good in
1995/96 to a necessity good in 2006/07.Household economic burden for private tuition
expenditure has increased significantly in recent time. Rural households show less
demand for private tuition classes. The highly educated parents seem to have stronger
demand for children’s private tuition classes.
This paper structured as follows. In section 2 I discussed the background of the research
question and private tuition situation in Sri Lanka. Section 3 presents the data and
4
descriptive analysis. Section 4 describes the econometric framework and variables.
Section 5 discusses the estimation results. Finally section 6 concludes the paper with
discussing policy implications.
2. Background of the research problem and private tuition classes in Sri Lanka
2.1 Background of the research problem
Demand for private tutoring is a widespread phenomenon in many countries. There is a
growing literature related to private tutoring in recent years. Lack of official data and
statistics, however, hinder the study of private tutoring. Bray (2007) reviews the literature
related to private tutoring. He compiled data from various sources and presents a
comprehensive review related to private tutoring around the world. He finds that private
tutoring widely varies with culture, the nature of main stream education systems, and the
scale of economies. Several authors have investigated the determinants of private tutoring
quantitatively. Tansel and Bircan (2006) have examined the household private tuition
expenditure in Turkey. They find that households with higher income spend more on
their children’s private tutoring and higher parental educational level seems to increase
spending on children’s private tutoring. According to their findings, private tutoring has a
unitary elasticity which indicates private tutoring is neither a necessity nor a luxury good
in household budget in Turkey. They have also found that household expenditure on
private tutoring is higher in urban areas compare to rural areas. Dang (2007) has
investigated the determinants of expenditure on private tutoring and impacts of private
tutoring on student’s academic performance in Vietnam. His findings indicate that private
tutoring is a necessity good in the household budget for primary and lower secondary
school students in Vietnam. His results also suggest that private tutoring seems to
5
increase student’s academic performance. Moreover, ethnic minority households spend
less on private tuition classes for their children who attend primary schools than ethnic
majority households do. Bray and Kwok (2003) have examined the demand for private
tuition classes in Hong Kong and found that about 49% of sampled secondary school
students receiving private supplementary tutoring. Kim and Lee (2004) have studied the
parent’s expenditure on private tuition in South Korea using national wide household
survey. They argue that the demand for private tutoring has been increased due to the
government’s strict education policies. Psacharopoulous and Papakonstantinou (2005)
have found that private tutoring expenditure is inelastic in Greece. Ha and Harpham
(2005) found that richer and more educated households in urban areas of Vietnam spend
more on private tuition classes compare to poor and uneducated households in rural areas.
In Sri Lanka, studies are limited to private tuition classes. This may be due to
unavailability of data on private tuition classes. De Silva (1994) has investigated the
private tutoring status in Sri Lanka. According to his survey, 80% of grade 6 students
attended some form of private tuition classes in 1990.This proportion was 75% for grade
11 students. Also 62% of grade 13 students who follow arts stream received private
tuition. The proportion was 67% for commerce students and 92% for science students. He
also found that more students go to private tuition classes for science related subjects like
Physics, Mathematics, and Chemistry. Since his study, private tuition classes have
become more popular and the household private tuition expenditure seems to have
increased significantly.
2.2 Private tuition classes in Sri Lanka
6
Private tuition classes are widespread and unofficial education industry especially in Sri
Lanka especially in urban areas. Although some students attend private tuition classes at
the beginning of their schools, majority of students attend the private tuition classes to
prepare for school qualifying examinations at the end of Grade 5, Grade 11 and Grade 13.
Since these three school qualifying examinations are very competitive and very important
in their life, most of the students attend private tuition classes. Private tuition classes are
not governed or administrated by Sri Lankan government. There are three types of private
tuition education in Sri Lanka.
First type of private tuition education is one-to-one instruction in which teachers visit
students or students visit teachers. A teacher could be a qualified teacher, an
undergraduate student, or an upper grade school student. They are usually paid hourly
rates which vary widely according to the qualifications and experiences. Classes can be
given any time of the day but usually after school or weekends. This is the most
expensive type of tuition class in Sri Lanka because instruction is given by one-to-one.
Therefore only rich households can afford this type of private tuition classes. Second type
of private tuition is provided by qualified teachers to small group of students. The class
size can vary from two to fifty students depending on the popularity of a teacher and the
student population of the area. In Sri Lanka, this type of tuition class is called as ‘Group
Tuition Class’. Teachers in these classes are usually public school teachers and provide
education for additional money. It is not illegal for public school teachers to teach after
school hours or weekends. So many public school teachers teach in these tuition classes.
Most students go to ‘Group Tuition Classes’ when they are nearing their school
qualifying examinations. Students who prepare for the scholarship examination at grade 5
7
usually take private tuition classes for Mathematics and first language subjects. Students
who sit for General Certificate of Education (GCE) Ordinary Level (O/L) examination at
Grade 11 usually take additional private tuition classes for subjects like Mathematics,
Science, English etc. GCE Advanced Level (A/L) students at grade 13 usually go to
private tuition classes depending on their major stream such as Bio-Science (Physics,
Chemistry, Biology), Physical Science (Physics, Chemistry, Combined Mathematics),
Commerce (Business Studies, Economics, Accounting) and Arts (various arts
subjects).The fees of this second type of private tuition classes are usually charged on
monthly basis and they vary with the popularity of teachers. Third type of private tuition
classes are known as ‘Hall Tuition Class’. The class size of these types of tuition classes
is very large. It can be between fifty and one-thousand students depending on teacher’s
popularity, student population and location of the class. Classes are usually held in very
large halls and instruction is given by using microphones. This type of private tuition
classes is popular among GCE O/L and GCE A/L students. Most of the teachers in this
type of classes are very famous. They may be school teachers or university lectures.
Classes are usually held on weekends but some times in week days. Since the number of
students is very high, fees charged by instructor is the cheapest among three types of
private tuition classes. This type of hall tuition classes are only located in large urban
cities. Therefore some times students from rural areas travel long distance to attend this
type of classes.
3. Data and Descriptive Analysis
3.1 Data
8
This study is based on the Household Income and Expenditure Survey (HIES) of Sri
Lanka conducted by the Department of Census and Statistics (DCS). According to
DCS (2008), DCS conducts Household Income and Expenditure Survey once in every
five years. The first survey has been conducted in 1980/81 namely Labor Force and
Socio-Economic Survey and continued till 1990.In 1990, this survey was separated in to
Labor force survey and Household Income and Expenditure survey. Therefore, DCS has
conducted Household Income and Expenditure survey as a separate survey since
1990.Genarally HIES selects 25000 household units as a sample for all country. DCS
collect the data using direct personal interviews. Last HIES has been conducted in
2006/07 covers all districts in Sri Lanka excluding Northern Province and Trincomoalee
district in Eastern Province due to security reasons. Sample selection of the survey has
been implemented according to the proportionately to the number of housing units in
each district. Also the data collection has been conducted in 12 monthly rounds to capture
the seasonal variation of income and expenditure patterns of households (DCS, 2008).
HIES usually gathers household information on demographic characteristics, household
expenditure, and household income.
I use both HIES (2006/07) and HIES (1995/96) survey data for analysis. By comparing
the two surveys, I can grasp the change of household demand for private tuition classes
on children’s education. The surveys ask detailed questions on education expenditure.
For example, I can obtain not only the expenditure on education but what type of
education expenditure such as tuition fees, expenditure on school text books, expenditure
on stationeries, boarding fees etc.Also it has specific individual data such as age,
education level, job etc.Since the purpose of this study is to identify the determinants of
9
household private tuition education expenditure, I only select households that have
students ages from 6 to 21 for this study.
3.2 Descriptive statistics
3.2.1 Sampled households and private tuition expenditure
In Table 1, I find that students are more likely to attend private tuition classes in recent
time. Sri Lankan students usually start their schooling when they reach above 5 years old.
They take first national level school examination when they are in grade5.Students take
first school qualifying exam called general certificate of education ordinary level(GCE
O/L) when they are aged above 15 and second qualifying examination called general
certificate of education advanced level(GCE A/L) when aged 18 or above. Students can
repeat the examination if they fail to pass. Therefore I take households that have students
aged 6 to 21 years as our sample cohort. There are 13863 households have students
between aged 6 and 21 years in 1995/96 sample and 11628 households in 2006/07 sample.
The total number students who are aged 6 to 21 are 30170 in 1995/96 and 21438 in
2006/07.Out of those total households, 76.74% of households have not spent money on
private tuition classes and 23.26% of households have used money on students private
tuition classes in 1995/96. But we can see that only 36.33% of households have not spent
money on private tuition in 2006/07.Outof total 11628 households, 63.67% of households
have spent money on private tuition classes. This indicates a considerable increase of
proportion of households that spend money on private tuition classes.
3.2.2 Private tuition expenditure by income level
10
In table 2, I figure out the clear difference in private tuition expenditure by household
income levels. First, the proportion of households with positive private tuition
expenditure increases highly from bottom to top income quartile in 1995/96 survey.
However, the tendency disappears in the 2006/07 survey. There is not much difference in
proportion of households with positive tuition expenditure by household total expenditure
quartiles. Thus, richer households are more likely to spend money on tuition classes in
1995/96.Second, for each quartile, the percentage of households with positive private
tuition expenditure has increased over time. For instance, the percentage of bottom
income quartile households with positive private tuition expenditure has increased from
around 6% in 1995/96 to 60% in 2006/07.Thus, poor households also seem to send their
children to private tuition classes in recent time.
3.2.3 Private tuition expenditure by demographic characteristics
In table 3, I find that household private tuition expenditure is varied with demographic
characteristics. I use sector of household reside and ethnicity of the household as
demographic characteristics. In Sri Lanka, households may divide into three main sectors.
They are urban sector, rural sector and estate sectors. Rural sector is the largest household
sector consists of various districts that are usually still under developed. Urban sector
consists of various urban areas usually have better infrastructure facilities. Then estate
sector consists of several areas mainly where tea plantations situated. It is usually the
least developed area in terms of infrastructure facilities. Then, I divide households based
on their ethnicity. Sinhalese and Tamils are the main ethnic groups live in Sri Lanka.
Sinhalese consist of 70% of total population and Tamils consist of 20%.Tamil
community divided in to two major sects one who live mainly in north and east part of
11
Sri Lanka called as ‘Sri Lankan Tamils’ and other who live in estate sector called as ‘Up
Country Tamils’. Another 10% of total population are belongs to Muslim and other minor
communities. Table 3 indicates that households live in urban sector are more likely to
spend money on private tuition classes in the 90s. For instance, 40.48% of urban
households have spent money on private tuition classes and only 19.76% have spent in
rural households. Estate sector have reported the least percentage of households which
spent money on private tuition classes. Only 14.85% of estate sector households have
spent money on children’s private tuition classes in 1995/96 survey.
But over the time, households seem to spend money on children’s private tuition
classes regardless of the living area. For instance, 65.04% of rural households have spent
money on private tuition classes in 2006/07 survey. This is dramatic increase compare
with 1995/96 survey results. Percentage of urban households that spend spent money on
private tuition classes have also increased but not as high as rural households. The
percentage of estate sector households that spend money on children’s private tuition
classes seem to increase significantly in recent time, however, estate sector households
still have reported least percentage compare with rural and urban sector households. This
may be due to the less development in terms of infrastructure facilities such as schools,
hospitals, houses, roads etc in the estate sector.
Next I find that the households belong to Tamil ethnicity group are less likely to spend
money on private tuition classes compare with Sinhalese and other ethnic groups. Only
16.72% of total Tamil households seem to spend money on children’s private tuition
classes in 1995/96. Around 24.32% of Sinhalese and 25.03% of other ethnic group
households have spent money on children’s private tuition classes in 1995/96. The same

12
trend can be observed in 2006/07. Percentage of Tamil households that spend money on
private tuition classes are the lowest, however, the percentage have increased
significantly in 2006/07.This result is as expected. Because most of the Sri Lankan Tamil
community lives in northern part of Sri Lanka where civil war had been taken place from
year 1983 to 2009 and some live in estate sector where least developed area in terms of
infrastructure facilities. Thus, access to private tuition classes may be difficult for Tamil
community compare with other communities.
3.2.4 Private tuition expenditure by household head’s level of education
The results in table 4 indicate that education level of parents has positive relationship
on household private tuition expenditure. I observe that the percentage of households
with positive private tuition expenditure has increased with the level of household head’s
education. About 55.29% of households that have positive private tuition expenditure are
headed by above university level educated person in 1995/96.But this percentage is only
9.53% for households that is headed by a person with no schooling. This trend is similar
for 2006/07, however, the percentages have increased significantly in
2006/07.Ranasinghe and Hartog (2002) argue that Sri Lankan children’s schooling
attainments depends on parents’ education and employment status. This result might give
a reason for higher achievement of children from higher educated parents though I did
not investigate academic performance of children in this study. Households that parents
have higher education background may demand children’s education more than those of
lesser educated parents. Therefore, may spend more money on their children’s education
such as private tutoring.
13
3.2.5 Percentage of private tuition expenditure in total household expenditure
In table 5, I find significant difference of household budget share for private tuition
expenditure. In 1995/96, around 23% of households with school aged children spend
money on private tuition classes and majority of them allocate 1-5% of total household
expenditure on private tuition classes. However, in 2006/07, around 64% of households
send their children to private tuition classes. Around 37% households allocate between
0% and 1% of total household expenditure on private tuition classes in 2006/07, however,
only 4% of households allocate between 0% and 1% in 1995/96.Thus,many households
seem to allocate at least few percent of their budget on children’s private tuition classes
in recent time.
4. Econometric Framework
In this section, I discuss the econometric framework and variables that we use in the
following estimation models. First, I estimate an Engle curve model for household private
tuition expenditure. Second, I estimate a model for household economic burden of private
tuition classes.
4.1 Determinants of Household Private tuition expenditure
An Engle curve form of demand for private tuition expenditure is adapted assuming
linear relationship between dependant and independent variables. The dependant variable
is private tuition expenditure of households censored at zero because some households do
not spend money on private tuition classes. Following Tanzel & Bircan (2006), Dang
(2007), Kim & Lee (2010), I estimate censored regression model for household’s demand
for private tuition expenditure as follows.
14
,*
ii XY εβ += (1)
0=iY if ,0*≤iY (2)
*
ii YY = if ,0*>iY (3)
Where *
iY is the latent private tuition expenditure of household i, and iY is the observed
private tuition expenditure of household i.X is a vector of independent variables that can
affect household private tuition expenditure, including household characteristics,
household head characteristics, and regional characteristics. iε is an error term.
As Deaton (1997) emphasizes, heteroscedasticity is often found problem in household
income and expenditure survey data. To reduce this problem, I use log transformation on
expenditure data. Thus, our dependant variable is the log of the household private tuition
expenditure. But it creates a problem of undefined value of log of zero as some
households do not spend money on private tuition expenditure. To overcome this issue, I
add a value of one in the place of zero to the household private tuition expenditure. Our
independent variables consists of a number of household characteristics such as the
household total expenditure per month as a proxy for the total household income, the
number of children in the household, the number of adults in the household, reported
ethnicity of household etc. I also add two dummy variables for the households having
only girls or boys. I include a year dummy for the 2006/07 survey data and an interaction
term of total the household expenditure with the year 2006/07 dummy to capture the time
difference. Several characteristics of the household heads have been included as
independent variables. They include age and age squared of the household head, the
education level of the household head, the employment status of the household head, and
the education level of the spouse of the household head. Regarding the employment
15
status of household head, I include several dummy variables named as
‘formal’, ’informal’, ’owner’ to indicate employment status of the household head. The
formal workers are workers who in the government sector, semi-government sector or
private sector. Informal workers are own account workers or unpaid family workers.
Finally the owner workers are entrepreneurs who usually do some form of businesses.
Moreover, I also include several dummy variables for household head’s income earnings
livelihood such as agriculture, employment and other sources. Household head education
usually means father’s education and mother’s education consider as spouse’s education.
The regional characteristics refer to sector (Urban, Rural) variables. Estimation of
censored regression model is implemented by using Tobit estimator as it is the obvious
choice for censored model. Tobit estimator uses maximum likelihood function method
which assumes normality and homoscedastic error distribution. Both conditional and
unconditional marginal effects of Tobit model will be calculated.
4.2 Determinants of Household economic burden for private tuition expenditure
Next, I estimate household economic burden for private tuition classes, defined as the
percentage of the private tuition expenditure in the total household expenditure. I set the
economic burden of private tuition classes as dependant variable. Inflation factor is a
potential problem of analyzing two decades of private tuition expenditure data since
survey data is in nominal values. Therefore, the economic burden for private tuition
expenditure may be indicator when I analyze two cross sectional data as it gives the
change of demand for private tuition classes in real terms. Explanatory variables are same
as the model in section 4.1 with the exception of household total monthly expenditure
variable. I omit the household total monthly expenditure from the explanatory variables
16
as it may be endogenous to economic burden of private tuition expenditure variable.
Tobit estimator is used as estimation technique similar to section 4.1.
5. Estimation Results
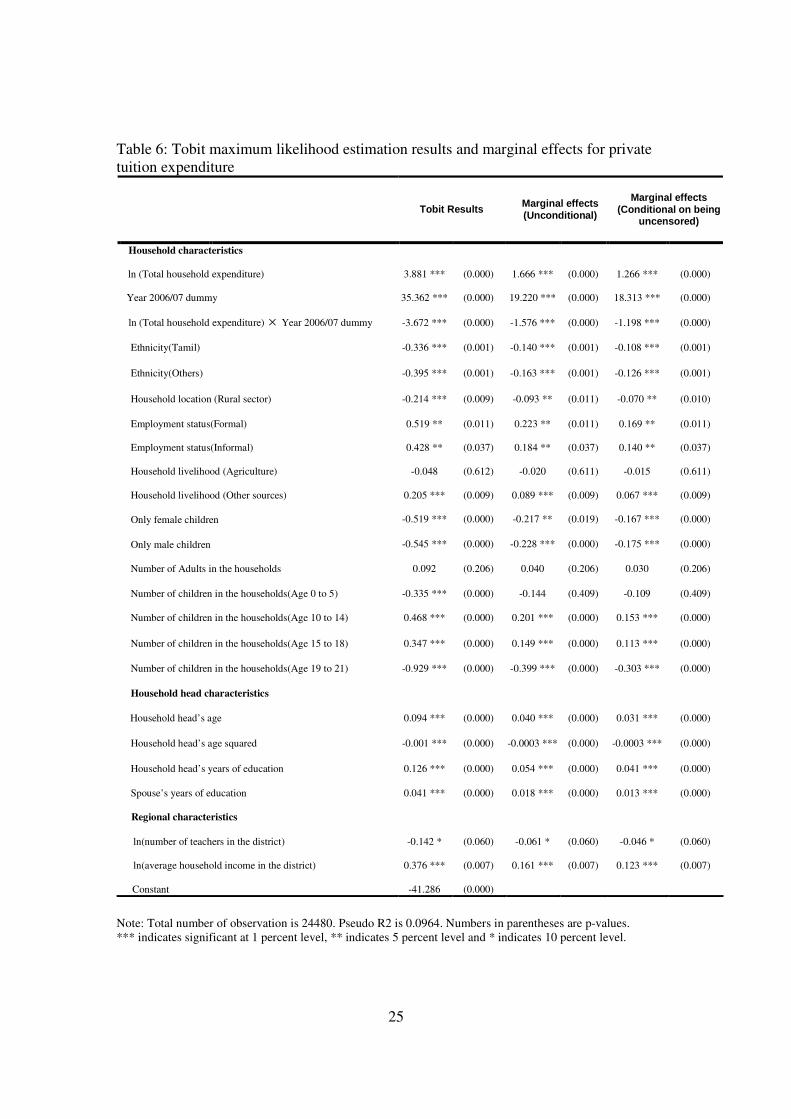
5.1 Determinants of Household Private Tuition Expenditure
The Tobit estimation results for household private tuition expenditure and the
associated conditional and unconditional marginal effects in table 5, suggest the demand
for private tuition classes has increased over the time. In my estimation model, the
household private tuition expenditure and the household total expenditure are both in
logarithms form. Thus, the estimated coefficient gives expenditure elasticities. The
private tuition expenditure elasticities conditional on positive private tuition expenditure
are 1.40 in 1995/96 and 0.08 in 2006/07.The unconditional private tuition expenditure
elasticities are 1.87 in 1995/96 and 0.10 in 2006/07.All elasticity values are statistically
significant This indicate that private tuition was a luxury good of household budget in
1995/96 but became a necessity of household budget in 2006/07. Dang (2007) also found
private tutoring is a necessity good for Vietnam primary and secondary school students.
The age of household head seems to have positive impact on private tuition expenditure
at a decreasing rate, because the coefficient values of household head’s age and age
squared are statistically significant with positive and negative signs. This may indicate
that the middle aged household heads are more likely to spend money on their school
aged children’s education. Similar result is also found by Tanzel and Bircan (2006) in
Turkey.
The education level of father and mother have statistically significant positive impact on
children’s private tuition expenditure as both coefficients of household head’s years of
17
education and spouse’s years education are positive and statistically significant. The
unconditional marginal effects results suggest that holding other things constant, a year
increase in father’s years of education increases household private tuition expenditure by
about 6% while a year increase in mother’s years of education only increase private
tuition expenditure by about 2%. In most Sri Lankan households, fathers are household
heads except for few mother headed households. Thus, the impact of father’s years of
education seems to be higher than mother’s years of education. This finding is in contrast
with Kim and Lee (2010), Tanzel and Bircan (2006) as they found mother’s years of
education have higher effect than that of fathers in Korea and Turkey.
There appears to be significant difference on household private tuition expenditure
among rural and urban households, and the ethnic majority and minority households. The
rural households are less likely to spend money on children’s private tuition classes
compare with urban households indicated by statistically significant and negative
coefficient estimate. For instance unconditional marginal effect results suggest that rural
households are about 18% less likely to spend money on children’s private tuition classes
compare with Sinhalese households. This result is as expected because people in the rural
areas are relatively poor and also have lack of facilities. The Sinhalese households who
belong to the ethnic majority are more likely to spend money on private tuition classes
than ethnic minority households. Because the coefficient value for ethnic majority
Sinhalese has lower negative value than two ethnic minority variables. Also I could not
find significant difference of private tuition expenditure between households who earn
income from agriculture or from other employment.
18
Number of children especially aged between 6 and 18 seems to be a factor of household
private tuition expenditure as expected. I can see positive highly significant coefficient
estimates for variables that represent number of children who are between age 6 and 18.
For example, unconditional marginal effect results suggest that the number children who
are aged between 10 and 14 increases by 1 child, household private tuition expenditure
increase by around 29%. Sri Lankan students usually take school qualifying examinations
when they are in grade 5(age 10), grade 11(age 16) and grade 13(age 18).Therefore, the
households that have students of these ages are more likely to spend money on private
tuition classes. In contrast, Tanzel and Bircan (2006) found in Turkey that the number of
children decreases the household private tuition expenditure.
Finally, there appears to be no significant difference of private tuition expenditure
between households with only female children and households with only male children
indicating no special priority given to boys’ education. This result is contrary to the
results of Himaz (2010) as she found a bias favoring girls on education expenditure
allocation in Sri Lankan households.
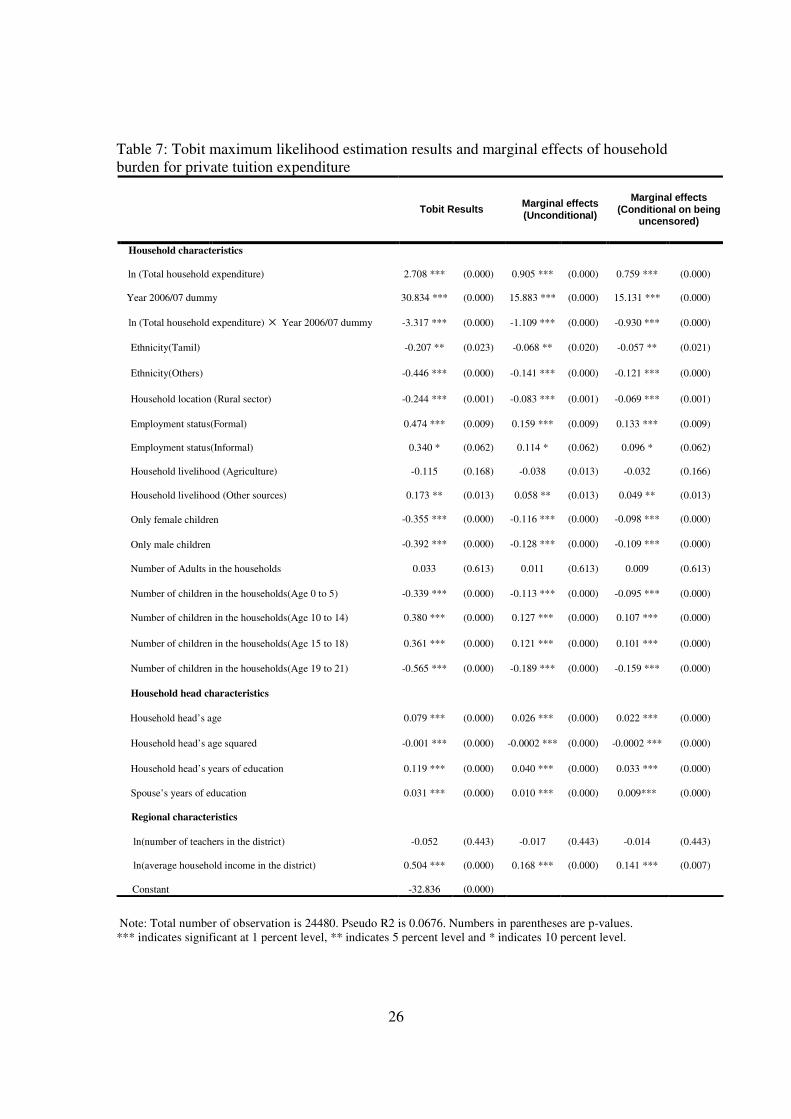
5.2 Determinants of Household Burden for Private Tuition Expenditure
According to the regression results in table 6, household economic burden for private
tuition expenditure is higher in recent days especially among households in urban area.
The unconditional marginal effects indicate that the economic burden for private tuition
expenditure in 2006/07 is about 78% higher than that of in 1995/96.Also the urban
households seem to have 11% higher economic burden than other households. The
variables that represent age of household head, education level of household head,
education level of spouse, number of school aged children in the households, number of
19
adults in the household, urban households have positive association with economic
burden for private tuition expenditure. In contrast, the rural households, female and male
children only households, livelihood of household head’s income earning variables are
negatively associated with household burden for private tuition expenditure.
6. Conclusion and Policy Implications
Private tuition classes are wide spread and growing phenomenon in Sri Lanka
especially among the students who take national school qualifying examinations. This is
a growing concern for education policy makers as Sri Lanka provides free education up
to university level. The private tuition classes may increase the social inequalities and
damage the purpose of free education policy. This paper has investigated the
determinants of private tuition expenditure and the determinants of economic burden for
private tuition expenditure in Sri Lankan households using two national wide household
survey data. The results imply that private tuition has become necessity good in Sri
Lankan household budget in recent time. The richer households are more likely to spend
money on children’s private tuition classes, however, the private tuition expenditure gap
has been narrowing in over the time. The education level of parents is found to be an
important factor of household private tuition expenditure. The positive relationship
between level of parental education and household private tuition expenditure indicates
high educated parents are more likely to spend money on children’s private tuition
classes. Majority Sinhalese households are more likely to spend money on children’s
private tuition classes compare with minority communities. The number of school aged
children seems to increase household private tuition expenditure, however, no significant
difference in terms gender has found.
20
The growing demand for private tuition classes has several social implications (Bray,
2007). It may increase the social inequalities as richer households are more likely to
spend money on additional private tutoring. The purpose of Sri Lankan free education
policy is to give equal opportunity to every child regardless of their income level.
Therefore, private tuition classes can harm this purpose. Moreover, it can increase racial
inequalities. The gap of education level of rural, urban or majority, minority communities
can be worsened due to private tuition classes.
Parents send their children to private tuition classes due to several reasons. Firstly,
national school qualifying examinations has become more competitive in recent time. In
order to pass competitive examinations, students seem to attend private tuition classes.
Secondly, the quality of education in public schools may be low because many schools
have lack of educational facilities especially in rural areas. The government and
educational policy makers need to take steps to overcome these issues. Sri Lankan
government needs to re-consider the free education policy to every child up to university
level in Sri Lanka. Sri Lankan government allocate large amount of money to implement
free education policy. Instead, government can provide scholarships to needy students
and improve the quality of education in public schools by charging some tuition fee
especially in higher secondary schools. The results of this paper suggest that parents are
willing to pay better quality education. Also educational policy makers can introduce less
competitive national school qualifying examinations. For example, if government
increases the number of public universities and introduce private universities, A/L
examination may become less competitive.
21
References
Athurupane, H. (1999). Econometric Analysis and Planning in the Social Sectors: An
Application to Education in Sri Lanka, Quantitative Tools in Economic Planning:
Applications and Issues in Asia, United Nations Centre for Regional Development,
Nagoya, Japan.
Athurupane, H., Glewwe, P., and Wisniewski, S. (2006).The impact of social quality,
Socio- economics factors and child health on Student’s academic performance:
Evidence from Sri Lankan primary schools. World Bank Working paper.
Bray, M. (2007). The shadow education system: Private tutoring and its implications for
planners, 2nd edition. Fundamentals in Educational Planning. Paris: UNESCO
International Institute for Educational Planning (IIEP).
Bray, M., and Kwok, P. (2003). Demand for private supplementary tutoring: Conceptual
considerations and socio-economic patterns in Hong Kong. Economics of
Education Review, 22, 611–620.
Chay, K.Y. and Powell, J.L. (2001).Semi parametric censored regression models.Journal
of Economic Perspectives, Vol 15(4), 29-42.
Dang, H.A. (2007). The determinants and impact of private tutoring classes in Vietnam.
Economics of Education Review, 26, 684–699,
Deaton, A. (1997).The analysis for household surveys microeconometric approach to
development policy. MD: The Johns Hopkins University Press.
Department of Census and Statistics (2008), Final Report, Household Income and
Expenditure Survey (2006/07), Final Report, Colombo
De Silva, W.A. (1994a).Extra-school tutoring in the Asian context with special reference
to Sri Lanka.Maharagama: Department of Educational Research, National Institute
of Education.
De Silva, W.A. (1994b).The present status of private tutoring in Sri Lanka.Economic
Review (The People's Bank, Colombo) 20(2, 3), 4-7, 20-24.
De Silva, W.A., Gunawardena, C., Jayaweera, S., Perera, L., Rupasinghe, S., and
Wijethunga, S. (1991).Extra-school instruction, social equity and educational
equality [Sri Lanka].Report prepared for the International Development Research
Centre, Singapore.
22
Ha, T. T., and Harpham, T. (2005). Primary education in Vietnam: Extra classes and
outcomes. International Education Journal, 6(5), 626–634.
Himaz, R. (2010). Intrahousehold Allocation of Education Expenditure: The Case of Sri
Lanka. Economic Development and Cultural Change, University of Chicago Press,
vol. 58(2), pages 231-258, 01.
Kakwani N., Soares F., and Son H. H. (2005), Conditional Cash Transfers in African
Countries, Working Paper No.6, Brasilia, International Poverty Centre.
Kim, S. and Lee, J.H. (2010). Private tutoring and demand for education in South Korea.
Economic development and cultural change, 58:259–296.
McDonald, J. F., and Moffitt, R. A. (1980). The uses of Tobit analysis. The Review of
Economics and Statistics, 62(2), 318–321.
Powell, J.L. (1984). Least Absolute Deviations Estimation for the Censored Regression
Model. Journal of Econometrics, 25: 303-325.
Psacharopoulous, G., and Papakonstantinou, G. (2005). The real university cost in a
‘‘free’’ higher education country. Economics of Education Review, 24(1), 103–108.
Ranasinghe, A. and Hartog, J. (1997). Investment in post-compulsory education in Sri
Lanka. Tinbergen Institute Discussion Paper (TI97 - 021/3), Tinbergen Institute,
Amsterdam, the Netherlands.
Ranasinghe, A., and Hartog, J. (2002). Free education in Sri Lanka. Does it eliminate the
family effect? Economics of Education Review, 21:625-633.
Tansel, A. and Bircan, P. (2006). Demand for education in Turkey: A Tobit analysis of
private education expenditure. Economics of Education Review, 25,303–313.
Wooldridge, J.M. (2009). Introductory econometrics: a modern approach. South-Western
Cengage Learning. Ohio, USA.
World Bank. (2005). Treasures of the Education System in Sri Lanka: Restoring
Performance, Expanding Opportunities and Enhancing Prospects. South Asia. The
World Bank.Washinton, DC.
23
Table 1: Proportion of households with zero and positive private tuition expenditure in
Sri Lanka
Year Number of
Households
Households with zero
private tuition expenditure
Households with positive
private tuition expenditure
1995/96 13863 10639 (76.74%) 3224 (23.26%)
2006/07 10677 3843 (35.99%) 6834 (64.01%)
Source: Author’s calculation based on HIES 1995/96 and HIES 2006/07 surveys
Table 2: Proportion of households with positive private tuition expenditure by total
household expenditure quartiles in Sri Lanka
Year Total household
expenditure quartile
Households with
positive private tuition
expenditure (%)
First quartile 6.38
Second quartile 13.99
Third quartile 24.55 1995/96
Forth quartile 48.11
First quartile 59.74
Second quartile 63.81
Third quartile 64.03 2006/07
Forth quartile 68.45
Source: Author’s calculation based on HIES 1995/96 and HIES 2006/07 surveys
24
Table 3: Proportion of households with positive private tuition expenditure by
demographic characteristics
Households with positive private tuition
expenditure (%) Year
Rural Urban Estate Sinhala Tamil Other
1995/96 19.19 40.48 14.85 24.32 16.72 25.03
2006/07 64.38 62.87 58.19 64.77 59.45 63.55
Source: Author’s calculation based on HIES 1995/96 and HIES 2006/07 surveys
Table 4: Proportion of households with positive private tuition expenditure by household
head’s education level
Households with positive private tuition
expenditure (%) Year
No
Schooling
Primary
Schooling
Secondary
Schooling
University
Graduate
1995/96 9.53 13.61 29.84 55.29
2006/07 57.61 61.95 65.17 71.43
Source: Author’s calculation based on HIES 1995/96 and HIES 2006/07 surveys
Table 5: Percentage of households and percentage of private tuition expenditure in total
expenditure
Percentage of Households (%) Private tuition expenditure as a
percentage of total monthly
expenditure 1995/96 2006/07
0% 76.74 35.99
0-1% 3.96 36.47
1-5% 14.78 23.95
5-10% 3.51 2.74
10% or higher 1.01 0.85
Total 100 100
Source: Author’s calculation based on HIES 1995/96 and HIES 2006/07 surveys
25
Table 6: Tobit maximum likelihood estimation results and marginal effects for private
tuition expenditure
Tobit Results Marginal effects (Unconditional)
Marginal effects (Conditional on being
uncensored)
Household characteristics
ln (Total household expenditure) 3.881 *** (0.000) 1.666 *** (0.000) 1.266 *** (0.000)
Year 2006/07 dummy 35.362 *** (0.000) 19.220 *** (0.000) 18.313 *** (0.000)
ln (Total household expenditure) × Year 2006/07 dummy -3.672 *** (0.000) -1.576 *** (0.000) -1.198 *** (0.000)
Ethnicity(Tamil) -0.336 *** (0.001) -0.140 *** (0.001) -0.108 *** (0.001)
Ethnicity(Others) -0.395 *** (0.001) -0.163 *** (0.001) -0.126 *** (0.001)
Household location (Rural sector) -0.214 *** (0.009) -0.093 ** (0.011) -0.070 ** (0.010)
Employment status(Formal) 0.519 ** (0.011) 0.223 ** (0.011) 0.169 ** (0.011)
Employment status(Informal) 0.428 ** (0.037) 0.184 ** (0.037) 0.140 ** (0.037)
Household livelihood (Agriculture) -0.048 (0.612) -0.020 (0.611) -0.015 (0.611)
Household livelihood (Other sources) 0.205 *** (0.009) 0.089 *** (0.009) 0.067 *** (0.009)
Only female children -0.519 *** (0.000) -0.217 ** (0.019) -0.167 *** (0.000)
Only male children -0.545 *** (0.000) -0.228 *** (0.000) -0.175 *** (0.000)
Number of Adults in the households 0.092 (0.206) 0.040 (0.206) 0.030 (0.206)
Number of children in the households(Age 0 to 5) -0.335 *** (0.000) -0.144 (0.409) -0.109 (0.409)
Number of children in the households(Age 10 to 14) 0.468 *** (0.000) 0.201 *** (0.000) 0.153 *** (0.000)
Number of children in the households(Age 15 to 18) 0.347 *** (0.000) 0.149 *** (0.000) 0.113 *** (0.000)
Number of children in the households(Age 19 to 21) -0.929 *** (0.000) -0.399 *** (0.000) -0.303 *** (0.000)
Household head characteristics
Household head’s age 0.094 *** (0.000) 0.040 *** (0.000) 0.031 *** (0.000)
Household head’s age squared -0.001 *** (0.000) -0.0003 *** (0.000) -0.0003 *** (0.000)
Household head’s years of education 0.126 *** (0.000) 0.054 *** (0.000) 0.041 *** (0.000)
Spouse’s years of education 0.041 *** (0.000) 0.018 *** (0.000) 0.013 *** (0.000)
Regional characteristics
ln(number of teachers in the district) -0.142 * (0.060) -0.061 * (0.060) -0.046 * (0.060)
ln(average household income in the district) 0.376 *** (0.007) 0.161 *** (0.007) 0.123 *** (0.007)
Constant -41.286 (0.000)
Note: Total number of observation is 24480. Pseudo R2 is 0.0964. Numbers in parentheses are p-values. *** indicates significant at 1 percent level, ** indicates 5 percent level and * indicates 10 percent level.
26
Table 7: Tobit maximum likelihood estimation results and marginal effects of household
burden for private tuition expenditure
Tobit Results Marginal effects (Unconditional)
Marginal effects (Conditional on being
uncensored)
Household characteristics
ln (Total household expenditure) 2.708 *** (0.000) 0.905 *** (0.000) 0.759 *** (0.000)
Year 2006/07 dummy 30.834 *** (0.000) 15.883 *** (0.000) 15.131 *** (0.000)
ln (Total household expenditure) × Year 2006/07 dummy -3.317 *** (0.000) -1.109 *** (0.000) -0.930 *** (0.000)
Ethnicity(Tamil) -0.207 ** (0.023) -0.068 ** (0.020) -0.057 ** (0.021)
Ethnicity(Others) -0.446 *** (0.000) -0.141 *** (0.000) -0.121 *** (0.000)
Household location (Rural sector) -0.244 *** (0.001) -0.083 *** (0.001) -0.069 *** (0.001)
Employment status(Formal) 0.474 *** (0.009) 0.159 *** (0.009) 0.133 *** (0.009)
Employment status(Informal) 0.340 * (0.062) 0.114 * (0.062) 0.096 * (0.062)
Household livelihood (Agriculture) -0.115 (0.168) -0.038 (0.013) -0.032 (0.166)
Household livelihood (Other sources) 0.173 ** (0.013) 0.058 ** (0.013) 0.049 ** (0.013)
Only female children -0.355 *** (0.000) -0.116 *** (0.000) -0.098 *** (0.000)
Only male children -0.392 *** (0.000) -0.128 *** (0.000) -0.109 *** (0.000)
Number of Adults in the households 0.033 (0.613) 0.011 (0.613) 0.009 (0.613)
Number of children in the households(Age 0 to 5) -0.339 *** (0.000) -0.113 *** (0.000) -0.095 *** (0.000)
Number of children in the households(Age 10 to 14) 0.380 *** (0.000) 0.127 *** (0.000) 0.107 *** (0.000)
Number of children in the households(Age 15 to 18) 0.361 *** (0.000) 0.121 *** (0.000) 0.101 *** (0.000)
Number of children in the households(Age 19 to 21) -0.565 *** (0.000) -0.189 *** (0.000) -0.159 *** (0.000)
Household head characteristics
Household head’s age 0.079 *** (0.000) 0.026 *** (0.000) 0.022 *** (0.000)
Household head’s age squared -0.001 *** (0.000) -0.0002 *** (0.000) -0.0002 *** (0.000)
Household head’s years of education 0.119 *** (0.000) 0.040 *** (0.000) 0.033 *** (0.000)
Spouse’s years of education 0.031 *** (0.000) 0.010 *** (0.000) 0.009*** (0.000)
Regional characteristics
ln(number of teachers in the district) -0.052 (0.443) -0.017 (0.443) -0.014 (0.443)
ln(average household income in the district) 0.504 *** (0.000) 0.168 *** (0.000) 0.141 *** (0.007)
Constant -32.836 (0.000)
Note: Total number of observation is 24480. Pseudo R2 is 0.0676. Numbers in parentheses are p-values. *** indicates significant at 1 percent level, ** indicates 5 percent level and * indicates 10 percent level.