Embed Size (px)
Citation preview
Demand for “Healthy”Products: False claims in
advertising∗
Anita Rao Emily Wang
Booth School of Business Department of Resource Economics
University of Chicago University of Massachusetts
July 2015
First draft: January 2015
Abstract
Firms often make selective or deceptive claims in their advertising. Such claims
can have negative consequences for consumers especially if consumers are not fully
informed and the claims are hard to verify. This paper aims to measure the impact
of such false claims on consumer demand and understand which type of consumer is
most impacted by these claims. Using a panel dataset of consumer purchases and firm
advertising at the ad-campaign-title level, we exploit the fact that four popular prod-
ucts settled charges raised by the Federal Trade Commission, leading to an exogenous
discontinuation of the false advertising campaigns, to measure this impact. We further
document firm responses in terms of price and advertisement changes around the date
of the warning letter.
∗We thank the James M. Kilts Center for Marketing at the University of Chicago Booth School of Businessfor their help with the Homescan, RMS and Media data. Thanks to seminar participants at Chicago, Duke,NCSU, University of Zurich; to participants at the 2015 IIOC, 2015 Yale Customer Insights Conference, 2014Marketing Science Conference and 2014 Marketing Dynamics Conference; as well as Mary Sullivan and JamesLacko of the FTC for their helpful comments and suggestions. Email addresses: [email protected],[email protected]
1

1 Introduction
Firms often have incentives to make deceptive or selective claims: especially when they
can lead to an increase in demand or can prevent substitution away from their products.
Examples abound in our day-to-day world: products selectively claiming to be made with
whole wheat even when whole wheat is not a main ingredient; products claiming to be “all-
natural” even when they contain synthetic compounds. While regulatory bodies such as
the FTC exist to safeguard consumers from deception, the vast number of companies and
advertisements suggests that some claims are likely to go unnoticed for prolonged durations.
This paper asks the question, what (if any) impact do false claims have on consumers’
purchase decisions. While the role of information on consumer decisions has been studied1,
the consequences of false or misleading health claims on consumer purchases has received
very little empirical attention.2 If consumers are completely informed or these claims are
easily verifiable, any additional information without product composition change should have
no impact on demand. For example, if consumers know that a product does not have sugar
but contains other forms of sugar such as fruit juice concentrate, adding a “no added sugar”
label should have no impact on demand. However, if consumers do not know that fruit juice
concentrate is another form of sugar, this new claim can mislead consumers into thinking this
is a healthy product and can increase demand. Similarly, if these claims are easily verifiable
(e.g. through reading the ingredient list carefully) through search or experience (Stigler 1961,
Nelson 1970) then these claims should have no impact on demand. However, if these claims
are hard to verify then these can mislead consumers.
To measure this impact, we exploit the fact that a few companies were under investigation
by the FTC for making false health claims. These companies reached an agreement with
the FTC which required an immediate termination of the false claims. These agreements
are issued as a consent order with an accompanying press-release statement by the FTC. We
use the timings of these consent orders as exogenous shocks that a) reduced the levels of the
false advertising campaigns to 0 and b) led to widespread information diffusion about these
misleading claims.
As an example, Kellogg’s Frosted Mini-Wheats started making the claim in January 2008
1For example, Bronnenberg, Dube, Gentzkow and Shapiro (2013) find that experts in a certain categoryare more likely to buy the generic versions while novices are more likely to buy the branded versions ofan otherwise homogenous product; Ippolito and Mathios (1990,1995) find that after a regulatory ban onadvertising health benefits was lifted, information acquisition became easier and more people were able topurchase healthier products; Jin and Leslie (2003) find that a policy change requiring restaurants to displayhygiene quality grade cards resulted in consumers becoming more sensitive to this information.
2Stated purchase intentions and consumer beliefs about brands making deceptive claims has been studiedin lab settings, e.g. Darke and Ritchie (2007), Burke et al (1988), Dyer and Kuehl (1978) and Johar (1995).
2

that FMW was “clinically shown to improve kids’ attentiveness by nearly 20%” without any
change in the composition of their product. In April 2009, the FTC issued a consent decree
requiring Kellogg’s to stop making these claims. For Frosted Mini-Wheats this implied both
a discontinuation of television advertisements and change of their front-of-the-box labeling.
Our empirical strategy is based on comparing market shares before and after these FTC
issued public statements to give us a measure of the impact of these false claims.
Using individual-level purchase data from products across 4 categories which were im-
pacted by these false claims, we find that the termination of these claims led to a significant
decline in demand. Our findings further indicate that it is the less-loyal group of consumers
(consumers who, prior to the FTC press-release, purchased fewer units of the focal brand
as a share of their total purchases in that category) who are most impacted by the mis-
leading health claims. These consumers are likely to be the least informed about the brand
and hence the most impacted by the “new” information presented in the advertisements and
front-of-the-box packaging.
Perhaps closest to our paper is Peltzman (1981) who studies the effects of FTC regulation
on the capital market, advertising expenditure and market share of the impacted brands.
Peltzman postulates that false advertisements should impact first-time buyers rather than
loyal buyers. However, data limitations at the time prevented Peltzman from investigating
heterogenous effects and controlling for prices. We build on this paper by incorporating
individual-level data at the brand-week-store level and provide evidence corroborating Peltz-
man’s model.
Broadly, this paper contributes to the literature on firm deception (e.g. Jin and Kato
2006 and Zinman and Zitzewitz 2013) and the literature on the influence of front-of-package
information on consumers (e.g. Moorman 1996, Roe et al 1999) and firms (e.g. Moorman et
al 2012) by measuring the impact of misleading health claims.
In the next section we describe the data and provide reduced form evidence on the impact
of misleading claims on consumer demand. In section 3 we describe the demand estimation
that controls for prices and the competitive environment to quantify the impact of these
misleading claims. Section 4 describes the results, Section 5 documents firm responses in
terms of price and advertisement changes around the date of the warning letter and Section
6 concludes.
2 Data
We use the Nielsen homescan data which contains households’ purchases at the UPC-date
level, the RMS data which contains the weekly price at the UPC-store level for participating
3

retailers and the Nielsen media data which contains the ad-spend, air-time and frequency
of campaigns at the creative-title level for each brand. The Homescan data consists of a
panel of about 40,000-60,000 households. Both the Homescan and Media data span the
years 2004-2012 while the RMS data spans 2006-2012.
We combine this with the dates that the FTC issued consent orders pertaining to various
companies in the RTE cereal, yogurt, yogurt-drink and nutritional supplements categories.
The relevant population of firms impacted by the FTC warning letters can be found at the
FTC website3 and consists of cases and proceedings classified under the mission of Consumer
Protection and the topic of Health Claims. As of November 2014 there were a total of 113
such cases. We restrict our attention to four of these cases based on the following inclusion
criteria (the number in parentheses pertain to the number of cases that do not meet the
listed criteria): 1. The cases should not pertain to internet scams or products sold only
online (44) 2. The case filing date should be after 2003 and before 2012 to be within the
timeframe of the Homescan data (27) 3. The cases should involve consumer product goods
(e.g. insurance, tanning services etc. were excluded) and be present in the Nielsen products
file (23) 4. The total number of observations across households and months should be at least
1,000, to ensure statistically meaningful measures (19). This leaves us with four products
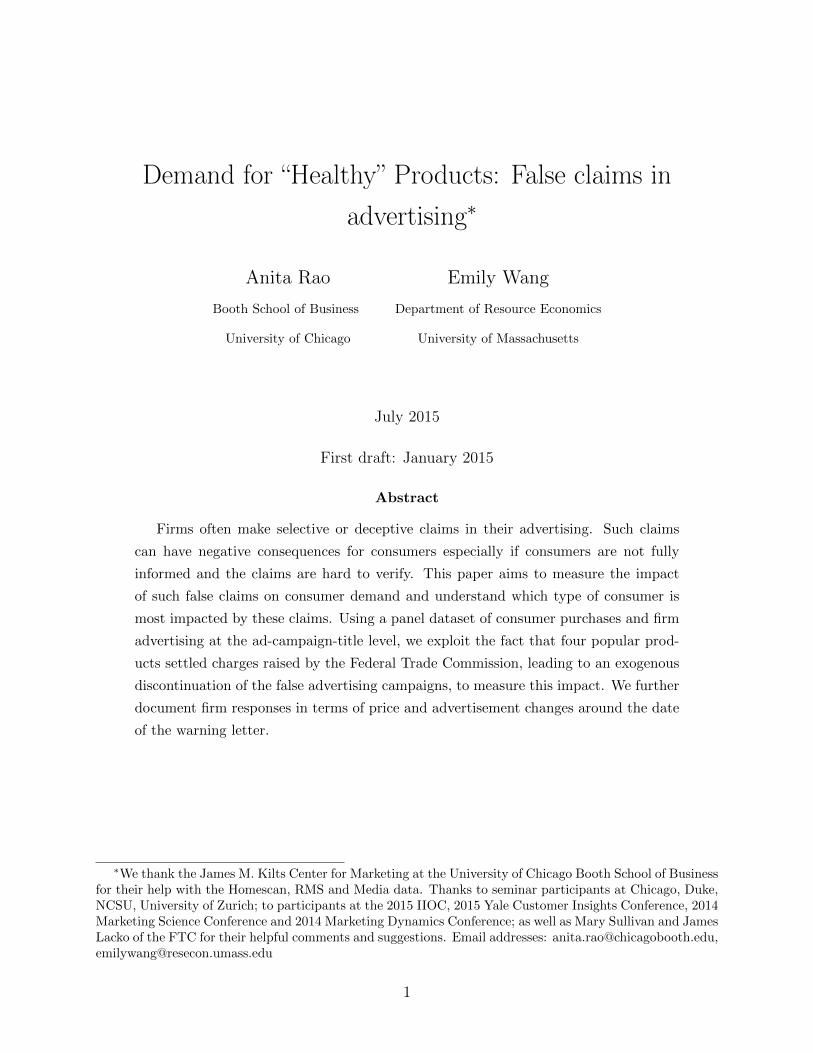
which are sold exclusively in retail stores. Table 1 lists these products, the claims they
were making and the date they were asked to terminate these claims. Figure 1 shows the
front-of-the-package claims highlighted on these products prior to the FTC consent order.
Table 1: Products asked to terminate misleading claims by the FTCProduct Category Claim Consent OrderKel Mini-Wheats RTE cereal improve kids’ attentiveness by 18% April 2009Dannon Activia Yogurt help with slow intestinal transit Dec 2010Dannon Dan Active Yogurt drink helps strengthen your body’s defenses Dec 2010Airborne Supplement offers guaranteed cold-fighting protection Aug 2008
3http://www.ftc.gov/enforcement/cases-proceedings/advanced-search
4
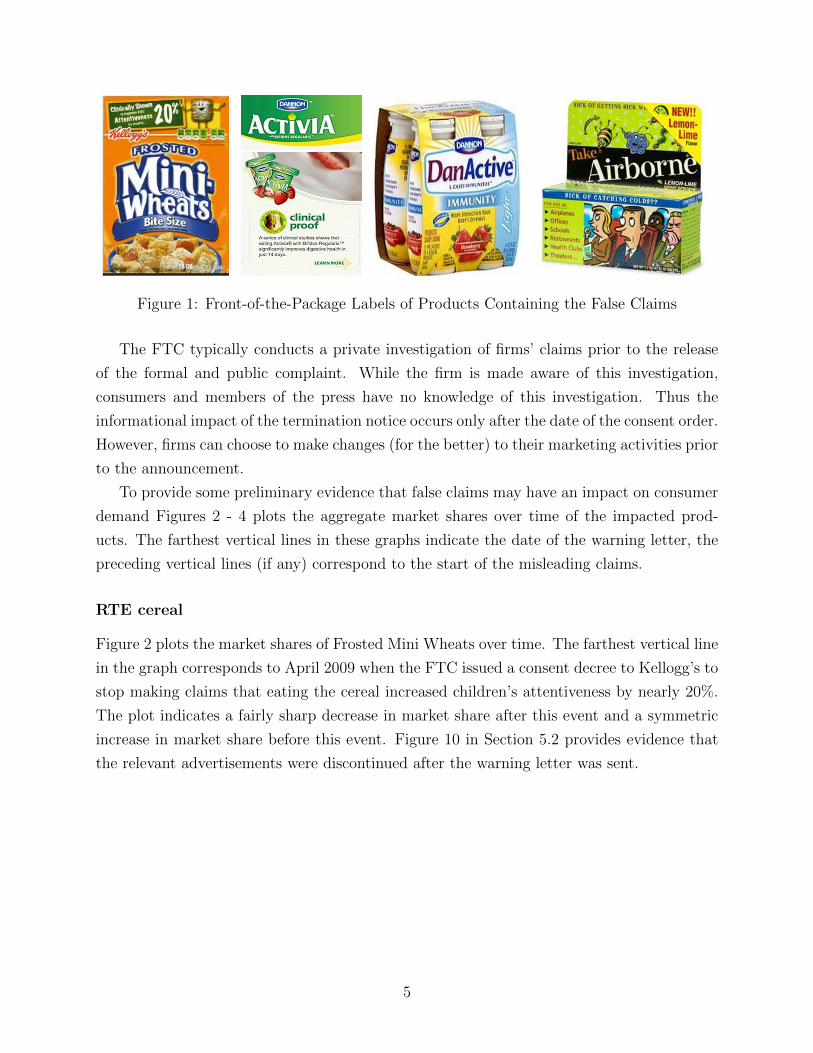
Figure 1: Front-of-the-Package Labels of Products Containing the False Claims
The FTC typically conducts a private investigation of firms’ claims prior to the release
of the formal and public complaint. While the firm is made aware of this investigation,
consumers and members of the press have no knowledge of this investigation. Thus the
informational impact of the termination notice occurs only after the date of the consent order.
However, firms can choose to make changes (for the better) to their marketing activities prior
to the announcement.
To provide some preliminary evidence that false claims may have an impact on consumer
demand Figures 2 - 4 plots the aggregate market shares over time of the impacted prod-
ucts. The farthest vertical lines in these graphs indicate the date of the warning letter, the
preceding vertical lines (if any) correspond to the start of the misleading claims.
RTE cereal
Figure 2 plots the market shares of Frosted Mini Wheats over time. The farthest vertical line
in the graph corresponds to April 2009 when the FTC issued a consent decree to Kellogg’s to
stop making claims that eating the cereal increased children’s attentiveness by nearly 20%.
The plot indicates a fairly sharp decrease in market share after this event and a symmetric
increase in market share before this event. Figure 10 in Section 5.2 provides evidence that
the relevant advertisements were discontinued after the warning letter was sent.
5

.02
.03
.04
.05
.06
.07
Mar
ket s
hare
Jul 2
003
Jan
2004
Jul 2
004
Jan
2005
Jul 2
005
Jan
2006
Jul 2
006
Jan
2007
Jul 2
007
Jan
2008
Jul 2
008
Jan
2009
Jul 2
009
Jan
2010
Jul 2
010
Jan
2011
Jul 2
011
Jan
2012
Jul 2
012
Jan
2013
Kel Frosted Mini-Wheats
Figure 2: Frosted Mini-Wheats market shares over time
Yogurt and Yogurt-drinks
In the refrigerated yogurts category, Dannon was issued a consent decree in December 2010 to
stop making the claim that Activia “relieves irregularity” and DanActive “helps people avoid
catching colds or the flu”. These claims were present in the brands since introduction: for
Activia in February 2006 and DanActive in January 2007. The specific settlement required
that Dannon cannot state that its products reduce the likelihood of getting a cold or flu
unless approved by the FDA; Dannon cannot state digestive benefits unless 1) it clearly
states that three servings of Activia be taken everyday to obtain these benefits or 2) the
claims are backed by reliable scientific evidence or two well-designed human clinical studies.
6
0.0
2.0
4.0
6M
arke
t sha
re
Jul 2
005
Jan
2006
Jul 2
006
Jan
2007
Jul 2
007
Jan
2008
Jul 2
008
Jan
2009
Jul 2
009
Jan
2010
Jul 2
010
Jan
2011
Jul 2
011
Jan
2012
Jul 2
012
Jan
2013
Jul 2
013
Dannon Activia
0.1
.2.3
.4M
arke
t sha
re
Jul 2
003
Jan
2004
Jul 2
004
Jan
2005
Jul 2
005
Jan
2006
Jul 2
006
Jan
2007
Jul 2
007
Jan
2008
Jul 2
008
Jan
2009
Jul 2
009
Jan
2010
Jul 2
010
Jan
2011
Jul 2
011
Jan
2012
Jul 2
012
Jan
2013
Dannon Dan Active
Figure 3: Dannon Activia (yogurt) and DanActive (yogurt-drink) market shares over time
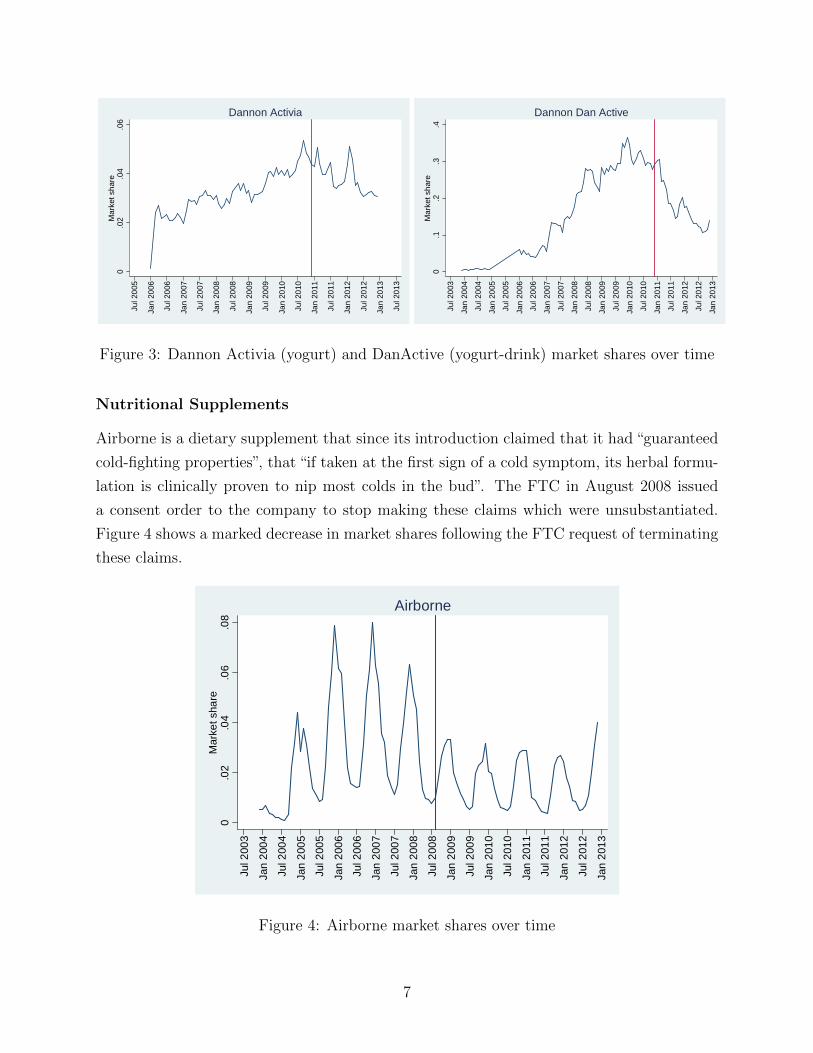
Nutritional Supplements
Airborne is a dietary supplement that since its introduction claimed that it had “guaranteed
cold-fighting properties”, that “if taken at the first sign of a cold symptom, its herbal formu-
lation is clinically proven to nip most colds in the bud”. The FTC in August 2008 issued
a consent order to the company to stop making these claims which were unsubstantiated.
Figure 4 shows a marked decrease in market shares following the FTC request of terminating
these claims.
0.0
2.0
4.0
6.0
8M
arke
t sha
re
Jul 2
003
Jan
2004
Jul 2
004
Jan
2005
Jul 2
005
Jan
2006
Jul 2
006
Jan
2007
Jul 2
007
Jan
2008
Jul 2
008
Jan
2009
Jul 2
009
Jan
2010
Jul 2
010
Jan
2011
Jul 2
011
Jan
2012
Jul 2
012
Jan
2013
Airborne
Figure 4: Airborne market shares over time
7
These figures indicate that there is a perceptible impact of the removal of false claims
and provide preliminary evidence to the extent that consumers might be impacted by these
misleading claims. However, it is possible that some unobservable trend which coincided
with the timing of these warning letters impacted the entire category. To rule out this
explanation, we perform a reduced-form regression of market shares on the time since the
warning letter. We compare these results to the same regression run on similar products but
which are unlikely to be substitutes for the impacted product.
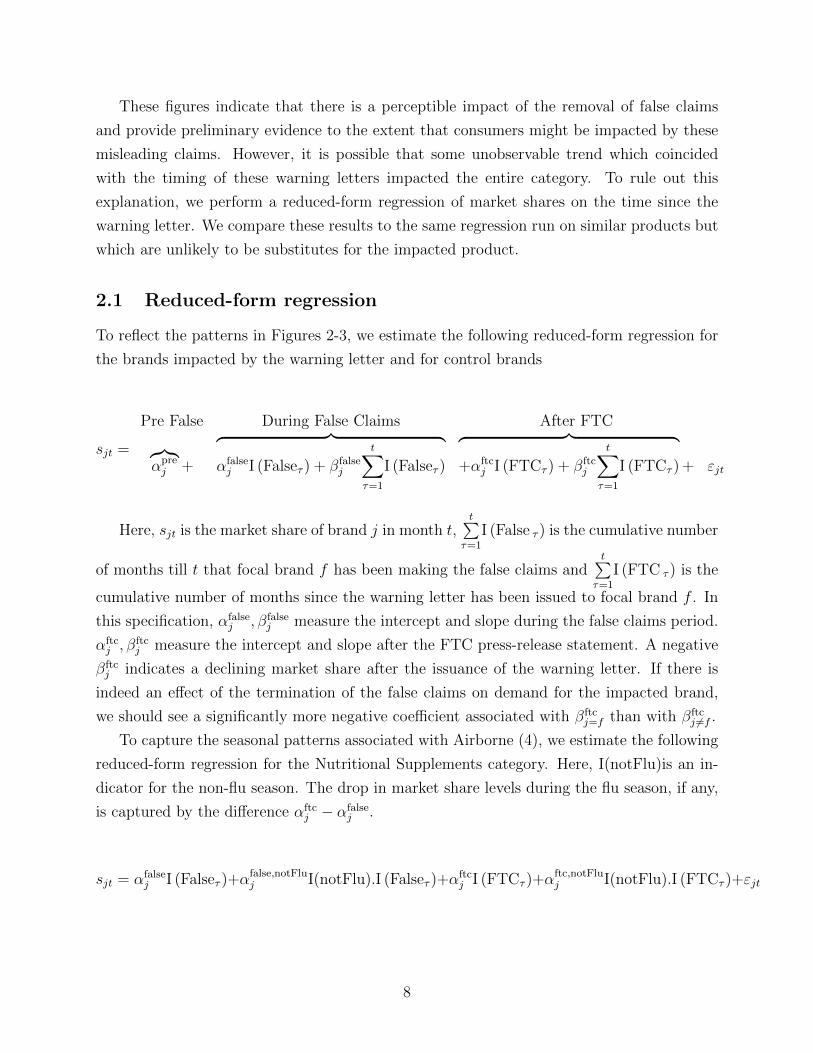
2.1 Reduced-form regression
To reflect the patterns in Figures 2-3, we estimate the following reduced-form regression for
the brands impacted by the warning letter and for control brands
sjt =
Pre False During False Claims After FTC︷︸︸︷αprej +
︷ ︸︸ ︷αfalsej I (Falseτ ) + βfalse
j
t∑τ=1
I (Falseτ )
︷ ︸︸ ︷+αftc
j I (FTCτ ) + βftcj
t∑τ=1
I (FTCτ ) + εjt
Here, sjt is the market share of brand j in month t,t∑
τ=1
I (False τ ) is the cumulative number
of months till t that focal brand f has been making the false claims andt∑
τ=1
I (FTC τ ) is the
cumulative number of months since the warning letter has been issued to focal brand f . In
this specification, αfalsej , βfalse
j measure the intercept and slope during the false claims period.
αftcj , β
ftcj measure the intercept and slope after the FTC press-release statement. A negative
βftcj indicates a declining market share after the issuance of the warning letter. If there is
indeed an effect of the termination of the false claims on demand for the impacted brand,
we should see a significantly more negative coefficient associated with βftcj=f than with βftc
j 6=f .
To capture the seasonal patterns associated with Airborne (4), we estimate the following
reduced-form regression for the Nutritional Supplements category. Here, I(notFlu)is an in-
dicator for the non-flu season. The drop in market share levels during the flu season, if any,
is captured by the difference αftcj − αfalse
j .
sjt = αfalsej I (Falseτ )+α
false,notFluj I(notFlu).I (Falseτ )+α
ftcj I (FTCτ )+α
ftc,notFluj I(notFlu).I (FTCτ )+εjt
8

Control brands
Comparing the impacted brands to other similar products can be problematic especially
if consumers substitute to/away from these similar products as a response to the warning
letters. To get around this problem, we use products which are similar to but are unlikely
substitutes for the impacted product.
In the RTE cereal category, we use Quaker Oats which is a hot cereal as a control.
Since this is not a RTE cereal but is still likely to be impacted by the same unobservable
trends as all cereals this serves as a good control. Similarly, for the yogurt and yogurt-drink
categories, we expand the market to include refrigerated puddings as well. We then use Swiss
Miss Puddings as the relevant control brand. In the nutritional supplements category, we
use Bausch & Lomb products which are vitamins meant only for eye health.
Table 2: Reduced-form evidence: Market shares of impacted brands drop after warningletters
Impacted brand Control Brandco-eff t-stat co-eff t-stat
FMW Quaker OatsCumulative False Claims 0.0012 5.21 -0.0006 -0.71Time since FTC warning letter -0.0003 -5.19 -0.0001 -0.27
Activia Swiss MissCumulative False Claims 0.0008 18.32 -0.00005 -1.79Time since FTC warning letter -0.0008 -4.52 -0.00009 -0.87
Dan Active Swiss MissCumulative False Claims 0.0001 7.23 -0.00005 -1.79Time since FTC warning letter -0.0002 -2.58 -0.00009 -0.87
Airborne Bausch and LombDrop in Level after FTC order -0.0167 -4.51 -0.0004 -0.37
Table 2 reports the results of this regression. The estimates indicate that all the impacted
brands face a decline in market share after the date of the issuance of the warning letter.
This is largely consistent with Figures 2-4 as well. Moreover, the estimates for the control
brands do not show any significant drop in shares after the respective dates for each of the
impacted brands.
These regressions provide some evidence that it is unlikely that the drop in market share
for the impacted brands is due to some other unobservable event which coincided with the
issuance of the warning letter. We now turn to a consumer choice model that controls for
9

prices and the competitive environment.
3 Model
Within a product category, we assume that a household makes a choice from C options
every time a transaction is made. The price of the chosen option is directly observed from
the purchase panel data. We construct the prices of the other options in the consumer’s
consideration set using the RMS data. We construct average within-DMA weekly prices
by averaging prices (per lb) of each brand across all stores and UPCs each week. We then
match a household to these DMA-level prices. For those DMA-weeks where this observation
is missing, we use the weekly national average (average across DMAs).
We specify individual i’s utility from purchasing brand j at time t as
uijt (θ) =
Pre False During False Claims After FTC︷︸︸︷αpreij +
︷ ︸︸ ︷αfalseij I (Falseτ ) + βfalseij
t∑τ=1
I (Falseτ )
︷ ︸︸ ︷+αftc
ij I (FTCτ ) + βftcij
t∑τ=1
I (FTCτ ) + γipjt + εijt
where αpreij is consumer i’s preference for brand j before the focal brand began making
the false claim. αfalseij , βfalse
ij measure the intercept and slope during the false claims period.
αftcij , β
ftcij measure the intercept and slope in the period after the FTC press-release, i.e. once
the consumer knows that the claim is false. βftcif < 0 indicates declining demand for the
focal brand f after the withdrawal of the claim; |βftcf | > |βftc
j | indicates that this decline
is the steepest for the focal brand f . γi is her price-sensitivity coefficient. θ is the set of
parameters{αpreij , α
falseij , βfalse
ij , αftcij , β
ftcij , γ
}governing a consumer’s decision. We estimate a
different specification for each category to capture the specifics of that category.
In the yogurt and yogurt-drinks category, there is no “before” period as the claims were
present since product introduction. Hence we use the following specification
uijt (θ) = αfalseij I (Falseτ )+β
falseij
t∑τ=1
I (False Claimsτ )+αftcij I (FTCτ )+β
ftcij
t∑τ=1
I (FTCτ )+γipjt+εijt
Lastly, in the nutritional supplements category, seasonality -whether it is the flu season
or not - is captured using the following specification
10

uijt (θ) = αfalseij I (Falseτ )+α
false,notFluij I (notFlu*Falseτ )+α
ftcij I (FTCτ )+α
ftc,notFluij I (notFlu*FTCτ )+βipjt+εijt
The probability that individual i chooses brand j at time t is then given by
pi,t (θ) =
∑j e
uijt(θ)Ii,t (j)∑j e
uijt
where Ii,t (j) are indicator functions reflecting individual i′s choice in purchase occasion
t.
Aggregating the probabilities over all purchase occasions that i makes, the individual-level
probability is
pi (θ) =T∏t=1
pi,t (θ)
The overall log-likelihood across all individuals can then be written as
LL (θ) =N∑i=1
log pi (θ)
We assume an individual’s choice set to be fixed. For cereal, we use the top 8 brands
by total sales and Store Brand Mini-Wheats. For yogurt drinks, we use the top 4 brands
excluding those that were discontinued. We aggregate the rest of the products into Other
brands and normalize the utility from Other brands to 0.
4 Results
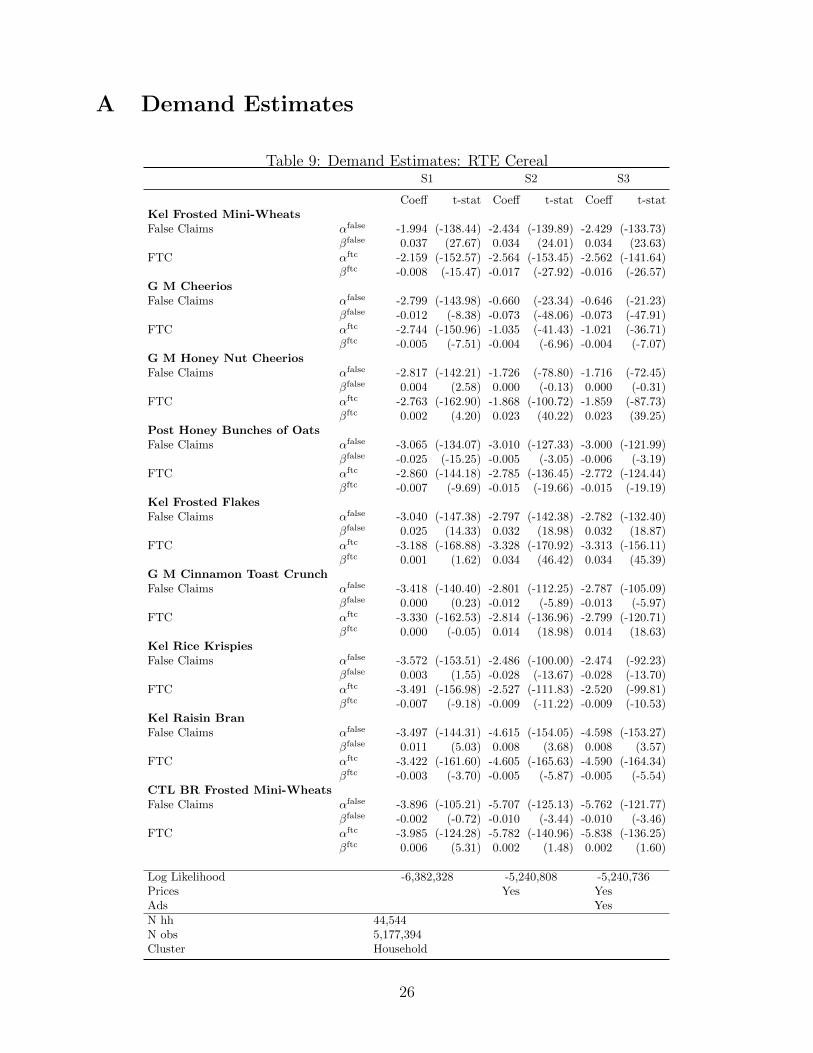
The results of the demand estimation for all categories are reported in Tables 9 - 12. In
Specification S1, we verify that the patterns presented in Section 2 hold even after including
the relevant set of competitors. Specification S2 controls for price of the purchased brand
as well as prices of the competing brands. Specification S3 adds controls for advertisements
at both the National and Regional (DMA) levels. All specifications cluster at the household
level.
Tables 9 - 11 show that the slope coefficient for the focal brand is significantly negative
(i.e. βftcf < 0), indicating declining demand for the focal brand f after the withdrawal of
the claim. In the Nutritional supplements category, where we estimate level differences in
the flu and non-flu seasons, the difference in levels during the flu season, i.e. αftcj − αfalse
j , is
11

significantly negative for Airborne.
To highlight the decline in demand, we simulate the market shares of all brands using
the estimates. Figure 5 plots the decline in market share 4 months after the focal brand was
required to terminate the false claims relative to the market share just before.This provides
further evidence of the decline in demand after the FTC consent order. Except for the yogurt
category (which we investigate further in Section 4.1 ), all impacted brands face a significant
decline in demand even after controlling for price and the competitive environment.
Figure 5 plots the decline in purchase units 4 months after FMW was required to termi-
nate the false claims relative to the market share just before. There are 128,359 households
in the purchase panel and 115 million households in the US. Scaling the decline in purchase
units to the population level, Kellogg’s is likely to have experienced a decline of about 1.3m
units 4 months after the FTC letter which at $3.00 per unit translates to a $4m decline in
revenues that month.Similarly Figure 6 plots the decline in market share for Dan Active.
Projecting this to the population, Dan Active is likely to have faced a decline of 143,000
units or an equivalent of $505,000 in revenues.
From consumer’s and a regulatory perspective, Kellogg’s agreed to a $4 million settlement
in May 2013. To evaluate the magnitude of this settlement, we compute the revenue gain
for Frosted Mini-Wheats due to the presence of the claims. For Frosted Mini-Wheats, if we
assume that the entire gain in market share from January 2008 (start of the false claims)
to September 2010 (when market shares seem to stabilize to pre-2008 levels) was due to the
presence of the false claims, the total revenue gain from these claims is $160m. Even after
controlling for advertisement expenses (which were not that different compared to 2008), the
revenue gain is much larger than the $4m settlement reached.
-1.0%
-0.5%
0.0%
0.5%
1.0%
Kel
Min
i-W
heat
s
GM
Che
erio
s
GM
Hny
Che
erio
s
Pos
t HB
O
Kel
Fro
sted
Fla
kes
GM
Cin
n. T
oast
Kel
Ric
e K
risp
ies
Kel
Rai
sin
Bra
n
CT
L M
ini-
Whe
ats
Cha
nge
in M
arke
t Sh
are
RTE Cereal
-4.0%
-2.0%
0.0%
2.0%
4.0%
Dan
non
Act
ivia
Yop
lait
Sto
nyfi
eld
Dan
non
Yop
lait
Whi
ps!
Cho
bani
Cha
nge
in M
arke
t Sh
are
Yogurt
Figure 5: Decline in market share 4 months after termination of false claims is steepest forFrosted Mini-Wheats
12

-6.0%
-3.0%
0.0%
3.0%
6.0%
9.0%
Dan
non
Dan
Act
ive
Dan
non
Dan
imal
s
Lif
eway
Sto
nyfi
eld
Cha
nge
in M
arke
t Sh
are
Yogurt Drinks
-4.0%
-2.0%
0.0%
2.0%
4.0%
Airb
orne
Na
ture
Mad
e
Na
ture
's B
ount
y
Cha
nge
in M
arke
t Sh
are
Nutr. Supplements
Figure 6: Decline in market share 4 months after termination of false claims is steepest forfocal brands: Dan Active and Airborne
4.1 Heterogeneity in consumer responses
We next explore heterogeneity in consumer responses to see who is most impacted by these
claims. Consumers who differed on observable demographics were found to exhibit little dif-
ference in purchase behavior. This finding is consistent with Rossi, McCulloch and Allenby
(1996) who found that purchase histories were more informative than observable demograph-
ics.
We first explore heterogeneity in consumer responses to the Frosted Mini-Wheats claim
withdrawal, because for this product we have a start-date and end-date of the false claims.
At the start-date of the claims (Jan. 2008), the only addition to the product was the front-
of-the-package label without any product composition change. This makes it possible to
investigate the behavior of those households who never purchased the brand prior to the
false claims.
We classify households into two types based on whether they purchased any units prior to
the start of the claims. This is indicative of households that began purchasing Mini-Wheats
because of the claims. Our hypothesis is that the drop in market-share for this group is
higher than for those consumers who were purchasing the product prior to the start of the
false claims. Figure 7 plots the market share by the number of units purchase prior to Jan.
2008. The rise and drop in market share is sharpest for the group who did not purchase the
product prior to the start of the claims.
13
0.0
2.0
4.0
6.0
8M
arke
t sha
re
Jul 2
005
Jan
2006
Jul 2
006
Jan
2007
Jul 2
007
Jan
2008
Jul 2
008
Jan
2009
Jul 2
009
Jan
2010
Jul 2
010
Jan
2011
Jul 2
011
Jan
2012
Jul 2
012
Jan
2013
0 units <= 5 units > 5 unitsUnits Purchased Before Start of False Claims
Kel Frosted Mini-Wheats
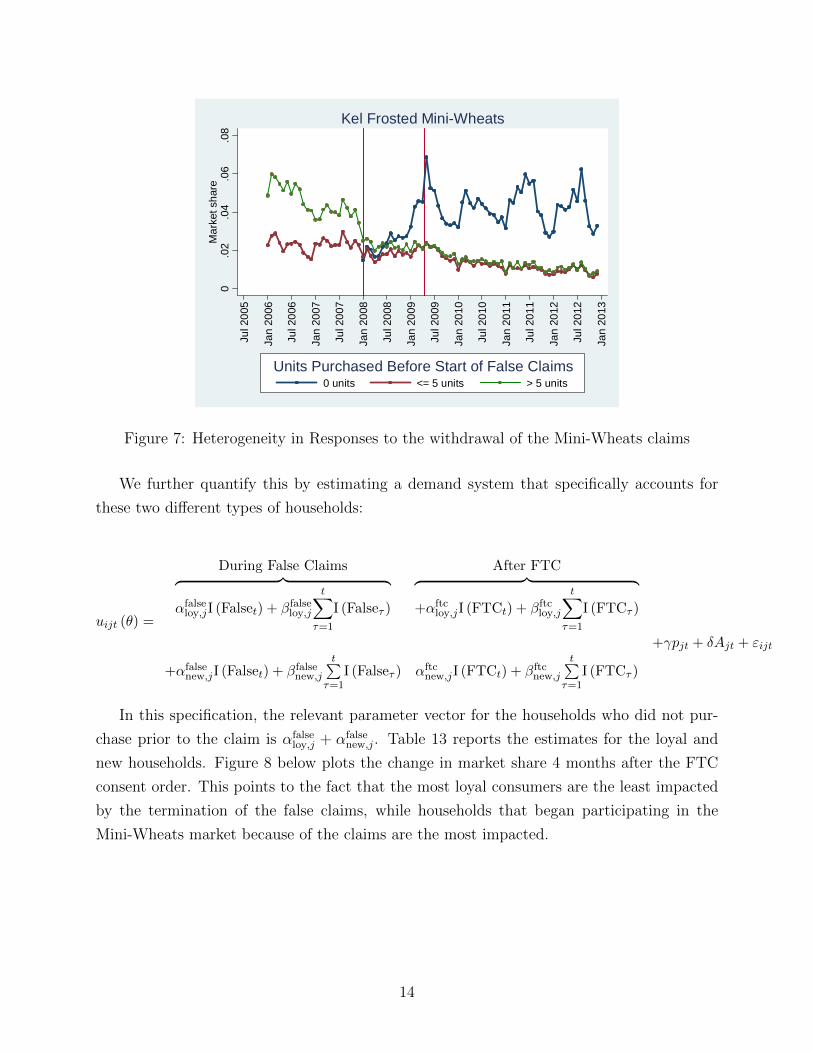
Figure 7: Heterogeneity in Responses to the withdrawal of the Mini-Wheats claims
We further quantify this by estimating a demand system that specifically accounts for
these two different types of households:
uijt (θ) =
During False Claims After FTC︷ ︸︸ ︷αfalseloy,jI (Falset) + βfalseloy,j
t∑τ=1
I (Falseτ )
︷ ︸︸ ︷+αftc
loy,jI (FTCt) + βftcloy,j
t∑τ=1
I (FTCτ )
+γpjt + δAjt + εijt
+αfalsenew,jI (Falset) + βfalsenew,j
t∑τ=1
I (Falseτ ) αftcnew,jI (FTCt) + βftcnew,j
t∑τ=1
I (FTCτ )
In this specification, the relevant parameter vector for the households who did not pur-
chase prior to the claim is αfalseloy,j + αfalse
new,j. Table 13 reports the estimates for the loyal and
new households. Figure 8 below plots the change in market share 4 months after the FTC
consent order. This points to the fact that the most loyal consumers are the least impacted
by the termination of the false claims, while households that began participating in the
Mini-Wheats market because of the claims are the most impacted.
14
-6%
-5%
-4%
-3%
-2%
-1%
0%Loyal New
Cha
nge
in M
arke
t Sh
are
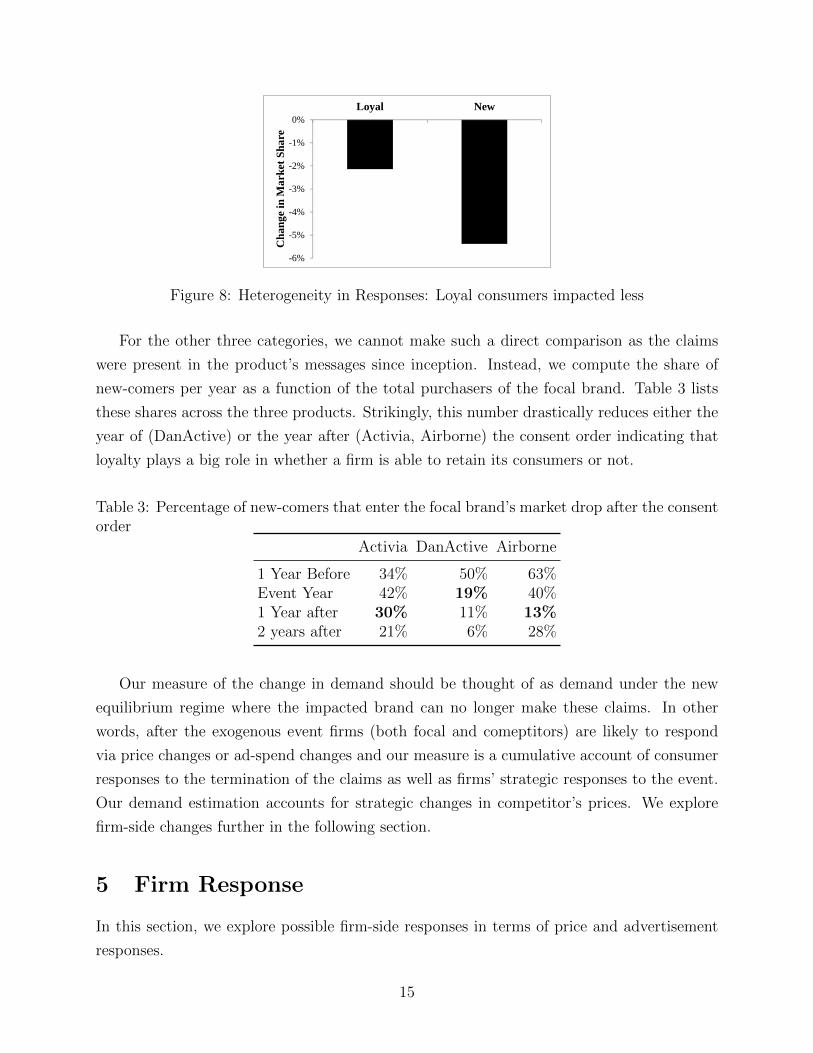
Figure 8: Heterogeneity in Responses: Loyal consumers impacted less
For the other three categories, we cannot make such a direct comparison as the claims
were present in the product’s messages since inception. Instead, we compute the share of
new-comers per year as a function of the total purchasers of the focal brand. Table 3 lists
these shares across the three products. Strikingly, this number drastically reduces either the
year of (DanActive) or the year after (Activia, Airborne) the consent order indicating that
loyalty plays a big role in whether a firm is able to retain its consumers or not.
Table 3: Percentage of new-comers that enter the focal brand’s market drop after the consentorder
Activia DanActive Airborne
1 Year Before 34% 50% 63%Event Year 42% 19% 40%1 Year after 30% 11% 13%2 years after 21% 6% 28%
Our measure of the change in demand should be thought of as demand under the new
equilibrium regime where the impacted brand can no longer make these claims. In other
words, after the exogenous event firms (both focal and comeptitors) are likely to respond
via price changes or ad-spend changes and our measure is a cumulative account of consumer
responses to the termination of the claims as well as firms’ strategic responses to the event.
Our demand estimation accounts for strategic changes in competitor’s prices. We explore
firm-side changes further in the following section.
5 Firm Response
In this section, we explore possible firm-side responses in terms of price and advertisement
responses.
15
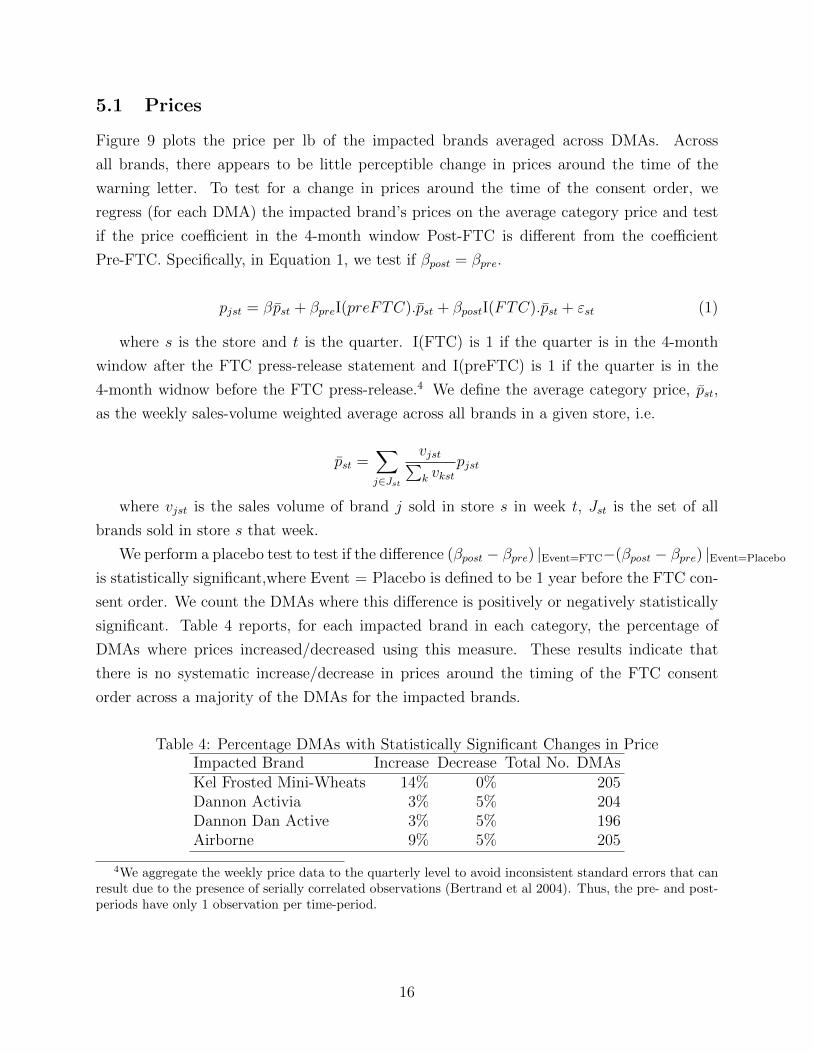
5.1 Prices
Figure 9 plots the price per lb of the impacted brands averaged across DMAs. Across
all brands, there appears to be little perceptible change in prices around the time of the
warning letter. To test for a change in prices around the time of the consent order, we
regress (for each DMA) the impacted brand’s prices on the average category price and test
if the price coefficient in the 4-month window Post-FTC is different from the coefficient
Pre-FTC. Specifically, in Equation 1, we test if βpost = βpre.
pjst = βp̄st + βpreI(preFTC).p̄st + βpostI(FTC).p̄st + εst (1)
where s is the store and t is the quarter. I(FTC) is 1 if the quarter is in the 4-month
window after the FTC press-release statement and I(preFTC) is 1 if the quarter is in the
4-month widnow before the FTC press-release.4 We define the average category price, p̄st,
as the weekly sales-volume weighted average across all brands in a given store, i.e.
p̄st =∑j∈Jst
vjst∑k vkst
pjst
where vjst is the sales volume of brand j sold in store s in week t, Jst is the set of all
brands sold in store s that week.
We perform a placebo test to test if the difference (βpost − βpre) |Event=FTC−(βpost − βpre) |Event=Placebo
is statistically significant,where Event = Placebo is defined to be 1 year before the FTC con-
sent order. We count the DMAs where this difference is positively or negatively statistically
significant. Table 4 reports, for each impacted brand in each category, the percentage of
DMAs where prices increased/decreased using this measure. These results indicate that
there is no systematic increase/decrease in prices around the timing of the FTC consent
order across a majority of the DMAs for the impacted brands.
Table 4: Percentage DMAs with Statistically Significant Changes in PriceImpacted Brand Increase Decrease Total No. DMAsKel Frosted Mini-Wheats 14% 0% 205Dannon Activia 3% 5% 204Dannon Dan Active 3% 5% 196Airborne 9% 5% 205
4We aggregate the weekly price data to the quarterly level to avoid inconsistent standard errors that canresult due to the presence of serially correlated observations (Bertrand et al 2004). Thus, the pre- and post-periods have only 1 observation per time-period.
16

Figure 9: Average Prices (per lb) of the impacted brands
5.2 Advertisements
Figure 10 plots the ad-spend by creative title for Kellogg’s Frosted Mini-Wheats from Jan.
2008 - Dec. 2009. The dotted lines indicate the advertisements relevant to the misleading
claims (all featuring children going to or in school) and the solid lines indicate other adver-
tisements. The solid black line is the envelope of total ad-spend on Frosted Mini-Wheats.
While the two creatives which started in 2008 had already stopped, the ones that started
in early 2009 were stopped following the FTC warnings5. The envelope of total ad spend
indicates that although the misleading ads were removed, the overall ad spend still remained
high. Figure 11 plots the total ad-spend across all creatives for the competitor brands: G M
Cheerios, G M Honey Cheerios and Post Honey Bunches of Oats. These figures indicate that
there was little change in total ad-spend by the focal firm or the competitor firms following
the FTC warning letter.
5The ad that restarted late 2009 had the same creative but with the voice over making much weakerclaims.
17

$0
$1,000,000
$2,000,000
$3,000,000
$4,000,000
$5,000,000
$6,000,000
$7,000,000
ANIMATED CEREAL/BOY/WOMAN/MICROWAVE BOY/ANIMATED CHARACTER/BOOKS/BOX
BOY/BOOK/ANIMATED MINI-WHEAT/TEXT CEREAL BOXES/MILK POURED/WATCHES
KID EATING CEREAL/ANIMATION KIDS WITH BACKPACKS/ANIMATED CEREAL
MAN/ANIMATED CEREAL/PHONE/PRODUCT PEOPLE IN COFFEE SHOP/WOMAN EATING
STATS/ANIMATED BOXING RING/TEXT TEACHER/CLASSROOM/STUDENTS/CEREAL
ALL
Figure 10: Frosted Mini-Wheats Ad Spend by creative-title
$0$1,000,000$2,000,000$3,000,000$4,000,000$5,000,000$6,000,000$7,000,000$8,000,000$9,000,000
Cheerios Honey Cheerios Post Honey Bunches
Figure 11: Competitor’s Ad Spend
To quantify possible changes in advertisemtns, we estimate the following regression equa-
tions for ad-spend, duration and frequency of advertisements at the brand-week level.
Adjt = γjt + γ2jt.I (FTC) + εjt
where Ad is the vector of ad-related variables {AdSpend, Duration, Frequency}and γ2jt
is the vector of coeffcients measuring any changes corresponding to the 4 month-window
after the FTC warning letter. The focal brand did not have a significant change in adver-
tisements as measured by these three variables. In the cereal category, only General Mills
Cheerios, General Mills Cinnamon Toast and Post Honey Bunches of Oats exhibited a signif-
icant increase in advertisements in this period. At this aggregate-level, competitors in other
categories had no significant change in advertisements. One caveat in the current analysis is
that it aggregates any variation across markets and creative-titles.
18
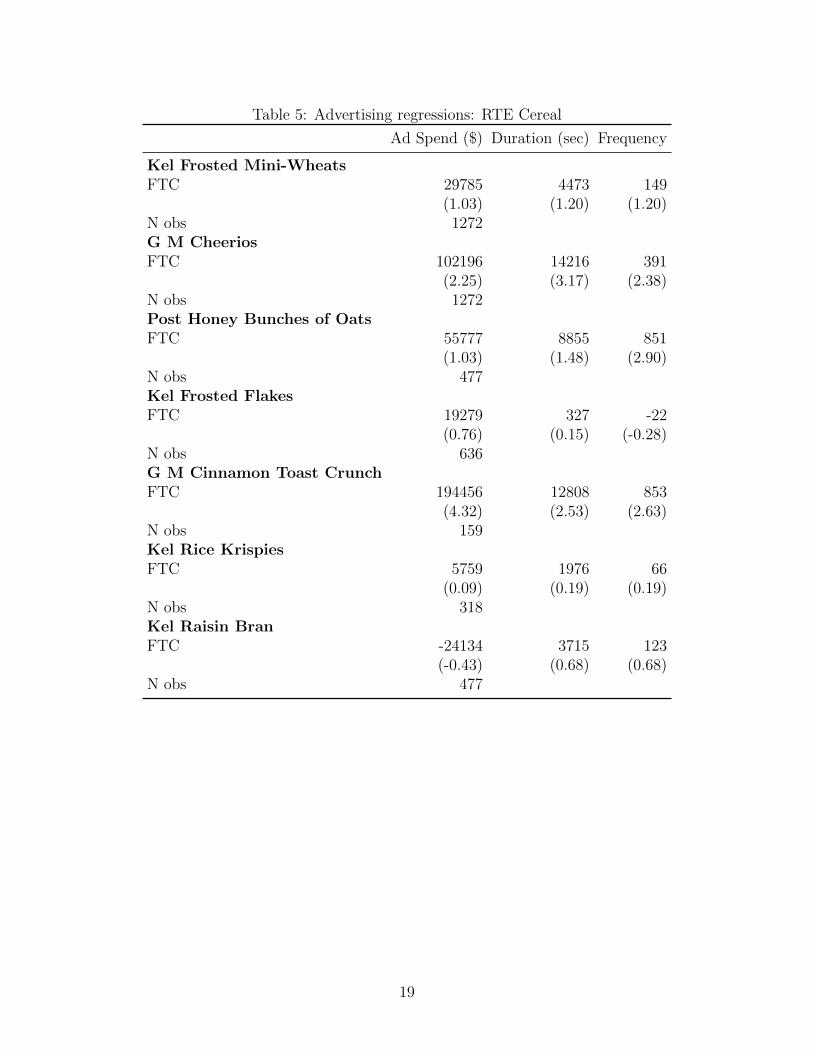
Table 5: Advertising regressions: RTE Cereal
Ad Spend ($) Duration (sec) Frequency
Kel Frosted Mini-WheatsFTC 29785 4473 149
(1.03) (1.20) (1.20)N obs 1272G M CheeriosFTC 102196 14216 391
(2.25) (3.17) (2.38)N obs 1272Post Honey Bunches of OatsFTC 55777 8855 851
(1.03) (1.48) (2.90)N obs 477Kel Frosted FlakesFTC 19279 327 -22
(0.76) (0.15) (-0.28)N obs 636G M Cinnamon Toast CrunchFTC 194456 12808 853
(4.32) (2.53) (2.63)N obs 159Kel Rice KrispiesFTC 5759 1976 66
(0.09) (0.19) (0.19)N obs 318Kel Raisin BranFTC -24134 3715 123
(-0.43) (0.68) (0.68)N obs 477
19
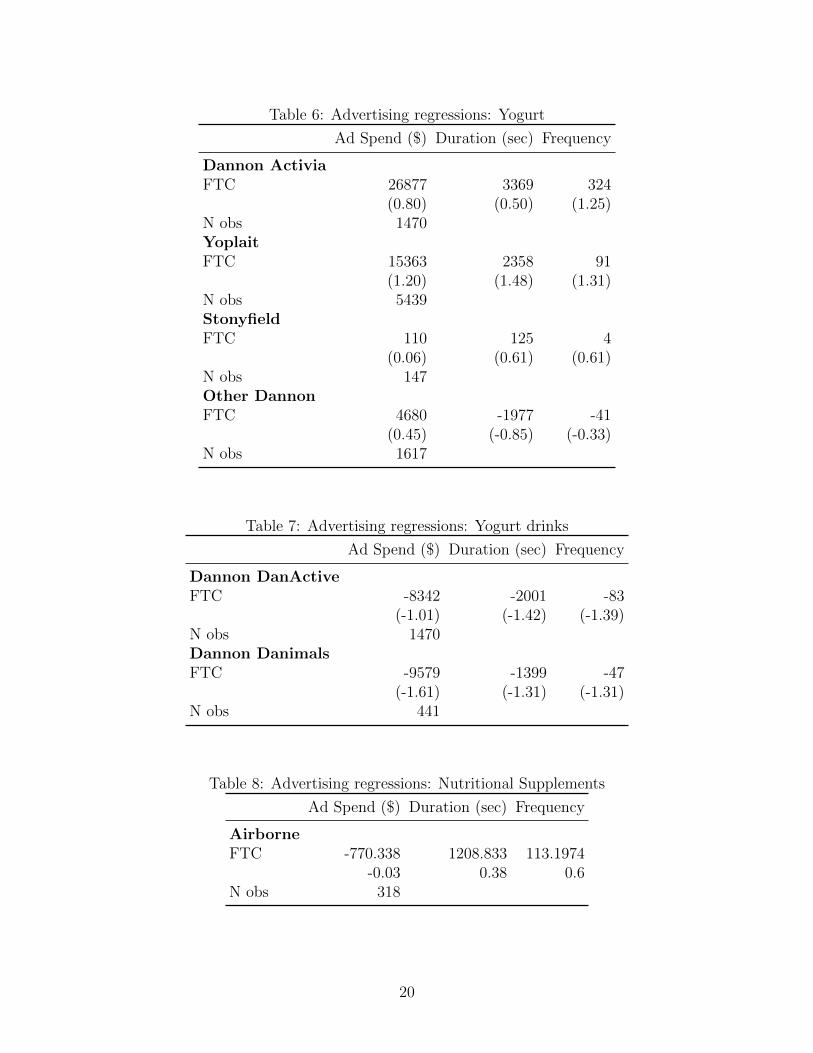
Table 6: Advertising regressions: Yogurt
Ad Spend ($) Duration (sec) Frequency
Dannon ActiviaFTC 26877 3369 324
(0.80) (0.50) (1.25)N obs 1470YoplaitFTC 15363 2358 91
(1.20) (1.48) (1.31)N obs 5439StonyfieldFTC 110 125 4
(0.06) (0.61) (0.61)N obs 147Other DannonFTC 4680 -1977 -41
(0.45) (-0.85) (-0.33)N obs 1617
Table 7: Advertising regressions: Yogurt drinks
Ad Spend ($) Duration (sec) Frequency
Dannon DanActiveFTC -8342 -2001 -83
(-1.01) (-1.42) (-1.39)N obs 1470Dannon DanimalsFTC -9579 -1399 -47
(-1.61) (-1.31) (-1.31)N obs 441
Table 8: Advertising regressions: Nutritional Supplements
Ad Spend ($) Duration (sec) Frequency
AirborneFTC -770.338 1208.833 113.1974
-0.03 0.38 0.6N obs 318
20
5.3 Availability
Following the FTC consent order, the impacted products might be out-of-stock in stores
(for e.g. manufacturers may need a few weeks to replace the packaging of their existing
products). Lack of availability of the impacted products can explain the patterns observed
in the data. To ensure that demand side factors, and not product stock-outs, drive the decline
in market shares following the FTC consent order, we check for discontinuity patterns in store
availability.
An observation in the RMS data can be missing if 1) the store did not report sales of the
UPC that week: This, if it occurs, should occur randomly and not systematically after the
FTC consent order, 2) the UPC had no sales in that store-week and 3) the product was not
available. While separating out (2) and (3) is hard given the data, we take advantage of the
fact that stock-outs, if they occur, should effect the entire brand and not just a single UPC.
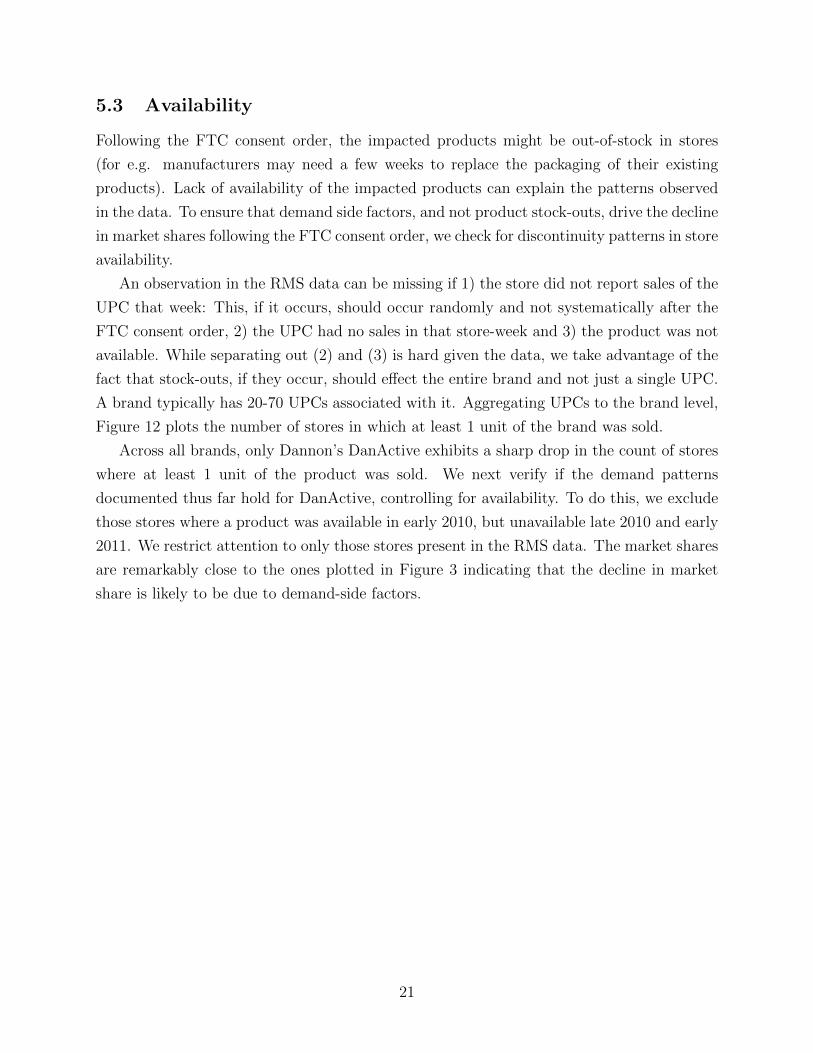
A brand typically has 20-70 UPCs associated with it. Aggregating UPCs to the brand level,
Figure 12 plots the number of stores in which at least 1 unit of the brand was sold.
Across all brands, only Dannon’s DanActive exhibits a sharp drop in the count of stores
where at least 1 unit of the product was sold. We next verify if the demand patterns
documented thus far hold for DanActive, controlling for availability. To do this, we exclude
those stores where a product was available in early 2010, but unavailable late 2010 and early
2011. We restrict attention to only those stores present in the RMS data. The market shares
are remarkably close to the ones plotted in Figure 3 indicating that the decline in market
share is likely to be due to demand-side factors.
21
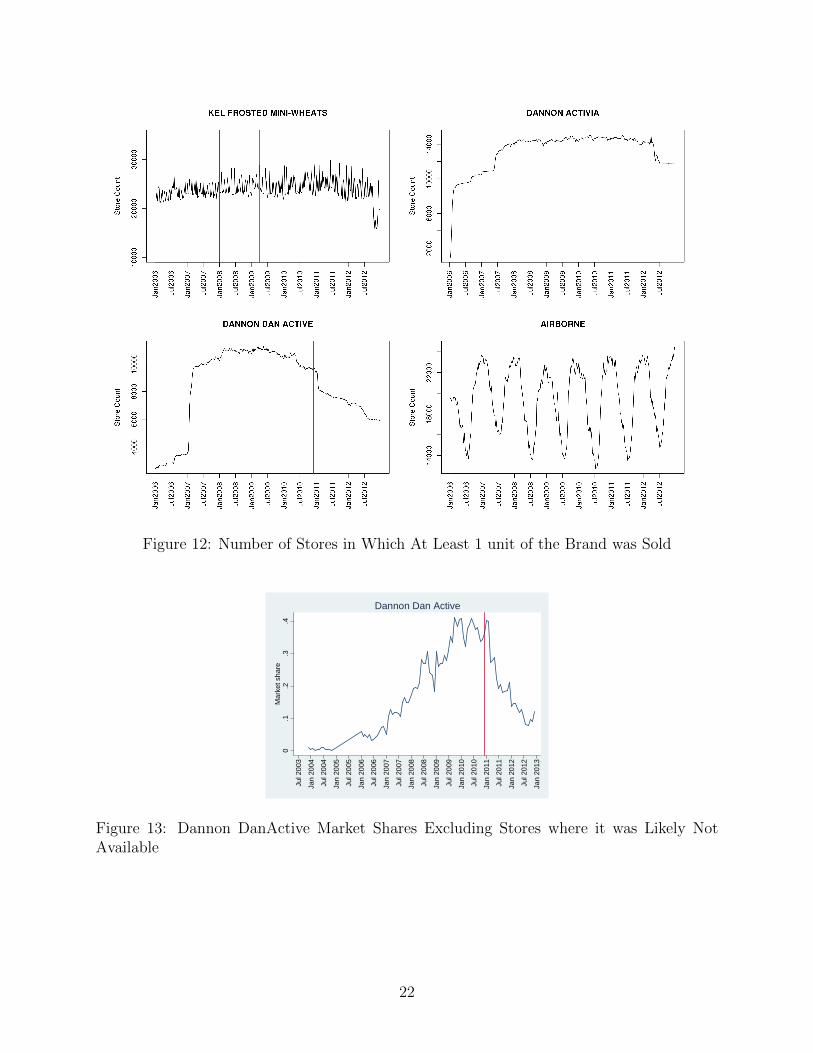
Figure 12: Number of Stores in Which At Least 1 unit of the Brand was Sold
0.1
.2.3
.4M
arke
t sha
re
Jul 2
003
Jan
2004
Jul 2
004
Jan
2005
Jul 2
005
Jan
2006
Jul 2
006
Jan
2007
Jul 2
007
Jan
2008
Jul 2
008
Jan
2009
Jul 2
009
Jan
2010
Jul 2
010
Jan
2011
Jul 2
011
Jan
2012
Jul 2
012
Jan
2013
Dannon Dan Active
Figure 13: Dannon DanActive Market Shares Excluding Stores where it was Likely NotAvailable
22
6 Conclusion
This paper finds that false claims can have a significant impact on consumer demand from
the evidence that termination of these claims led to a decline in consumer demand. While
introduction of these claims in firms’ packaging and advertising messages is likely to be
endogenous, the termination of these claims was an exogenous event driven by the efforts of
the FTC. We exploit this exogenous event and measure market shares and individual-level
purchase behaviors before and after this event controlling for time-trends and brand fixed
effects. We also find evidence suggesting that response to the termination of the false claims
is heterogenous: our preliminary findings indicate that it is the new-comers that are most
impacted by these false claims and persist in their purchases even after the false claims have
been removed.
This effect is an aggregate of consumer responses to the termination of the claims as well
as possible strategic firm-side responses in terms of price and advertisement changes. The
firm-side data provide some evidence that competitors as well as the parent brand of the
impacted product respond with price declines in certain DMAs.
23

References
[1] Bertrand, M., E. Duflo, S. Mullainathan (2004), “How Much Should We Trust
Differences-In-Differences Estimates?”, The Quarterly Journal of Economics, 119 (1),
249-275.
[2] Bronnenberg, B.J., J.P. Dube, M. Gentzkow and J.M. Shapiro (2013), “Do Pharmacists
Buy Bayer? Sophisticated Shoppers and the Brand Premium”, working paper, Chicago
Booth
[3] Burke,R.R., W. S. DeSarbo, R. L. Oliver and T. S. Robertson (1988), “Deception by
Implication: An Experimental Investigation”, Journal of Consumer Research, 14(4),
483-494
[4] Darke, P.R and R.J.B. Ritchie (2007), “The Defensive Consumer: Advertising Decep-
tion, Defensive Processing, and Distrust”, Journal of Marketing Research, 44, 114-127
[5] Dyer R.F and P.G. Kuehl (1978), “A Longitudinal Study of Corrective Advertising”,
Journal of Marketing Research, 15, 39-48
[6] Ippolito, P.M and A.D. Mathios (1990), “Information, Advertising and Health Choices:
A Study of the Cereal Market”, The RAND Journal of Economics, 21(3), 459-480
[7] (1995), “Information and Advertising: The Case of Fat Consumption in the United
States”, The American Economic Review, 85(2), 91-95
[8] Jin, G. and A. Kato (2006), “Price, Quality, and Reputation: Evidence from an Online
Field Experiment.” The RAND Journal of Economics, 37(4), 983-1005
[9] Jin, G. and P. Leslie (2003), “The Effects of Information on Product Quality: Evidence
from Restaurant Hygiene Grade Cards”, Quarterly Journal of Economics, 118(2), 409-51
[10] Johar, G.V. (1995), “Consumer Involvement and Deception from Implied Advertising
Claims”, Journal of Marketing Research, 32(3), 267-279
[11] Moorman, C. (1996), “A Quasi Experiment to Assess the Consumer and Informational
Determinants of Nutrition Information Processing Activities: The Case of the Nutrition
Labeling and Education Act”, Journal of Public Policy & Management, 15 (1), 28-44
[12] Moorman, C., R. Ferraro and J. Huber (2012), “Unintended Nutrition Consequences:
Firm Responses to the Nutrition Labeling and Education Act”, Marketing Science,
31(5), 717-737
24
[13] Nelson, P. (1970), “Information and Consumer Behavior”, Journal of Political Economy,
Vol. 78 (2), 311-329
[14] Roe,B., A. S. Levy and B. M. Derby (1999), “The Impact of Health Claims on Consumer
Search and Product Evaluation Outcomes: Results from FDA Experimental Data”,
Journal of Public Policy & Marketing, 18(1), 89-105
[15] Peltzman, S. (1981), “The Effects of FTC Advertising Regulation”, Journal of Law and
Economics, 24 (3), 403-48
[16] Rossi, P.E, R. E. McCulloch and G. M. Allenby (1996): “The Value of Purchase History
Data in Target Marketing”, Marketing Science, 15 (4), 321-340
[17] Stigler, L. (1961), “The Economics of Information”, Journal of Political Economy, Vol.
69 (3), 213-225
[18] Zinman, J. and Zitzewitz, Z. (2013), “Wintertime for Deceptive Advertising”, working
paper, Dartmouth College
25
A Demand Estimates
Table 9: Demand Estimates: RTE CerealS1 S2 S3
Coeff t-stat Coeff t-stat Coeff t-statKel Frosted Mini-WheatsFalse Claims αfalse -1.994 (-138.44) -2.434 (-139.89) -2.429 (-133.73)
βfalse 0.037 (27.67) 0.034 (24.01) 0.034 (23.63)FTC αftc -2.159 (-152.57) -2.564 (-153.45) -2.562 (-141.64)
βftc -0.008 (-15.47) -0.017 (-27.92) -0.016 (-26.57)G M CheeriosFalse Claims αfalse -2.799 (-143.98) -0.660 (-23.34) -0.646 (-21.23)
βfalse -0.012 (-8.38) -0.073 (-48.06) -0.073 (-47.91)FTC αftc -2.744 (-150.96) -1.035 (-41.43) -1.021 (-36.71)
βftc -0.005 (-7.51) -0.004 (-6.96) -0.004 (-7.07)G M Honey Nut CheeriosFalse Claims αfalse -2.817 (-142.21) -1.726 (-78.80) -1.716 (-72.45)
βfalse 0.004 (2.58) 0.000 (-0.13) 0.000 (-0.31)FTC αftc -2.763 (-162.90) -1.868 (-100.72) -1.859 (-87.73)
βftc 0.002 (4.20) 0.023 (40.22) 0.023 (39.25)Post Honey Bunches of OatsFalse Claims αfalse -3.065 (-134.07) -3.010 (-127.33) -3.000 (-121.99)
βfalse -0.025 (-15.25) -0.005 (-3.05) -0.006 (-3.19)FTC αftc -2.860 (-144.18) -2.785 (-136.45) -2.772 (-124.44)
βftc -0.007 (-9.69) -0.015 (-19.66) -0.015 (-19.19)Kel Frosted FlakesFalse Claims αfalse -3.040 (-147.38) -2.797 (-142.38) -2.782 (-132.40)
βfalse 0.025 (14.33) 0.032 (18.98) 0.032 (18.87)FTC αftc -3.188 (-168.88) -3.328 (-170.92) -3.313 (-156.11)
βftc 0.001 (1.62) 0.034 (46.42) 0.034 (45.39)G M Cinnamon Toast CrunchFalse Claims αfalse -3.418 (-140.40) -2.801 (-112.25) -2.787 (-105.09)
βfalse 0.000 (0.23) -0.012 (-5.89) -0.013 (-5.97)FTC αftc -3.330 (-162.53) -2.814 (-136.96) -2.799 (-120.71)
βftc 0.000 (-0.05) 0.014 (18.98) 0.014 (18.63)Kel Rice KrispiesFalse Claims αfalse -3.572 (-153.51) -2.486 (-100.00) -2.474 (-92.23)
βfalse 0.003 (1.55) -0.028 (-13.67) -0.028 (-13.70)FTC αftc -3.491 (-156.98) -2.527 (-111.83) -2.520 (-99.81)
βftc -0.007 (-9.18) -0.009 (-11.22) -0.009 (-10.53)Kel Raisin BranFalse Claims αfalse -3.497 (-144.31) -4.615 (-154.05) -4.598 (-153.27)
βfalse 0.011 (5.03) 0.008 (3.68) 0.008 (3.57)FTC αftc -3.422 (-161.60) -4.605 (-165.63) -4.590 (-164.34)
βftc -0.003 (-3.70) -0.005 (-5.87) -0.005 (-5.54)CTL BR Frosted Mini-WheatsFalse Claims αfalse -3.896 (-105.21) -5.707 (-125.13) -5.762 (-121.77)
βfalse -0.002 (-0.72) -0.010 (-3.44) -0.010 (-3.46)FTC αftc -3.985 (-124.28) -5.782 (-140.96) -5.838 (-136.25)
βftc 0.006 (5.31) 0.002 (1.48) 0.002 (1.60)
Log Likelihood -6,382,328 -5,240,808 -5,240,736Prices Yes YesAds YesN hh 44,544N obs 5,177,394Cluster Household
26
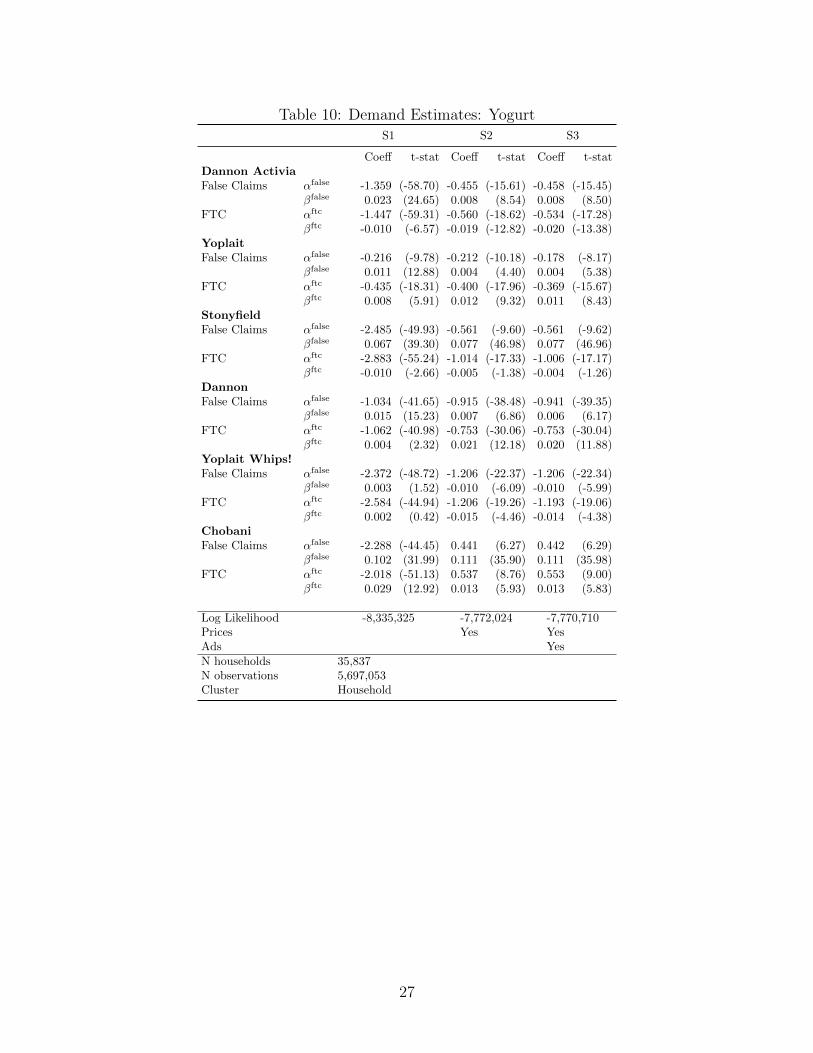
Table 10: Demand Estimates: YogurtS1 S2 S3
Coeff t-stat Coeff t-stat Coeff t-statDannon ActiviaFalse Claims αfalse -1.359 (-58.70) -0.455 (-15.61) -0.458 (-15.45)
βfalse 0.023 (24.65) 0.008 (8.54) 0.008 (8.50)FTC αftc -1.447 (-59.31) -0.560 (-18.62) -0.534 (-17.28)
βftc -0.010 (-6.57) -0.019 (-12.82) -0.020 (-13.38)YoplaitFalse Claims αfalse -0.216 (-9.78) -0.212 (-10.18) -0.178 (-8.17)
βfalse 0.011 (12.88) 0.004 (4.40) 0.004 (5.38)FTC αftc -0.435 (-18.31) -0.400 (-17.96) -0.369 (-15.67)
βftc 0.008 (5.91) 0.012 (9.32) 0.011 (8.43)StonyfieldFalse Claims αfalse -2.485 (-49.93) -0.561 (-9.60) -0.561 (-9.62)
βfalse 0.067 (39.30) 0.077 (46.98) 0.077 (46.96)FTC αftc -2.883 (-55.24) -1.014 (-17.33) -1.006 (-17.17)
βftc -0.010 (-2.66) -0.005 (-1.38) -0.004 (-1.26)DannonFalse Claims αfalse -1.034 (-41.65) -0.915 (-38.48) -0.941 (-39.35)
βfalse 0.015 (15.23) 0.007 (6.86) 0.006 (6.17)FTC αftc -1.062 (-40.98) -0.753 (-30.06) -0.753 (-30.04)
βftc 0.004 (2.32) 0.021 (12.18) 0.020 (11.88)Yoplait Whips!False Claims αfalse -2.372 (-48.72) -1.206 (-22.37) -1.206 (-22.34)
βfalse 0.003 (1.52) -0.010 (-6.09) -0.010 (-5.99)FTC αftc -2.584 (-44.94) -1.206 (-19.26) -1.193 (-19.06)
βftc 0.002 (0.42) -0.015 (-4.46) -0.014 (-4.38)ChobaniFalse Claims αfalse -2.288 (-44.45) 0.441 (6.27) 0.442 (6.29)
βfalse 0.102 (31.99) 0.111 (35.90) 0.111 (35.98)FTC αftc -2.018 (-51.13) 0.537 (8.76) 0.553 (9.00)
βftc 0.029 (12.92) 0.013 (5.93) 0.013 (5.83)
Log Likelihood -8,335,325 -7,772,024 -7,770,710Prices Yes YesAds YesN households 35,837N observations 5,697,053Cluster Household
27
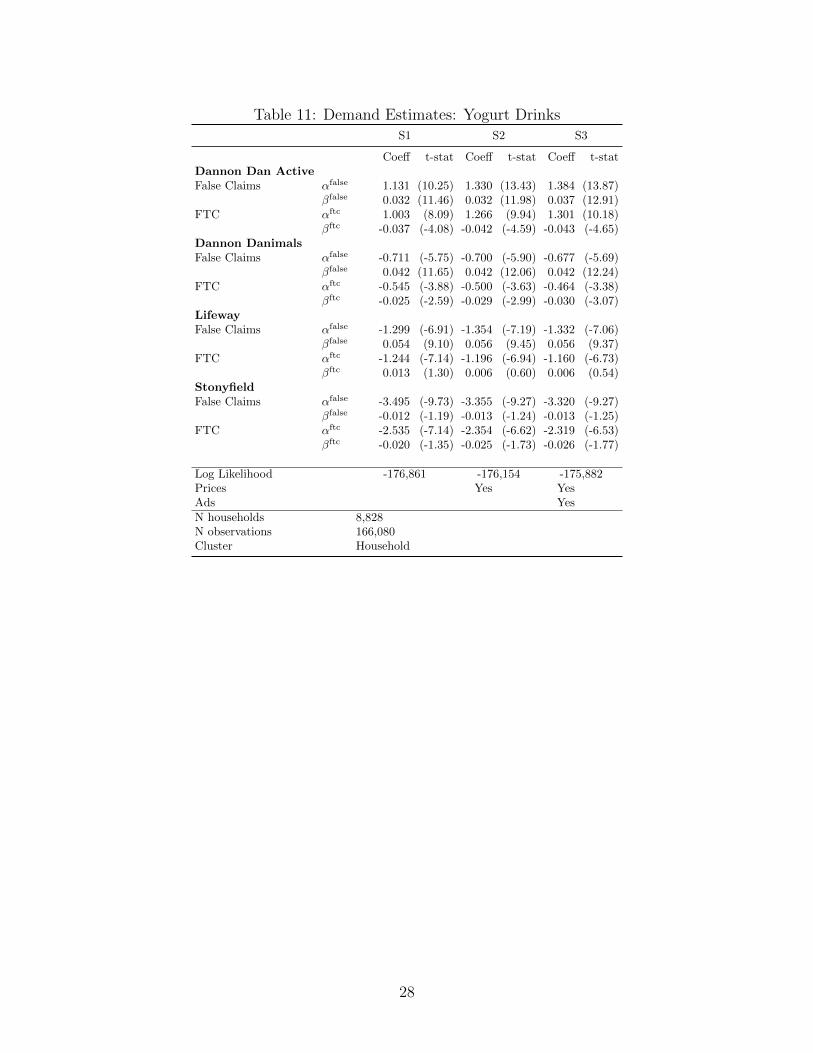
Table 11: Demand Estimates: Yogurt DrinksS1 S2 S3
Coeff t-stat Coeff t-stat Coeff t-statDannon Dan ActiveFalse Claims αfalse 1.131 (10.25) 1.330 (13.43) 1.384 (13.87)
βfalse 0.032 (11.46) 0.032 (11.98) 0.037 (12.91)FTC αftc 1.003 (8.09) 1.266 (9.94) 1.301 (10.18)
βftc -0.037 (-4.08) -0.042 (-4.59) -0.043 (-4.65)Dannon DanimalsFalse Claims αfalse -0.711 (-5.75) -0.700 (-5.90) -0.677 (-5.69)
βfalse 0.042 (11.65) 0.042 (12.06) 0.042 (12.24)FTC αftc -0.545 (-3.88) -0.500 (-3.63) -0.464 (-3.38)
βftc -0.025 (-2.59) -0.029 (-2.99) -0.030 (-3.07)LifewayFalse Claims αfalse -1.299 (-6.91) -1.354 (-7.19) -1.332 (-7.06)
βfalse 0.054 (9.10) 0.056 (9.45) 0.056 (9.37)FTC αftc -1.244 (-7.14) -1.196 (-6.94) -1.160 (-6.73)
βftc 0.013 (1.30) 0.006 (0.60) 0.006 (0.54)StonyfieldFalse Claims αfalse -3.495 (-9.73) -3.355 (-9.27) -3.320 (-9.27)
βfalse -0.012 (-1.19) -0.013 (-1.24) -0.013 (-1.25)FTC αftc -2.535 (-7.14) -2.354 (-6.62) -2.319 (-6.53)
βftc -0.020 (-1.35) -0.025 (-1.73) -0.026 (-1.77)
Log Likelihood -176,861 -176,154 -175,882Prices Yes YesAds YesN households 8,828N observations 166,080Cluster Household
28

Table 12: Demand Estimates: Nutritional SupplementsS1 S2 S3
Coeff t-stat Coeff t-stat Coeff t-statAirborneFalse Claims αfalse -0.851 (-32.00) -0.852 (-31.19) -0.887 (-22.63)
αfalse,notFlu -1.048 (-39.79) -1.075 (-40.69) -1.056 (-32.63)FTC αftc -1.405 (-46.83) -1.405 (-46.06) -1.471 (-40.03)
αftc,notFlue -1.017 (-29.82) -1.038 (-28.82) -1.001 (-24.18)Nature MadeFalse Claims αfalse -2.223 (-48.44) -2.223 (-48.34) -2.259 (-39.74)
αfalse,notFlu -0.085 (-2.62) -0.072 (-2.25) -0.052 (-1.39)FTC αftc -2.161 (-62.95) -2.161 (-62.83) -2.232 (-50.75)
αftc,notFlue -0.061 (-2.64) -0.051 (-2.16) -0.008 (-0.26)Nature’s BountyFalse Claims αfalse -2.727 (-43.70) -2.727 (-43.56) -2.763 (-38.10)
αfalse,notFlu -0.011 (-0.25) -0.019 (-0.42) 0.001 (0.03)FTC αftc -2.306 (-49.97) -2.306 (-49.78) -2.376 (-43.59)
αftc,notFlue 0.024 (0.94) 0.036 (1.39) 0.079 (2.44)
Log Likelihood -243,921 -243,892 -243,839Prices Yes YesAds YesN households 10,738N observations 279,679Cluster Household
29

B Heterogenous Demand Estimates
Table 13: Heterogenous Demand Estimates: RTE CerealLoyal: θloy New: θnew
Coeff t-stat Coeff t-statKel Frosted Mini-WheatsFalse Claims αfalse -0.876 (-37.56) 0.039 (1.22)
βfalse 0.012 (6.42) 0.051 (16.38)FTC αftc -0.875 (-36.65) -0.149 (-4.87)
βftc -0.019 (-20.67) 0.004 (3.45)G M CheeriosFalse Claims αfalse 0.629 (17.56) -0.187 (-4.92)
βfalse -0.070 (-35.36) -0.024 (-7.97)FTC αftc 0.448 (13.21) -0.059 (-1.66)
βftc -0.007 (-7.66) 0.000 (-0.38)G M Honey Nut CheeriosFalse Claims αfalse -0.292 (-9.28) -0.115 (-2.89)
βfalse -0.012 (-5.54) -0.004 (-1.01)FTC αftc -0.211 (-7.52) -0.090 (-2.78)
βftc 0.019 (21.44) 0.000 (0.20)Post Honey Bunches of OatsFalse Claims αfalse -1.501 (-45.90) -0.235 (-4.93)
βfalse -0.012 (-5.59) -0.014 (-3.99)FTC αftc -1.246 (-40.01) -0.115 (-2.80)
βftc -0.014 (-12.77) 0.001 (0.90)Kel Frosted FlakesFalse Claims αfalse -1.404 (-46.28) 0.022 (0.54)
βfalse 0.021 (9.21) 0.006 (1.74)FTC αftc -1.787 (-60.42) -0.008 (-0.21)
βftc 0.032 (28.86) 0.001 (1.04)G M Cinnamon Toast CrunchFalse Claims αfalse -1.412 (-38.52) 0.010 (0.21)
βfalse -0.024 (-8.84) -0.002 (-0.38)FTC αftc -1.281 (-38.12) 0.062 (1.53)
βftc 0.008 (7.07) 0.002 (1.42)Kel Rice KrispiesFalse Claims αfalse -1.137 (-31.64) -0.040 (-0.86)
βfalse -0.037 (-14.08) 0.000 (-0.11)FTC αftc -1.056 (-30.88) 0.065 (1.62)
βftc -0.011 (-9.35) 0.000 (-0.11)Kel Raisin BranFalse Claims αfalse -3.025 (-82.39) -0.146 (-2.85)
βfalse -0.001 (-0.27) -0.003 (-0.58)FTC αftc -2.889 (-83.93) -0.133 (-2.97)
βftc -0.007 (-5.94) 0.002 (1.05)CTL BR Frosted Mini-WheatsFalse Claims αfalse -2.264 (-43.21) -0.154 (-2.01)
βfalse 0.008 (2.17) -0.004 (-0.74)FTC αftc -2.065 (-42.43) -0.131 (-2.00)
βftc -0.008 (-4.94) 0.000 (0.17)
Log Likelihood -5,718,196Prices YesAds YesN hh 44,544N obs 5,177,394*Note: the parameters for those who did not purchase prior to the claim: θloy + θnew
30