Embed Size (px)
Citation preview
AGRICULTURAL ECONOMICS
ELSEVIER Agricultural Economics 11 (1994) 207-217
Demand for food in Myanmar (Burma)
T. Soe I, R.L. Batterham *, R.G. Drynan Department of Agricultural Economics, University of Sydney, N.S. W 2006, Australia
Accepted 19 April 1994
Abstract
Aggregate quarterly time series data from 1975 to 1987 on government procurement prices and open (black) market prices were used in estimating an almost ideal demand system (AIDS) and double-log models for consumption of foodstuffs in Myanmar. The results from the AIDS model were superior to those from the double-log models.
The estimated income elasticity of demand for non-meat foodstuffs was high, even for low-quality rice, which has been shown to be an inferior good in other Asian countries. The income elasticities for the non-cereals (groundnut oil, sesame oil, pulses, potato and onion) are positive and less than one. Contrary to expectation, the income elasticities for all meat items are low. Own-price elasticities for most foodstuffs were less than one. The estimated cross-price elasticities indicate the complementary nature of the basic food items to rice.
A brief analysis of the effects of taxing Myanmarese rice exports and subsidising consumers indicated that there are net costs to government, unevenly distributed welfare gains to consumers and welfare losses to farmers.
1. Introduction
The economy of Myanmar is agrarian in nature with production, consumption and export activities dominated by basic foods. Food produc- · tion engages about 80% of the total work force, with rice production occupying approximately half of the total cultivated area and employing around 70% of the work force. Until the early 1960s, Myanmar had a relatively prosperous economy and was a leading rice producer and exporter.
* Corresponding author. 1 Present address: Institute of Economics, Yangon, Myan
mar, Burma.
The period from independence in 1948 to 1962 was characterised by food self-sufficiency and increasing volumes of trade. In 1962, the Revolutionary Council assumed power and adopted a number of principles of central economic planning. Myanmar is now barely self-sufficient in rice and basic foodstuffs.
Prior to 1962, government policies focussed on the procurement of rice for export purposes. The Revolutionary Council extended the functions of the State Agricultural Marketing Board, established in 1946 to officially procure rice for the government, to include the procurement of other 'planned crops' for the domestic and export markets (Than and Nishizawa, 1990, p. 93). Consumer subsidies were applied to some foodstuffs
0169-5150/94/$07.00 © 1994 Elsevier Science B.V. All rights reserved SSDI 0 169-5150(94 )00014-S
208 T. Soe et al. 1 Agricultural Economics 11 (1994) 207-217
such as low-grade rice, and taxes were imposed on exported commodities. The procured low-quality rice however, met only about one third of domestic needs. The remaining rice and other food requirements were met by various forms of legal or 'open' and 'illegal black market' operations. Rice sold on illegal markets consisted of both low-quality rice originally sold on the controlled market, and high-quality rice diverted from export procurement and special ration markets. Through time, the operations of these markets have become increasingly blurred.
The objective of this study is to fill a gap in the literature by first estimating demand functions for a range of important foodstuffs for Myanmar. The results from these estimations are presented in the form of elasticities. These estimates are then used to calculate the effects on consumer and producer welfare of official policies relating to rice in Myanmar since 1962. Although specific to Myanmar, the difficulties posed by this study and the results generated have important implications for other developing nations.
As with other empirical demand studies, this analysis adopts a number of simplifying assumptions. First, consumption per person is assumed to be reflected in a representative consumer whose behaviour is described by theory. Second, quantity variables are assumed to be endogenous and the prices at retail predetermined (Tomek and Robinson, 1972). Third, although both income distribution and savings are likely to affect food consumption, due to data limitations it is assumed that there was no change in income distribution over the study period and that consumers spent all their income. These assumptions seem realistic for Myanmar over the period 1975-1987 considered in the demand analysis. Real income levels for the large majority of consumers were low and stable over the period, with very little saving (Than and Tan, 1990; Thein, 1990). Finally, as in most demand studies, commodities, with one exception, are assumed to be homogeneous. The exception is for rice, the most important staple food. Quality variation in rice is well-recognised by consumers, and their purchasing behaviour cannot be properly modelled without recognising this variation. Several different
rice products (namely high, low and average-quality rice), each taken as homogeneous, were defined and included in various formulations of the models.
For the purpose of analysis in the current study, there are a number of Myanmarese food preparation methods and consumption patterns of interest. For example, eating higher-quality rather than lower-quality food in Myanmar is highly regarded for the status attached to it by the Buddhist religion. There are, too, well-defined seasonal festivals associated with religion and culture. These are associated with distinct patterns of food consumption in Myanmar. In addition, food preparation is such that any main or side dish prepared usually requires well-defined food items in fixed proportions. Basic food items such as cooking oil, onion, garlic, salt and spices are used as complements to rice. Together, these features can be expected to influence demand patterns considerably.
2. Model selection
On the basis of criteria laid out by Fuss et al. (1978) and Gujarati (1988), two demand systems were chosen to model the food demand relationships in Myanmar: the more theoretically appealing Almost Ideal Demand System (AIDS) model (Deaton and Muellbauer, 1980), and the more pragmatic, but simpler approach of separate double-log demand equations.
The AIDS model is derived from an expenditure or cost function and is not based on an explicit consumer utility function. Thus unless
· restrictions are placed on the parameter estimates, an estimated AIDS model is not necessarily wholly consistent with any utility function. For example, although homogeneity and symmetry restrictions are implied by demand theory, they often do not hold in empirical studies. The AIDS model is flexible enough to allow homogeneity and symmetry conditions to be tested for or imposed during estimation if required, while simultaneously enforcing other less questionable theoretical demand properties (Delforce, 1989b, pp. 2-3). Even when demand theory restrictions are
T. Soe et al. /Agricultural Economics 11 (1994) 207-217 209
fully met, the AIDS model is sufficiently general to avoid some of the rigidity problems (e.g. additivity) encountered in other demand systems derived from overly-simple utility functions.
The explanatory power of the AIDS model has been recognised in demand studies conducted for both developed and developing countries. The approach has been used in demand studies of India (Ray, 1980; Majumder, 1986), studies of household expenditure patterns in Burkina Faso (Savadogo and Brandt, 1988) and Tonga (Delforce, 1989a). The approach has also been applied to food demand studies in North American households' (Capps et al., 1985; Goddard, 1983), Greece (Mergos and Donatos, 1989), France (Fulponi, 1989) and the United States (Eales and Unnevehr, 1988).
The double-log model is less consistent with demand theory and imposes rigidity of its own, e.g. constant elasticities. Nevertheless, it is convenient and time saving for its parsimony in parameters, ease of computation and interpretation. The explanatory power of the double-log model, as evidenced by some previous studies (Fisher, 1979; de Vega, 1981), can also be reasonably good. In the event, the estimates generated by the AIDS model in this study were found to be significantly better than those from the double-log model. Consequently, the results presented and discussed in this paper relate only to the AIDS specification.
Consumption of food items in this study is generally assumed to depend only on three factors: prices, income and seasonal influences as mentioned earlier. The latter are proxied by quarterly dummy variables. It is assumed that there have been no major shifts in individual consumer demand for foodstuffs during the study period 1•
2.1. Specification of the AIDS model
The AIDS model used in the study broadly corresponds to those used in Fulponi (1989),
1 A more detailed outline of the demand model is found in Soe (1991).
Mergos and Donatos (1989), Delforce (1989a,b), Chalfant and Alston (1986) and Alston and Chalfant (1987). The true AIDS model is a non-linear model and thus relatively difficult to estimate. The model estimated in the current study is a linear approximation of the strict AIDS model (LA/ AIDS), and is derived by substituting the known Stone price index (p*) for the parameterdependent non-linear price index (p) used in the true AIDS model (Deaton and Muellbauer, 1980).
The LA/ AIDS form of the estimated equation for non-meat basic food items, including seasonal dummy variables takes the form:
( 1)
where the subscripts i and j, ranging from 1 to 12, denote rice, wheat flour, groundnut oil, sesame oil, pulses, potato, onion, garlic, chilli, salt, sugar and coffee, respectively. The variables are defined as follows: W;nm is the income (expenditure) share of non-meat basic food i (i = 1, ... , 12); ln pj is the log price of non-meat basic food (j =
1, ... , 12) (kyats/kg) per quarter; lnY is log income (expenditure) (kyats/person) per quarter; p* is a composite price index (Stone's price index); and D 1 is a seasonal dummy (0-1) variable with a 1 representing the tth quarter (t = 2, 3 and 4); and afm, f3J't, yfm and O;~m are the parameters to be estimated.
For meat items, the corresponding model is:
wk' = ak' + '£sf3'ks In Ps + Yk' In( Y jp*) + okrDt (2)
where the subscripts k and s, ranging from 1 to 7, denote beef, pork, chicken, duck, fish, mutton and goat-meat. The variables have meanings analogous to those in Eq. 1.
The 'income' variable used in the model is either, the specific food-group (e.g. meat) expenditure, or a broader expenditure variable or income. In the latter case, the consumer price index (CPI) is included as an additional price variable as a proxy for the 'other food prices' omitted from the particular food group being studied.
210 T Soe et al. /Agricultural Economics 11 (1994) 207-217
2.2. Data sources
Lack of reliable data is a major impediment to any detailed analysis of food consumption patterns in Myanmar. In the present study aggregate quarterly time-series data consisting of 51 observations from 1975(1) to 1987(3) were used. The data on non-meat basic foods were for Myanmar as a whole, while the meat data were for 70 townships as specified by the Central Statistical Organisation. The basic data were compiled from various primary sources 2 . The main sources of data are the publications and records of the Central Statistical Organisation, the Ministry of National Planning and Finance, the Agricultural Corporation, and the Agriculture and Farm Produce Trade Corporation.
For the regression analysis, all data were expressed in a per person andjor per unit per quarter basis. Real prices and income 1 expenditure were used with the consumer price index at 1969-70 prices used as the deflator.
Initially, twelve non-meat basic food items and seven meat items were considered. Rice, as noted previously, was divided into 'low-quality' rice (being the rationed rice supplied by the government), and 'high-quality' rice (being the rice available on the black market). 'Average rice' simply refers to the average of the prices for high and low-quality rice.
Both recorded income and, recorded and calculated expenditure variables were used for the 'income' variable, with the calculated expenditure figures being based on the available quantity and price data for foodstuffs. The economic and statistical quality of those regressions using the income variable were generally better than those based on expenditures. In part, this may relate to data errors, with household surveys undertaken
2 Most Myanmarese data are disorganised and scattered, and data collection for Myanmar is a formidable task. It was initially intended to undertake a household expenditure survey in Myanmar. However, the prevailing problems in the country made such a task very difficult. Thus it was decided to use time-series data. The task of data collection, compilation and processing took approximately one year.
in Myanmar indicating that the extent of over-reporting of expenditure is greater than under-reporting of income (Institute of Economics, 1978, 1979, 1982). Given this and the fact that income elasticities and constant-income price elasticities are of more use to policy makers than narrow expenditure-group based elasticities, results are reported here only for those equations based on income.
Where income rather than expenditure is used in the model, total income has two components, namely 'base income' and 'additional income'. Total income was calculated as follows:
Y* =Y+RRY
where Y* is total income; Y is 'base income'; and RRY is the 'additional income'. 'Base income' is equal to per capita income (Ministry of National Planning and Finance, various issues), and additional income represents earnings from resale of rationed rice by consumers. Resale of low-quality rationed rice being relatively common, RRY was computed as:
RRY = (ORR*PRSR)- (ORR*PPRR)
where ORR and PRSR are quantity of rationed rice and resale price, respectively; and PPRR is the purchase price of rationed rice.
For some foods, namely rice, pulses and fish, problems were encountered in using the available retail prices. Lack of data for individual varieties of these foods required some averaging of aggregate price and quantity data to obtain figures used in the model.
2.3. Method of estimation
The budget share equations were estimated simultaneously as a system of equations using the SHAZAM package (White et al., 1990, pp. 152-158). The system approach allows the imposition of demand theory restrictions and has the ability to improve the efficiency of the overall set of parameter estimates compared to single equation estimation (Beggs, 1987, pp. 14-15). It also provides information to test hypotheses about various theoretical restrictions (Phlips, 1974; Johnson et al., 1984). Against these advantages, a systems
T. Soe et al. /Agricultural Economics 11 (1994) 207-217 211
estimation approach suffers in that it is less robust to misspecification errors than single equation estimation. Because of this, and on the basis of preliminary tests and considering the relative importance of the commodities in the household budgets and diets, only parts of the two demand systems were estimated. The budget share equations for five of the non-meat basic food items (garlic, chilli, salt, coffee and sugar) were omitted. In the meat case, two relationships (mutton and goat-meat) were not included. The prices of these variables, however, were still used as explanatory factors.
Nominal price versions of the systems of equations specified in (1) and (2) were estimated in both unconstrained and constrained forms to test for homogeneity and symmetry properties. Real price models automatically satisfy homogeneity. Tests were made of symmetry in these cases. · The estimated results of the unconstrained estimation and homogeneity constrained estimation were not significantly different in any equation suggesting that the homogeneity property applies. Symmetry was found to apply in most but not all equations in both the non-meat system and the meat system for which symmetry could be tested.
2.4. Computation of elasticities of demand for the AIDS model
The estimated results from the model are presented in this paper in the form of elasticities. The formulae and procedures used for the calculation of elasticities follow Beggs (1988), Delforce (1989b), and Green and Alston (1990). The elasticities are calculated for non-meats as follows: - income elasticities
erym = rrm ;wrm + 1 (3)
own-price elasticities
eilm = {3Ilm ;wnm- ( 1 + 'Ynm) ll ll l l ( 4)
- cross-price elasticities
e'?t = f3'0m /wtm - rtmwtm /wtm (5)
The method chosen for calculation of elastici-ties when using the LA/ AIDS model is impor-
tant. In a comparison of alternative methods of calculation of the uncompensated price elasticities of demand from the LA/ AIDS model, Green and Alston (1990) ·showed that not all are correct or equally reliable. Although the own and crossprice elasticity estimates using the formulae (4) and (5) are theoretically correct for the LA/ AIDS model only when expenditure shares are exogenous, the error from using these formulae rather than the theoretically correct LA/ AIDS model formulae is likely to be small (Green and Alston, 1990, p. 444).
3. Estimated results for non-meat basic foods
The estimated elasticities generated by the LA/ AIDS model are set out in Tables 1-6. Generally speaking, the estimates exhibit the signs expected.
For non-meat basic food items, the LA/ AIDS model was estimated with three alternative specifications: Model 1 used 'base income' and average rice prices and quantities; Model 2 'new income' and high-quality rice prices and quantities; and Model 3 'base income' and prices and quantities for high and low-quality rice. For meat items, only the LA/ AIDS model using 'base income' was estimated due to data limitations.
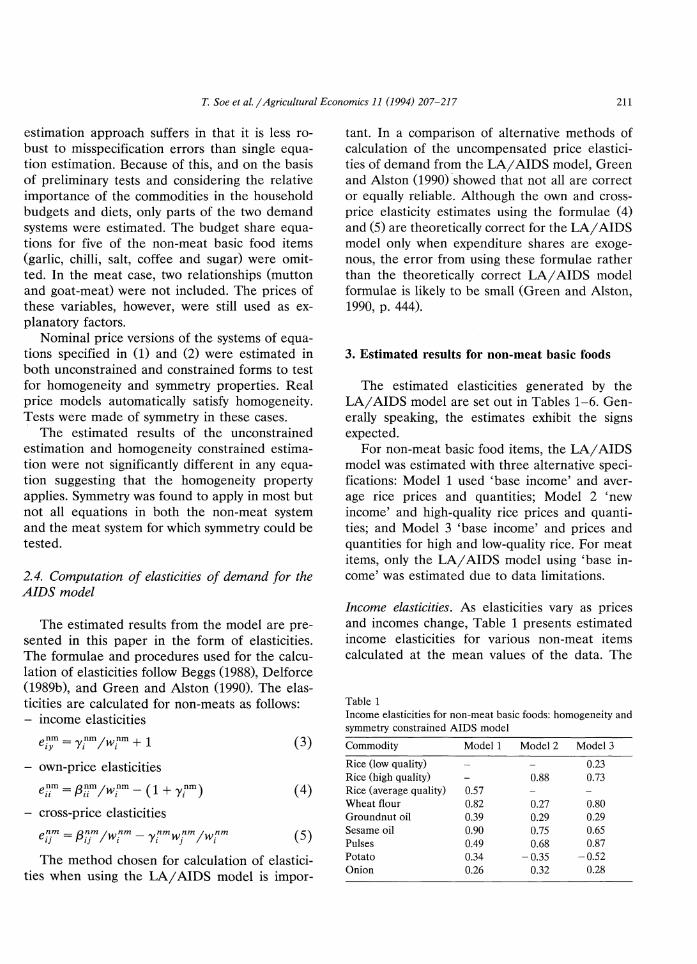
Income elasticities. As elasticities vary as prices and incomes change, Table 1 presents estimated income elasticities for various non-meat items calculated at the mean values of the data. The
Table 1 Income elasticities for non-meat basic foods: homogeneity and symmetry constrained AIDS model
Commodity Modell Model2 Model3
Rice (low quality) 0.23 Rice (high quality) 0.88 0.73 Rice (average quality) 0.57 Wheat flour 0.82 0.27 0.80 Groundnut oil 0.39 0.29 0.29 Sesame oil 0.90 0.75 0.65 Pulses 0.49 0.68 0.87 Potato 0.34 -0.35 -0.52 Onion 0.26 0.32 0.28
212 T. Soe eta/. I Agricultural Economics 11 (1994) 207-217
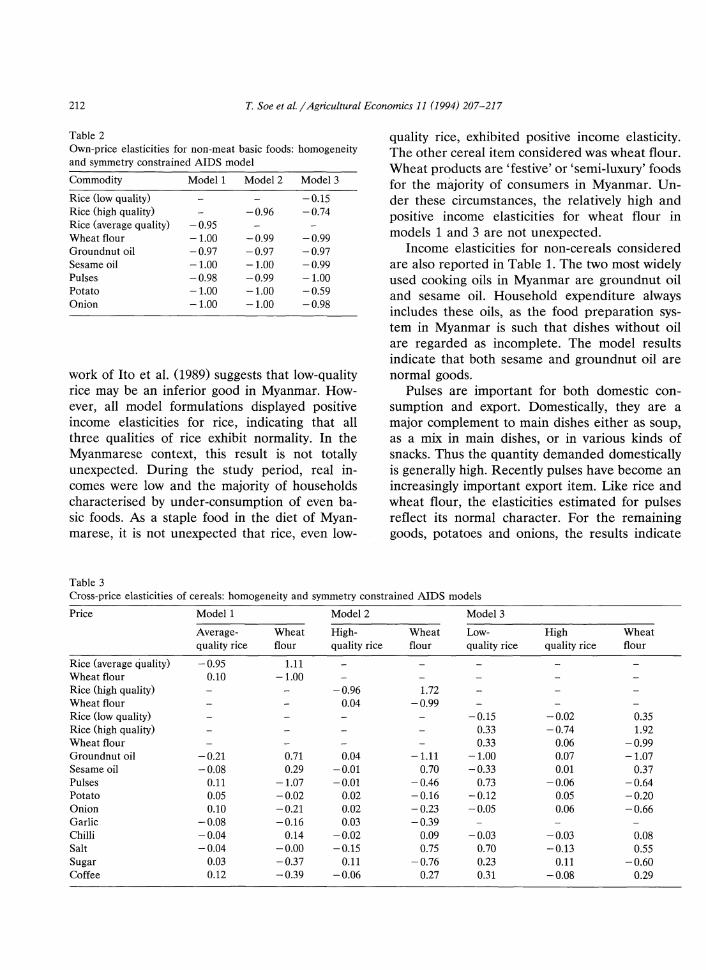
Table 2 Own-price elasticities for non-meat basic foods: homogeneity and symmetry constrained AIDS model
Commodity Modell Model2 Model3
Rice (low quality) -0.15 Rice (high quality) -0.96 -0.74 Rice (average quality) -0.95 Wheat flour -1.00 -0.99 -0.99 Groundnut oil -0.97 -0.97 -0.97 Sesame oil -1.00 -1.00 -0.99 Pulses -0.98 -0.99 -1.00 Potato -1.00 -1.00 -0.59 Onion -1.00 -1.00 -0.98
work of Ito et al. (1989) suggests that low-quality rice may be an inferior good in Myanmar. However, all model formulations displayed positive income elasticities for rice, indicating that all three qualities of rice exhibit normality. In the Myanmarese context, this result is not totally unexpected. During the study period, real incomes were low and the majority of households characterised by under-consumption of even basic foods. As a staple food in the diet of Myanmarese, it is not unexpected that rice, even low-
Table 3
quality rice, exhibited posttlve income elasticity. The other cereal item considered was wheat flour. Wheat products are 'festive' or 'semi-luxury' foods for the majority of consumers in Myanmar. Under these circumstances, the relatively high and positive income elasticities for wheat flour in models 1 and 3 are not unexpected.
Income elasticities for non-cereals considered are also reported in Table 1. The two most widely used cooking oils in Myanmar are groundnut oil and sesame oil. Household expenditure always includes these oils, as the food preparation system in Myanmar is such that dishes without oil are regarded as incomplete. The model results indicate that both sesame and groundnut oil are normal goods.
Pulses are important for both domestic consumption and export. Domestically, they are a major complement to main dishes either as soup, as a mix in main dishes, or in various kinds of snacks. Thus the quantity demanded domestically is generally high. Recently pulses have become an increasingly important export item. Like rice and wheat flour, the elasticities estimated for pulses reflect its normal character. For the remaining goods, potatoes and onions, the results indicate
Cross-price elasticities of cereals: homogeneity and symmetry constrained AIDS models
Price
Rice (average quality) Wheat flour Rice (high quality) Wheat flour Rice (low quality) Rice (high quality) Wheat flour Groundnut oil Sesame oil Pulses Potato Onion Garlic Chilli Salt Sugar Coffee
Modell
Average-quality rice
-0.95 0.10
-0.21 -0.08
0.11 0.05 0.10
-0.08 -0.04 -0.04
0.03 0.12
Model2
Wheat High-flour quality rice
1.11 -1.00
-0.96 0.04
0.71 0.04 0.29 -0.01
-1.07 -0.01 -0.02 0.02 -0.21 0.02 -0.16 0.03
0.14 -0.02 -0.00 -0.15 -0.37 0.11 -0.39 -0.06
Model3
Wheat Low- High Wheat flour quality rice quality rice flour
1.72 -0.99
-0.15 -0.02 0.35 0.33 -0.74 1.92 0.33 0.06 -0.99
-1.11 -1.00 0.07 -1.07 0.70 -0.33 O.Ql 0.37
-0.46 0.73 -0.06 -0.64 -0.16 -0.12 0.05 -0.20 -0.23 -0.05 0.06 -0.66 -0.39
0.09 -0.03 -0.03 0.08 0.75 0.70 -0.13 0.55
-0.76 0.23 0.11 -0.60 0.27 0.31 -0.08 0.29
T. Soe et al. j Agricultural Economics 11 (1994) 207-217 213
that onions are a normal good but are indeterminate with respect to potatoes.
Own-price elasticities. The estimated own-price elasticities for non-meat basic items are reported in Table 2. The coefficients for the rice variables indicate that all rice types are price inelastic. Despite the difference in magnitudes, the inelastic or low own-price elasticity for rice recorded in this study was consistent with the often observed phenomenon that a staple food with no close substitutes, and which also accounts for a large share of the consumer's budget, has a low price elasticity. The relatively high own-price elasticity of wheat flour was consistent with its nature as a semi-luxury or festive good.
The relatively high own-price elasticities for non-cereals set out in Table 2 maybe somewhat ml'sleading. They are probably due to supply shortages rather than any underlying luxury or semi-luxury quality of these goods (de Vega, 1981; Tomek and Robinson, 1977). These items are necessities and are used as supplements in a package in the preparation of food. The price elasticities of these items could be expected to be low if prices and supplies remained normal and stable (FAO, 1971). However, during the study period shortages led to increased domestic prices for these items. This was partly caused by government policy which allocated resources to rice and a few other 'controlled' crops, thereby constrain-
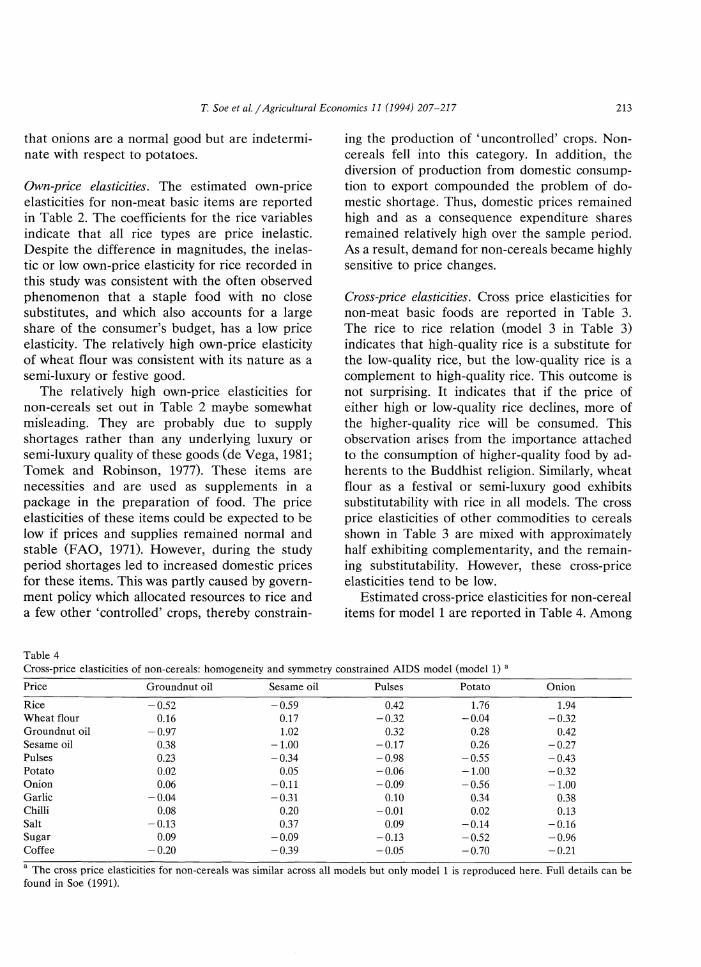
Table 4
ing the production of 'uncontrolled' crops. Noncereals fell into this category. In addition, the diversion of production from domestic consump" tion to export compounded the problem of domestic shortage. Thus, domestic prices remained high and as a consequence expenditure shares remained relatively high over the sample period. As a result, demand for non-cereals became highly sensitive to price changes.
Cross-price elasticities. Cross price elasticities for non-meat basic foods are reported in Table 3. The rice to rice relation (model 3 in Table 3) indicates that high-quality rice is a substitute for the low-quality rice, but the low-quality rice is a complement to high-quality rice. This outcome is not surprising. It indicates that if the price of either high or low-quality rice declines, more of the higher-quality rice will be consumed. This observation arises from the importance attached to the consumption of higher-quality food by adherents to the Buddhist religion. Similarly, wheat flour as a festival or semi-luxury good exhibits substitutability with rice in all models. The cross price elasticities of other commodities to cereals shown in Table 3 are mixed with approximately half exhibiting complementarity, and the remaining substitutability. However, these cross-price elasticities tend to be low.
Estimated cross-price elasticities for non-cereal items for model 1 are reported in Table 4. Among
Cross-price elasticities of non-cereals: homogeneity and symmetry constrained AIDS model (model 1) a
Price Groundnut oil Sesame oil Pulses Potato Onion
Rice -0.52 -0.59 0.42 1.76 1.94 Wheat flour 0.16 0.17 -0.32 -0.04 -0.32 Groundnut oil -0.97 1.02 0.32 0.28 0.42 Sesame oil 0.38 -1.00 -0.17 0.26 -0.27 Pulses 0.23 -0.34 -0.98 -0.55 -0.43 Potato 0.02 0.05 -0.06 -1.00 -0.32 Onion 0.06 -0.11 -0.09 -0.56 -1.00 Garlic -0.04 -0.31 0.10 0.34 0.38 Chilli 0.08 0.20 -0.01 0.02 0.13 Salt -0.13 0.37 0.09 -0.14 -0.16 Sugar 0.09 -0.09 -0.13 -0.52 -0.96 Coffee -0.20 -0.39 -0.05 -0.70 -0.21
a The cross price elasticities for non-cereals was similar across all models but only model 1 is reproduced here. Full details can be found in Soe (1991).
214 T. Soe et al. /Agricultural Economics 11 (1994) 207-217
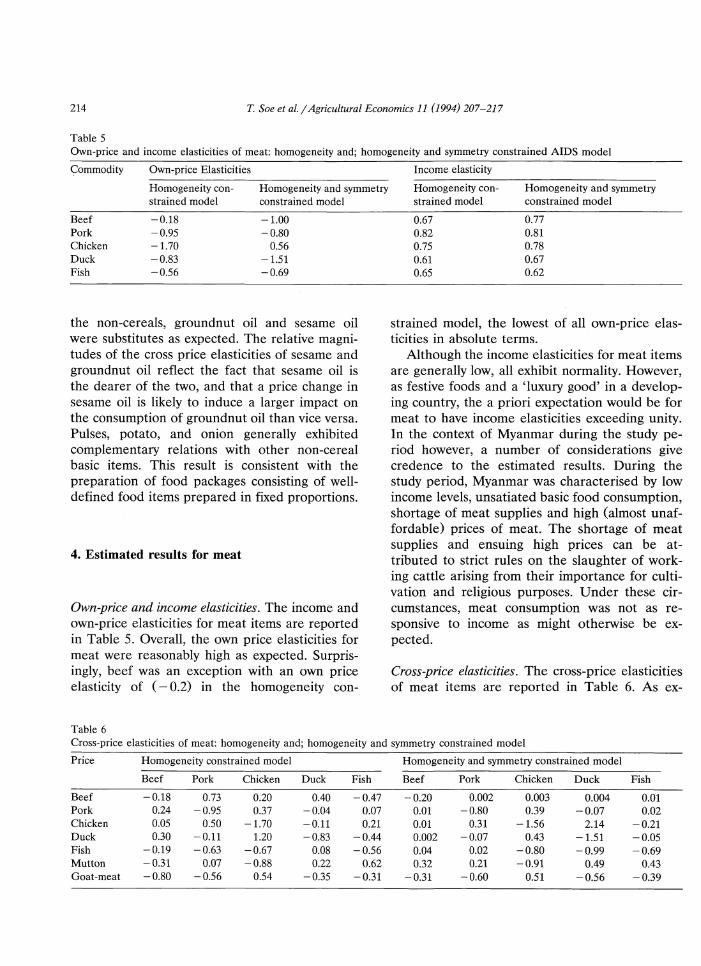
Table 5 Own-price and income elasticities of meat: homogeneity and; homogeneity and symmetry constrained AIDS model
Commodity Own-price Elasticities Income elasticity
Homogeneity con- Homogeneity and symmetry strained model constrained model
Beef -0.18 -1.00 Pork -0.95 -0.80 Chicken -1.70 0.56 Duck -0.83 -1.51 Fish -0.56 -0.69
the non-cereals, groundnut oil and sesame oil were substitutes as expected. The relative magnitudes of the cross price elasticities of sesame and groundnut oil reflect the fact that sesame oil is the dearer of the two, and that a price change in sesame oil is likely to induce a larger impact on the consumption of groundnut oil than vice versa. Pulses, potato, and onion generally exhibited complementary relations with other non-cereal basic items. This result is consistent with the preparation of food packages consisting of welldefined food items prepared in fixed proportions.
4. Estimated results for meat
Own-price and income elasticities. The income and own-price elasticities for meat items are reported in Table 5. Overall, the own price elasticities for meat were reasonably high as expected. Surprisingly, beef was an exception with an own price elasticity of (- 0.2) in the homogeneity con-
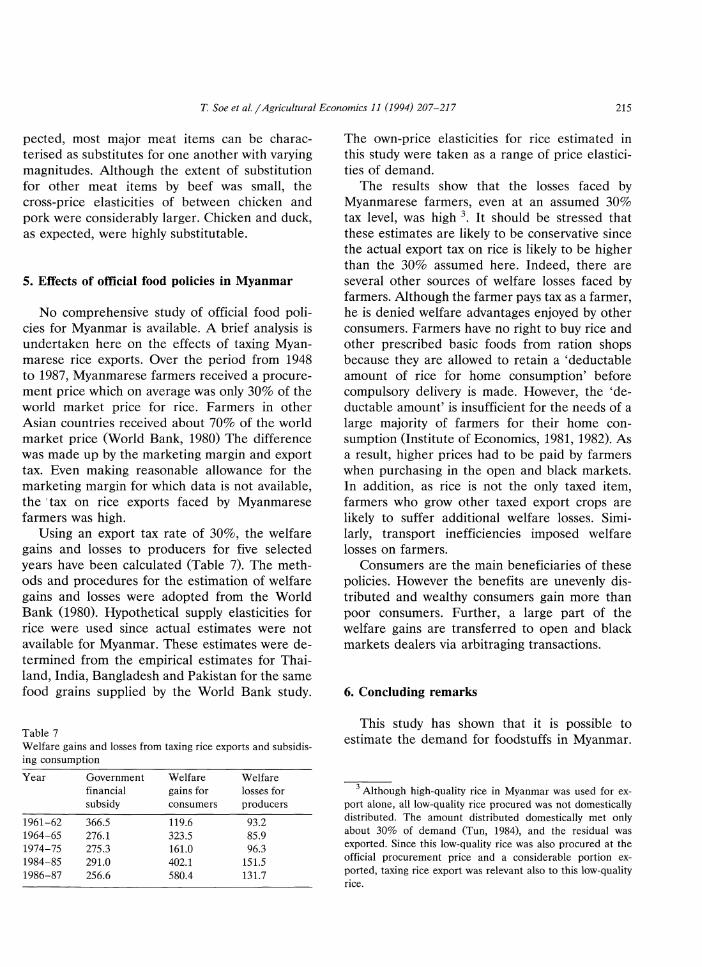
Table 6
--------------------------------Homogeneity con- Homogeneity and symmetry strained model constrained model
0.67 0.77 0.82 0.81 0.75 0.78 0.61 0.67 0.65 0.62
strained model, the lowest of all own-price elasticities in absolute terms.
Although the income elasticities for meat items are generally low, all exhibit normality. However, as festive foods and a 'luxury good' in a developing country, the a priori expectation would be for meat to have income elasticities exceeding unity. In the context of Myanmar during the study period however, a number of considerations give credence to the estimated results. During the study period, Myanmar was characterised by low income levels, unsatiated basic food consumption, shortage of meat supplies and high (almost unaffordable) prices of meat. The shortage of meat supplies and ensuing high prices can be attributed to strict rules on the slaughter of working cattle arising from their importance for cultivation and religious purposes. Under these circumstances, meat consumption was not as responsive to income as might otherwise be expected.
Cross-price elasticities. The cross-price elasticities of meat items are reported in Table 6. As ex-
Cross-price elasticities of meat: homogeneity and; homogeneity and symmetry constrained model
Price Homogeneity constrained model Homogeneity and symmetry constrained model
Beef Pork Chicken Duck Fish Beef Pork Chicken Duck Fish
Beef -0.18 0.73 0.20 0.40 -0.47 -0.20 0.002 0.003 0.004 0.01 Pork 0.24 -0.95 0.37 -0.04 0.07 0.01 -0.80 0.39 -0.07 0.02 Chicken 0.05 0.50 -1.70 -0.11 0.21 0.01 0.31 -1.56 2.14 -0.21 Duck 0.30 -0.11 1.20 -0.83 -0.44 0.002 -0.07 0.43 -1.51 -0.05 Fish -0.19 -0.63 -0.67 0.08 -0.56 0.04 0.02 -0.80 -0.99 -0.69 Mutton -0.31 0.07 -0.88 0.22 0.62 0.32 0.21 -0.91 0.49 0.43 Goat-meat -0.80 -0.56 0.54 -0.35 -0.31 -0.31 -0.60 0.51 -0.56 -0.39
T. Soe eta/./ Agricultural Economics 11 (1994) 207-217 215
pected, most major meat items can be characterised as substitutes for one another with varying magnitudes. Although the extent of substitution for other meat items by beef was small, the cross-price elasticities of between chicken and pork were considerably larger. Chicken and duck, as expected, were highly substitutable.
5. Effects of official food policies in Myanmar
No comprehensive study of official food policies for Myanmar is available. A brief analysis is undertaken here on the effects of taxing Myanmarese rice exports. Over the period from 1948 to 1987, Myanmarese farmers received a procurement price which on average was only 30% of the world market price for rice. Farmers in other Asian countries received about 70% of the world market price (World Bank, 1980) The difference was made up by the marketing margin and export tax. Even making reasonable allowance for the marketing margin for which data is not available, the 'tax on rice exports faced by Myanmarese farmers was high.
Using an export tax rate of 30%, the welfare gains and losses to producers for five selected years have been calculated (Table 7). The methods and procedures for the estimation of welfare gains and losses were adopted from the World Bank (1980). Hypothetical supply elasticities for rice were used since actual estimates were not available for Myanmar. These estimates were determined from the empirical estimates for Thailand, India, Bangladesh and Pakistan for the same food grains supplied by the World Bank study.
Table 7 Welfare gains and losses from taxing rice exports and subsidising consumption
Year Government Welfare Welfare financial gains for losses for subsidy consumers producers
1961-62 366.5 119.6 93.2 1964-65 276.1 323.5 85.9 1974-75 275.3 161.0 96.3 1984-85 291.0 402.1 151.5 1986-87 256.6 580.4 131.7
The own-price elasticities for rice estimated in this study were taken as a range of price elasticities of demand.
The results show that the losses faced by Myanmarese farmers, even at an assumed 30% tax level, was high 3. It should be stressed that these estimates are likely to be conservative since the actual export tax on rice is likely to be higher than the 30% assumed here. Indeed, there are several other sources of welfare losses faced by farmers. Although the farmer pays tax as a farmer, he is denied welfare advantages enjoyed by other consumers. Farmers have no right to buy rice and other prescribed basic foods from ration shops because they are allowed to retain a 'deductable amount of rice for home consumption' before compulsory delivery is made. However, the 'deductable amount' is insufficient for the needs of a large majority of farmers for their home consumption (Institute of Economics, 1981, 1982). As a result, higher prices had to be paid by farmers when purchasing in the open and black markets. In addition, as rice is not the only taxed item, farmers who grow other taxed export crops are likely to suffer additional welfare losses. Similarly, transport inefficiencies imposed welfare losses on farmers.
Consumers are the main beneficiaries of these policies. However the benefits are unevenly distributed and wealthy consumers gain more than poor consumers. Further, a large part of the welfare gains are transferred to open and black markets dealers via arbitraging transactions.
6. Concluding remarks
This study has shown that it is possible to estimate the demand for foodstuffs in Myanmar.
3 Although high-quality rice in Myanmar was used for ex-port alone, all low-quality rice procured was not domestically distributed. The amount distributed domestically met only about 30% of demand (Tun, 1984), and the residual was exported. Since this low-quality rice was also procured at the official procurement price and a considerable portion ex-ported, taxing rice export was relevant also to this low-quality rice.
216 T. Soe et al. j Agricultural Economics 11 (1994) 207-217
The estimates for income elasticity of demand, own-price elasticity of demand and cross-price elasticity of demand were consistent with generally accepted economic theory for a very low income country. One obvious result of the study is to demonstrate the necessity of collecting basic economic statistics, even in very poor countries. The study also demonstrates the need for dedication to the task of preliminary data screening, and to econometric model specification. As in many previous studies, the AIDS model gave estimates for the demand systems that are consistent with economic theory.
Finally, it is reasonable to use the estimates for income elasticity of demand, own-price elasticity of demand and cross price elasticity of demand to make policy recommendations for governments. Few such recommendations are made in the part of the demand study reported in this paper. Interested readers are referred to Soe (1991), for a more complete view of policy recommendations based on the econometric estimates of the demand for food in Myanmar.
Acknowledgments
The financial assistance of the Australian International Development Assistance Bureau in supporting Soe during his PhD program at the University of Sydney is gratefully acknowledged. The authors express their appreciation to Stephen Whelan for research assistance and helpful comments, and to David Godden and two anonymous referees for helpful comments on this paper.
References
Alston, J.M. and Chalfant, J.A., 1987. Weak separability and a test for the specification of income in demand models with an application to the demand for meat in Australia. Paper, 31st Annu. Conf. Australian Agricultural Economics Society, February, Adelaide.
Beggs, J.J., 1987. Diagnostic testing in applied econometrics. Paper, 31st Annu. Conf. Australian Agricultural Economics Society, February, Adelaide.
1988. Diagnostic testing in applied econometrics. Econ. Rec., 64: 82-98.
Braverman, A. and Hammer, J.S., 1986. Multi-market analysis of agricultural pricing policies in Senegal. In: I. Singh, L. Squire and J. Strauss (Editors), Agricultural Household Models: Extensions, Applications, and Policy. Johns Hopkins University Press, Baltimore, MD, pp. 233-254.
Capps, 0., Tedford, J.R. and Havlicek, J., 1985. Household demand for convenience and nonconvenience foods. Am. J. Agric. Econ., 67: 862-869.
Central Statistical Organisation, 1960, 1961, 1964, 1967, 1972, 1975. Statistical Year Book, Rangoon.
Central Statistical Organisation (various issues). Quarterly Bulletin of Statistics, Rangoon.
Chalfant, J.A. and Alston, J.M., 1986. Testing for structural change in a system of demand equations for meat in Australia. Paper, Post-Conference Workshop on Research into Consumer Demand for Meat in Australia, Australian Agricultural Economics Society ANU, Canberra.
Deaton, A.S. and Muellbauer, J., 1980. An almost ideal demand system. Am. Econ. Rev., 70: 312-326
de Vega, M.C., 1981. A study of food consumption in the Philippines: a case study of rural and urban households in Laguna and Metropolitan Manila. Ph.D. thesis, Univ. Sydney.
Delforce, J., 1989a. Expenditure patterns of smallholder farm-households in Tonga: an application of the Almost Ideal Demand System. Paper, 33rd Annu. Conf. Australian Agricultural Economics Society, Christchurch, New Zealand.
Delforce, J., 1989b. Using the Almost Ideal Demand System to model household expenditure. South Pacific Smallholder Project, University of New England, Armidale.
Eales, J.S. and Unnevehr, L.J., 1988. Demand for beef and chicken products: separability and structural change. Am. J. Agric. Econ., 70: 521-531.
Fisher, B.S., 1979. The Demand for Meat. Aust. J. Agric. Econ., 23: 220-229.
FAO, 1971. Agricultural Commodity Projections, 1970-1980, II. Food and Agricultural Organisation, Rome.
Fulponi, L., 1989. The Almost Ideal Demand System: an application to food and meat groups for France. J. Agric. Econ., 40: 82-92.
Fuss, M., McFadden, D. and Mundlak, Y., 1978. A Survey of Functional Forms in the Economic Analysis of Production. In M. Fuss and D. McFadden (Editors), Production Economics: A Dual Approach to Theory and Applications, 1. North-Holland, Amsterdam, pp. 219-268.
Goddard, D., 1983. An analysis of Canadian aggregate demand for food at home and away from home. Can. J. Agric. Econ., 31: 289-318.
Green, R. and Alston, J.M., 1990. Elasticities in AIDS models. Am. J. Agric. Econ., 72: 442-445.
Gujarati, D.N., 1988. Basic Econometrics (2nd Edition). McGraw-Hill, New York, 705 pp.
Institute of Economics, 1978, 1979. Burmese rice production and the high yielding varieties of rice: case studies of
T. Soe et at. 1 Agricultural Economics 11 (1994) 207-217 217
Okpo, Taikgyi and Patheigyi townships. Economic Research Project Reports AERP (1), AERP (2), Department of Economics, Rangoon.
Institute of Economics, 1982. Technology transfer, institutional transfer and induced development in agriculture: a case study of Hlegu township. Economic Research Project APP 1/82, Department of Economics, Rangoon.
Ito, S., Peterson, F. and Grant, W.R., 1989. Rice in Asia: is it becoming an inferior good? Am. J. Agric. Econ., 71: 32-42.
Johnson, S.R., Hassan, Z.A. and Green, R.D., 1984. Demand systems estimation: methods and applications. Iowa State University Press, Ames, lA, 178 pp.
Main, G.W., Reynolds, R.G. and White, G.M., 1976. Quantity-price relationships in the Australian retail meat market. Q. Rev. Agric. Econ., 29: 193-211.
Majumder, A., 1986. Consumer expenditure pattern in India: a comparison of the Almost Ideal Demand System and the Linear Expenditure System. Indian J. Stat. Sankya, 48B: 115-143.
Martin, W and Porter, D., 1985. Testing for changes in the structure of the demand for meat. Aust. J. Agric. Econ., 29: 16-31.
Mergos, G.J. and Donatos, G.S., 1989. Demand for food in Greece: An Almost Ideal Demand System analysis. J. Agric. Econ., 40: 178-184.
Ministry of National Planning and Finance, 1974-1988 (various issues). Report to the Pyithu Hluttaw on the Financial, Economic and Social .Conditions of the Socialist Republic of the Union of Burma, Rangoon.
Phlips, L., 1974. Applied Consumption Analysis. North-Holland, Amsterdam, 331 pp.
Raunikar, R. and Huang, C.L. (Editors), 1987. Food demand analysis: problems, issues, and empirical evidence. Iowa State University Press, Ames, lA, 285 pp.
Ray, R., 1980. Analysis of a time series of household expenditure surveys for India. Rev. Econ. Stat., 62: 595-602.
Savadogo, K. and Brandt, J.A., 1988. Household food demand in Burkina Faso: Implications for food policy. Agric. Econ., 2: 345-364.
Soe, T., 1991. An econometric study of food demand in Burma. Ph.D thesis, Univ. Sydney.
Than, M. and Tan, J.L.H., 1990. Introduction: Optimism for Myanmar's economic transition in the 1990s? In: M. Than and J.L.H. Tan (Editors), Myanmar Dilemmas and Options: The Challenges of Economic Transition in the 1990s. ASEAN Economic Research Unit, Institute of South East Asian Studies, Singapore, pp. 1-17.
Thein, M., 1990. Monetary and fiscal policies for development. In: M. Than and J.L.H. Tan (Editors), Myanmar Dilemmas and Options: The Challenges of Economic Transition in the 1990s. ASEAN Economic Research Unit, Institute of South East Asian Studies, Singapore, pp. 53-88.
Tomek, W.G. and Robinson, K.L., 1972. Agricultural Product Prices. Cornell University Press, Ithaca, NY, 376 pp.
Tomek, W.G. and Robinson, K.L., 1977. Agricultural price and outlook. In: L.R. Martin (Editor), A Survey of Agricultural Economic Literature, 1. University of Minnesota Press, Minneapolis, pp. 330-351.
Tun, H. 1984. An economic analysis of rice distribution and marketing of the State Agricultural Board. Master of Arts (Economics) thesis, Department of Economics, Institute of Economics, Rangoon (in Myanmarese)
White, K.J., Wong, S.D., Whistler, D. and Haun, S.A., 1990. SHAZAM: Econometric Computer Program: User's Reference Manual Version 6.2. McGraw-Hill, New York.
World Bank, 1980. Methodologies for measuring agricultural price intervention effects. World Bank Staff Paper 394, Washington DC.