Embed Size (px)
Citation preview
Demand for Drought Tolerance in Africa:
Selection of Drought Tolerant Maize Seed using Framed Field Experiments
Timothy J. Dalton Mahmud Yesuf
Department of Agricultural Economics Kansas State University Manhattan, KS 66503
USA Corresponding author: [email protected]
Lutta Muhammad
Kenya Agricultural Research Institute Kaptagat Road Loresho, Nairobi
KENYA [email protected]
Selected Paper prepared for presentation at the Agricultural & Applied Economics Association’s 2011
AAEA & NAREA Joint Annual Meeting, Pittsburgh, PA July 24‐26‐2011
Abstract Recent projections on the impact of climate change argue that eastern and southern Africa will be two regions around the globe that will experience dramatic reductions in maize yields by mid‐century. Absent from these projections is any consideration for farmer adaptation of cropping practices or land reallocation. This research quantifies risk, loss and ambiguity aversion for a sample of smallholder Kenyan farmers using framed field experiments. This behavioral information, directly elicited, is used to condition the selection of maize varieties differentiated by drought tolerance, pest resistance, maturity, and seed price. Overall, the willingness to pay for drought tolerance and other attributes is highly heterogeneous as determined through a Latent Class modeling approach. Failing to account for farmer heterogeneity biases the potential welfare gains from this technology. Secondly, willingness to pay estimates identify segments of farmers that are seed‐price sensitive and this elastic demand may limit technology purchase and the eventual impact of this adaptation strategy without seed market intervention. Copyright 2011 Dalton, Yesuf and Muhammad. All rights reserved. Readers may make verbatim copies of this document for non‐commercial purposes by any means, provided that this copyright notice appears on such copies.

1
Behavioral Determinants of Adaptation to Climate Change: Selection of Drought Tolerant Seed using Framed Field Experiments in Kenya
Introduction
Several fundamental questions plague ex‐ante assessment of new agricultural technologies. At
the core of most analyses are questions of adoption including the number of potential adopters, time
lags from initial release to equilibrium, the area coverage of a new technology and the differential yield
advantage between the new technology and the competitor. Even within the adoption decision lays
several behavioral questions that condition adoption, such as how an individual’s perception of an
unknown technology hinders exploration, formation of subjective performance expectations or whether
uncertainty, and the ability to bear the unknown, affects experimentation. Several influential studies
have documented the role of farmers’ risk preferences on the adoption of new farming technologies
(Feder, Just & Zilberman 1985).
Behavioral determinants of new technology adoption are difficult to identify and are often
proxied with personal, social and demographic characteristics (Binswanger, Rosenzweig 1992 [1986]).
Until recently, few studies have attempted to identify the conditioning effect and tradeoffs associated
with decisionmaking under risk and relate it to technology choice (Liu 2008). Framed field experiments
and simulation of decisionmaking under risk provides an opportunity to elicit this information yet it has
been used rarely in low income countries and even less so in Africa(Binswanger 1981, Yesuf, Bluffstone
2009)
The common approach to elicit individual risk preferences is to conduct a field or laboratory
experiment in which subjects decide between a menu of alternatives with varying degree of risk or a
single choice from a pair‐wise lottery (Binswanger 1980, Holt, Laury 2002). The design of such an
experiment permits estimation of the curvature of the utility function, which is the sole parameter
characterizing individual risk preference under expected utility theory. However, since Kahneman and
Tversky’s (1979) seminal paper on prospect theory, several studies have found that prospect theory has

2
more predictive power than expected utility theory under some conditions (Harrison, Rutstrom 2009). In
particular, if farmers are more sensitive to loss below a subsistence income level, the utility function of
farmers may be reference dependent, rendering expected utility theory inadequate in explaining their
decisions to adopt new technologies, especially where downside loss is nonnegligable. Examples in the
empirical literature that apply prospect theory to measure three distinct causes of risk aversion, i.e. risk
aversion associated merely with the curvature of the utility function, risk aversion caused by aversion to
loss, and risk aversion due to non‐linearity in probability weighting in developing countries are rare(Liu
2008, Tanaka, Camerer & Nguyen 2010).
Drought tolerant maize presents a novel opportunity to study the value of reducing a specific
type of risk, in particular yield loss under water stress that occurs periodically, much in the same way
that we might observe protection from random pest infestation developed through host plant resistance
or genetic modification. These technologies reduce losses only under pest or moisture stress thereby
affecting downside yield loss that might be observed in reduced variance or skewness of yield
distribution. Studies that have examined the impacts of technologies to reduce production risk, outside
of irrigation, have found conflicting results. For example, Bt cotton technology might be viewed as an
insurance‐type technology against pest infestation, yet empirical analysis indicates that Bt cotton is not
risk reducing and a “risk‐reducing, vulnerability–decreasing role to Bt technology” cannot be ascribed
(Shankar, Thirtle 2005). The value of reducing maize yield variability has been estimated to range from
149% to 157% of the value of increasing yield potential following a Stiglitz‐Newberry displacement
model, but farmer behavior towards risk was assumed rather than tested (La Rovere et al. 2010).
Recent projections on the impact of climate change argue that eastern and southern Africa will
be two regions around the globe that will experience higher temperatures and reduced rainfall. Climate
change is expected to reduce maize productivity in southern Africa by 37% without crop or
environmental adaptation before mid‐century(Schlenker, Lobell 2010, Lobell et al. 2008). In response to

3
this projected stressor, this research quantifies risk, loss and preferences against ambiguous information
for a sample of smallholder African farmers using framed field choice experiments. Behavioral
information, directly elicited, is then used to condition choice decisions that describe the technological
opportunity to reduce yield losses associated with drought stress. In the following section we describe
the empirical approach used to estimate the willingness to pay for seed that has varying levels of
drought tolerance and other production traits. The methods section is followed by presentation of the
field experiments employed in data collection. The fourth section tests hypotheses on consumer
behavior towards improved drought tolerant maize seeds and estimates the potential for
misspecification bias. In addition, we identify user segments and show heterogeneous preferences for
these traits. The final section discusses the research findings and suggests directions for future studies.
Conditioning Behavior and Choice Modeling to Measure Adaptation Potential
We combine two innovative datasets to understand the impact of behavioral conditioning on
choice decisions for drought tolerant maize. Both data sets were collected using framed field
experiments in semi‐arid regions of Eastern Kenya during July 2010 following the protocol described in
(Yesuf, Dalton 2010). Table 1 presents a summary of the risk, loss and ambiguity aversion experiments.
We design the experiment to estimate participants’ certainty equivalents (CEs) for three kinds of binary
prospects: (1) risky prospects involving gains‐only, (2) gains‐and‐loss games, and (3) gains‐only games
with ambiguous probabilities. The first six prospects of Table 1 are risky prospects of the form p:x;y. For
instance, prospect 1 is a risky prospect yielding the outcome 100 units with probability 90% and the
outcome 0 with probability 10%. The next four prospects are also risky prospects of the form P:x;y but
they involve actual loses in case of negative outcome. For example, prospect 7 yields a positive outcome
of 50 units with a probability of 50%, but at the same time it involves actual loss of 25 units with an
equal probability of 50%.

4
The last five prospects are imprecise ambiguous prospects (with probability intervals). They give
x with probability which can be either (p‐r) or (p+r) and y (with x<y) otherwise. Prospect 11, for instance,
is an ambiguous prospect that gives the outcome 0 units with probability lying in the range between 0%
and 20% and 100 otherwise. Prospect 15 gives the outcome 0 units with probability that is between 80%
or 100% and 100 otherwise. It is noteworthy that in order to simplify matters, we fixed the width of the
probability interval of ambiguous prospects to 20 following similar laboratory experiments1(Abdellaoui
et al. 2010 (forthcoming), Baillon, L'Haridon & Placido 2010 (forthcoming), Baillon, Cabantous 2009).
(Table 1 goes about here)
In order to estimate the CE of each household for each prospect, we will employ a choice listing
approach where each household will choose between a given prospect and a certain amount of money.
We will use 10 choices for each prospect in the risk and ambiguity aversion experiment, and five to
fifteen choices for loss aversion prospects. Overall, each player will make 145 choices (fifteen prospects
times the number of choices). An example of a choice list for prospect 1 is presented in Table 2.
(Table 2 goes about here)
To test for the presence of order effects, we will administer the experiment in two different
sequences. For half of the respondents, the risk experiment will be administered first. For the other
half, the ambiguity aversion experiment will be administered first. In both cases, the loss aversion game
will be played last. Randomization of the order would also help us to test for the presence of
comparative ignorance in ambiguity experiment. Fox and Tversky (1995) documented evidence of
comparative ignorance in ambiguity aversion experiment where ambiguity aversion will be present
1 However, it is important to test the sensitivity of ambiguity aversion to changes in the probability interval.
We are also planning to conduct this sensitivity using a small group of our sample in only one of the
participating countries. This type of exercise would also enable us to generate policy relevant observations on
the role of precision of climatic information on ambiguity and technology adoption.

5
when subjects evaluate clear and vague prospects jointly, but it will diminish or disappear when they
evaluate each prospect in isolation. The elicitation process, and motivation, is described in greater
detail in Appendix 1.
The Design of the Choice Experiment
In a choice experiment, individuals are given a hypothetical setting, and then asked to choose
the preferred alternative, from multiple alternatives, presented as a choice set. Each alternative is
described by a number of attributes, such as yield, maturity, seed price, insect resistance, that take
different levels from one choice set to the next. There are two steps involved in the design of a choice
experiment: determination of the salient attributes of interest to farming populations and the relevant
level of attributes. With this information, the choice experiment can be designed to maximize contrasts
between attributes in order to insure sufficient variation among the represented composite good.
The primary objective of our study is to determine farmer demand and willingness to pay for
new maize varieties that are drought resistant. The most general assumptions that can be made to
describe drought resistance are related to the distribution of the on‐farm yields and the net returns to
the technology under alternative states of nature, namely moisture regimes. Figure 1 presents three
stylized cases of the performance of drought tolerant technology. The vertical axes are the cumulative
probability distribution of ordered outcomes, while the horizontal axis represents the outcome, either
as yield or net returns. The outcomes reflect the ordering of rainfall from low to high. In panel (A), the
new technology (denoted as “WEMA”) achieves higher yields in all states of nature and first order
stochastically dominates the status quo technology. In the lower half of the panel, the net returns from
this technology also first order stochastically dominates such that the incremental revenue from the
new variety exceeds the cost of the technology under all states of nature.

6
In panel (B) the yield benefits to the technology exceed those of the status quo technology
under water stress, but this dominance erodes under good states of nature. The curves coincide at
higher levels of moisture in a scenario of “no yield penalty” under sufficient moisture conditions. In this
case, the technology does not unequivocally dominate the status quo in financial terms, especially if the
cost to access the technology is nonzero. The critical point in the profitability dominance analysis is the
point of crossover between the two technologies and the cumulative area representing the difference
between the two curves. Under this scenario, second order stochastic dominance would be required to
determine technology dominance or even more restrictive third order stochastic dominance or
stochastic dominance with respect to a function, depending upon the location of the crossover. In
panel (C), a conceivable tradeoff is that the new technology outperforms the status quo at lower levels
of moisture but does not outperform the status quo at higher levels. In this case, the better
understanding of farmer attitudes towards risk are required since it is unlikely that second order
stochastic dominance will be able to identify the preferred technology.
In addition to these yield distributions describing first‐, second‐, and third‐order stochastic
dominance of the new technology relative to the existing base technology, we capture drought escape
though shorter‐duration varieties. Typical landraces in Kenya mature in 135‐150 days while shorter
duration varieties mature in only 90 days. We couple these drought‐management traits with host‐plant
resistance to insect pests. Finally, we vary the price of the seed consistent with observed market prices
for landraces and hybrids. Summary of these traits and their levels is presented in Table 3.
(Table 3 goes about here)
The second important step in the design of the choice experiment concern how to create the
choice sets in an efficient way, i.e. how to combine attribute levels into profiles of alternatives and
profiles into choice sets. The natural starting point is a full factorial design. Given our 4 attributes and
their levels, we could form (32*22=36) possible combinations. However, it is unrealistic to expect each

7
respondent to respond to all of these choice sets. More importantly, some of the choice sets are
correlated and would not be needed to generate the main preference effects. Thus, the standard
approach is to use an orthogonal design, where the variations of the attributes of the alternatives are
uncorrelated in all choice sets (Kuhfeld, Tobias & Garratt 1994). In order to minimize respondent fatigue,
we reduced the number of choice sets down to nine using a fractional factorial design that maximized
design efficiency and minimized attribute correlation, while maintaining design orthogonality.
An example of a choice card with new varieties is presented in Figure 2 and for the default in
Figure 3. It consists of three alternatives, non‐branded choice “A”, non‐branded choice “B” and branded
choice “C”. In all choice sets, C represents the common default variety specific to the area. In Kenya,
the default variety is “Kikamba,” an unimproved landrace commonly sown in the area. Choices A and
“B” are generic new varieties developed through the technology development process. Each card
presents maize yield under high, average and low rainfall both graphically and numerically. We use a
rain gauge to denote the alternative states of nature, drawings of maize plants to denote vigor, and the
number of 90 kilogram bags of maize for yield, numerically.
(Figures 2 and 3 go about here)
We denote whether the plant is insect resistant or not through the image of a maize borer
commonly observed in eastern and southern Africa. A line through the borer indicates that it would not
be present if the variety was chosen. We describe this trait as host‐plant resistance but it could be
conferred though the introduction of a Bt trait. The third trait of interest is the cycle length of the seed
from planting to harvest. Early maturity is denoted with a cycle length of 90 days against the default of
135‐150 days. Finally, we indicate the price of the seed package. The unit is denoted as a 2 kg package,
the smallest common unit of sale in Kenya. The attribute levels are pivoted around choice C in
recognition of the importance of relative choices, as opposed to absolute levels, as proposed in Prospect
Theory and theories on cognitive psychology.
8
An example of a choice card is presented in Figure 2 and the default base option of Kikamba
variety, is presented in Figure 3. The choice card presented in Figure 2 represents two variations of
drought tolerance over choice C: choice A is a new variety with a yield distribution that first‐order
stochastically dominates choice C, while choice B represents a new variety that second‐order
stochastically dominates choice C. Insect resistance, early maturity and price vary across the three
choices as well. Given this choice set with three alternatives, each farmer is instructed to indicate which
seed they would prefer to purchase. This stated choice decision is the key variable of interest in our
empirical analysis.
Econometric Modeling of the Demand for Drought Tolerance using Stated Choice Data
Drought resistance can be achieved though several mechanisms including drought escape
through shorter duration varieties, or resistance to periodic intraseasonal drought mitigated though
varietal selection and development. What is unknown is whether farmers demand either mechanism or
what is the distribution of value for these traits across the farm population. In response, we develop a
model of individual choice behavior that posits the decision to select new maize varieties upon
characteristics embodied within the seed and individual heterogeneity in the underlying utility structure.
We argue that this heterogeneity resides in cognitive behavior towards decisionmaking under risk. In
the past decades, integration of consumer heterogeneity (unobservable to the analyst) into choice
modeling has proliferated. We focus on integrating preference heterogeneity into decision modeling
through latent class modeling (LCM). Specifically, denote Ci as the discrete endogenous preference
segment of the population into which the individual i resides. This segmentation is unobservable to the
researcher but of interest as co‐residents are observed to behave similarly and yet distinctly different
from individuals in other segments. Membership in each segment is of interest in so far that common
characteristics can be found that correlate with observed behavior or defining characteristics. If not, a

9
single model of a “typical” consumer suffices. Empirical latent class modeling has been presented in
numerous publications but is succinctly presented in Hensher, Greene (2010) and with greater detail in
Roeder, Lynch & Nagin (1999). We follow the former in our presentation.
Formally latent classes correspond to underlying user or market segments. In this application
we are interested in whether a trait designed to reduce yield loss under moisture stress has broad or
narrow appeal to small scale farmers. We are also interested in comparing drought management
against other drought escape through shorter duration varieties. Define the probability of membership
in class C as
1 exp
∑ exp , 1, … , 0
which can be modeled as multinomial logit upon a set of class characteristics z and a vector of
parameter estimates. Class membership is hypothesized to condition the behavioral decision of the
individual to make a particular choice j among a set of alternatives J in choice situation t
2 j | exp ,
∑ exp
Using equation (1) we can define the probability of class membership and equation(2) will define the
probability of choosing a defined alternative. The likelihood of a choice by an individual is the
summation over the classes of the individual contributions
3 |
where Pi|c is the joint product of the sequence of choices made by the individual given class assignment.
Therefore the log‐likelihood of the sample is
4 ln |
10
Equation (4) can be estimated with maximum likelihood in order to derive estimates of the latent
parameters affecting class membership (θ) and estimates of the structural parameters affecting the
choice of a particular alternative (βc). Equation (4) can be evaluated against the null hypothesis of one
single and homogenous consumer. If warranted, through rejection of the null hypothesis, posterior
estimates of the probability of class participation can be derived using Bayes theorem providing the
person‐specific estimate of the class probability conditioned on their choice decisions.
Empirical Findings from Kenya
Field experiments were conducted in Makueni and Kathonzweni locations of Eastern Kenya in
July 2010. On each day, a representative sample of between 19 and 32 maize farmers, equally divided
between males and females, attended the experiment. An opening discussion on the occurrence of
drought and farmer strategies on adaptation framed the context of the experiments followed by reading
of an informed consent statement. After the opening discussion, the games were explained to the
participants and practice sessions were conducted, including discussion of the financial stakes at hand in
each of the three games. Following the warm up sessions, farmers were offered a break and told that
the real games would follow. Upon reassembly, farmers were offered the opportunity to opt‐out of
participation, yet none accepted. We then played each of the three games by methodically proceeding
through each of the prospects. We visually stimulated understanding of the gambles through graphical
representation and counting poker chips into standard water jugs. After proceeding through the
behavioral experiments, lunch was served to the participants.
When we reconvened, farmers played the games for real stakes. Each farmer was endowed
with 200Ksh as a participation fee, a level established to be relative to the average informal local wage
rate for unskilled labor. The procedure that was followed included three random draws of numbered
balls by each participant. The number on the ball indicated which stake was played. If the farmer chose

11
the certain payoff in that stake, he or she received that amount. If the farmer selected to take the
gamble, a second jug with the appropriate probability density was constructed with the farmer counting
the appropriate number of blue chips, earning a payoff of 0 KSh and white chips, earning 100 KSh into
the pot. It was vigorously mixed and the farmer selected a chip and the outcome noted. Based upon
farmer behavior and the decision to take the gamble or the certainty equivalent, combined with luck‐of‐
the‐draw, farmers earned between 120 KSh and 500 KSh for their participation. On average, farmers
earned 310Ksh or 150% of a daily wage. They were paid their winnings at the end of the end of the day,
after the choice experiments were conducted.
We then proceeded to the choice experiments after discussion of the representation of the
choice cards. It is the opinion of the authors that the graphical representations of the yield distribution
were easily understood by the participants consistent with other studies that have found high levels of
understanding using visual aids. We presented farmers with the nine choice sets and they asked to
evaluate even more alternatives.
(Table 4 goes about here)
A summary of the distribution of the sample statistics is presented in Table 4 along with
summary statistic on three behavioral parameters derived from observed behavior towards the
gambles. Briefly, farmers were risk averse, even more loss averse and slightly optimistic in their outlook
on ambiguous situations. They chose varieties with insect resistance and early maturity in two‐thirds of
the preferred alternatives while preferring FSD, SSD to TSD. Eight percent of the choices were the
default Kikamba alternative.
(Table 5 goes about here)
Using data derived from the behavioral and choice experiments, we estimate the model
described in equation 4. A multinomial logit model was estimated on the choice decision with the
explanatory variables being the yield distribution (FSD, SSD, TSD), pest resistance (binary), early maturity

12
(binary) , and price (in KSh per 2 kg seed package). We then proceed to include the behavioral
parameters in the Latent Class model and compare the two models based upon several characteristics
to determine whether (1) segmenting the population improves model performance and (2) what is the
optimal number of market segments if so. Model performance statistics are presented in Table 5 and
we evaluate them using a “balanced” approach advocated by several authors. Overall the model with
three market segments outperforms all others. The model with three segments is pursued for further
discussion in comparison to the model of unitary preferences, despite the fact that the hypothesis of
unitary preference structure is rejected. Coefficient estimates of these two models are presented in
Table 6 but we caution that their interpretation is not transparent and not directly interpretable.
(Table 6 goes about here)
We examine model performance in terms of the marginal impact of the trait on the selection of
the preferred option and in terms of the price elasticity of selection in Table 7. Since the choice sets
were constructed in reference to Kikamba variety, we can interpret the coefficients directly and as the
marginal impact on the logit probability of selection if a trait were added to Kikamba. Overall, several
important findings can be derived from this table. Under the unitary preference model, adding in a first
order stochastic dominant yield advantage to the Kikamba variety will increase selection by 29%, holding
all other characteristics constant. The marginal contribution of SSD and TSD yield advantages decline
relative to the FSD advantage but still indicate demand for drought tolerance. Insect resistance and
early maturity increase the probability of selection beyond a TSD shift in the yield distribution.
Column 3 of Table 7 presents the weighted average marginal impact from the LCM. The
weighted average results indicate lower marginal impacts of trait inclusion. The final column indicates
the impact of maintaining the null hypothesis of a unitary consumer over a LCM with three market
segments. The impact of this Type II hypothesis error is to overestimate the marginal impact of all of
these traits, some in excess of twice their contribution. The final row indicates that farmers are price

13
inelastic, when it comes to selection, but the misspecification bias of the unitary model underestimates
the degree of elasticity by more than one‐half.
(Table 7 goes about here)
The implications of market segmentation are important. We turn our attention to segment‐
specific analysis in order to determine whether observed choice decisions appear conditioned on
behavioral characteristics defined by attitudes towards risk, loss and ambiguity. Our results are mixed.
While the preferred structure differentiated the sample into three distinct segments, the explanatory
power of the behavioral determinants was only partially rewarding (lower section Table 6). Fifty‐eight
percent of our sample was allocated to the first segment, nineteen percent to the second and twenty‐
four to the third. The LCM approach estimates parameters for (C‐1) classes by normalizing one. Thus
interpretation of the coefficients is relative to the base, in our case, the third class. No behavioral
variables were statistically significant and different from the base in explaining class determinants for
the first segment but the coefficients suggest that this class was slightly more risk averse, willing to
insure against losses and slightly less optimistic than the base. The second class exhibited different
behavioral characteristics. They were less risk averse, less willing to insure, and more pessimistic than
the base. The risk aversion and pessimism characteristics were significantly different from zero.
(Table 8 goes about here)
Using these characteristics, we can begin to see how behavioral determinants shape varietal
selection. Table 8 presents class‐average individual‐specific willingness to pay estimates for the yield
distribution, maturity and insect resistance following standard practice of dividing the trait coefficient by
the price coefficient. Segment 1 is willing to pay the greatest amount for new traits. For example, the
marginal willingness to pay for varieties that first order stochastically dominates Kikamba is 389KSh/2 kg
seed, an amount that is consistent with the price of hybrid seed available in Kenya. In addition, it is
below the reservation price of 500 Ksh/2kg where farmers look to lower cost seed alternatives, namely

14
retained and Kikamba (J. Missi, personal communication). A declining marginal willingness to pay is
noted in for SSD and TSD yet there still is interest in drought tolerance even if it is not accompanied by
higher yield potential under non‐moisture limited conditions. Farmers are willing to pay 110 KSh/2 kg
for a Bt‐like protection and 69 KSh/2 kg for a shorter duration variety without addition of any change in
the yield outcomes.
Segment three is interesting and accounts for nearly twenty‐five percent of the sample. This
segment is interested in the new traits embodied in the improved varieties but they have a very low, but
positive, and significant, willingness to pay. It is unclear from this analysis the reasons behind the low
willingness to pay, but it could be linked to a cash constraint, market transaction costs, unfamiliarity
with purchased seed or other factors not captured in this analysis. Clearly this is an opportunity for post
hoc study with supplemental information of farm, farmer and household characteristics2.
Segment 2 is the smallest and consists of individuals who are not willing to pay for FSD, willing
to pay a small amount for SSD, and require a discount for TSD benefits. They are willing to pay for insect
resistance and early maturity but at a rate less than the first segment of the sample. This class appears
to be seeking drought escape, as opposed to drought tolerance, and some relief from pest damage. We
can infer from the classification model that these individuals are less risk averse and more pessimistic
than the base, perhaps suggesting a group of individuals that are more skeptical about technological
innovation to reduce production risk exposure.
Conclusion
This paper has examined the impact of behavioral determinants on the contingent selection of
improved maize technologies designed with specific attributes to reduce yield loss associated with
drought stress. We approach the problem by combining choice and behavioral experiments in order to
2 Unfortunately, this is not possible at this time. A follow‐up survey was conducted in August and September 2011 but the data is not yet available for analysis.

15
determine whether heterogeneity in individual risk, loss and ambiguity aversion affects technology
choice. A model of a unitary consumer is evaluated against a segmented consumer population. The
hypothesis of a unitary consumer is rejected. Maintaining the null hypothesis of common preferences
has been shown to upwardly bias the marginal impact of all traits on contingent choice and
underestimate the price elasticity of selection.
Overall, we find evidence that farmers are willing to pay for new varieties with superior yield
performance including performance that is superior only under drought stress. However, there is
heterogeneity in this demand and only sixty percent of the sample expresses a willingness to pay for
these attributes at levels consist with observed market prices for hybrid seed. The second largest
segment expresses a willingness to pay but at very low levels. A third segment is not interested in
varieties with drought tolerance but are willing to purchased improved seed containing insect resistance
and drought escape.
These segments provide interesting opportunities for future study. The premise of the
innovative public‐private partnership developing the drought tolerant varieties will provide the
technology royalty free to smallholder producers in Africa. This mechanism may allow for the segment
of consumer, desiring the trait, but unwilling to pay market relevant prices to access the potential
benefits. Defining this segment with readily observable characteristics will improve targeting if
nonmarket interventions are pursued.
Finally, we have attempted to link technology choice decisions with underlying behavioral
attitudes in order to determine whether risk, loss and ambiguity aversion conditions attribute valuation
and willingness to pay. Our results suggest mixed results. Future research will refine the measures
capturing these behavioral attributes with the goal of improving our understanding of how cognitive
psychology can contribute to understanding decisionmaking under risk in low income countries. Testing
this behavior, broadly assumed in some of the most influential literature in applied economics, may
16
contribute to improved policy making and technology development by clarifying the cognitive
determinants of adoption behavior.
References
Abdellaoui, M., Baillon, A., Placido, L. & Wakker, P.P. 2010 (forthcoming), "The Rich Domain of Uncertainty: Source Functions and Their Experimental Implementation", American Economic Review, .
Baillon, A. & Cabantous, L. 2009, Combining Imprecise or Conflicting Probability Judgments: A Choice‐Based Study, ICBBR Working Paper Series, No. 2009_03. International Center for Behavioral Business Research, Nottingham University, UK.
Baillon, A., L'Haridon, O. & Placido, L. 2010 (forthcoming), "Ambiguity Models and the Machina Paradoxes", American Economic Review, .
Binswanger, H.P. 1981, "Attitudes toward Risk: Theoretical Implications of an Experiment in Rural India", Economic Journal, vol. 91, no. 364, pp. 867‐890.
Binswanger, H.P. 1980, "Attitudes toward Risk: Experimental Measurement in Rural India", American Journal of Agricultural Economics, vol. 62, no. 3, pp. 395‐407.
Binswanger, H.P. & Rosenzweig, M.R. 1992 [1986], "Behavioural and Material Determinants of Production Relations in Agriculture" in Development economics. Volume 2, ed. D. Lal ed, pp. 3‐39.
Feder, G., Just, R.E. & Zilberman, D. 1985, "Adoption of Agricultural Innovations in Developing Countries: A Survey", Economic Development and Cultural Change, vol. 33, no. 2, pp. 255‐298.
Harrison, G.W. & Rutstrom, E.E. 2009, "Expected Utility Theory and Prospect Theory: One Wedding and a Decent Funeral", Experimental Economics, vol. 12, no. 2, pp. 133‐158.
Hensher, D.A. & Greene, W.H. 2010, "Non‐attendance and Dual Processing of Common‐Metric Attributes in Choice Analysis: A Latent Class Specification", Empirical Economics, vol. 39, no. 2, pp. 413‐426.
Holt, C.A. & Laury, S.K. 2002, "Risk Aversion and Incentive Effects", American Economic Review, vol. 92, no. 5, pp. 1644‐1655.
Kuhfeld, W.F., Tobias, R.D. & Garratt, M. 1994, "Efficient Experimental Design with Marketing Applications", Journal of Marketing Research, vol. 31, no. 4, pp. 545.

17
La Rovere, R., Kostandini, G., Abdoulaye, T., Dixon, J., Mwangi, W., Guo, Z. & Banzinger, M. 2010, Potential impact of investments in drought tolerant maize in Africa. , CIMMYT, Addis Ababa, Ethiopia.
Liu, E. 2008, Essays on Development Economics in China, Princeton University.
Lobell, D.B., Burke, M.B., Tebaldi, C., Mastrandrea, M.D., Falcon, W.P. & Naylor, R.L. 2008, "Prioritizing climate change adaptation needs for food security in 2030", Science, vol. 319, no. 5863, pp. 607‐610.
Roeder, K., Lynch, K.G. & Nagin, D.S. 1999, "Modeling Uncertainty in Latent Class Membership: A Class Study in Criminology", Journal of the American Statistical Association, vol. 94, no. 447, pp. 766‐776.
Schlenker, W. & Lobell, D.B. 2010, "Robust negative impacts of climate change on African agriculture", Environmental Research Letters, vol. 5, no. 1, pp. 014010.
Shankar, B. & Thirtle, C. 2005, "Pesticide Productivity and Transgenic Cotton Technology: The South African Smallholder Case", Journal of Agricultural Economics, vol. 56, no. 1, pp. 97‐115.
Tanaka, T., Camerer, C.F. & Nguyen, Q. 2010, "Risk and Time Preferences: Linking Experimental and Household Survey Data from Vietnam", American Economic Review, vol. 100, no. 1, pp. 557‐571.
Yesuf, M. & Dalton, T.J. 2010, Experimental Studies on Risk, Loss and Ambiguity Aversion, and the Willingness to Pay for Water Efficient Maize in Eastern and Southern Africa, Department of Agricultural Economics, Manhattan, KS.
Yesuf, M. & Bluffstone, R.A. 2009, "Poverty, Risk Aversion, and Path Dependence in Low‐Income Countries: Experimental Evidence from Ethiopia", American Journal of Agricultural Economics, vol. 91, no. 4, pp. 1022‐1037.
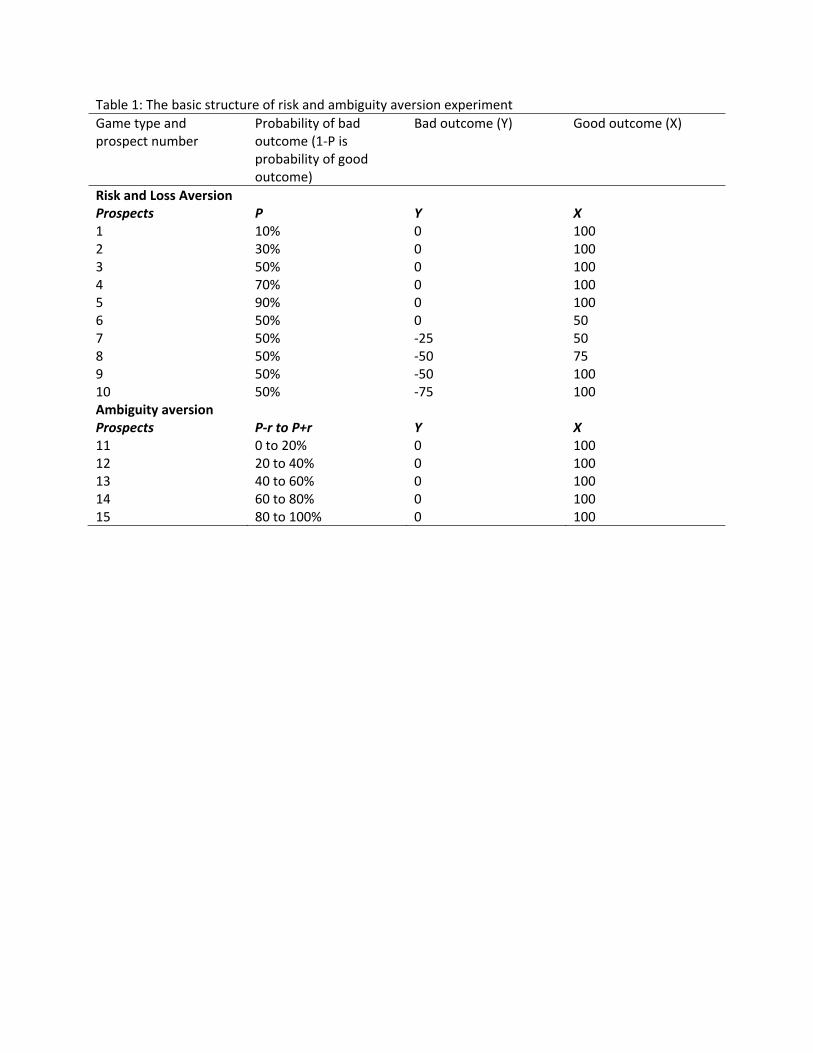
Table 1: The basic structure of risk and ambiguity aversion experiment Game type and prospect number
Probability of bad outcome (1‐P is probability of good outcome)
Bad outcome (Y) Good outcome (X)
Risk and Loss Aversion Prospects P Y X 1 10% 0 100 2 30% 0 100 3 50% 0 100 4 70% 0 100 5 90% 0 100 6 50% 0 50 7 50% ‐25 50 8 50% ‐50 75 9 50% ‐50 100 10 50% ‐75 100 Ambiguity aversion Prospects P‐r to P+r Y X 11 0 to 20% 0 100 12 20 to 40% 0 100 13 40 to 60% 0 100 14 60 to 80% 0 100 15 80 to 100% 0 100

Table 2: Choice list for prospect 1 (10% chance of 0 payoff and 90% chance 0f 100) [1] Bet on prospect 1 Ο Ο Receive 10 units for sure [2] Bet on prospect 1 Ο Ο Receive 20 units for sure [3] Bet on prospect 1 Ο Ο Receive 30 units for sure [4] Bet on prospect 1 Ο Ο Receive 40 units for sure [5] Bet on prospect 1 Ο Ο Receive 50 units for sure [6] Bet on prospect 1 Ο Ο Receive 60 units for sure [7] Bet on prospect 1 Ο Ο Receive 70 units for sure [8] Bet on prospect 1 Ο Ο Receive 80 units for sure [9] Bet on prospect 1 Ο Ο Receive 90 units for sure [10] Bet on prospect 1 Ο Ο Receive 100 units for sure
Put an X mark on each of your choices.

Table 3: Choice attributes for maize varieties and their levels
Trait Improved Varieties Reference Variety
“Kikamba” Yield Distribution( 90kg bags) FSD SSD TSD Base
No moisture stress 13 9 9 9 Moderate moisture stress 7 7 4 4 High moisture stress 3 3 3 1
Early Maturity (90 days) Yes or No No (135‐150 days) Insect Resistant Yes or No No Price (KSh/2kg packet)
Block 1 240/300/360 60 Block 2 340/400/460 60

Table 4. Descriptive statistics on attribute partition of choice selections and behavioral parameters
Selected Choice N Mean Std.
Deviation Minimum Maximum FSD 1089 .39 .49 .0 1.0 SSD 1089 .33 .47 .0 1.0 TSD 1089 .23 .42 .0 1.0 Early Maturity 1089 .66 .48 .0 1.0 Insect Resistance 1089 .66 .47 0 1 Price 1089 319 90 60 460 Not Selected FSD 2178 .14 .35 .0 1.0 SSD 2178 .17 .37 .0 1.0 TSD 2178 .22 .41 .0 1.0 Early Maturity 2178 .17 .38 .0 1.0 Insect Resistance 2178 .17 .38 0 1 Price 2178 204 145 60 460 Behavioral Parameters Risk Premium1 121 24 160 ‐250 250 Insurance2 121 82 62 ‐138 63 Optimism Index3 121 .32 2.65 ‐5.00 5.00
1Expressed as the summation of payments to avoid the gamble 2Expressed as the summation of payments to avoid the loss 3Expressed as a scale variable where ‐5=pessimistic, 0=neutral,5=optimistic
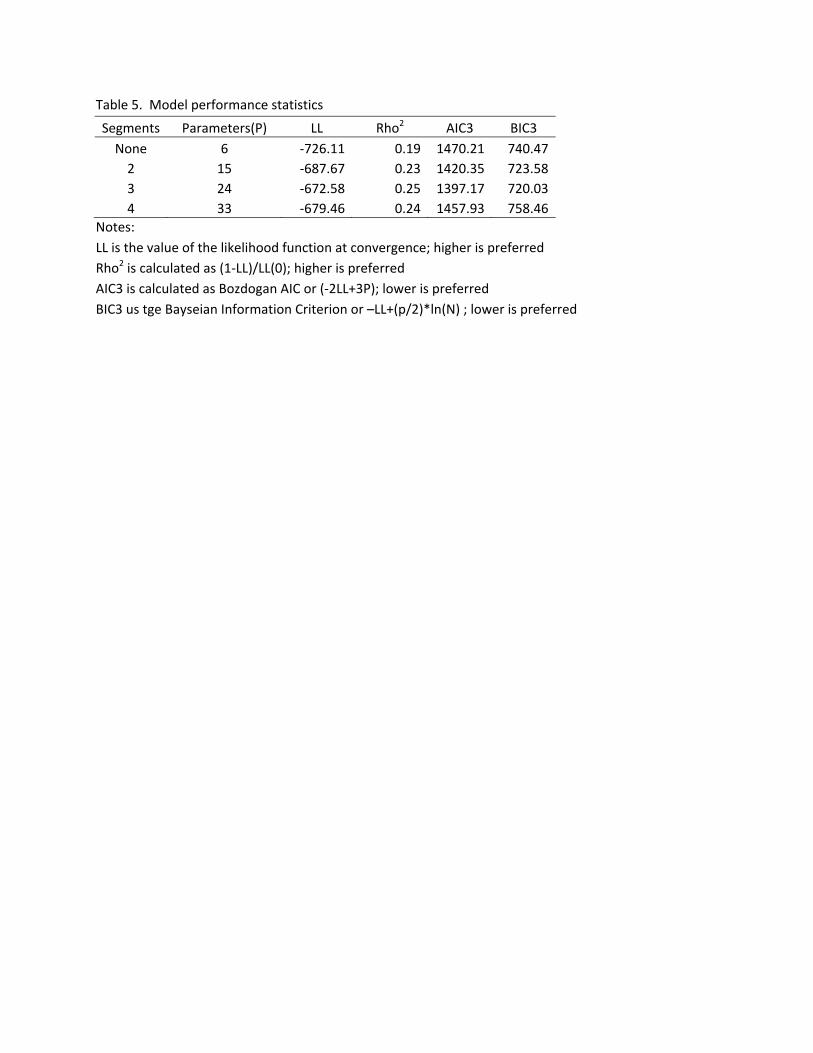
Table 5. Model performance statistics
Segments Parameters(P) LL Rho2 AIC3 BIC3 None 6 ‐726.11 0.19 1470.21 740.472 15 ‐687.67 0.23 1420.35 723.583 24 ‐672.58 0.25 1397.17 720.034 33 ‐679.46 0.24 1457.93 758.46
Notes: LL is the value of the likelihood function at convergence; higher is preferred Rho2 is calculated as (1‐LL)/LL(0); higher is preferred AIC3 is calculated as Bozdogan AIC or (‐2LL+3P); lower is preferred BIC3 us tge Bayseian Information Criterion or –LL+(p/2)*ln(N) ; lower is preferred

Table 6. Parameter Estimates for the multinomial and preferred Latent Class model specification
Unitary Three Segment
Variable (βc) Parameter Parameter
(1) Parameter (2) Parameter
(3) PRUSD ‐0.32 * 0.06 0.14 ‐0.78 *** FSD 1.63 * 4.14 *** ‐0.44 * 3.82 *** SSD 1.41 * 3.66 *** ‐0.59 ** 4.09 *** TSD 0.71 ** 2.89 *** ‐1.79 *** 3.79 *** IR 0.92 * 1.21 *** 0.69 *** 0.59 *** EM 0.94 * 0.60 *** 1.04 *** 1.90 ***
Determinant (θ) Constant ‐0.59 ‐0.93 ‐ Risk Premium 0.01 ‐0.01 ** ‐ Insurance ‐0.02 0.01 ‐ Optimism ‐0.03 ‐0.42 *** ‐
Membership (%) 0.58 0.19 0.24
Log L ‐
726.101 ‐662.584

Table 7. Marginal impact of trait and price elasticity of choice selection for two competing models
Trait Unitary Segment (3) Type II
Error Bias FSD 28.5 18.1 57% SSD 24.3 12.7 91% TSD 12.3 10.3 20% IR 16.2 8.0 101% EM 16.4 7.9 107% Price Elasticity ‐0.054 ‐0.118 117%

Table 8. Segment‐specific willingness to pay estimates for variety attributes calculated as the mean of individual‐specific estimates (KSh/trait)
FSD 388.7 *** 6.4 5.9 *** 227.1SSD 349.5 *** 2.6 ** 6.2 *** 204.9TSD 280.2 *** ‐37.9 *** 5.5 *** 171.4IR 109.9 *** 25.7 *** 1.1 *** 59.9EM 68.9 *** 42.6 *** 2.7 *** 33.4
WTPClass
Mean1 2 3

Figure 1. Three scenarios on yield and profitability dominance of drought tolerant maize technology.

Figure 2. Profiles of new varieties presented to farmers in Kenya

Figure 3. Profile of base variety “Kikamba” presented to farmers in Kenya