Embed Size (px)
Citation preview
DEMAND ESTIMATION FOR MEAT IN THE PHILIPPINES USINGSOURCE-DIFFERENTIATED ALMOST IDEAL
DEMAND SYSTEM *
Tito M. Ompoy1 and Edmundo B. Prantilla2
Correspondence: www. [email protected]
Abstract
The main objective of this study is to estimate the demand and income elasticities for meat (beef,broiler chicken, and pork) of the Philippines from 1994 to 2009, using the Source-Differentiated AlmostIdeal Demand System (SDAIDS). The model is capable of estimating simultaneously demand equationsof domestic and of different meat exporting countries. Included in the estimation are price- and income-elasticities. Data were taken from the United Nations Comtrade Trade Statistics website.
Results indicate that domestic production accounted for 94% of the total supply in the country forbeef, broiler chicken, and pork, while imported meat accounted for only 6%. The top exporting countriesof beef to the Philippines are India, Australia, New Zealand, USA and Brazil. For broiler chicken, they areUSA and Australia; and for pork, the countries are China and Brazil. Income elasticities noted that broilerchicken is the most responsive to an increase in consumer’s income. The Philippines’ broiler chicken hasthe highest position in the Philippine market relative to the other sources namely USA, Australia, andChina. Cross-price elasticities indicate weak substitutability and weak complementary.
Forecasting the possible volume of meat (beef, broiler chicken, and pork) demand in the countrycould be facilitated by precise estimates of price and income elasticities of demand. Hence, policymakers and development planners can make an assessment on the efficiency of the livestock industriesin the Philippines given said estimates. It is recommended that meat consumption per region should beanalyzed to have a clearer picture of the national demand for beef, chicken, and pork. In this way,surpluses or shortages could be avoided.
Keywords: demand elasticity, domestic and import meat demand, income. elasticity, SDAIDS model
Introduction
Meat, from which the majority of animal proteins are drawn, is an integral part of many peoples’ diet(Piggon and Marsh, 2004). Livestock and poultry meat products constitute one of the most importantagricultural outputs in the world. In 1983, developing countries consumed 36% of all meat consumedworldwide and by 1993 the percentage had risen to 48%. Increases in meat demand have been metlargely by substantial growth in livestock production in developing countries. Although per capita meatproduction in developing countries is still only a little more than one fourth of the developed-countries thedeveloping world supplies almost half the worlds meat on the average. Asia is the fastest growingsupplier, accounting for more than 80% of the net increase in meat output of developing countries (Newsand Views, 1999). The strong growth of demand for meat in Asia as well as in Central America isprojected to push meat imports of developing countries to 10 million tones in 2010 (FAO, 2002).
_______________________

2
1 MS Economics graduate, School of Applied Economics (SAEc), University of Southeastern Philippines(USeP), Bo. Obrero, Davao City.
2 Adviser and Professorial Lecturer at SAEc, USeP, Davao City. He went HOME ahead on January 13, 2013.
Data from the Food and Agriculture Organization (FAO) of the United Nations (Table 1) show thatChina consumes over 20 times its 1961 tonnage compared with 68 million mt in 2002. Next to China, theUnited States and Brazil registered an annual meat consumption of 36 million mt and 15 million mtrespectively. The overall trend is higher consumption of meat and meat products over time.
Table 1. Meat consumption per country (in million metric tons): 1998-2002.
Country Year 1988 1999 2000 2001 2002
ChinaUnited StatesBrazilGermanyRussian FederationFranceJapanMexicoIndiaItalyWorld
59 60 64 65 6833 35 35 35 3612 13 14 14 157 7 7 7 77 6 6 7 76 6 6 6 65 6 6 6 65 5 6 6 65 5 5 5 65 5 5 5 5
224 228 234 238 247Source: FAO, 2005
Table 2 shows that Denmark has the highest meat consumption per capita in 2002. The percapita meat consumption of Filipinos in 2002 is only 31 kg. Most of this growth is in developing countriesas their populations and incomes increase (FAO, Rome, 2005). The world’s per capita meat consumptionduring the period 1998 to 2002 has increased only by 2 kg. or by 5.26%, while total world meatconsumption over the same period increased from 224 million metric tons in 1998 to 247 million metrictons in 2002. Thus, most of the increase in total meat consumption in the world may be traced to increasein population.
FAO defines meat consumption as "the total meat retained for use in country for each country peryear”. Total meat includes meat from animals slaughtered in countries, irrespective of their origin, andcomprises horsemeat, poultry, and meat from all other domestic or wild animals such as camels, rabbits,reindeer, and game animals.
Table 2. Meat consumption per capita (in kg): 1998- 2002.
Country Year 1998 1999 2000 2001 2002

3
New ZealandLuxembourgBahamasDenmarkCyprusUnited StatesSpainFrench PolynesiaCanadaFranceChinaPhilippinesWorld
140 138 122 147 142NA NA 147 134 142
123 141 152 135 124126 130 130 139 146126 132 134 132 131120 124 122 120 125115 114 112 115 119105 103 107 109 112103 107 107 108 108102 100 100 103 101NA NA 49.9 NA 52.4NA NA 27 NA 3138 38 39 39 40
Source: FAO, 2005NA – no data available
In Southeast Asia, the Philippines leads in per capita consumption of pork while Malaysia leads inper capita consumption of chicken (Rosegrant et al., 1999). As a whole, meat consumption in SoutheastAsia is projected to more than double from 7 million metric tons in 1993 to 15 million metric tons by 2020.For Philippines, it is expected to quadruple from 1 million metric tons in 1993, to 4 million metric tons by2020. As a consequence of this trend in meat consumption, demand for feed grains is projected to doublefrom 15 million metric tons in 1993 to 30 million metric tons by 2020 (Delgado et al., 2000).
Demand for livestock and poultry meat products is influenced by food safety. Johnson (2009)reports a decrease in the international demand for pork and a subsequent drop in the prices of pork andpork products due to the H1N1 influenza virus or swine flu. Exporting countries were also affected bytrade restrictions by the different pork importing countries including the United States. There were alsopork importing countries that did impose trade restrictions because of sporadic animal-borne diseaseoutbreak. These countries include Bolivia, Costa Rica, Guatemala, and the Philippines. Similarly, theoutbreak of highly contagious H5N1 avian influenza in East and Southeast Asia in 2003 had a world wideimpact on poultry production, consumption, domestic prices, export prices, and trade patterns in both theinfected and the uninfected countries around the world. Major exporters were affected since the demandof meat products at the international market dropped substantially (Taha, 2003). Some analysts haveestimated that the 2009 H1N1 outbreak lesser impact on the pork industry than Bovine SpongiformEncephalopathy had on the beef industry in 2003 and avian influenza on the poultry industry for 2005-2006 (Market Research.Com).
The Philippines is one of the world’s important markets for beef, broiler chicken, and pork. Overthe past two decades demand for meat has considerably increased due to an increase in population andincome. Meat imports of the country in reached about 210,273 mt in 2009 (UN Comtrade, 2009) throughshipments of frozen meat products, while 2.729 million metric tons from domestic sources played asignificant role and have a very strong competitive position in the market (BAS, 2010). It is reported thatthe Philippines historically depends mainly on the domestic producers of meat with a comparativeadvantage in sustaining the country’s demand for meat.
Table 3 shows the total consumption of beef in the Philippines by country of origin. It shows thatthe domestic production has dominating from 1994-2009 with an annual increasing trend of 42 percent.Similarly, the Philippines got the highest share of 94% in 1994. It had recorded the lowest share of 66% in2001 wherein importation increased by almost 34% share in the Philippine beef market. In 2009, thePhilippines have the highest source of beef with 79%, India with 10.22% as the second largest supplier ofimported beef in the country and trade partners for almost 20 years, Australia with 4.6%, the rest of theWorld consist of Brazil and the United States with 4.13%, and New Zealand with 1.66%. Meanwhile,
4
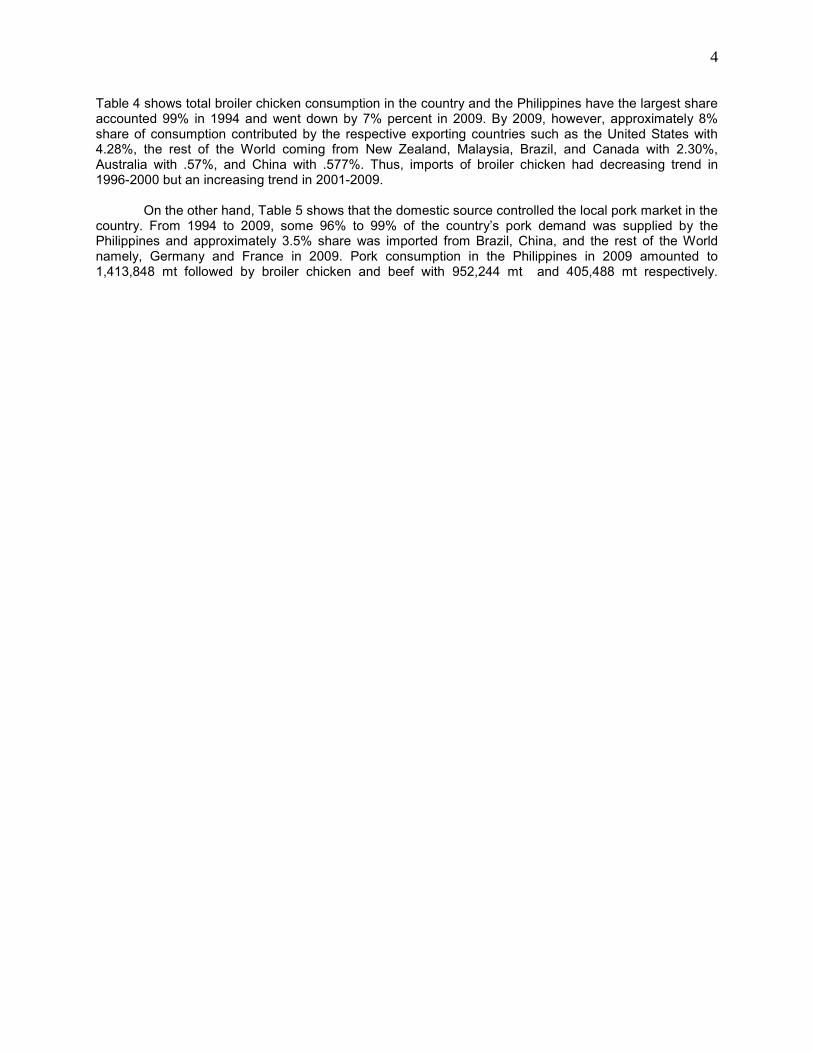
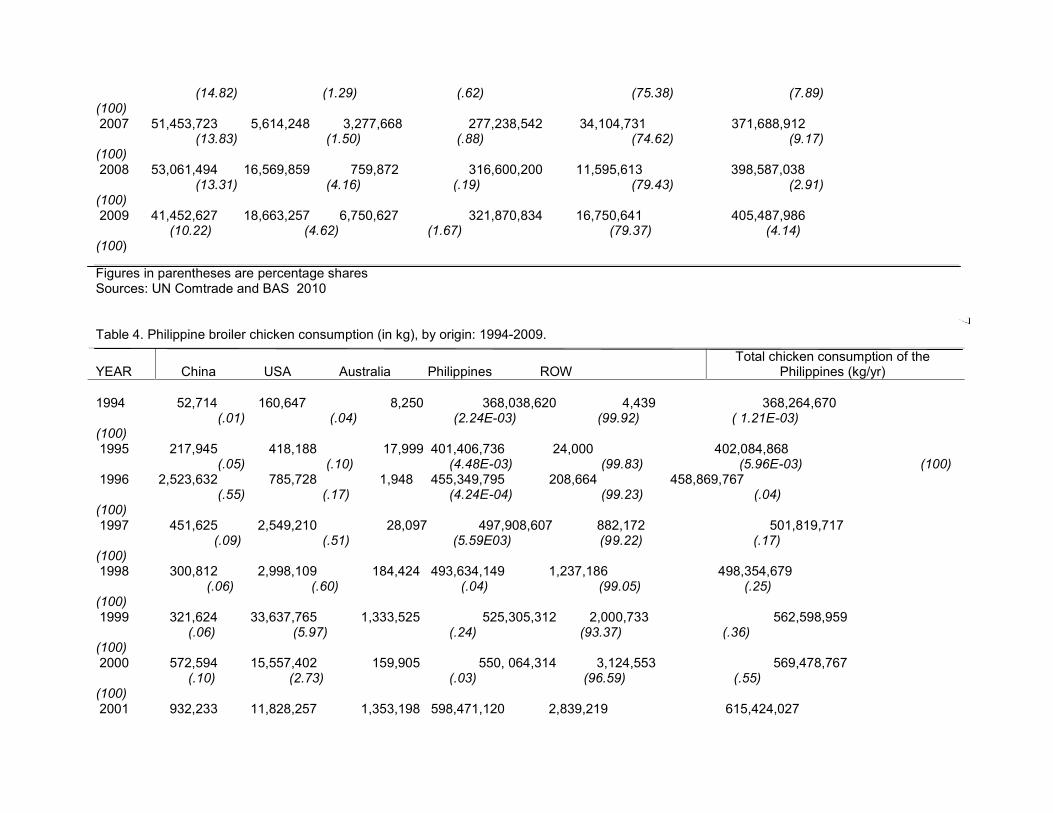
Table 4 shows total broiler chicken consumption in the country and the Philippines have the largest shareaccounted 99% in 1994 and went down by 7% percent in 2009. By 2009, however, approximately 8%share of consumption contributed by the respective exporting countries such as the United States with4.28%, the rest of the World coming from New Zealand, Malaysia, Brazil, and Canada with 2.30%,Australia with .57%, and China with .577%. Thus, imports of broiler chicken had decreasing trend in1996-2000 but an increasing trend in 2001-2009.
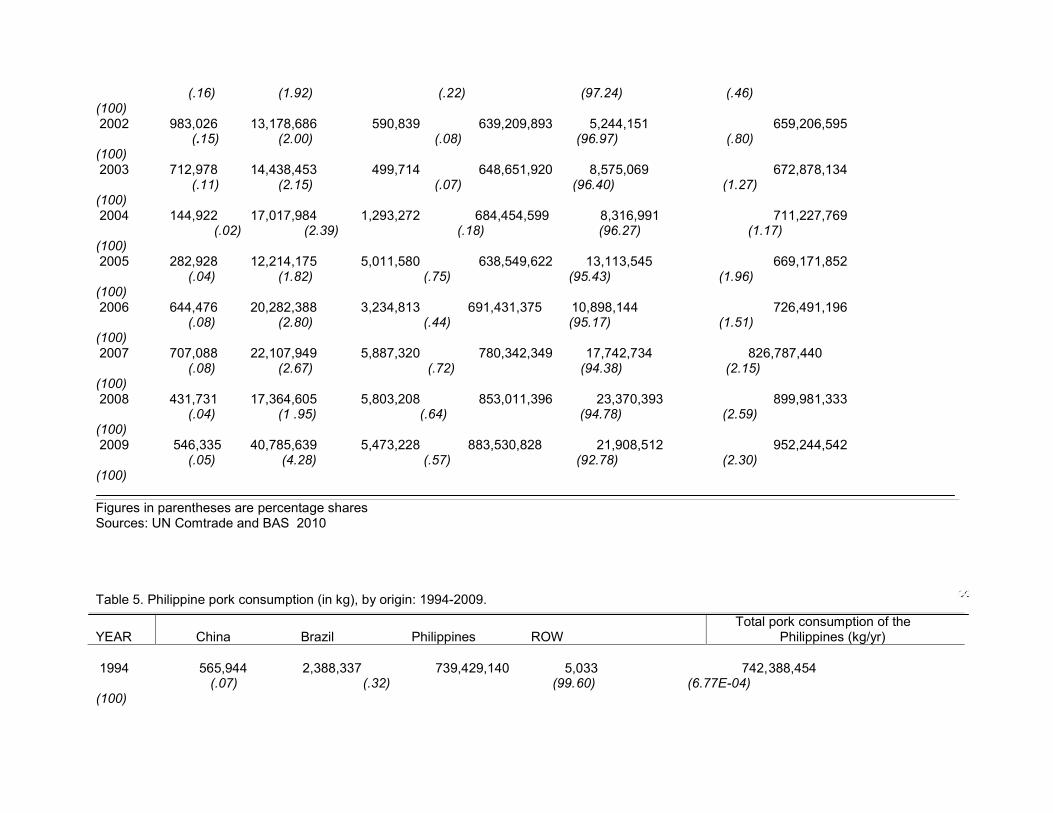
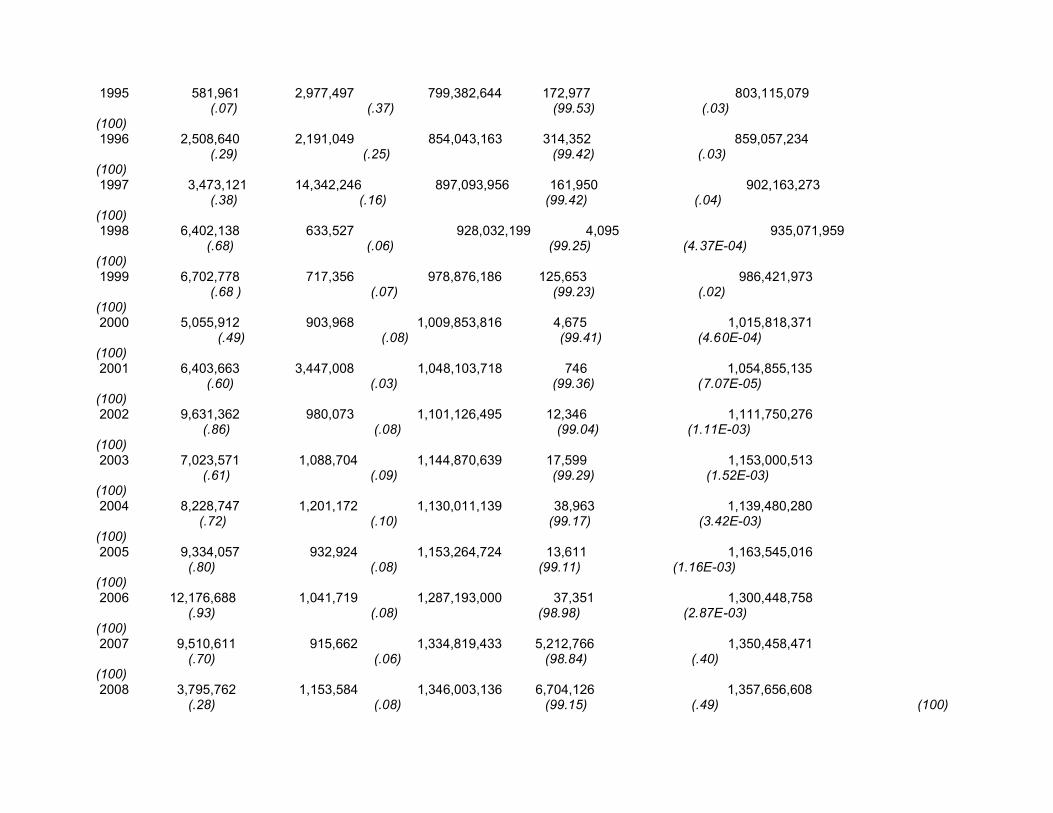
On the other hand, Table 5 shows that the domestic source controlled the local pork market in thecountry. From 1994 to 2009, some 96% to 99% of the country’s pork demand was supplied by thePhilippines and approximately 3.5% share was imported from Brazil, China, and the rest of the Worldnamely, Germany and France in 2009. Pork consumption in the Philippines in 2009 amounted to1,413,848 mt followed by broiler chicken and beef with 952,244 mt and 405,488 mt respectively.
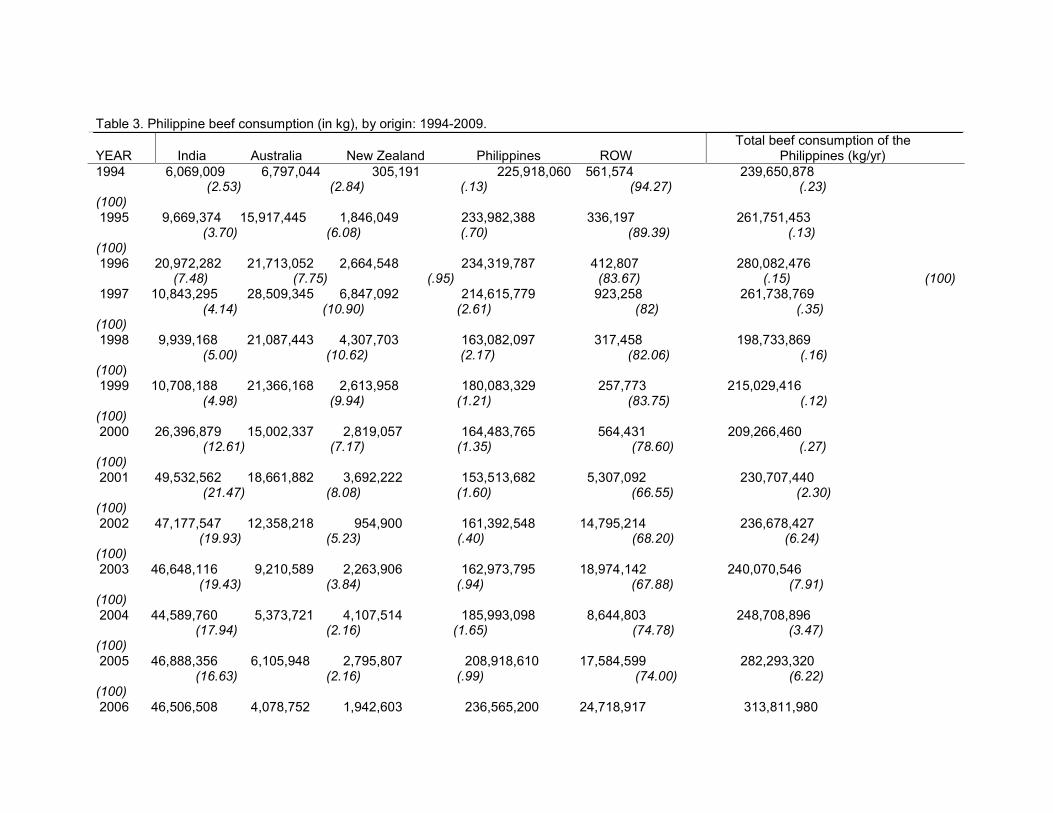
Table 3. Philippine beef consumption (in kg), by origin: 1994-2009.
1994 6,069,009 6,797,044 305,191 225,918,060 561,574 239,650,878(2.53) (2.84) (.13) (94.27) (.23)
(100)1995 9,669,374 15,917,445 1,846,049 233,982,388 336,197 261,751,453
(3.70) (6.08) (.70) (89.39) (.13)(100)1996 20,972,282 21,713,052 2,664,548 234,319,787 412,807 280,082,476
(7.48) (7.75) (.95) (83.67) (.15) (100)1997 10,843,295 28,509,345 6,847,092 214,615,779 923,258 261,738,769
(4.14) (10.90) (2.61) (82) (.35)(100)1998 9,939,168 21,087,443 4,307,703 163,082,097 317,458 198,733,869
(5.00) (10.62) (2.17) (82.06) (.16)(100)1999 10,708,188 21,366,168 2,613,958 180,083,329 257,773 215,029,416
(4.98) (9.94) (1.21) (83.75) (.12)(100)2000 26,396,879 15,002,337 2,819,057 164,483,765 564,431 209,266,460
(12.61) (7.17) (1.35) (78.60) (.27)(100)2001 49,532,562 18,661,882 3,692,222 153,513,682 5,307,092 230,707,440
(21.47) (8.08) (1.60) (66.55) (2.30)(100)2002 47,177,547 12,358,218 954,900 161,392,548 14,795,214 236,678,427
(19.93) (5.23) (.40) (68.20) (6.24)(100)2003 46,648,116 9,210,589 2,263,906 162,973,795 18,974,142 240,070,546
(19.43) (3.84) (.94) (67.88) (7.91)(100)2004 44,589,760 5,373,721 4,107,514 185,993,098 8,644,803 248,708,896
(17.94) (2.16) (1.65) (74.78) (3.47)(100)2005 46,888,356 6,105,948 2,795,807 208,918,610 17,584,599 282,293,320
(16.63) (2.16) (.99) (74.00) (6.22)(100)2006 46,506,508 4,078,752 1,942,603 236,565,200 24,718,917 313,811,980
YEAR India Australia New Zealand Philippines ROWTotal beef consumption of the
Philippines (kg/yr)
(14.82) (1.29) (.62) (75.38) (7.89)(100)2007 51,453,723 5,614,248 3,277,668 277,238,542 34,104,731 371,688,912
(13.83) (1.50) (.88) (74.62) (9.17)(100)2008 53,061,494 16,569,859 759,872 316,600,200 11,595,613 398,587,038
(13.31) (4.16) (.19) (79.43) (2.91)(100)2009 41,452,627 18,663,257 6,750,627 321,870,834 16,750,641 405,487,986
(10.22) (4.62) (1.67) (79.37) (4.14)(100)
Figures in parentheses are percentage sharesSources: UN Comtrade and BAS 2010
Table 4. Philippine broiler chicken consumption (in kg), by origin: 1994-2009.
1994 52,714 160,647 8,250 368,038,620 4,439 368,264,670(.01) (.04) (2.24E-03) (99.92) ( 1.21E-03)
(100)1995 217,945 418,188 17,999 401,406,736 24,000 402,084,868
(.05) (.10) (4.48E-03) (99.83) (5.96E-03) (100)1996 2,523,632 785,728 1,948 455,349,795 208,664 458,869,767
(.55) (.17) (4.24E-04) (99.23) (.04)(100)1997 451,625 2,549,210 28,097 497,908,607 882,172 501,819,717
(.09) (.51) (5.59E03) (99.22) (.17)(100)1998 300,812 2,998,109 184,424 493,634,149 1,237,186 498,354,679
(.06) (.60) (.04) (99.05) (.25)(100)1999 321,624 33,637,765 1,333,525 525,305,312 2,000,733 562,598,959
(.06) (5.97) (.24) (93.37) (.36)(100)2000 572,594 15,557,402 159,905 550, 064,314 3,124,553 569,478,767
(.10) (2.73) (.03) (96.59) (.55)(100)2001 932,233 11,828,257 1,353,198 598,471,120 2,839,219 615,424,027
YEAR China USA Australia Philippines ROWTotal chicken consumption of the
Philippines (kg/yr)
(.16) (1.92) (.22) (97.24) (.46)(100)2002 983,026 13,178,686 590,839 639,209,893 5,244,151 659,206,595
(.15) (2.00) (.08) (96.97) (.80)(100)2003 712,978 14,438,453 499,714 648,651,920 8,575,069 672,878,134
(.11) (2.15) (.07) (96.40) (1.27)(100)2004 144,922 17,017,984 1,293,272 684,454,599 8,316,991 711,227,769
(.02) (2.39) (.18) (96.27) (1.17)(100)2005 282,928 12,214,175 5,011,580 638,549,622 13,113,545 669,171,852
(.04) (1.82) (.75) (95.43) (1.96)(100)2006 644,476 20,282,388 3,234,813 691,431,375 10,898,144 726,491,196
(.08) (2.80) (.44) (95.17) (1.51)(100)2007 707,088 22,107,949 5,887,320 780,342,349 17,742,734 826,787,440
(.08) (2.67) (.72) (94.38) (2.15)(100)2008 431,731 17,364,605 5,803,208 853,011,396 23,370,393 899,981,333
(.04) (1 .95) (.64) (94.78) (2.59)(100)2009 546,335 40,785,639 5,473,228 883,530,828 21,908,512 952,244,542
(.05) (4.28) (.57) (92.78) (2.30)(100)
Figures in parentheses are percentage sharesSources: UN Comtrade and BAS 2010
Table 5. Philippine pork consumption (in kg), by origin: 1994-2009.
1994 565,944 2,388,337 739,429,140 5,033 742,388,454(.07) (.32) (99.60) (6.77E-04)
(100)
YEAR China Brazil Philippines ROWTotal pork consumption of the
Philippines (kg/yr)
1995 581,961 2,977,497 799,382,644 172,977 803,115,079(.07) (.37) (99.53) (.03)
(100)1996 2,508,640 2,191,049 854,043,163 314,352 859,057,234
(.29) (.25) (99.42) (.03)(100)1997 3,473,121 14,342,246 897,093,956 161,950 902,163,273
(.38) (.16) (99.42) (.04)(100)1998 6,402,138 633,527 928,032,199 4,095 935,071,959
(.68) (.06) (99.25) (4.37E-04)(100)1999 6,702,778 717,356 978,876,186 125,653 986,421,973
(.68 ) (.07) (99.23) (.02)(100)2000 5,055,912 903,968 1,009,853,816 4,675 1,015,818,371
(.49) (.08) (99.41) (4.60E-04)(100)2001 6,403,663 3,447,008 1,048,103,718 746 1,054,855,135
(.60) (.03) (99.36) (7.07E-05)(100)2002 9,631,362 980,073 1,101,126,495 12,346 1,111,750,276
(.86) (.08) (99.04) (1.11E-03)(100)2003 7,023,571 1,088,704 1,144,870,639 17,599 1,153,000,513
(.61) (.09) (99.29) (1.52E-03)(100)2004 8,228,747 1,201,172 1,130,011,139 38,963 1,139,480,280
(.72) (.10) (99.17) (3.42E-03)(100)2005 9,334,057 932,924 1,153,264,724 13,611 1,163,545,016
(.80) (.08) (99.11) (1.16E-03)(100)2006 12,176,688 1,041,719 1,287,193,000 37,351 1,300,448,758
(.93) (.08) (98.98) (2.87E-03)(100)2007 9,510,611 915,662 1,334,819,433 5,212,766 1,350,458,471
(.70) (.06) (98.84) (.40)(100)2008 3,795,762 1,153,584 1,346,003,136 6,704,126 1,357,656,608
(.28) (.08) (99.15) (.49) (100)
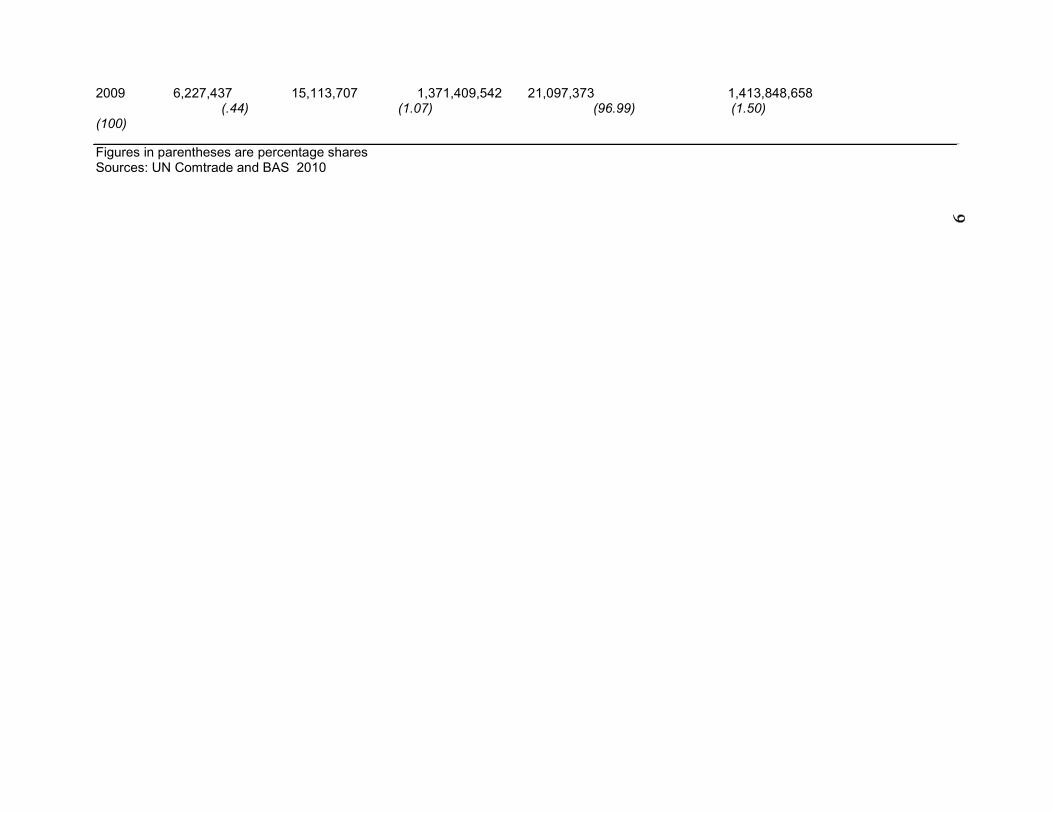
2009 6,227,437 15,113,707 1,371,409,542 21,097,373 1,413,848,658(.44) (1.07) (96.99) (1.50)
(100)
Figures in parentheses are percentage sharesSources: UN Comtrade and BAS 2010
10
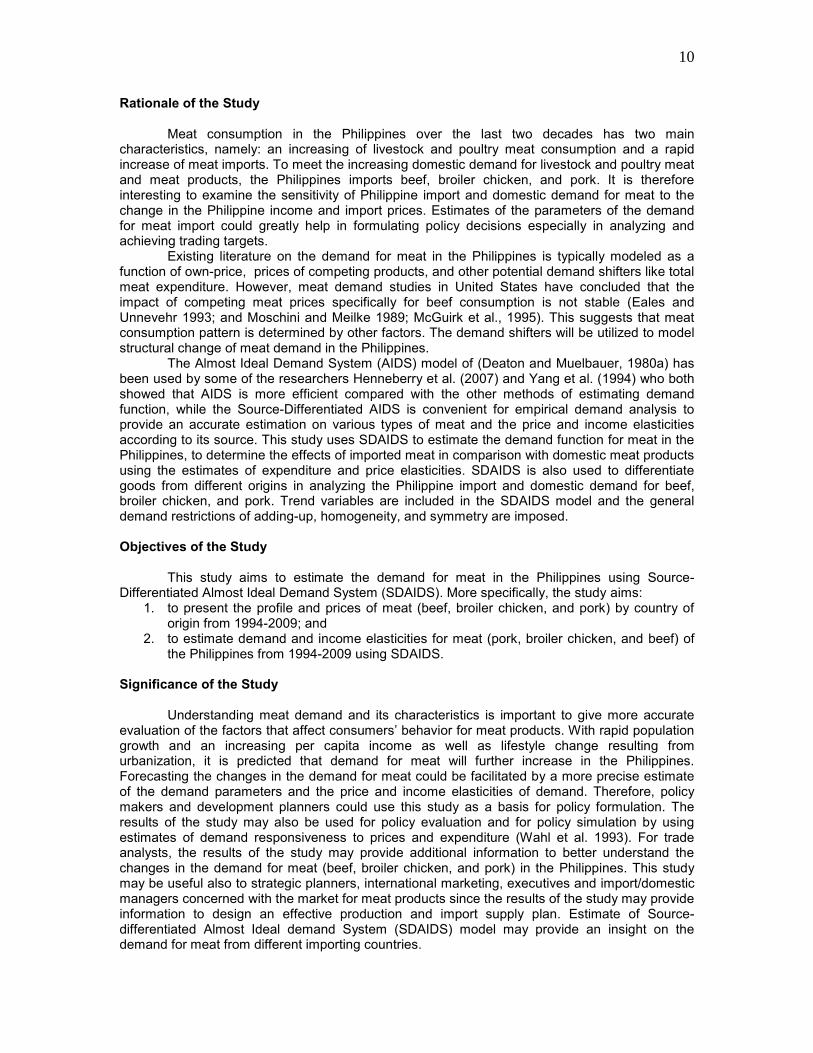
Rationale of the Study
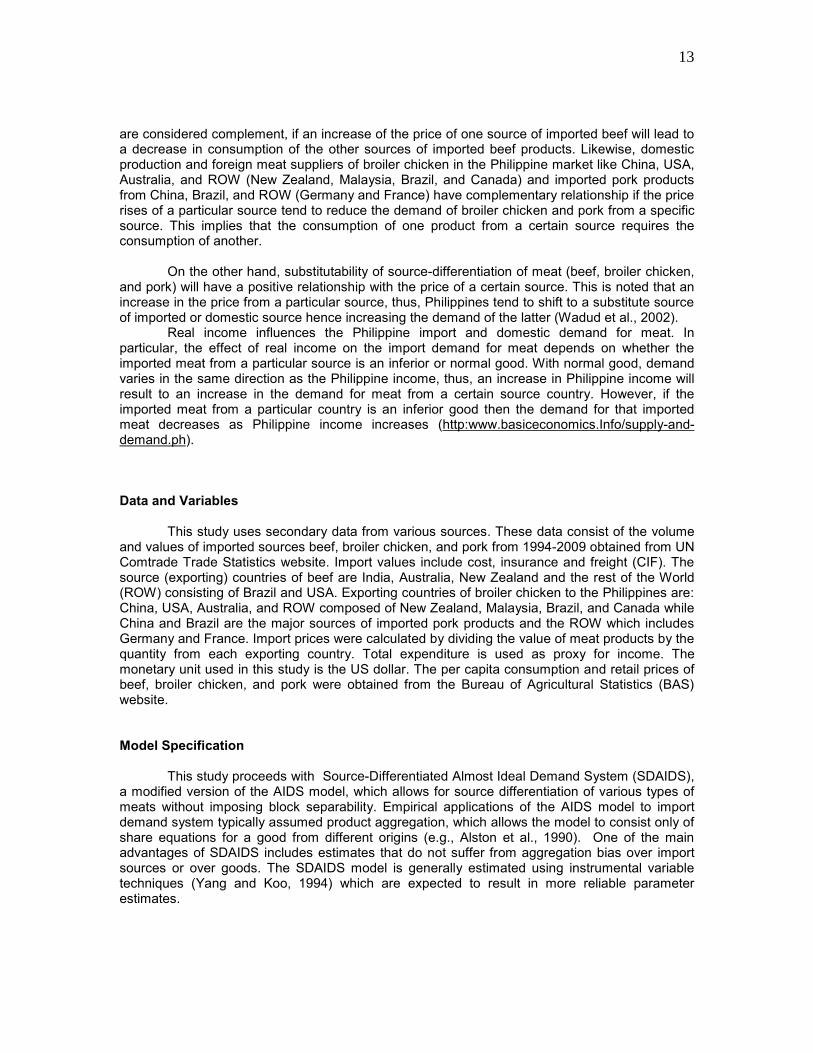
Meat consumption in the Philippines over the last two decades has two maincharacteristics, namely: an increasing of livestock and poultry meat consumption and a rapidincrease of meat imports. To meet the increasing domestic demand for livestock and poultry meatand meat products, the Philippines imports beef, broiler chicken, and pork. It is thereforeinteresting to examine the sensitivity of Philippine import and domestic demand for meat to thechange in the Philippine income and import prices. Estimates of the parameters of the demandfor meat import could greatly help in formulating policy decisions especially in analyzing andachieving trading targets.
Existing literature on the demand for meat in the Philippines is typically modeled as afunction of own-price, prices of competing products, and other potential demand shifters like totalmeat expenditure. However, meat demand studies in United States have concluded that theimpact of competing meat prices specifically for beef consumption is not stable (Eales andUnnevehr 1993; and Moschini and Meilke 1989; McGuirk et al., 1995). This suggests that meatconsumption pattern is determined by other factors. The demand shifters will be utilized to modelstructural change of meat demand in the Philippines.
The Almost Ideal Demand System (AIDS) model of (Deaton and Muelbauer, 1980a) hasbeen used by some of the researchers Henneberry et al. (2007) and Yang et al. (1994) who bothshowed that AIDS is more efficient compared with the other methods of estimating demandfunction, while the Source-Differentiated AIDS is convenient for empirical demand analysis toprovide an accurate estimation on various types of meat and the price and income elasticitiesaccording to its source. This study uses SDAIDS to estimate the demand function for meat in thePhilippines, to determine the effects of imported meat in comparison with domestic meat productsusing the estimates of expenditure and price elasticities. SDAIDS is also used to differentiategoods from different origins in analyzing the Philippine import and domestic demand for beef,broiler chicken, and pork. Trend variables are included in the SDAIDS model and the generaldemand restrictions of adding-up, homogeneity, and symmetry are imposed.
Objectives of the Study
This study aims to estimate the demand for meat in the Philippines using Source-Differentiated Almost Ideal Demand System (SDAIDS). More specifically, the study aims:
1. to present the profile and prices of meat (beef, broiler chicken, and pork) by country oforigin from 1994-2009; and
2. to estimate demand and income elasticities for meat (pork, broiler chicken, and beef) ofthe Philippines from 1994-2009 using SDAIDS.
Significance of the Study
Understanding meat demand and its characteristics is important to give more accurateevaluation of the factors that affect consumers’ behavior for meat products. With rapid populationgrowth and an increasing per capita income as well as lifestyle change resulting fromurbanization, it is predicted that demand for meat will further increase in the Philippines.Forecasting the changes in the demand for meat could be facilitated by a more precise estimateof the demand parameters and the price and income elasticities of demand. Therefore, policymakers and development planners could use this study as a basis for policy formulation. Theresults of the study may also be used for policy evaluation and for policy simulation by usingestimates of demand responsiveness to prices and expenditure (Wahl et al. 1993). For tradeanalysts, the results of the study may provide additional information to better understand thechanges in the demand for meat (beef, broiler chicken, and pork) in the Philippines. This studymay be useful also to strategic planners, international marketing, executives and import/domesticmanagers concerned with the market for meat products since the results of the study may provideinformation to design an effective production and import supply plan. Estimate of Source-differentiated Almost Ideal demand System (SDAIDS) model may provide an insight on thedemand for meat from different importing countries.

11
Scope and LimitationsThis study will estimate the demand for meat in the Philippines. Three type of meat are
the focus of the study, namely: beef, broiler chicken, and pork. One limitation of the study is thatstatistical data on the consumption pattern of meat products are often incomplete or not available.Annual data of retail price and per capita consumption of beef, broiler chicken, and pork for theperiod 1994-2009 are used in this study while wholesale prices of meat are not used due to theirunavailability. In addition, quantity and expenditure of the Philippines from exporting countrieswere acquired from the United Nations Commodity Trade Statistics (UN, Comtrade). The analysisis also limited to the top meat exporting countries to the Philippines such as beef from India,Australia, and New Zealand; broiler chicken from China, Australia, and USA, and pork fromBrazil and China and the Rest of the World taking into consideration the number of years thecountry has exported meat to the Philippines. The rest of the world (ROW) is composed ofcountries that export beef, broiler chicken, and pork irregularly to the Philippines and in minimalamount. The countries under ROW are: Brazil and USA for beef, Brazil, New Zealand, Malaysia,and Canada for broiler chicken, and Germany and France for pork.
METHODOLOGY
Theoretical Framework
International trade is widely acknowledged as an essential element in broadening theprospects for economic expansion. To this extent, international trade has been described as anengine for economic growth. It promotes domestic efficiency, international specialization andinternational competitiveness, ultimately leading to greater levels of global output. Undoubtedly,the process of global expansion critically depends on foreign trade activities.
The process of economic expansion or growth sets in motion a growing demand forcapital and consumer goods as well as raw materials to sustain the expansion. Harrod andHague (1963) have stressed the need to sustain increasing levels of consumption, investmentand production as growth progresses. Clearly, economic growth necessitates the provision ofadditional resources as it occurs. However, the provision of this extra resource cannot besustained out of domestic supply alone, implying that imports of foreign resources are necessaryto fill the gap between a growing domestic aggregate demand and a limited supply (Cheelo,1998).
International trade has significant dynamic effects that can provide strong stimulus toeconomic growth. It improves a developing country’s access to new production technologies, tointernational capital, and to labor skills leading to an outward shift of the production possibilityfrontier. Foreign trade overcomes the limitations of a small domestic market, enabling the countryto take advantage of specialization and scale economies. It helps promote growth of nationalincome without being subject to a binding demand constraints (Bautista and Tecson, 2003).Export demand refers to the demand by foreign countries for goods and services produceddomestically while import demand refers to demand by domestic residents for foreign producedgoods and services.
Following the assertions of the traditional theory of imports demand determinants,scholars maintain that national income is an important determinant of imports in any openeconomy, hence, a positive relationship between imports and national income is often postulated(Harrod and Hague, 1963). This relationship has a microeconomic foundation, which states thatthe aim of the consumer is to maximize satisfaction so that higher income would mean higherdemand for goods and services.
Import prices are similarly asserted to be important in determining imports demand. Caveand Jones (1985) postulated that if the price of imports rises, three ingredients contribute to a
12
decline of import demand: (a) a substitution effect in consumption where the rise in import priceserves to lessen the demand on the importable and more consumption will go to its substituteproducts; (b) an income effect where the rise in the price of imports lowers real income andtherefore lowers imports; and (c) a production effect where the rise in import price serves toattract resource from other industries to the import-competing industry, so that importablecommodities decrease.
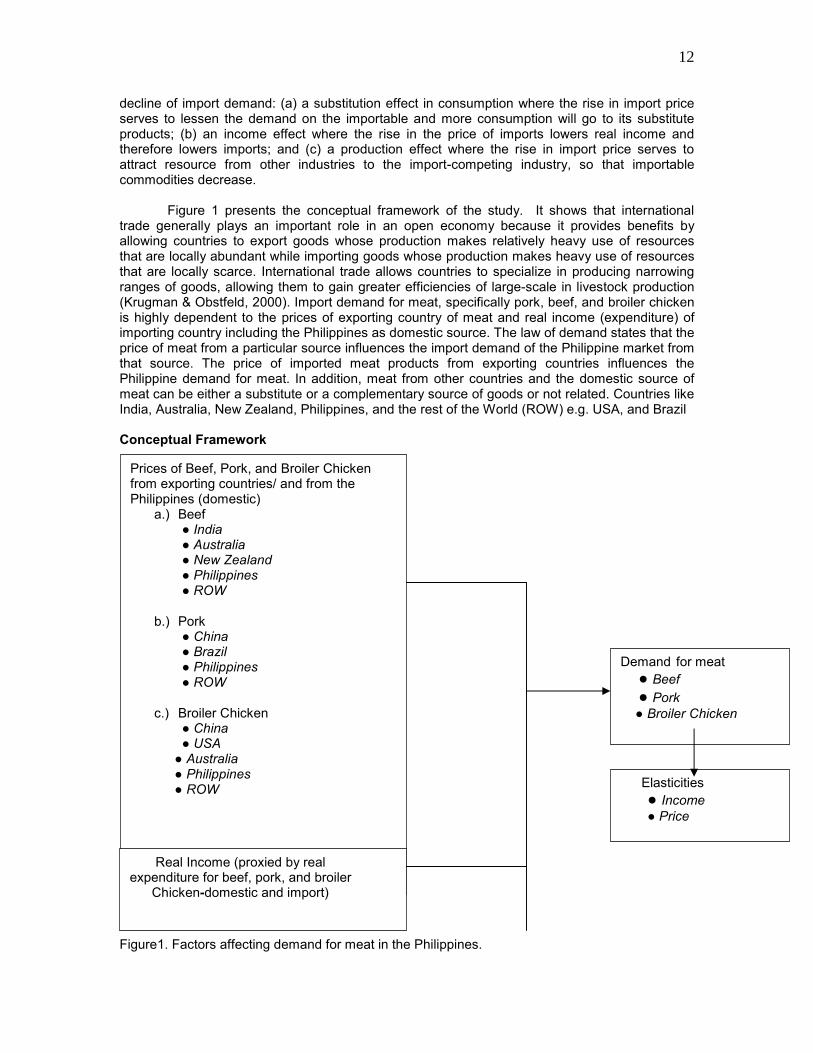
Figure 1 presents the conceptual framework of the study. It shows that internationaltrade generally plays an important role in an open economy because it provides benefits byallowing countries to export goods whose production makes relatively heavy use of resourcesthat are locally abundant while importing goods whose production makes heavy use of resourcesthat are locally scarce. International trade allows countries to specialize in producing narrowingranges of goods, allowing them to gain greater efficiencies of large-scale in livestock production(Krugman & Obstfeld, 2000). Import demand for meat, specifically pork, beef, and broiler chickenis highly dependent to the prices of exporting country of meat and real income (expenditure) ofimporting country including the Philippines as domestic source. The law of demand states that theprice of meat from a particular source influences the import demand of the Philippine market fromthat source. The price of imported meat products from exporting countries influences thePhilippine demand for meat. In addition, meat from other countries and the domestic source ofmeat can be either a substitute or a complementary source of goods or not related. Countries likeIndia, Australia, New Zealand, Philippines, and the rest of the World (ROW) e.g. USA, and Brazil
Conceptual Framework
Figure1. Factors affecting demand for meat in the Philippines.
Elasticities● Income● Price
Prices of Beef, Pork, and Broiler Chickenfrom exporting countries/ and from thePhilippines (domestic)
a.) Beef● India● Australia● New Zealand● Philippines● ROW
b.) Pork● China● Brazil● Philippines● ROW
c.) Broiler Chicken● China● USA
● Australia● Philippines● ROW
Demand for meat● Beef● Pork● Broiler Chicken
Real Income (proxied by realexpenditure for beef, pork, and broiler
Chicken-domestic and import)
13
are considered complement, if an increase of the price of one source of imported beef will lead toa decrease in consumption of the other sources of imported beef products. Likewise, domesticproduction and foreign meat suppliers of broiler chicken in the Philippine market like China, USA,Australia, and ROW (New Zealand, Malaysia, Brazil, and Canada) and imported pork productsfrom China, Brazil, and ROW (Germany and France) have complementary relationship if the pricerises of a particular source tend to reduce the demand of broiler chicken and pork from a specificsource. This implies that the consumption of one product from a certain source requires theconsumption of another.
On the other hand, substitutability of source-differentiation of meat (beef, broiler chicken,and pork) will have a positive relationship with the price of a certain source. This is noted that anincrease in the price from a particular source, thus, Philippines tend to shift to a substitute sourceof imported or domestic source hence increasing the demand of the latter (Wadud et al., 2002).
Real income influences the Philippine import and domestic demand for meat. Inparticular, the effect of real income on the import demand for meat depends on whether theimported meat from a particular source is an inferior or normal good. With normal good, demandvaries in the same direction as the Philippine income, thus, an increase in Philippine income willresult to an increase in the demand for meat from a certain source country. However, if theimported meat from a particular country is an inferior good then the demand for that importedmeat decreases as Philippine income increases (http:www.basiceconomics.Info/supply-and-demand.ph).
Data and Variables
This study uses secondary data from various sources. These data consist of the volumeand values of imported sources beef, broiler chicken, and pork from 1994-2009 obtained from UNComtrade Trade Statistics website. Import values include cost, insurance and freight (CIF). Thesource (exporting) countries of beef are India, Australia, New Zealand and the rest of the World(ROW) consisting of Brazil and USA. Exporting countries of broiler chicken to the Philippines are:China, USA, Australia, and ROW composed of New Zealand, Malaysia, Brazil, and Canada whileChina and Brazil are the major sources of imported pork products and the ROW which includesGermany and France. Import prices were calculated by dividing the value of meat products by thequantity from each exporting country. Total expenditure is used as proxy for income. Themonetary unit used in this study is the US dollar. The per capita consumption and retail prices ofbeef, broiler chicken, and pork were obtained from the Bureau of Agricultural Statistics (BAS)website.
Model Specification
This study proceeds with Source-Differentiated Almost Ideal Demand System (SDAIDS),a modified version of the AIDS model, which allows for source differentiation of various types ofmeats without imposing block separability. Empirical applications of the AIDS model to importdemand system typically assumed product aggregation, which allows the model to consist only ofshare equations for a good from different origins (e.g., Alston et al., 1990). One of the mainadvantages of SDAIDS includes estimates that do not suffer from aggregation bias over importsources or over goods. The SDAIDS model is generally estimated using instrumental variabletechniques (Yang and Koo, 1994) which are expected to result in more reliable parameterestimates.
14
12 i h
i h
i j
i h
i h
i j
βih
βih
βih
βih
i h
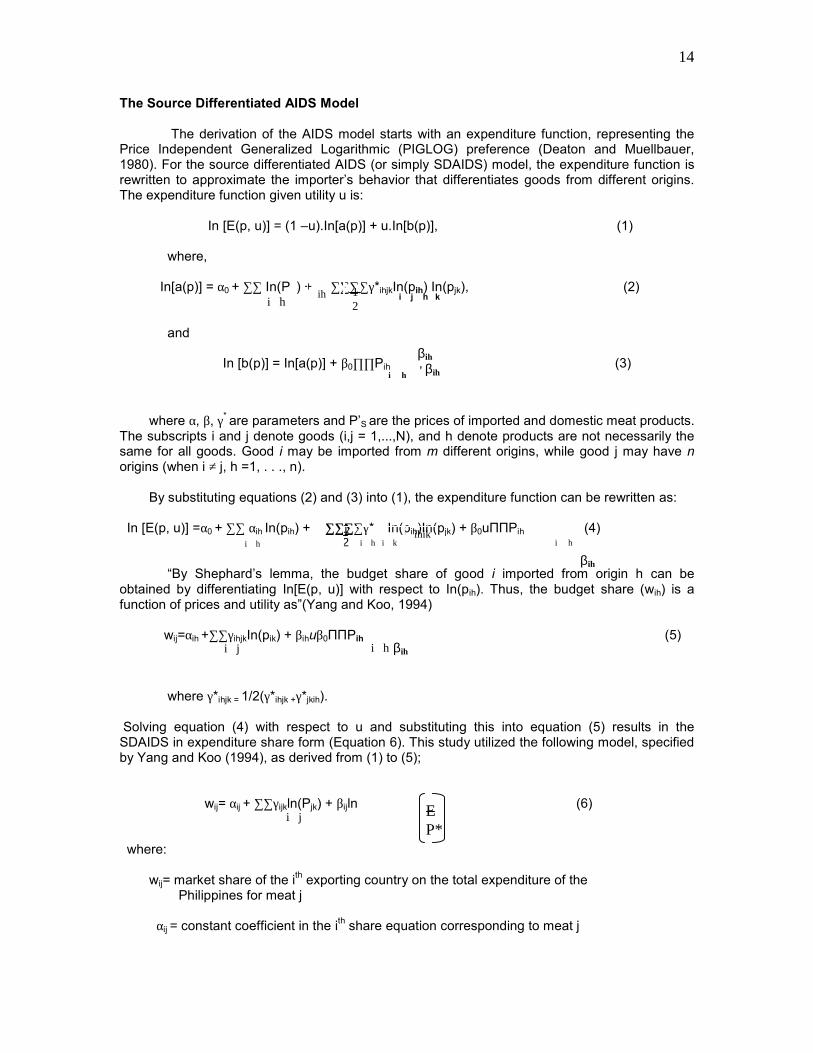
The Source Differentiated AIDS Model
The derivation of the AIDS model starts with an expenditure function, representing thePrice Independent Generalized Logarithmic (PIGLOG) preference (Deaton and Muellbauer,1980). For the source differentiated AIDS (or simply SDAIDS) model, the expenditure function isrewritten to approximate the importer’s behavior that differentiates goods from different origins.The expenditure function given utility u is:
In [E(p, u)] = (1 –u).In[a(p)] + u.In[b(p)], (1)
where,
In[a(p)] = α0 + ∑∑ In(P ) + ∑∑∑∑γ*ihjkIn(pih) In(pjk), (2)i j h k
and
In [b(p)] = In[a(p)] + β0∏∏Pih , (3)
where α, β, γ* are parameters and P’S are the prices of imported and domestic meat products.The subscripts i and j denote goods (i,j = 1,...,N), and h denote products are not necessarily thesame for all goods. Good i may be imported from m different origins, while good j may have norigins (when i ≠ j, h =1, . . ., n).
By substituting equations (2) and (3) into (1), the expenditure function can be rewritten as:
In [E(p, u)] =α0 + ∑∑ αih In(pih) + ∑∑∑∑γ* In(pih)In(pjk) + β0uППPih (4)
“By Shephard’s lemma, the budget share of good i imported from origin h can beobtained by differentiating In[E(p, u)] with respect to In(pih). Thus, the budget share (wih) is afunction of prices and utility as”(Yang and Koo, 1994)
wij=αih +∑∑γihjkIn(pik) + βihuβ0ППPih (5)
where γ*ihjk = 1/2(γ*ihjk +γ*jkih).
Solving equation (4) with respect to u and substituting this into equation (5) results in theSDAIDS in expenditure share form (Equation 6). This study utilized the following model, specifiedby Yang and Koo (1994), as derived from (1) to (5);
wij= αij + ∑∑γijkln(Pjk) + βijln (6)
where:
wij= market share of the ith exporting country on the total expenditure of thePhilippines for meat j
αij = constant coefficient in the ith share equation corresponding to meat j
12
i h j k
ih
ihjk
EP*
15
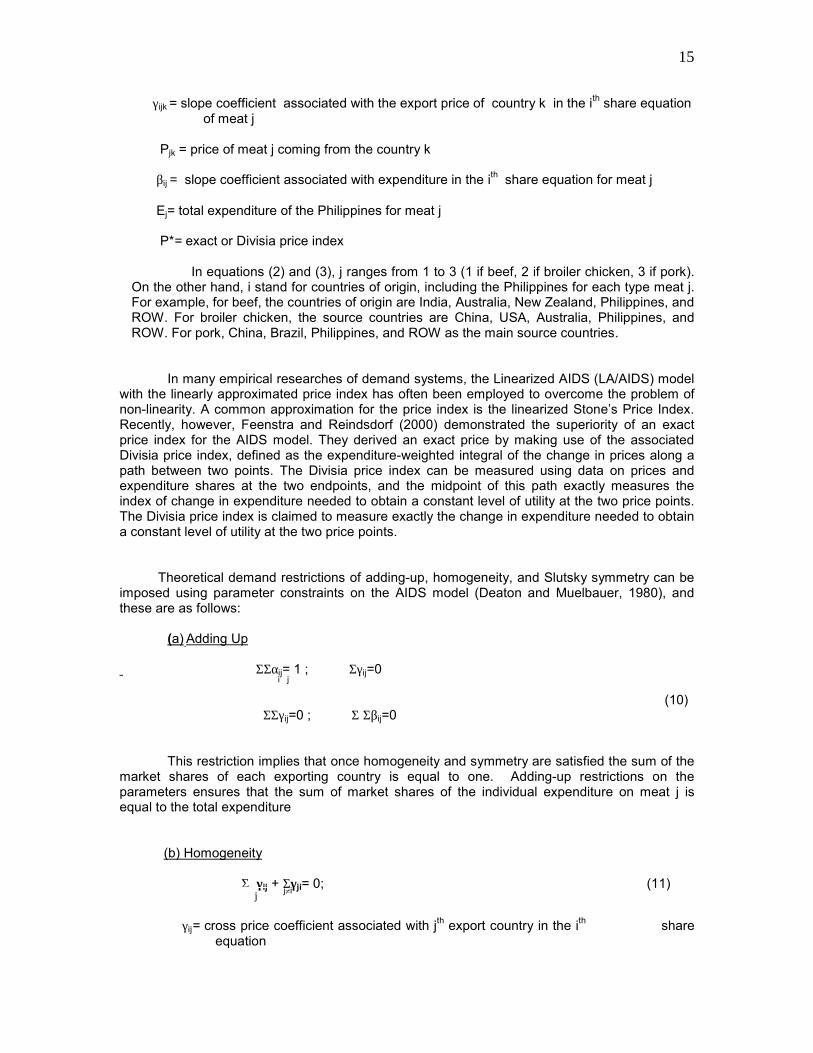
γijk = slope coefficient associated with the export price of country k in the ith share equationof meat j
Pjk = price of meat j coming from the country k
βij = slope coefficient associated with expenditure in the ith share equation for meat j
Ej= total expenditure of the Philippines for meat j
P*= exact or Divisia price index
In equations (2) and (3), j ranges from 1 to 3 (1 if beef, 2 if broiler chicken, 3 if pork).On the other hand, i stand for countries of origin, including the Philippines for each type meat j.For example, for beef, the countries of origin are India, Australia, New Zealand, Philippines, andROW. For broiler chicken, the source countries are China, USA, Australia, Philippines, andROW. For pork, China, Brazil, Philippines, and ROW as the main source countries.
In many empirical researches of demand systems, the Linearized AIDS (LA/AIDS) modelwith the linearly approximated price index has often been employed to overcome the problem ofnon-linearity. A common approximation for the price index is the linearized Stone’s Price Index.Recently, however, Feenstra and Reindsdorf (2000) demonstrated the superiority of an exactprice index for the AIDS model. They derived an exact price by making use of the associatedDivisia price index, defined as the expenditure-weighted integral of the change in prices along apath between two points. The Divisia price index can be measured using data on prices andexpenditure shares at the two endpoints, and the midpoint of this path exactly measures theindex of change in expenditure needed to obtain a constant level of utility at the two price points.The Divisia price index is claimed to measure exactly the change in expenditure needed to obtaina constant level of utility at the two price points.
Theoretical demand restrictions of adding-up, homogeneity, and Slutsky symmetry can beimposed using parameter constraints on the AIDS model (Deaton and Muelbauer, 1980), andthese are as follows:
(a) Adding Up
ΣΣαij= 1 ; Σγij=0i j
(10)ΣΣγij=0 ; Σ Σβij=0
This restriction implies that once homogeneity and symmetry are satisfied the sum of themarket shares of each exporting country is equal to one. Adding-up restrictions on theparameters ensures that the sum of market shares of the individual expenditure on meat j isequal to the total expenditure
(b) Homogeneity
Σ γij + Σγji= 0; (11)j≠i
γij= cross price coefficient associated with jth export country in the ith shareequation
j

16
Homogeniety restrictions state that the system of function of degree zero implies thatthe share for each product source i will not be changed if total expenditure E and all prices Piare increased by the same percentage (Deaton and Muelbauer, 1980). It also implies that theconsumers in the country react only to real prices and income. The sum of the Marshallian own-price and cross price elasticity for a particular meat j is zero taking account of signs (Tomek andRobinson, 1981) market share (Wi) will not change if relative prices (lnPj) and real expenditure(lnE/Pj) will change by the same percentage.
(c) Symmetry
γij = γji , i≠j (12)
where:
γi= cross price coefficient associated with ith export country in the ith share equation
γj= cross price coefficient associated with jth export country in thejth share equation
This restriction is defined as the substitution effect of a change of Pj in market share wi isequal to the substitution effect of a change in Pi on Wj. This means that an increase in the price ofgood from source i will cause an increase in the quantity demanded from source j caused by anincrease in the price of good from source i (Deaton and Muelbauer, 1980). The cross-price effect,however, of changes in price of meat j products on the demand for another sources are equal.
Estimation of Elasticity
The estimated parameters of SDAIDS equation form the basis of elasticity, whichmeasures the percentage response of the market share to a one percent change in prices or totalexpenditure. The Marshallian elasticity is used in this study. This elasticity formula is also used byYang, S. and Koo W. (1994), Lee et al. (1994), Fabiosa J. and Ukhova Y. (2000), Taljaard et al.(2004), and Wadud (2006) in their respective AIDS model study.
Marshallian Own-Price Elasticity
ηii = -1+( γi/wi)-βi i=1,2,…….,5 (13)
where:
ηii= Marshallian own-price elasticity of commodity iγi = slope coefficient associated with the own-price in the ith share equation
wi= market share in the ith sourceβi = slope coefficient associated with expenditure in the ith share equation
The Marshallian own-price elasticity measures the responsiveness of the Philippineimport demand from source i for beef like India, Australia, New Zealand, Philippine, and ROW toa change in the export price of country i expected, this will yield a negative sign due to the inverserelationship of price and quantity demanded. If the absolute value of own-price elasticity is greaterthan 1, the demand of the commodity is considered elastic, i,e., quantity demanded isresponsive to changes in price. In the contrary, if the absolute value of own-price elasticity is less

17
Wi
than 1, the demand of the commodity is inelastic and considered not to be responsive to changesin price.
Marshallian Cross-Price Elasticity
ηij= (γij-βiwj)/wi i=1,2,…….,5 (14)
where:ηij = Marshallian cross-price elasticity of commodity iγij= slope coefficient associated with the cross-price of good in the jth share
equation.
βi= slope coefficient associated with expenditure in the ith shareequation
wj = market share in the jth commoditywi= market share of the ith commodity
The Marshallian cross-price elasticity measures the responsiveness of import demandcoming from source i with same commodity and source like India to a change in the price ofimports from country j like Australia for beef. If the absolute value of cross-price elasticity ispositive then the two sources are considered substitute. If it is negative, the two sourcescomplement each other.
Income Elasticity
€y= 1 + i=1,2,…….,5 (15)
where:
€y= expenditure elasticityβi= slope coefficient of real total income (expenditure)wi= market share of the ith source
Expenditure elasticity is used as a proxy of income elasticity in this study. It measures thepercent change in the market share of a commodity from a one percent change in totalexpenditure. If the expenditure elasticity is positive, the commodity from a certain source isconsidered normal. If the expenditure elasticity is negative, the commodity from certain source isconsidered inferior. Equations (13), (14), and (15) are used also for the other types of meat(broiler chicken and pork).
Meanwhile, to estimate the annual growth rate of volume of meat (beef, broiler chicken,and pork) consumption in terms of metric tons in the Philippines from 1994 to 2009 using simplelinear model express as:
lnY = a + bt (16)
where:
βi
wi
18
ln Y = the natural log of meat (beef, broiler chicken, andpork) consumption
t = time in year (1, 2, 3,………,16)
b = growth rate of volume of meat consumption
Equation 16 is also used for expenditure and prices of the Philippines for domestic andimported on other types of meat (beef, broiler chicken and pork), by source under study.
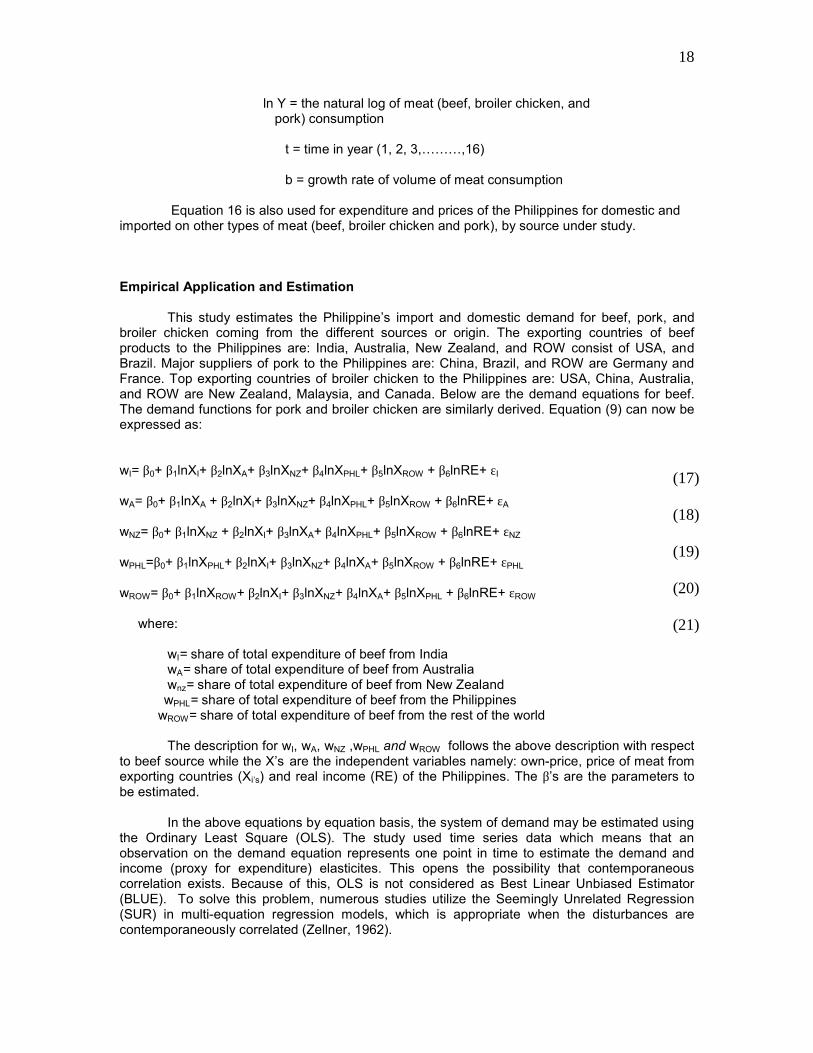
Empirical Application and Estimation
This study estimates the Philippine’s import and domestic demand for beef, pork, andbroiler chicken coming from the different sources or origin. The exporting countries of beefproducts to the Philippines are: India, Australia, New Zealand, and ROW consist of USA, andBrazil. Major suppliers of pork to the Philippines are: China, Brazil, and ROW are Germany andFrance. Top exporting countries of broiler chicken to the Philippines are: USA, China, Australia,and ROW are New Zealand, Malaysia, and Canada. Below are the demand equations for beef.The demand functions for pork and broiler chicken are similarly derived. Equation (9) can now beexpressed as:
wI= β0+ β1lnXI+ β2lnXA+ β3lnXNZ+ β4lnXPHL+ β5lnXROW + β6lnRE+ εI
wA= β0+ β1lnXA + β2lnXI+ β3lnXNZ+ β4lnXPHL+ β5lnXROW + β6lnRE+ εA
wNZ= β0+ β1lnXNZ + β2lnXI+ β3lnXA+ β4lnXPHL+ β5lnXROW + β6lnRE+ εNZ
wPHL=β0+ β1lnXPHL+ β2lnXI+ β3lnXNZ+ β4lnXA+ β5lnXROW + β6lnRE+ εPHL
wROW= β0+ β1lnXROW+ β2lnXI+ β3lnXNZ+ β4lnXA+ β5lnXPHL + β6lnRE+ εROW
where:
wI= share of total expenditure of beef from IndiawA= share of total expenditure of beef from Australiawnz= share of total expenditure of beef from New ZealandwPHL= share of total expenditure of beef from the Philippines
wROW= share of total expenditure of beef from the rest of the world
The description for wI, wA, wNZ ,wPHL and wROW follows the above description with respectto beef source while the X’s are the independent variables namely: own-price, price of meat fromexporting countries (Xi’s) and real income (RE) of the Philippines. The β’s are the parameters tobe estimated.
In the above equations by equation basis, the system of demand may be estimated usingthe Ordinary Least Square (OLS). The study used time series data which means that anobservation on the demand equation represents one point in time to estimate the demand andincome (proxy for expenditure) elasticites. This opens the possibility that contemporaneouscorrelation exists. Because of this, OLS is not considered as Best Linear Unbiased Estimator(BLUE). To solve this problem, numerous studies utilize the Seemingly Unrelated Regression(SUR) in multi-equation regression models, which is appropriate when the disturbances arecontemporaneously correlated (Zellner, 1962).
(17)
(18)
(19)
(20)
(21)
19
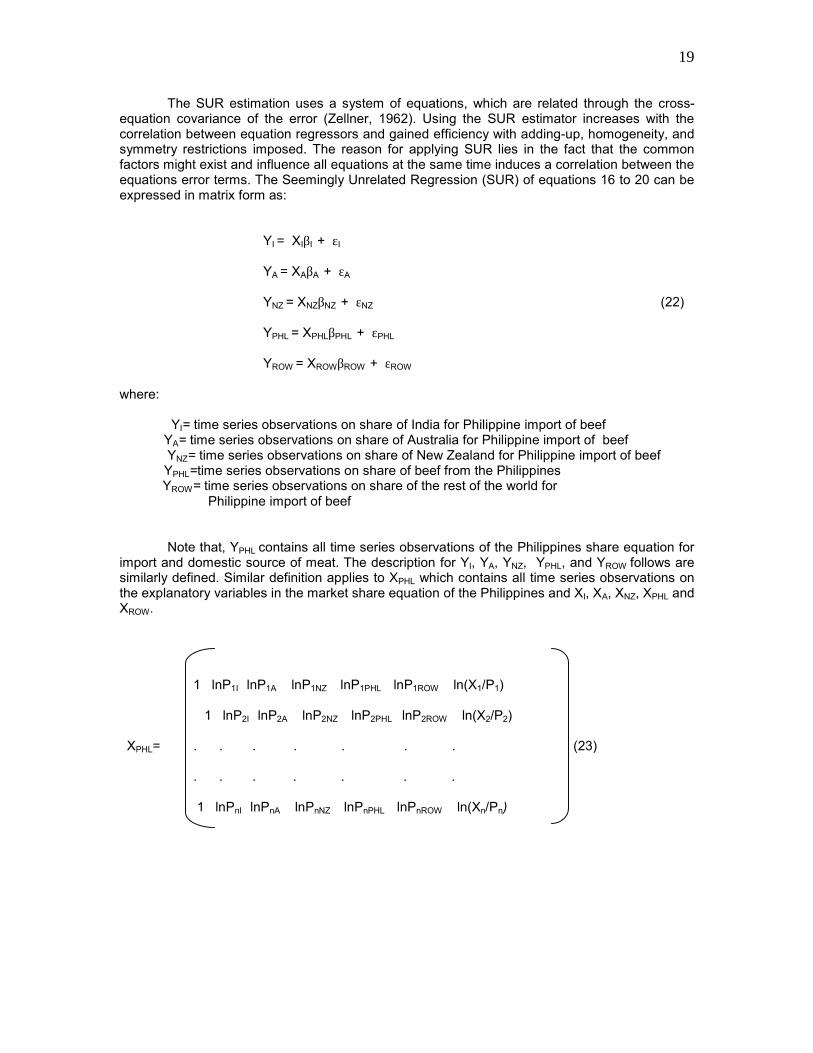
The SUR estimation uses a system of equations, which are related through the cross-equation covariance of the error (Zellner, 1962). Using the SUR estimator increases with thecorrelation between equation regressors and gained efficiency with adding-up, homogeneity, andsymmetry restrictions imposed. The reason for applying SUR lies in the fact that the commonfactors might exist and influence all equations at the same time induces a correlation between theequations error terms. The Seemingly Unrelated Regression (SUR) of equations 16 to 20 can beexpressed in matrix form as:
YI = XIβI + εI
YA = XAβA + εA
YNZ = XNZβNZ + εNZ (22)
YPHL = XPHLβPHL + εPHL
YROW = XROWβROW + εROW
where:
YI= time series observations on share of India for Philippine import of beefYA= time series observations on share of Australia for Philippine import of beefYNZ= time series observations on share of New Zealand for Philippine import of beefYPHL=time series observations on share of beef from the PhilippinesYROW= time series observations on share of the rest of the world for
Philippine import of beef
Note that, YPHL contains all time series observations of the Philippines share equation forimport and domestic source of meat. The description for YI, YA, YNZ, YPHL, and YROW follows aresimilarly defined. Similar definition applies to XPHL which contains all time series observations onthe explanatory variables in the market share equation of the Philippines and XI, XA, XNZ, XPHL andXROW.
1 lnP1I lnP1A lnP1NZ lnP1PHL lnP1ROW ln(X1/P1)
1 lnP2I lnP2A lnP2NZ lnP2PHL lnP2ROW ln(X2/P2)
XPHL= . . . . . . . (23)
. . . . . . .
1 lnPnI lnPnA lnPnNZ lnPnPHL lnPnROW ln(Xn/Pn)
20
The system of equations in (17-22) could further be written compactly as the “supermodel” in (eq. 25) given in the framework of a single equation linear model, after which SURestimation, follows:
Y= Xβ+ε (25)
where:
YI XI 0 0 0 0 βI
YA 0 XA 0 0 0 βA
Y= YNZ X= 0 0 XNZ 0 0 β= βNZ (26)
YPHL 0 0 0 XPHL 0 βPHL
YROW 0 0 0 0 XROW βROW
Parameters and elasticities were estimated using SHAZAM version 9.0 and annual growth ratewas estimated using MICROSOFT EXCEL.
RESULTS AND DISCUSSION
Consumption Pattern of Meatin the Philippines (1994-2009)
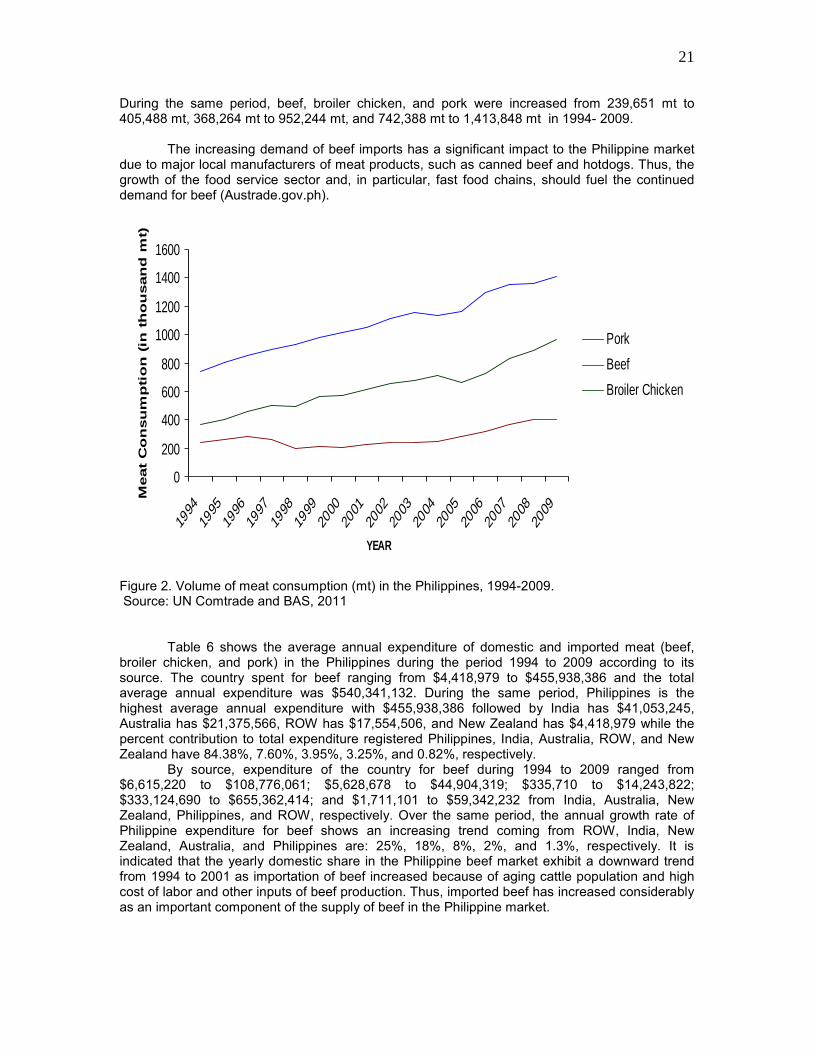
The rapid growth of meat consumption in the Philippines is expected to strengthenconsiderably in the future due to a positive economic growth rate over the past 10 years with aremarkable increase of 7% in Gross Domestic Product (GDP) in the country for 2007 and anincreasing population growth of 2.3% per annum that will take the population from its 92 million in2009 to over 152 million within the next three decades (NSO, 2010). In effect, most of thehouseholds sector has capacity to purchase of meat (beef, broiler chicken, and pork). Thus,consumption of broiler chicken is the highest annual growth rate of 5.6% followed by pork with 4%and beef with 3% from the period1994 to 2009 shown in Figure 2. By weight, pork is the highestdemand trend in the Philippine market compared with broiler chicken and beef in metric tons.
In 1994 to 2009, Bureau of Agricultural Statistics (BAS) reports, that the average percapita meat consumption of Filipinos for beef, broiler chicken, and pork in terms of kilogram (kg)ranged from 1.90 kg - 1.99 kg; 5.49 kg - 9.58 kg; and 11.03 kg – 14.87 kg. During the sameperiod beef, broiler chicken, and pork consumption increased by about 105%, 175%, and 135%,respectivelyThe volume of meat imports in 2009 for beef has 83,617 mt followed by broilerchicken with 68,713 mt , and pork with 42,439 mt. During the period from 2004 and 2008, thevolume of meat import grew at an average rate of about 7.5% per annum, driven by buoyanteconomic conditions, stronger consumer demand for meat and poultry products, short falls inlocal supplies of meat products due to disease outbreaks, and improved market access arisingfrom trade liberalization by the government (Philippine External Trade Statistics for Import, 2008).
21
During the same period, beef, broiler chicken, and pork were increased from 239,651 mt to405,488 mt, 368,264 mt to 952,244 mt, and 742,388 mt to 1,413,848 mt in 1994- 2009.
The increasing demand of beef imports has a significant impact to the Philippine marketdue to major local manufacturers of meat products, such as canned beef and hotdogs. Thus, thegrowth of the food service sector and, in particular, fast food chains, should fuel the continueddemand for beef (Austrade.gov.ph).
0
200
400
600
800
1000
1200
1400
1600
1994
1995
1996
1997
1998
1999
2000
2001
2002
2003
2004
2005
2006
2007
2008
2009
YEAR
Meat
Co
nsu
mp
tio
n (
in t
ho
usan
d m
t)
PorkBeefBroiler Chicken
Figure 2. Volume of meat consumption (mt) in the Philippines, 1994-2009.Source: UN Comtrade and BAS, 2011
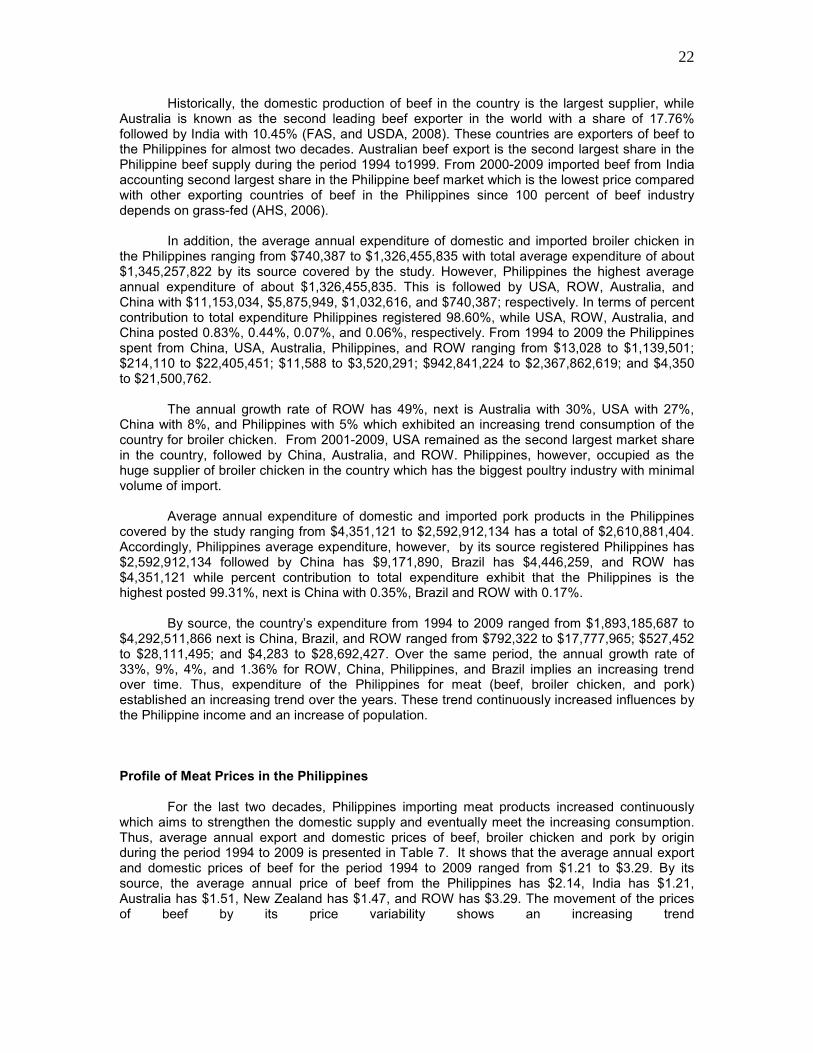
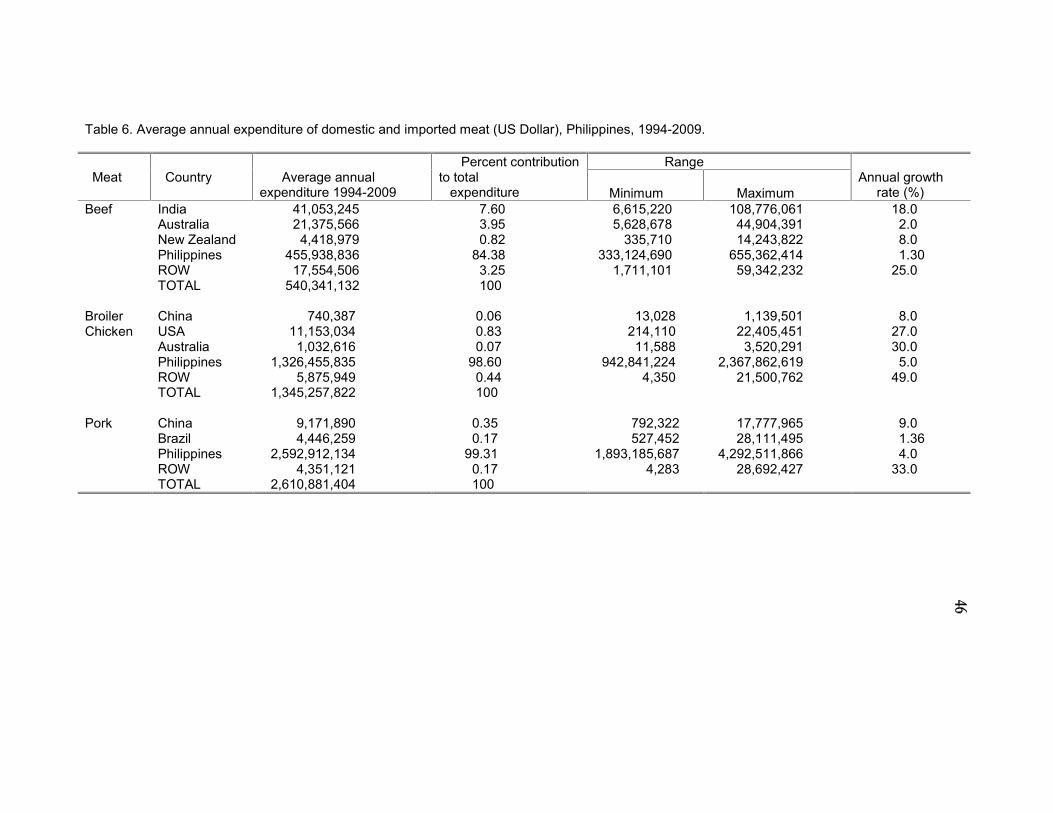
Table 6 shows the average annual expenditure of domestic and imported meat (beef,broiler chicken, and pork) in the Philippines during the period 1994 to 2009 according to itssource. The country spent for beef ranging from $4,418,979 to $455,938,386 and the totalaverage annual expenditure was $540,341,132. During the same period, Philippines is thehighest average annual expenditure with $455,938,386 followed by India has $41,053,245,Australia has $21,375,566, ROW has $17,554,506, and New Zealand has $4,418,979 while thepercent contribution to total expenditure registered Philippines, India, Australia, ROW, and NewZealand have 84.38%, 7.60%, 3.95%, 3.25%, and 0.82%, respectively.
By source, expenditure of the country for beef during 1994 to 2009 ranged from$6,615,220 to $108,776,061; $5,628,678 to $44,904,319; $335,710 to $14,243,822;$333,124,690 to $655,362,414; and $1,711,101 to $59,342,232 from India, Australia, NewZealand, Philippines, and ROW, respectively. Over the same period, the annual growth rate ofPhilippine expenditure for beef shows an increasing trend coming from ROW, India, NewZealand, Australia, and Philippines are: 25%, 18%, 8%, 2%, and 1.3%, respectively. It isindicated that the yearly domestic share in the Philippine beef market exhibit a downward trendfrom 1994 to 2001 as importation of beef increased because of aging cattle population and highcost of labor and other inputs of beef production. Thus, imported beef has increased considerablyas an important component of the supply of beef in the Philippine market.
22
Historically, the domestic production of beef in the country is the largest supplier, whileAustralia is known as the second leading beef exporter in the world with a share of 17.76%followed by India with 10.45% (FAS, and USDA, 2008). These countries are exporters of beef tothe Philippines for almost two decades. Australian beef export is the second largest share in thePhilippine beef supply during the period 1994 to1999. From 2000-2009 imported beef from Indiaaccounting second largest share in the Philippine beef market which is the lowest price comparedwith other exporting countries of beef in the Philippines since 100 percent of beef industrydepends on grass-fed (AHS, 2006).
In addition, the average annual expenditure of domestic and imported broiler chicken inthe Philippines ranging from $740,387 to $1,326,455,835 with total average expenditure of about$1,345,257,822 by its source covered by the study. However, Philippines the highest averageannual expenditure of about $1,326,455,835. This is followed by USA, ROW, Australia, andChina with $11,153,034, $5,875,949, $1,032,616, and $740,387; respectively. In terms of percentcontribution to total expenditure Philippines registered 98.60%, while USA, ROW, Australia, andChina posted 0.83%, 0.44%, 0.07%, and 0.06%, respectively. From 1994 to 2009 the Philippinesspent from China, USA, Australia, Philippines, and ROW ranging from $13,028 to $1,139,501;$214,110 to $22,405,451; $11,588 to $3,520,291; $942,841,224 to $2,367,862,619; and $4,350to $21,500,762.
The annual growth rate of ROW has 49%, next is Australia with 30%, USA with 27%,China with 8%, and Philippines with 5% which exhibited an increasing trend consumption of thecountry for broiler chicken. From 2001-2009, USA remained as the second largest market sharein the country, followed by China, Australia, and ROW. Philippines, however, occupied as thehuge supplier of broiler chicken in the country which has the biggest poultry industry with minimalvolume of import.
Average annual expenditure of domestic and imported pork products in the Philippinescovered by the study ranging from $4,351,121 to $2,592,912,134 has a total of $2,610,881,404.Accordingly, Philippines average expenditure, however, by its source registered Philippines has$2,592,912,134 followed by China has $9,171,890, Brazil has $4,446,259, and ROW has$4,351,121 while percent contribution to total expenditure exhibit that the Philippines is thehighest posted 99.31%, next is China with 0.35%, Brazil and ROW with 0.17%.
By source, the country’s expenditure from 1994 to 2009 ranged from $1,893,185,687 to$4,292,511,866 next is China, Brazil, and ROW ranged from $792,322 to $17,777,965; $527,452to $28,111,495; and $4,283 to $28,692,427. Over the same period, the annual growth rate of33%, 9%, 4%, and 1.36% for ROW, China, Philippines, and Brazil implies an increasing trendover time. Thus, expenditure of the Philippines for meat (beef, broiler chicken, and pork)established an increasing trend over the years. These trend continuously increased influences bythe Philippine income and an increase of population.
Profile of Meat Prices in the Philippines
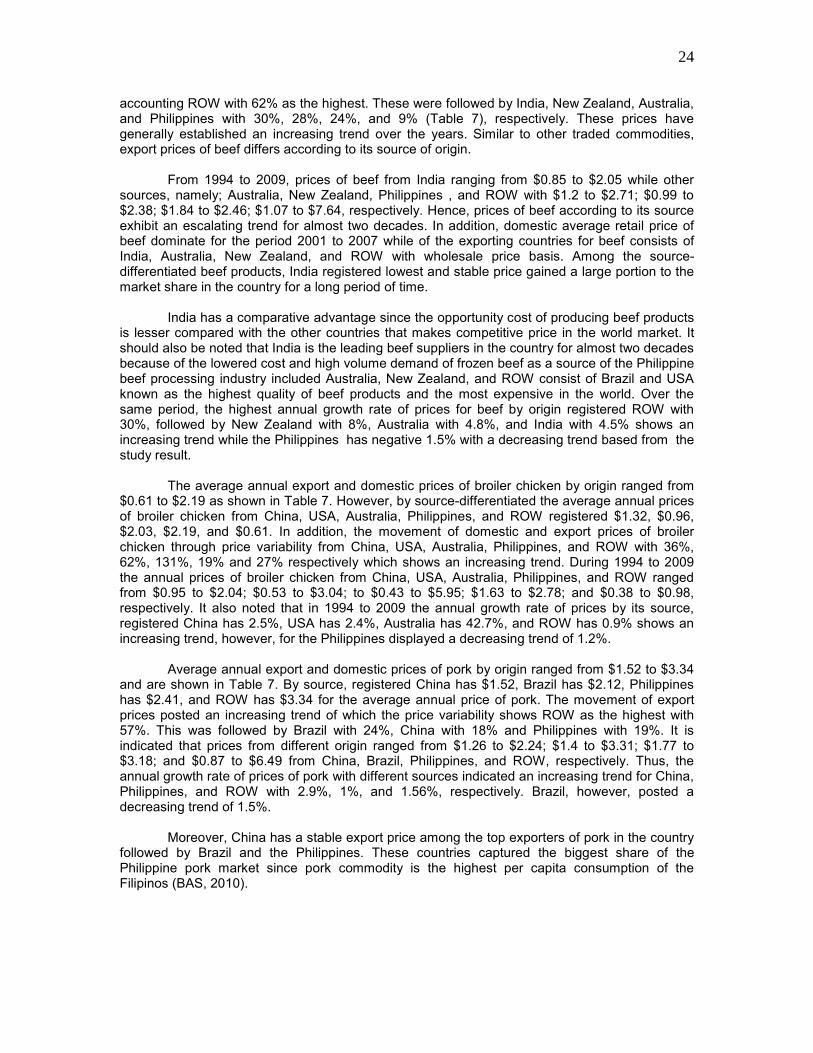
For the last two decades, Philippines importing meat products increased continuouslywhich aims to strengthen the domestic supply and eventually meet the increasing consumption.Thus, average annual export and domestic prices of beef, broiler chicken and pork by originduring the period 1994 to 2009 is presented in Table 7. It shows that the average annual exportand domestic prices of beef for the period 1994 to 2009 ranged from $1.21 to $3.29. By itssource, the average annual price of beef from the Philippines has $2.14, India has $1.21,Australia has $1.51, New Zealand has $1.47, and ROW has $3.29. The movement of the pricesof beef by its price variability shows an increasing trend
23
Table 6. Average annual expenditure of domestic and imported meat (US Dollar), Philippines, 1994-2009.
Meat Country Average annualexpenditure 1994-2009
Percent contributionto total
expenditure
RangeAnnual growth
rate (%)Minimum MaximumBeef India 41,053,245 7.60 6,615,220 108,776,061 18.0
Australia 21,375,566 3.95 5,628,678 44,904,391 2.0New Zealand 4,418,979 0.82 335,710 14,243,822 8.0Philippines 455,938,836 84.38 333,124,690 655,362,414 1.30ROW 17,554,506 3.25 1,711,101 59,342,232 25.0TOTAL 540,341,132 100
BroilerChicken
China 740,387 0.06 13,028 1,139,501 8.0USA 11,153,034 0.83 214,110 22,405,451 27.0Australia 1,032,616 0.07 11,588 3,520,291 30.0Philippines 1,326,455,835 98.60 942,841,224 2,367,862,619 5.0ROW 5,875,949 0.44 4,350 21,500,762 49.0TOTAL 1,345,257,822 100
Pork China 9,171,890 0.35 792,322 17,777,965 9.0Brazil 4,446,259 0.17 527,452 28,111,495 1.36Philippines 2,592,912,134 99.31 1,893,185,687 4,292,511,866 4.0ROW 4,351,121 0.17 4,283 28,692,427 33.0TOTAL 2,610,881,404 100
24
accounting ROW with 62% as the highest. These were followed by India, New Zealand, Australia,and Philippines with 30%, 28%, 24%, and 9% (Table 7), respectively. These prices havegenerally established an increasing trend over the years. Similar to other traded commodities,export prices of beef differs according to its source of origin.
From 1994 to 2009, prices of beef from India ranging from $0.85 to $2.05 while othersources, namely; Australia, New Zealand, Philippines , and ROW with $1.2 to $2.71; $0.99 to$2.38; $1.84 to $2.46; $1.07 to $7.64, respectively. Hence, prices of beef according to its sourceexhibit an escalating trend for almost two decades. In addition, domestic average retail price ofbeef dominate for the period 2001 to 2007 while of the exporting countries for beef consists ofIndia, Australia, New Zealand, and ROW with wholesale price basis. Among the source-differentiated beef products, India registered lowest and stable price gained a large portion to themarket share in the country for a long period of time.
India has a comparative advantage since the opportunity cost of producing beef productsis lesser compared with the other countries that makes competitive price in the world market. Itshould also be noted that India is the leading beef suppliers in the country for almost two decadesbecause of the lowered cost and high volume demand of frozen beef as a source of the Philippinebeef processing industry included Australia, New Zealand, and ROW consist of Brazil and USAknown as the highest quality of beef products and the most expensive in the world. Over thesame period, the highest annual growth rate of prices for beef by origin registered ROW with30%, followed by New Zealand with 8%, Australia with 4.8%, and India with 4.5% shows anincreasing trend while the Philippines has negative 1.5% with a decreasing trend based from thestudy result.
The average annual export and domestic prices of broiler chicken by origin ranged from$0.61 to $2.19 as shown in Table 7. However, by source-differentiated the average annual pricesof broiler chicken from China, USA, Australia, Philippines, and ROW registered $1.32, $0.96,$2.03, $2.19, and $0.61. In addition, the movement of domestic and export prices of broilerchicken through price variability from China, USA, Australia, Philippines, and ROW with 36%,62%, 131%, 19% and 27% respectively which shows an increasing trend. During 1994 to 2009the annual prices of broiler chicken from China, USA, Australia, Philippines, and ROW rangedfrom $0.95 to $2.04; $0.53 to $3.04; to $0.43 to $5.95; $1.63 to $2.78; and $0.38 to $0.98,respectively. It also noted that in 1994 to 2009 the annual growth rate of prices by its source,registered China has 2.5%, USA has 2.4%, Australia has 42.7%, and ROW has 0.9% shows anincreasing trend, however, for the Philippines displayed a decreasing trend of 1.2%.
Average annual export and domestic prices of pork by origin ranged from $1.52 to $3.34and are shown in Table 7. By source, registered China has $1.52, Brazil has $2.12, Philippineshas $2.41, and ROW has $3.34 for the average annual price of pork. The movement of exportprices posted an increasing trend of which the price variability shows ROW as the highest with57%. This was followed by Brazil with 24%, China with 18% and Philippines with 19%. It isindicated that prices from different origin ranged from $1.26 to $2.24; $1.4 to $3.31; $1.77 to$3.18; and $0.87 to $6.49 from China, Brazil, Philippines, and ROW, respectively. Thus, theannual growth rate of prices of pork with different sources indicated an increasing trend for China,Philippines, and ROW with 2.9%, 1%, and 1.56%, respectively. Brazil, however, posted adecreasing trend of 1.5%.
Moreover, China has a stable export price among the top exporters of pork in the countryfollowed by Brazil and the Philippines. These countries captured the biggest share of thePhilippine pork market since pork commodity is the highest per capita consumption of theFilipinos (BAS, 2010).
25
Table 7. Average annual export and domestic prices of meat (US Dollar/kg), by origin, 1994-2009.
Meat Country Average annual priceUSD/kg. 1994-2009
Percent VariabilityCV (price)
RangeAnnual growth
rate (%)Minimum MaximumBeef India 1.21 30 0.85 2.05 4.50
Australia 1.51 24 1.20 2.71 4.80New Zealand 1.47 28 0.99 2.38 8.0Philippines 2.14 9 1.84 2.46 -1.50ROW 3.29 62 1.07 7.64 30.0
BroilerChicken
China 1.32 36 0.95 2.04 2.50USA 0.96 62 0.53 3.04 2.40Australia 2.03 131 0.43 5.95 42.70Philippines 2.19 19 1.63 2.78 -1.20ROW 0.61 27 0.38 0.98 0.90
Pork China 1.52 18 1.26 2.24 3.0Brazil 2.12 24 1.40 3.31 -1.50Philippines 2.14 19 1.77 3.18 1.0ROW 3.34 57 0.87 6.49 1.56
i
Estimation of Meat Demand
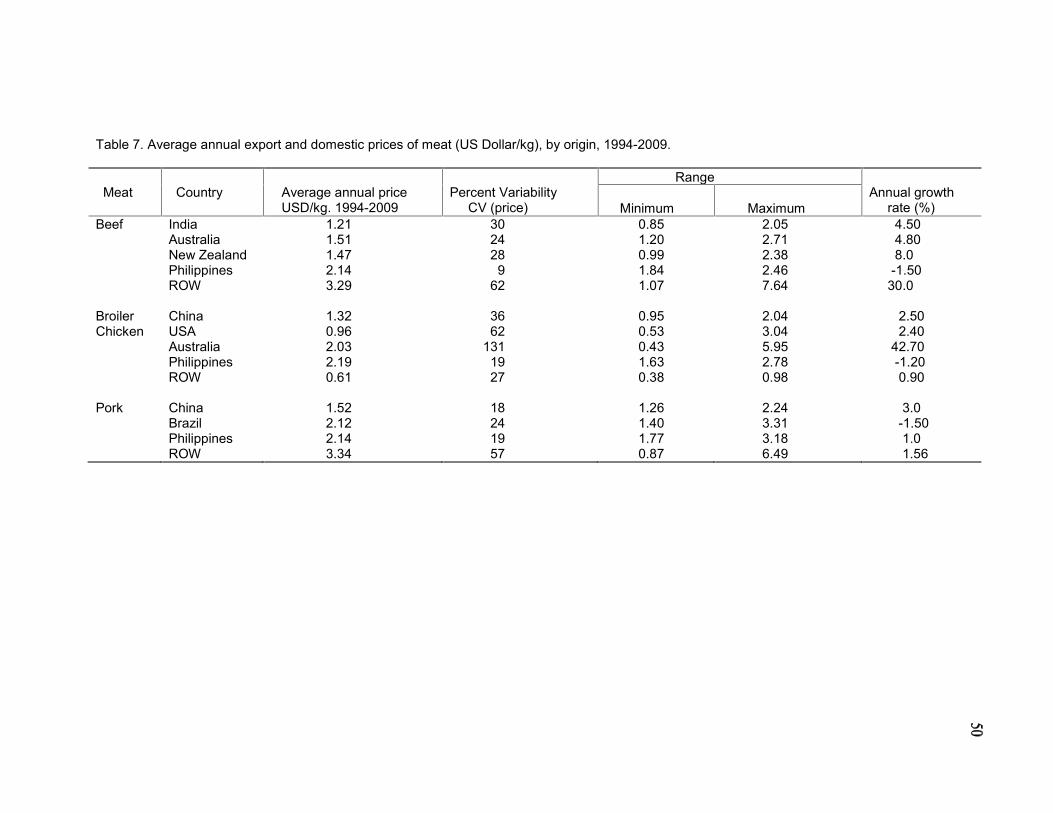
The common treatment of a separate import demand specification in the literature isusually motivated by product differentiation. This is done using the Source-Differentiated AlmostIdeal Demand System. The Source-Differentiated Almost Ideal Demand System (SDAIDS) modelaims to estimate source-specific import and domestic demand elasticities for meat (beef, broilerchicken, and pork) in the Philippine market. This approach allows substitution between domesticand imported meat products to avoid econometric problems in generating estimated demandparameters (Fabiosa, 2000).
The SDAIDS model estimates the demand of meat (pork, broiler chicken, and beef)considering domestic and imported meats was disaggregated as differentiated products, therebyallowing substitution between domestic and imported meat referring to the general model inEquation 6 and similarly derived the elasticity estimates of the sources of beef, broiler chicken,and pork. This study used Ordinary Least Square (OLS) estimation which minimizes the sum ofthe square errors and utilized Seemingly Unrelated Regression (SUR) estimation technique toestimate of import and domestic demand parameters using SDAIDS model (see tables 8, 9, and10).
Since the sum of the meat expenditures shares (wij) is equal to one, the demand systemcomposed of prices and expenditure share equations for the three Source-Differentiated meats issingular. Therefore, without loss of generality, the last equation of the system of equations isdropped for estimation purposes. The coefficients of the dropped equation were calculated fromthe adding-up, homogeneity, and symmetry restrictions in order to satisfy and calculate theestimated demand parameters of SDAIDS model in the Philippine market from 1994 to 2009.
Table 8. Estimated demand parameters of beef using SDAIDS, Philippinemarket, 1994-2009.
Source Estimated Parametersβ0 β1 β2 β3 β4 β5 β6
India -1.253 ns -1.397 ns -0.215 ns 1.773 ns -0.160 ns -0.939E-09 ns 0.632*(1.339) (1.525) (0.290) (1.422) (0.052) (0.126E-08)
(0.318)
Australia 1.291* -0.840 ns 0.973* 0.083* -0.286E-10 ns 0.381*(0.373) (0.145) (0.254) (0.029) (0.731E-
09) (0.157)
New Zealand -7.316 ns -2.793 ns 0.048 ns 0.803E-09 ns -0.038 ns
(1.426) (1.369) (0.0615) (0.166E-08)(0.083)
Philippines -0.610 ns 0.101E-08 ns 0.101* 0.314*(0.244) (0.214E-08) (0.436-
E09) (0.083)
ROW 8.887* -0.577E-08 ns -1.244 ns
(0.9997) (0.281E-08) (0.557)
Values in parentheses are standard errors of estimates* - Significant at 10%ns - not significantLegend:β0= Interceptβ1= ln(price of beef from India)β2= ln(price of beef from Australia)β3= ln(price of beef from New Zealand)
ii
β4= ln(price of beef from Philippines)β5= ln(price of beef from ROW)β6= ln(total real income)
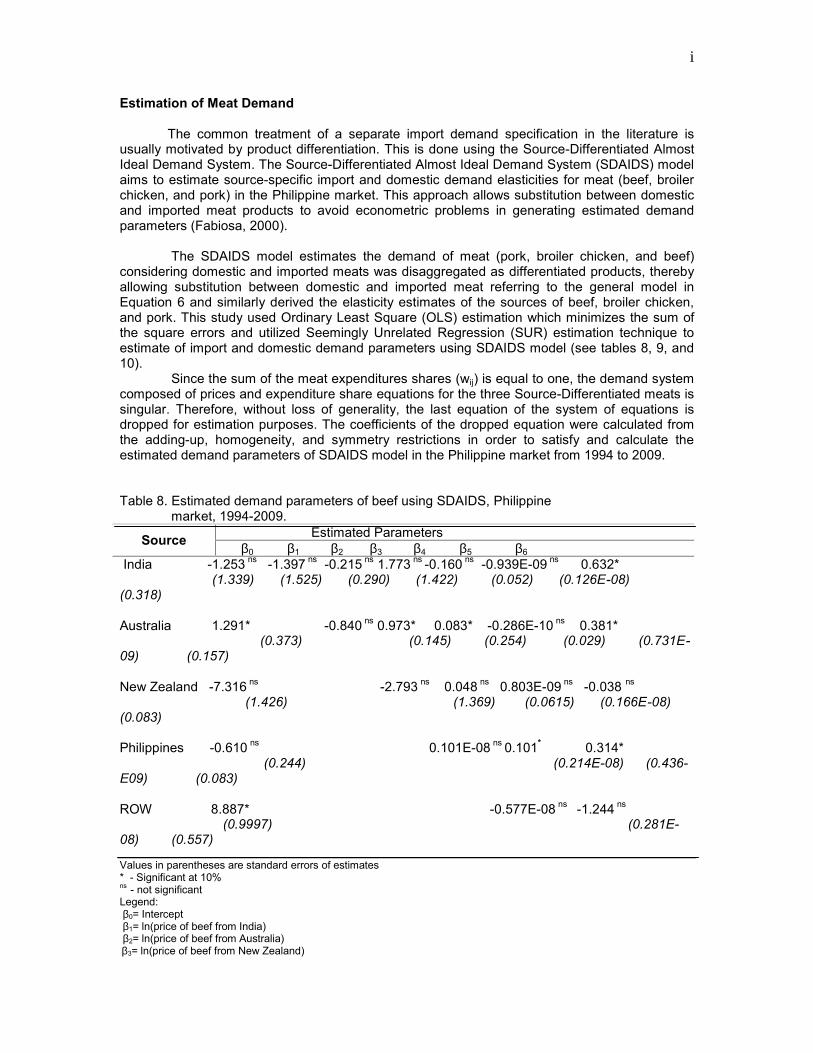
Table 9.Estimated demand parameters of broiler chicken using SDAIDS,Philippinemarket, 1994-2009.
Source Estimated Parametersβ0 β1 β2 β3 β4 β5 β6
China 10.166 ns 17.615 * -1.035* -17.299 ns 0.755 ns -0.036* 0.344*(23.051) (31.336) (0.528) (31.565) (0.632) (0.018)
(0.145)
USA 37.703* -0.589* 0.113 ns 1.551* -0.039* 0.402*(6.496) (0.318) (0.449) (0.528)
(0.007) (0.072)
Australia 33.534* 19.294* -2.086* -0.022* -0.224*(20.492) (31.806) (0.582) (0.016)
(0.088)
Philippines -14.829* 0.012* 0.012* -0.166*(6.921) (0.072)
(0.07) (0.082)
ROW -65.574* -0.124* 0.107 ns
(18.194) (0.024)(0.126)
Values in parentheses are standard errors of estimates** - Significant at 10% levelns - not significant
Legend:β0= Interceptβ1= ln(price of broiler chicken from China)β2= ln(price of broiler chicken from USA)β3= ln(price of broiler chicken from Australia)β4= ln(price of broiler chicken from Philippines)β5= ln(price of broiler chicken from ROW)β6= ln(total real income)
Table 10. Estimated parameters of pork using SDAIDS, Philippine market, 1994-2009.
Source Estimated Parametersβ0 β1 β2 β3 β4 β5
China -19.337 ns 1.006* -0.397** -0.773 ns 0.166* 0.724E-08 ns
(62.612) (0.462) (.396) (0.208) (0.078) (0.338E-07)
Brazil -100.42* -0.065 ns 0.461* -0.127* 0.481E-07*(63.278) (0.3970) (0.168) (0.076)
(0.326E-07)
Philippines -36.663 ns 0.212 ns 0.095* 0.185E-07 ns
(46.247) (0.208) (0.062)(0.237E-07)
ROW 157.42* -0.133 ns -0.857E-08*
iii
(94.699) (0.126)(0.487E-07)Values in parenthesis are standard errors of estimates
** - Significant at 10% level (2-tailed estimate)
ns - not significant
Legend:
β0= Intercept
β1= ln(price of pork from China)
β2= ln(price of pork from Brazil)
β3= ln(price of pork from Philippines)
β4= ln(price of pork from ROW)
β5= ln(total real income)
Philippine Meat Demand Elasticity
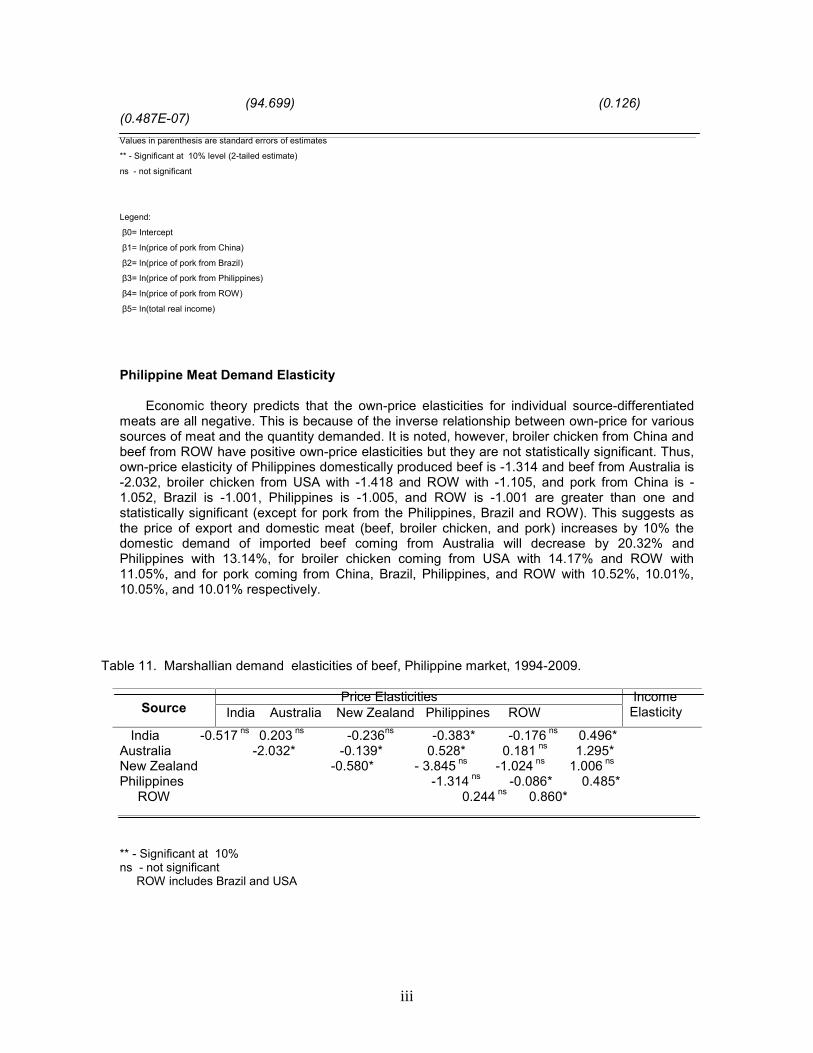
Economic theory predicts that the own-price elasticities for individual source-differentiatedmeats are all negative. This is because of the inverse relationship between own-price for varioussources of meat and the quantity demanded. It is noted, however, broiler chicken from China andbeef from ROW have positive own-price elasticities but they are not statistically significant. Thus,own-price elasticity of Philippines domestically produced beef is -1.314 and beef from Australia is-2.032, broiler chicken from USA with -1.418 and ROW with -1.105, and pork from China is -1.052, Brazil is -1.001, Philippines is -1.005, and ROW is -1.001 are greater than one andstatistically significant (except for pork from the Philippines, Brazil and ROW). This suggests asthe price of export and domestic meat (beef, broiler chicken, and pork) increases by 10% thedomestic demand of imported beef coming from Australia will decrease by 20.32% andPhilippines with 13.14%, for broiler chicken coming from USA with 14.17% and ROW with11.05%, and for pork coming from China, Brazil, Philippines, and ROW with 10.52%, 10.01%,10.05%, and 10.01% respectively.
Table 11. Marshallian demand elasticities of beef, Philippine market, 1994-2009.
SourcePrice Elasticities Income
ElasticityIndia Australia New Zealand Philippines ROW
India -0.517 ns 0.203 ns -0.236ns -0.383* -0.176 ns 0.496*Australia -2.032* -0.139* 0.528* 0.181 ns 1.295*New Zealand -0.580* - 3.845 ns -1.024 ns 1.006 ns
Philippines -1.314 ns -0.086* 0.485*ROW 0.244 ns 0.860*
** - Significant at 10%ns - not significant
ROW includes Brazil and USA
iv
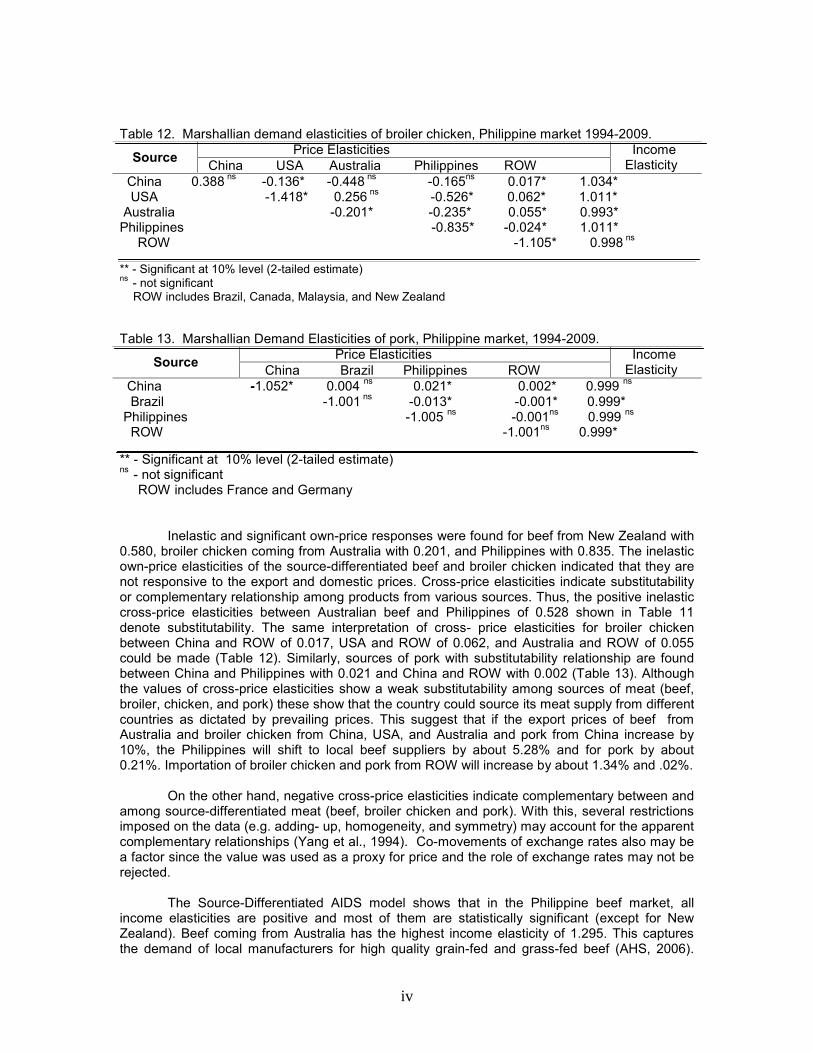
Table 12. Marshallian demand elasticities of broiler chicken, Philippine market 1994-2009.
Source Price Elasticities IncomeElasticityChina USA Australia Philippines ROW
China 0.388 ns -0.136* -0.448 ns -0.165ns 0.017* 1.034*USA -1.418* 0.256 ns -0.526* 0.062* 1.011*
Australia -0.201* -0.235* 0.055* 0.993*Philippines -0.835* -0.024* 1.011*
ROW -1.105* 0.998 ns
** - Significant at 10% level (2-tailed estimate)ns - not significant
ROW includes Brazil, Canada, Malaysia, and New Zealand
Table 13. Marshallian Demand Elasticities of pork, Philippine market, 1994-2009.
Source Price Elasticities IncomeElasticityChina Brazil Philippines ROW
China -1.052* 0.004 ns 0.021* 0.002* 0.999 ns
Brazil -1.001 ns -0.013* -0.001* 0.999*Philippines -1.005 ns -0.001ns 0.999 ns
ROW -1.001ns 0.999*
** - Significant at 10% level (2-tailed estimate)ns - not significant
ROW includes France and Germany
Inelastic and significant own-price responses were found for beef from New Zealand with0.580, broiler chicken coming from Australia with 0.201, and Philippines with 0.835. The inelasticown-price elasticities of the source-differentiated beef and broiler chicken indicated that they arenot responsive to the export and domestic prices. Cross-price elasticities indicate substitutabilityor complementary relationship among products from various sources. Thus, the positive inelasticcross-price elasticities between Australian beef and Philippines of 0.528 shown in Table 11denote substitutability. The same interpretation of cross- price elasticities for broiler chickenbetween China and ROW of 0.017, USA and ROW of 0.062, and Australia and ROW of 0.055could be made (Table 12). Similarly, sources of pork with substitutability relationship are foundbetween China and Philippines with 0.021 and China and ROW with 0.002 (Table 13). Althoughthe values of cross-price elasticities show a weak substitutability among sources of meat (beef,broiler, chicken, and pork) these show that the country could source its meat supply from differentcountries as dictated by prevailing prices. This suggest that if the export prices of beef fromAustralia and broiler chicken from China, USA, and Australia and pork from China increase by10%, the Philippines will shift to local beef suppliers by about 5.28% and for pork by about0.21%. Importation of broiler chicken and pork from ROW will increase by about 1.34% and .02%.
On the other hand, negative cross-price elasticities indicate complementary between andamong source-differentiated meat (beef, broiler chicken and pork). With this, several restrictionsimposed on the data (e.g. adding- up, homogeneity, and symmetry) may account for the apparentcomplementary relationships (Yang et al., 1994). Co-movements of exchange rates also may bea factor since the value was used as a proxy for price and the role of exchange rates may not berejected.
The Source-Differentiated AIDS model shows that in the Philippine beef market, allincome elasticities are positive and most of them are statistically significant (except for NewZealand). Beef coming from Australia has the highest income elasticity of 1.295. This capturesthe demand of local manufacturers for high quality grain-fed and grass-fed beef (AHS, 2006).
v
Beef coming from New Zealand has an income elasticity of 1.006. The rest have less than 1income elasticities, thus, ROW has 0.860, India has 0.496, and Philippines has 0.485. The resultof the study implies that as the Philippines income increases, demand for beef coming fromAustralia, New Zealand, ROW, India will also increase.
Income elasticities for broiler chicken are positive and statistically significant except forROW. Broiler chicken from China registered the highest income elasticity of 1.034, followed byPhilippines and USA with 1.011. On the other hand, broiler chicken from ROW and Australia areincome inelastic. This suggests as the Philippine income increases, demand of broiler chickenfrom China, USA, ROW, and Australia will not increase proportionally.
Income elasticities of pork are positive and statistically significant except for thePhilippines and China. Both the Philippines and China exhibited the same income elasticity equalto 0.999 (Table 13) or unitary elasticity. This means that as the Philippine income increases,demand of import and domestic pork products will increase with the same percentage.
The findings of the study revealed that meat (beef, broiler chicken and pork) is a normalgood. It is noted that export and domestic prices could not affect the demand of meat (beef,broiler chicken, and pork). Consumption as the population and income influences the increasingdemand over time. The study also found out that consumption of pork is very high in thePhilippines, followed by broiler chicken.
SUMMARY and CONCLUSIONS
Meat consumption in the Philippines has increased by about 1,333,386 million mt in 1994to 2,576,811 million mt in 2009. On the other hand, importation of meat increased from about16,918 mt in 1994 to 210,273 mt in 2009. Population and income are factors other than pricesthat affect the country’s meat demand. Hence, as the Philippine population continues to increase,total meat consumption also increases.
The top exporting countries for beef to the Philippines are: India, Australia, New Zealand,and ROW consisting of USA and Brazil. For broiler chicken, China, USA, Australia, and ROW(Brazil, New Zealand, Malaysia, and Canada) are the top exporting countries to the Philippines,and for pork, China, Brazil, and ROW (Germany and France) are the top exporting countries.Historically, Philippine domestic production is the biggest supplier of beef, broiler chicken, andpork in the country, while imported meat products essentially augment the meat supply and tomeet the expected demand.
In 1994 to 2009, total average annual expenditure for meat (beef, broiler chicken, and pork)of the Philippines was $4.49 billion. Thus, domestic production captured the major shareaccounted 94% of the total supply in the country. Importation of meat products spent by thePhilippines noted a minimal share recorded from the United Nation Commodity Trade Statistics(UN Comtrade, 2010). The significant increased also of the movement on prices among thevarious sources of meat indicated that imported beef from ROW (USA and Brazil) has 62%,broiler chicken from Australia has 131%, and pork from ROW (Germany and France) has 57%,respectively, have a volatile characteristics resulted from a lower importation of frozen meatproducts over time. It is noted that pork consumption in the country is highest while beef is thelowest. Among the meat consumed in the Philippines, broiler chicken has the lowest pricefollowed by pork with beef the most expensive. Broiler chicken is also a substitute for pork andbeef particularly for the lower income groups in the country.
Results of this study may shed light on the Philippine consumer’s and localmanufacturers’ preferences with regards to imported and domestic sources of meats. Thecalculated income (proxied by expenditure) elasticities noted that among the Philippinesdomestically produce meats; broiler chicken is the most highly responsive to an increase in
vi
consumer’s income. The result shows that the Philippines broiler chicken has gain a highestposition in the market relative to the other sources of this commodity, namely USA, Australia,ROW, and China.
LIST OF REFERENCES
Cheelo, C. 1998. Determinants of imports demand in Zambia. Electronic Publications Universityof Zambia, Lusaka. Supply of Academic Publications (SAP)-Project athttp://www.finc.org/:aup/sap/
Commodity Trade Statistics Database of United Nation 2009. Uncomtrade. Internet site:http://comtrade.un.orgDeaton, A. and Muellbauer, J. 1980. An almost ideal demand system. The American Economic
Review, 70:312-326Feenstra, R. and M. Reinsdorf 1999. An exact price index for the almost ideal demand system.
Federal Deposit Insurance Corporation. Washington, DC. Internet sitehttp:/citeceerx.ist.psu.edu/viewdoc/download?=10.1.1
.39.4547&ep=rep1&type =pfdFood and Agriculture Organization of the United Nations. FAOSTAT. Internet
site:http://faostat.fao.orgGreen, R and Alston J. 1990. Elasticities in AIDS models. American Journal of Agricultural
Economics, Vol. 72. No. 2. (1990), pp. 442-445Harrord, R. and D. C. Hague. 1963. International trade theory in a developing world. New York:
St. Martin’s Press, IncHennebery, S. and Hwang, S. 2007. Meat Demand in South Korea: An Application of the
Restricted Source-Differentiated Almost Ideal Demand System Model. Journal ofAgricultural and Applied Economics, 39, 1(April 2007): 47-60
KREI ( Korea Rural economic Institute). Food Balance Sheet in Korea. Internetsite:http//2003,255,236.5:8000//kreistats/src/Iist_I.JAP?PCLASS=1(Accessed May2005)
Krugman and Obstfeld 2000. International Economics 5th Edition, Addison-Wisley PublishingCompany
La France, J.T. 1991“ When Is Expenditure’ Exogenous in Separable demand Models? West.J. Agr. Econ.16 (1991):44-62.
Taljaard, P., Alemu, A. and Schalkwyk, H. 2004. The demand for meat in South Africa: Analmost ideal estimation. Department of Agricultural Economics, University of the FreeState, Bloemfontien, Agrekon,Vol 43,No 4 (2004)
United Nations Commodity trade statistics. Uncomtrade. Internetsite:http://comtrade.un.org//db/dqBasicQueryResults.aspx?cc=0207&px=HS
Wadud, M. 2006.An analysis of meat demand in Bangladesh using the almost ideal demandsystem. Department of Economics, Rajshahi University, Rajshahi, Bangladesh
Washington, A. and Kilmer R. 2002. The Production theory approach to import demandanalysis: A comparison of the Rotterdam model and differential production approach.Journal of Agricultural and Resource Economics, 34, 3(2002): 421-443
Wintres, L. 1984 “ Separability and the Specification of Foreign Trade Functions”J.Internet.Econ.17(1984) :239-63
Yang, S. and W. Koo 1994. Japanese meat import demand estimation with the source-differentiated AIDS model. Journal of Agricultural and Resource Economics,19(2):396-408
Zellner, A. 1962. An efficient method of estimating seemingly unrelated regression equationsand tests of aggregation bias. Journal of the American Statistical Association, 57,500-509