Embed Size (px)
Citation preview
DEMAND DRIVEN MATERIAL REQUIREMENTS PLANNING:
The Next Generation MRP Standard
www.myhicoach.com
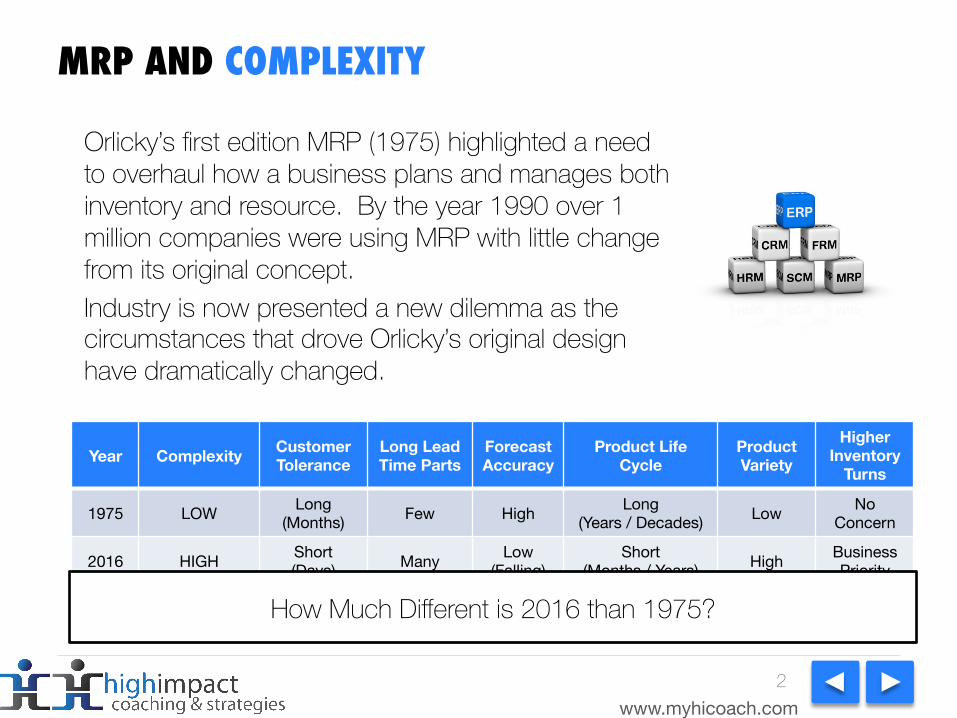
MRP AND COMPLEXITY
Orlicky’s first edition MRP (1975) highlighted a need to overhaul how a business plans and manages both inventory and resource. By the year 1990 over 1 million companies were using MRP with little change from its original concept. Industry is now presented a new dilemma as the circumstances that drove Orlicky’s original design have dramatically changed.
2
Year Complexity Customer Tolerance
Long Lead Time Parts
Forecast Accuracy
Product Life Cycle
Product Variety
Higher Inventory
Turns
1975 LOW Long (Months) Few High Long
(Years / Decades) Low No Concern
2016 HIGH Short (Days) Many Low
(Falling) Short
(Months / Years) High Business Priority
How Much Different is 2016 than 1975?
www.myhicoach.com
MRP’s CURRENT IMPACT ON PERFORMANCE
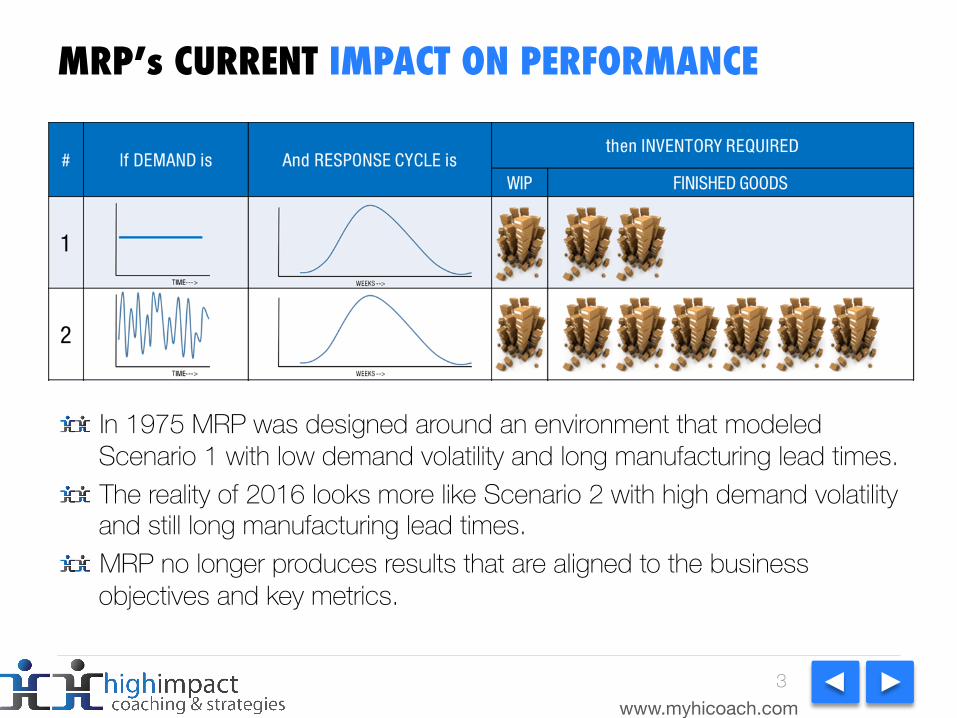
In 1975 MRP was designed around an environment that modeled Scenario 1 with low demand volatility and long manufacturing lead times. The reality of 2016 looks more like Scenario 2 with high demand volatility and still long manufacturing lead times. MRP no longer produces results that are aligned to the business objectives and key metrics.
3
www.myhicoach.com
Supplier MFG Distributor
2000s:Customer
Ship
Dist Dist
CustSvc
CustSvc
FinalAssyMfg
Eng Eng
Mfg
2007 to Present:
CustomerFinalAssy
Eng
Eng
CustSvc
Mfg
Mfg
Dist
Dist
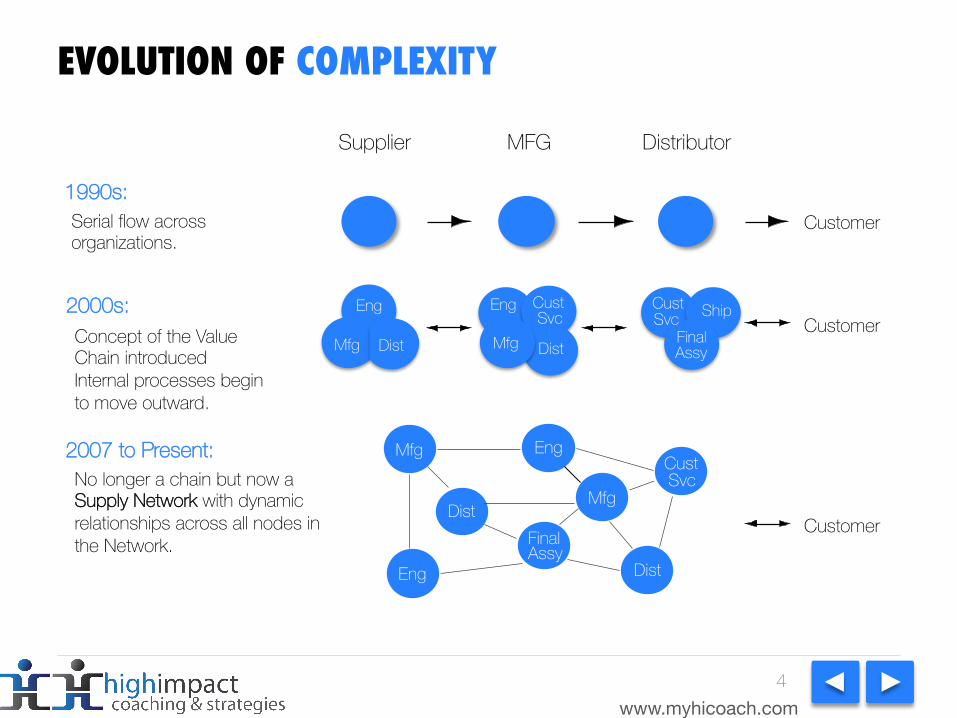
EVOLUTION OF COMPLEXITY
1990s:CustomerSerial flow across
organizations.
Concept of the Value Chain introduced Internal processes begin to move outward.
No longer a chain but now a Supply Network with dynamic relationships across all nodes in the Network.
4
www.myhicoach.com
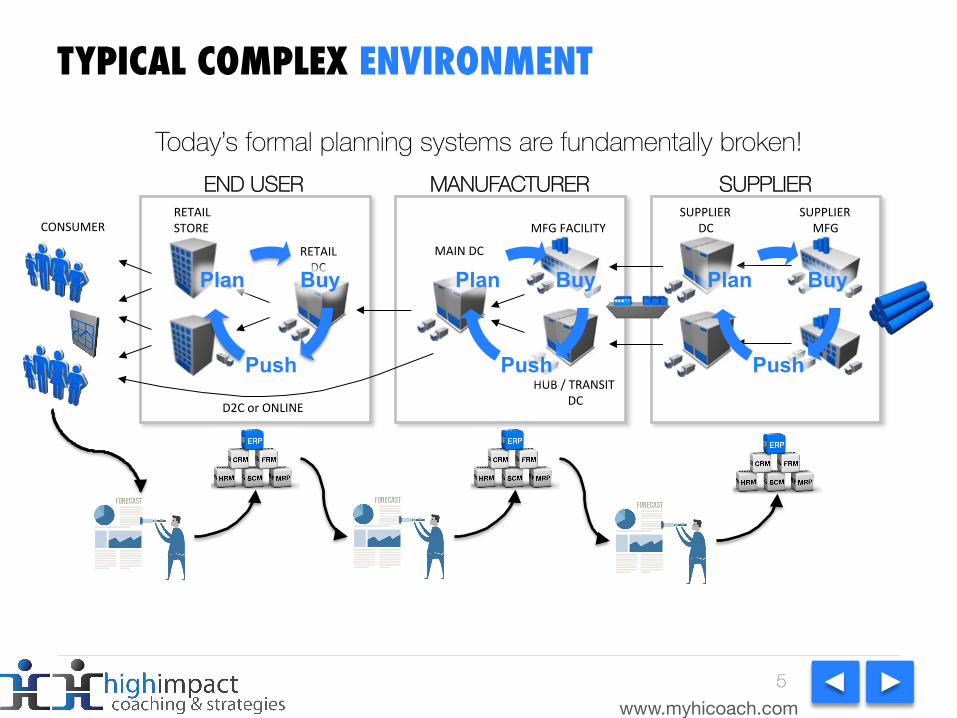
TYPICAL COMPLEX ENVIRONMENT
Today’s formal planning systems are fundamentally broken!
RETAILDC
CONSUMERRETAILSTORE
MAINDC
MFGFACILITY
HUB/TRANSITDC
SUPPLIERDC
D2CorONLINE
SUPPLIERMFG
END USER MANUFACTURER SUPPLIER
Buy
Push
Plan Buy
Push
Plan Buy
Push
Plan
5
www.myhicoach.com
TWO PRIMARY DRIVERS OF ISSUES
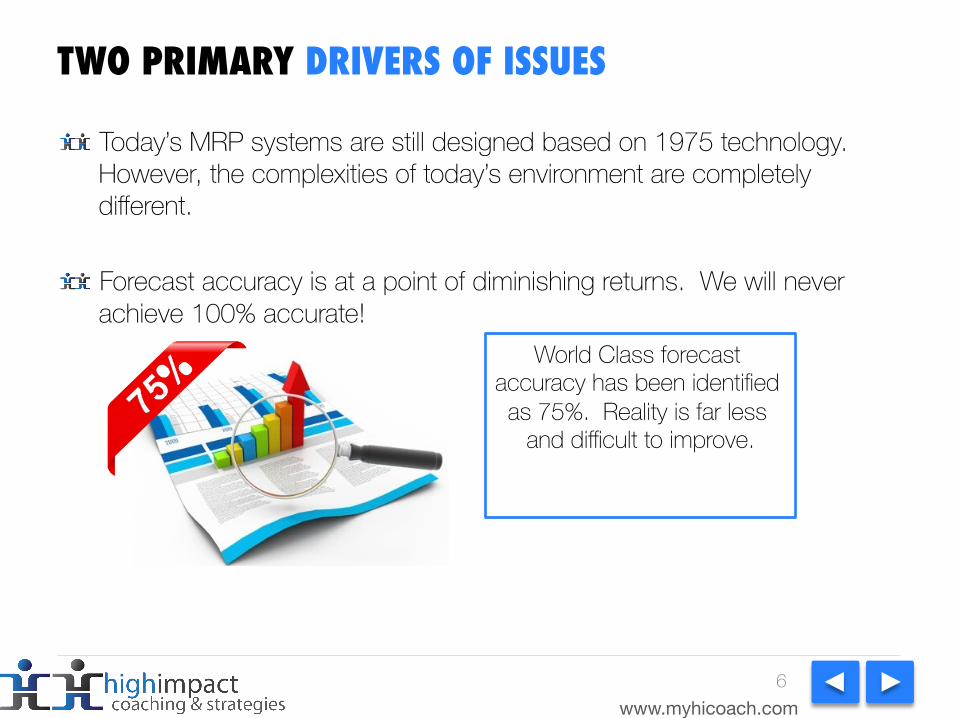
Today’s MRP systems are still designed based on 1975 technology. However, the complexities of today’s environment are completely different.
Forecast accuracy is at a point of diminishing returns. We will never achieve 100% accurate!
6
World Class forecast accuracy has been identified as 75%. Reality is far less
and difficult to improve.
www.myhicoach.com
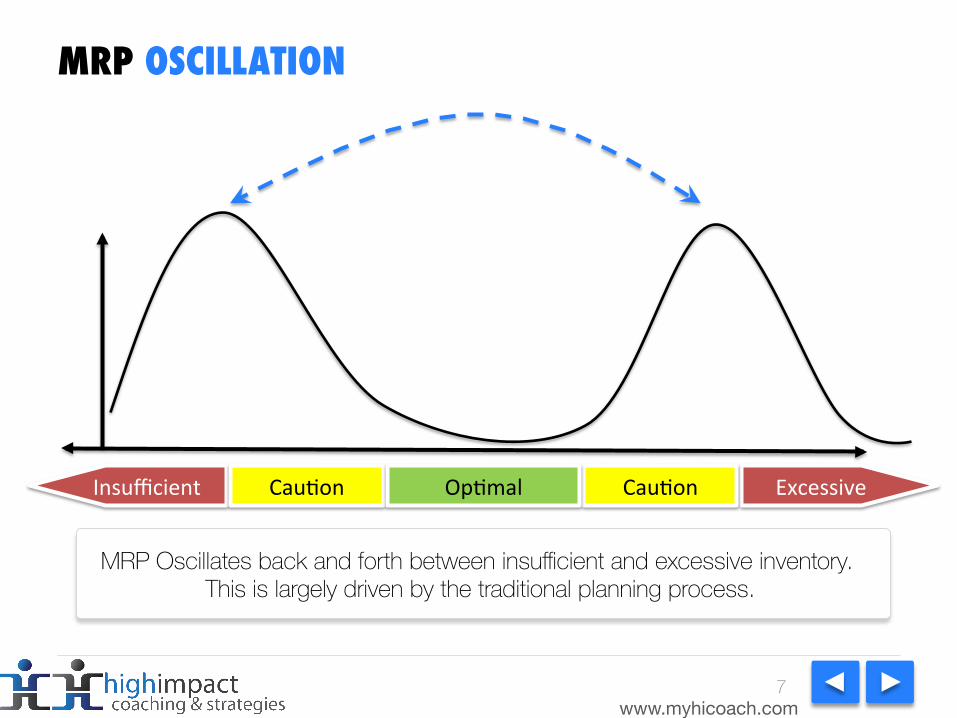
MRP OSCILLATION
Insufficient ExcessiveCauDon CauDonOpDmal
MRP Oscillates back and forth between insufficient and excessive inventory. This is largely driven by the traditional planning process.
7
www.myhicoach.com
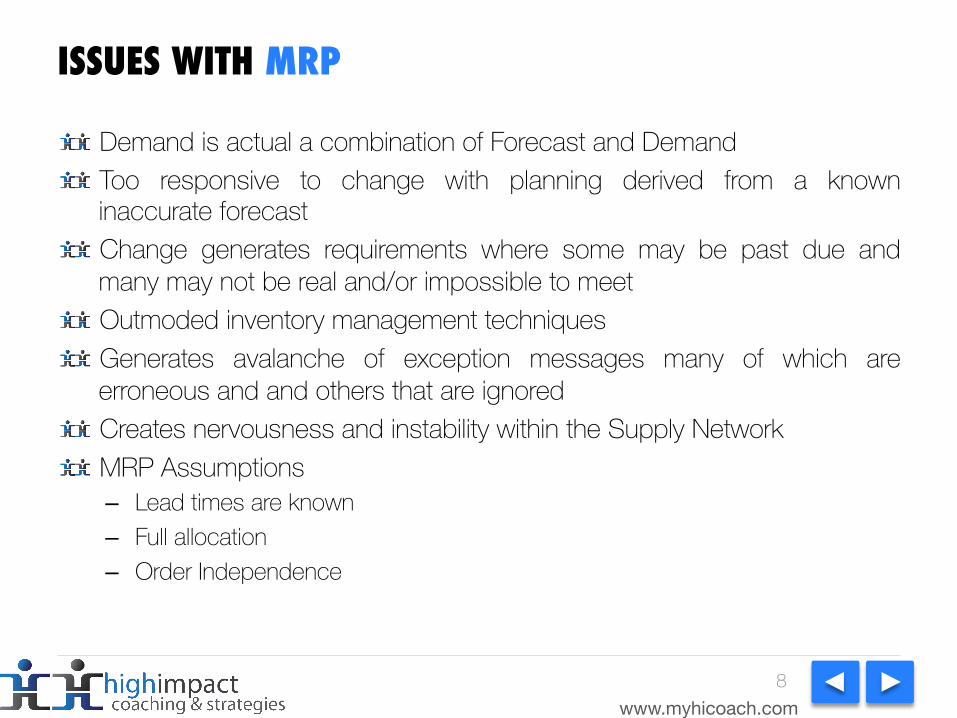
ISSUES WITH MRP
Demand is actual a combination of Forecast and Demand Too responsive to change with planning derived from a known inaccurate forecast Change generates requirements where some may be past due and many may not be real and/or impossible to meet Outmoded inventory management techniques Generates avalanche of exception messages many of which are erroneous and and others that are ignored Creates nervousness and instability within the Supply Network MRP Assumptions– Lead times are known– Full allocation– Order Independence
8
www.myhicoach.com
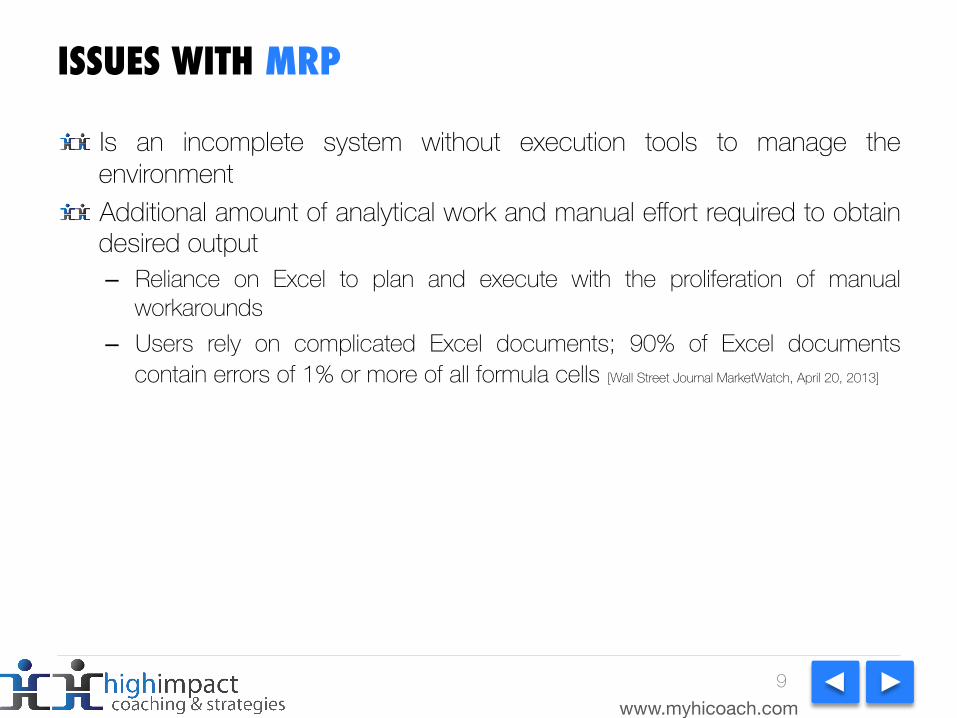
ISSUES WITH MRP
Is an incomplete system without execution tools to manage the environment Additional amount of analytical work and manual effort required to obtain desired output – Reliance on Excel to plan and execute with the proliferation of manual
workarounds– Users rely on complicated Excel documents; 90% of Excel documents
contain errors of 1% or more of all formula cells [Wall Street Journal MarketWatch, April 20, 2013]
9
www.myhicoach.com
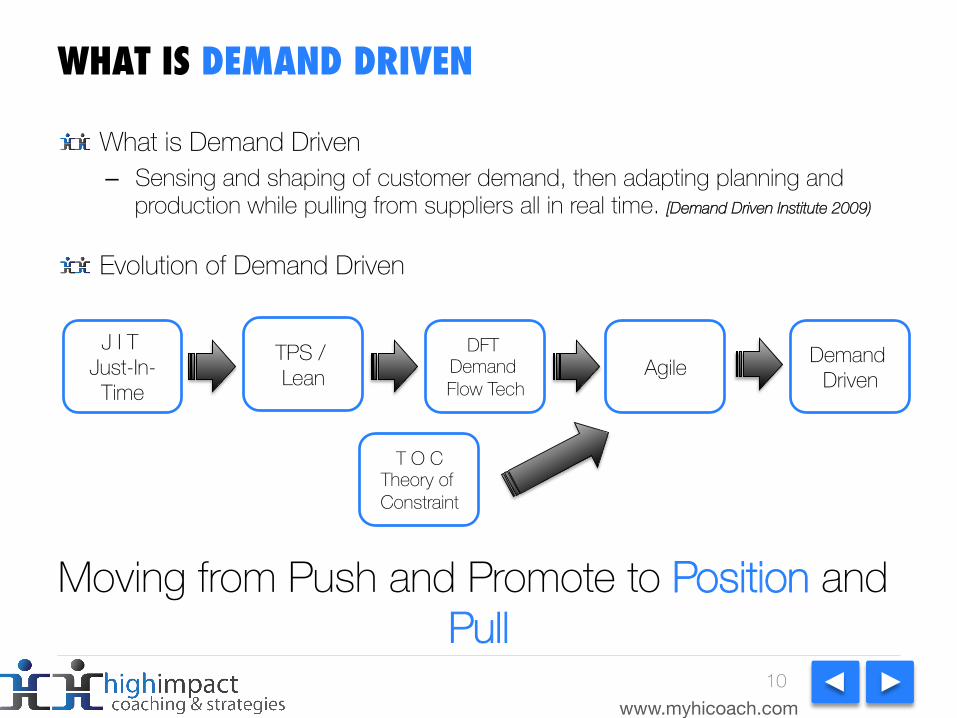
WHAT IS DEMAND DRIVEN
What is Demand Driven– Sensing and shaping of customer demand, then adapting planning and
production while pulling from suppliers all in real time. [Demand Driven Institute 2009)
Evolution of Demand Driven
10
Demand Driven
J I T Just-In-
Time
TPS / Lean
DFT Demand Flow Tech
Agile
T O CTheory of Constraint
Moving from Push and Promote to Position and Pull
www.myhicoach.com
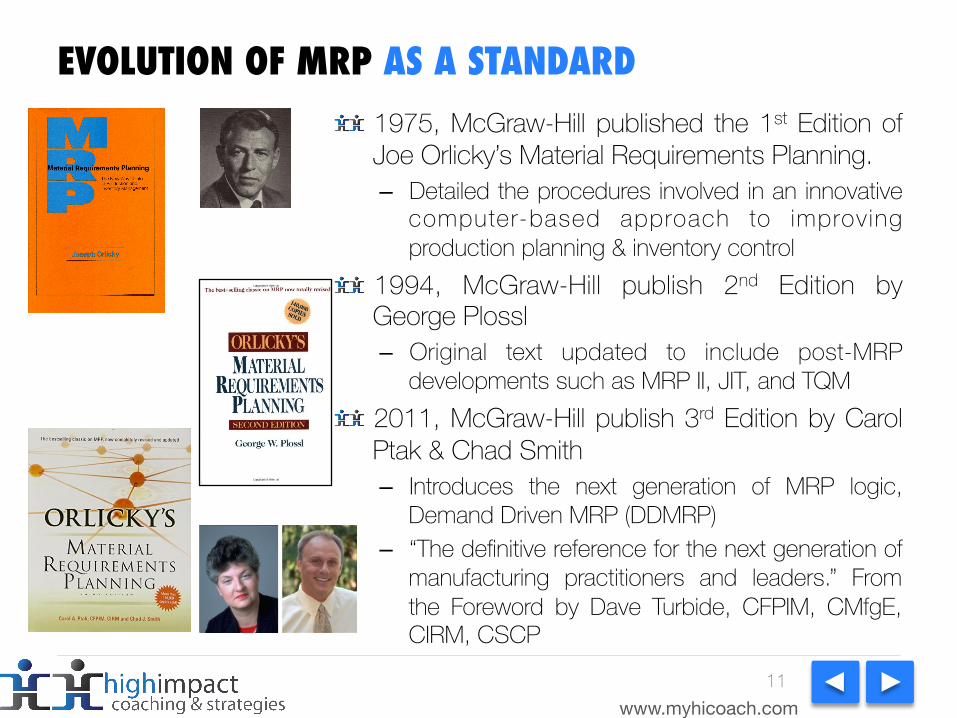
EVOLUTION OF MRP AS A STANDARD 1975, McGraw-Hill published the 1st Edition of Joe Orlicky’s Material Requirements Planning. – Detailed the procedures involved in an innovative
computer-based approach to improving production planning & inventory control
1994, McGraw-Hill publish 2nd Edition by George Plossl– Original text updated to include post-MRP
developments such as MRP II, JIT, and TQM 2011, McGraw-Hill publish 3rd Edition by Carol Ptak & Chad Smith– Introduces the next generation of MRP logic,
Demand Driven MRP (DDMRP)– “The definitive reference for the next generation of
manufacturing practitioners and leaders.” From the Foreword by Dave Turbide, CFPIM, CMfgE, CIRM, CSCP
11
www.myhicoach.com
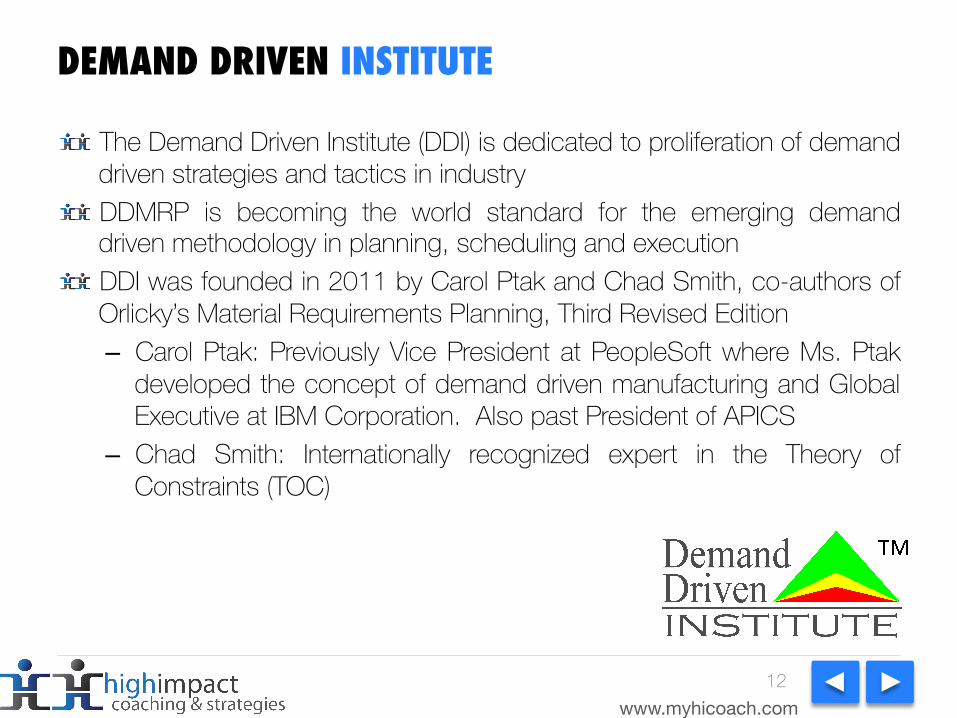
DEMAND DRIVEN INSTITUTE
12
The Demand Driven Institute (DDI) is dedicated to proliferation of demand driven strategies and tactics in industry DDMRP is becoming the world standard for the emerging demand driven methodology in planning, scheduling and execution DDI was founded in 2011 by Carol Ptak and Chad Smith, co-authors of Orlicky’s Material Requirements Planning, Third Revised Edition– Carol Ptak: Previously Vice President at PeopleSoft where Ms. Ptak
developed the concept of demand driven manufacturing and Global Executive at IBM Corporation. Also past President of APICS
– Chad Smith: Internationally recognized expert in the Theory of Constraints (TOC)
www.myhicoach.com
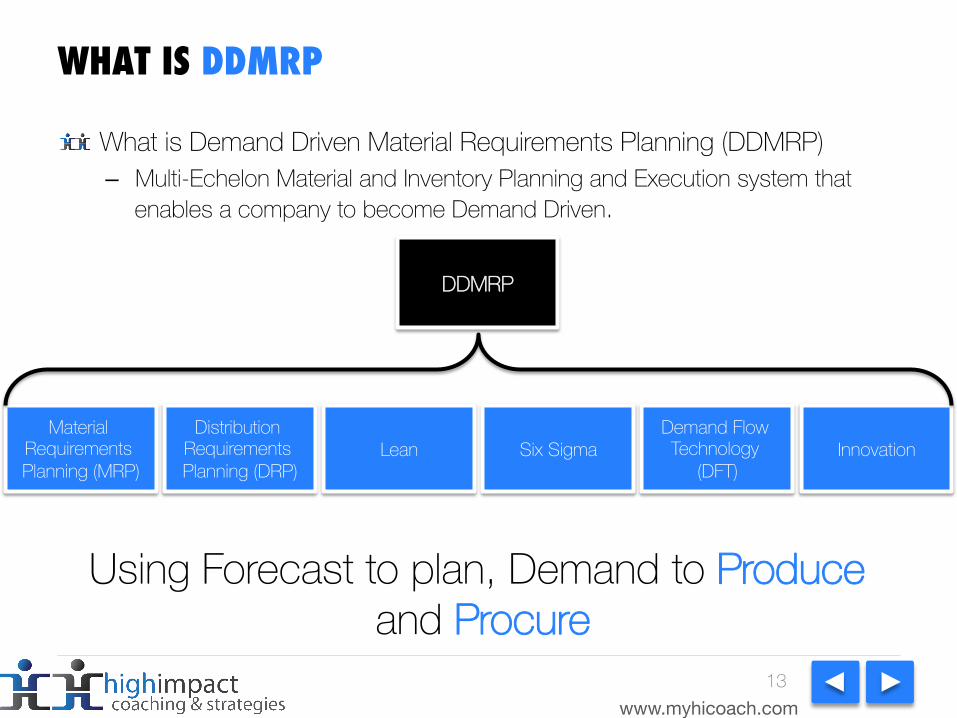
WHAT IS DDMRP
13
What is Demand Driven Material Requirements Planning (DDMRP)– Multi-Echelon Material and Inventory Planning and Execution system that
enables a company to become Demand Driven.
Material Requirements Planning (MRP)
Distribution Requirements Planning (DRP)
Lean Six SigmaDemand Flow Technology
(DFT)Innovation
DDMRP
Using Forecast to plan, Demand to Produce and Procure
www.myhicoach.com
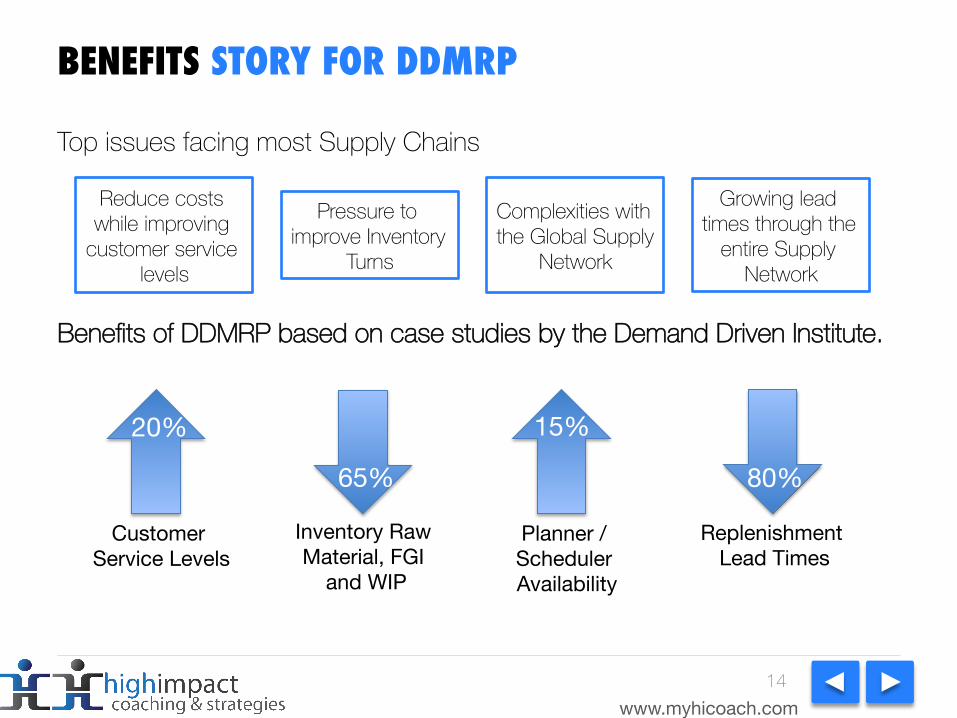
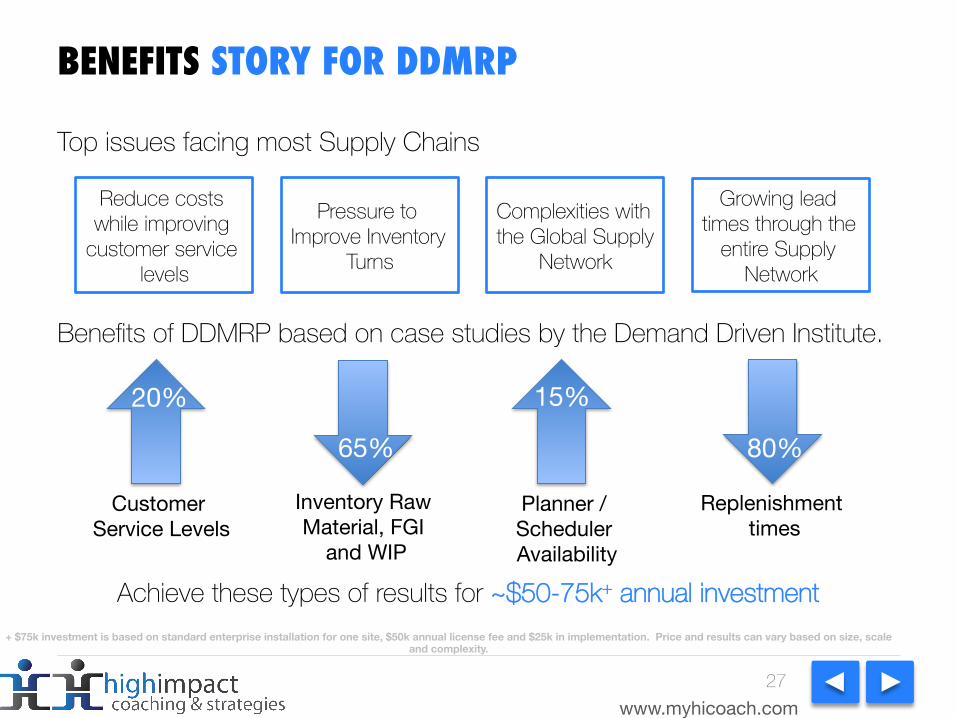
BENEFITS STORY FOR DDMRP
Top issues facing most Supply Chains
Benefits of DDMRP based on case studies by the Demand Driven Institute.
14
Reduce costs while improving
customer service levels
Complexities with the Global Supply
Network
Pressure to improve Inventory
Turns
Growing lead times through the
entire Supply Network
Replenishment Lead Times
80%
Inventory Raw Material, FGI
and WIP
65%
20%
Customer Service Levels
15%
Planner / Scheduler Availability
www.myhicoach.com
MINIMIZING THE ADVERSE IMPACT OF MRP
Cumulative demand & stable signal
Consistent availability of inventory
Demand VariabilitySupply Variability
StrategicInventory
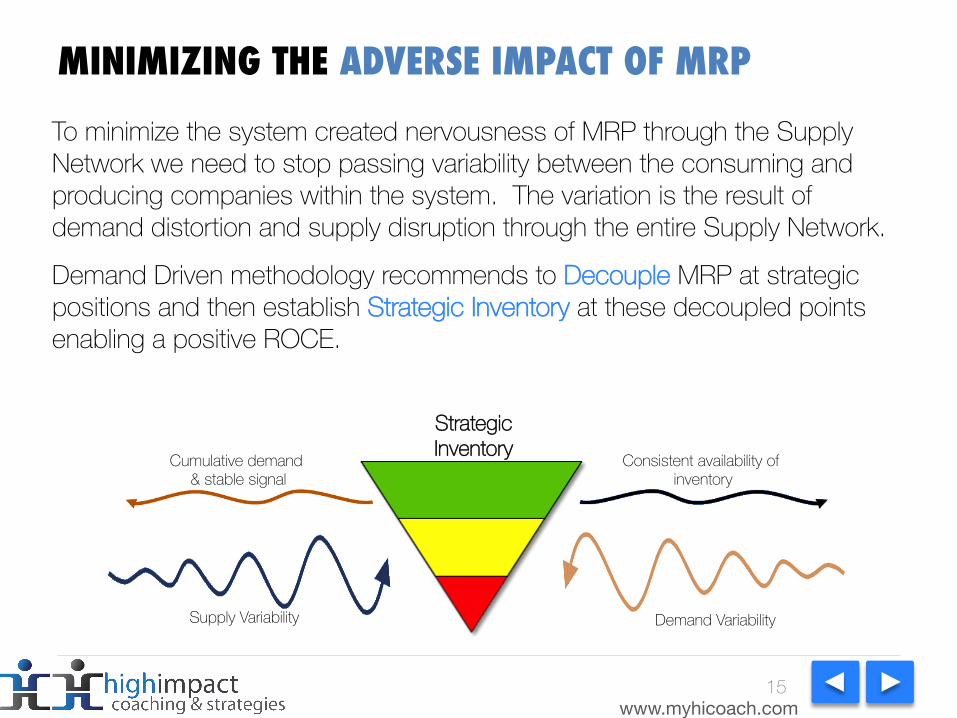
To minimize the system created nervousness of MRP through the Supply Network we need to stop passing variability between the consuming and producing companies within the system. The variation is the result of demand distortion and supply disruption through the entire Supply Network.
Demand Driven methodology recommends to Decouple MRP at strategic positions and then establish Strategic Inventory at these decoupled points enabling a positive ROCE.
15
www.myhicoach.com
DDMRP REBALANCE
Insufficient ExcessiveCauDon CauDonOpDmal
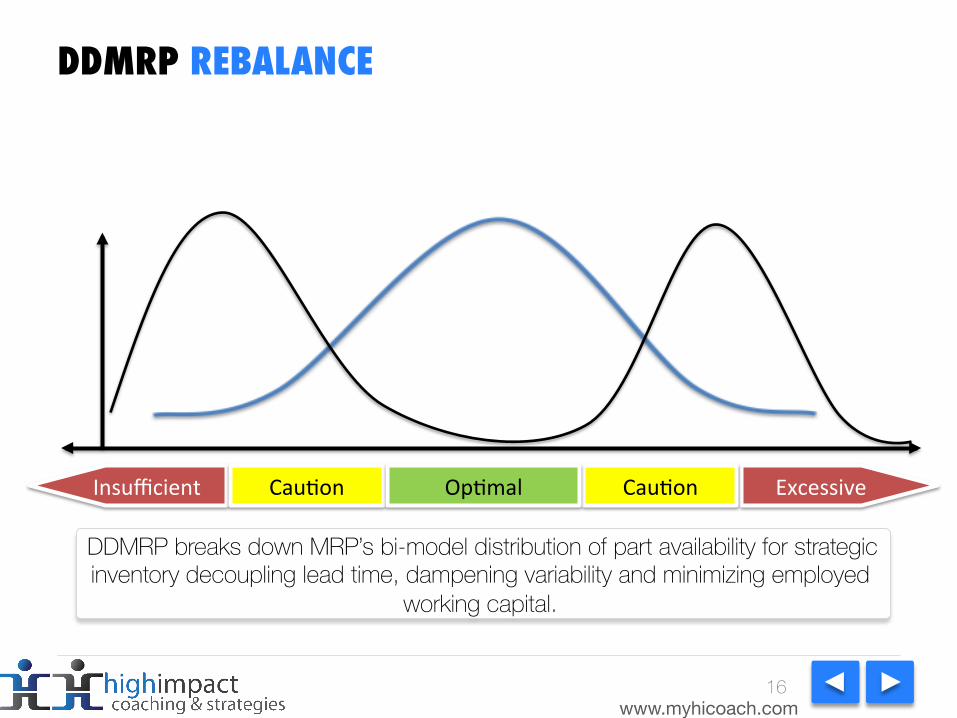
DDMRP breaks down MRP’s bi-model distribution of part availability for strategic inventory decoupling lead time, dampening variability and minimizing employed
working capital.
16
www.myhicoach.com
DDMRP METHODOLOGY
17
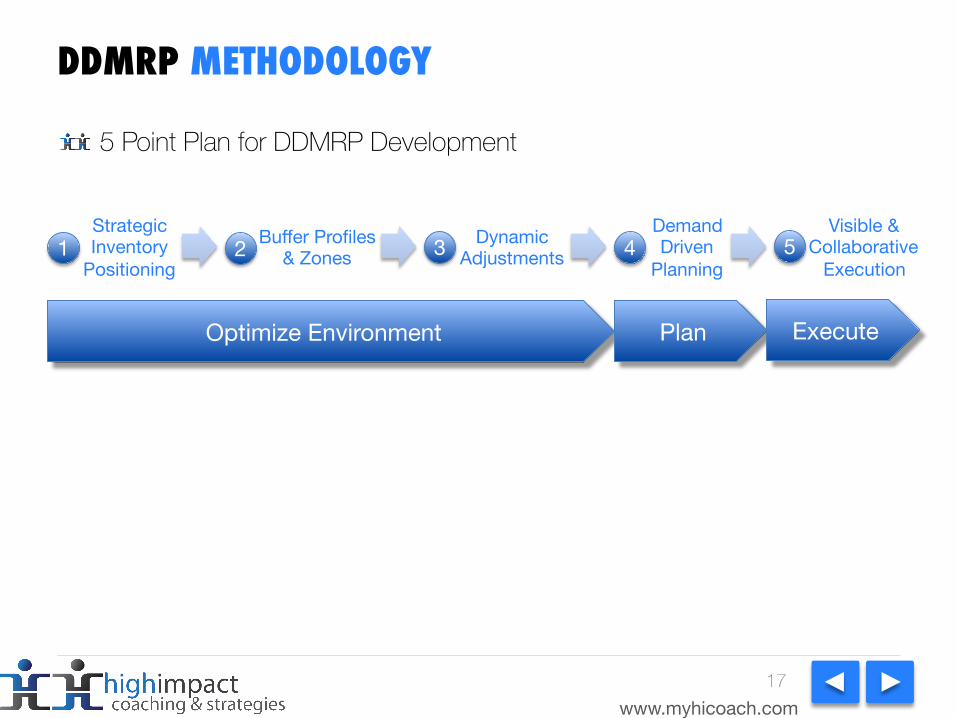
5 Point Plan for DDMRP Development
3 Dynamic Adjustments 4
Demand Driven
Planning 5
Visible & Collaborative
Execution
Strategic Inventory
Positioning 1 Buffer Profiles
& Zones 2
Optimize Environment Plan Execute
www.myhicoach.com
DDMRP INTELLIGENT ASSISTANT
18
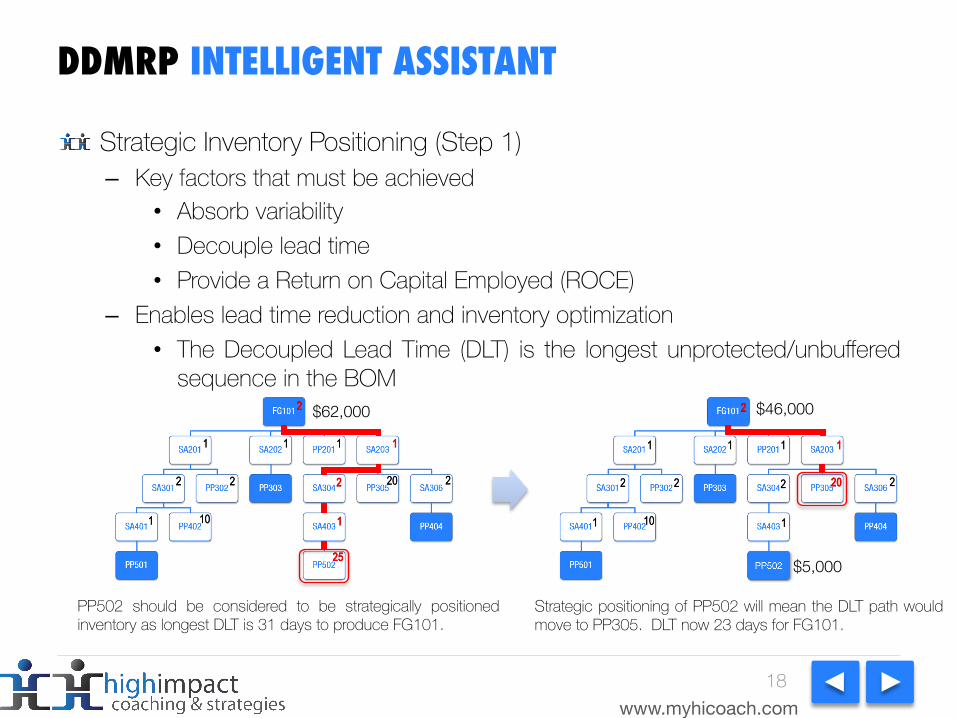
Strategic Inventory Positioning (Step 1)– Key factors that must be achieved
• Absorb variability• Decouple lead time• Provide a Return on Capital Employed (ROCE)
– Enables lead time reduction and inventory optimization• The Decoupled Lead Time (DLT) is the longest unprotected/unbuffered
sequence in the BOM
PP502 should be considered to be strategically positioned inventory as longest DLT is 31 days to produce FG101.
Strategic positioning of PP502 will mean the DLT path would move to PP305. DLT now 23 days for FG101.
1 1 1 1
20
25
2 2 2 2
1 1
2
10
1 1 1 1
20 2 2 2 2
1 1
2
10
$62,000 $46,000
$5,000
1 1 1 1
20
25
2 2 2 2
1 1
2
10
1 1 1 1
20 2 2 2 2
1 1
2
10
www.myhicoach.com
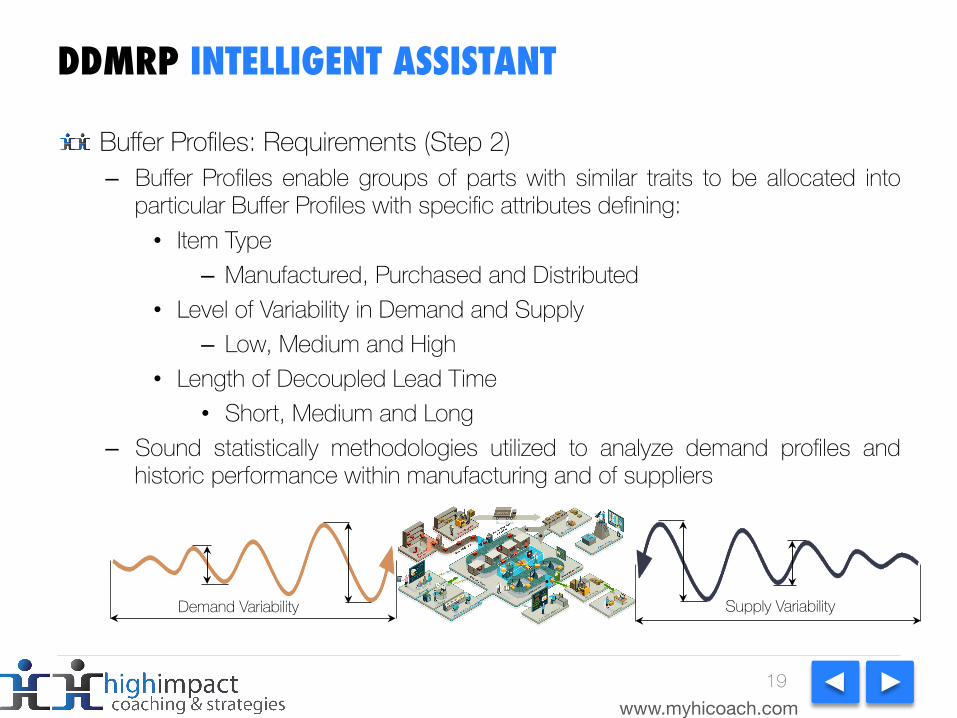
DDMRP INTELLIGENT ASSISTANT
19
Buffer Profiles: Requirements (Step 2)– Buffer Profiles enable groups of parts with similar traits to be allocated into
particular Buffer Profiles with specific attributes defining:• Item Type
– Manufactured, Purchased and Distributed• Level of Variability in Demand and Supply
– Low, Medium and High• Length of Decoupled Lead Time
• Short, Medium and Long– Sound statistically methodologies utilized to analyze demand profiles and
historic performance within manufacturing and of suppliers
Supply VariabilityDemand Variability
www.myhicoach.com
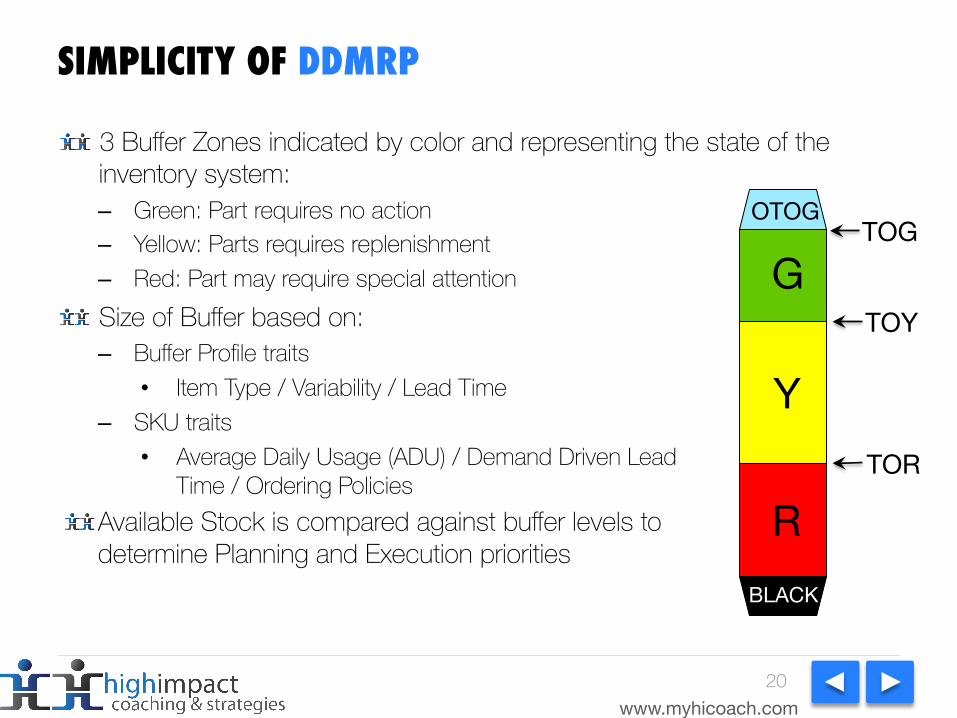
SIMPLICITY OF DDMRP
3 Buffer Zones indicated by color and representing the state of the inventory system:
R
Y
G TOY
TOR
TOG OTOG
BLACK
– Green: Part requires no action – Yellow: Parts requires replenishment– Red: Part may require special attention Size of Buffer based on:– Buffer Profile traits
• Item Type / Variability / Lead Time– SKU traits
• Average Daily Usage (ADU) / Demand Driven Lead Time / Ordering Policies
Available Stock is compared against buffer levels to determine Planning and Execution priorities
20
www.myhicoach.com
DDMRP INTELLIGENT ASSISTANT
21
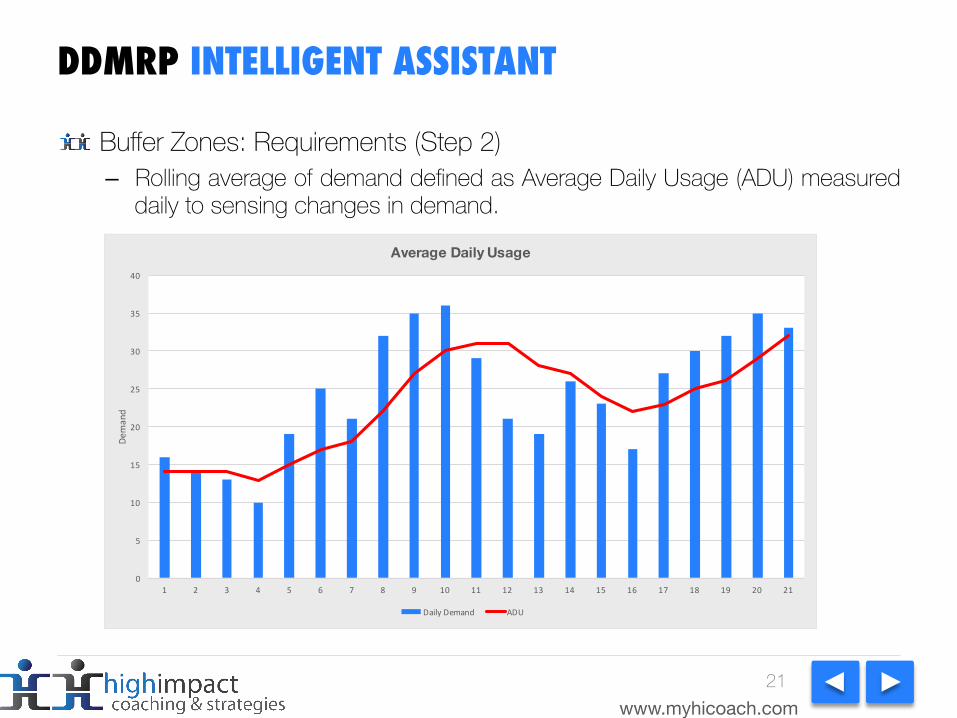
Buffer Zones: Requirements (Step 2)– Rolling average of demand defined as Average Daily Usage (ADU) measured
daily to sensing changes in demand.
0
5
10
15
20
25
30
35
40
1 2 3 4 5 6 7 8 9 10 11 12 13 14 15 16 17 18 19 20 21
Demand
Average Daily Usage
DailyDemand ADU
www.myhicoach.com
DDMRP INTELLIGENT ASSISTANT
22
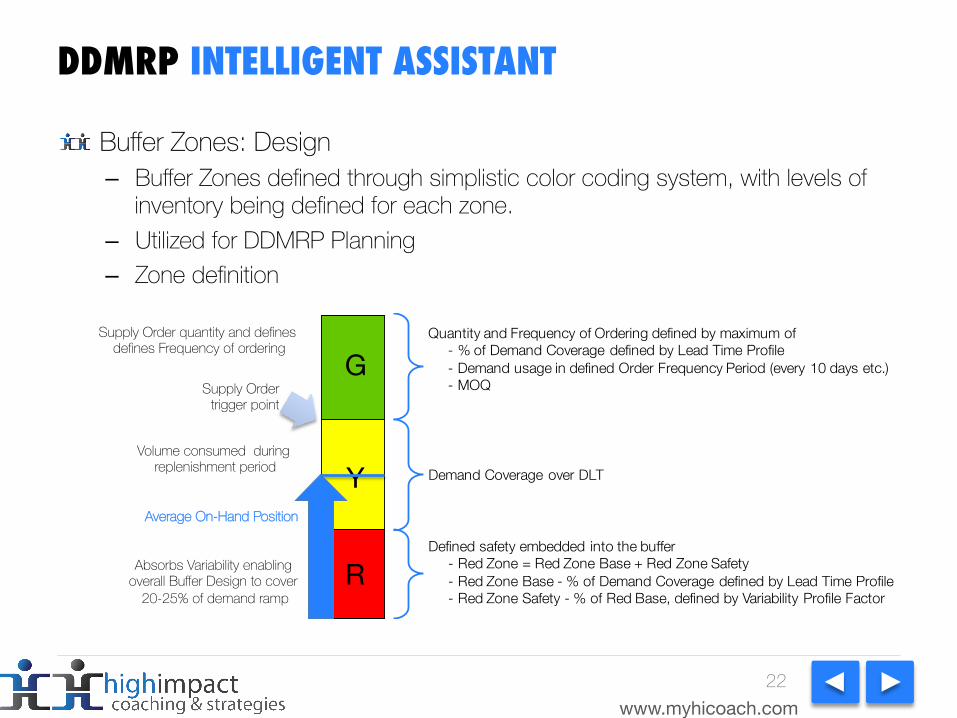
Buffer Zones: Design– Buffer Zones defined through simplistic color coding system, with levels of
inventory being defined for each zone.– Utilized for DDMRP Planning– Zone definition
Y Demand Coverage over DLT
GQuantity and Frequency of Ordering defined by maximum of
- % of Demand Coverage defined by Lead Time Profile- Demand usage in defined Order Frequency Period (every 10 days etc.)- MOQ
RDefined safety embedded into the buffer
- Red Zone = Red Zone Base + Red Zone Safety- Red Zone Base - % of Demand Coverage defined by Lead Time Profile- Red Zone Safety - % of Red Base, defined by Variability Profile Factor
Absorbs Variability enabling overall Buffer Design to cover
20-25% of demand ramp
Supply Order quantity and defines defines Frequency of ordering
Volume consumed during replenishment period
Supply Ordertrigger point
Average On-Hand Position
www.myhicoach.com
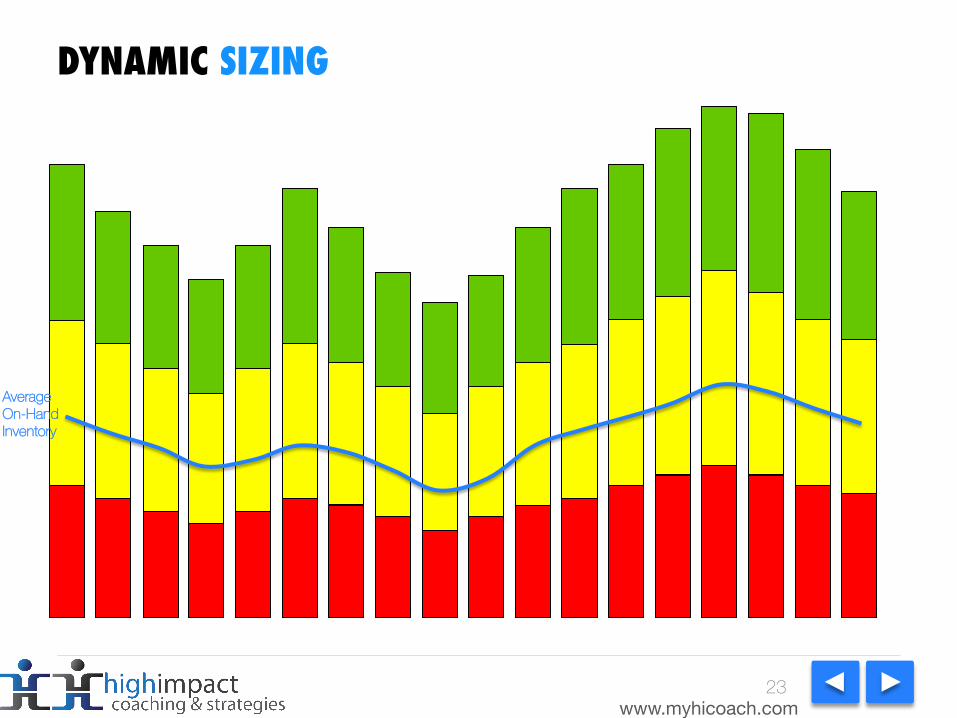
DYNAMIC SIZING
Average On-HandInventory
23
www.myhicoach.com
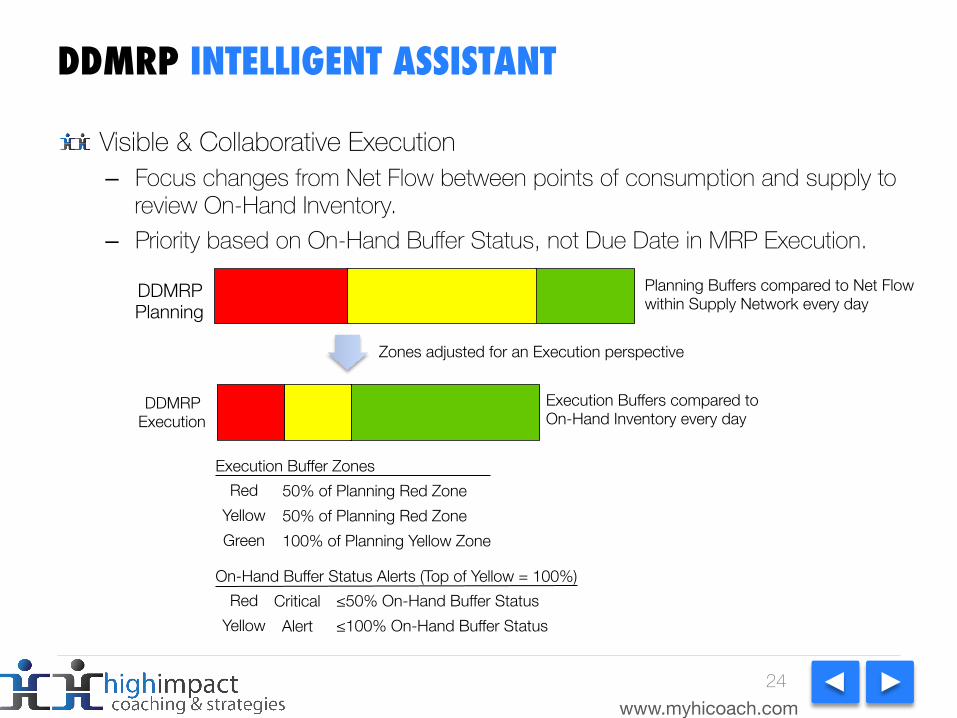
DDMRP INTELLIGENT ASSISTANT
24
Visible & Collaborative Execution– Focus changes from Net Flow between points of consumption and supply to
review On-Hand Inventory. – Priority based on On-Hand Buffer Status, not Due Date in MRP Execution.
DDMRP Planning
DDMRP Execution
Planning Buffers compared to Net Flow within Supply Network every day
Execution Buffers compared to On-Hand Inventory every day
Zones adjusted for an Execution perspective
Execution Buffer Zones Red
Yellow Green
50% of Planning Red Zone 50% of Planning Red Zone 100% of Planning Yellow Zone
On-Hand Buffer Status Alerts (Top of Yellow = 100%) Red
Yellow Critical Alert
≤50% On-Hand Buffer Status ≤100% On-Hand Buffer Status
www.myhicoach.com
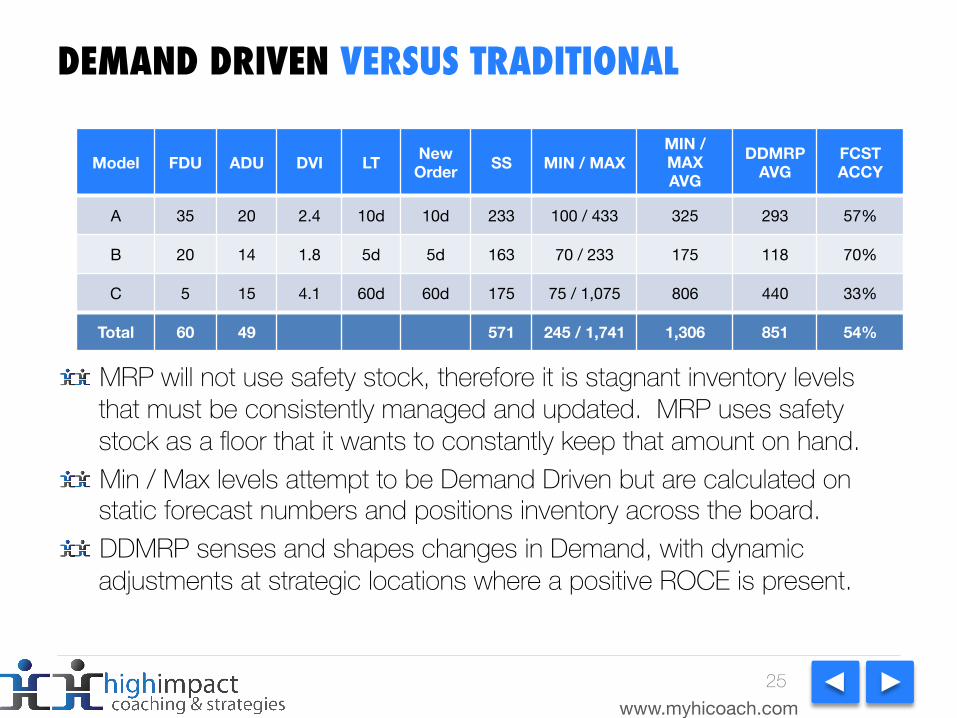
DEMAND DRIVEN VERSUS TRADITIONAL
MRP will not use safety stock, therefore it is stagnant inventory levels that must be consistently managed and updated. MRP uses safety stock as a floor that it wants to constantly keep that amount on hand. Min / Max levels attempt to be Demand Driven but are calculated on static forecast numbers and positions inventory across the board. DDMRP senses and shapes changes in Demand, with dynamic adjustments at strategic locations where a positive ROCE is present.
25
Model FDU ADU DVI LT New Order SS MIN / MAX
MIN / MAX AVG
DDMRP AVG
FCST ACCY
A 35 20 2.4 10d 10d 233 100 / 433 325 293 57%
B 20 14 1.8 5d 5d 163 70 / 233 175 118 70%
C 5 15 4.1 60d 60d 175 75 / 1,075 806 440 33%
Total 60 49 571 245 / 1,741 1,306 851 54%
www.myhicoach.com 26
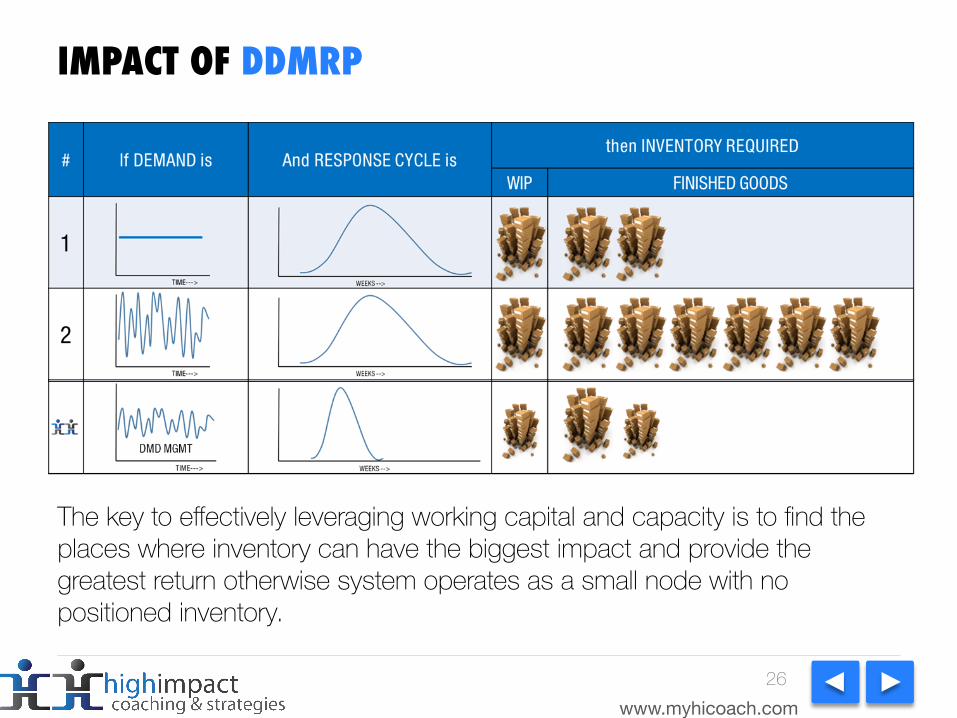
IMPACT OF DDMRP
The key to effectively leveraging working capital and capacity is to find the places where inventory can have the biggest impact and provide the greatest return otherwise system operates as a small node with no positioned inventory.
www.myhicoach.com
BENEFITS STORY FOR DDMRP
Top issues facing most Supply Chains
Benefits of DDMRP based on case studies by the Demand Driven Institute.
27
Reduce costs while improving
customer service levels
Complexities with the Global Supply
Network
Pressure to Improve Inventory
Turns
Growing lead times through the
entire Supply Network
Replenishment times
80%
Inventory Raw Material, FGI
and WIP
65%
20%
Customer Service Levels
15%
Planner / Scheduler Availability
Achieve these types of results for ~$50-75k+ annual investment+ $75k investment is based on standard enterprise installation for one site, $50k annual license fee and $25k in implementation. Price and results can vary based on size, scale
and complexity.
www.myhicoach.com
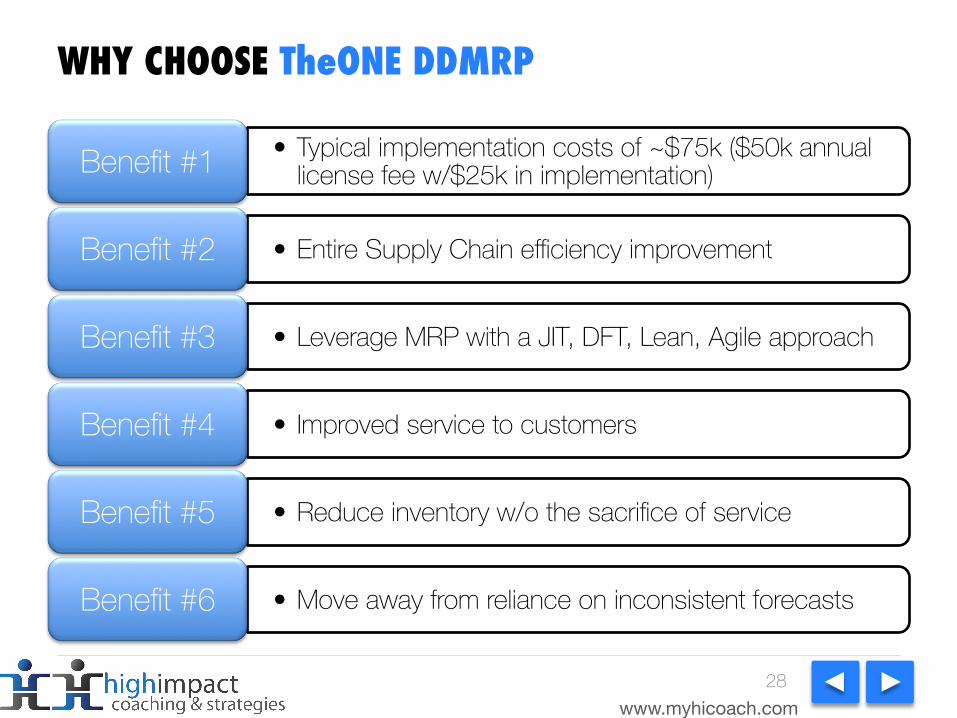
WHY CHOOSE TheONE DDMRP
28
• Typical implementation costs of ~$75k ($50k annual license fee w/$25k in implementation)Benefit #1
• Entire Supply Chain efficiency improvementBenefit #2
• Leverage MRP with a JIT, DFT, Lean, Agile approachBenefit #3
• Improved service to customersBenefit #4
• Reduce inventory w/o the sacrifice of serviceBenefit #5
• Move away from reliance on inconsistent forecastsBenefit #6
www.myhicoach.com
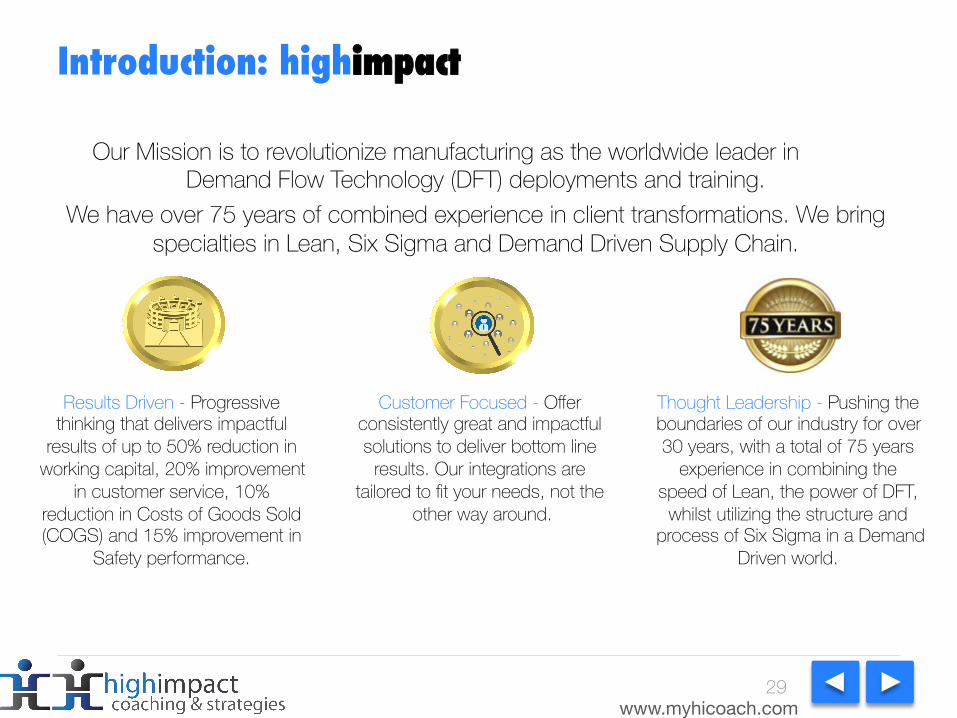
Our Mission is to revolutionize manufacturing as the worldwide leader in Demand Flow Technology (DFT) deployments and training.
We have over 75 years of combined experience in client transformations. We bring specialties in Lean, Six Sigma and Demand Driven Supply Chain.
Results Driven - Progressive thinking that delivers impactful
results of up to 50% reduction in working capital, 20% improvement
in customer service, 10% reduction in Costs of Goods Sold (COGS) and 15% improvement in
Safety performance.
Customer Focused - Offer consistently great and impactful solutions to deliver bottom line
results. Our integrations are tailored to fit your needs, not the
other way around.
Thought Leadership - Pushing the boundaries of our industry for over 30 years, with a total of 75 years
experience in combining the speed of Lean, the power of DFT, whilst utilizing the structure and
process of Six Sigma in a Demand Driven world.
Introduction: highimpact
29
www.myhicoach.com
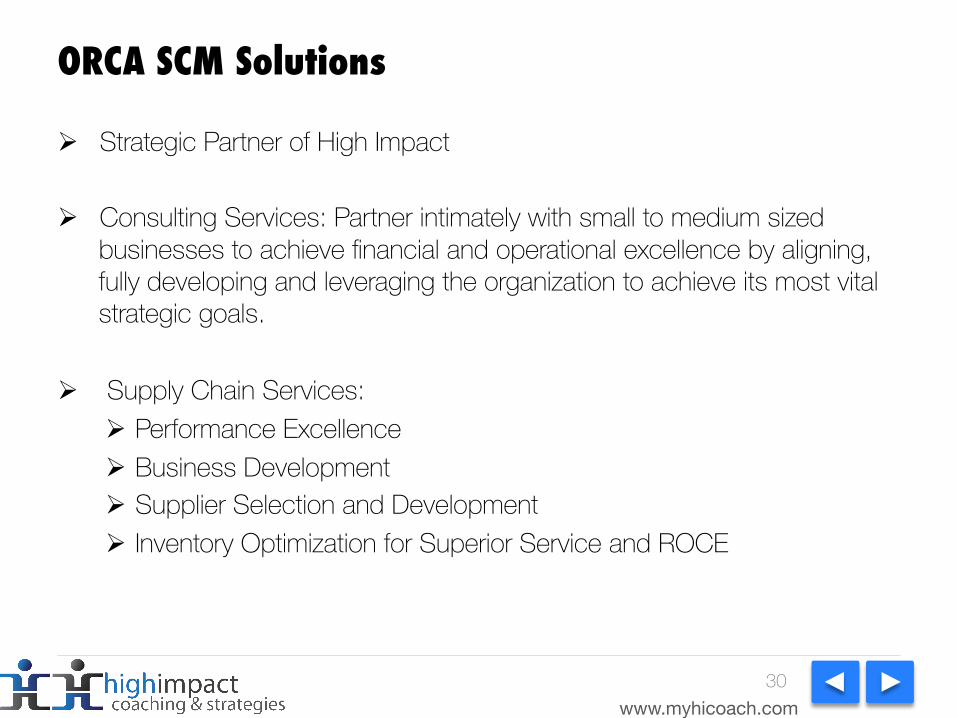
ORCA SCM Solutions
Ø Strategic Partner of High Impact
Ø Consulting Services: Partner intimately with small to medium sized businesses to achieve financial and operational excellence by aligning, fully developing and leveraging the organization to achieve its most vital strategic goals.
Ø Supply Chain Services: Ø Performance Excellence Ø Business DevelopmentØ Supplier Selection and DevelopmentØ Inventory Optimization for Superior Service and ROCE
30
www.myhicoach.com
DDMRP--The New Standard of MRP: Wrap Up
Q & A
THANK YOU!!!
31