Embed Size (px)
Citation preview
RAW WATER SOURCE ALTERNATIVES STUDY
Demand and Yield AnalysisFinal
Prepared for:Ute Water Conservancy DistrictP.O. Box 460Grand Junction, CO 81502
Prepared by:
8181 East Tufts AvenueDenver, CO 80237
April 2009
TABLE OF CONTENTS
Section 1 ONE Introduction..................................................................................................................... 1-1
Section 2 TWO Background..................................................................................................................... 2-1
Section 3 THREE Population Projection .................................................................................................... 3-1
Section 4 FOUR Per Capita Demand......................................................................................................... 4-1
Section 5 FIVE Demand Forecast ........................................................................................................... 5-1
Section 6 SIX Water Rights Model Selection ....................................................................................... 6-1
Section 7 SEVEN Firm Yield Analysis ........................................................................................................ 7-1
C:\Documents and Settings\david_slack\My Documents\John Sikora\Demand and Yield Report\Ute Water_Demand and Yield Report_rev2_Final_4.21.09.doc\22240554\ i

SECTIONONE Introduction
1. Section 1 ONE Introduction
The purpose of this report is to document the demand and yield analysis of the Ute Water Conservancy District (the District) system. This report will support the Purpose and Need Statement in the Section 404 and National Environmental Policy Act (NEPA) process for a potential water supply project. The demand and yield analysis described in this report is supported by detailed reports on demographic forecasting and associated firm yield requirements (Appendix A).
In 1995, the District was faced with replacing the Plateau Creek Pipeline due to a failure of the pipeline. The pipeline is a critical component in their water system that conveys water from Plateau Creek to their water treatment plant near Rapid Creek. The District prepared a Plateau Creek Pipeline Replacement Project Environmental Impact Statement (EIS) to address the replacement of the pipeline. A fifty year planning horizon (2045) was chosen for that EIS. The District desires to increase their firm yield of their water system to meet demands of the same planning horizon until 2045.
C:\Documents and Settings\david_slack\My Documents\John Sikora\Demand and Yield Report\Ute Water_Demand and Yield Report_rev2_Final_4.21.09.doc\22240554\ 1-1
SECTIONTWO Background
2. Section 2 TWO Background
The District’s was created by decree of the District Court of Mesa County, Colorado on April 4, 1956. The District was formed in accordance with the Water Conservancy Act, Title 37, Article 45 as amended. The District is a political subdivision of the State of Colorado and was formed to provide domestic water service to rural and urban areas of the Grand Valley.
The District provides potable water to the Grand Valley except for the core of the City of Grand Junction, City of Palisade and the Clifton Water District as shown on Figure 2-1. Most of the undeveloped and future growth areas of the Grand Valley are to be served by the District including most of the new growth within the City of Grand Junction. The District serves the largest population on the Western Slope of Colorado.
C:\Documents and Settings\david_slack\My Documents\John Sikora\Demand and Yield Report\Ute Water_Demand and Yield Report_rev2_Final_4.21.09.doc\22240554\ 2-1
SECTIONTHREE Population Projection
3. Section 3 THREE Population Projection
In 1995 Pearse and Associates, for the Plateau Creek Pipeline Replacement Project EIS, conducted a population and water demand projection report. The population of the Service Area was approximately 55,000 people at that time. Pearse and Associates evaluated six different growth scenarios for the District’s Service Area, and recommended using a mid range (Scenarios C and D) of these scenarios. This resulted in a projection that the population would grow to somewhere between 200,000 and 235,000 by 2045, for a four fold increase over 50 years.
HDR conducted an independent analysis as part of the Raw Water Source Study using the same planning horizon of 2045 as the previous Plateau Creek Pipeline Replacement Project EIS. The results of this analysis are documented in a separate report entitled, “Demographic Forecasting, The District Service Area” dated February 5, 2009 (Appendix A). HDR also reviewed the work done by Pearse and Associates, as well as that done by the Colorado State Demography Office, BBC Research and Consulting and Mesa County.
As of 2008, the District currently serves nearly 80,000 residents. The growth rate has averaged 4.3%, a rate which has surpassed the projections. This recent review and updating of these projections by HDR has resulted in a lower out year projection, with the expected 2045 Ute Service Area Population to be between 165,000 to 235,000, with a median population of 197,000. This reflects a growth of 2.27% to 3.4% through 2035 and a median rate of 1.28% for the period from 2035 to 2045.
No forecast data past 2035 were available from the State of Colorado or Mesa County. Therefore, national population forecasts from the US Census Bureau of 0.8 percent per year were used for Mesa County. We have assumed nearly 50% of the Mesa County growth will continue to be attributed to Grand Junction, and that 75% of the growth in Grand Junction will be served by the District. This results in a median growth of 1.28% for the last 10 years of the period, higher than the national rate, but still flatter than the period up to 2035.
C:\Documents and Settings\david_slack\My Documents\John Sikora\Demand and Yield Report\Ute Water_Demand and Yield Report_rev2_Final_4.21.09.doc\22240554\ 3-1

SECTIONFOUR Per Capita Demand
4. Section 4 FOUR Per Capita Demand
The District has continued to reduce an already low per capita consumption rate by implementing stringent conservation measures and maintaining system efficiency. The current usage rate over the past five years has ranged from 80 to 85 gallons per capita per day (gcpd), a rate which is much lower than any other western municipalities. This is largely due to the fact that the District serves principally in-house use water; outside irrigation is provided primarily by the historic irrigation entities which have served the Grand Valley. HDR reviewed historic water usage for the past 10 years and developed the following information.
While gallons per capita per day have averaged 86 for the past ten years, it has been trending downward from 91 in 1997 to 80 in 2005. 80 gcpd was used for forecasting future usage in the Raw Water Source study. Industrial usage has averaged 731,000 gallons/tap for the past 10 years, again trending downward. 700,000 gallons/industrial tap was used for future usage. Industrial taps were computed to grow at the same rate as district population.
The percentage of water delivered to meters compared to water delivered to the plant has averaged 78%, and ranged from 74% to 87%. For the purpose of projecting total demand, it was assumed the District would continue to improve its efficiencies, and 85% was used.
The peak daily usage has averaged 205 gcpd (total) over the past 8 years (compared to an average 113 gcpd (total) amount. Again, assuming continued efficiency improvement, a 180 gcpd (total) would mean that the District would need to plan for at least 40 million gallons per day (MGD) in system daily peak capacity.
C:\Documents and Settings\david_slack\My Documents\John Sikora\Demand and Yield Report\Ute Water_Demand and Yield Report_rev2_Final_4.21.09.doc\22240554\ 4-1
SECTIONFIVE Demand Forecast
5. Section 5 FIVE Demand Forecast
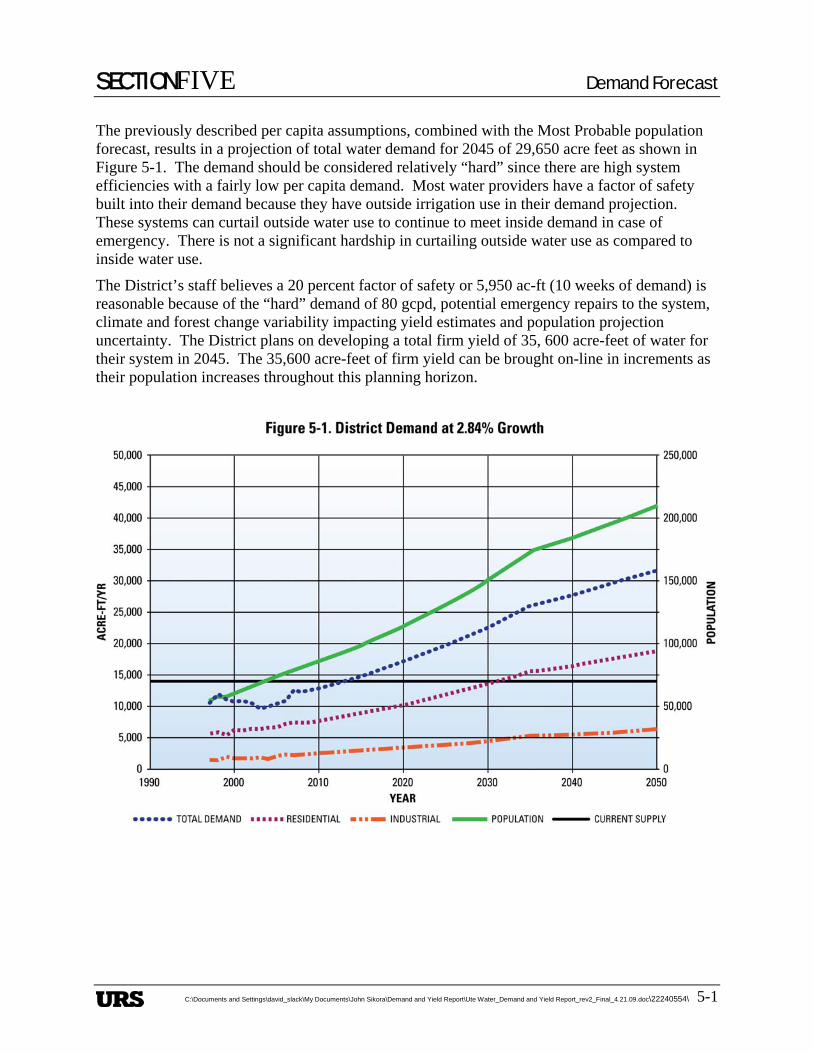
The previously described per capita assumptions, combined with the Most Probable population forecast, results in a projection of total water demand for 2045 of 29,650 acre feet as shown in Figure 5-1. The demand should be considered relatively “hard” since there are high system efficiencies with a fairly low per capita demand. Most water providers have a factor of safety built into their demand because they have outside irrigation use in their demand projection. These systems can curtail outside water use to continue to meet inside demand in case of emergency. There is not a significant hardship in curtailing outside water use as compared to inside water use.
The District’s staff believes a 20 percent factor of safety or 5,950 ac-ft (10 weeks of demand) is reasonable because of the “hard” demand of 80 gcpd, potential emergency repairs to the system, climate and forest change variability impacting yield estimates and population projection uncertainty. The District plans on developing a total firm yield of 35, 600 acre-feet of water for their system in 2045. The 35,600 acre-feet of firm yield can be brought on-line in increments as their population increases throughout this planning horizon.
C:\Documents and Settings\david_slack\My Documents\John Sikora\Demand and Yield Report\Ute Water_Demand and Yield Report_rev2_Final_4.21.09.doc\22240554\ 5-1

SECTIONSIX Water Rights Model Selection
6. Section 6 SIX Water Rights Model Selection
A water rights model is needed to assess firm yield and to evaluate hydrologic changes associated with potential water supply alternative components. The water rights model is used to evaluate the potential impacts on resources affected by change in flow, including wildlife, aquatic resources, recreation, stream channel morphology, wetlands and riparian habitat, floodplains, water quality, and reservoir operations.
There are two water rights models that are readily available, the CDSS model developed by the Colorado Water Conservation Board and the District’s SYSTEM Model developed by Boyle Engineering. A detailed description of the two models and their advantages and disadvantages was developed by Ecological Resource Consultants (ERC) and documented in a memorandum dated October 3, 2008. The memorandum is in Appendix B.
The District after reviewing the memorandum from ERC has chosen to upgrade the CDSS model. The main reasons for choosing the CDSS model is the model is well documented and supported by the Colorado Water Conservation Board (CWCB), the model currently has a reasonable representation of the Colorado River system and the period of record is from 1909 through 2005. The current CDSS model will need major upgrades to the Plateau Valley representation including adding the District’s existing irrigation water rights.
C:\Documents and Settings\david_slack\My Documents\John Sikora\Demand and Yield Report\Ute Water_Demand and Yield Report_rev2_Final_4.21.09.doc\22240554\ 6-1

SECTIONSEVEN Firm Yield Analysis
7. Section 7 SEVEN Firm Yield Analysis
An analysis was completed of the firm yield of the District water supply system for the Raw Water Source study. Firm yield was defined as the amount of water that can be reliably delivered to meet the District’s municipal water demands in each year of the study period without any shortages. The determination of reliable water deliveries during dry years, or “firm yield”, is dependent on the amount and timing of supplies and demands, reservoir operations, physical constraints in the water conveyance system, and legal constraints including water rights priorities and administration of the river.
To calculate the existing firm yield of the District’s water supply system, the District’s SYSTEM Model, which was originally developed for use in the Plateau Creek Pipeline Replacement Project EIS, was used. The model includes the District’s raw water system and water rights in the Plateau Creek basin, on the Colorado River and Rapid Creek. The SYSTEM model was designed to determine the firm yield of the District’s raw water system under a variety of operational parameters including water rights owned, storage and diversion capacities, calls on the river, Green Mountain Reservoir protection and development of downstream senior conditional water rights. The SYSTEM model operates the District’s water supply system including direct flow and storage rights with the objective of meeting monthly demands in a manner such that the combined yield of the District’s water supplies is maximized. The model reflects current operating criteria including use of the District’s direct flow diversions rights prior to storage and diversion of Molina Tailrace water prior to Plateau Creek and Colorado River water due to its higher water quality. The SYSTEM Model study period extends 18 years from 1975 through 1993.
To determine the firm yield of the District’s water supply system the following water rights were assumed to be operational and available to meet demand:
• Ute Pipeline senior and junior rights for 20 cfs and 30 cfs, respectively;
• Cameo Pipeline right for 15 cfs (this right was reduced to 12 cfs to reflect current capacity constraints);
• Coon Creek pipeline right for 6 cfs;
• Mason & Eddy Ditch rights for 4.032 cfs and 1.95 cfs;
• Carver Ranch Pipeline right for 11.0 cfs;
• Rapid Creek Pipeline right for 8 cfs.
In addition to the water rights listed above, the instream flow right below the Molina tailrace diversions was assumed to be 20 cfs. Although the District owns numerous other ditch and reservoir shares and water rights, these rights were not considered in the determination of firm yield because they have not yet been transferred from agricultural to municipal use in water court.
The results of the SYSTEM model analysis indicate the existing firm yield of the District’s system is 15,114 AF/yr. Model results show the critical period for the District’s system extends from 1977 through 1978. The estimate of firm yield assumes that Green Mountain Reservoir protection is available to the District’s junior 30 cfs Ute Pipeline right. Based on model results, it does not appear that the firm yield would decrease if Green Mountain Reservoir protection was not available to that right. The SYSTEM model run also assumes that the Cameo call during the summer is for 2,260 cfs. If the summer Cameo call was reduced to 1,950 cfs, which is consistent
C:\Documents and Settings\david_slack\My Documents\John Sikora\Demand and Yield Report\Ute Water_Demand and Yield Report_rev2_Final_4.21.09.doc\22240554\ 7-1

SECTIONSEVEN Firm Yield Analysis
C:\Documents and Settings\david_slack\My Documents\John Sikora\Demand and Yield Report\Ute Water_Demand and Yield Report_rev2_Final_4.21.09.doc\22240554\ 7-2
with the Orchard Mesa Check Case Settlement, the District firm yield would increase by approximately 500 AF to 15,600 AF/yr.
A sensitivity analysis was conducted to determine how much less the District’s firm yield would be if the Molina tailrace water was not available during the critical period from 1977 through 1978. Under that scenario, the firm yield would be reduced to approximately 14,200 AF/yr. Without the supply from the Molina tailrace, the District would need to rely more heavily on native Plateau Creek diversions and diversions from the Colorado River. Therefore, although the firm yield only decreases by about 900 AF/yr, a greater portion of the demand is met with diversions from Plateau Creek and the Colorado River.
At their current growth projections, the District will exceed their firm yield in 2013 without any factor of safety. Because of the relatively “hard” demand on the system, it is imperative the District begin an aggressive plan to increase their firm yield of their system.

Appendix A
HDR: Ute Water Conservancy District; Demographic Forecasting; Final Report (Revised)
Appendix A HDR: Ute Water Conservancy District; Demographic Forecasting; Final Report (Revised)
C:\Documents and Settings\david_slack\My Documents\John Sikora\Demand and Yield Report\Ute Water_Demand and Yield Report_rev2_Final_4.21.09.doc\22240554\ A-1

Ute Water Conservancy District Demographic Forecasting The District Service Area Final Report (Revised)
February 5, 2009
HDR|HLB Decision Economics Page • i

Ute Water Conservancy District
Demographic Forecasting The District Service Area
Final Report (Revised)
Prepared By:
HDR|Decision Economics 1545 Carling Avenue, Suite 410
Ottawa Ontario K1Z 8P9 Canada
February 5, 2009

TABLE OF CONTENTS
Executive Summary .........................................................................................................................1
1. Introduction ............................................................................................................................3 1.1 Objectives ............................................................................................................... 3 1.2 Organization of Report ........................................................................................... 3
2. Historical Population Projections ...........................................................................................4 2.1 Ute Water Service Area, “Domestic Water Demand Projections: Technical Memorandum” ....................................................................................................................... 4 2.1.1 Mesa County Forecast............................................................................................. 4 2.1.2 Historical District Population Forecast................................................................... 5
3. Current Population Projections...............................................................................................7 3.1 US Census Bureau Forecast 2000-2035 ................................................................. 7 3.2 Colorado Department of Local Affairs Forecast 2000-2035 .................................. 7 3.3 BBC Research & Consulting Forecast 2005-2035 ................................................. 8 3.4 Mesa County Administration Forecast 2000-2020 ................................................. 9
4. Historical Population Trends................................................................................................12 4.1 Historical Trends................................................................................................... 12 4.2 Pearse & Associates Forecast Assessment ........................................................... 13
5. Risk Adjusted Population Forecast for the District Service Area ........................................15 5.1 Risk Adjusted Forecast assumption ...................................................................... 15 5.2 Risk Adjusted Forecast ......................................................................................... 15
Appendix A....................................................................................................................................17
Appendix B ....................................................................................................................................18
HDR|HLB Decision Economics Page • i

LIST OF FIGURES
Figure 1: Pearse & Associates Forecasts- Mesa County 1995-2045 ...............................................5
Figure 2: Historical Average Growth Rates U.S, Colorado, Mesa County, and Grand Junction..13
Figure 3: Estimated District Population 1997-2007 .....................................................................14
HDR|HLB Decision Economics Page • ii

LIST OF TABLES
Table 1: Mesa County Population Forecast 1995-2045...................................................................4
Table 2: The District’s Population Forecast 1995-2045..................................................................6
Table 3: Summary of Available Population Projections................................................................10
Table 4: Decennial Census Population and Estimates...................................................................12
Table 5: : Base, Pessimistic and Optimistic Case Forecasts for Population Growth in the District’s Service Area 2005-2045.................................................................................................16
Appendix A.1: Households -- Colorado, Mesa County and Municipalities ..................................18
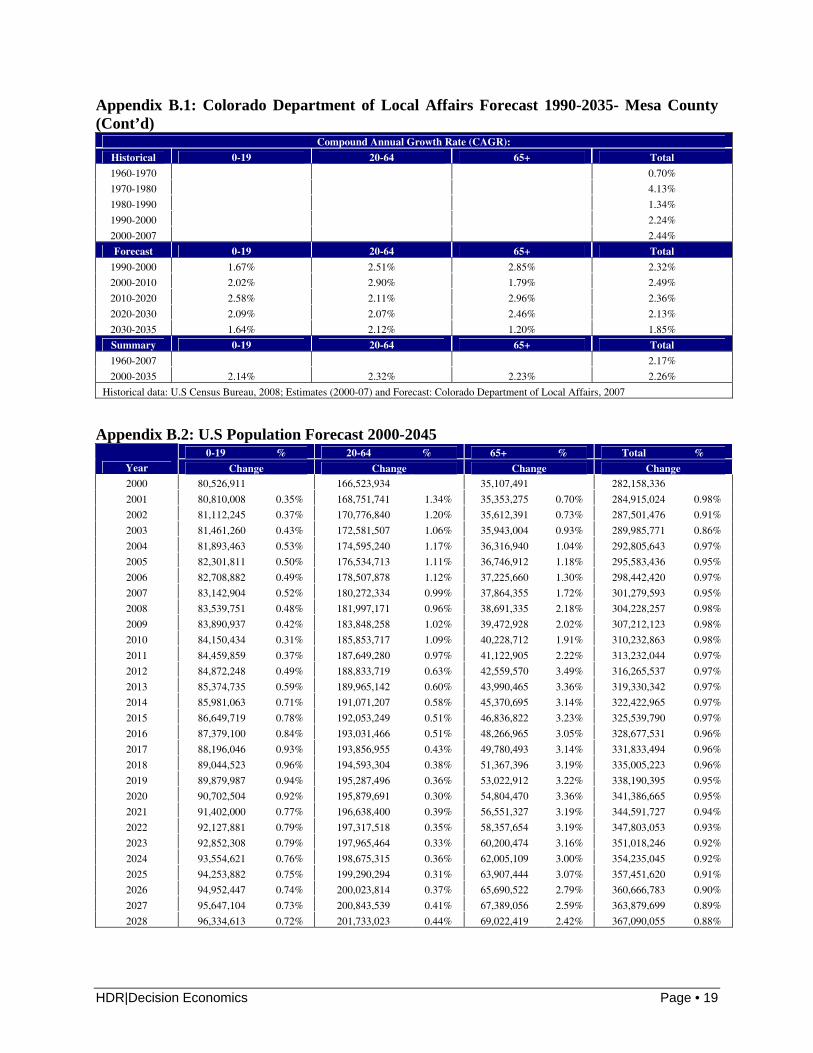
Appendix B.1: Colorado Department of Local Affairs Forecast 1990-2035 - Mesa County........18
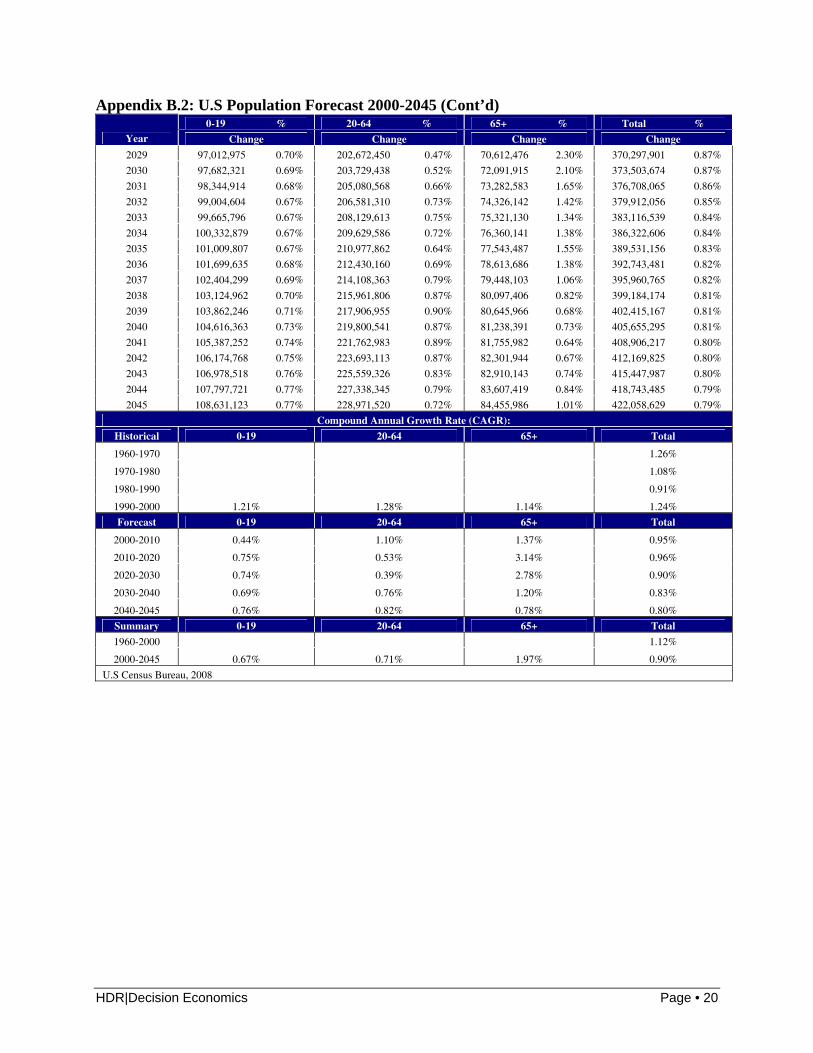
Appendix B.2: U.S Population Forecast 2000-2045......................................................................19
HDR|Decision Economics Page • iii
EXECUTIVE SUMMARY
HDR|Decision Economics (HDR) has been contracted to provide an independent assessment of the key socioeconomic variables underlying facility demand – population and households – within the service area of Ute Water Conservancy District (the District). The purposes of the assessment are three-fold:
a) Review and assess existing forecasts of population; b) Documents historical growth trends and existing forecasts of population; and, c) Provide a recommendation as to whether the existing forecasts provide adequate
information to form the basis of a forecast; or if the data is deemed sufficient, provide an independent risk adjusted population forecast of the District’s service area.
In October 1995, Pearse & Associates were retained to produce population forecasts for Mesa County and the District. It was concluded that Mesa County’s population would experience annual compound average growth in the range of 2.1 to 2.5 percent. Tracking of current Mesa County’s population (2000-06) relative to the 1995 forecast reveals that the County’s population has been growing slightly faster than forecast. Pearse & Associates suggested the District’s population will probably grow faster than Mesa County’s population. Indeed, recent population estimates from the District suggest this has been the case. When the Pearse & Associates population forecast is compared to subsequent forecasts, the annual population growth rate projected appears to be reasonable. More recent forecasts, from BBC Research and Consulting and local agencies, project Mesa County’s population to grow at an annual rate between 2 and 3 percent for various long term time horizons. However, these forecasts are well in excess of what the US Census Bureau projects for the US in general, and the State of Colorado in particular. Due to aging population trends, longer term population growth rates tend to be in about the 1 percent range. Local areas can achieve higher population trends if there is sustained migration to the local area from other locations. Given our review of available data (including Ute estimates), the District’s service area is expected to increase in population by 117,377 people by 2045, an increase of 148 percent from 2007. This forecast assumes that 75 percent of the new population growth within the City of Grand Junction will be served by the District. Monte Carlo simulations were conducted to develop risk-adjusted forecasts of the population growth in the study area. The simulation model provides Base, Pessimistic and Optimistic Case forecasts over the period 2007-45. Growth rates have been adjusted to reflect stronger growth in the early years and slower growth in the later years. The table below presents a summary of HDR’s Base, Pessimistic and Optimistic Case forecasts.
HDR|Decision Economics Page • 1

HDR|Decision Economics Page • 2
District Population Forecast Base Pessimistic Optimistic
Year Pop Annual Growth Pop
Annual Growth Pop
Annual Growth
2005 74,327 3.56% 74,327 3.56% 74,327 3.56% 2006 76,739 3.25% 76,739 3.25% 76,739 3.25% 2007 79,095 3.07% 79,095 3.07% 79,095 3.07% 2010 86,564 3.05% 85,034 2.44% 88,112 3.66% 2015 100,507 3.03% 95,859 2.42% 105,350 3.63% 2020 116,487 2.96% 107,907 2.36% 125,692 3.55% 2025 134,027 2.76% 120,758 2.20% 148,664 3.31% 2030 152,551 2.58% 133,971 2.06% 173,580 3.09% 2035 173,041 2.54% 148,221 2.03% 201,845 3.05% 2040 184,384 1.28% 155,954 1.02% 217,804 1.53% 2045 196,472 1.28% 164,091 1.02% 235,026 1.53%
CAGR 07-35 2.84% 2.27% 3.40% CAGR 05-45 2.46% 2.00% 2.92%
HDR recommends using similar growth rates for household projections within the District’s service area. This recommendation is actually consistent with the household’s historical rate of growth since 1970 (3.14 percent) in Mesa County. (See appendix A.1)
HDR|Decision Economics Page • 3
1. INTRODUCTION
HDR|Decision Economics (HDR) has been contracted by the District to provide an independent assessment of the key socioeconomic variables underlying facility demand – population and households – of the District’s service area. The study area encompasses most of Mesa County: Collbran, De Beque, Fruita, including unincorporated areas and new developments in the City of Grand Junction. It excludes some portions of the City, the town of Palisade and Clifton CDP1 (part).
1.1 Objectives
The District retained HDR to accomplish the following study objectives:
• Review existing forecasts of population as provided by the client; • Assess other existing socioeconomic forecasts of the region that may be available from
other sources (i.e., US Census Bureau, recent studies, etc); • Assess historical growth trends in the above variables for the region and surrounding
regions of influence given the availability of data; • Interview economic development specialists, city officials as appropriate with respect to
the local area prospects and development potential; • Based on the above, provide a recommendation as to whether the existing forecasts
provide adequate information to form the basis of a forecast for this project: o If the data is deemed in-sufficient, recommendations will be made with respect to
undertaking primary demographic forecasting research; and, o If the data is deemed sufficient, independent risk adjusted forecasts of population and
households will be developed. “Risk adjusted” implies that forecasts will be available at various probability levels which will be used to structure alternative projection scenarios such as Base, Optimistic and Pessimistic cases.
1.2 Organization of Report Following this introduction, this report has been organized as follows:
• Section 2 provides a review of historical population projections; • Section 3 documents existing population forecasts for United States, The State of
Colorado and for the study area; • Section 4 presents historical populations trends; • Section 5 provides risk adjusted forecasts of population; and • The appendices contain supplementary information as referenced in the report.
1 Census Designated Place

2. HISTORICAL POPULATION PROJECTIONS
This section provides an overview of Pearse & Associates (1995) population projections (1995-2045). 2.1 UTE Water Service Area, “Domestic Water Demand Projections: Technical
Memorandum”
2.1.1 Mesa County Forecast In October 1995, Pearse & Associates were retained to produce population forecasts for Mesa County and the District. Six different forecast scenarios were presented:
• Scenario A was based on a forecast made by the State Demography Office, part of Colorado Department of Local Affairs (DOLA). Mesa County’s population was forecasted to grow at an annual decreasing rate, from a high of 1.82 percent in 1995 to 1.32 percent in 2020. The next period (2020-45) was assumed to grow at a compound annual growth rate (CAGR) of 1.32 percent;
• Like Scenario A, Scenario B included the same annual growth for the period 1995-20; however it assumed a CAGR of 2.52 percent for the second 25 years;
• Scenario C, assumed a CAGR of 2.18 percent for the whole forecasting period (50 years). This is the same average rate per annum of the period 1950-95;
• Scenario D, applied a CAGR of 2.52 percent to the forecasting period (the same annual average growth rate of the period 1970-95);
• In Scenario E, the 50 year period forecast used a CAGR of 3.63 percent, based on the rate of growth projected (by DOLA) for San Miguel County for the period 1995-20; and,
• Similar to Scenario E, Scenario F took into consideration a CAGR of 4.60 percent for the forecasting period (similar to rate of growth projected for Douglas County for the period 1995-20).
Table 1: Mesa County Population Forecast 1995-2045, July 1st Scenario 1995 2000 2005 2010 2015 2020 2025 2030 2035 2040 2045
A 103,004 112,394 122,203 132,211 142,179 152,093 162,400 173,406 185,158 197,706 211,105 B 103,004 112,394 122,203 132,211 142,179 152,093 172,247 195,071 220,920 250,194 283,348 C 103,004 114,749 127,832 142,408 158,645 176,734 196,885 219,334 244,342 272,202 303,238 D 103,004 116,653 132,111 149,617 169,442 191,895 217,323 246,121 278,734 315,669 357,499 E 103,004 123,106 147,132 175,846 210,164 251,180 300,200 358,787 428,808 512,494 612,512 F 103,004 128,977 161,500 202,224 253,217 317,069 397,021 497,133 622,490 779,458 976,006
The following figure shows projected population scenarios for Mesa County.
HDR|Decision Economics Page • 4
Figure 1: Pearse & Associates Forecasts- Mesa County 1995-2045

HDR|Decision Economics Page • 5
211,105283,348303,238
103,004
976,006
357,499
612,512
0
200,000
400,000
600,000
800,000
1,000,000
1995 2000 2005 2010 2015 2020 2025 2030 2035 2040 2045
Popu
latio
n Fo
reca
st
Scenario A Scenario B Scenario C Scenario D Scenario E Scenario F
Pearse & Associates concluded that Mesa County’s population will double over the next 50 years and likely experience an annual growth rate in the range of 2.18 to 2.52 percent (Scenario C and D). On their view, this projection was consistent with a more balanced economy2, which was expected to be an increasingly popular location for retirees and one that could rely on its natural attractiveness and outdoor recreational opportunities to increase its population.
2.1.2 Historical District Population Forecast In order to convert Mesa County’s population forecasts to District’s population forecasts, Pearse & Associates used the following methodology:
a) 1990 Census population for Mesa County was distributed by zip code and water district; b) This distribution was then converted to households, using Census data on persons per
households and compared against known area tap data; c) A history of new taps per district was examined to determine areas of population growth
by water district; d) With the information above, a forecast of tap growth (1995-45) was established by water
district; and, e) The District tap’s percent change (1995-45) was then allocated to the County’s
forecasting growth to determine the District’s service area population projection. Table 2 presents the District’s population forecasts. 2 “At a current resident level of 100,000, the County is achieving a certain critical mass built upon a more balanced economy than during earlier years. Previous massive swings in the population reflected the heavy dependence upon economic activity on natural resource extraction”. UTE Water Service Area, “Domestic Water Demand Projections: Technical Memorandum”, pg. 58.
HDR|Decision Economics Page • 6
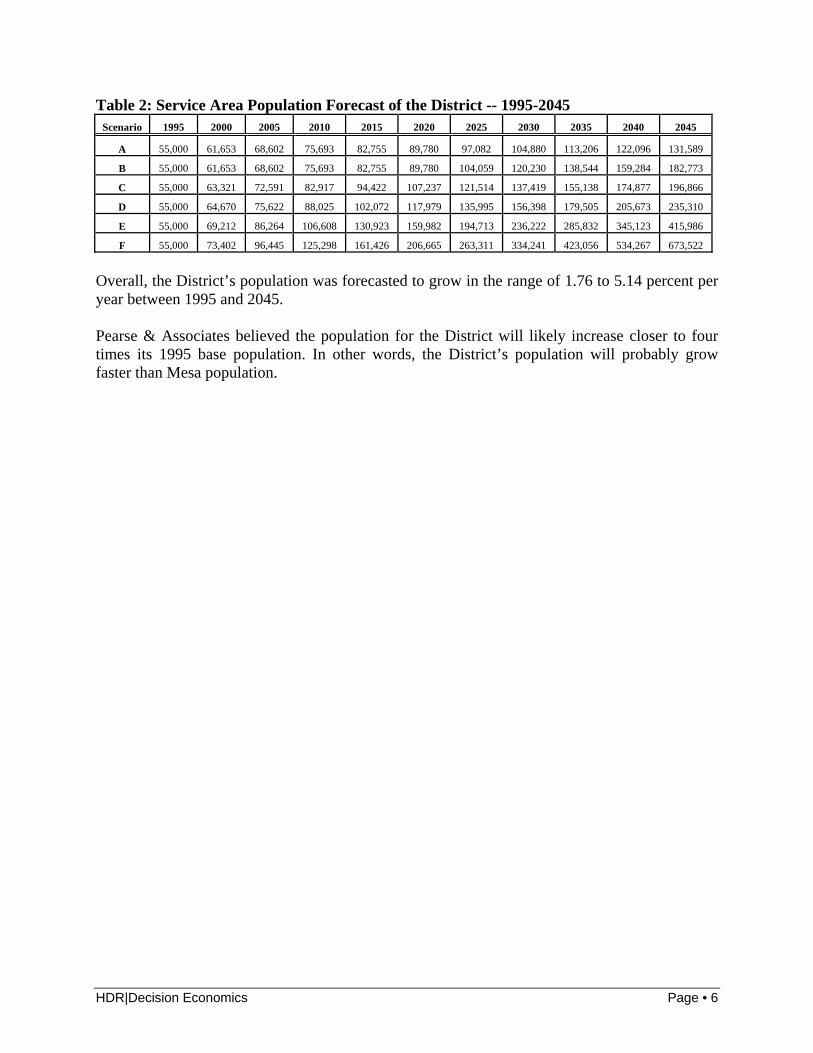
Table 2: Service Area Population Forecast of the District -- 1995-2045 Scenario 1995 2000 2005 2010 2015 2020 2025 2030 2035 2040 2045
A 55,000 61,653 68,602 75,693 82,755 89,780 97,082 104,880 113,206 122,096 131,589
B 55,000 61,653 68,602 75,693 82,755 89,780 104,059 120,230 138,544 159,284 182,773
C 55,000 63,321 72,591 82,917 94,422 107,237 121,514 137,419 155,138 174,877 196,866
D 55,000 64,670 75,622 88,025 102,072 117,979 135,995 156,398 179,505 205,673 235,310
E 55,000 69,212 86,264 106,608 130,923 159,982 194,713 236,222 285,832 345,123 415,986
F 55,000 73,402 96,445 125,298 161,426 206,665 263,311 334,241 423,056 534,267 673,522
Overall, the District’s population was forecasted to grow in the range of 1.76 to 5.14 percent per year between 1995 and 2045. Pearse & Associates believed the population for the District will likely increase closer to four times its 1995 base population. In other words, the District’s population will probably grow faster than Mesa population.

HDR|Decision Economics Page • 7
3. CURRENT POPULATION PROJECTIONS
This section presents the most recent population projections for United States, The State of Colorado, Mesa County, and City of Grand Junction. 3.1 US Census Bureau Forecast 2000-2035
The population of the United States is expected to increase at a low pace during the next 27 years. From a high of 0.98 percent in 2008, the annual rate of growth will slowly decline to reach 0.83 percent in 2035. See Table 3. Experiencing the highest average annual growth among cohorts (seniors: 1.97%; youth 0-19: 0.67%; and working age 20-64: 0.71%), the elderly population (persons aged 65 and over) is anticipated to increase closer to 2.3 times its current population by 2035 (Appendix B.2). Remarkably similar to the forecasted growth for United States, the Census Bureau projects the population of the State of Colorado to increase by about 1 percent each year. Colorado is expected to be among the fastest growing states of United States in terms of growth rate3. Although Colorado’s senior population is projected to increase at an annual average rate of 2.81 percent, this age group will only count for 16.5 percent of total population projected by 2030. 3.2 Colorado Department of Local Affairs (DOLA) Forecast 2000-2035 The State Demography Office employs the Center for Business and Economic Forecasting (CBEF) model which is based on the cohort-component method4, and uses economic variables (such as employment, unemployment; persons in the labor force, and personal income), in order to forecast the overall set of population projections at the state, region and county levels. The State Demography Office projects5 the population of the state of Colorado to increase at a faster rate than what has been forecasted by the U.S. Census Bureau. In general, The State Demography office expects the state’s population to grow at an annual rate of 1.76 percent in the next 22 years. At the county level, The State Demography Office anticipates 257,176 residents by 2035. The County is projected to achieve a compound annual growth rate of 2.26 percent.
3 The State of Colorado is anticipated to rank 14th in the nation. U.S Census Bureau, Interim Projections of the Total Population for the United States and States: April 1, 2000 to July 1, 2030, Released on April 21, 2005. http://www.census.gov/population/www/projections/projectionsagesex.html 4 It breaks the population into age-groups and applies demographic factors (such as survival rates, fertility, migration, etc.) to each group. 5 The State Demography Office produced annual population forecasts. Its most recent forecasts were produced in October, 2007. http://www.dola.state.co.us/dlg/demog/pop_cnty_forecasts.html

HDR|Decision Economics Page • 8
During the period 2012 to 2029, DOLA expects an important increase of the senior population outpacing rates of population groups 0-19 and 20-64 (See Appendix B1). However, the long term rate of growth of the age group 20-64 will exceed the rate of the elderly and youth population (2.32% vs. 2.23% and 2.14% respectively). This forecast implies that Mesa County will not follow the same national trend expected by Census Bureau. 3.3 BBC Research & Consulting Forecast 2005-2035
In April 2008, BBC Research & Consulting released a study with the purpose of analyzing existing socioeconomic conditions in northwest Colorado and forecast how those conditions may change with future natural resource development (natural gas and commercial oil shale scenarios6). The projected forecast was developed with the help of The Northwest Colorado Socioeconomic Projection Model and was based on:
• Projected population growth in each county; • Relative “attraction coefficients” for each sub-county area (each coefficient is based on
recent population distribution trends, interviews with county officials and projected growth and employment activity within each community); and,
• Population capacity of each area and how close the area is to its estimated capacity. Overall, Mesa County is expected to witness an annual average grow of 1.98 percent over the forecasting period. The population of the City of Grand Junction is projected to increase from about 49,422 residents in 2005 to nearly 104,224 residents by 2035, which represent a 30-year growth of 111%. BBC Research & Consulting analysts believe the City of Grand Junction will experience a higher average growth per annum than Mesa County. The population growth of the area that falls outside the city but inside the county (which includes Collbran, De Beque, and Fruita, Grand Junction, Palisade and unincorporated areas) is projected to add more than 49,000 residents by 2035, representing an average increase of 1.61 percent per year. Interestingly, under the economic scenario that was assumed, Mesa County’s population growth per year will slightly increase. As a result, there would be about 7,000 additional residents in 2035 compared to the original forecast (235,272 residents, Table 3). It is important to mention that this increase will be mainly absorbed by the City of Grand Junction.
6 See page III-1. BBC Research & Consulting, Final Report Northwest Colorado Socioeconomic Analysis and Forecasts, April 4, 2008.

HDR|Decision Economics Page • 9
3.4 Mesa County Administration Forecast 2000-2020
The most current projections from Mesa County Administration (20077) are remarkably higher than the above projections. Under this forecast, Mesa County’s population will increase at an annual average rate of 2.93 percent between 2000 and 2020. By 2020, this forecast expects 182,170 residents (about 19,609 and 27,458 residents more than DOLA and BBC Research & Consulting projections respectively).
7 See Mesa County – Administration. http://www.mesacounty.us/administration/adminpopulationdata.aspx
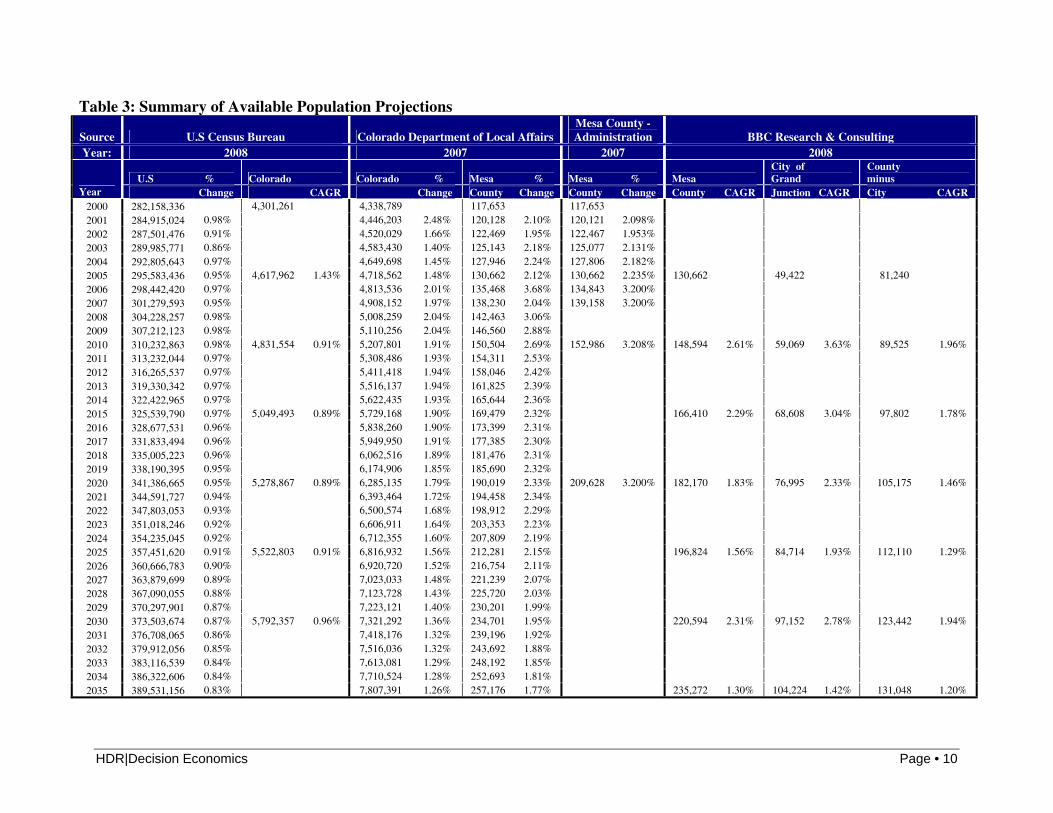
HDR|Decision Economics Page • 10
Table 3: Summary of Available Population Projections
Source U.S Census Bureau Colorado Department of Local Affairs Mesa County - Administration BBC Research & Consulting
Year: 2008 2007 2007 2008
U.S % Colorado Colorado % Mesa % Mesa % Mesa City of Grand
County minus
Year Change CAGR Change County Change County Change County CAGR Junction CAGR City CAGR 2000 282,158,336 4,301,261 4,338,789 117,653 117,653 2001 284,915,024 0.98% 4,446,203 2.48% 120,128 2.10% 120,121 2.098% 2002 287,501,476 0.91% 4,520,029 1.66% 122,469 1.95% 122,467 1.953% 2003 289,985,771 0.86% 4,583,430 1.40% 125,143 2.18% 125,077 2.131% 2004 292,805,643 0.97% 4,649,698 1.45% 127,946 2.24% 127,806 2.182% 2005 295,583,436 0.95% 4,617,962 1.43% 4,718,562 1.48% 130,662 2.12% 130,662 2.235% 130,662 49,422 81,240 2006 298,442,420 0.97% 4,813,536 2.01% 135,468 3.68% 134,843 3.200% 2007 301,279,593 0.95% 4,908,152 1.97% 138,230 2.04% 139,158 3.200% 2008 304,228,257 0.98% 5,008,259 2.04% 142,463 3.06% 2009 307,212,123 0.98% 5,110,256 2.04% 146,560 2.88% 2010 310,232,863 0.98% 4,831,554 0.91% 5,207,801 1.91% 150,504 2.69% 152,986 3.208% 148,594 2.61% 59,069 3.63% 89,525 1.96% 2011 313,232,044 0.97% 5,308,486 1.93% 154,311 2.53% 2012 316,265,537 0.97% 5,411,418 1.94% 158,046 2.42% 2013 319,330,342 0.97% 5,516,137 1.94% 161,825 2.39% 2014 322,422,965 0.97% 5,622,435 1.93% 165,644 2.36% 2015 325,539,790 0.97% 5,049,493 0.89% 5,729,168 1.90% 169,479 2.32% 166,410 2.29% 68,608 3.04% 97,802 1.78% 2016 328,677,531 0.96% 5,838,260 1.90% 173,399 2.31% 2017 331,833,494 0.96% 5,949,950 1.91% 177,385 2.30% 2018 335,005,223 0.96% 6,062,516 1.89% 181,476 2.31% 2019 338,190,395 0.95% 6,174,906 1.85% 185,690 2.32% 2020 341,386,665 0.95% 5,278,867 0.89% 6,285,135 1.79% 190,019 2.33% 209,628 3.200% 182,170 1.83% 76,995 2.33% 105,175 1.46% 2021 344,591,727 0.94% 6,393,464 1.72% 194,458 2.34% 2022 347,803,053 0.93% 6,500,574 1.68% 198,912 2.29% 2023 351,018,246 0.92% 6,606,911 1.64% 203,353 2.23% 2024 354,235,045 0.92% 6,712,355 1.60% 207,809 2.19% 2025 357,451,620 0.91% 5,522,803 0.91% 6,816,932 1.56% 212,281 2.15% 196,824 1.56% 84,714 1.93% 112,110 1.29% 2026 360,666,783 0.90% 6,920,720 1.52% 216,754 2.11% 2027 363,879,699 0.89% 7,023,033 1.48% 221,239 2.07% 2028 367,090,055 0.88% 7,123,728 1.43% 225,720 2.03% 2029 370,297,901 0.87% 7,223,121 1.40% 230,201 1.99% 2030 373,503,674 0.87% 5,792,357 0.96% 7,321,292 1.36% 234,701 1.95% 220,594 2.31% 97,152 2.78% 123,442 1.94% 2031 376,708,065 0.86% 7,418,176 1.32% 239,196 1.92% 2032 379,912,056 0.85% 7,516,036 1.32% 243,692 1.88% 2033 383,116,539 0.84% 7,613,081 1.29% 248,192 1.85% 2034 386,322,606 0.84% 7,710,524 1.28% 252,693 1.81% 2035 389,531,156 0.83% 7,807,391 1.26% 257,176 1.77% 235,272 1.30% 104,224 1.42% 131,048 1.20%

HDR|Decision Economics Page • 10
Source U.S Census Bureau Colorado Department of Local
Affairs Mesa County - Administration BBC Research & Consulting
Compound Annual Growth Rates (CAGR): Historical* U.S Colorado Mesa County Grand Junction County minus City 1960-1970 1.26% 2.34% 0.70% 0.76% 0.66% 1970-1980 1.08% 2.72% 4.13% 3.32% 4.59% 1980-1990 0.91% 1.32% 1.34% 0.38% 1.81% 1990-2000 1.24% 2.70% 2.24% 3.76% 1.48% 2000-2005 0.95% 1.55% 1.99% 0.54% 2.84% Forecast U.S Colorado Colorado Mesa County Mesa County Mesa County Grand Junction County minus City
2000-2005 0.93% 1.43% 1.69% 2.12% 2.12% 2005-2010 0.97% 0.91% 1.99% 2.87% 3.20% 2.61% 3.63% 1.96% 2000-2010 0.95% 1.17% 1.84% 2.49% 2.66% 2010-2020 0.96% 0.89% 1.90% 2.36% 3.20% 2.06% 2.69% 1.62% 2020-2030 0.90% 0.93% 1.54% 2.13% 1.93% 2.35% 1.61% 2030-2035 0.84% 1.29% 1.85% 1.30% 1.42% 1.20% Summary U.S Colorado Mesa County Grand Junction County minus City 1960-2000 1.13% 2.27% 2.10% 2.04% 2.13% 2000-2020 0.96% 1.03% 1.87% 2.43% 2.93% 2000-2030 0.94% 1.00% 1.76% 2.33% 2000-2035 0.93% 1.69% 2.26% 2005-2035 0.92% 1.69% 2.28% 1.98% 2.52% 1.61%
* Historical data: U.S. Census Bureau, 2008. Estimates (2000-2005): U.S. Census Bureau and Colorado Department of Local Affairs

4. HISTORICAL POPULATION TRENDS
This section discusses past and recent trends of population and households in the study area. It also assesses Pearse & Associates projections compared to actual population estimates and latest forecasts 4.1 Historical Trends The United States population has expanded over 70 percent in the last 48 years. This growth has not been consistent; rapid growth in the early 1960s was followed by two consecutive census periods of slow growth between 1970 and 1990. Since 1990, the average population growth rate per year has remained above its long-term average trend (Table 4). Since 1960, Colorado’s population trend is similar to Mesa County. A period of higher growth has been followed by a period of slow growth. However, the average intercensal growth rate has been much volatile in the former, presenting picks and downs deeper than those experienced by the state.
Table 4: Decennial Census Population and Estimates
Year U.S. Colorado Mesa
County
City of Grand
Junction
County minus City Collbran
De Beque Fruita Palisade
Unincorporated Areas
1960 179,323,175 1,753,947 50,715 18,694 32,021 310 172 1,830 860 28,849 1970 203,235,298 2,209,596 54,374 20,170 34,204 225 155 1,822 874 31,128 1980 226,545,805 2,889,735 81,530 28,144 53,386 344 279 2,810 1,551 48,402 1990 248,709,873 3,294,394 93,145 29,034 64,111 228 257 4,045 1,871 57,710 2000 281,421,906 4,301,261 116,255 41,986 74,269 388 451 6,478 2,579 64,373
Estimates* 2000 282,194,308 4,301,261 116255 42,879 73,376 662 451 6,478 2,579 63,206 2001 285,112,030 4,446,203 120122 44,788 75,334 602 462 6,787 2,645 64,838 2002 287,888,021 4,520,029 122463 45,675 76,788 618 471 7,270 2,691 65,738 2003 290,447,644 4,583,430 125072 46,850 78,222 628 478 7,725 2,737 66,654 2004 293,191,511 4,649,698 127808 48,314 79,494 637 497 8,507 2,802 67,051 2005 295,895,897 4,718,562 130662 49,422 81,240 642 504 9,393 2,842 67,859 2006 298,754,819 4,813,536 135468 51,631 83,837 657 508 10,349 2,941 69,382
Compound Annual Growth Rate (CAGR): Historical 1960-1970 1.26% 2.34% 0.70% 0.76% 0.66% -3.15% -1.04% -0.04% 0.16% 0.76% 1970-1980 1.09% 2.72% 4.13% 3.39% 4.55% 4.34% 6.05% 4.43% 5.90% 4.51% 1980-1990 0.94% 1.32% 1.34% 0.31% 1.85% -4.03% -0.82% 3.71% 1.89% 1.77% 1990-2000 1.24% 2.70% 2.24% 3.76% 1.48% 5.46% 5.79% 4.82% 3.26% 1.10% Estimates* 2000-2006 0.95% 1.89% 2.58% 3.14% 2.25% -0.13% 2.00% 8.12% 2.21% 1.57% Summary 1960-2000 1.13% 2.27% 2.10% 2.04% 2.13% 0.56% 2.44% 3.21% 2.78% 2.03% 1960-2006 1.12% 2.22% 2.16% 2.23% 2.11% 1.65% 2.38% 3.84% 2.71% 1.93% 1990-2006 1.15% 2.40% 2.37% 3.66% 1.69% 6.84% 4.35% 6.05% 2.87% 1.16% *Colorado Department of Local Affairs (DOLA) estimates as of July 1 of each year Source: U.S Census Bureau; and Colorado Department of Local Affairs (DOLA)
HDR|Decision Economics Page • 12
Inside Mesa County, the long-term population growth (1960-06) has been higher in all communities except Collbran, and unincorporated areas (residents living outside municipal boundaries). However, the period 1990-06 has witnessed a robust population growth in all regions of the county, especially the City. Recent estimates for the communities reveal that the

City’s sharp population growth of the 1990s (Table 4) has reduced already. Long-term and short-term average growth rates are illustrated in Figure 2. Figure 2: Historical Average Growth Rates
0.951.151.12
1.89
2.402.22
2.582.37
2.16
3.14
3.66
2.23 2.25
1.69
2.11
1.57
1.16
1.93
0%
1%
2%
3%
4%
1960-2006 1990-2006 2000-2006
CA
GR
U.S. Colorado Mesa County City of Grand Junction County minus City Unincorporated
4.2 Pearse & Associates Forecast Assessment As mentioned earlier, Pearse & Associates concluded that Mesa County’s population will likely experience a constant annual growth rate in the range of 2.18 to 2.52 percent (Scenario C and D). Current population estimates (2000-06) show that the County’s population has been growing slightly higher than Pearse & Associates annual forecast. However, the estimated annual average rate of growth since 1990 (2.37 percent) falls in the range forecasted. Likewise, Pearse & Associates suggested the District’s population will probably grow faster than Mesa County’s population (CAGR over 2.58%). Indeed, recent population estimates from the District suggest this has been the case in the last 11 years (CAGR of 3.66%). The District’s population estimates and respective percent changes are shown in Figure 3.
HDR|Decision Economics Page • 13
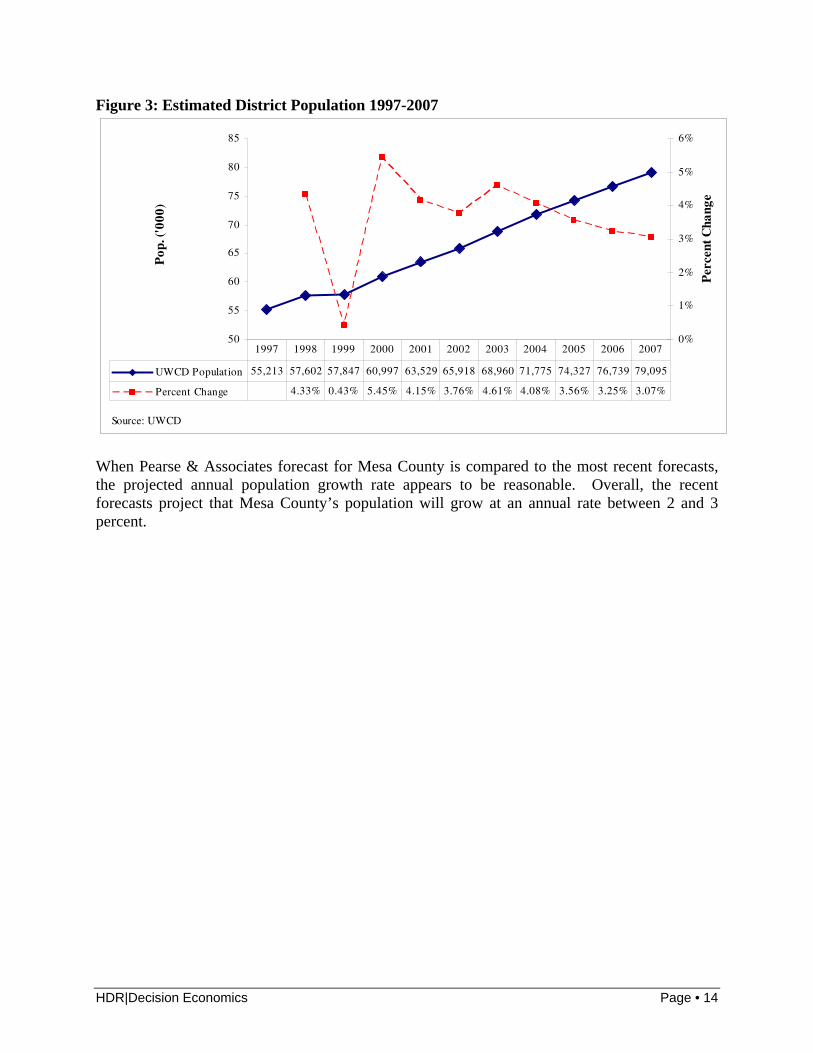
Figure 3: Estimated District Population 1997-2007
50
55
60
65
70
75
80
85
Source: UWCD
Pop
. ('0
00)
0%
1%
2%
3%
4%
5%
6%
Per
cent
Cha
nge
UWCD Population 55,213 57,602 57,847 60,997 63,529 65,918 68,960 71,775 74,327 76,739 79,095
Percent Change 4.33% 0.43% 5.45% 4.15% 3.76% 4.61% 4.08% 3.56% 3.25% 3.07%
1997 1998 1999 2000 2001 2002 2003 2004 2005 2006 2007
When Pearse & Associates forecast for Mesa County is compared to the most recent forecasts, the projected annual population growth rate appears to be reasonable. Overall, the recent forecasts project that Mesa County’s population will grow at an annual rate between 2 and 3 percent.
HDR|Decision Economics Page • 14
HDR|Decision Economics Page • 15
5. RISK ADJUSTED POPULATION FORECAST
This section provides a risk adjusted population forecast for the District‘s service area. 5.1 Risk Adjusted Forecast Assumption
Given the above review, HDR recommends using a long term population growth rate of 2.5 percent for the District’s service area. This recommendation is based on the following reasons:
• Mesa County’s population historical long term growth rate (2.1 percent) has remained stable despite the recent higher population growth of Mesa County’s municipalities;
• In spite of actual economic uncertainty, Mesa County’s population growth is not generally impacted by national recessions8. Furthermore, Mesa County’s economy is today more diversify compared to economic conditions in the early 1990s9; and,
• Although economic conditions in the Western Slope are favorable10, Mesa County’s population is anticipated to be slightly impacted by this condition (see BBC Research & Consulting report, 2008).
• According to Ute staff, the District will provide water to 70 to 80 percent of the new population within the City limits.
5.2 Risk Adjusted Forecasts The table below presents HDR’s Base, Pessimistic and Optimistic Case population forecasts in the area described above over the period 2007-45. The compound annual forecast growth rates (CAGRs) are shown at the bottom of the table. The Optimistic and Pessimistic Case projections reflect the upside and downside potential range of population growth based on analysis of historical volatility over:
a) The 1960-06 period for Mesa County (CAGR of 2.16%); b) The 1960-06 period for the County area excluding Palisade11 (CAGR of 2.15%); c) The 1990-06 period for the City of Grand Junction (CAGR of 3.66%); and, d) The 1997-07 period for the District’s service area (CAGR of 3.66%).
8 See Economic Profile System, A SocioEconomic Profile Mesa County, Colorado, November 30, 2007. http://www.headwaterseconomics.org/profiles/p_Mesa_County_Colorado.pdf. 9 According to University of Colorado at Boulder economist Richard Wobbekind “Mesa County has felt the impact of the recent downturn less than other parts of the state because of its diverse economy… Positive year-to-year growth has occurred in retail sales, construction, real estate, vehicle registrations and population. Over time, the structure of the economy has evolved into one with a greater emphasis on services and less focus on manufacturing, mining and agriculture. http://www.colorado.edu/news/releases/2004/382.html 10 Businesses on the oil- and natural-gas-rich are still in growth mode. 11 Clifton area should also be excluded but there is not sufficient data
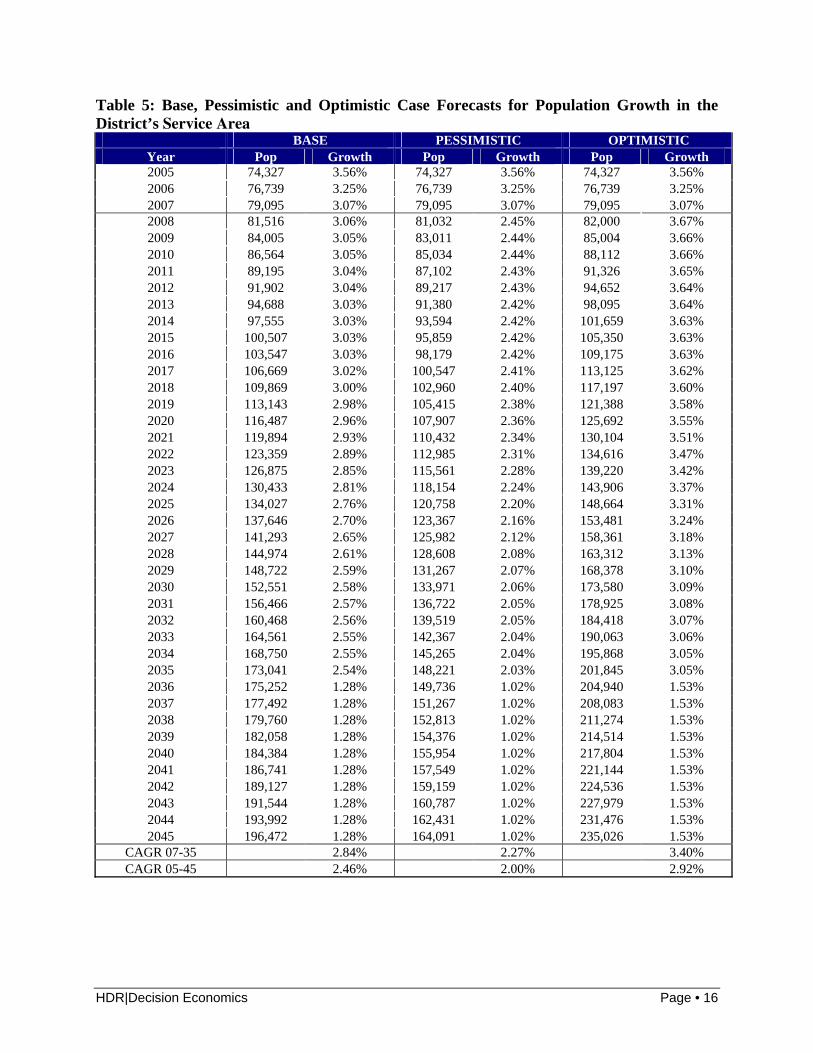
Table 5: Base, Pessimistic and Optimistic Case Forecasts for Population Growth in the District’s Service Area
BASE PESSIMISTIC OPTIMISTIC Year Pop Growth Pop Growth Pop Growth 2005 74,327 3.56% 74,327 3.56% 74,327 3.56% 2006 76,739 3.25% 76,739 3.25% 76,739 3.25% 2007 79,095 3.07% 79,095 3.07% 79,095 3.07% 2008 81,516 3.06% 81,032 2.45% 82,000 3.67% 2009 84,005 3.05% 83,011 2.44% 85,004 3.66% 2010 86,564 3.05% 85,034 2.44% 88,112 3.66% 2011 89,195 3.04% 87,102 2.43% 91,326 3.65% 2012 91,902 3.04% 89,217 2.43% 94,652 3.64% 2013 94,688 3.03% 91,380 2.42% 98,095 3.64% 2014 97,555 3.03% 93,594 2.42% 101,659 3.63% 2015 100,507 3.03% 95,859 2.42% 105,350 3.63% 2016 103,547 3.03% 98,179 2.42% 109,175 3.63% 2017 106,669 3.02% 100,547 2.41% 113,125 3.62% 2018 109,869 3.00% 102,960 2.40% 117,197 3.60% 2019 113,143 2.98% 105,415 2.38% 121,388 3.58% 2020 116,487 2.96% 107,907 2.36% 125,692 3.55% 2021 119,894 2.93% 110,432 2.34% 130,104 3.51% 2022 123,359 2.89% 112,985 2.31% 134,616 3.47% 2023 126,875 2.85% 115,561 2.28% 139,220 3.42% 2024 130,433 2.81% 118,154 2.24% 143,906 3.37% 2025 134,027 2.76% 120,758 2.20% 148,664 3.31% 2026 137,646 2.70% 123,367 2.16% 153,481 3.24% 2027 141,293 2.65% 125,982 2.12% 158,361 3.18% 2028 144,974 2.61% 128,608 2.08% 163,312 3.13% 2029 148,722 2.59% 131,267 2.07% 168,378 3.10% 2030 152,551 2.58% 133,971 2.06% 173,580 3.09% 2031 156,466 2.57% 136,722 2.05% 178,925 3.08% 2032 160,468 2.56% 139,519 2.05% 184,418 3.07% 2033 164,561 2.55% 142,367 2.04% 190,063 3.06% 2034 168,750 2.55% 145,265 2.04% 195,868 3.05% 2035 173,041 2.54% 148,221 2.03% 201,845 3.05% 2036 175,252 1.28% 149,736 1.02% 204,940 1.53% 2037 177,492 1.28% 151,267 1.02% 208,083 1.53% 2038 179,760 1.28% 152,813 1.02% 211,274 1.53% 2039 182,058 1.28% 154,376 1.02% 214,514 1.53% 2040 184,384 1.28% 155,954 1.02% 217,804 1.53% 2041 186,741 1.28% 157,549 1.02% 221,144 1.53% 2042 189,127 1.28% 159,159 1.02% 224,536 1.53% 2043 191,544 1.28% 160,787 1.02% 227,979 1.53% 2044 193,992 1.28% 162,431 1.02% 231,476 1.53% 2045 196,472 1.28% 164,091 1.02% 235,026 1.53%
CAGR 07-35 2.84% 2.27% 3.40% CAGR 05-45 2.46% 2.00% 2.92%
HDR|Decision Economics Page • 16

APPENDIX A
Appendix A.1: Households -- Colorado, Mesa County and Municipalities
Year Colorado Mesa Grand
Junction Collbran De Beque Fruita Palisade Unincorporated
Areas
1960 530,385
1970 690,928 17,639 7,197
1980 1,062,553 29,668 11,766
1990 1,282,489 36,250 12,810 100 97 1,444 759 21,040
2000 1,658,238 45,823 17,865 145 167 2,447 1,051 24,148
Estimates
2001 1,709,017 47,368 19,067 172 171 2,510 1,079 24,369
2002 1,737,966 48,374 19,443 177 175 2,760 1,099 24,720
2003 1,762,868 49,362 19,857 181 178 2,938 1,119 25,089
2004 1,786,882 50,507 20,467 185 185 3,245 1,147 25,278
2005 1,812,192 51,554 20,940 187 188 3,592 1,164 25,483
2006 1,845,921 53,416 21,801 193 189 3,967 1,206 26,060
2007 1,886,599 55,446 22,712 199 190 4,202 1,245 26,898
Compound Annual Growth Rate (CAGR): Historical
1960-1970 2.68%
1970-1980 4.40% 5.34% 5.04%
1980-1990 1.90% 2.02% 0.85%
1990-2000 2.60% 2.37% 3.38% 3.79% 5.58% 5.42% 3.31% 1.39%
Estimates 2001-2007 1.66% 2.66% 2.96% 2.46% 1.77% 8.97% 2.41% 1.66%
Summary 1960-2000 2.89%
1960-2007 2.74%
1970-2007 2.75% 3.14% 3.15%
1990-2007 2.30% 2.53% 3.43% 4.13% 4.03% 6.48% 2.95% 1.46%
Historical data: U.S Census Bureau, 2008; Estimates (2001-07): Colorado Department of Local Affairs, 2007
HDR|Decision Economics Page • 17

APPENDIX B
Appendix B.1: Colorado Department of Local Affairs Forecast 1990-2035- Mesa County
HDR|Decision Economics Page • 18
0-19 % 20-64 % 65+ % Total % Year Change Change Change Change
1990 28,024 52,051 13,497 93,572
1991 28,536 1.83% 53,523 2.83% 13,931 3.22% 95,990 2.58%
1992 28,786 0.88% 54,416 1.67% 14,206 1.97% 97,408 1.48%
1993 29,342 1.93% 55,911 2.75% 14,648 3.11% 99,901 2.56%
1994 29,995 2.23% 57,617 3.05% 15,145 3.39% 102,757 2.86%
1995 30,585 1.97% 59,211 2.77% 15,616 3.11% 105,412 2.58%
1996 31,006 1.38% 60,517 2.21% 16,013 2.54% 107,536 2.01%
1997 31,456 1.45% 61,880 2.25% 16,426 2.58% 109,762 2.07%
1998 31,984 1.68% 63,451 2.54% 16,900 2.89% 112,335 2.34%
1999 32,420 1.36% 64,828 2.17% 17,322 2.50% 114,570 1.99%
2000 33,079 2.03% 66,696 2.88% 17,878 3.21% 117,653 2.69%
2001 33,777 2.11% 68,159 2.19% 18,185 1.72% 120,121 2.10%
2002 34,343 1.68% 69,568 2.07% 18,556 2.04% 122,467 1.95%
2003 34,705 1.05% 71,521 2.81% 18,851 1.59% 125,077 2.13%
2004 35,142 1.26% 73,471 2.73% 19,203 1.87% 127,816 2.19%
2005 35,695 1.57% 75,413 2.64% 19,554 1.83% 130,662 2.23%
2006 36,810 3.12% 78,709 4.37% 19,954 2.05% 135,473 3.68%
2007 37,329 1.41% 80,702 2.53% 20,199 1.23% 138,230 2.04%
2008 38,333 2.69% 83,597 3.59% 20,533 1.65% 142,463 3.06%
2009 39,405 2.80% 86,208 3.12% 20,947 2.02% 146,560 2.88%
2010 40,397 2.52% 88,765 2.97% 21,342 1.89% 150,504 2.69%
2011 41,371 2.41% 91,309 2.87% 21,631 1.35% 154,311 2.53%
2012 42,435 2.57% 93,348 2.23% 22,263 2.92% 158,046 2.42%
2013 43,484 2.47% 95,369 2.17% 22,972 3.18% 161,825 2.39%
2014 44,616 2.60% 97,407 2.14% 23,621 2.83% 165,644 2.36%
2015 45,818 2.69% 99,282 1.92% 24,379 3.21% 169,479 2.32%
2016 46,949 2.47% 101,312 2.04% 25,138 3.11% 173,399 2.31%
2017 48,244 2.76% 103,235 1.90% 25,906 3.06% 177,385 2.30%
2018 49,548 2.70% 105,207 1.91% 26,721 3.15% 181,476 2.31%
2019 50,800 2.53% 107,268 1.96% 27,622 3.37% 185,690 2.32%
2020 52,123 2.60% 109,334 1.93% 28,562 3.40% 190,019 2.33%
2021 53,433 2.51% 111,545 2.02% 29,480 3.21% 194,458 2.34%
2022 54,724 2.42% 113,779 2.00% 30,409 3.15% 198,912 2.29%
2023 55,955 2.25% 116,170 2.10% 31,228 2.69% 203,353 2.23%
2024 57,134 2.11% 118,642 2.13% 32,033 2.58% 207,809 2.19%
2025 58,282 2.01% 121,031 2.01% 32,968 2.92% 212,281 2.15%
2026 59,452 2.01% 123,533 2.07% 33,769 2.43% 216,754 2.11%
2027 60,659 2.03% 126,019 2.01% 34,561 2.35% 221,239 2.07%
2028 61,819 1.91% 128,685 2.12% 35,216 1.90% 225,720 2.03%
2029 62,957 1.84% 131,401 2.11% 35,843 1.78% 230,201 1.99%
2030 64,077 1.78% 134,203 2.13% 36,421 1.61% 234,701 1.95%
2031 65,182 1.72% 137,186 2.22% 36,828 1.12% 239,196 1.92%
2032 66,261 1.66% 140,181 2.18% 37,250 1.15% 243,692 1.88%
2033 67,345 1.64% 143,206 2.16% 37,641 1.05% 248,192 1.85%
2034 68,420 1.60% 146,203 2.09% 38,070 1.14% 252,693 1.81%
2035 69,495 1.57% 149,015 1.92% 38,666 1.57% 257,176 1.77%
Appendix B.1: Colorado Department of Local Affairs Forecast 1990-2035- Mesa County (Cont’d)
Compound Annual Growth Rate (CAGR):
Historical 0-19 20-64 65+ Total
1960-1970 0.70%
1970-1980 4.13%
1980-1990 1.34%
1990-2000 2.24%
2000-2007 2.44%
Forecast 0-19 20-64 65+ Total
1990-2000 1.67% 2.51% 2.85% 2.32%
2000-2010 2.02% 2.90% 1.79% 2.49%
2010-2020 2.58% 2.11% 2.96% 2.36%
2020-2030 2.09% 2.07% 2.46% 2.13%
2030-2035 1.64% 2.12% 1.20% 1.85%
Summary 0-19 20-64 65+ Total
1960-2007 2.17%
2000-2035 2.14% 2.32% 2.23% 2.26%
Historical data: U.S Census Bureau, 2008; Estimates (2000-07) and Forecast: Colorado Department of Local Affairs, 2007
Appendix B.2: U.S Population Forecast 2000-2045
HDR|Decision Economics Page • 19
0-19 % 20-64 % 65+ % Total % Year Change Change Change Change 2000 80,526,911 166,523,934 35,107,491 282,158,336
2001 80,810,008 0.35% 168,751,741 1.34% 35,353,275 0.70% 284,915,024 0.98%
2002 81,112,245 0.37% 170,776,840 1.20% 35,612,391 0.73% 287,501,476 0.91%
2003 81,461,260 0.43% 172,581,507 1.06% 35,943,004 0.93% 289,985,771 0.86%
2004 81,893,463 0.53% 174,595,240 1.17% 36,316,940 1.04% 292,805,643 0.97%
2005 82,301,811 0.50% 176,534,713 1.11% 36,746,912 1.18% 295,583,436 0.95%
2006 82,708,882 0.49% 178,507,878 1.12% 37,225,660 1.30% 298,442,420 0.97%
2007 83,142,904 0.52% 180,272,334 0.99% 37,864,355 1.72% 301,279,593 0.95%
2008 83,539,751 0.48% 181,997,171 0.96% 38,691,335 2.18% 304,228,257 0.98%
2009 83,890,937 0.42% 183,848,258 1.02% 39,472,928 2.02% 307,212,123 0.98%
2010 84,150,434 0.31% 185,853,717 1.09% 40,228,712 1.91% 310,232,863 0.98%
2011 84,459,859 0.37% 187,649,280 0.97% 41,122,905 2.22% 313,232,044 0.97%
2012 84,872,248 0.49% 188,833,719 0.63% 42,559,570 3.49% 316,265,537 0.97%
2013 85,374,735 0.59% 189,965,142 0.60% 43,990,465 3.36% 319,330,342 0.97%
2014 85,981,063 0.71% 191,071,207 0.58% 45,370,695 3.14% 322,422,965 0.97%
2015 86,649,719 0.78% 192,053,249 0.51% 46,836,822 3.23% 325,539,790 0.97%
2016 87,379,100 0.84% 193,031,466 0.51% 48,266,965 3.05% 328,677,531 0.96%
2017 88,196,046 0.93% 193,856,955 0.43% 49,780,493 3.14% 331,833,494 0.96%
2018 89,044,523 0.96% 194,593,304 0.38% 51,367,396 3.19% 335,005,223 0.96%
2019 89,879,987 0.94% 195,287,496 0.36% 53,022,912 3.22% 338,190,395 0.95%
2020 90,702,504 0.92% 195,879,691 0.30% 54,804,470 3.36% 341,386,665 0.95%
2021 91,402,000 0.77% 196,638,400 0.39% 56,551,327 3.19% 344,591,727 0.94%
2022 92,127,881 0.79% 197,317,518 0.35% 58,357,654 3.19% 347,803,053 0.93%
2023 92,852,308 0.79% 197,965,464 0.33% 60,200,474 3.16% 351,018,246 0.92%
2024 93,554,621 0.76% 198,675,315 0.36% 62,005,109 3.00% 354,235,045 0.92%
2025 94,253,882 0.75% 199,290,294 0.31% 63,907,444 3.07% 357,451,620 0.91%
2026 94,952,447 0.74% 200,023,814 0.37% 65,690,522 2.79% 360,666,783 0.90%
2027 95,647,104 0.73% 200,843,539 0.41% 67,389,056 2.59% 363,879,699 0.89%
2028 96,334,613 0.72% 201,733,023 0.44% 69,022,419 2.42% 367,090,055 0.88%
HDR|Decision Economics Page • 20
Appendix B.2: U.S Population Forecast 2000-2045 (Cont’d) 0-19 % 20-64 % 65+ % Total %
Year Change Change Change Change
2029 97,012,975 0.70% 202,672,450 0.47% 70,612,476 2.30% 370,297,901 0.87%
2030 97,682,321 0.69% 203,729,438 0.52% 72,091,915 2.10% 373,503,674 0.87%
2031 98,344,914 0.68% 205,080,568 0.66% 73,282,583 1.65% 376,708,065 0.86%
2032 99,004,604 0.67% 206,581,310 0.73% 74,326,142 1.42% 379,912,056 0.85%
2033 99,665,796 0.67% 208,129,613 0.75% 75,321,130 1.34% 383,116,539 0.84%
2034 100,332,879 0.67% 209,629,586 0.72% 76,360,141 1.38% 386,322,606 0.84%
2035 101,009,807 0.67% 210,977,862 0.64% 77,543,487 1.55% 389,531,156 0.83%
2036 101,699,635 0.68% 212,430,160 0.69% 78,613,686 1.38% 392,743,481 0.82%
2037 102,404,299 0.69% 214,108,363 0.79% 79,448,103 1.06% 395,960,765 0.82%
2038 103,124,962 0.70% 215,961,806 0.87% 80,097,406 0.82% 399,184,174 0.81%
2039 103,862,246 0.71% 217,906,955 0.90% 80,645,966 0.68% 402,415,167 0.81%
2040 104,616,363 0.73% 219,800,541 0.87% 81,238,391 0.73% 405,655,295 0.81%
2041 105,387,252 0.74% 221,762,983 0.89% 81,755,982 0.64% 408,906,217 0.80%
2042 106,174,768 0.75% 223,693,113 0.87% 82,301,944 0.67% 412,169,825 0.80%
2043 106,978,518 0.76% 225,559,326 0.83% 82,910,143 0.74% 415,447,987 0.80%
2044 107,797,721 0.77% 227,338,345 0.79% 83,607,419 0.84% 418,743,485 0.79%
2045 108,631,123 0.77% 228,971,520 0.72% 84,455,986 1.01% 422,058,629 0.79%
Compound Annual Growth Rate (CAGR):
Historical 0-19 20-64 65+ Total
1960-1970 1.26%
1970-1980 1.08%
1980-1990 0.91%
1990-2000 1.21% 1.28% 1.14% 1.24%
Forecast 0-19 20-64 65+ Total
2000-2010 0.44% 1.10% 1.37% 0.95%
2010-2020 0.75% 0.53% 3.14% 0.96%
2020-2030 0.74% 0.39% 2.78% 0.90%
2030-2040 0.69% 0.76% 1.20% 0.83%
2040-2045 0.76% 0.82% 0.78% 0.80%
Summary 0-19 20-64 65+ Total
1960-2000 1.12%
2000-2045 0.67% 0.71% 1.97% 0.90%
U.S Census Bureau, 2008

Appendix B
ERC: Draft Technical Memo, Model Selection Criteria, Evaluation, and Recommendation

Appendix B ERC: Draft Technical Memo, Model Selection Criteria, Evaluation, and Recommendation
C:\Documents and Settings\david_slack\My Documents\John Sikora\Demand and Yield Report\Ute Water_Demand and Yield Report_rev2_Final_4.21.09.doc\22240554\ B-1

35715 US Hwy. 40, Suite D204 ~ Evergreen, CO 80439 ~ 303.679.4820
Technical Memorandum Date: October 3, 2008 To: Ed Tolen, Ute Water Conservancy District, John Sikora, URS
Corporation From: Heather Thompson, Ecological Resource Consultants Project: Raw Water Source Alternatives Study Re: Model Selection Criteria, Evaluation and Recommendation The purpose of the Raw Water Source Alternatives Study is to identify new raw water supplies for Ute Water Conservancy District (District) through 2045. A hydrologic model is needed to assess the firm yield associated with those supplies and evaluate how potential new supplies could be integrated in the District’s system. In addition, a model is required to evaluate hydrologic changes associated with potential water supply alternatives if the District pursues permitting of a water supply project. A new water supply project could increase or decrease flows or change reservoir operations and water levels resulting in impacts to existing resources. A model is needed to evaluate the impact of hydrologic changes on flow related resources. The following memorandum summarizes the model selection criteria, evaluation and model recommendation for the Raw Water Source Alternatives Study. 1.0 MODEL OVERVIEW Two models were reviewed to assess their suitability for accomplishing the modeling objectives of this study. These models include the State’s Upper Colorado River Basin Water Resource Planning Model from the Colorado Decision Support System (CDSS Model) and the District’s SYSTEM Model. A brief overview of each model is provided below. CDSS Model Overview The State of Colorado has invested significantly in the development of the CDSS Model to provide an integrated system of databases and a model of the Upper Colorado River Basin that is available to the public. The CDSS Model is widely known and has been used for the analysis of historical and future water management policies including the impacts of proposed diversions, reservoirs, water rights and changes in operating strategies. It has also been used in

Model Selection Criteria, Evaluation and Recommendation
2
environmental permitting processes including the Windy Gap Firming Project Environmental Impact Statement (EIS) and Colorado Springs Utilities’ Green Mountain Reservoir Substitution Environmental Assessment (EA). The CDSS Model covers the entire Colorado River drainage, except the Gunnison River, from the headwaters to the Colorado-Utah state line. The water supply system is represented as a system of links and nodes, which correspond with features such as diversion structures, reservoirs, instream flow requirements, demands, and stream gages. In general, the model determines availability of water to individual users and projects based on hydrology, water rights, demands, operating rules and practices. It simulates current demands, infrastructure and projects, and the current administrative environment including numerous contractual and operating agreements. The model is extremely detailed, containing more than 400 diversions nodes, 30 reservoirs, and 80 USGS gages. The model includes operating rules for all major reservoirs, including complex and unique operations. SYSTEM Model Overview The District’s SYSTEM Model was originally developed by Camp Dresser and McKee (CDM) in the early 1990’s for use in the Plateau Creek Pipeline EIS. The model includes the District’s raw water system in the Plateau Creek basin and water rights on the Colorado River and Rapid Creek. The SYSTEM model was designed to determine the firm yield of the District’s raw water system under a variety of operational parameters including water rights owned, storage and diversion capacities, calls on the river, Green Mountain Reservoir protection and development of downstream senior conditional water rights. The model was also used to estimate changes in the timing and amount of flows in the Colorado River and Plateau Creek and projected depletions to the Colorado River in the 15-Mile Reach. The hydrology of Plateau Creek and the Colorado River, diversion records, and data provided by the District, the U.S. Bureau of Reclamation (USBR), Collbran Water Conservancy District and others formed the basis of the model’s design. The model consists of a series of linked Excel spreadsheets, which all perform specific functions related to the District’s system. The model was updated in 2008 by Boyle Engineering (Boyle) to incorporate water rights acquired by the District since the original version of the model was developed and to provide functionality to evaluate the firm yield of their system under a variety of dry year leasing and water conservation scenarios. 2.0 MODEL SELECTION CRITERIA The following criteria were considered in the selection of a model for this study:
1. Study Period 2. Time Step 3. Study Area/Potential Alternatives 4. Required Functionality 5. Ease of Modification
Model Selection Criteria, Evaluation and Recommendation
3
A discussion of these criteria and how they relate to each model is provided below. 1. Study Period A study period should be long enough that it includes a variety of hydrologic conditions including average, wet and dry years. At the same time, it should not be so long that many streamflows, reservoir contents, and diversions must be synthesized to fill in missing data. The SYSTEM Model input dataset extends 18 years from 1975 through 1993. The CDSS Model input dataset extends 97 years from 1909 through 2005. The CDSS model can be configured to model any consecutive subset of years within that period. Of particular concern for this study is the inclusion of several dry years in the model study period since that increases the certainty and reliability of firm yield estimates. In addition, the inclusion of dry years is important since the hydrologic effects of a water supply project may be greatest in those years and should be thoroughly considered in an evaluation of impacts on flow related resources. The SYSTEM model analyses completed for the Plateau Creek EIS indicated that 1977-1978 was the critical period for the District’s water supply system. This also coincides with historical operations since 1977 was more critical than 2002 in terms of the District’s ability to meet their water demands. However, Jerry Creek Reservoir No. 2 was not constructed until ____, so the District only had approximately 1,100 AF of storage available at Jerry Creek Reservoir No. 1 in 1977. Although the amount pumped from the Lower Molina tailrace was considerably less than average in 2002, the District was able to draw heavily on their storage in the Jerry Creek Reservoir Nos. 1 and 2 that year. It is possible that the period from 2002 through 2004 may be a more critical drought for the District’s water supply system at a 2045 demand level particularly since 2002 was followed by two dry years. A review of historical gage flows for the Plateau Creek near Cameo gage (09105000) is shown in Table 1. The lowest annual flow recorded at the Cameo gage occurred in 1977 and was 35,300 AF versus 37,100 AF in 2002. However, the two-year and three-year flows surrounding those years were considerably lower for the more recent period. The two-year flow for 1977-1978 was 59,500 AF versus 48,100 for 2002-2003 and the three-year flow for 1976-1978 was 68,500 AF versus 54,900 AF for 2002-2004. Therefore, the period from 2002 through 2004 may be more critical if the District is unable to refill their reservoirs and must rely on carryover storage. For comparison purposes, the following study periods were used in recent Colorado River Basin permitting processes. Denver Water Moffat Collection System EIS Model Study Period: 1947 - 1991 Windy Gap Firming Project (WGFP) Model Study Period: 1950 – 1996 Colorado Springs Utilities (CSU) Green Mountain Reservoir Substitution EA
Model Study Period: 1950 – 2005
Model Selection Criteria, Evaluation and Recommendation
4
Ruedi Reservoir Round II Water Marketing Program EA Model Study Period: 1981 - 2005
Both the CSU and Ruedi Reservoir EAs used model study periods that extended through 2005. Although the Denver Water and WGFP EIS model study periods did not extend through the most recent drought, both of those EISs used study periods that were considerably longer (45 and 47 years, respectively) than the 18-year SYSTEM Model study period. To increase the certainty and reliability of firm yield estimates for those projects, both applicants performed separate spreadsheet analyses, which demonstrated the period from 2002 through 2004 was not as critical as earlier periods for their systems. To address comments that hydrologic effects and resource impacts should be evaluated for the period from 2002 through 2004, both applicants demonstrated their proposed alternatives would not affect flows in dry years. Another aspect of the study period that warrants consideration is climate and forest change. It may be necessary to consider the effects of both climate and forest change on potential water supply alternatives. For example, if runoff is shifted earlier in the year due to either climate or forest change there may be effects on the call regime and the District’s system yield. A longer and more recent study period would facilitate evaluating these effects. Summary To provide more certainty and reliability in the firm yield of the District’s existing water supply system and have the capability of evaluating hydrologic effects during the most recent drought, the recommended model study period should extend from 1975 through 2005. It is our opinion the District needs to provide an evaluation of their system yield and hydrologic effects in 2002 due to public perception of the severity of that drought. Since the CDSS Model input dataset currently extends through 2005 that model would not need to be modified. However, if the SYSTEM Model is selected, the input dataset would need to be extended 13 years from 1994 through 2005. This would require obtaining and synthesizing hydrology for Plateau Creek and the Colorado River, and extending and filling diversion records for water rights owned by the District. It may be possible to use virgin flow and diversion data from the CDSS model to extend the SYSTEM Model dataset in certain locations. 2. Time Step A monthly time step is typically adequate for the purposes of assessing firm yield and estimating hydrologic effects including changes in streamflows and reservoir contents. A daily time step may be warranted in situations where operations change considerably on a daily basis or there are specific requirements, such as instream flows or decree limitations, that change or are imposed mid-month. Both the CSU and Ruedi Reservoir EAs and WGFP EIS used monthly time step models whereas the Denver Water Moffat Collection System EIS used a daily time step
Model Selection Criteria, Evaluation and Recommendation
5
model. The WGFP EIS required that some monthly model output be disaggregated to daily data, therefore, it is possible that some daily data may be required for certain flow related resource evaluations. Summary Based on the current operations of the District’s water supply system and the administration of their water rights, a monthly time step model is considered adequate for the purposes of this study. Both the CDSS and SYSTEM models are available in a monthly time step format. The CDSS Model is also available in a daily time step format. If daily data is needed for the analysis of impacts on flow related resources, historical daily streamflow data could be used to disaggregate monthly model output to daily data. 3. Study Area/Potential Alternatives The study area of the model is important because the District’s water rights and diversions are affected by Colorado River mainstem calls by senior rights at Cameo and Green Mountain Reservoir protection, which extends beyond the Plateau Creek basin. The study area of the model is also important with respect to the location of potential water supply alternatives. The SYSTEM model reflects the District’s water supply system in the Plateau Creek Basin and their direct flow rights on Rapid Creek and the Colorado River. Although the District has shares in Vega Reservoir, the SYSTEM model does not reflect Vega Reservoir. The CDSS model covers the entire Upper Colorado River Basin downstream to the Colorado-Utah state line including the Plateau Creek Basin and Vega Reservoir. As a result, current administrative policies that affect the District’s water supply system, including the Interim Operating Policy for Green Mountain Reservoir and the Orchard Mesa Check Case Settlement, are reflected in more detail in the CDSS Model than the SYSTEM model. A broader model study area would facilitate modeling alternatives located outside of the Plateau Creek Basin. For example, an alternative that involves a contract for water out of either Ruedi or Green Mountain Reservoirs could be reflected in the CDSS Model relatively easily and the model could be used to estimate flow changes along the Blue, Colorado and Fryingpan Rivers. If the SYSTEM Model is selected, an alternative outside of the Plateau Creek Basin would likely require that a separate spreadsheet model be developed and integrated in SYSTEM, which could be a fairly involved effort depending on the alternative. The short list of alternatives that require modeling should be considered in the selection of the model, particularly if several alternatives are located outside of the Plateau Creek Basin or include Vega Reservoir. Summary The CDSS Model covers a much broader study area than the SYSTEM model and would require less modification to model alternatives that are located outside of

Model Selection Criteria, Evaluation and Recommendation
6
the Plateau Creek Basin or include Vega Reservoir. The CDSS Model also provides a more accurate representation of current Colorado River mainstem calls and their effect on the District’s diversions and firm yield. If the SYSTEM Model is selected, the model would need to be enhanced to reflect alternatives located outside of the Plateau Creek Basin. In addition, the Cameo call function in the SYSTEM model would need to be reviewed to determine if changes are needed to reflect the effect of the Orchard Mesa Check Case Settlement and additional upstream development on the frequency, timing and duration of the Cameo call. 4. Required Functionality The model selected must be capable of representing the District’s raw water system and the hydrology, operations and administration of the Colorado River. The following sections discuss issues that were considered in evaluating the functionality of the SYSTEM and CDSS Models with respect to this study. Representation of the District’s Raw Water Supply System and Water Rights The SYSTEM model incorporates a detailed representation of the District’s water rights, facilities, and operations. A summary of the District’s water rights by tributary is provided in Table 2. For each right, the user can modify several input parameters in the model. The user has the ability to turn each right on or off by year. For example, the District currently owns numerous irrigation rights that would need to undergo transfer in Water Court prior to their use in the District’s water system. In addition, the District owns two conditional water rights on the Colorado River, however, facilities do not exist to convey water from the Bridges Switch Pump Plant Pipeline and the Ute Pump Station and Pipeline to the District’s water treatment plant. Since these rights are not currently available to meet the District’s municipal water demands, the user can turn them off. The ability to turn irrigation rights on or off by year provides the ability to simulate a dry year leasing program. If an irrigation right is turned on in the model, the user can modify the percent consumptive use that could be expected if the right was transferred to municipal use. The user can also change the percentage of each direct flow or storage right the District owns. Green Mountain Reservoir replacement can be turned on or off for every right since the date whereby water rights are protected by Green Mountain Reservoirs is not conclusive at this time. A water conservation feature was also recently added to the model, which allows the user to simulate the effects of implementing temporary water conservation measures during drought emergencies. Demands can be adjusted in any month of the simulation period by varying water conservation factors. For each direct flow right, the SYSTEM model includes an estimate of the potential yield, which reflects the amount both physically and legally available to that right. In addition to the District’s direct flow rights, the model operates Jerry Creek Reservoir Nos. 1 and 2 as one combined reservoir. The District also acquired several new storage rights and reservoirs after the SYSTEM model was originally developed, which were recently incorporated in the model by Boyle.

Model Selection Criteria, Evaluation and Recommendation
7
The SYSTEM model operates the District’s water supply system including direct flow and storage rights with the objective of meeting monthly demands in a manner such that the combined yield of the District’s water supplies is maximized. The model reflects current operating criteria including use of the District’s direct flow diversions rights prior to storage and diversion of Molina Tailrace water prior to Plateau Creek and Colorado River water due to its higher water quality. The CDSS Model includes a more simplified representation of the District’s water supply system in comparison to the SYSTEM model. Only the District’s absolute water rights that are currently decreed for municipal purposes are diverted to meet the District’s demand in the CDSS model. Several changes would need to be made to more accurately reflect these rights. The Martin Crawford Ditch Ute Enlargement right for 8 cfs from Rapid Creek and the junior Ute Pipeline right for 30 would need to be added to the model. The seasonal and volumetric limitations on the Mason Eddy Ditch rights would need to be reflected in the model. The model also does not include any of the District’s conditional municipal water rights, including the Atwell East Ditch Supplemental domestic right for 2.82 cfs, the two conditional rights on the Colorado River for a total of 80 cfs, and the Coon Creek Pipeline conditional rights for 0.4 cfs and 1.5 cfs. The CDSS model does not reflect the majority of the irrigation rights (direct flow and storage) owned by the District nor does it include the option to use the irrigation rights that are in the model to meet the District’s municipal water demand. As shown in Table 2, only five of the direct flow irrigation rights owned by the District are reflected at individual structures in the CDSS Model. Water rights owned by the District in six ditches are not included in the model, and water rights in eleven ditches are included at aggregated irrigation structures. Aggregated irrigation structures in the CDSS model reflect several ditches and water rights located in the same general vicinity. There are 14 aggregated diversion structures included in the Plateau Creek Basin. For example, the aggregated irrigation structure, 72_ADC063, represents 20 ditches including the Atwell Waste Seep, Craig and Stewart, Pisel and Wildcat Ditches, which are owned by the District. Because these ditches are included in an aggregated irrigation structure, the yield is not estimated individually. Of the storage rights (reservoirs and reservoir shares) purchased by the District, only Hunter Reservoir, Monument Reservoir, Big Creek Reservoirs, Cottonwood Lakes Reservoirs and Vega Reservoir are reflected in the model. Reservoirs that are not reflected in the model include Jerry Creek Reservoir Nos. 1 and 2, Buzzard Creek Reservoir, Twin Basin Reservoir, Bull Creek Reservoirs, Bull Basin Reservoir Nos. 1 and 2, Coon Creek Reservoirs, Stubbs, McKinney and Clark Reservoir No. 1, and Mesa Creek Reservoirs. Vega Reservoir operations are fairly detailed in the CDSS model, which is a benefit if several potential water supply alternatives include Vega Reservoir. Hunter, Monument, Big Creek and Cottonwood Lakes reservoirs are included in aggregated reservoir structures so the yield is not estimated individually. The CDSS model includes four aggregated reservoir structures in the Plateau Creek Basin, which reflect several reservoirs

Model Selection Criteria, Evaluation and Recommendation
8
located in the same general vicinity or tributary basin. A key deficit in the CDSS model with respect to the District’s existing water supply system is that Jerry Creek Reservoir Nos. 1 and 2 are not reflected in the model. In a dry year, the yield of the District’s existing municipal water rights would be significantly underestimated because the model does not reflect the additional water the District could draw from storage at these reservoirs. The representation of instream flow rights in the Plateau Creek basin in both models was also considered since potential water supply alternatives will likely be subject to these requirements. Both the SYSTEM and CDSS models include the instream flow right on Plateau Creek from Grove Creek to the confluence of the Colorado River. The CDSS model also includes the instream flow right on Leon Creek. The representation of instream flow rights in the CDSS model is more dynamic since if reflects the flow requirement through a reach of river whereas the SYSTEM model only considers the requirement directly below the Molina tailrace diversion. Both models may also need to be capable of evaluating the effects of dry-up if potential alternatives include transfers of agricultural water rights to municipal use. Historically Diversion 5 has not required maintenance of return flows associated with water rights transfers. However, if return flows need to be maintained the model selected must be capable of evaluating new or existing reservoirs for this purpose. Summary The System Model is considerably more detailed and accurate than the CDSS Model in terms of its depiction of the District’s raw water system and water rights. The SYSTEM model includes all water rights owned by the District (except for Big Park Reservoir, GVIC shares and Vega Reservoir shares) and has more functionality with respect to how those rights are used to meet the District’s demands. The model can be modified to reflect a dry year leasing alternative or an alternative that includes transferring all or a portion of the District’s agricultural rights to municipal use. In addition, the storage rights and reservoirs purchased by the District are reflected in the model, in which case, a lot of work has already been completed to incorporate an alternative that includes Hunter Reservoir, Monument Reservoir or Buzzard Creek Reservoir. The major drawback of the SYSTEM model is that Vega Reservoir is not included. Alternatives that include use of the District’s Vega Reservoir shares, re-operation of the existing reservoir, or an enlargement would require that Vega Reservoir be incorporated in the model. This could be an involved task depending on the alternative. Vega Reservoir operations are relatively complicated and project water is delivered to numerous tributaries, therefore, potential hydrologic effects extend beyond just the Plateau Creek mainstem.

Model Selection Criteria, Evaluation and Recommendation
9
A considerable amount of work would be required to update the CDSS Model to include the conditional municipal rights and irrigation rights (direct flow and storage) owned by the District. Several additional structures would need to be added to the model and existing structures modified, which affects numerous input files. The distribution of virgin flows would need to be adjusted to reflect the amount of water physically available at each structure. Operating rules would need to be added so diversions under these rights or releases from these reservoirs would be available to meet the District’s demand. While the CDSS model can be configured to turn structures on or off, it would require changing parameters in several input files as opposed to one variable in the SYSTEM model control sheet. There isn’t a feature in the CDSS model that allows the user to easily turn on or off a structure to reflect transferring an irrigation right to municipal use or dry year leasing. In addition, it would not be as easy to modify the percent consumptive use that could be expected if an irrigation right was transferred to municipal use. Hydrology The virgin flow hydrology of each model was reviewed since the determination of firm yield and the ability of the District’s system to meet projected future demands is dependent on the available water supply at the District’s diversion points. In the SYSTEM model, the available flow at the District’s diversion points was estimated by using available streamflow gaging data, synthesizing data as necessary to fill in periods where records were missing, and then adjusting the data for any accretions and depletions between the gage location and the diversion point. In general, the starting point for generating flows on Plateau Creek, Mesa Creek, Coon Creek, and Buzzard Creek was the Plateau Creek near Cameo gage flows. Virgin flows at the Plateau Creek near Cameo gage were calculated by adding upstream historical diversions by the District (estimated based on raw water production data) and consumptive use by irrigation for the entire basin. Consumptive irrigation use in the basin was estimated by Western Engineers (WE) based on approximately 25,000 acres of irrigated land in the Plateau Creek basin. The average annual consumptive irrigation use was estimated to be 41,500 AF/yr. For comparison, the GIS assessment of irrigated acres in the Plateau Creek Basin that was completed for the CDSS model estimated irrigated acreage in the Plateau Creek basin at _____ acres. Since most virgin flows in the SYSTEM model are based in part on the virgin flow at Plateau Creek near Cameo, the estimated consumptive irrigation requirement in the Plateau Creek basin completed by WE should be reviewed and compared with more recent data available from the CDSS model. In the CDSS model virgin flows were computed where historical gage data is available by adding historical upstream depletive effects and subtracting historical upstream augmenting effects from the gaged value as shown below:
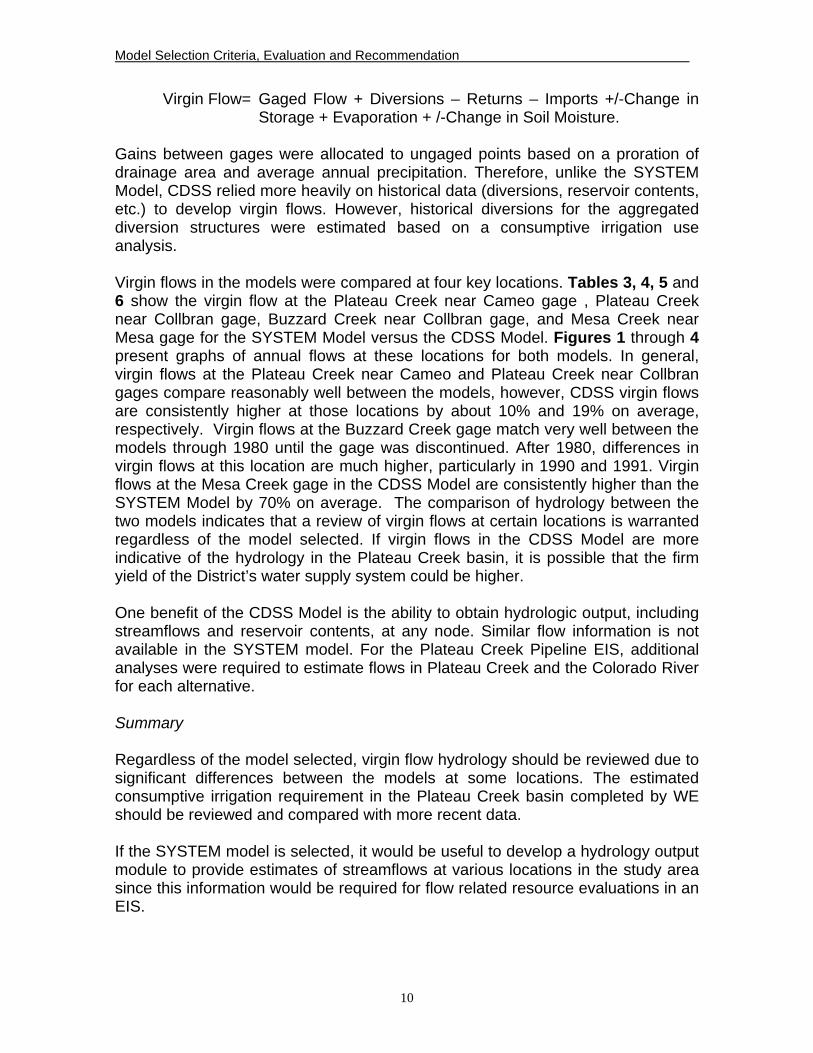
Model Selection Criteria, Evaluation and Recommendation
10
Virgin Flow= Gaged Flow + Diversions – Returns – Imports +/-Change in Storage + Evaporation + /-Change in Soil Moisture.
Gains between gages were allocated to ungaged points based on a proration of drainage area and average annual precipitation. Therefore, unlike the SYSTEM Model, CDSS relied more heavily on historical data (diversions, reservoir contents, etc.) to develop virgin flows. However, historical diversions for the aggregated diversion structures were estimated based on a consumptive irrigation use analysis. Virgin flows in the models were compared at four key locations. Tables 3, 4, 5 and 6 show the virgin flow at the Plateau Creek near Cameo gage , Plateau Creek near Collbran gage, Buzzard Creek near Collbran gage, and Mesa Creek near Mesa gage for the SYSTEM Model versus the CDSS Model. Figures 1 through 4 present graphs of annual flows at these locations for both models. In general, virgin flows at the Plateau Creek near Cameo and Plateau Creek near Collbran gages compare reasonably well between the models, however, CDSS virgin flows are consistently higher at those locations by about 10% and 19% on average, respectively. Virgin flows at the Buzzard Creek gage match very well between the models through 1980 until the gage was discontinued. After 1980, differences in virgin flows at this location are much higher, particularly in 1990 and 1991. Virgin flows at the Mesa Creek gage in the CDSS Model are consistently higher than the SYSTEM Model by 70% on average. The comparison of hydrology between the two models indicates that a review of virgin flows at certain locations is warranted regardless of the model selected. If virgin flows in the CDSS Model are more indicative of the hydrology in the Plateau Creek basin, it is possible that the firm yield of the District’s water supply system could be higher. One benefit of the CDSS Model is the ability to obtain hydrologic output, including streamflows and reservoir contents, at any node. Similar flow information is not available in the SYSTEM model. For the Plateau Creek Pipeline EIS, additional analyses were required to estimate flows in Plateau Creek and the Colorado River for each alternative. Summary Regardless of the model selected, virgin flow hydrology should be reviewed due to significant differences between the models at some locations. The estimated consumptive irrigation requirement in the Plateau Creek basin completed by WE should be reviewed and compared with more recent data. If the SYSTEM model is selected, it would be useful to develop a hydrology output module to provide estimates of streamflows at various locations in the study area since this information would be required for flow related resource evaluations in an EIS.

Model Selection Criteria, Evaluation and Recommendation
11
Cameo Call The Cameo call was reflected in the SYSTEM model based on an evaluation of historical streamflows and downstream demands by the Grand Valley Project and Grand Valley Canal. Available flows in the Colorado River at the District’s Colorado River diversion points were estimated by adding the flows of the USGS gages Colorado River near Cameo and Plateau Creek near Cameo and then subtracting demands for the Grand Valley Project and Grand Valley Canal. From April 16 through October 31, a total of 2,260 cfs (1,620 cfs for the Government Highline Canal and 640 cfs for the Grand Valley Canal) was subtracted from the gaged flows and from November 1 through April 14, 800 cfs was subtracted to reflect the demand for the Grand Valley Canal. When the calculated remaining flow is estimated to be zero, the Cameo call is assumed to be in effect. The summer and winter Cameo call amounts (2,260 cfs and 800 cfs) are reflected as variables that can be modified on the control sheet of the System model. In addition, the effect of future development of senior conditional rights in the Colorado River basin was incorporated in the SYSTEM model by including the ability to increase the call on the river. The Cameo Call in the CDSS Model reflects the Orchard Mesa Check Settlement. To reflect the agreement to subordinate the power right in the summer, the Grand Valley Power Plant right was split into three parts. The first part represents the winter rights for the full 800 cfs senior right, and the second and third parts represent the summer senior 490 cfs right and the summer junior right of 310 cfs (subordinated per the Check Case Settlement). The effect of the Orchard Mesa Check Case Settlement is that the Cameo call is reduced to 1,950 cfs (2,260 cfs – 310 cfs) during the summer. The reduced Cameo call could be reflected in the SYSTEM model by simply reducing the summer Cameo call amount on the control sheet of the model. However, the current level of upstream development and its potential effect on the Cameo call is not reflected in the SYSTEM. For example, the historical gage flows for the Colorado River near Cameo do not reflect current transbasin municipal diversions by Denver Water and the Windy Gap Firming Project. The CDSS model incorporates baseline demands in the model, which reflect current demands and operations. Additional upstream diversions could increase the frequency and duration of the Cameo call in comparison with the analysis in the SYSTEM model, which relied on historical streamflow records. The historical streamflows at the Cameo gage also do not reflect recent changes in operations such as late summer and fall fish flow releases for the 15-Mile Reach and the Interim Operating Policy for Green Mountain Reservoir. Late summer and fall fish flow releases to benefit the 15-Mile Reach affect Colorado River streamflows in the study area. Releases are made in the fall from Ruedi Reservoir, Wolford Mountain Reservoir, Williams Fork Reservoir, and Green Mountain Reservoir when the flow recommendations in the 15-Mile Reach are not being met. These fish flow releases are included in the CDSS model. While fish flow releases do not change the amount of water available to the District’s water rights, the District’s diversions and return flows do affect the amount of water flowing
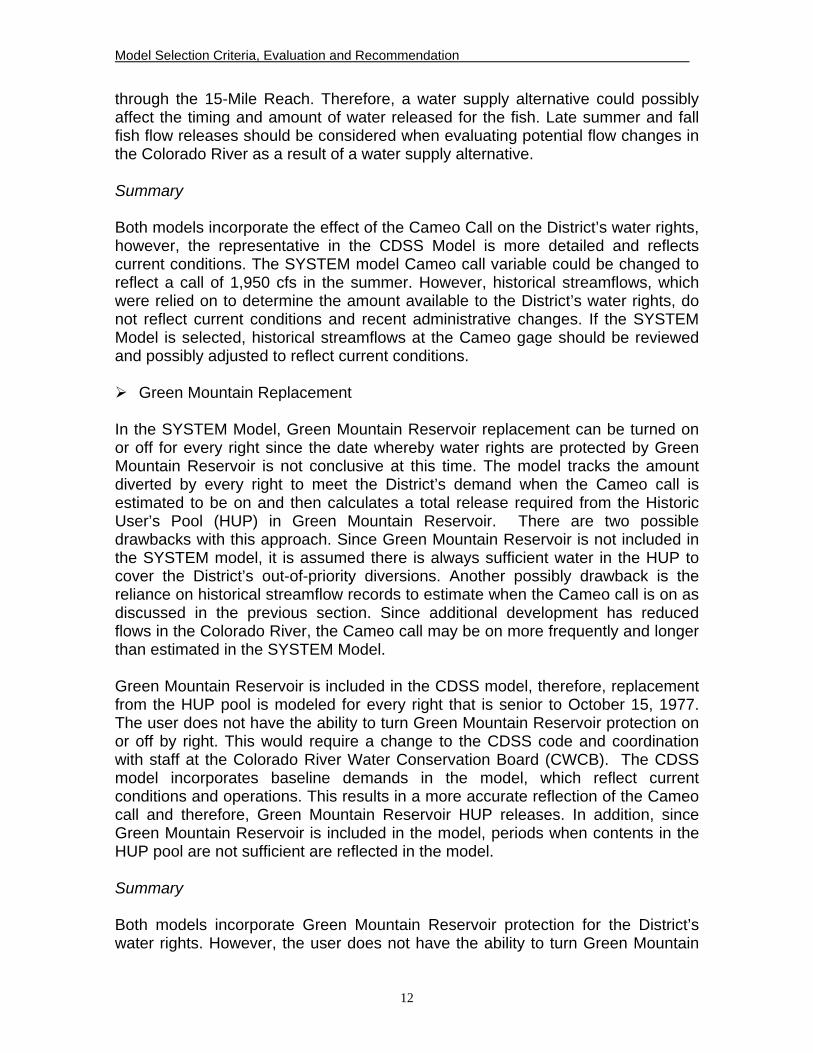
Model Selection Criteria, Evaluation and Recommendation
12
through the 15-Mile Reach. Therefore, a water supply alternative could possibly affect the timing and amount of water released for the fish. Late summer and fall fish flow releases should be considered when evaluating potential flow changes in the Colorado River as a result of a water supply alternative. Summary Both models incorporate the effect of the Cameo Call on the District’s water rights, however, the representative in the CDSS Model is more detailed and reflects current conditions. The SYSTEM model Cameo call variable could be changed to reflect a call of 1,950 cfs in the summer. However, historical streamflows, which were relied on to determine the amount available to the District’s water rights, do not reflect current conditions and recent administrative changes. If the SYSTEM Model is selected, historical streamflows at the Cameo gage should be reviewed and possibly adjusted to reflect current conditions. Green Mountain Replacement In the SYSTEM Model, Green Mountain Reservoir replacement can be turned on or off for every right since the date whereby water rights are protected by Green Mountain Reservoir is not conclusive at this time. The model tracks the amount diverted by every right to meet the District’s demand when the Cameo call is estimated to be on and then calculates a total release required from the Historic User’s Pool (HUP) in Green Mountain Reservoir. There are two possible drawbacks with this approach. Since Green Mountain Reservoir is not included in the SYSTEM model, it is assumed there is always sufficient water in the HUP to cover the District’s out-of-priority diversions. Another possibly drawback is the reliance on historical streamflow records to estimate when the Cameo call is on as discussed in the previous section. Since additional development has reduced flows in the Colorado River, the Cameo call may be on more frequently and longer than estimated in the SYSTEM Model. Green Mountain Reservoir is included in the CDSS model, therefore, replacement from the HUP pool is modeled for every right that is senior to October 15, 1977. The user does not have the ability to turn Green Mountain Reservoir protection on or off by right. This would require a change to the CDSS code and coordination with staff at the Colorado River Water Conservation Board (CWCB). The CDSS model incorporates baseline demands in the model, which reflect current conditions and operations. This results in a more accurate reflection of the Cameo call and therefore, Green Mountain Reservoir HUP releases. In addition, since Green Mountain Reservoir is included in the model, periods when contents in the HUP pool are not sufficient are reflected in the model. Summary Both models incorporate Green Mountain Reservoir protection for the District’s water rights. However, the user does not have the ability to turn Green Mountain

Model Selection Criteria, Evaluation and Recommendation
13
Reservoir protection on or off by right in the CDSS Model. This would require a change to the CDSS code and coordination with staff at the CWCB. If the SYSTEM Model is selected, historical streamflows at Cameo should be reviewed and possibly adjusted to reflect current conditions. This would result in a more accurate reflection of the Cameo call and therefore, Green Mountain Reservoir HUP releases. 5. Ease of Modification Another criterion considered for model selection is the ease with which it can be modified to accommodate water supply alternatives. The ability to customize and modify the model to represent potential water supply alternatives and project specific operations is necessary. The ability to change input data and incorporate an alternative or combinations of alternatives should be relatively easy for experienced modelers and those familiar with the District’s water supply system. The ability to evaluate different operational scenarios for a given site should also be easily tested with the model. Both the CDSS and SYSTEM models can be modified to reflect different input parameters and water supply parameters. Physical features, time series inputs, and operating criteria can be directly edited in input files in both models. Since the SYSTEM model was developed specifically to reflect the District’s water supply system it is easier to modify parameters that directly affect the District’s yield including Green Mountain Reservoir protection, dry year leasing and water conservation options. In addition, the user can easily turn on or off a structure and modify the percent consumptive use that could be expected if an irrigation right is transferred to municipal use. While these changes can be made in the CDSS model, they are more difficult and require changes in multiple input files. 3.0 MODEL SELECTION RECOMMENDATION A hydrologic model is needed to assess the firm yield associated with potential water supply alternatives and to evaluate hydrologic changes associated with those alternatives. The SYSTEM model and CDSS model were reviewed with respect to five criteria including: 1) Study Period, 2) Time Step, 3) Study Area/Potential Alternatives, 4) Required Functionality, and 5) Ease of Modification. The pros and cons of each model with respect to these criteria are summarized in Table 7. The following modifications and enhancements are recommended should either of these models be selected. SYSTEM Model Updates
1. Extend the model study period 13 years from 1994 through 2005 2. Review virgin flow hydrology 3. Incorporate Vega Reservoir 4. Develop hydrology module to provide streamflow output at various locations 5. Review Cameo call and possibly update to reflect current conditions
Model Selection Criteria, Evaluation and Recommendation
14
CDSS Model Updates
1. Review virgin flow hydrology 2. Incorporate all conditional municipal rights and irrigation rights owned by
District The selection of a model for this study depends in large part on two key issues: 1) the study area encompassed by the short list of alternatives, and 2) inclusion of the District’s irrigation rights in alternatives. If the short list of alternatives that requires modeling is primarily confined to the Plateau Creek basin and the Colorado River mainstem downstream of the District’s diversion points, the SYSTEM model is a better candidate for this project. However, if there are several alternatives located outside of the Plateau Creek basin that include other reservoirs, such as Ruedi and Green Mountain Reservoirs, the CDSS Model is a better candidate. The CDSS Model covers a much broader study area than the SYSTEM model and would require less modification to model alternatives that are located outside of the Plateau Creek Basin or include Vega Reservoir. If several alternatives include dry year leasing options or transfers of the District’s irrigation rights, then the SYSTEM model is a better candidate due to recent updates to the model to incorporate these water rights. The primary drawback of the CDSS model is the amount of work required to update the model to include the conditional municipal rights and irrigation rights (direct flow and storage) owned by the District. Numerous changes and additions would be needed that affect several input data files. Even if the model is updated to reflect these rights, there isn’t a feature in the model that allows the user to easily turn on or off a structure to reflect transferring an irrigation right to municipal use or dry year leasing. In addition, it would be more difficult to modify the percent consumptive use that could be expected if an irrigation right was transferred to municipal use. Green Mountain Reservoir protection is also not easily modified in the CDSS model since it cannot be turned on or off for individual rights. The primary drawback of the SYSTEM model is the need to extend the study period and incorporate Vega Reservoir. However, it the District intends to continue using this model in the future for planning purposes, the benefits of these modifications extend beyond this project. The model is easier to use and modify to reflect different operating scenarios and more accurately reflects the District’s system. It has the capability to reflect dry year leasing options and conservation, and already includes several reservoirs that have been identified as potential alternatives. The model was also accepted by the Bureau of Land Management for use in the Plateau Creek Pipeline EIS.