Embed Size (px)
Citation preview

Demand and Supply of Populism∗
Luigi Guiso† Helios Herrera ‡ Massimo Morelli§
Tommaso Sonno¶
March 4, 2017
Abstract
We define as populist a party that champions short-term protection policies with-
out regard for their long-term costs. First, we study the demand for populism: we
analyze the drivers of the populist vote using individual level data from multiple waves
of surveys in Europe. Individual voting preferences are influenced directly by different
measures of economic insecurity and by the decline in trust in traditional parties.
However, economic shocks that undermine voters’ security and trust in parties also
discourage voter turnout, thus mitigating the estimated demand of populism when
ignoring this turnout selection. Economic insecurity affects intentions to vote for pop-
ulist parties and turnout incentives also indirectly because it causes trust in parties
to fall. Second, we study the supply side: we find that populist parties are more
likely to appear when the drivers of demand for populism accumulate, and more so in
countries with weak checks and balances and with higher political fragmentation. The
non-populist parties’ policy response is to reduce the distance of their platform from
that of new populist entrants, thereby magnifying the aggregate supply of populist
policies.
Keywords: voter participation, short term protection, anti-elite rhetoric.
∗Luigi Guiso and Massimo Morelli wish to thank the Italian Ministry of Research (MIUR) for thePRIN funding 2016; Massimo Morelli also wishes to thank the Dondena and Igier research centersand the European Research Council, advanced grant 694583. We thank Tito Boeri, Giunia Gatta,Sergei Guriev, John Huber, Thomas Coening, Alex Lenk, Moritz Osnabruegge, Marco Ottaviani,Paola Profeta, Guido Tabellini, Stephane Wolton and Matia Vannoni for useful comments.
†Einaudi Institute for Economics and Finance and CEPR‡Warwick University§Bocconi University and CEPR¶Universite Catholique de Louvain, Centre for Economic Performance (LSE) and F.R.S.-FNRS
1

1 Introduction
The majority of European countries and the United States are experiencing an un-
precedented wave of populist and anti-populist rhetoric.1 As it previously happened
in Latin America, some countries are experiencing a growth of protests against in-
equality and capitalist institutions, leading to left-wing type of policy demands; at the
same time, in other countries, right-wing populist movements find increasing support
for protecting the country from immigrants and globalization threats. Protection-
ism against migrants and free trade effects is also key in the Trump and post-Brexit
UK policies, which are difficult to place in the traditional left-right spectrum. All
populist movements and rhetoric have in common what we summarize as short-term
protection. In southern Europe, M5S in Italy and the Greek and Spanish populist
movements fight for citizenship income and for other forms of economic short term
protection, against European impositions for future stability – the Mediterranean
populism. In continental Europe, the main concern has become terrorism and Islam
(though citizenship income is also being discussed). In the UK the main issues being
discussed are protection against immigrants and import substitution from China,
without concern for future consequences from such protectionism. Overall, nation-
alism and closure to immigration are on the rise.
Rather than focusing on the differences between existing strands of populism and
corresponding definitions, our goal is to focus on the common features of all types of
populism, in order to (1) acquire an analytical, rather than merely descriptive, tool
for its study and (2) to zoom on the key drivers of the populist wave as a whole. To
this end, we find the definition of populism in the Encyclopedia Britannica a particu-
larly useful starting point: populists claim to promote the interest of common citizens
against the elites; they pander to people’s fear and enthusiasm; and they promote
policies without regard to the consequences for the country. This broad definition of
populism highlights three important components: (1) the populists’ claim to be on
the side of the people against the elite – which we can label as “supply rhetoric;” (2)
1Google Trends shows an astonishing spike in the number of searches for the word populism,which quadrupled in the fall of 2016.
2

the “fears or enthusiasm” of people – the demand conditions to which the populists
pander; and (3) the disregard for future consequences – policy characteristics of the
populists’ political supply which we summarize as short-term protection.2 These
three components should be theoretically understood and empirically analyzed to-
gether. Most importantly, how does the “short-term protection” component of the
definition interact with the commonly emphasized anti-elite rhetoric? Our claim
is that the anti-elite rhetoric simply “supplies disinformation,” making it possible
to win elections with short-term oriented policies. For example, if a non-populist
politician counters a populist policy proposal by a challenger with statements about
future costs, future debt accumulation or banking crises, the rational response by the
populist challenger is to claim that all such statements of concern for the future con-
sequences of the protection policies are instead driven by the self-interest of the elites.
That is to say, economists and incumbent politicians may well know something about
how to evaluate future costs, but since maintaining the status quo policies is in their
elite interests, their statements become non-credible. The definition of Encyclopedia
Britannica encompasses both the nationalist type of populism (emphasizing fear or
enthusiasm about identity protection), and the economic type of populism (propos-
ing redistributive policies like citizenship income, regardless of costs). Thus, when
we say that a populist party or movement offers short-term protection we intend to
include both possibilities.3
But what drives the observed simultaneous shift towards populism in so many
countries? Is it a global shift in voters’ preferences or emotions, which is then im-
mediately captured by new political leaders who enter politics? And, what drives
this global shift of demand, this preference shift towards short term protection? Is
it related to economic crises or stagnation and, if so, through which channels?
First, this paper provides a comprehensive identikit of the populist voter in Eu-
2Citing from Encyclopedia Britannica 2015: “...either a platform that promotes the interest ofcommon citizens and the country as a whole or a platform that seeks to redistribute wealth togain popularity, without regard to the consequences for the country such as inflation or debt.” seewww.britannica.com/topic/populism
3In political science the right wing and left wing populism of the past have been studied sepa-rately; with this definition we can study them together, emphasizing the common characteristics.This is essential when trying to capture the global trend of populism.
3

rope. We study the determinants of the demand for populist platforms in the Euro-
pean countries covered by the European Social Survey. Our empirical study stresses
the importance of accounting for selection issues, which are typically ignored in other
studies of populist voting. Adverse shocks to economic security and trust in political
parties can induce people not to turnout, but if they vote, to vote for a populist
party. Ignoring the voter participation selection may bias the estimates of drivers of
the voting choice and also underestimate the underlying demand for populist parties.
Second, we provide evidence of the supply shifts, documenting the entry of new
populist parties in the political arena over time, and the electoral competition re-
sponses of non-populist parties. A decline in trust for traditional parties can de-
termine entry of populist challengers, creating a change in the subsequent electoral
competition game.
The main finding on the demand side is that economic variables are significant
determinants of increased voter preference for populist parties. Lower income, fi-
nancial distress and higher economic insecurity from exposure to globalization and
competition of immigrants drive the populist vote. Interestingly, economic insecurity
shocks have both a direct effect on populist vote and also an indirect effect through
induced lower trust in the incumbents. All these variables push voters simultane-
ously in two directions: to abstain from voting and, if they participate, to vote more
for the more populist. Aggregating all effects, negative economic shocks (like the
2008 crisis and its aftermath) and the collapse of trust in traditional politics they
induce, boost the demand for populist policies.
On the supply side, we find that the prolonged economic crisis caused the entry
of populist movements and parties, who took advantage of the drop of trust in
traditional politics and institutions. In the prolonged stagnation that followed, we
show evidence that even traditional parties facing crumbling support and increased
demand for short-term protection started shifting their policies gradually towards
populist policies. Perhaps surprisingly, no counter-populist movement successfully
emerged to capture the votes of those citizens who see the dangers of an excessive
focus on protectionism and the short run. This policy convergence can be understood
as due to the “disinformation supply” or anti-elite rhetoric mentioned above, which
4

makes it difficult to pursue a credible anti-populist campaign.
The paper is organized as follows. In the next section we review the most recent
related literature. Next, we introduce a simple theoretical framework that helps
to pin down the relevant individual heterogeneous characteristics that affect the
preference for a populist party. We describe the data in Section 4, and illustrate the
empirical results on the demand side in Section 5. The results on the supply side of
populism are shown in Section 6. Section 7 concludes.
2 Relation with Literature
The traditional macro-economics literature on populism (Dornbush and Edwards
1991; Sachs 1989) looks at the consequences of the short-term protection populist
policies. Contemporary political economics works (e.g. Acemoglu et al, 2013a) have
started to focus on the causes of short-term protection, by looking at what voters
want and how politicians pander to it. The trade literature exploits exogenous vari-
ation in import flows to study political polarization and support for populist politics
(Steiner, 2012; Autor et al., 2016; Colantone and Stanig, 2016; Jensen et al., 2016),
and analyzes economic shocks due to austerity policies (Becker et al., 2016). Di Tella
and Rotemberg (2016) analyze populism demand based on the behavioral observa-
tion that voters are betrayal averse, and hence may prefer incompetent leaders to
minimize the chance of suffering from betrayal. In sum, the economics literature
has so far focused on what explains the demand of populist policies and their con-
sequences, but has not explored the causes and sustainability of populist policies on
the supply side, nor has it offered an explanation about “Why now?” should there
be such a cluster of populism in the world.
The bulk of works in political science has focused mostly on the institutional pre-
conditions for the formation of populist parties (Norris, 2005; Rydgen, 2007; Golder,
2016), or on electoral dynamics, identifying parties on the radical right (Mudde,
2007), but increasingly also on the radical left (March, 2007; March and Mudde, 2005;
Pauwels, 2014; Stavrakakis and Katsambekis, 2014), or on the populists’ strategies to
survive in office (see e.g. Boix, 1999). Only recently, in political science, the attention
5

has shifted from the supply side to the demand side. Inglehart and Norris (2016)
observe that cultural variables affect the decision to vote for a populist party (instead
of abstaining or voting for a non-populist party) more than economic variables. But
the fact that they find a weak direct effect of economic variables is mostly due to
the fact that they fail to observe that economic security shocks affect significantly
the incentive to abstain (see footnote 7 and our empirical sections for the details
on this turnout selection problem). Beside the stronger direct effect of economic
shocks that we document by taking into account the turnout selection effect, we
document a strong indirect effect: the shocks to economic security are responsible
for a sharp change in trust and attitudes towards migration, and hence the effects of
the changes in the latter variables cannot be considered independent drivers.4 For a
review of the literature on populism in the social sciences in general, see e.g. Gidron
and Bonikoeski (2013) and Mudde and Rovira Katwesser (2017).
In this work, we look simultaneously at the demand and supply sides, in order
to explain populist policies. The demand side involves the fears and enthusiasms of
people, to which politicians pander. The supply side lies in the politicians’ claim to
be on the side of people and against the elites. Demand and supply meet at a specific
point: short-term protection. Due to growing economic insecurity, people demand
short run protection. At the same time, populist parties find their own space in the
political landscape and they build their agenda on the dichotomy “people vs elites”.
This leads to the supply of short-term protection, since long-termism is considered
to be in the interest of the elites.
As far as the policy convergence result (described in section 6) is concerned, the
closest related result is in Schumacher (2016), who shows with manifestos data that
early success of populist parties did affect the skepticism for multiculturalism in
mainstream parties’ platforms. Another related paper is Tohmelt et al (2016).
4Lucassen and Lubbers give evidence – for 8 of the 11 countries they consider – that countriesthat experienced a shift towards far-right-wing populism did so due to perceived cultural threatsmore than due to perceived ethnic economic threats, whereas it is plausible that in countries ex-periencing a shift towards left-wing populism the relevant perceived threat is economic. But forus the important observation is that both perceptions of economic and cultural threats have beenaffected by the economic shocks.
6

3 A Simple Theory
Here we provide a simple framework to address and rationalize the empirical results
that follow.
3.1 Demand
We outline a simple theory of demand for populist policies, identifying the individual
voters’ factors that affect their likelihood to vote for a populist party. Suppose that
each voter i in a country has a choice between a populist party, P , and a non-populist
status quo party, S, namely the incumbent party. We consider party P as populist
when it offers a bundle of short-term protection policies (such as trade protection,
defense from immigration, citizenship income or other secure employment policies).
The status quo party S proposes policies already tested and observed commonly, and
hence with more clearly identifiable future implications.
We assume two periods, 1 and 2, representing the short run and the long run.
The voters’ expected income over these two periods from the two different platforms,
S and P , are as follows.
Expected Incomes of Status Quo S:
y1 y2
Status Quo qy σy1
where y1(y2) is the short term (long-term) expected income from the status quo
party. The key heterogeneity factors among voters are:
• y income on the current job.
• q current job perceived security: the probability of keeping the current job.
• σ trust in current policies to be sustainable (improve/worsen) in the long run,
namely the chance of improving (σ > 1) or worsening (σ < 1) the current short
term expected income in the future.
7

• π trust that the short term populist policies are sustainable in the long run,
see below.
Expected Incomes of Populist Platform P
Y1 Y2
Populist q′y′ πY1
where Y1 (Y2) is short term (long term) expected income from populist policies.
We assume that, in general, the populist platform proposes a reduction in the
dispersion of short term expected income qy, by means of enhanced redistribution
from the higher to the lower incomes and enhanced job protection for the jobs most
at risk (low q). For instance, closure to immigration is an example of a populist
platform aimed at generating higher short term expected income for some. A similar
effect can be attributed to protectionist policies in trade.5
We can represent the populist platform as a linear re-mapping of job security q
into:
q′ = ρ+ (1− ρ) q
where ρ is the minimal level of employment protection. This policy improves job
security for all voters (q′ > q) and more so for the agents with least job security.
Moreover, the populist platform may also offer redistribution. The latter in re-
duced form is a linear re-mapping of income y which increases low incomes and lowers
high incomes:
y′ = y0 +
(1− y0
ym
)y
where y0 is some minimal income and ym is the mean income that is left unchanged
by the populist policy, namely we have:
5More specifically, populist parties either put greater emphasis on employment protection pro-posals (often identifiable as right-wing populism), or on measures like citizenship income (identifi-able as left-wing), but for the sake of the description of the demand side we let the populist platformpotentially contain both types of proposals.
8

This policy improves job security for all (q0 > q) and more so for the agents with least
job security. Moreover, the populist platform also o¤ers redistribution. The latter
in reduced form is a linear remapping of income y which increases low incomes and
lowers high incomes, namely:
y0 = y0 +
�1� y0
ym
�y
where y0 is some the minimal income and ym is the mean income that is left unchanged
by the populist policy, namely we have:
y0 ? y () y 7 ym
As for the long run e¤ects, � represents the trust that the short term populist
polices are sustainable in the long run. In fact, the future cost of an untested pop-
ulist policy is obviously uncertain and agents in general have heterogeneous beliefs
on it. The expectations of future costs of a populist platform are heterogeneous
because di¤erent generations of voters have di¤erent experiences with alternative
3
y′ ≷ y ⇐⇒ y ≶ ym
The future cost of an untested populist policy is obviously uncertain and agents
in general have heterogeneous beliefs on it. The expectations of future costs of a
populist platform are heterogeneous because different generations of voters have dif-
ferent experiences with alternative policies and because of education and information
heterogeneities. Thus, π is perceived as low by more informed/educated people, who
may be able to evaluate the general equilibrium consequences and long term conse-
quences of trade barriers. The under-estimation of future costs of populist policies
is not only a well recognized phenomenon,6 but also an explicit political strategy of
populist parties. Voters typically receive conflicting messages from the competing
parties, with the populist party emphasizing that any concern for future costs ex-
pressed by the incumbents is simply a product of elite’s interests – what we label
6See e.g. Hainmueller and Hiscox (2006).
9
“supply rhetoric”.
3.2 Predictions
The model identifies the drivers of individual voting decisions. Assuming risk neu-
trality and time discounting δ, an agent prefers the populist platform to the status
quo if the utility from the populist platform (UP ) exceeds status quo utility (US) :
UP − US > 0
q′y′ (1 + δπ) > qy (1 + δσ)
Substituting and simplifying we obtain:(ρ
q+ (1− ρ)
)(y0y
+
(1− y0
ym
))>
1 + δσ
1 + δπ
The populist platform is popular among agents with lower (q, y, σ) or higher π, and
all these variables are independent from one another. The discount factor δ, a proxy
for the agent horizon, has an ambiguous effect. In sum, populist vote intentions are
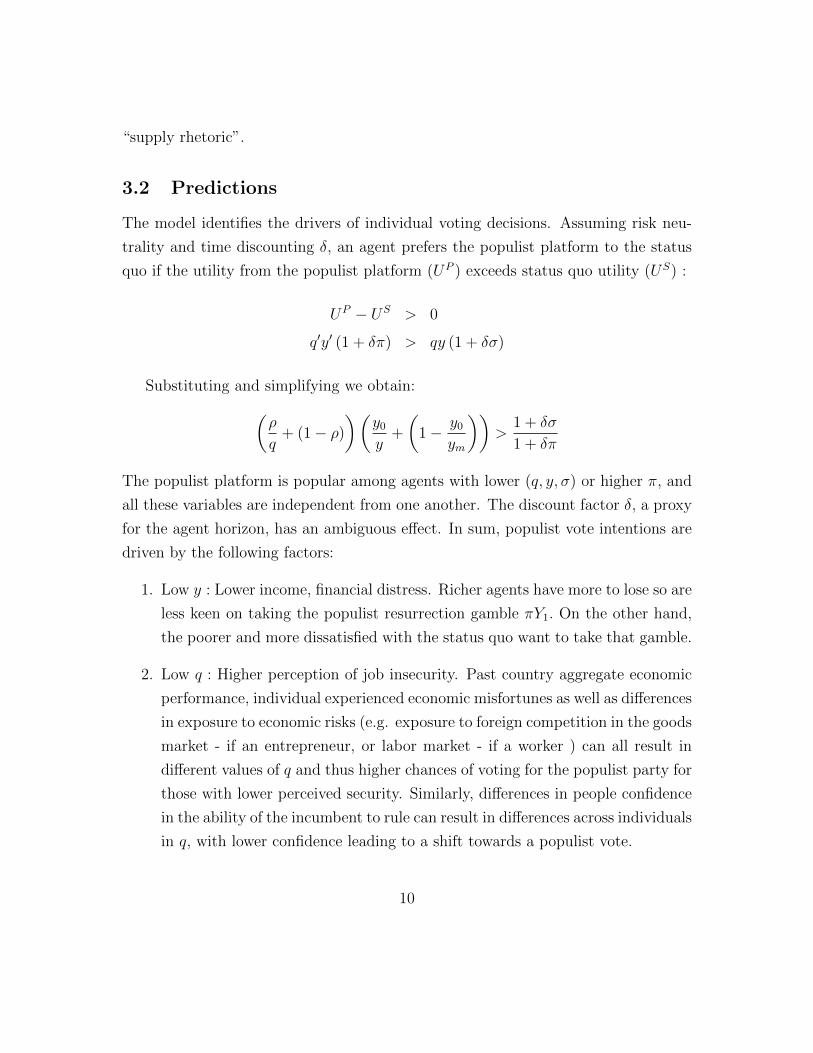
driven by the following factors:
1. Low y : Lower income, financial distress. Richer agents have more to lose so are
less keen on taking the populist resurrection gamble πY1. On the other hand,
the poorer and more dissatisfied with the status quo want to take that gamble.
2. Low q : Higher perception of job insecurity. Past country aggregate economic
performance, individual experienced economic misfortunes as well as differences
in exposure to economic risks (e.g. exposure to foreign competition in the goods
market - if an entrepreneur, or labor market - if a worker ) can all result in
different values of q and thus higher chances of voting for the populist party for
those with lower perceived security. Similarly, differences in people confidence
in the ability of the incumbent to rule can result in differences across individuals
in q, with lower confidence leading to a shift towards a populist vote.
10

3. Low σ : Lower trust in traditional status-quo politics to be sustainable or
improve matters in the long run.
4. High π : Higher perception of sustainability of populist policies. This can re-
flect differences in people’s information about what the costs are as well as
differences in ability to see through the populist party veil of the future cost of
their current protection policies. While expectations about future income is al-
ways uncertain, the more informed better evaluate the probability distribution
of future costs of populist policies. Understanding costs is related to education
and attention to politics.
3.3 Turnout
For simplicity, the above model focuses primarily on the voting decision. Empirically,
however, we need to distinguish the decision to participate from the party choice.
In fact, the party choice only applies to those citizens that choose to participate.
Participation matters for the election result if it is driven by some of the same
variables that influence the party choice. This selection problem can either enhance
or mitigate the success of populist parties, depending on whether the variables that
induce people to abstain from voting would make it more or less likely to vote for a
populist party.7
It is well documented – see, among others, the comprehensive work of Blais (2000)
– that the incentives to turn out depend positively on income y and age, positively
on trust in the political system σ and also positively on education, and depend neg-
atively on π. Blais suggests the reason for these correlations is that people with
these characteristics tend to be integrated into society. The sociological interpreta-
7 The fact that Inglehart and Norris did not consider the turnout decisions explicitly in theiranalysis could be one of the main reasons for their result, opposite to ours, that the economicinsecurity is not a significant cause of the populist shift. To see this, let P denote the number ofvotes for the populist party, V the number of participants and N the number of potential voters.Clearly P
N = PV
VN . If in response to economic insecurity V/N decreases, while the share of votes to
the populist party among the participants, P/V, increases as our results show, P/N may respondlittle if at all - which partly explains why Inglehart and Norris (2016) find small effects of economicinsecurity measures on populist votes.
11
tion suggests that the act of voting expresses one’s sense of belonging to the larger
community.
A way to include abstention in our framework is to assume that voter turnout
depends on intensity of preferences. Namely, agents turn out to vote if they feel
strongly enough about the issue at stake, that is when:
∣∣UP − US∣∣B (y, σ, π, δ) > 1
where∣∣UP − US
∣∣ is perceived utility distance from the two platforms, while
B (y, σ, π, δ) is the benefit-cost ratio of turning out to vote for a given party, which
depends positively on income, age and trust, and negatively on education.
With such a framework it is easy to see that a voter who prefers the status quo is
more likely to participate, whereas a voter that prefers the populist platform is more
likely to abstain. This is true for all variables except for the discount δ, which has no
clear effect on the decision of who to vote for. As a result our model predicts that the
populist vote preference is positively correlated with abstention. This is important,
as it mitigates the overall populist vote. For instance, an aggregate income shock
would increase the populist vote, but not as much, because it would also increase
abstention.
3.4 Supply: Parties’ Entry and Policy Choice
The decision to enter in politics with a new party is worth it if upon entry a high
enough expected power share can be obtained. Thus, a voters’ preference shock
on the demand side could eventually increase the number of populist parties. For
instance, an economic crisis that lowers q and/or lowers y for a relevant fraction of
the population should increase the supply of populist parties, that is the incentive
for a populist platform to enter the political arena.
A change on the demand side may be amplified by certain country specific fac-
tors. For instance, higher political fragmentation, namely less concentration of power
among political parties, allows in expectation more power share for any given vote
share obtained. Hence this should create additional incentives for entry of new polit-
12

ical parties, who for instance can more easily be part of some coalitional government.
Moreover, all else equal, lower checks and balances should allow more freedom on the
implementation of policies, hence more incentives for parties with extreme platforms,
such as populist parties, to appear in electoral lists.
As for the policy outcomes, the standard Downsian theory predicts that existing
parties should respond to the entry of populist parties. Namely, after the entry of
populist parties, non-populist parties should choose somewhat more populist policies
to limit or prevent a loss of vote share.
In the next sections we discuss how we proxy empirically for these variables,
identifying separately the decision to participate in the election and the choice of
the party to vote for; as well as the creation of populist parties and the response of
mainstream parties to their presence.
3.5 Case Study
Before getting to the general econometric analysis, Figure 1 (panel 1) exemplifies our
story drawing on the Italian case. It shows the evolution of GDP growth just before
the 2008 crisis and in the subsequent years; that of the level of people’s confidence in
political parties; and the level of support (measured by the intentions to vote) for the
Five Star movement - a newly created populist party. GDP falls markedly in 2009
and stagnates since then, giving rise to the deepest and most prolonged recession in
Italian history. Disappointed with incumbent parties, Italians lose faith in political
parties, held responsible for the country’s performance. The share of people trusting
political parties falls from 25% before the crisis to levels around 5% (or below) after
2009 with no sign of recovery. This disappointment with incumbent parties has
two consequences: it leads voters to abstain from voting (in the last parliamentary
election in 2013, turnout falls to 75%, the lowest in Italy’s post war elections8); and,
most strikingly, it raises support for “outsiders.”Driven by demand for protection and
voters’ disillusion with (existing) political parties, the Five Stars movement enters
8The drop in turnout in European elections is even more marked: in 2004 (before the crisis) itwas 73%, falls to 66% in 2009, after Lehman Brothers but before the European sovereign crisis andto 58.7% in the 2014 elections, when the effects of the European crisis were felt.
13

the political market. It first appears in 2009 and since then has gained increasing
support, up to becoming the second largest party in the 2013 elections and the largest
one in the 2016 polls. To try to contrast their success, Prime Minister Matteo Renzi,
leader of the incumbent party, has adopted a number of “populist” policies - ranging
from voters-friendly budget policies (e.g. the so called “80-euro bonus”- a personal
income tax cut for lower earners), to more symbolic anti-Euro positioning (e.g. not
exposing the European flag together with the Italian flag as customarily done by
government representatives in public speeches).
The second panel of Figure 1 shows that a similar pattern holds in Greece: as the
economic crisis deepens after 2007, people start losing faith in traditional parties,
participation in elections falls, and demand for protection rises. Populist movements
either enter the market (as Golden Down), or expand considerably (as Syriza) start-
ing from an almost irrelevant voters’ basis.
In the following sections we show systematic evidence from all European coun-
tries, supporting the narrative above.
4 Data
Our main source of individual level data is the European Social Survey (ESS). The
ESS is the richest social scientific endeavor to map the attitudes, beliefs, and be-
havior patterns in Europe. The central aim of the ESS is to develop and conduct
a systematic study of changing values, attitudes, attributes, and behavior patterns
within European polities. The survey covers all European countries, though not
all countries participate in all waves. Data collection takes place every two years,
starting in September 2002, by means of face-to-face interviews. We will use all
seven waves available up to now. The questionnaire consists of a core module which
remains constant from round to round and smaller rotating modules, repeated at
intervals, each devoted to a substantive topic or theme. We will rely on informa-
tion from the core module covering a wide range of socio-economic, socio-political,
socio-psychological and socio-demographic variables.
14

Figure 1: Populism, Economics, Turnout and TrustItaly
..
Greece
2004 2006 2008 2010 2012 2014 20160
0.05
0.1
0.15
0.2
0.25
90
95
100
105
110
115
120
125
TRUSTIN
POLITICA
LPA
RTIES
INDUSTRIALPRO
DUCTION,M
5SSHAR
EOFVO
TES,
ELECTO
RALTU
RNOUT
M5S(share+100,ParlGov) Industrialproduction(2010=100,Istat) Electoral turnout(2006=100,GovPol) Trustinpoliticalparties(average fromdifferentsources)
0
0.05
0.1
0.15
0.2
0.25
0.3
70
80
90
100
110
120
130
2003 2005 2007 2009 2011 2013 2015 2017
TRUSTIN
POLITICA
LPA
RTIES
INDUSTRIALPRO
DUCTION,M
5SSHAR
EOFVO
TES,
ELECTO
RALTU
RNOUTS
Totalpopulistpartiesshare(SYRIZA,LAOS,IndepGreek,GoldenDawnshares+100) Industrialproduction(2010=100,Eurostat)Electoral turnout(2004=100,ParlGov) Trustinpoliticalparties(Eurobarometer)
The figures show the evolution of economic activity, trust in political parties, electoral turnout and consensus to pop-ulist parties in Italy an Greece. Economic activity (measured by the index of industrial production), the share ofvotes to the populist parties and electoral turnout are on the left scale; trust in political parties on the right scale.
15

4.1 Measuring voting decisions
Most importantly for our purpose, the ESS asks people whether they voted in the last
parliamentary election in their country and which party they voted for. Specifically,
survey participants are asked: “Some people don’t vote nowadays for one reason or
another. Did you vote in the last [country name] national election in [month/year?]”.
From this we obtain an indicator of participation in the election. Those answering
yes were then asked: “Which party did you vote for in that election?” and were
shown the list of parties in the election. From this we construct a dummy that takes
value one if the voter voted for a populist party (identified in section 4.3).
4.2 Measuring voters’ characteristics
The ESS contains a large number of variables from which we select a subset that
we use to construct proxies for the voters’ characteristics that influence both their
turnout and voting decisions, as discussed in Section 3.
Perception of long run costs of populist policies. We use two proxies for
voters’ ability to foresee the potential pitfalls of the populist platforms, and obtain
a more precise assessment of the future impact of a populist protection policy. The
first is education, measured by the number of years of full-time completed school-
ing. Education can capture the ability to infer the future costs of current populist
policies (e.g. because highly educated are more likely to be aware of the government
intertemporal budget constraint).
The second proxy is a measure of attention to politics, captured by two variables:
how long, hours per week, people devote to watching TV in general and how much
of the time watching television is spent watching news or programs about politics
and current affairs. Watching TV in general is taken as a proxy for little interest
in politics, and thus as a proxy for poor information. Watching news and programs
about politics, given the time spent watching TV, is used to proxy for the information
level.9 Ceteris paribus, we would expect better educated people and people who
9This second proxy has to be taken with a grane of salt, because in some countries it may wellbe possible that someone who watches political news hundred percent of his or her time does so
16

watch TV programs on politics to be better able to anticipate the costs consequences
of a populist party policies and thus be less likely to vote for it.
Time discounting and risk aversion. The weight given to the future uncertain
costs and benefits of current policies depends on the subjective discount factor (with
ambiguous sign, as shown in Section 3), and on the degree of risk aversion. The ESS
has no direct measure of people’s patience. We use age as a proxy for subjective
discounting, relying on the idea that older people are less likely to pay for the future
cost of current policies (assuming they care about future generations less than they
care about themselves). The ESS is richer in terms of proxies for risk tolerance.
We use an indicator of whether people consider it important to avoid taking risks
measured on a scale between 1 and 6, increasing in aversion to risk.
Economic insecurity. We capture heterogeneity across voters in economic in-
security, or in their perception of it, with several measures. First, we use two direct
measures of financial distress: a) an indicator of whether the voter has undergone an
experience of unemployment over the past five years – forcing him or her to search
for a new job; b) an indicator of whether (s)he is experiencing income difficulties, i.e.
(s)he finds it difficult to live with his current income. Second, we build an indicator of
exposure to globalization, exploiting information in the ESS on the type of employ-
ment, industry and workers’ skill level – classifying as more exposed low-skill workers
in low-tech manufacturing industry. The indicator has three values, increasing in ex-
posure to globalization: 2 if an employee is a blue collar in a manufacturing industry,
or self-employed in a low-tech industry; 1 if (s)he is a non-blue collar employee in
a manufacturing industry, or self-employed in a medium-tech industry; 0 otherwise.
Third, we use two measures of sentiments towards immigrants: a) whether the voter
would like fewer immigrants from low-wage countries; b) whether immigrants make
the country worse. We use these variables, particularly the first, to capture fear of
by watching only one-sided news. We cannot find any more precise measure of the quality of theinformation that people receive, and hence this information proxy is very noisy. This may be thereason for the fact that it turns out not to be significant in the regression on the party choice,whereas it is a significant regressor for the decision to participate, since watching political newscorrelates with mobilization.
17

displacement in the labor market due to potential arrival of cheaper labor.10
Trust in traditional politics and institutions. The ESS has several proxies
for confidence in institutions, governments and political parties. These indicators
tend to be highly correlated and thus hard to tell apart. We use two measures
separately: a) trust in political parties, which speaks directly to our model; b) average
trust in parties and institutions, constructed as the average of the trust towards the
country’s parliament, political parties, politicians and the European Parliament.
In all regressions we control for gender and political orientation, measuring the
latter with a dummy for “right” orientation. Needless to say, some variable can
proxy for more than one of the dimensions of heterogeneity that we have listed. For
instance gender may also reflect risk preferences and so may age.
Table 1 panel A shows summary statistics for these variables.
4.3 Identifying populist parties
To identify populist parties in Europe we rely on the classification proposed in the
most recent and comprehensive study on populism in Europe by van Kessel (2015).
van Kessel (2015) examines all parties that gained parliamentary representation af-
ter national elections between 2000 and 2013 in European countries.11 The period
and the countries covered by van Kessel match the ones covered by the ESS data.
van Kessel defines a party as populist if a) portrays “the people” as virtuous and
essentially homogenous; b) advocates popular sovereignty, as opposed to elitist rule;
c) defines itself against the political establishment, which is alleged to act against
the interest of the people. The presence of these features – which are all perfectly
consistent with the first component of the definition of populism of the Encyclopedia
10Empirically, using the panel data discussed in Section 5.2, we find that people who lose theirjob or experience a drop in income change their opinions towards immigrants. For instance, theybecome more supportive of constraining immigration from low wage countries. This is consistentwith Inglehart (1997) who shows that cultural traits may be determined by income.
11The countries covered are: Austria, Belgium, Bulgaria, Croatia, Cyprus, Check Republic, Den-mark, Estonia, Finland, France, Germany, Greece, Hungary, Iceland, Ireland, Italy, latvia, Lithua-nia, Luxemburg, Malta, The Netherlands, Norway, Poland, Portugal, Romania, Slovakia, Slovenia,Spain, Sweden, Switzerland, UK.
18

Table 1: Descriptive statisticsVariable Obs. Mean St. Dev. Min Max
A. Demand analysis
Vote for populist party 130,663 0.08 0.27 0 1
Voted 200,269 0.78 0.41 0 1
Education 218,573 12.65 3.93 0 25
TV total 218,130 4.23 2.05 0 7
TV politics 210,098 1.98 1.32 0 7
Age 217,724 47.86 18.47 14 100
Risk aversion 207,213 3.88 1.44 1 6
Unemploymen 217,445 0.13 0.34 0 1
Income difficulties 213,074 0.95 0.87 0 3
Explosure to globalization 218,573 0.02 0.17 0 2
Immigrants make country worse 208,634 4.95 2.25 0 10
Want less immigrants from outside EU 210,744 2.50 0.89 1 4
Female 218,303 0.53 0.50 0 1
Right wing 193,311 5.13 2.16 0 10
Trust in political parties 185,933 3.69 2.36 0 10
Trust in politicians 214,557 3.75 2.38 0 10
Trust in the European Parliament 197,558 4.49 2.42 0 10
Trust in National Parliament 213,065 4.54 2.57 0 10
Government satisfaction 209,799 4.36 2.44 0 10
Trust in parties and institutions (Princ. Comp.) 169,767 0.37 0.24 0 1
Health 218,343 3.84 0.91 1 5
B. Pseudo panel analysis
Trust in political parties 4,283 3.42 1.12 0 7
Unemploymen 4,898 0.12 0.11 0 1
Income difficulties 4,842 1.10 0.49 0 3
Explosure to globalization 4,899 0.02 0.04 0 1
Immigrants make country worse 4,899 5.24 0.88 2 9
Want less immigrants from outside EU 4,899 2.65 0.38 1 4
Risk aversion 4,842 2.88 0.56 1 5
Importance safeness 4,843 4.74 0.44 3 6
Education 4,899 11.48 2.32 2.88 18
Age 4,899 54.92 16.60 22 88
TV total 4,899 4.43 0.78 2 7
TV politics 4,899 2.15 0.51 1 7
C. Supply analysis
Populist parties 416 1.53 1.09 0 5
Income difficulties 323 1.29 0.49 1 3
Unemploymen 323 0.39 0.08 0 1
Immigrants make country worse 323 2.34 0.35 2 3
Mean (log) education 323 2.48 0.08 2 3
St. dev. of (log) education 323 0.34 0.07 0 1
Import p.c. 368 10.69 7.09 1 40
Trust in politicians 314 1.68 0.58 1 3
Trust in political parties 314 1.71 0.60 1 3
Check and balances 323 4.17 1.11 2 8
Fragmentation 322 0.73 0.10 0 1
D. Chapel Hill Expert Survey
Distance European integration 706 22.70 22.30 0 91
Distance European policy 704 36.60 43.30 0 239
Distance ideological issues 706 27.21 38.16 0 184
Distance policy issues 501 79.25 106.20 0 510
Total distance 500 51.95 85.16 0 521
The table shows summary statistics of the variables used to study demand (Panels A and B) and supply (PanelC) of populism. The constriction of the singles variables is discussed in the text and in Appendix A an B.
19

Britannica (the supply rhetoric ) – is detected using primary sources such as party
manifestos and speeches. To make sure that the classification is meaningful, van
Kessel consults also a pool of country experts that are asked to validate or reject
his classification by answering an ad hoc questionnaire. Using these criteria, van
Kessel singles out 57 populist parties distributed in 26 of the 33 countries exam-
ined.12 There are several advantages to this classification. First, it is based on a
clear set of attributes of what a populist party is in terms of political strategy, rather
than on subjective judgements. As explained in the introduction, the Encyclope-
dia’s definition of populism considers, on top of the anti-elite supply rhetoric, the
pandering to people’s fears and the shrouding of the future costs of their policies.
Ideally one would want to use all three dimensions to try to identify populist parties.
van Kessel essentially leverages on the first dimension. This is a sensible choice, as
the other two lack observability and would require more judgement to be empirically
implemented, whereas the “supply rhetoric” is observable.13 The other main advan-
tages of van Kessel’s characterization of populist parties are (1) that it covers all
relevant European countries and (2) that it allows the definition to be time varying,
so that a non-populist party may turn populist in a certain year, a feature which is
important for studying the supply side of populism.
Despite these merits, the classification unavoidably contains a certain amount of
judgment. To validate van Kessel’s classification, we compare it with two alternative
ones. The first is simply the one available in the ESS itself. As part of the background
documentation, the ESS reports whether a party is populist or not. The classifica-
tion is done by the ESS country experts. We prefer van Kessel’s classification for
two reasons: first, the ESS provides the classification only for the last three waves
while van Kessel covers every year in our sample. Second, the ESS classification does
not follow a pre-specified unique protocol and definition. Rather, whether to classify
a party as populist and the criteria used to define a populist party are left to the
discretion and judgment of the country experts. The second classification is the one
12Van Kessel’s definition is very close to that of Cas Mudde (2007); in fact, the parties identifiedas populist by both Mudde and van Kessel are essentially the same.
13Trump’s first statement in his inauguration speech was “..we are transferring power from Wash-ington D.C. and giving it back to you, the people” - an observable fact.
20

used by Inglehart and Norris (2016), based on the 2014 Chapel Hill Expert Survey
(CHES) data. Inglehart and Norris (2016) classify a party as populist if it scores
more than 80 points on a standardized 100-point scale built using thirteen selected in-
dicators contained in the CHES, where experts rate the position of European parties
on a range of characteristics such as support for traditional values, liberal lifestyles,
and multiculturalism, as well as their economic stance towards market deregulation,
state management of the economy, and preferences for either tax cuts or public ser-
vices (see below and Section 6 for more details about CHES). Out of 57 populist
parties in the van Kessel classification, 25 are defined as populist also in Inglehart
and Norris (2016) more stringent classification.14 Van Kessel’s classification is time
varying, hence it serves our goal well to trace populism supply over the years of our
study. Comparing the ESS classification with the van Kessel classification, it turns
out that out of 19 parties classified as populist in the last three ESS waves 14 are
also classified so by van Kessel and 12 by Inglehart and Norris.
Tables A1 and A2 in the Appendix list the populist parties based on the three
definitions.
4.4 Validating survey data on voting
Since true voting behavior is unobserved, the analysis of voting decision is based on
reported voting. Clearly, what people state in the ESS is not necessarily what they
actually did in the ballot box. Besides reported voting being potentially affected by
recall bias, people may be reluctant to report truthfully their voting choice. The
correlation between turnout in the ESS and actual turnout is quite high, 80%. Fur-
thermore, in a regression of ESS on actual turnout the slope coefficient is not statis-
tically different from 1, though there is tendency of the ESS to exceed actual turnout
on average. The correlation between ESS votes to populist parties conditional on
14Van Kessel (2015) assumes that populism is a set of ideas rather than a set of specific socio-economic policies. In his view, socio-economic positions on issues like European integration, unem-ployment, immigration should be treated as accompanying properties ( possibly non-stable becausepopulist parties are chameleonic in nature). Inglehart and Norris use a very different approachdefining a party as populist if it scores high on an index of progressive/liberal values.
21

participation and actual voting is lower, at 63%. This is not surprising. Besides some
reluctance to reveal voting choice, the survey may be representative of the country’s
adult population but not necessarily of the electorate. Furthermore, the low correla-
tion can be traced to seven observations out of 79 where the ESS understates actual
voting to the populist party by more than 25 percentage points. Dropping these
observations the correlation is 85% and a regression of average populist voting in the
ESS on actual voting yields a slope of 0.86 and a negative constant of 4.3 percentage
points. The joint hypothesis that the slope is 1 and the constant 0 is rejected, sug-
gesting that the ESS sample participants tend to understate systematically populist
voting. However, if this measurement error were positively correlated with prefer-
ences for populist voting, our estimates of the effect of economic insecurity on voting
would be a conservative estimate of the true effects.
4.5 Data on supply
We use the ESS mostly to study individual voting behavior - what we call the demand
side of populism. To study the supply side, we complement the ESS data with
several other datasets. First, we obtain data on national political institutions from
the World Bank Database of Political Institutions. Second, we obtain data on trade
with China, India and the rest of the world from the World Bank WITS statistics
(UN Comtrade). Finally, we use the five waves (1999, 2002, 2006, 2010, 2014) of
the Chapel Hill Expert Survey (CHES) to study whether populism, once it appears,
spills over to other non-populist parties. CHES reports for each party in each country
in our sample a measure of the party position on a set of relevant issues, which we
use to obtain measures of distance between the position of a non-populist party in
a country from that of the populist party in that country. Table 1, panel D shows
summary statistics of these measures, described in detail in Section 6.
22
5 Results on voters’ behavior
We first show results on the drivers of people vote for a populist party using the
ESS data. As argued, citizens make two decisions: a) whether to participate in
an election (participation decision); b) conditional on participation, which party to
support with their vote – in particular, whether to vote for a populist party or not
(voting decision). Clearly, countries that have no populist party (yet) in the ESS
wave-year do not belong to the sample. To account for the fact that the party
choice only applies to voters who participate in the election, itself a choice variable,
we estimate a two step Heckman probit model. In the first stage, we estimate the
probability of participation; in the second stage the probability of voting for the
populist party. As discussed in Section 3, participation in election will depend on
the same set of variables that affect the party choice but possibly with opposite signs:
that is, voters’ characteristics that increase the chances of voting for a populist party
may also discourage participation. For identification, we assume that at least one
personal characteristic affects the net benefit of voting (benefit-cost), but not the
choice of the party conditional on participation. We use one such instrument: a
measure of the health status of the individual. This variable affects the cost of going
to the poll and it seems plausible that per se it should not affect people preferences
for populist or non-populist parties, particularly when all other controls are included.
In all specifications we control for age and trust in political parties, we include
country-level fixed effects and ESS wave effects, and we run weighted regressions
using sampling weights to account for differences in sample size across countries.
Importantly, country fixed effects capture all the features of the country context that
may affect the success of populist platforms: e.g., the electoral system, the respon-
siveness of existing parties to salient political issues (such as competitive pressure
from immigrants), or the level of corruption.15 Our final dataset includes 134,834
observations from 24 European countries when estimating the specification with all
controls.
15These are some of the context variables that studies of populism (e.g. van Kessel, 2015) considercritical in explaining populists’ success.
23

Table 2 shows the results of the estimates of several specifications, each time
augmenting the set of controls. The first two columns show results of participation
and voting decisions controlling for risk and time preferences, education and infor-
mation about political matters, gender, political orientation and trust in political
parties. The decision to participate is strongly affected by health status: people in
good health are much more likely to participate, suggesting that health is a strong
instrument. The proxy for risk aversion has a significant positive effect on participa-
tion: participation is more likely among people who consider it important to avoid
taking risks. This measure has no effect on the choice of voting for a populist party.
Hence, we find no evidence supporting the idea that since the populist choice entails
risk it is more appealing for a risk tolerant voter. Age affects participation positively
but it has no effect on voting populist.
Education - our proxy for people’s ability to foresee the long term costs of current
policies - has a positive and precisely measured effect on participation in elections
and, conditional on participation, has a negative effect on the vote for a populist
party. This is consistent with the model prediction. Education is economically
key. Increasing education by 4 years (one sample standard deviation) increases the
participation rate by 19 percentage points (35% of the sample mean) and lowers the
probability of voting for a populist party by 1.75 percentage points - as much as 22%
of the sample mean. The proxy for political information, while having a significant
impact on the participation probability - more politically informed citizens are more
likely to participate - has no effect on voting for a populist party (see the brief
discussion on the reasonableness of these findings in footnote 9). .
Interestingly, women are less likely to participate, but, conditional on going to the
polls, they are also less likely to support populist platforms. People with orientation
to the right are more likely to participate and vote for a populist party - a finding
that is robust to specification and consistent with the right wing orientation of most
populist parties in Europe (e.g. van Kessel, 2015; Mudde, 2007). Finally, consistent
with the prediction of the model and our interpretation, we find that people with
greater confidence in political parties are more likely to participate in elections and
to vote for a non-populist party. Those who have lost faith in political parties are
24

more likely to give up expressing their vote, but if they do express it, they are more
likely to vote for a populist party. Trust in political parties is on a scale between
0 and 10; a drop by 5 points on this scale increases the probability of voting for
a populist party by 1 percentage point. Confronted with the unconditional sample
probability of voting for a populist party of 7.8%, this is a 11.5 percent increase
in the support for a populist platform. Similarly strong is the effect of trust in
political parties on participation: a drop in trust by 5 percentage points lowers the
chance of participation in elections by 8 percentage points - more than 10% of the
unconditional mean electoral turnout.
The second pair of columns add the proxies for economic insecurity. Overall, the
effect of these measures is clear: economic insecurity acts on two margins: it dis-
courages participation and increases the chance of voting for a populist party among
those who decide to exert their voting right. The effect on the participation margin
is more precisely estimated and very responsive to being unemployed, suffering an
income loss and being exposed to competition from immigrants; it is not affected
by exposure to globalization (once controlling for sentiment towards immigrants).
A vote for a populist party is more likely among those who suffer an income loss,
are exposed to globalization and to competition from immigrants. Having lost em-
ployment, instead has no statistically detectible effect on the vote for a populist
party, possibly because, as documented, those who lose their job refuse to partici-
pate rather than vote against the incumbent. The effects of economic insecurity are
quantitatively important on both the participation and the voting decisions. Being
unemployed lowers participation by 3.1 percentage points; feeling you live in diffi-
culty on current income, compared to living comfortably on current income, lowers
participation by 9.6 percentage points; while moving immigrants fears from the low-
est to the mean value lowers participation by 2 percentage points. Similarly, being
exposed to globalization increases the chance of voting for a populist party by 1.6
percentage points (20% of the sample mean), feeling you live in difficulty on current
income, compared to living comfortably, increases voting for a populist party by 1
percentage point (9% of the sample mean) while moving immigrants fears from the
lowest to the mean value increases the chances of voting for a populist party by more
25

Table 2: Main specification: Heckman probit estimates of populist party vote andparticipation in voting
(1) (2) (3)
Heckprobit Heckprobit Heckprobit
Populist Vote Populist Vote Populist Vote
Health 0.115*** 0.0818*** 0.0821***
(0.00695) (0.00786) (0.00817)
Risk aversion 0.00117 0.0241*** 0.00357 0.0275*** 0.00489 0.0270***
(0.00999) (0.00429) (0.0113) (0.00474) (0.0117) (0.00490)
ln(Age) -0.0265 1.142*** -0.101* 1.138*** -0.0869 1.131***
(0.0507) (0.0150) (0.0572) (0.0169) (0.0578) (0.0174)
ln(Education) -0.278*** 0.624*** -0.216*** 0.594*** -0.207*** 0.593***
(0.0442) (0.0200) (0.0510) (0.0229) (0.0519) (0.0238)
TV total 0.0172** -0.0283*** 0.000801 -0.0228*** 0.00125 -0.0210***
(0.00726) (0.00336) (0.00831) (0.00374) (0.00863) (0.00389)
TV politics -0.00324 0.0618*** 0.00135 0.0514*** 0.00180 0.0469***
(0.0109) (0.00506) (0.0122) (0.00564) (0.0127) (0.00582)
Unemployment -0.0317 -0.0947*** -0.0243 -0.0962***
(0.0447) (0.0189) (0.0464) (0.0195)
Income difficulties 0.0409** -0.0990*** 0.0325* -0.0980***
(0.0187) (0.00872) (0.0195) (0.00906)
Explosure globalization 0.117* -0.00661 0.123* -0.0164
(0.0701) (0.0382) (0.0735) (0.0397)
Less imm. no EU 0.0782*** -0.0205** 0.0708*** -0.0201**
(0.0182) (0.00842) (0.0191) (0.00873)
Imm. country worse 0.0406*** -0.0123*** 0.0374*** -0.0118***
(0.00755) (0.00332) (0.00791) (0.00345)
Trust in pol. parties -0.0190*** 0.0485***
(0.00697) (0.00312)
Trust in part. and inst. (PC) -0.230*** 0.426***
(0.0706) (0.0317)
Female -0.132*** -0.0473*** -0.128*** -0.0520*** -0.118*** -0.0529***
(0.0238) (0.0111) (0.0270) (0.0123) (0.0279) (0.0127)
Right wing 0.0621*** 0.0124*** 0.0448*** 0.0145*** 0.0447*** 0.0141***
(0.00553) (0.00258) (0.00645) (0.00294) (0.00667) (0.00306)
Observations 176,259 176,259 144,610 144,610 135,200 135,200
Wave FE YES YES YES YES YES YES
Country FE YES YES YES YES YES YES
Countries Kessel Kessel Kessel Kessel Kessel Kessel
The table shows Heckman probit estimates of the decisions to vote in the election (Vote) and the choice of voting for a pop-ulist party conditional on participation (Populist). Left hand side variables : a dummy if a voter has chosen a populist partyin the columns Populist and a dummy if (s)he has participated in the election in the column Vote. The excluded instrumentin the populist regression is an indicator of health status. All regressions include country and wave fixed effects. Robust stan-dard errors are shown in parenthesis. *** significant 1% or less; ** significant at 5%; * significant at 10% confidence level.
26
than 1.4 percentage points (17% of the sample mean). These effects are large if we
consider that the sample average of populist votes is 7.8%. The last pair of columns
shows estimates replacing trust towards political parties with the principal compo-
nent of trust towards political parties, politicians, the national parliament and the
European parliament. Results are unaffected.
The estimates in Table 2 restrict the effects of the various components of eco-
nomic insecurity on participation and on voting for populist parties to be the same
across European countries. Even though the distinctive feature of all populist par-
ties platforms is to offer short term protection - as we have advocated - populist
parties in different countries may stress different components of insecurity. Because
of this, the responses to each component may differ across countries. For instance,
in Northern Europe populist platforms may put more emphasis on immigration than
in Southern countries, while Southern European populists may emphasize more un-
employment arising from austerity policies. To check this possibility we have built
an indicator variable equal to 1 for Northern European countries (Germany, France,
The Netherlands, Belgium, Sweden, Finland, Denmark and Austria) and interacted
it with the five measures of insecurity in the estimates of the Heckman corrected
probit model. The estimates (unreported) show some evidence that vote to populist
parties among participants is less sensitive to income losses in Northern Europe; but
in these countries vote to populists is also less sensitive to the threat of immigrants.
On turnout, there is some evidence that Northern European citizens are less likely
to vote when they lose their job; yet, a joint test that the sensitivity to all measure
of economic insecurity is the same across all European countries cannot be rejected
(p-values 0.0023 and 0.001 in the populists voting and in the participation regression,
respectively).
In sum, the evidence shown is broadly consistent with the model implications.
Voting for populist parties is more likely among people experiencing economic in-
security and among people that have a harder time in foreseeing the future costs
of populist policies. The role of risk preferences is unclear. Voting for a populist
party is a risky option - which may require high risk tolerance to take it. But it may
be argued that gambling for resurrection may be the only option that loss averse
27

citizens, who ended up in the domain of economic losses, think is available to them.
Economic insecurity plays a quantitatively important direct role in explaining the
voting decisions of people that choose to participate in elections. However, there are
at least two other indirect important channels through which economic insecurity
shocks are crucial determinants of the populist wave: The first is through selection
of participants in elections. The second is through the effect of economic misfortune
and insecurity on people’s trust in incumbent parties. The first softens the effect of
economic insecurity on populist voting, the second amplifies it. We discuss each one
next.
5.1 Economic insecurity, participation and populist support
Changes in economic insecurity and confidence towards political parties affect the
success of a populist party, both because these variables affect the preferences of the
population of voters regarding the various parties and because they affect the indi-
vidual decision to express those preferences by actually participating in the elections.
Jointly, the two channels shape the effect of economic insecurity and confidence in
political parties on voting for a populist party conditional on participation. Because
economic insecurity results in a lower participation among those that suffer from it
the most, some people that have a higher chance of supporting a populist party do
not express their vote, resulting in a lower share of populist votes among the par-
ticipants. In other words, because of the selection induced by economic insecurity,
populist parties get a lower share of votes than if this selection effect were absent.
Accounting for selection is important and has been ignored in studies related to ours
(e.g. Inglehart and Norris, 2016). For instance, the marginal effect on voting for a
populist party of an increase in income difficulties would be 26% larger in the ab-
sence of any effect on participation, that of an increase in the fear of immigration 10%
larger and that of a drop in confidence in political parties 28% larger. The presence
of this (adverse to populists) selection effect determines an additional rationalization
of the rhetoric that characterizes populist parties (see e.g. Kitschelt and McGann,
1995; Hans-Georg, 2002): the anti-elite rhetoric is a tool to build populist-inclined
28
voter identity and raise their willingness to participate in elections.
5.2 Economic insecurity and trust in political parties
Economic insecurity can affect both participation in an election and voting for a
populist party because it affects people’s confidence in political parties. As Figure 1
documents, the sharp drop in income in Italy in 2009 and the dismal performance of
the economy since then are highly correlated with an impressive loss of confidence in
political parties. Needless to say, causality can in principle go both ways. A negative
shock to confidence in politics, taking place for whatever reason, may lead to a
sudden stop of the economy, for instance if debt holders were to reduce financing to
the government. This is the channel a substantial amount of literature has focused
on when trying to understand systematic and persistent differences in per-capita
GDP across countries (see e.g. Zak and Knack, 2001; Algan and Cahuc, 2010). This
literature emphasizes the relevance of trust not in politics but in people, which is
considered as a slow moving trait. A recent strand emphasizes the opposite causality
link that sees drops in confidence as caused by sharp drops in economic activity. This
literature focuses on movements in trust over time at the business cycles frequency
rather than on persistent differences in trust levels across communities. There is
evidence that recessions cause drops in people trust. Ananyev and Guriev (2016) are
able to isolate the causal effect of economic downturns on people’s trust during the
2009 recession in Russia, exploiting variation across regions in industrial structure
inherited by the Soviet Union, and noticing that capital-intensive and oil-related
industries are more responsive to shocks to GDP. They find that a drop in GDP
causes a sizable drop in trust in other people. The same logic can be used to argue,
perhaps even nore plausibly, that recessions can cause a drop in trust in political
parties and politicians, for instance because citizens blame incumbent parties (and
the government) for poor economic performance.
Table 3 shows correlations between measures of economic insecurity and trust in
political parties, average trust and a measure of people’s confidence in the govern-
ment, respectively, using cross sectional variation in the pooled ESS. Unambiguously,
29
all measures of economic insecurity are negatively correlated with trust in political
parties and institutions and with confidence in the government. For instance, people
who find it difficult to live with their current income, trust political parties 21% less
than the average citizen; and being unemployed has an equally sized negative effect.
Of course these correlations may just reflect unobserved heterogeneity - i.e. some
individual characteristics that are not controlled for that drive both the economic
insecurity measures and people’s trust/confidence measures. To address this prob-
lem, we follow Deaton (1985) and use a pseudo panel constructed from the sequence
of ESS waves. We group the data into eleven 5-year age cohorts of male and female
individuals in each country, respectively. Unobserved heterogeneity is taken care of
by cohort-specific fixed effects.16
Figure 2 shows simple bivariate correlations between the change in trust in po-
litical parties and the change in unemployment, income difficulty and exposure to
immigrant competition among the pseudo panel cohorts. In all cases an increase
in economic insecurity experienced by the age cohorts leads to a decrease in trust
in political parties. Table 4 shows controlled fixed-effects pseudo panel regressions
of our confidence indicators on our measures of economic insecurity and individual
time varying controls (the measure of risk aversion, age, exposure to the media) as
well as time effects common to all cohorts. With the exception of the exposure to
globalization, which has no statistically significant effect on trust in political parties,
all other measures have a negative and statistically significant effect. Because these
are fixed effects regressions, results cannot be driven by unobserved heterogeneity.17
They are consistent with the idea that a deterioration in individual economic security
causes a loss in confidence in political parties and institutions.18 Similar results can
16Our pseudo panel consists of 785 age-country-year-of-birth groups. Cohorts are relatively large,with 294 observations on average. This reassures that measurement error in building the cohortmeans is likely to be negligible. Dropping cohorts with fewer than 50 observations (8% of the total)leaves our results unchanged.
17Of course, the pseudo panel regressions identify the causal effect of economic insecurity ontrust in political parties that is due to: a) individuals in the cohort changing their attitudes whenthey experience insecurity directly; b) changes in trust towards parties in that cohort reflectinggroup effects. For instance, an individual in a given cohort that loses confidence in political partiesbecause he/she observes that other members of the same cohort have experienced unemployment.
18The reverse causality - an individual who revises trust towards parties downwards and because
30

Table 3: Trust and Insecurity(1) (2) (3)
Trust parties Trust PC Gov. satis.
Unemployment -0.190*** -0.0230*** -0.264***
(0.0294) (0.00319) (0.0299)
Income difficulties -0.246*** -0.0275*** -0.367***
(0.0132) (0.00140) (0.0133)
Explosure globalization -0.0409 -0.00522 -0.0205
(0.0732) (0.00755) (0.0635)
Less imm. no EU -0.0659*** -0.00809*** -0.0352***
(0.0131) (0.00137) (0.0135)
Imm. country worse -0.201*** -0.0221*** -0.215***
(0.00524) (0.000560) (0.00546)
ln(Education) -0.178*** -0.0104*** -0.240***
(0.0334) (0.00364) (0.0355)
ln(Age) -0.352*** -0.0172*** -0.101***
(0.0255) (0.00270) (0.0251)
Risk aversion 0.000799 0.00162** 0.0182**
(0.00733) (0.000770) (0.00752)
TV total -0.0209*** -0.00298*** -0.000440
(0.00566) (0.000611) (0.00585)
TV politics 0.118*** 0.0106*** 0.0383***
(0.00879) (0.000933) (0.00897)
Female 0.0782*** 0.0105*** -0.00916
(0.0182) (0.00194) (0.0188)
Right wing 0.0729*** 0.00918*** 0.144***
(0.00487) (0.000512) (0.00509)
Observations 144,671 135,258 160,455
R-squared 0.211 0.213 0.178
Wave FE YES YES YES
Country FE YES YES YES
Countries Kessel Kessel Kessel
The table shows regressions of measures of confidence in parties (first column), political system and institutions (an average oftrust in political parties, politicians, the national and the European parliament) (second column) and the government (third col-umn) on measures of economic insecurity and other controls. All regressions include country and wave fixed effects. Robuststandard errors are shown in parenthesis. *** significant 1% or less; ** significant at 5%; * significant at 10% confidence level.
31
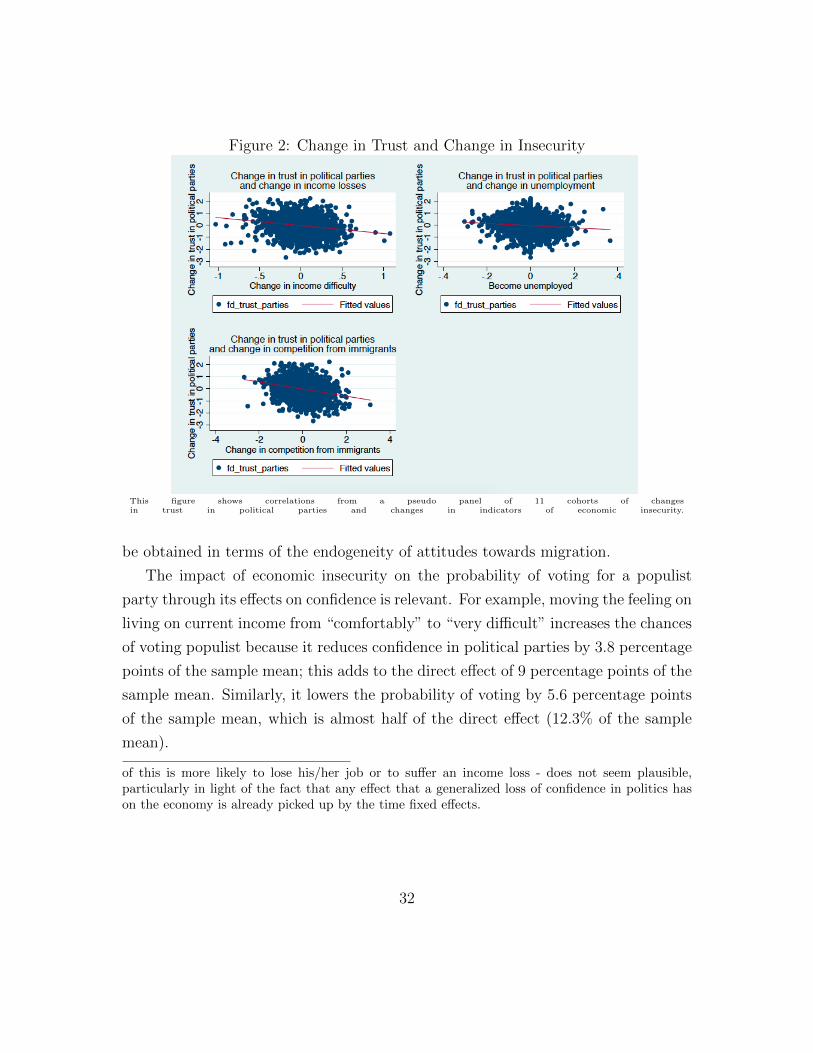
Figure 2: Change in Trust and Change in Insecurity
This figure shows correlations from a pseudo panel of 11 cohorts of changesin trust in political parties and changes in indicators of economic insecurity.
be obtained in terms of the endogeneity of attitudes towards migration.
The impact of economic insecurity on the probability of voting for a populist
party through its effects on confidence is relevant. For example, moving the feeling on
living on current income from “comfortably” to “very difficult” increases the chances
of voting populist because it reduces confidence in political parties by 3.8 percentage
points of the sample mean; this adds to the direct effect of 9 percentage points of the
sample mean. Similarly, it lowers the probability of voting by 5.6 percentage points
of the sample mean, which is almost half of the direct effect (12.3% of the sample
mean).
of this is more likely to lose his/her job or to suffer an income loss - does not seem plausible,particularly in light of the fact that any effect that a generalized loss of confidence in politics hason the economy is already picked up by the time fixed effects.
32

Table 4: Trust in Parties and Economic Insecurity - Pseudo Panel EstimatesTrust parties
Unemployment -0.703***
(0.202)
Income difficulties -0.990***
(0.0781)
Less imm. no EU -0.0365
(0.0730)
Explosure globalization 0.0695
(0.375)
Imm. country worse -0.277***
(0.0318)
ln(Education) -0.585***
(0.168)
ln(Age) -0.0786
(0.474)
Risk aversion -0.223***
(0.0486)
Importance safeness 0.0149
(0.0521)
TV total 0.0341
(0.0370)
TV politics -0.0809
(0.0514)
Observations 3,358
Number of id 756
R-squared 0.205
Wave FE YES
Countries Kessel
The table shows regression results of trust in political parties and measures of economic insecurity in a pseudopanel of 11 cohorts constructed from the ESS surveys include individual cohort fixed effects and thus corre-lation exploits only time variation. All regressions include wave fixed effects. Robust standard errors areshown in parenthesis. *** significant 1% or less; ** significant at 5%; * significant at 10% confidence level.
33
6 The supply side of populism
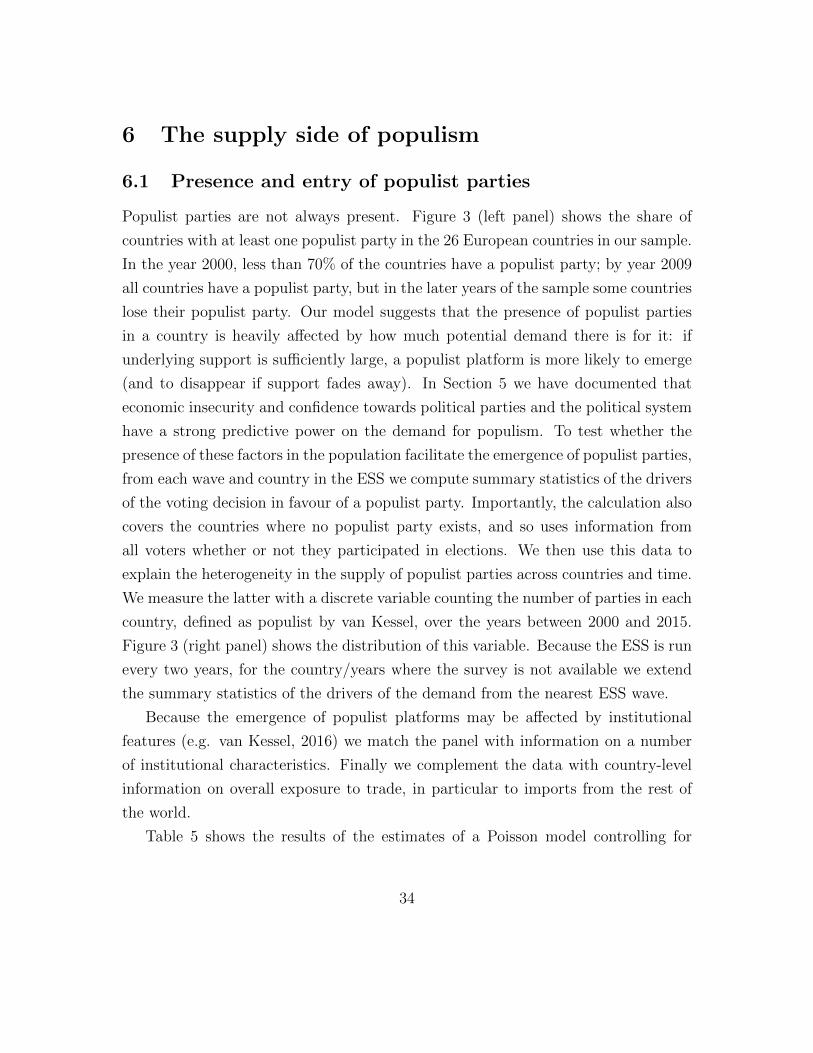
6.1 Presence and entry of populist parties
Populist parties are not always present. Figure 3 (left panel) shows the share of
countries with at least one populist party in the 26 European countries in our sample.
In the year 2000, less than 70% of the countries have a populist party; by year 2009
all countries have a populist party, but in the later years of the sample some countries
lose their populist party. Our model suggests that the presence of populist parties
in a country is heavily affected by how much potential demand there is for it: if
underlying support is sufficiently large, a populist platform is more likely to emerge
(and to disappear if support fades away). In Section 5 we have documented that
economic insecurity and confidence towards political parties and the political system
have a strong predictive power on the demand for populism. To test whether the
presence of these factors in the population facilitate the emergence of populist parties,
from each wave and country in the ESS we compute summary statistics of the drivers
of the voting decision in favour of a populist party. Importantly, the calculation also
covers the countries where no populist party exists, and so uses information from
all voters whether or not they participated in elections. We then use this data to
explain the heterogeneity in the supply of populist parties across countries and time.
We measure the latter with a discrete variable counting the number of parties in each
country, defined as populist by van Kessel, over the years between 2000 and 2015.
Figure 3 (right panel) shows the distribution of this variable. Because the ESS is run
every two years, for the country/years where the survey is not available we extend
the summary statistics of the drivers of the demand from the nearest ESS wave.
Because the emergence of populist platforms may be affected by institutional
features (e.g. van Kessel, 2016) we match the panel with information on a number
of institutional characteristics. Finally we complement the data with country-level
information on overall exposure to trade, in particular to imports from the rest of
the world.
Table 5 shows the results of the estimates of a Poisson model controlling for
34

Figure 3: The Rise of Populism.7
.8.9
1Sh
are
of c
ount
ries
with
a p
opul
ist p
arty
2000 2005 2010 2015year
Share of countries witha populist parties
050
100
150
200
Num
ber o
f obs
erva
tions
0 2 4 6Number of populist parties
Distribution of the number of populist parties
The left panel shows the time evolution of the share of European countries in the ESS sample that have atleast one populist party. The left panel shows the histogram of the number of populist parties in our sample.
year fixed effects, to account for the trend in populist parties documented in Figure
3. Since the demand drivers of populist voting may have a different effect on the
emergence of a populist platform, depending on how concentrated or spread out in
the population is the specific driver, we scale the mean of the variable with its cross
sectional standard deviation. The table shows that the economic variables that drive
individual voting for a populist party help explain the existence and number of pop-
ulist parties across countries. The supply of populism is higher when/where more
people in the population feel it is very difficult to live on their current income, where
a larger share have experienced unemployment and where more people feel threat-
ened by immigrant competition - that is, where economic insecurity is more spread
in the population. It is lower instead where average education is higher and more
unevenly distributed in the population. All these effects are fully consistent with
the predictions of the model. We find that empirically, for the supply of populism,
it is important to distinguish between trust in politicians and trust in political par-
ties: a higher average trust in politicians in the population discourages the supply of
populism, while a higher trust in political parties, ceteris paribus, raises it. Both ef-
fects are statistically significant. Interestingly, the country exposure to globalization,
35
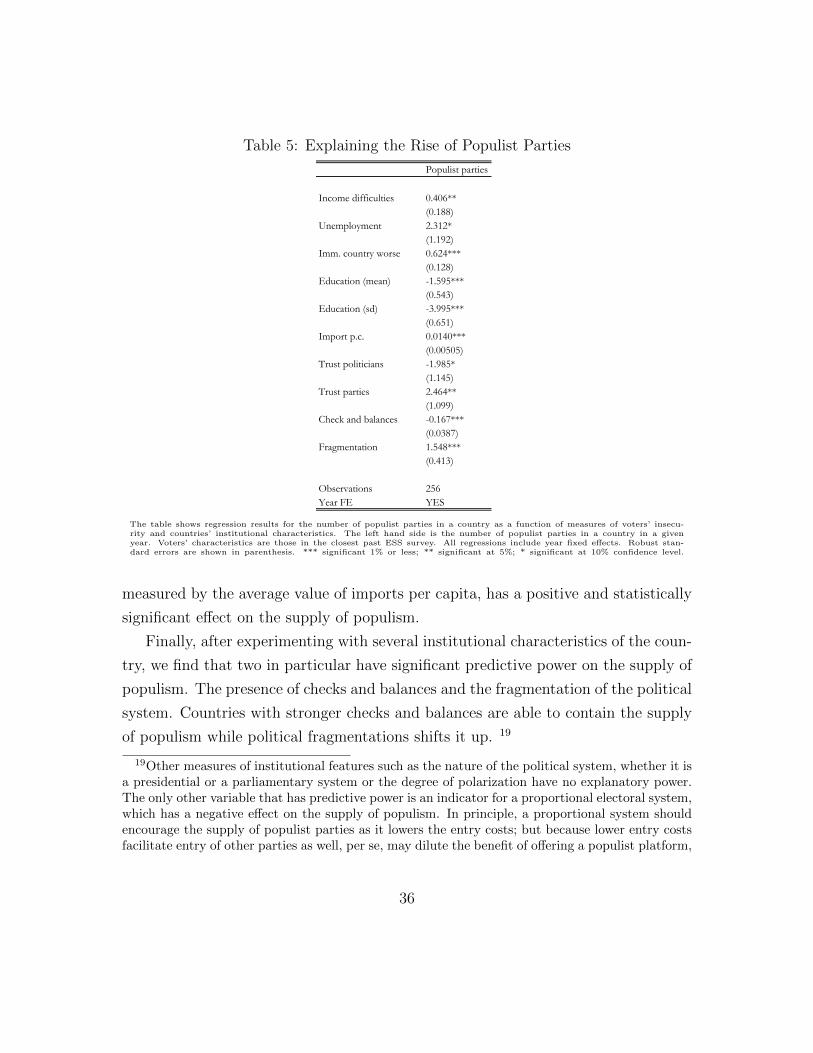
Table 5: Explaining the Rise of Populist Parties
Populist parties
Income difficulties 0.406**(0.188)
Unemployment 2.312*(1.192)
Imm. country worse 0.624***(0.128)
Education (mean) -1.595***(0.543)
Education (sd) -3.995***(0.651)
Import p.c. 0.0140***(0.00505)
Trust politicians -1.985*(1.145)
Trust parties 2.464**(1.099)
Check and balances -0.167***(0.0387)
Fragmentation 1.548***(0.413)
Observations 256Year FE YES
The table shows regression results for the number of populist parties in a country as a function of measures of voters’ insecu-rity and countries’ institutional characteristics. The left hand side is the number of populist parties in a country in a givenyear. Voters’ characteristics are those in the closest past ESS survey. All regressions include year fixed effects. Robust stan-dard errors are shown in parenthesis. *** significant 1% or less; ** significant at 5%; * significant at 10% confidence level.
measured by the average value of imports per capita, has a positive and statistically
significant effect on the supply of populism.
Finally, after experimenting with several institutional characteristics of the coun-
try, we find that two in particular have significant predictive power on the supply of
populism. The presence of checks and balances and the fragmentation of the political
system. Countries with stronger checks and balances are able to contain the supply
of populism while political fragmentations shifts it up. 19
19Other measures of institutional features such as the nature of the political system, whether it isa presidential or a parliamentary system or the degree of polarization have no explanatory power.The only other variable that has predictive power is an indicator for a proportional electoral system,which has a negative effect on the supply of populism. In principle, a proportional system shouldencourage the supply of populist parties as it lowers the entry costs; but because lower entry costsfacilitate entry of other parties as well, per se, may dilute the benefit of offering a populist platform,
36

6.2 Non-populist parties reaction to populism
One hypothesis, consistent with the electoral competition consequences of the entry
of a populist party, is that non-populist parties will adapt their political platforms
mimicking that of a successful populist party. To test this implication we rely on
the five waves of the Chapel Hill Expert Survey (CHES). For each of a list of several
issues (see Appendix B for a complete description), the CHES reports the position of
the party on a scale between 0 and 10 (for some issues the scale is between 1 and 7;
in this case we rescale to a 0-10 scale). To assess the party position CHES relies on a
pool of experts in each country. For instance, on the issue of deregulation /regulation
the position of the party is described by a number, between 0 and 10, where 0 means
strongly opposes deregulation and 10 strongly supports deregulation. Numbers in
between reflect intermediate positions on deregulation. We disregard issues that are
only present in one or two surveys and focus on those that are assessed in all five
or at least three surveys. We group positions into four families: overall European
integration (P EI); European policy (P EU, obtained summing the scores on three
issues: powers of European institutions, European cohesion policy, and European
Union foreign and security policy); position on ideological issues (P ID, obtained
summing the scores on three issues: general ideological stance on left/right dimen-
sion, stance of intensity of government intervention in the economy, position on the
libertarian versus traditional/authoritarian stance); and an index of the positions on
a set of eleven policy issues (P PD: government expenditure versus taxation, dereg-
ulation, redistribution of wealth, civil liberties versus law and order, social lifestyle,
religious principles in politics, immigration policy, multiculturalism, urban versus
rural interests, political decentralization to regions/localities and position towards
ethnic minorities). The first three indeces are available for all surveys, the last one
for the last three waves. In addition we build an overall measure of the party position
(P total) by summing the scores on the four indexes; of course, this total index is
defined only for the last three ways.
To compare platforms we proceed as follows. Let yicjt denote the position of party
as it may leave a lower share of votes on the table.
37
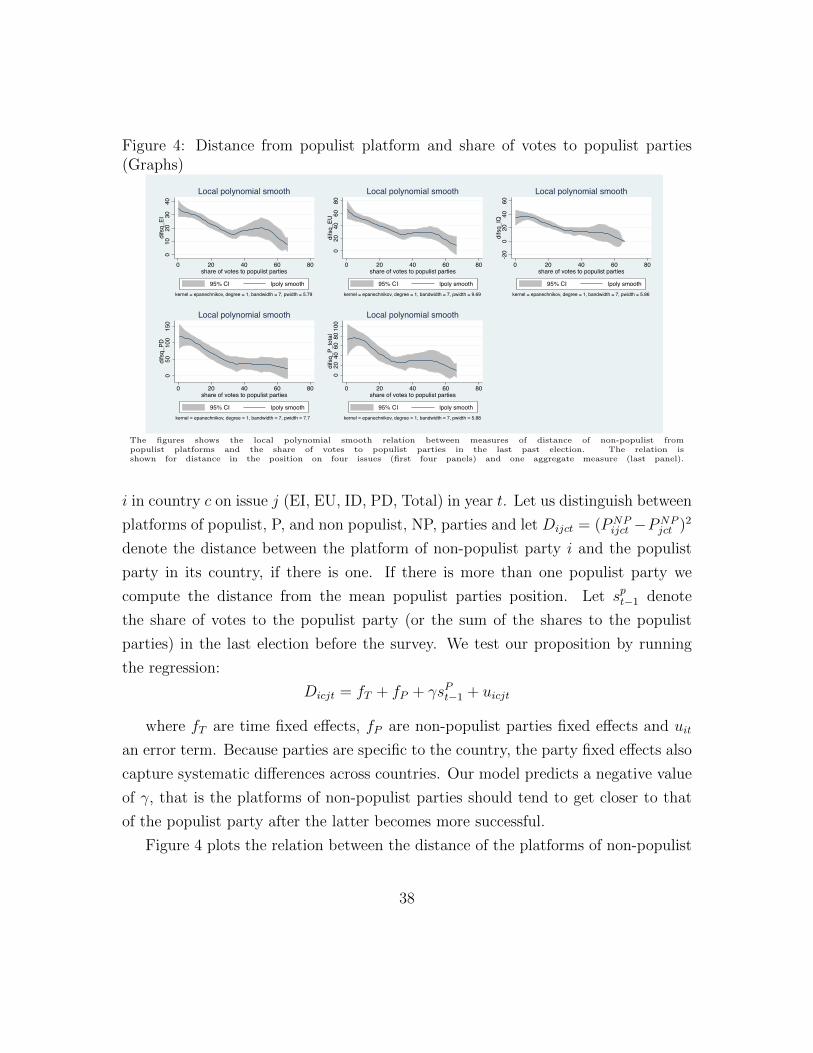
Figure 4: Distance from populist platform and share of votes to populist parties(Graphs)
010
2030
40di
fsq_
EI
0 20 40 60 80share of votes to populist parties
95% CI lpoly smoothkernel = epanechnikov, degree = 1, bandwidth = 7, pwidth = 5.79
Local polynomial smooth
020
4060
80di
fsq_
EU
0 20 40 60 80share of votes to populist parties
95% CI lpoly smoothkernel = epanechnikov, degree = 1, bandwidth = 7, pwidth = 9.69
Local polynomial smooth
-20
020
4060
difs
q_IQ
0 20 40 60 80share of votes to populist parties
95% CI lpoly smoothkernel = epanechnikov, degree = 1, bandwidth = 7, pwidth = 5.86
Local polynomial smooth
050
100
150
difs
q_PD
0 20 40 60 80share of votes to populist parties
95% CI lpoly smoothkernel = epanechnikov, degree = 1, bandwidth = 7, pwidth = 7.7
Local polynomial smooth
020
4060
8010
0di
fsq_
P_to
tal
0 20 40 60 80share of votes to populist parties
95% CI lpoly smoothkernel = epanechnikov, degree = 1, bandwidth = 7, pwidth = 5.88
Local polynomial smooth
The figures shows the local polynomial smooth relation between measures of distance of non-populist frompopulist platforms and the share of votes to populist parties in the last past election. The relation isshown for distance in the position on four issues (first four panels) and one aggregate measure (last panel).
i in country c on issue j (EI, EU, ID, PD, Total) in year t. Let us distinguish between
platforms of populist, P, and non populist, NP, parties and let Dijct = (PNPijct −PNP
jct )2
denote the distance between the platform of non-populist party i and the populist
party in its country, if there is one. If there is more than one populist party we
compute the distance from the mean populist parties position. Let spt−1 denote
the share of votes to the populist party (or the sum of the shares to the populist
parties) in the last election before the survey. We test our proposition by running
the regression:
Dicjt = fT + fP + γsPt−1 + uicjt
where fT are time fixed effects, fP are non-populist parties fixed effects and uit
an error term. Because parties are specific to the country, the party fixed effects also
capture systematic differences across countries. Our model predicts a negative value
of γ, that is the platforms of non-populist parties should tend to get closer to that
of the populist party after the latter becomes more successful.
Figure 4 plots the relation between the distance of the platforms of non-populist
38

parties from those of the populist and the share of votes to the populist party in
the last election before the survey for each of the issues and the total index. To
pick up possible non-linearities we plot a local polynomial regression, together with
the 95% confidence band. Interestingly, in all issues the distance falls after populist
parties gain consensus, consistent with the model prediction. Table 6 shows the
estimates of the linear regression specified above. The results confirm the visual
inspection of Figure 4: as populist parties gain support, non-populist parties seem
to adapt their platforms to reduce the distance from that of the successful populist
party. The effects are substantial: increasing the share of votes to the populist party
by one standard deviation (16 percentage points) reduces the distance between the
non-populist and populist overall platforms by 33% of the sample mean.
Hence, just counting the number of populist parties, or their share of votes/seats
in elections, understates the supply of populist policies in a country.
Table 6: Distance from populist platform and share of votes to populist parties(Empirics)
Dependent variable Coefficient Std. Err. Year FE Obs. R2
(1) P_EI -0.365*** (0.0904) YES 397 0.923(2) P_EU -0.128 (0.1771) YES 396 0.906(3) P_IQ -0.407** (0.1438) YES 397 0.923(4) P_PD -1.408** (0.5896) YES 286 0.815(5) P_total -1.106* (0.5831) YES 286 0.907
The table shows the regression of the distance between the position of non-populist parties and that of the populist partyon four separate issues and the share of votes to the populist parties in the last past election. The last row showsthe regression results for an overall measure of distance. All regressions include year fixed effects. Robust standard er-rors are shown in parenthesis. *** significant 1% or less; ** significant at 5%; * significant at 10% confidence level.
7 Conclusions
We can describe the situation of Western countries in the last decade as a global
crisis that has affected both markets and sovereign states at the same time, leaving
people without a safety net. This has not been the case previously: the crisis in
the 70s was mainly a market crisis, while various types of state crises in the 90s
were government crises in a context of markets thriving. The rare combination of
markets and governments’ inability to guarantee security has shaken the confidence
39

in traditional political parties and institutions, facilitating an increase in fear, in turn
aggravated by threats such as mass migration. This paper documents how this global
dual crisis affects the demand and supply of populism systematically, considering at
the same time effects on turnout, on entry decisions, and on electoral competition.
40

References
[1] Acemoglu, Daron, Georgy Egorov and Konstantin Sonin (2013), “A Political
Theory of Populism”, Quarterly Journal of Economics, 771-805.
[2] Autor, David , David Dorn, Gordon Hanson and Kaveh Majlesi (2016), “Im-
porting Political Polarization? The Electoral Consequences of Rising Trade
Exposure”, NBER Working Paper No. 22637.
[3] Algan Yann and Pierre Cahuc, (2010), “Inherited Trust and Growth”, American
Economic Review, 100 (5): 2060-92.
[4] Ananyev Maxim and Sergei Guriev (2016), “Effect of Income on Trust: Evidence
from the 2009 Economic Crisis in Russia”, WP Science Po, Paris.
[5] Becker, Sascha O. , Thiemo Fetzer and Dennis Novy (2016), “Who Voted for
Brexit? A Comprehensive District-Level Analysis”, Warwick University WP N.
305.
[6] Blais, Andre (2000), “To vote or not to vote?: The merits and limits of ratio-
nalchoice theory.” University of Pittsburgh Press.
[7] Boix, Carles (1999), “Setting the Rules of the Game: The Choice of Electoral
Systems in Advanced Democracies”, The American Political Science Review, 93
(3), 609-624.
[8] Deaton, Angus (1985) “Panel data from time series of cross-sections”, Journal
of Econometrics, 30 (1-2), 109?26.
[9] Colantone, Italo and Piero Stanig (2016), “Global Competition and Brexit”,
Bocconi University, WP 2016-44.
[10] Di Tella, Rafael, and Julio J. Rotemberg (2016), “Populism and the Return
of the ’Paranoid Style’: Some Evidence and a Simple Model of Demand for
Incompetence as Insurance Against Elite Betrayal.” Harvard Business School
Working Paper, No. 17-056.
41
[11] Dornbusch, Rudiger, and Sebastian Edwards, eds., (1991), “The Macroeco-
nomics of Populism in Latin America” University of Chicago Press, Chicago.
[12] Gidron, Noam and Bart Bonikowski (2013), “Varieties of Populism: Literature
Review and Research Agenda”, Harvard University, Weathgerhead Center for
Internationakl Affairs, WP n. 13.
[13] Golder, Dawn (2016), “Far Right Parties in Europe”, Annual Review of Political
Science, 19 (1): 477-497.
[14] Hans-Georg, Betz (2002), “Conditions favouring the success and failure of radi-
cal right-wing populist parties in contemporary democracies?, in Yves Meny and
Yves Surel (Eds), “Democracies and the Populist Challenge,” Springer, Berlin.
[15] Inglehart Roland F. (1997), “Modernization and Post-modernization: Cultural
Economic and Political Change in 43 Societies”, Princeton University Press.
[16] Inglehart Ronald F. and Pippa Norris (2016), “Trump, Brexit, and the Rise
of Populism: Economic Have-Nots and Cultural Backlash”, Harvard Kennedy
School RWP16-026.
[17] Jensen, J. Bradford, Dennis P. Quinn, and Stephen Weymouth, (2016), ”Win-
ners and Losers in International Trade: The Effects on U.S. Presidential Voting.”
NBER Working Paper No. 21899.
[18] Hainmueller, J. and Michael Hiscox (2006): “Learning to Love Globalization:
Education and Individual Attitudes Toward International Trade,” International
Organization, 60:2, 469-498.
[19] Kitschelt, H. and Anthony J. McGann (1995), “The Radical Right in West-
ernEurope.” Ann Arbor: University of Michigan Press.
[20] Kriesi, Hanspeter (2014), “The Populist Challenge,” West European Politics,
37:2, 361-378.
42
[21] Kriesi, H. and Takis Papas (Eds) (2016), “European Populism in the Shadow
of the Great Recession,” ECPR Press, Colchester UK.
[22] Lucassen, Geertje, and Marcel Lubbers (2012): “Who Fears What? Explaining
Far-Right-Wing Preference in Europe by Distinguishing Perceived Cultural and
Economic Ethnic Threats.” Comparative Political Studies, 45(5), 547-74.
[23] March, Luke and Cas Mudde (2005), “What’s left of the radical left? The
European radical left after 1989: Decline and mutation”, Comparative European
Politics 3 (1): 23-49.
[24] March, Luke (2007), “Radical left parties in Euirope”, Routledge, Oxford UK.
[25] Mudde, Cas (2007), “Populist radical right parties in Europe”, Cambridge Uni-
versity Press, Cambridge UK.
[26] Mudde, Cas and Cristobal Rovira Kaltwesser (2017), “Populism”, Oxford Uni-
versity Press, Oxford UK.
[27] Muller, Jean-Werner (2016), “What is Populism”, University of Pennsivania
Press, Philadelphia.
[28] Norris, Pippa (2005), “Radical Right. Voters and Parties in the Electoral Mar-
ket”, Cambridge University Press, Cambridge UK.
[29] Pauwels, T (2014), “Populism in Western Europe. Comparing Belgium, germany
and the Netherlands. Routledge, New York, USA.
[30] Sachs, Jeffrey (1989), “Social Conflict and Populist Policies in latin America”,
NBER WP 2897.
[31] Schumacher, Gijs (2016): “Do Mainstream Parties Adapt to the Welfare Chau-
vinism of Populist Parties?” Party Politics, 22(3), 300-12.
[32] Stavrakakis, Yannis and Giorgos Katsambekis (2014), “Left-wing populism in
the European periphery: the case of SYRIZA”, Journal of Political Ideologies
19 (2): 119-142.
43
[33] Steiner Nils D. and Christian W. Martin, (2012), “Economic Integration, Party
Polarisation and Electoral Turnout,” West European Politics Vol. 35 (2): 238-
265.
[34] Bohmelt, Ezrow, Lehrer, and Ward (2016): “Party Policy Diffusion,” American
Political Science Review, 110 (2): 397-410.
[35] Van Kessel, Stijn (2015), “Populist Parties in Europe. Agents of Discontent?”,
Palgrave MacMillan London.
[36] Zak, Paul J. and Stephen Knack (2001), “Trust and Growth”, The Economic
Journal , 111 (470): 295-321.
44

Appendix
A Populist parties
Table A1 lists parties that are defined as populist by van Kessel (2016) on the one
hand and by and Norris & Inglehart (2016) on the other. Table A2, lists all partiues
defiuned as popilist in the European Social Survey’s Appendixes, and compares the
ESS classification with those of van Kessel’s and Norris & Inglehart’s. It is worth
noting that Table A2 presents only the intersection of parties: (i) defined as populist
by the ESS, (ii) which received a vote share large enough to be considered by van
Kessel in his study, (iii) that are present in the countries analysed by van Kessel.
These filters leave out the majority of parties defined as populist in the ESS, which are
not of direct interest for this work. Notice also that the ESS provides descriptions on
parties only for waves 5, 6 and 7, which partly explains the reduction in the number
of partioes compared to Table A1.
B Political platforms
We obtain innformation on parties political platformsafrom the five waves of the
Chapel Hill Expert Survey (CHES). For each of a list of several issues the CHES
reports the position of the party on a scale either between 1 and 7 or between 0 and
10. Positions are grouped in fours families: i) overall european integration (P EI); ii)
11 issues on European policy (P EU); 3 position on ideological issues (P ID) and 17
positions on policy issues (P PD). Table A3 lists the issues covered for each family,
the scale on which the position is reported and the survey years it is available in
CHES. To make sure we have enough coverage over time, we build the EU index
P EU usimng the the position on te three issues covered in all 5 surveys (three
issues, highlithed in italics in the table) and construct the P PD index using the 11
positions vovered in three surveys (gain highligthed in italics in the table).
45

Table A1: Comparison Kessel (K) and Norris & Inglehart (N&I)
Country Party Kessel N&IAT FPO 1 1AT Alliance for the Future of Austria 1AT Team Stronach 1BE Vlaams Blok 1 1BE FRONT NATIONAL 1BE List Dedecker 1BG NDSV 1BG Coalition Ataka 1 1BG Law, Order and Justice (Red, Zakonnost, Spravedlivost) 1BG Citizens for European Development of Bulgaria (GERB) 1BG VMRO-BND Bulgarian National Movement 1BG NFSB National Front for the Salvation of Bulgaria 1BG HSS Croatian Peasants Party 1CH Swiss People's Party 1 1CH Swiss Democrats 1CH Lega dei Ticinesi 1CH Geneva Citizen's Movement 1CZ ANO 1CZ Public Affairs (Veci Verejne) 1CZ Usvit 1 1DE Die Linke (The Left) 1DE NPD National Democratic Party 1DE AfD Alternative for Germany 1DK Dansk Folkeparti 1 1ES Podemos 1FI True Finns 1 1FR FN (Front National) 1 1FR MPF Popular Republican Movement 1GB British National Party 1 1GB UK Independence Party 1GB NF National Front 1GR SYRIZA 1 1GR ANEL 1 1GR XA Golden Dawn 1GR LAOS Popular Orthodox Rally 1GR ND New Democracy 1HR HSP-AS 1 1HR HSS Croatian Peasants Party 1HR HDSSB Croatian Democratic Alliance of Slavonia and Baranja 1HR HSP Croatian Party of Rights 1HR HDZ Croatian Democratic Union 1
46

Country Party Kessel N&IHU FYD-HDF Fed.of Young Democrats&Hungarian Dem.Forum 1 1HU Justice and Life Party (MIEP) 1HU Movement for a Better Hungary 1 1HU FIDESZ-MPSZ 1 1IE Sinn Fein 1IS Citizen's Movement (BF) 1IT Forza Italia 1IT Lega Nord 1 1IT Movimento Cinque Stelle 1 1IT Il Popolo della Liberta (PdL) 1IT Fdl Brothers of Italy 1LT Labour Party (DP) 1LT Party "Order and Justice" (TT) 1LT DK The Way of Courage 1LU Alternative Democratic Reform Party 1 1LV For Fatherland and Freedom/ LNNK 1LV All for Latvia 1LV NA National Alliance 1NL List Pim Fortuyn 1NL Liveable Netherlands 1NL Geert Wilders' Freedom Party (PVV) 1 1NL SGP Political Reformed Party 1NO Progress Party (FrP) 1 1NO Democrats 1PL Samoobrona Rzeczypospolitej Polskiej 1PL Prawo i Sprawiedliwosc 1 1PL SP United Poland 1PL KNP Congress of the New Right 1RO Greater Romania Party 1RO People's Party 1 1SE Sweden Democrats 1 1SI Slovene National Party (SNS) 1SI SDS Slovenian Democratic Party 1SI SDS Slovenian Democratic Party 1SK HZDS Movement for a Democratic Slovakia 1SK SMER 1SK KDH Christian Democratic Movement 1 1SK Slovak National Party (SNS) 1 1SK Ordinary People and Independent Personalities (OLaNO) 1TR MHP National Action Party 1
47

Table A2: Comparison ESS, Kessel (K) and Norris & Inglehart (N&I)
Country Party ESS Kessel N&IAT Freedom Party of Austria 1 1 1AT Team Stronach for Austria 1 1CH Swiss People's Party 1 1 1CH Bourgeois (Conservative)-democratic Party 1CH Ticino League 1 1CZ Dawn of Direct Democracy of Tomio Okamura (Usvit) 1 1 1CZ Public Affairs 1 1DE Alternative for Germany 1 1DK Danish People's Party 1 1 1GR LAOS Popular Orthodox Rally 1 1HU Fidesz-Christian Democratic Allience 1 1 1HU Hungarian Democratic Forum 1 1 1IE Soldiers of Destiny 1IT Five Star Movement 1 1 1LT The Way of Courage 1 1 1NL Party for Freedom 1 1 1NL Proud of the Netherlands - List Verdonk 1NO Progress Party 1 1 1PO Self-Defence 1 1
48

Table A3: Chapel Hill Expert Survey
Issue Scale Availability N. waves asked
General question1. European Integration 1 (SO) -7 (SF) 1999-2014 5
EU Policy1. Powers of European Parliament 1 (SO) -7 (SF) 1999-2014 52. Tax Harmonization 1 (SO) -7 (SF) 1999 13. Internal Market 1 (SO) -7 (SF) 2002-2014 44. Common Employment Policy 1 (SO) -7 (SF) 1999, 2014 25. EU authority over member states budgets
1 (SO) -7 (SF) 2014 1
6. EU agriculture spending 1 (SO) -7 (SF) 2002 17. EU cohesion on region al policy 1 (SO) -7 (SF) 1999-2014 58. Common policy on environment 1 (SO) -7 (SF) 1999, 2002 29. Common policy on political asylum 1 (SO) -7 (SF) 1999, 2002 210. EU foreign and security policy 1 (SO) -7 (SF) 1999-2014 511. EU enlargement to Turkey 1 (SO) -7 (SF) 2006, 2010, 2014 3
Ideological position1. Overall stance 0 (Left)-10(Right) 1999-2014 52. Stance on economic issues 0 (Left)-10(Right) 1999-2014 53. Stance on democratic freedoms 0 (Libertarian)-
10(Traditional)1999-2014 5
Policy issues position1. Increase gov exp/reduce taxes 0(Favor gov exp)-
10(Favor reduc taxes)2006-2014 3
2. Deregulation 0(Oppose der)-10(Favor Der)
2006-2014 3
3. Redistribution of wealth 0(Favor)-10(Oppose) 2006-2014 34. State intervention in economy 0(Favor)-10(Oppose) 2014 15. Civil liberties ves law&order 0(Promote liberties)-
10(Support L&O)2006-2014 3
6. Social lifestyle 0(Support liberal pol)-10(Oppose lib pol)
2006-2014 3
7. Role of religion in politics 0(Oppose)-10(Support) 2006-2014 38. Immigration policy 0(Oppose tough policy)-
10(Support tough pol)2006-2014 3
9. Integration of immigrants 0(Favor multicul. policy)-10(Support multicul pol)
2006-2014 3
10. Urban versus rural interest 0(Support urban)-10(Support rural)
2006-2014 3
11. Environment 0(Support environment)-10(Support growth)
2010, 2014 2
12. Cosmopolitanism 0(Support cosm.)-10(Support nationalism)
2006 1
13. Regional decentralization 0(Support political decentr.)-10(Oppose decentr.)
2006-2014 3
14. International security and peace keeping
0(Support int. sec)-10(Oppose int. sec.)
20,102,014 2
15. Position towards US power in world affairs
0(Oppose)-10(Support) 2006 1
16. Rights to ethnic minorities 0(Support more rights)-10(Oppose)
2006-2014 3
49