Embed Size (px)
DESCRIPTION
Demand Function
Citation preview

Demand (Easy Way)
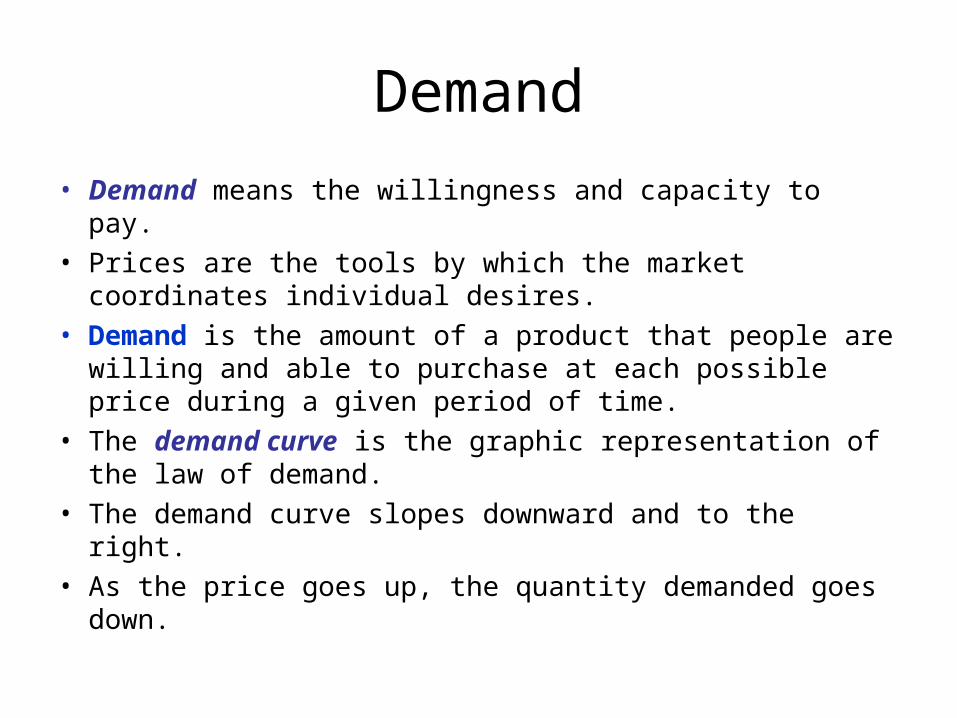
Demand
• Demand means the willingness and capacity to pay.• Prices are the tools by which the market coordinates
individual desires.• Demand is the amount of a product that people are
willing and able to purchase at each possible price during a given period of time.
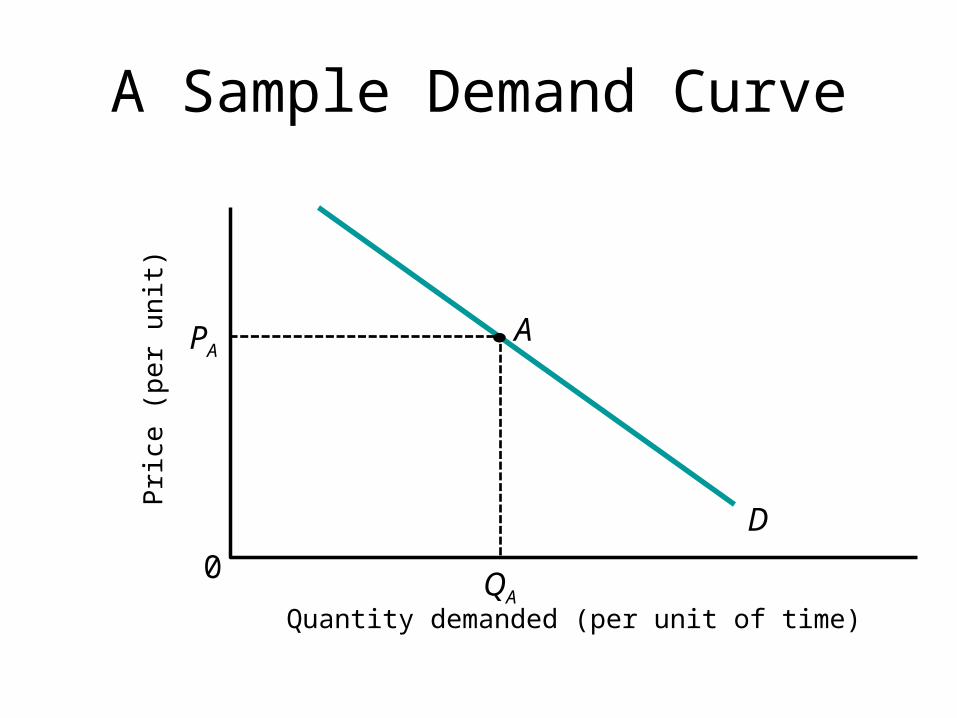
• The demand curve is the graphic representation of the law of demand.
• The demand curve slopes downward and to the right.• As the price goes up, the quantity demanded goes down.
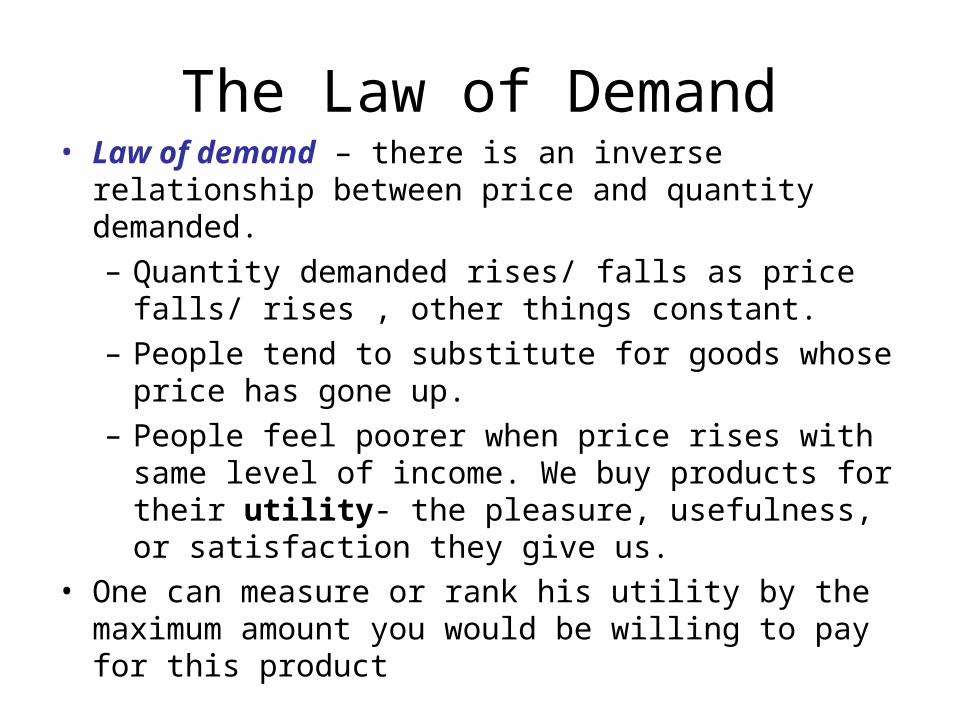
The Law of Demand• Law of demand – there is an inverse relationship
between price and quantity demanded.– Quantity demanded rises/ falls as price falls/ rises ,
other things constant.– People tend to substitute for goods whose price has
gone up.– People feel poorer when price rises with same level of
income. We buy products for their utility- the pleasure, usefulness, or satisfaction they give us.
• One can measure or rank his utility by the maximum amount you would be willing to pay for this product
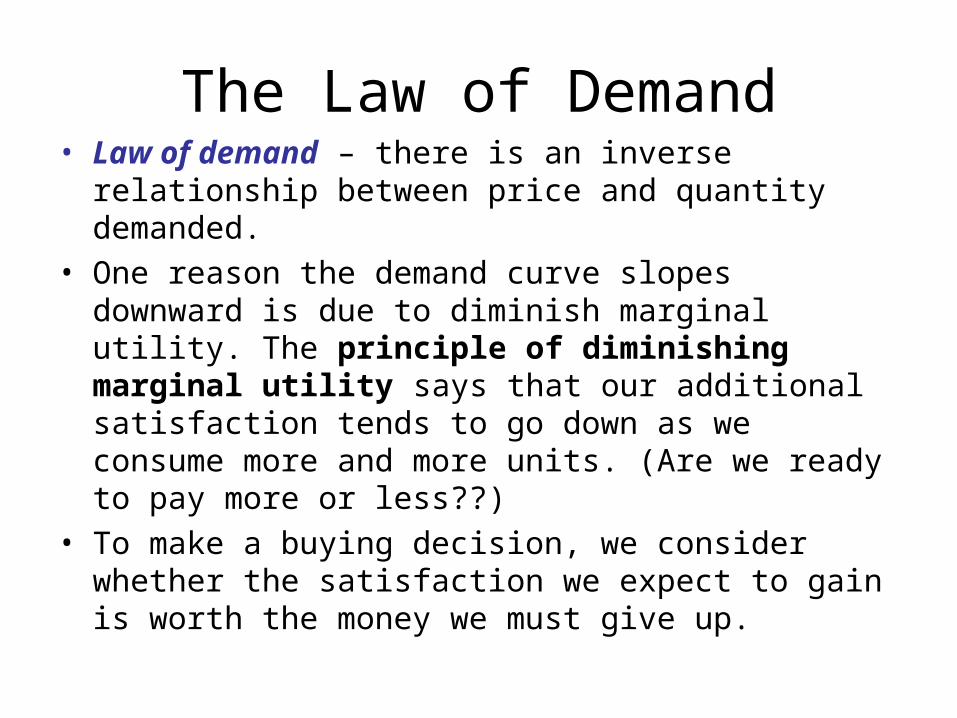
The Law of Demand• Law of demand – there is an inverse relationship
between price and quantity demanded.• One reason the demand curve slopes downward is due
to diminish marginal utility. The principle of diminishing marginal utility says that our additional satisfaction tends to go down as we consume more and more units. (Are we ready to pay more or less??)
• To make a buying decision, we consider whether the satisfaction we expect to gain is worth the money we must give up.
Price
per
DVD
s (in
dol
lars
)
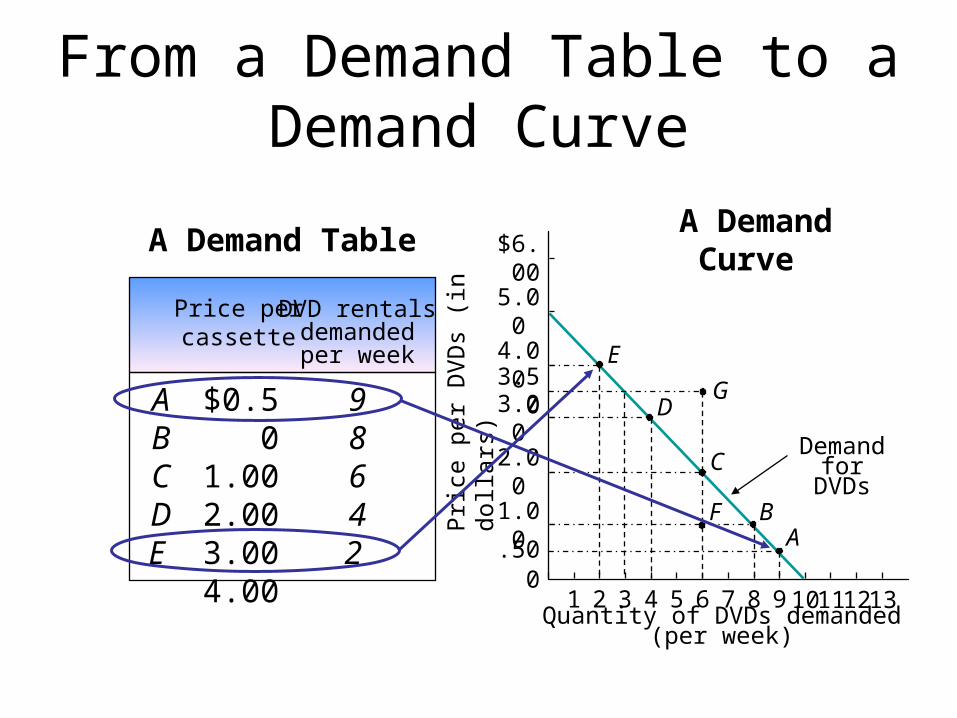
A Demand Curve
Quantity of DVDs demanded (per week)1 2 3 4 5 6 7 8 9 10 11 12
13
$6.00
5.00
4.00
3.00
2.00
1.00 .50
0
3.50E
D
C
BFA
From a Demand Table to a Demand Curve
Price per cassette
ABCDE
A Demand Table
DVD rentals demanded per
week
$0.50 1.002.003.004.00
98642
Demand for DVDs
G
D
Pri
ce (
per
uni
t)
0
Quantity demanded (per unit of time)
PA
QA
A
A Sample Demand Curve
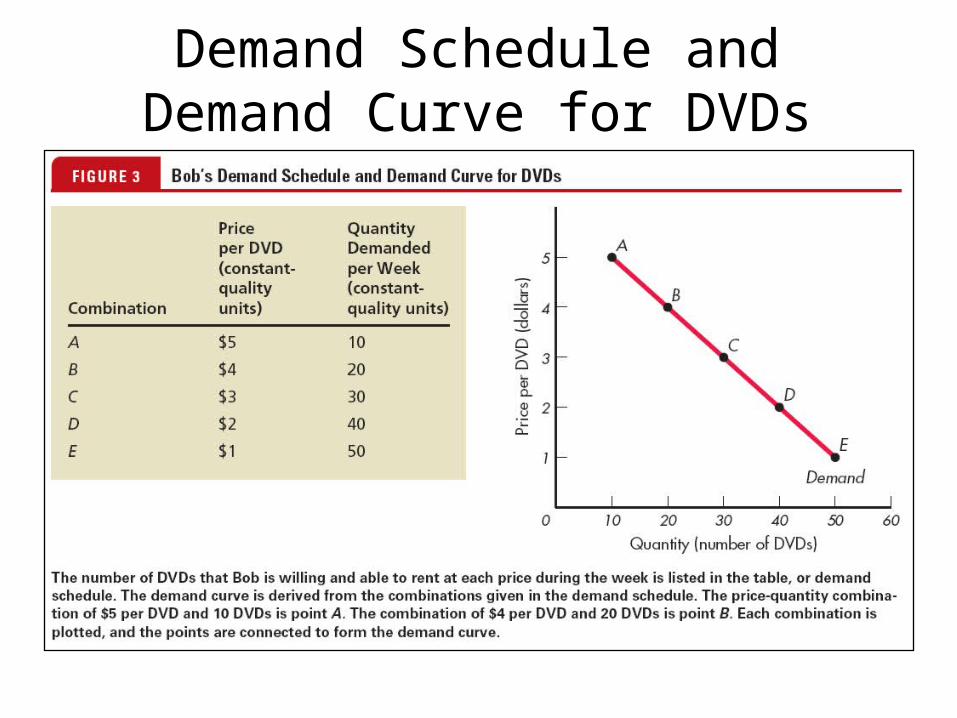
Demand Schedule andDemand Curve for DVDs
Other Things Constant
• Other things constant places a limitation on the application of the law of demand.– These factors may include changing tastes, prices of other goods,
income, even the weather.• Demand Curves can also shift in response to the following factors:
– Buyers (of): changes in the number of consumers– Income: changes in consumers’ income– Tastes: changes in preference or popularity of product/ service– Expectations: changes in prices, availability what consumers
expect to happen in the future– Related goods: compliments and substitutes
– Taxes or subsidies to consumers
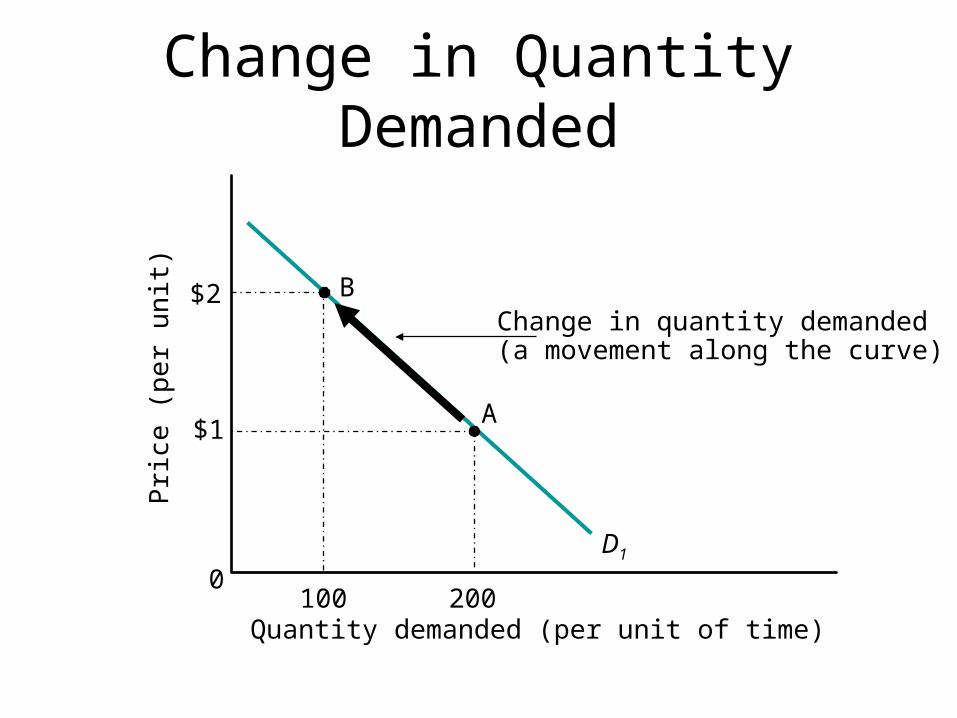
Change in Quantity Demanded
D1
Change in quantity demanded(a movement along the curve)
B
0
Pri
ce (
per
uni
t)
Quantity demanded (per unit of time)100
$2
$1
200
A
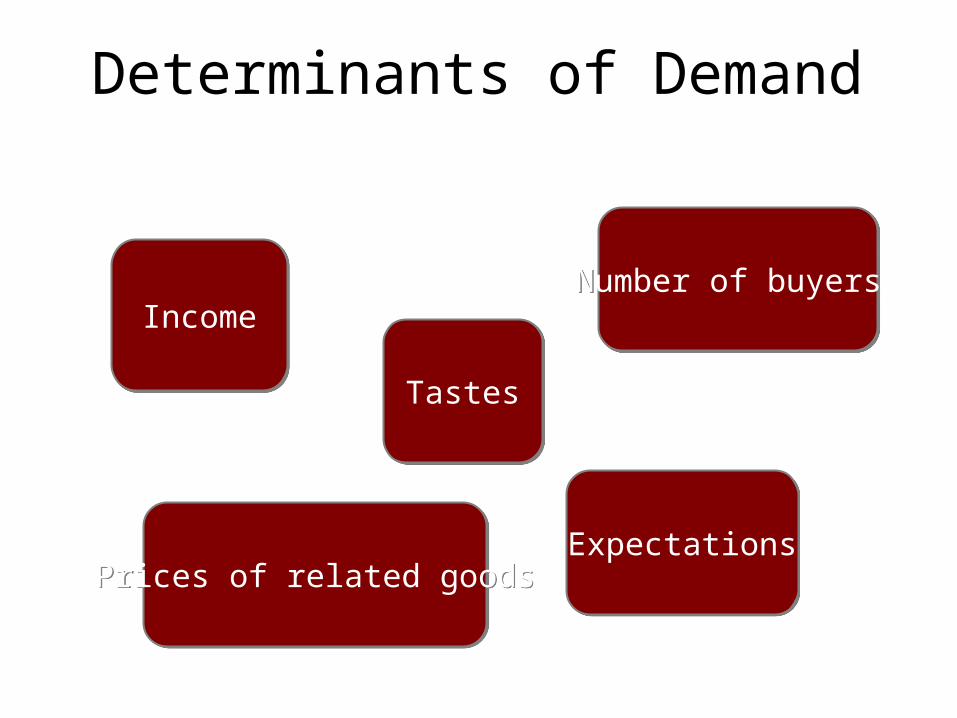
Determinants of Demand
TastesTastes
IncomeIncomeNumber of buyers Number of buyers
ExpectationsExpectationsPrices of related goodsPrices of related goods
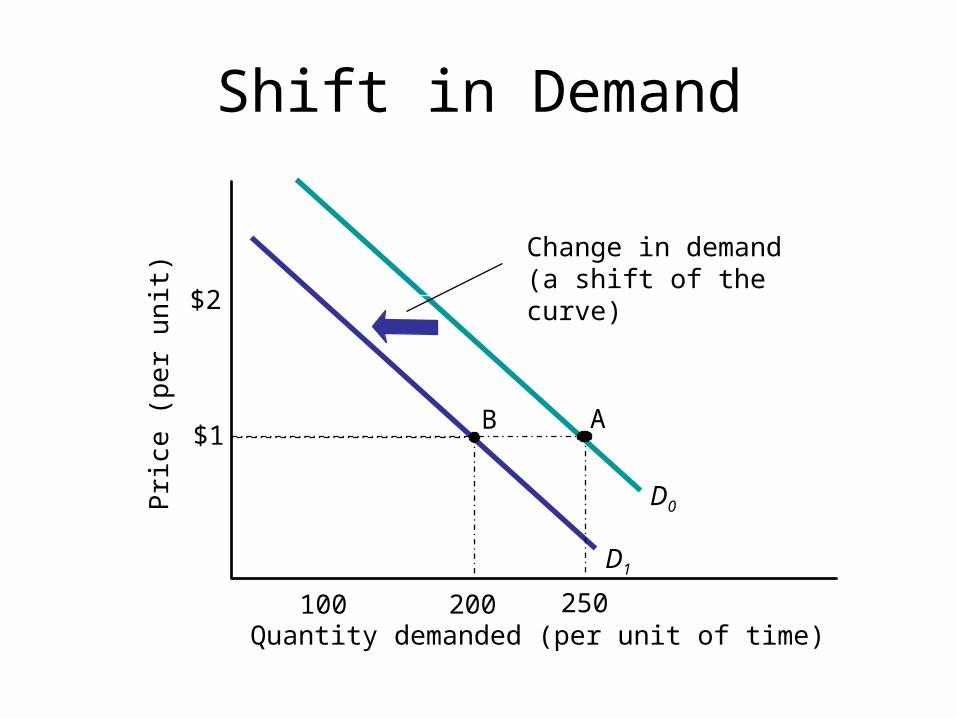
D0
D1
Shift in DemandP
rice
(pe
r u
nit)
Quantity demanded (per unit of time)100
$2
$1
200
B A
Change in demand(a shift of the curve)
250
Income/ Substitutes/ Complementary
• An increase in income will increase demand for normal goods and will decrease demand for inferior goods.
• If you expect your income to rise, you may consume more now.
• If you expect prices to fall in the future, you may put off purchases today
• When the price of a substitute good falls, demand falls for the good whose price has not changed.
• When the price of a complement good falls, demand rises for the good whose price has not changed.
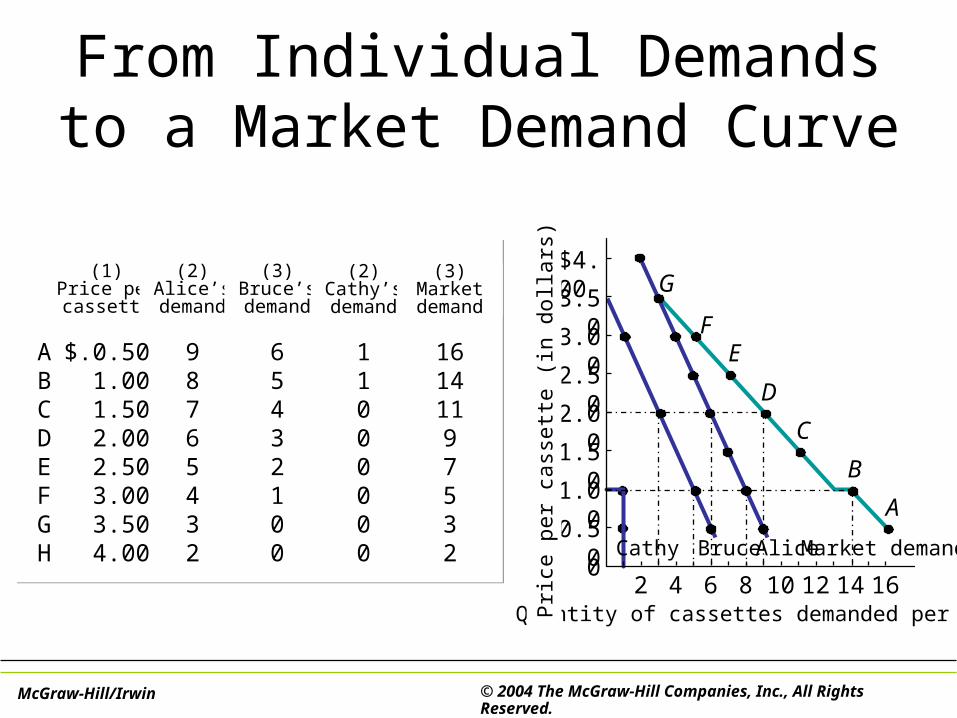
From Individual Demandsto a Market Demand Curve
(1)Price per cassette
$.0.501.001.502.002.503.003.504.00
(2)Alice’s
demand
(3)Bruce’s demand
(2)Cathy’s demand
(3)Market demand
98765432
65432100
11000000
16141197532
ABCDEFGH Cathy Bruce Alice
D
A
C
EF
G
Quantity of cassettes demanded per week2
$4.00
3.50
3.00
2.50
2.00
1.50
1.00
0.50
0Pr
ice p
er c
asse
tte (i
n do
llars
)
4 6 8 10 12 14 16
B
Market demand
McGraw-Hill/Irwin © 2004 The McGraw-Hill Companies, Inc., All Rights Reserved.
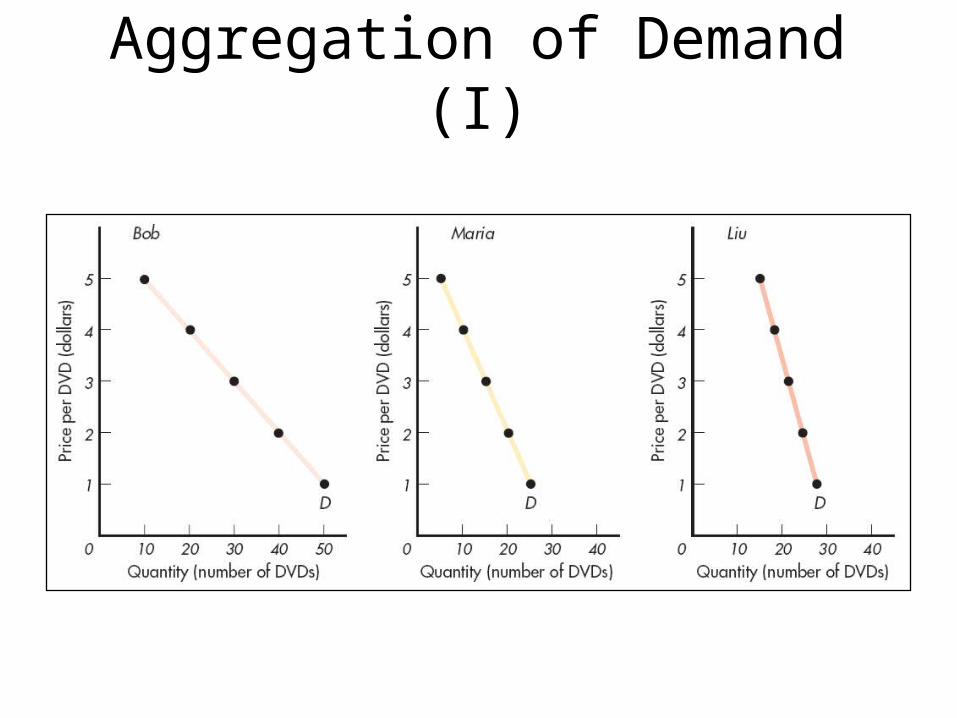
Aggregation of Demand (I)
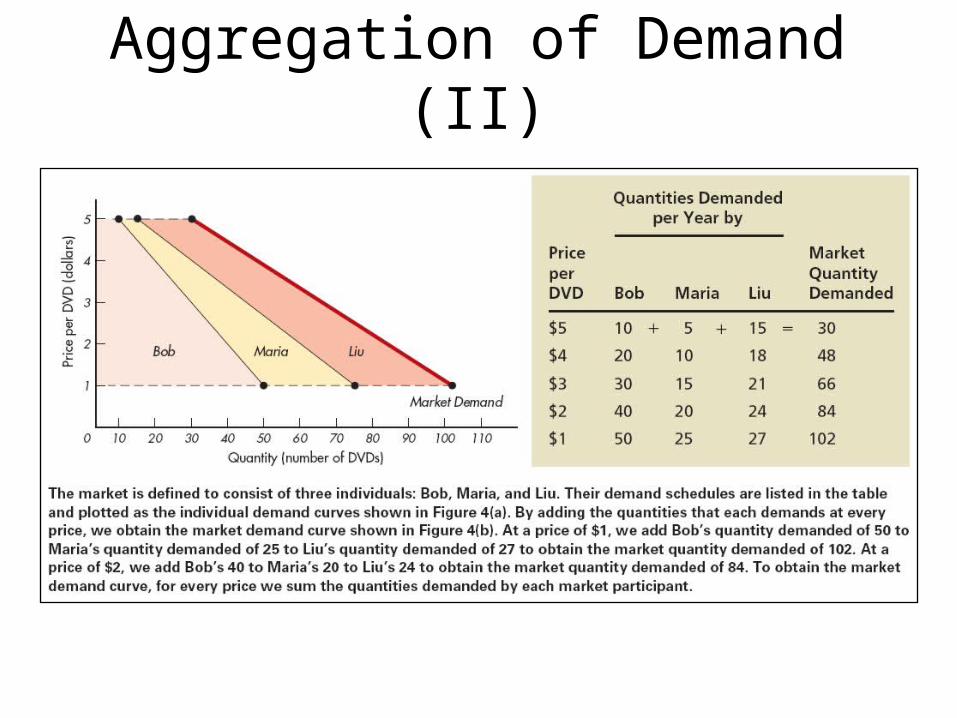
Aggregation of Demand (II)
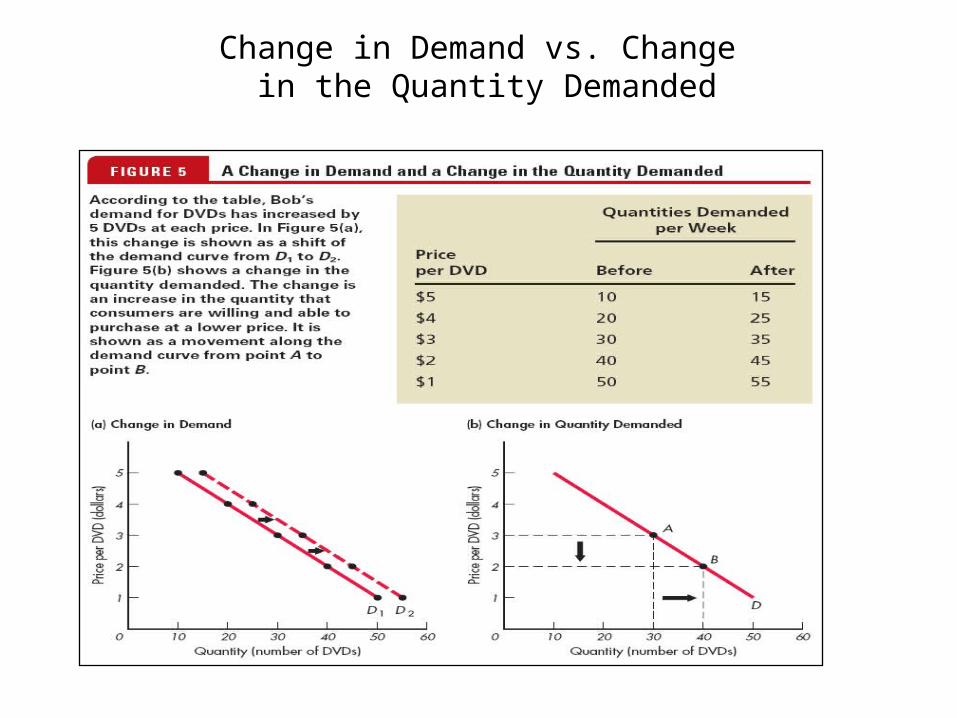
Change in Demand vs. Change in the Quantity Demanded