Embed Size (px)
Citation preview

Delta – A Durable Business Model
Raymond James Institutional Investors Conference
March 6, 2017
2
Safe Harbor
Statements in this presentation that are not historical facts, including statements regarding our estimates, expectations,
beliefs, intentions, projections or strategies for the future, may be "forward-looking statements" as defined in the Private
Securities Litigation Reform Act of 1995. All forward-looking statements involve a number of risks and uncertainties that
could cause actual results to differ materially from the estimates, expectations, beliefs, intentions, projections and
strategies reflected in or suggested by the forward-looking statements. These risks and uncertainties include, but are not
limited to, the effects of terrorist attacks or geopolitical conflict; the cost of aircraft fuel; the impact of fuel hedging activity
including rebalancing our hedge portfolio, recording mark-to-market adjustments or posting collateral in connection with our
fuel hedge contracts; the availability of aircraft fuel; the performance of our significant investments in airlines in other parts
of the world; the possible effects of accidents involving our aircraft; the restrictions that financial covenants in our financing
agreements could have on our financial and business operations; labor issues; interruptions or disruptions in service at one
of our hub or gateway airports; breaches or security lapses in our information technology systems; disruptions in our
information technology infrastructure; our dependence on technology in our operations; the effects of weather, natural
disasters and seasonality on our business; the effects of an extended disruption in services provided by third party regional
carriers; failure or inability of insurance to cover a significant liability at Monroe’s Trainer refinery; the impact of
environmental regulation on the Trainer refinery, including costs related to renewable fuel standard regulations; our ability
to retain management and key employees; competitive conditions in the airline industry; the effects of extensive
government regulation on our business; the sensitivity of the airline industry to prolonged periods of stagnant or weak
economic conditions; uncertainty in economic conditions and regulatory environment in the United Kingdom related to the
likely exit of the United Kingdom from the European Union; and the effects of the rapid spread of contagious illnesses.
Additional information concerning risks and uncertainties that could cause differences between actual results and forward-
looking statements is contained in our Securities and Exchange Commission filings, including our Annual Report on Form
10-K for the fiscal year ended Dec. 31, 2016. Caution should be taken not to place undue reliance on our forward-looking
statements, which represent our views only as of March 6, 2017, and which we have no current intention to update.
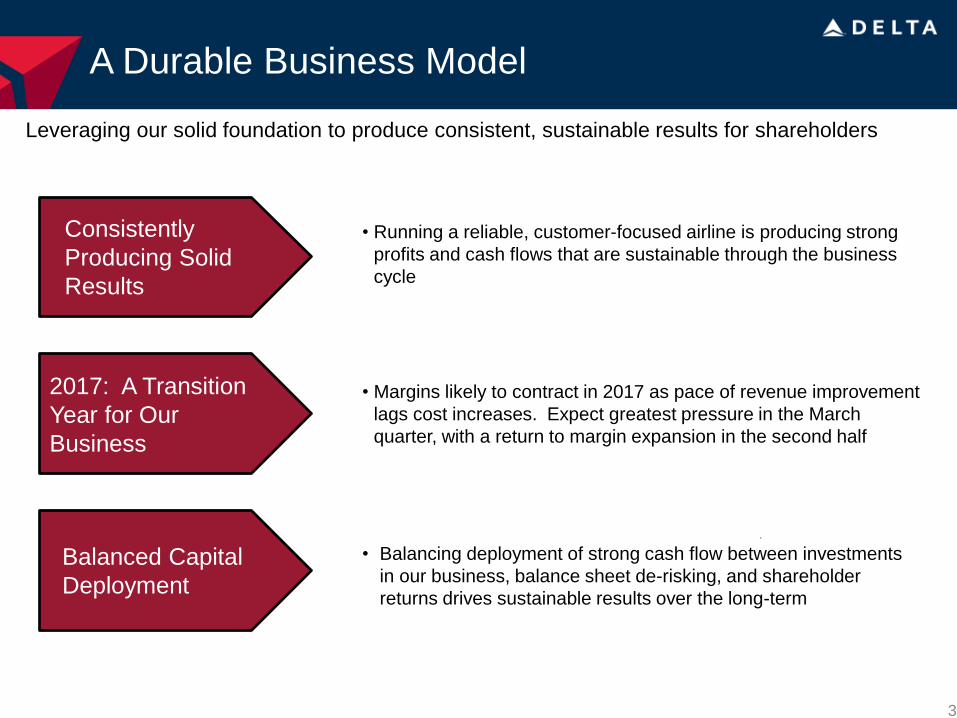
A Durable Business Model
Consistently
Producing Solid
Results
2017: A Transition
Year for Our
Business
Balanced Capital
Deployment
Leveraging our solid foundation to produce consistent, sustainable results for shareholders
• Running a reliable, customer-focused airline is producing strong
profits and cash flows that are sustainable through the business
cycle
• Balancing deployment of strong cash flow between investments
in our business, balance sheet de-risking, and shareholder
returns drives sustainable results over the long-term
• Margins likely to contract in 2017 as pace of revenue improvement
lags cost increases. Expect greatest pressure in the March
quarter, with a return to margin expansion in the second half
3
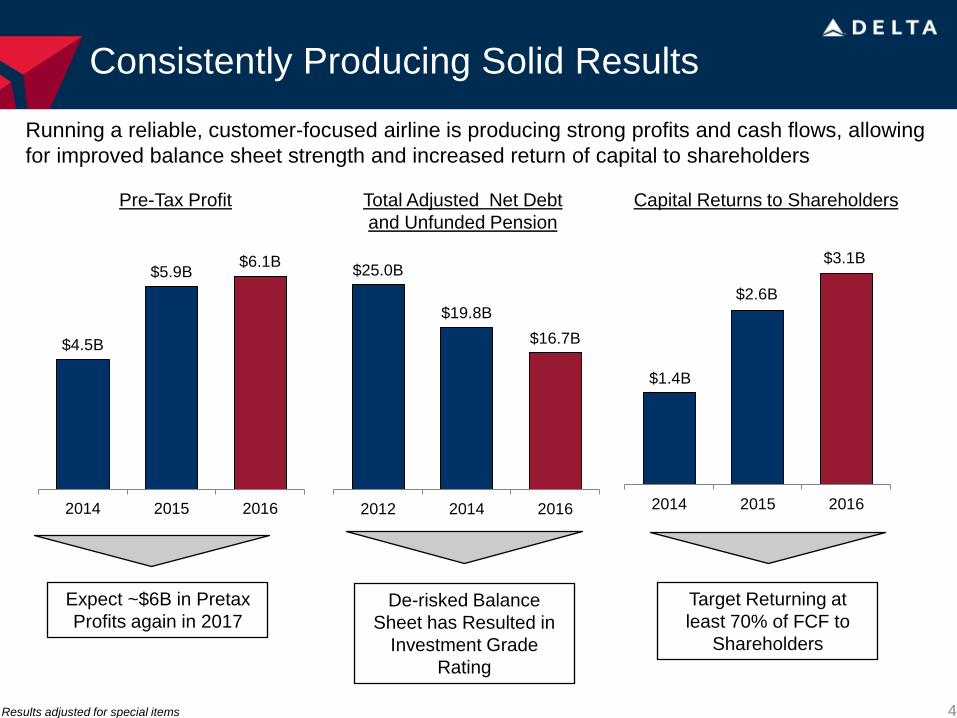
Consistently Producing Solid Results
Running a reliable, customer-focused airline is producing strong profits and cash flows, allowing
for improved balance sheet strength and increased return of capital to shareholders
Results adjusted for special items
Expect ~$6B in Pretax
Profits again in 2017
$25.0B
$19.8B
$16.7B
2012 2014 2016
$4.5B
$5.9B $6.1B
2014 2015 2016
$1.4B
$3.1B
2014 2015 2016
$2.6B
4
Pre-Tax Profit Capital Returns to Shareholders Total Adjusted Net Debt
and Unfunded Pension
De-risked Balance
Sheet has Resulted in
Investment Grade
Rating
Target Returning at
least 70% of FCF to
Shareholders
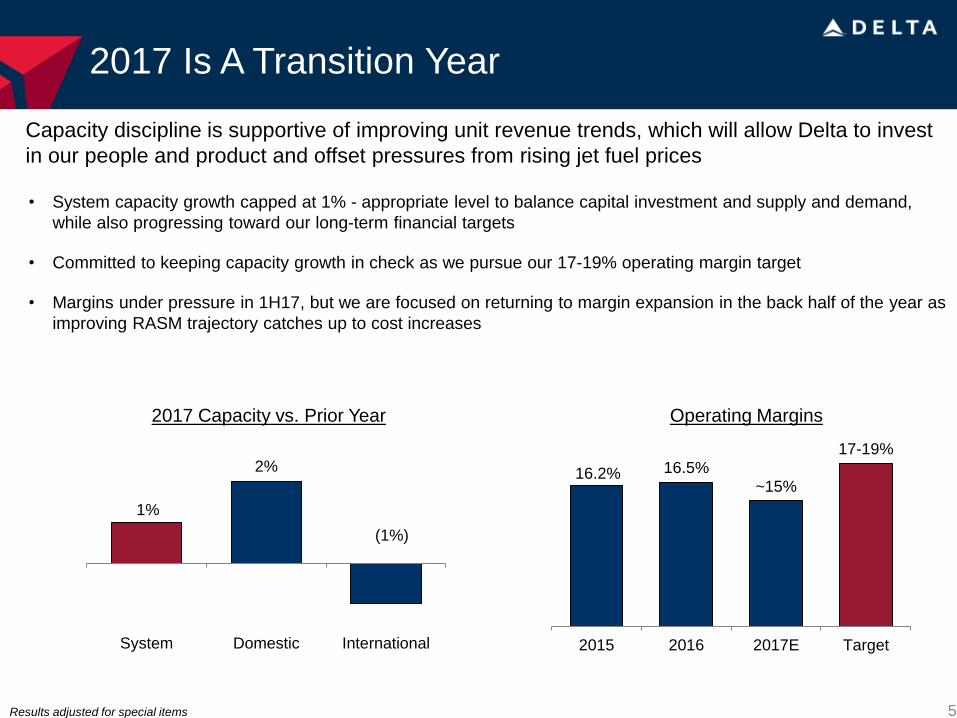
2017 Is A Transition Year
• System capacity growth capped at 1% - appropriate level to balance capital investment and supply and demand,
while also progressing toward our long-term financial targets
• Committed to keeping capacity growth in check as we pursue our 17-19% operating margin target
• Margins under pressure in 1H17, but we are focused on returning to margin expansion in the back half of the year as
improving RASM trajectory catches up to cost increases
Capacity discipline is supportive of improving unit revenue trends, which will allow Delta to invest
in our people and product and offset pressures from rising jet fuel prices
5
1%
System Domestic International
2%
2017 Capacity vs. Prior Year
(1%)
Operating Margins
16.2% 16.5%
~15%
17-19%
2015 2016 2017E Target
Results adjusted for special items
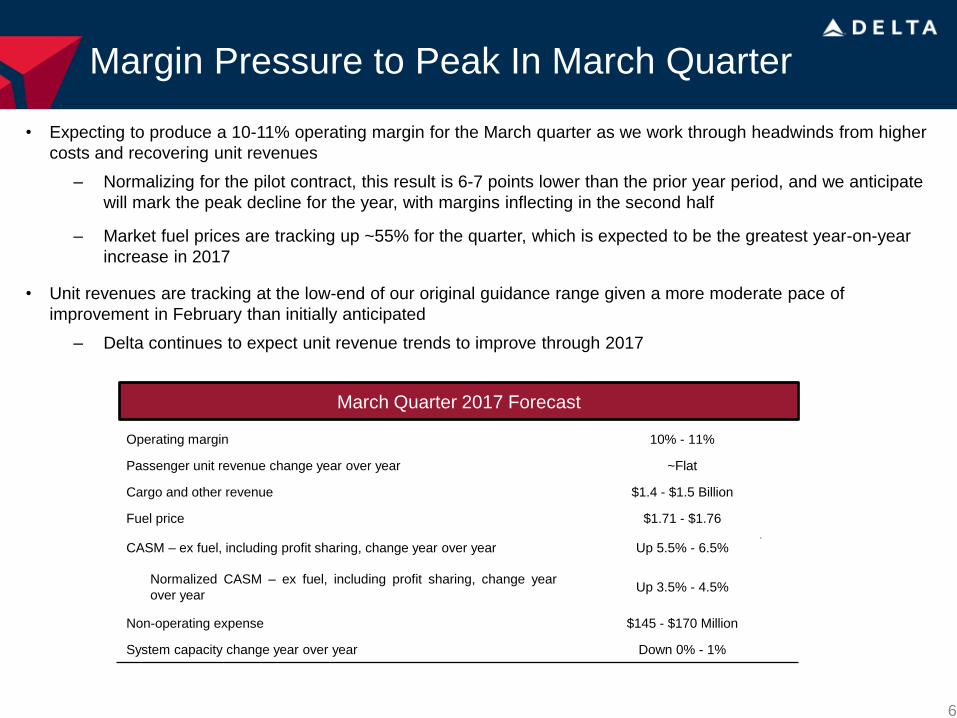
Margin Pressure to Peak In March Quarter
6
March Quarter 2017 Forecast
Operating margin 10% - 11%
Passenger unit revenue change year over year ~Flat
Cargo and other revenue $1.4 - $1.5 Billion
Fuel price $1.71 - $1.76
CASM – ex fuel, including profit sharing, change year over year Up 5.5% - 6.5%
Normalized CASM – ex fuel, including profit sharing, change year
over year Up 3.5% - 4.5%
Non-operating expense $145 - $170 Million
System capacity change year over year Down 0% - 1%
• Expecting to produce a 10-11% operating margin for the March quarter as we work through headwinds from higher
costs and recovering unit revenues
– Normalizing for the pilot contract, this result is 6-7 points lower than the prior year period, and we anticipate
will mark the peak decline for the year, with margins inflecting in the second half
– Market fuel prices are tracking up ~55% for the quarter, which is expected to be the greatest year-on-year
increase in 2017
• Unit revenues are tracking at the low-end of our original guidance range given a more moderate pace of
improvement in February than initially anticipated
– Delta continues to expect unit revenue trends to improve through 2017
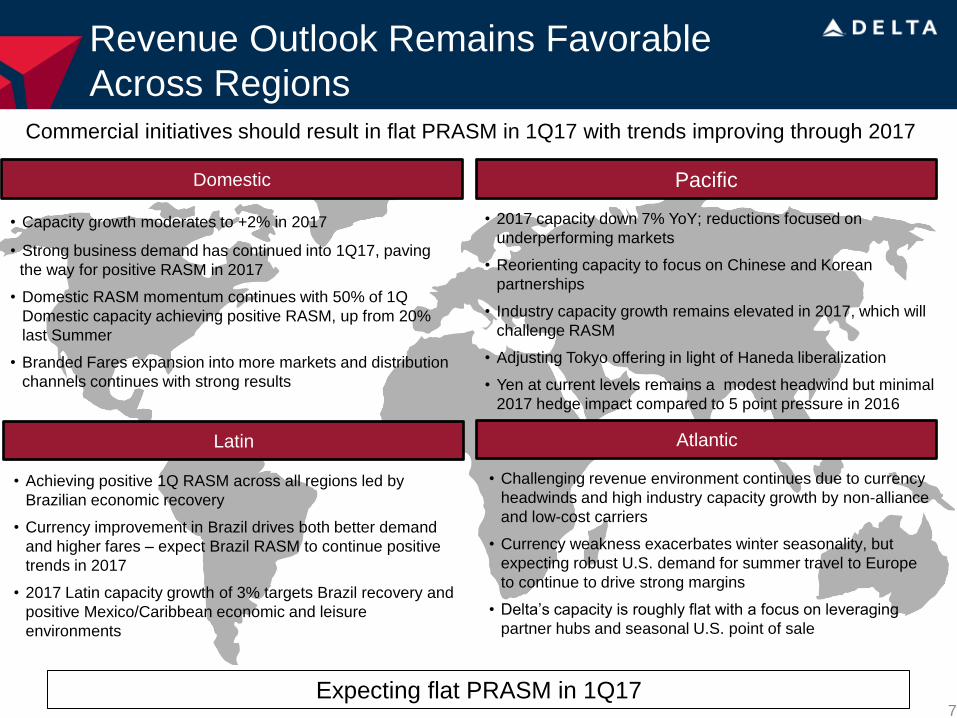
Revenue Outlook Remains Favorable
Across Regions
7
Commercial initiatives should result in flat PRASM in 1Q17 with trends improving through 2017
Domestic
• Capacity growth moderates to +2% in 2017
• Strong business demand has continued into 1Q17, paving
the way for positive RASM in 2017
• Domestic RASM momentum continues with 50% of 1Q
Domestic capacity achieving positive RASM, up from 20%
last Summer
• Branded Fares expansion into more markets and distribution
channels continues with strong results
Latin
• Achieving positive 1Q RASM across all regions led by
Brazilian economic recovery
• Currency improvement in Brazil drives both better demand
and higher fares – expect Brazil RASM to continue positive
trends in 2017
• 2017 Latin capacity growth of 3% targets Brazil recovery and
positive Mexico/Caribbean economic and leisure
environments
Pacific
• 2017 capacity down 7% YoY; reductions focused on
underperforming markets
• Reorienting capacity to focus on Chinese and Korean
partnerships
• Industry capacity growth remains elevated in 2017, which will
challenge RASM
• Adjusting Tokyo offering in light of Haneda liberalization
• Yen at current levels remains a modest headwind but minimal
2017 hedge impact compared to 5 point pressure in 2016
Atlantic
• Challenging revenue environment continues due to currency
headwinds and high industry capacity growth by non-alliance
and low-cost carriers
• Currency weakness exacerbates winter seasonality, but
expecting robust U.S. demand for summer travel to Europe
to continue to drive strong margins
• Delta’s capacity is roughly flat with a focus on leveraging
partner hubs and seasonal U.S. point of sale
Expecting flat PRASM in 1Q17
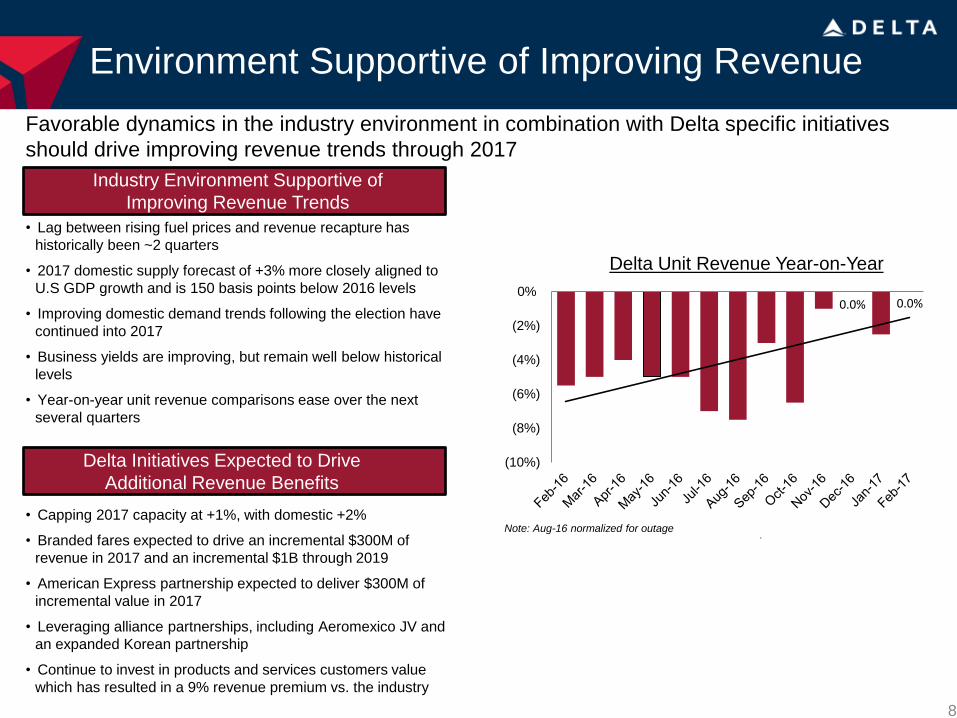
Environment Supportive of Improving Revenue
Favorable dynamics in the industry environment in combination with Delta specific initiatives
should drive improving revenue trends through 2017
8
Industry Environment Supportive of
Improving Revenue Trends
• Lag between rising fuel prices and revenue recapture has
historically been ~2 quarters
• 2017 domestic supply forecast of +3% more closely aligned to
U.S GDP growth and is 150 basis points below 2016 levels
• Improving domestic demand trends following the election have
continued into 2017
• Business yields are improving, but remain well below historical
levels
• Year-on-year unit revenue comparisons ease over the next
several quarters
• Capping 2017 capacity at +1%, with domestic +2%
• Branded fares expected to drive an incremental $300M of
revenue in 2017 and an incremental $1B through 2019
• American Express partnership expected to deliver $300M of
incremental value in 2017
• Leveraging alliance partnerships, including Aeromexico JV and
an expanded Korean partnership
• Continue to invest in products and services customers value
which has resulted in a 9% revenue premium vs. the industry
Delta Initiatives Expected to Drive
Additional Revenue Benefits
Industry Environment Supportive of
Improving Revenue Trends
0.0% 0.0%
(10%)
(8%)
(6%)
(4%)
(2%)
0%
Delta Unit Revenue Year-on-Year
Note: Aug-16 normalized for outage
Maintaining our Commitment on Costs
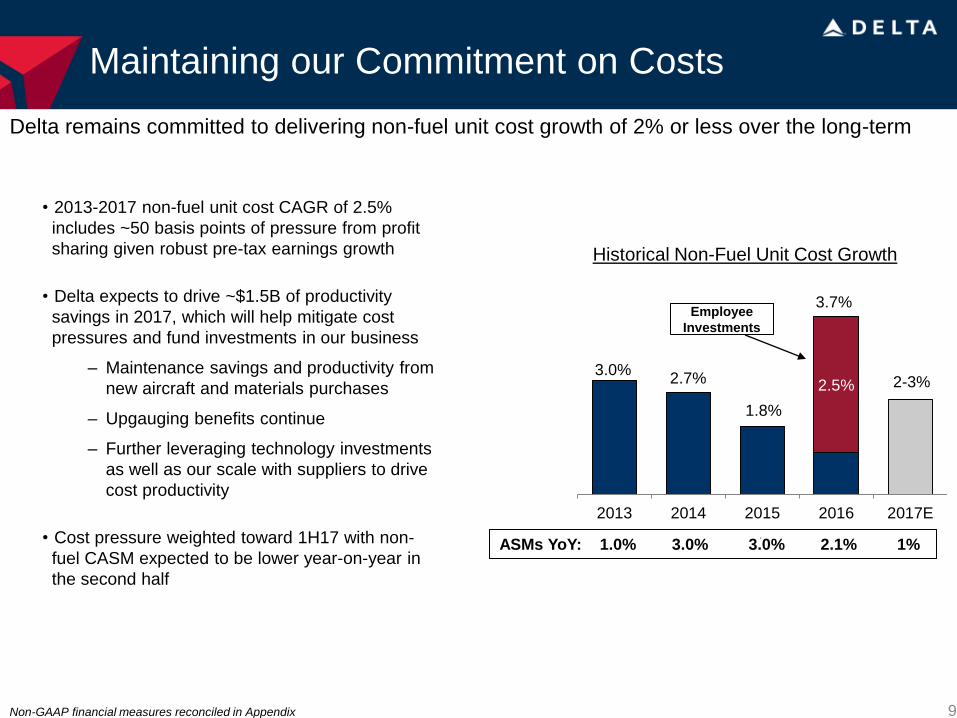
Delta remains committed to delivering non-fuel unit cost growth of 2% or less over the long-term
9
• 2013-2017 non-fuel unit cost CAGR of 2.5%
includes ~50 basis points of pressure from profit
sharing given robust pre-tax earnings growth
• Delta expects to drive ~$1.5B of productivity
savings in 2017, which will help mitigate cost
pressures and fund investments in our business
– Maintenance savings and productivity from
new aircraft and materials purchases
– Upgauging benefits continue
– Further leveraging technology investments
as well as our scale with suppliers to drive
cost productivity
• Cost pressure weighted toward 1H17 with non-
fuel CASM expected to be lower year-on-year in
the second half
Historical Non-Fuel Unit Cost Growth
3.0% 2.7%
1.8%
2.5%
2013 2014 2015 2016 2017E
Employee
Investments
3.7%
2-3%
ASMs YoY: 1.0% 3.0% 3.0% 2.1% 1%
Non-GAAP financial measures reconciled in Appendix
Strong Cash Generation and Disciplined
Capital Investment Differentiates Delta
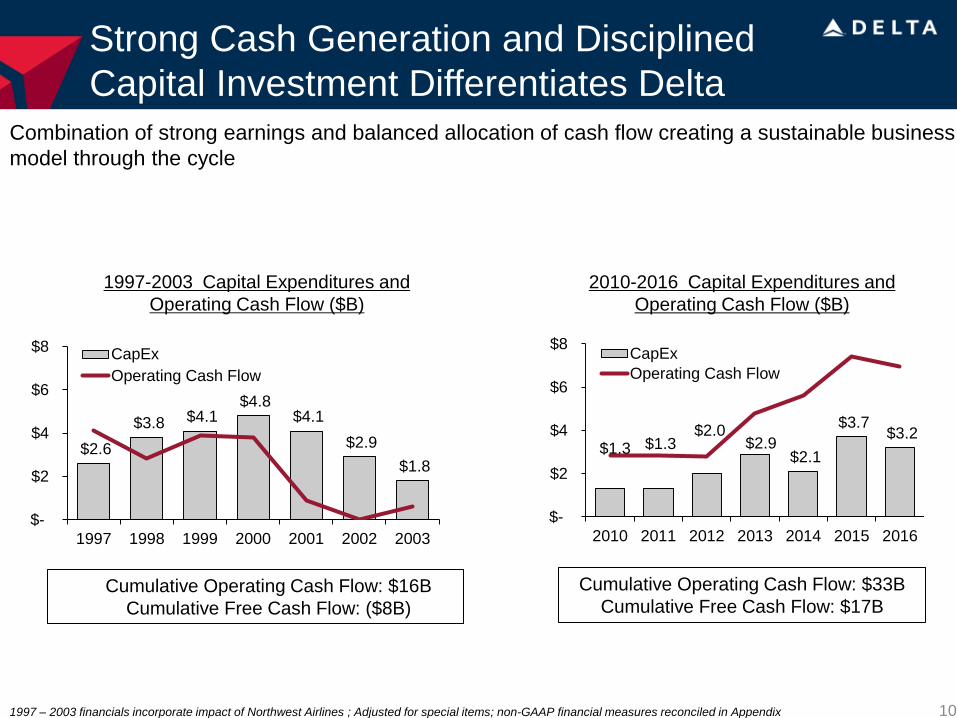
Combination of strong earnings and balanced allocation of cash flow creating a sustainable business
model through the cycle
10
$2.6
$3.8 $4.1 $4.8
$4.1
$2.9
$1.8
$-
$2
$4
$6
$8
1997 1998 1999 2000 2001 2002 2003
CapEx
Operating Cash Flow
$1.3 $1.3 $2.0
$2.9 $2.1
$3.7 $3.2
$-
$2
$4
$6
$8
2010 2011 2012 2013 2014 2015 2016
CapEx
Operating Cash Flow
1997-2003 Capital Expenditures and
Operating Cash Flow ($B)
2010-2016 Capital Expenditures and
Operating Cash Flow ($B)
Cumulative Operating Cash Flow: $16B
Cumulative Free Cash Flow: ($8B)
Cumulative Operating Cash Flow: $33B
Cumulative Free Cash Flow: $17B
1997 – 2003 financials incorporate impact of Northwest Airlines ; Adjusted for special items; non-GAAP financial measures reconciled in Appendix
Balance Sheet Strategy Maintains Cash
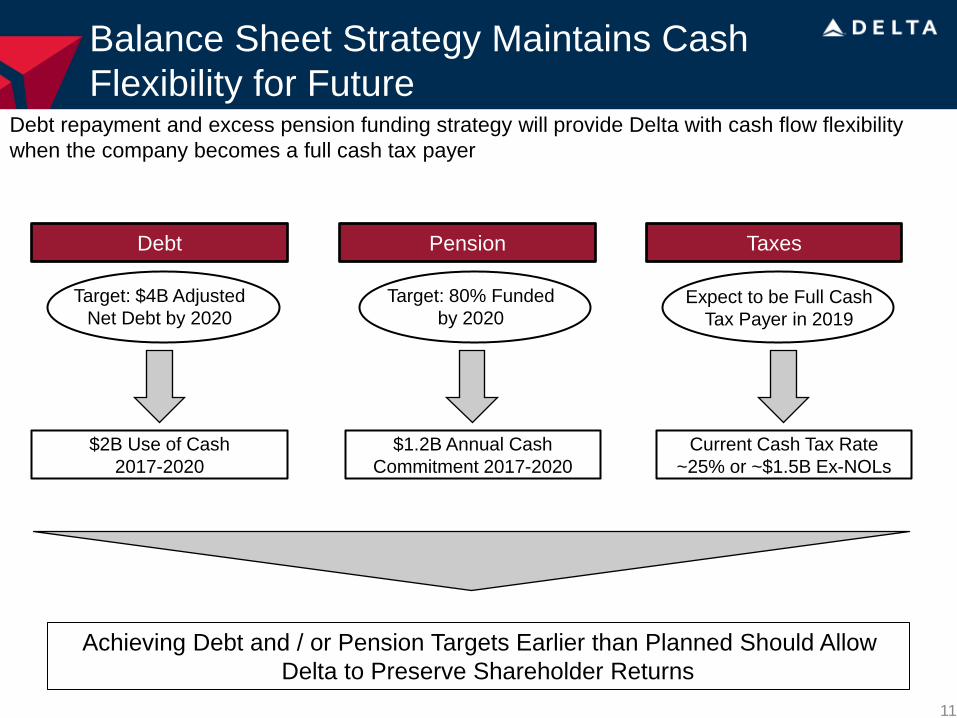
Flexibility for Future Debt repayment and excess pension funding strategy will provide Delta with cash flow flexibility
when the company becomes a full cash tax payer
11
Debt Pension Taxes
Target: $4B Adjusted
Net Debt by 2020
Target: 80% Funded
by 2020 Expect to be Full Cash
Tax Payer in 2019
$2B Use of Cash
2017-2020
$1.2B Annual Cash
Commitment 2017-2020
Current Cash Tax Rate
~25% or ~$1.5B Ex-NOLs
Achieving Debt and / or Pension Targets Earlier than Planned Should Allow
Delta to Preserve Shareholder Returns
Delta Committed To Consistent
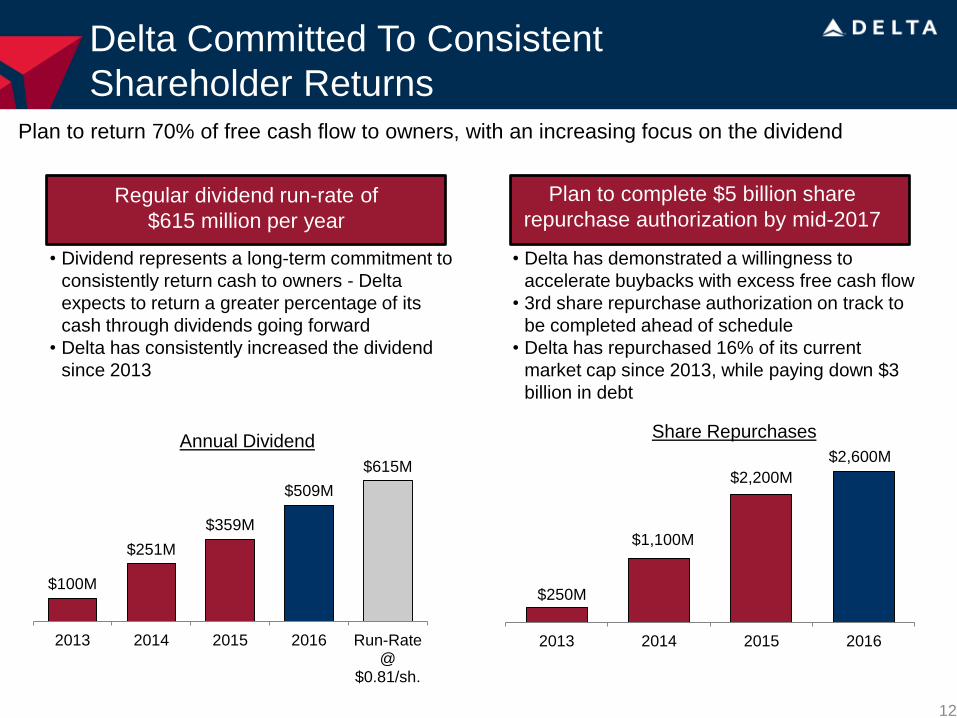
Shareholder Returns Plan to return 70% of free cash flow to owners, with an increasing focus on the dividend
12
• Dividend represents a long-term commitment to
consistently return cash to owners - Delta
expects to return a greater percentage of its
cash through dividends going forward
• Delta has consistently increased the dividend
since 2013
• Delta has demonstrated a willingness to
accelerate buybacks with excess free cash flow
• 3rd share repurchase authorization on track to
be completed ahead of schedule
• Delta has repurchased 16% of its current
market cap since 2013, while paying down $3
billion in debt
Share Repurchases
Regular dividend run-rate of
$615 million per year
Plan to complete $5 billion share
repurchase authorization by mid-2017
Annual Dividend
$100M
$251M
$359M
$509M
$615M
2013 2014 2015 2016 Run-Rate@
$0.81/sh.
$250M
$1,100M
$2,200M
$2,600M
2013 2014 2015 2016
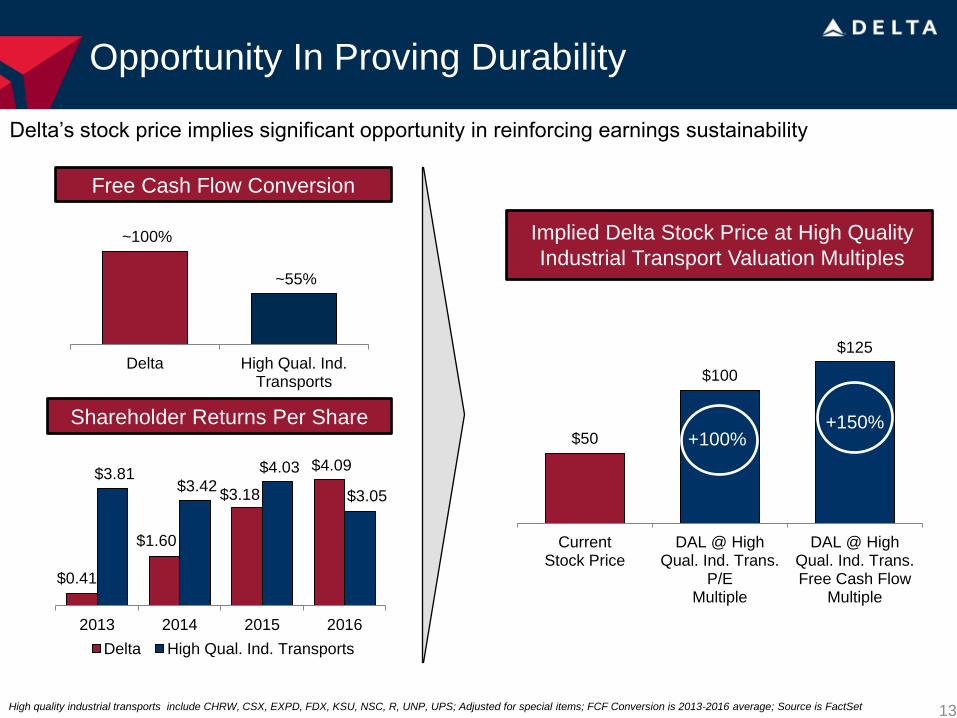
Opportunity In Proving Durability
13 High quality industrial transports include CHRW, CSX, EXPD, FDX, KSU, NSC, R, UNP, UPS; Adjusted for special items; FCF Conversion is 2013-2016 average; Source is FactSet
Implied Delta Stock Price at High Quality
Industrial Transport Valuation Multiples
+185% +165%
$50
$100
$125
CurrentStock Price
DAL @ HighQual. Ind. Trans.
P/EMultiple
DAL @ HighQual. Ind. Trans.Free Cash Flow
Multiple
~100%
~55%
Delta High Qual. Ind.Transports
Free Cash Flow Conversion
Shareholder Returns Per Share
Delta’s stock price implies significant opportunity in reinforcing earnings sustainability
+100% +150%
$0.41
$1.60
$3.18
$4.09 $3.81
$3.42
$4.03
$3.05
2013 2014 2015 2016
Delta High Qual. Ind. Transports
Non-GAAP Reconciliations
14
+185% +165%
+100% +150%
Non-GAAP Financial Measures
Pre-Tax Income and Net Income, Adjusted
Non-GAAP Financial Measures: We sometimes use information ("non-GAAP financial measures") that is derived from the Consolidated Financial Statements,
but that is not presented in accordance with accounting principles generally accepted in the U.S. (“GAAP”). Under the U.S. Securities and Exchange
Commission rules, non-GAAP financial measures may be considered in addition to results prepared in accordance with GAAP, but should not be considered a
substitute for or superior to GAAP results. The tables below show reconciliations of non-GAAP financial measures used in this presentation to the most directly
comparable GAAP financial measures.
Forward Looking Projections. We do not reconcile forward looking non-GAAP financial measures because mark-to-market ("MTM") adjustments and
settlements will not be known until the end of the period and could be significant.
Release of tax valuation allowance. Because of the uniqueness of the net gain related to the reversal of the tax valuation allowance, the exclusion of this
gain allows investors to better understand and analyze the company's core operational performance in the period shown.
Pre-Tax and Net Income, Adjusted. We adjust for the following items to determine pre-tax and net income, adjusted, for the reasons described below:
Mark-to-Market ("MTM") adjustments and settlements. MTM adjustments are defined as fair value changes recorded in periods other than the settlement
period. Such fair value changes are not necessarily indicative of the actual settlement value of the underlying hedge in the contract settlement period.
Settlements represent cash received or paid on hedge contracts settled during the period. These items adjust fuel expense to show the economic impact
of hedging, including cash received or paid on hedge contracts during the period. Adjusting for these items allows investors to better understand and
analyze our core operational performance in the periods shown.
Restructuring and other items. Restructuring and other items includes fleet and other charges, severance and related costs, an insurance settlement, and
a litigation settlement. Because of the variability in restructuring and other items, the exclusion of this item is helpful to investors to analyze the company’s
recurring core operational performance in the periods shown.
Loss on extinguishment of debt. Because of the variability in loss on extinguishment of debt, the exclusion of this item is helpful to investors to analyze
the company’s recurring core operational performance in the periods shown.
Virgin Atlantic MTM adjustments. We record our proportionate share of earnings from our equity investment in Virgin Atlantic in non-operating expense.
We adjust for Virgin Atlantic's MTM adjustments to allow investors to better understand and analyze the company’s core financial performance in the
periods shown.
Non-GAAP Reconciliations
15
+185% +165%
+100% +150%
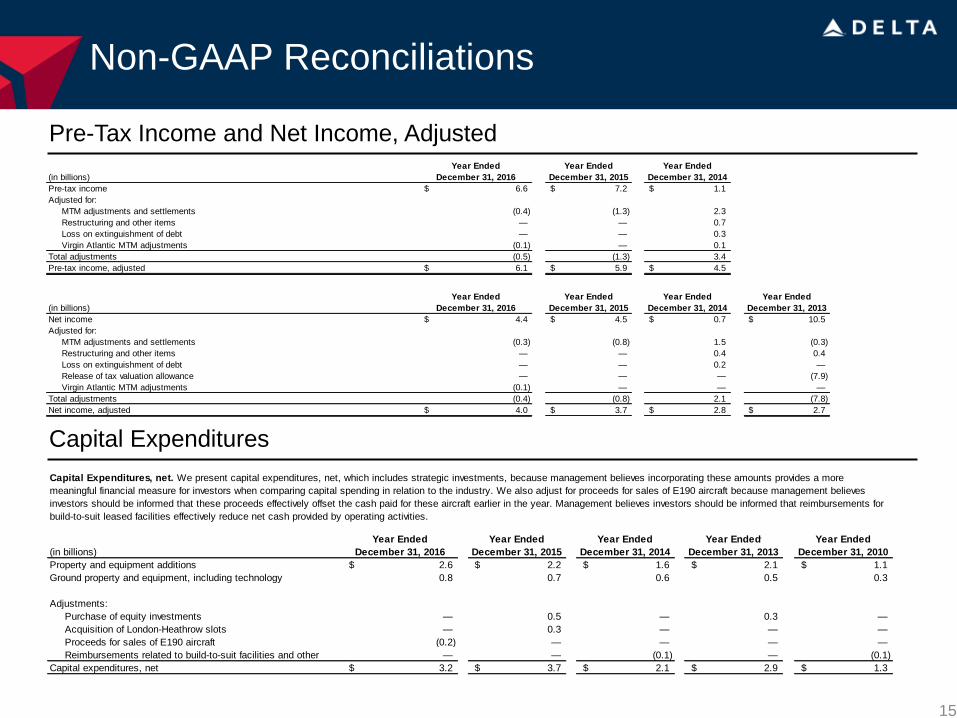
Pre-Tax Income and Net Income, Adjusted
Capital Expenditures
Year Ended Year Ended Year Ended
(in billions) December 31, 2016 December 31, 2015 December 31, 2014
Pre-tax income 6.6$ 7.2$ 1.1$
Adjusted for:
MTM adjustments and settlements (0.4) (1.3) 2.3
Restructuring and other items — — 0.7
Loss on extinguishment of debt — — 0.3
Virgin Atlantic MTM adjustments (0.1) — 0.1
Total adjustments (0.5) (1.3) 3.4
Pre-tax income, adjusted 6.1$ 5.9$ 4.5$
Year Ended Year Ended Year Ended Year Ended
(in billions) December 31, 2016 December 31, 2015 December 31, 2014 December 31, 2013
Net income 4.4$ 4.5$ 0.7$ 10.5$
Adjusted for:
MTM adjustments and settlements (0.3) (0.8) 1.5 (0.3)
Restructuring and other items — — 0.4 0.4
Loss on extinguishment of debt — — 0.2 —
Release of tax valuation allowance — — — (7.9)
Virgin Atlantic MTM adjustments (0.1) — — —
Total adjustments (0.4) (0.8) 2.1 (7.8)
Net income, adjusted 4.0$ 3.7$ 2.8$ 2.7$
Year Ended Year Ended Year Ended Year Ended Year Ended
(in billions) December 31, 2016 December 31, 2015 December 31, 2014 December 31, 2013 December 31, 2010
Property and equipment additions 2.6$ 2.2$ 1.6$ 2.1$ 1.1$
Ground property and equipment, including technology 0.8 0.7 0.6 0.5 0.3
Adjustments:
Purchase of equity investments — 0.5 — 0.3 —
Acquisition of London-Heathrow slots — 0.3 — — —
Proceeds for sales of E190 aircraft (0.2) — — — —
Reimbursements related to build-to-suit facilities and other — — (0.1) — (0.1)
Capital expenditures, net 3.2$ 3.7$ 2.1$ 2.9$ 1.3$
Capital Expenditures, net. We present capital expenditures, net, which includes strategic investments, because management believes incorporating these amounts provides a more
meaningful financial measure for investors when comparing capital spending in relation to the industry. We also adjust for proceeds for sales of E190 aircraft because management believes
investors should be informed that these proceeds effectively offset the cash paid for these aircraft earlier in the year. Management believes investors should be informed that reimbursements for
build-to-suit leased facilities effectively reduce net cash provided by operating activities.
Non-GAAP Reconciliations
16
+185% +165%
+100% +150%
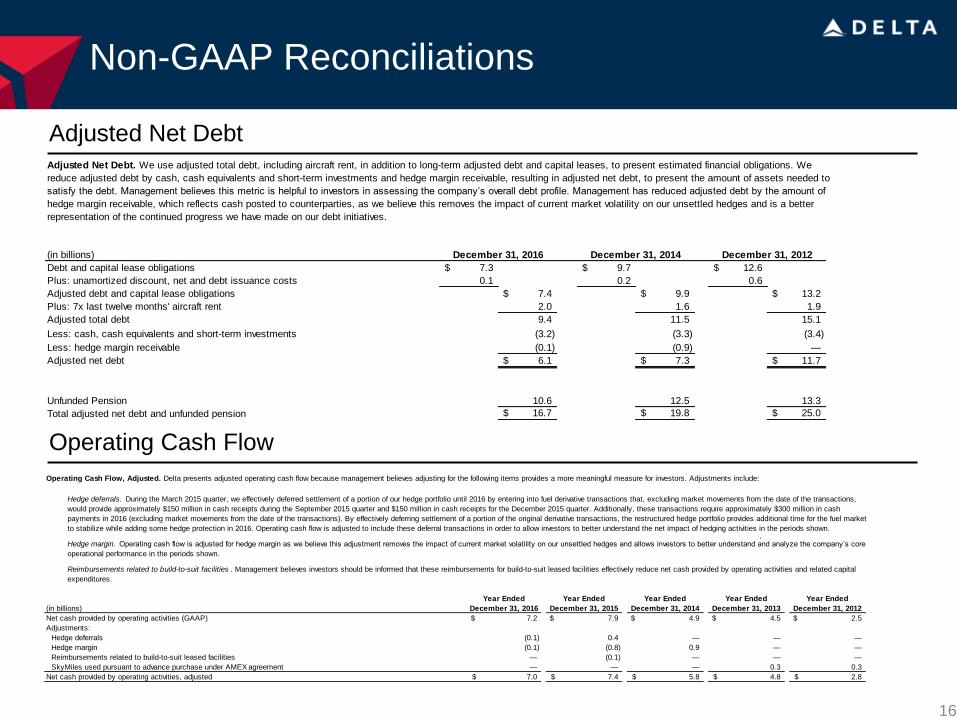
Adjusted Net Debt
Operating Cash Flow
7.3$ 9.7$ 12.6$
0.1 0.2 0.6
7.4$ 9.9$ 13.2$
2.0 1.6 1.9
9.4 11.5 15.1
(3.2) (3.3) (3.4)
(0.1) (0.9) —
6.1$ 7.3$ 11.7$
Unfunded Pension 10.6 12.5 13.3
Total adjusted net debt and unfunded pension $ 16.7 $ 19.8 $ 25.0
Adjusted Net Debt. We use adjusted total debt, including aircraft rent, in addition to long-term adjusted debt and capital leases, to present estimated financial obligations. We
reduce adjusted debt by cash, cash equivalents and short-term investments and hedge margin receivable, resulting in adjusted net debt, to present the amount of assets needed to
satisfy the debt. Management believes this metric is helpful to investors in assessing the company’s overall debt profile. Management has reduced adjusted debt by the amount of
hedge margin receivable, which reflects cash posted to counterparties, as we believe this removes the impact of current market volatility on our unsettled hedges and is a better
representation of the continued progress we have made on our debt initiatives.
(in billions) December 31, 2016 December 31, 2014 December 31, 2012
Adjusted total debt
Less: cash, cash equivalents and short-term investments
Less: hedge margin receivable
Adjusted net debt
Debt and capital lease obligations
Plus: unamortized discount, net and debt issuance costs
Adjusted debt and capital lease obligations
Plus: 7x last twelve months' aircraft rent
Year Ended Year Ended Year Ended Year Ended Year Ended
(in billions) December 31, 2016 December 31, 2015 December 31, 2014 December 31, 2013 December 31, 2012
Net cash provided by operating activities (GAAP) 7.2$ 7.9$ 4.9$ 4.5$ 2.5$
Adjustments:
Hedge deferrals (0.1) 0.4 — — —
Hedge margin (0.1) (0.8) 0.9 — —
Reimbursements related to build-to-suit leased facilities — (0.1) — — —
SkyMiles used pursuant to advance purchase under AMEX agreement — — — 0.3 0.3
Net cash provided by operating activities, adjusted 7.0$ 7.4$ 5.8$ 4.8$ 2.8$
Operating Cash Flow, Adjusted. Delta presents adjusted operating cash flow because management believes adjusting for the following items provides a more meaningful measure for investors. Adjustments include:
Hedge deferrals. During the March 2015 quarter, we effectively deferred settlement of a portion of our hedge portfolio until 2016 by entering into fuel derivative transactions that, excluding market movements from the date of the transactions,
would provide approximately $150 million in cash receipts during the September 2015 quarter and $150 million in cash receipts for the December 2015 quarter. Additionally, these transactions require approximately $300 million in cash
payments in 2016 (excluding market movements from the date of the transactions). By effectively deferring settlement of a portion of the original derivative transactions, the restructured hedge portfolio provides additional time for the fuel market
to stabilize while adding some hedge protection in 2016. Operating cash flow is adjusted to include these deferral transactions in order to allow investors to better understand the net impact of hedging activities in the periods shown.
Hedge margin. Operating cash flow is adjusted for hedge margin as we believe this adjustment removes the impact of current market volatility on our unsettled hedges and allows investors to better understand and analyze the company’s core
operational performance in the periods shown.
Reimbursements related to build-to-suit facilities . Management believes investors should be informed that these reimbursements for build-to-suit leased facilities effectively reduce net cash provided by operating activities and related capital
expenditures.
Non-GAAP Reconciliations
17
+185% +165%
+100% +150%
Operating Margin, adjusted
Free Cash Flow
Year Ended Year Ended
December 31, 2016 December 31, 2015
17.5 % 19.2 %
(1.1)% (3.2)%
Restructuring and other — 0.1 %
0.1 % 0.1 %
16.5 % 16.2 %
Adjusted for:
MTM adjustments and settlements
Refinery sales
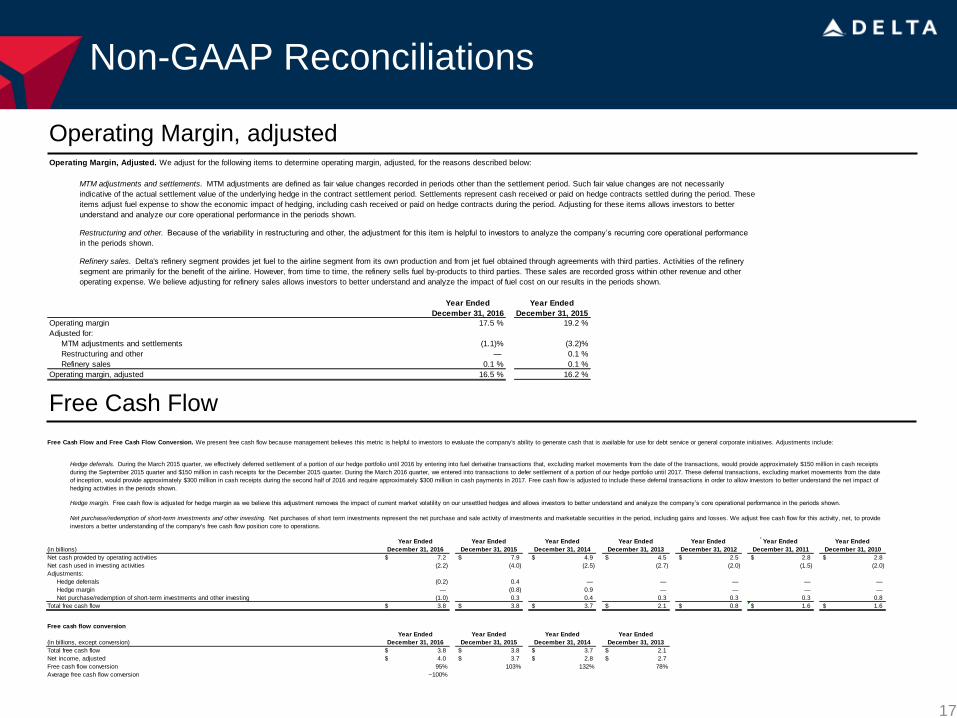
Operating Margin, Adjusted. We adjust for the following items to determine operating margin, adjusted, for the reasons described below:
Operating margin, adjusted
Operating margin
MTM adjustments and settlements. MTM adjustments are defined as fair value changes recorded in periods other than the settlement period. Such fair value changes are not necessarily
indicative of the actual settlement value of the underlying hedge in the contract settlement period. Settlements represent cash received or paid on hedge contracts settled during the period. These
items adjust fuel expense to show the economic impact of hedging, including cash received or paid on hedge contracts during the period. Adjusting for these items allows investors to better
understand and analyze our core operational performance in the periods shown.
Restructuring and other. Because of the variability in restructuring and other, the adjustment for this item is helpful to investors to analyze the company’s recurring core operational performance
in the periods shown.
Refinery sales. Delta's refinery segment provides jet fuel to the airline segment from its own production and from jet fuel obtained through agreements with third parties. Activities of the refinery
segment are primarily for the benefit of the airline. However, from time to time, the refinery sells fuel by-products to third parties. These sales are recorded gross within other revenue and other
operating expense. We believe adjusting for refinery sales allows investors to better understand and analyze the impact of fuel cost on our results in the periods shown.
Year Ended Year Ended Year Ended Year Ended Year Ended Year Ended Year Ended
December 31, 2016 December 31, 2015 December 31, 2014 December 31, 2013 December 31, 2012 December 31, 2011 December 31, 2010
Net cash provided by operating activities 7.2$ 7.9$ 4.9$ 4.5$ 2.5$ 2.8$ 2.8$
(2.2) (4.0) (2.5) (2.7) (2.0) (1.5) (2.0)
(0.2) 0.4 — — — — —
— (0.8) 0.9 — — — —
(1.0) 0.3 0.4 0.3 0.3 0.3 0.8
3.8$ 3.8$ 3.7$ 2.1$ 0.8$ 1.6$ 1.6$
Free cash flow conversion
Year Ended Year Ended Year Ended Year Ended
December 31, 2016 December 31, 2015 December 31, 2014 December 31, 2013
Total free cash flow 3.8$ 3.8$ 3.7$ 2.1$
Net income, adjusted 4.0$ 3.7$ 2.8$ 2.7$
Free cash flow conversion 95% 103% 132% 78%
Average free cash flow conversion ~100%
Free Cash Flow and Free Cash Flow Conversion. We present free cash flow because management believes this metric is helpful to investors to evaluate the company's ability to generate cash that is available for use for debt service or general corporate initiatives. Adjustments include:
Hedge deferrals. During the March 2015 quarter, we effectively deferred settlement of a portion of our hedge portfolio until 2016 by entering into fuel derivative transactions that, excluding market movements from the date of the transactions, would provide approximately $150 million in cash receipts
during the September 2015 quarter and $150 million in cash receipts for the December 2015 quarter. During the March 2016 quarter, we entered into transactions to defer settlement of a portion of our hedge portfolio until 2017. These deferral transactions, excluding market movements from the date
of inception, would provide approximately $300 million in cash receipts during the second half of 2016 and require approximately $300 million in cash payments in 2017. Free cash flow is adjusted to include these deferral transactions in order to allow investors to better understand the net impact of
hedging activities in the periods shown.
Hedge margin. Free cash flow is adjusted for hedge margin as we believe this adjustment removes the impact of current market volatility on our unsettled hedges and allows investors to better understand and analyze the company’s core operational performance in the periods shown.
Net purchase/redemption of short-term investments and other investing. Net purchases of short term investments represent the net purchase and sale activity of investments and marketable securities in the period, including gains and losses. We adjust free cash flow for this activity, net, to provide
investors a better understanding of the company's free cash flow position core to operations.
(in billions, except conversion)
Net purchase/redemption of short-term investments and other investing
Total free cash flow
(in billions)
Net cash used in investing activities
Adjustments:
Hedge deferrals
Hedge margin
Non-GAAP Reconciliations
18
+185% +165%
+100% +150%
Non-Fuel Unit Cost per Available Seat Mile, Including Profit Sharing (“CASM-Ex”)
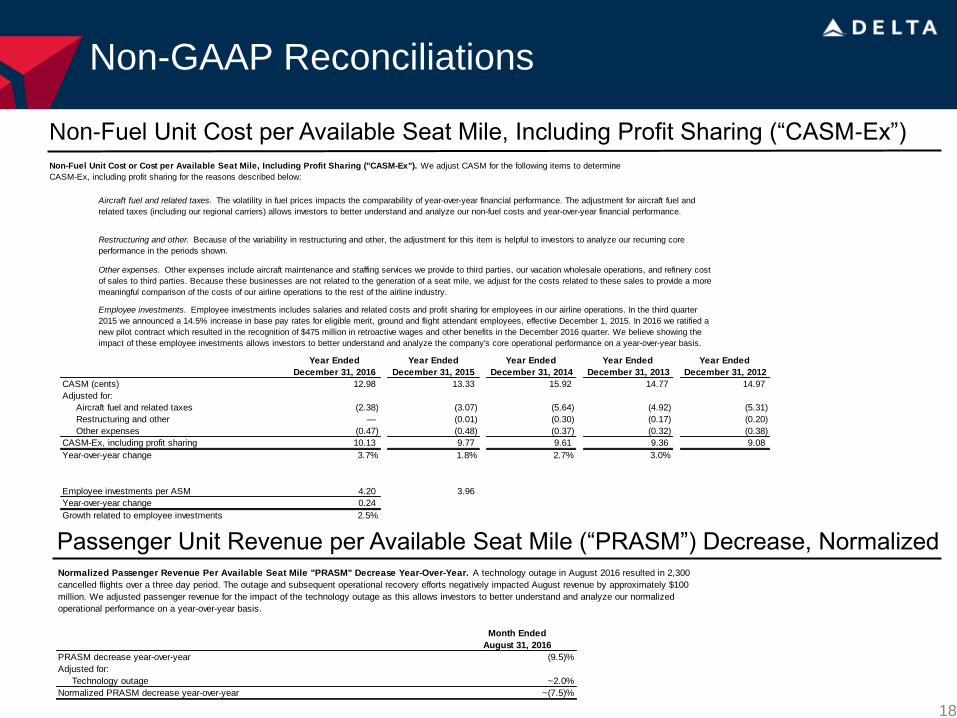
Non-Fuel Unit Cost or Cost per Available Seat Mile, Including Profit Sharing ("CASM-Ex"). We adjust CASM for the following items to determine
CASM-Ex, including profit sharing for the reasons described below:
Employee investments. Employee investments includes salaries and related costs and profit sharing for employees in our airline operations. In the third quarter
2015 we announced a 14.5% increase in base pay rates for eligible merit, ground and flight attendant employees, effective December 1, 2015. In 2016 we ratified a
new pilot contract which resulted in the recognition of $475 million in retroactive wages and other benefits in the December 2016 quarter. We believe showing the
impact of these employee investments allows investors to better understand and analyze the company's core operational performance on a year-over-year basis.
Other expenses. Other expenses include aircraft maintenance and staffing services we provide to third parties, our vacation wholesale operations, and refinery cost
of sales to third parties. Because these businesses are not related to the generation of a seat mile, we adjust for the costs related to these sales to provide a more
meaningful comparison of the costs of our airline operations to the rest of the airline industry.
Restructuring and other. Because of the variability in restructuring and other, the adjustment for this item is helpful to investors to analyze our recurring core
performance in the periods shown.
Aircraft fuel and related taxes. The volatility in fuel prices impacts the comparability of year-over-year financial performance. The adjustment for aircraft fuel and
related taxes (including our regional carriers) allows investors to better understand and analyze our non-fuel costs and year-over-year financial performance.
Year Ended Year Ended Year Ended Year Ended Year Ended
December 31, 2016 December 31, 2015 December 31, 2014 December 31, 2013 December 31, 2012
12.98 13.33 15.92 14.77 14.97
(2.38) (3.07) (5.64) (4.92) (5.31)
— (0.01) (0.30) (0.17) (0.20)
(0.47) (0.48) (0.37) (0.32) (0.38)
10.13 9.77 9.61 9.36 9.08
3.7% 1.8% 2.7% 3.0%
Employee investments per ASM 4.20 3.96
Year-over-year change 0.24
Growth related to employee investments 2.5%
CASM-Ex, including profit sharing
Year-over-year change
CASM (cents)
Adjusted for:
Aircraft fuel and related taxes
Restructuring and other
Other expenses
Passenger Unit Revenue per Available Seat Mile (“PRASM”) Decrease, Normalized
Month Ended
August 31, 2016
PRASM decrease year-over-year (9.5)%
Adjusted for:
Technology outage ~2.0%
Normalized PRASM decrease year-over-year ~(7.5)%
Normalized Passenger Revenue Per Available Seat Mile "PRASM" Decrease Year-Over-Year. A technology outage in August 2016 resulted in 2,300
cancelled flights over a three day period. The outage and subsequent operational recovery efforts negatively impacted August revenue by approximately $100
million. We adjusted passenger revenue for the impact of the technology outage as this allows investors to better understand and analyze our normalized
operational performance on a year-over-year basis.