Embed Size (px)
Citation preview
Delran Sewerage Authority, Wastewater Treatment Plant SWA, Inc. – Local Government Energy Audit Report Page 1/44
August 10, 2010
Local Government Energy Program
Final Energy Audit Report
For
Delran Sewerage Authority Wastewater Treatment Plant
Control Building Blower and Generator Building
Sludge Processor Building Norman Ave. & River Rd.
Delran, NJ 08075
Project Number: LGEA35
Steven Winter Associates, Inc. 50 Washington Street Telephone (203) 857-0200 Architects and Engineers Norwalk, CT 06854 Facsimile (203) 852-0741
www.swinter.com E-mail: [email protected]
Delran Sewerage Authority, Wastewater Treatment Plant SWA, Inc. – Local Government Energy Audit Report Page 2/44
Table of Contents INTRODUCTION ................................................................................................................................... 3 EXECUTIVE SUMMARY ..................................................................................................................... 4 ECM SUMMARY TABLES ................................................................................................................... 6 1. HISTORIC ENERGY CONSUMPTION ................................................................................. 7 1.1. ENERGY USAGE AND COST ANALYSIS ........................................................................................ 7 1.2. UTILITY RATE ............................................................................................................................. 8 1.3. ENERGY BENCHMARKING .......................................................................................................... 9 2. FACILITY AND SYSTEMS DESCRIPTION ....................................................................... 11 2.1. BUILDING CHARACTERISTICS .................................................................................................. 11 2.2. BUILDING OCCUPANCY PROFILES ............................................................................................ 11 2.3. BUILDING ENVELOPE ................................................................................................................ 11 2.3.1. EXTERIOR WALLS ..................................................................................................................... 11 2.3.2. ROOF .......................................................................................................................................... 11 2.3.3. BASE ........................................................................................................................................... 12 2.3.4. WINDOWS .................................................................................................................................. 12 2.3.5. EXTERIOR DOORS ..................................................................................................................... 13 2.3.6. BUILDING AIR TIGHTNESS ........................................................................................................ 13 2.4. HVAC SYSTEMS ........................................................................................................................ 14 2.4.1. HEATING .................................................................................................................................... 14 2.4.2. COOLING ................................................................................................................................... 14 2.4.3. VENTILATION ............................................................................................................................ 15 2.4.4. DOMESTIC HOT WATER ........................................................................................................... 16 2.5. ELECTRICAL SYSTEMS.............................................................................................................. 16 2.5.1. LIGHTING .................................................................................................................................. 16 2.5.2. ELEVATORS ............................................................................................................................... 16 2.5.3. BUILDING SYSTEMS EQUIPMENT LIST .................................................................................... 17 3. WASTEWATER TREATMENT PLANT PROCESS .......................................................... 18 4. ENERGY CONSERVATION MEASURES .......................................................................... 28 CATEGORY I RECOMMENDATIONS: CAPITAL IMPROVEMENTS ......................................................... 28 CATEGORY II RECOMMENDATIONS: OPERATIONS AND MAINTENANCE ........................................... 28 CATEGORY III RECOMMENDATIONS: ENERGY CONSERVATION MEASURES .................................... 29 5. RENEWABLE AND DISTRIBUTED ENERGY MEASURES ........................................... 35 5.1. EXISTING SYSTEMS ................................................................................................................... 35 5.2. SOLAR PHOTOVOLTAIC ............................................................................................................ 35 5.3. SOLAR THERMAL COLLECTORS .............................................................................................. 35 5.4. COMBINED HEAT AND POWER ................................................................................................. 35 5.5. GEOTHERMAL ........................................................................................................................... 35 5.6. WIND .......................................................................................................................................... 35 6. ENERGY PURCHASING AND PROCUREMENT STRATEGIES ................................... 35 6.1. ENERGY PURCHASING .............................................................................................................. 35 6.2. TARIFF ANALYSIS ...................................................................................................................... 38 6.3. ENERGY PROCUREMENT STRATEGIES .................................................................................... 39 7. METHOD OF ANALYSIS ...................................................................................................... 40 7.1. ASSUMPTIONS AND METHODS .................................................................................................. 40 7.2. DISCLAIMER .............................................................................................................................. 40 APPENDIX A: LIGHTING STUDY ............................................................................................................ 41 APPENDIX B: THIRD PARTY ENERGY SUPPLIERS (ESCOS) ................................................................ 44
Delran Sewerage Authority, Wastewater Treatment Plant SWA, Inc. – Local Government Energy Audit Report Page 3/44
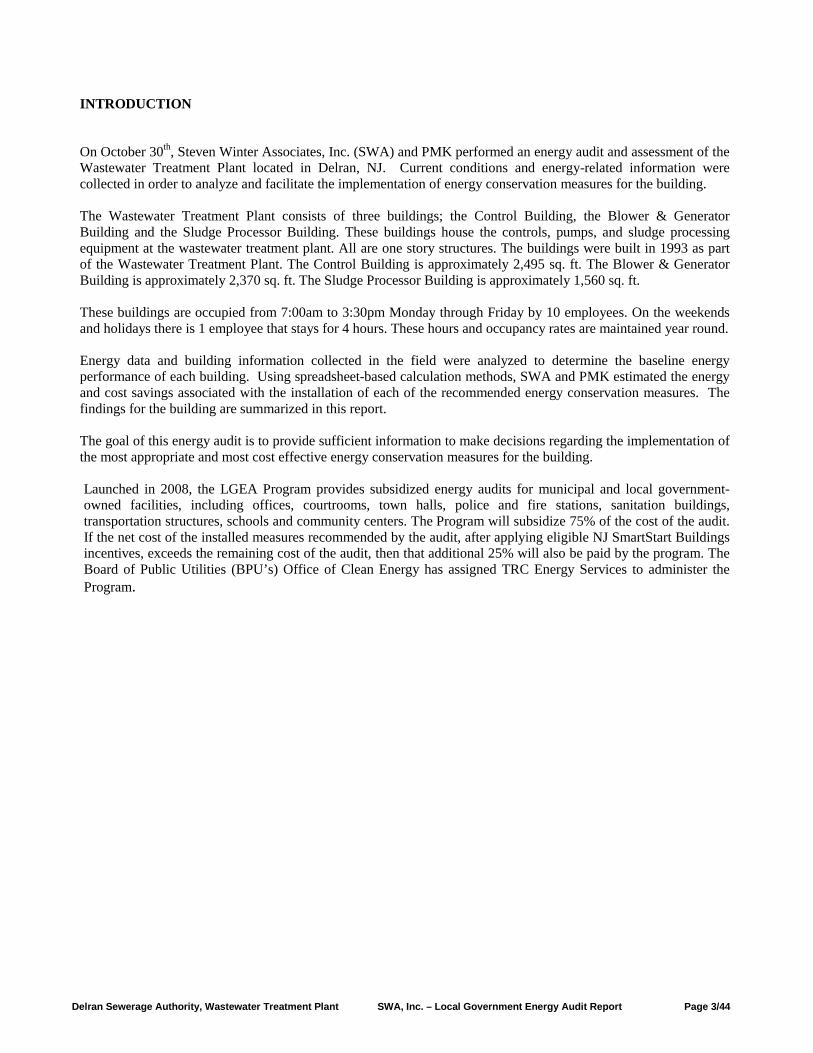
INTRODUCTION On October 30th, Steven Winter Associates, Inc. (SWA) and PMK performed an energy audit and assessment of the Wastewater Treatment Plant located in Delran, NJ. Current conditions and energy-related information were collected in order to analyze and facilitate the implementation of energy conservation measures for the building.
The Wastewater Treatment Plant consists of three buildings; the Control Building, the Blower & Generator Building and the Sludge Processor Building. These buildings house the controls, pumps, and sludge processing equipment at the wastewater treatment plant. All are one story structures. The buildings were built in 1993 as part of the Wastewater Treatment Plant. The Control Building is approximately 2,495 sq. ft. The Blower & Generator Building is approximately 2,370 sq. ft. The Sludge Processor Building is approximately 1,560 sq. ft. These buildings are occupied from 7:00am to 3:30pm Monday through Friday by 10 employees. On the weekends and holidays there is 1 employee that stays for 4 hours. These hours and occupancy rates are maintained year round. Energy data and building information collected in the field were analyzed to determine the baseline energy performance of each building. Using spreadsheet-based calculation methods, SWA and PMK estimated the energy and cost savings associated with the installation of each of the recommended energy conservation measures. The findings for the building are summarized in this report. The goal of this energy audit is to provide sufficient information to make decisions regarding the implementation of the most appropriate and most cost effective energy conservation measures for the building. Launched in 2008, the LGEA Program provides subsidized energy audits for municipal and local government-owned facilities, including offices, courtrooms, town halls, police and fire stations, sanitation buildings, transportation structures, schools and community centers. The Program will subsidize 75% of the cost of the audit. If the net cost of the installed measures recommended by the audit, after applying eligible NJ SmartStart Buildings incentives, exceeds the remaining cost of the audit, then that additional 25% will also be paid by the program. The Board of Public Utilities (BPU’s) Office of Clean Energy has assigned TRC Energy Services to administer the Program.
Delran Sewerage Authority, Wastewater Treatment Plant SWA, Inc. – Local Government Energy Audit Report Page 4/44
EXECUTIVE SUMMARY
This document contains the energy audit report for the Control Building, Blower and Generator Building and Sludge Processor building located within the Wastewater Treatment Plant at the intersection of Norman Ave and River Rd, Delran, NJ 08075. Based on the field visit performed by Steven Winter Associates (SWA) and PMK staff on October 30th, 2009 and the results of a comprehensive energy analysis, this report describes the site’s current conditions and recommendations for improvements. Suggestions for measures related to energy conservation and improved comfort are provided in the scope of work. Energy and resource savings are estimated for each measure that results in a reduction of heating, cooling, and electric usage. Current conditions In the most recent full year of data collected (10/1/08-9/30/09), the buildings consumed 2,434,627 kWh or $331,643.74 worth of electricity, and 3,990 therms or $7,011.52 worth of natural gas and 896 gallons or $2,895.71 worth of diesel fuel for the emergency generator. The average aggregated cost of electricity was calculated to be $0.14/kWh, the average aggregated cost of natural gas was calculated to be $1.77/therm and the average aggregated cost of diesel fuel was calculated to be $3.23/gallon. With electricity and fossil fuel combined, the building consumed 8,825 MMBtus of energy at a total cost of $336,173.83. SWA/BSG-PMK has entered energy information about the Delran Sewerage Authority Wastewater Treatment Plant building in the U.S. Environmental Protection Agency’s (EPA) Energy Star Portfolio Manager Energy benchmarking system. The username is delransewerauth and the password is delransewer. The building performance rating received is a score of 27 when compared to other buildings of its kind. Buildings achieving an Energy Star rating of 75 are eligible to apply for the Energy Star award and receive the Energy Star plaque to convey superior performance. These ratings also greatly help when applying for Leadership in Energy and Environmental Design (LEED) building certification through the United States Green Building Council (USGBC). SWA encourages the Delran Sewer Authority to continue to entering utility data in Energy Star Portfolio Manager in order to track weather normalized source energy use over time. The Site Energy Use Intensity is 5 kBtu/gpd (gallons per day) compared to the national average of a wastewater treatment plant consuming 4 kBtu/gpd. There may be procurement opportunities for the Delran Sewerage Authority to reduce annual utility costs. After energy efficiency improvements are implemented, future utility bills can be added to the Portfolio Manager and the site energy use intensity for a different time period can be compared to the year 2009 baseline to track the changes in energy consumption associated with the energy improvements. Based on the assessment of the Delran Sewerage Authority Wastewater Treatment Plant, BSG-PMK and SWA has separated the recommendations into three categories (See Section 4 for more details). These are summarized as follows:
Delran Sewerage Authority, Wastewater Treatment Plant SWA, Inc. – Local Government Energy Audit Report Page 5/44
Recommendations
Category I recommendations: capital improvements.
• During the Audit process BSG-PMK discovered that the cooling provided by the current system in the Control Building does not appear to be sufficient for this size building. BSG-PMK recommends the system be balanced and a load calculation be done that includes current insulation levels to determine the sizing and design of a new system.
• Electrical submeters should be installed at the Influent Pump Station, Effluent Pump Station, A/O Tank Mixers, and Blowers.
• Air Flow meters should be installed to measure; the Total Air Flow from Centrifugal Blowers, the Total Air Flow from the PD Blowers, 5 meters in each of the A/O Tanks to measure the amount of air entering the aerobic process.
• Conifer trees should be planted along the Delaware River’s edge. The trees will act as windbreakers and reduce the cold winter winds that cause the water temperature in the tanks to decrease causing increased density which in turn causes more energy to be used inject air and mix the tanks. Also this measure will decrease the wind on the sand filtration equipment and decrease the amount of freezing that occurs in the winter.
Category II: O&M
• Enclose the canopied space that houses the sludge disposal conveyer belt. The conveyer belt freezes in winter. Enclosing the space with plywood walls would shield the area with a higher R value than the tarp that is currently in use.
• Smart Strips can be used in the offices and lab to automatically turn off appliances when not in use. Smart strips are a combination surge protector and autoswitch which can have appliances plugged in and then switch them off when they are not in use. This type of switch will cut off the small current that runs to appliances when they are not in use. Smart Strips can be purchased at Walmart or many other stores for approximately $30.
Category III: ECMs
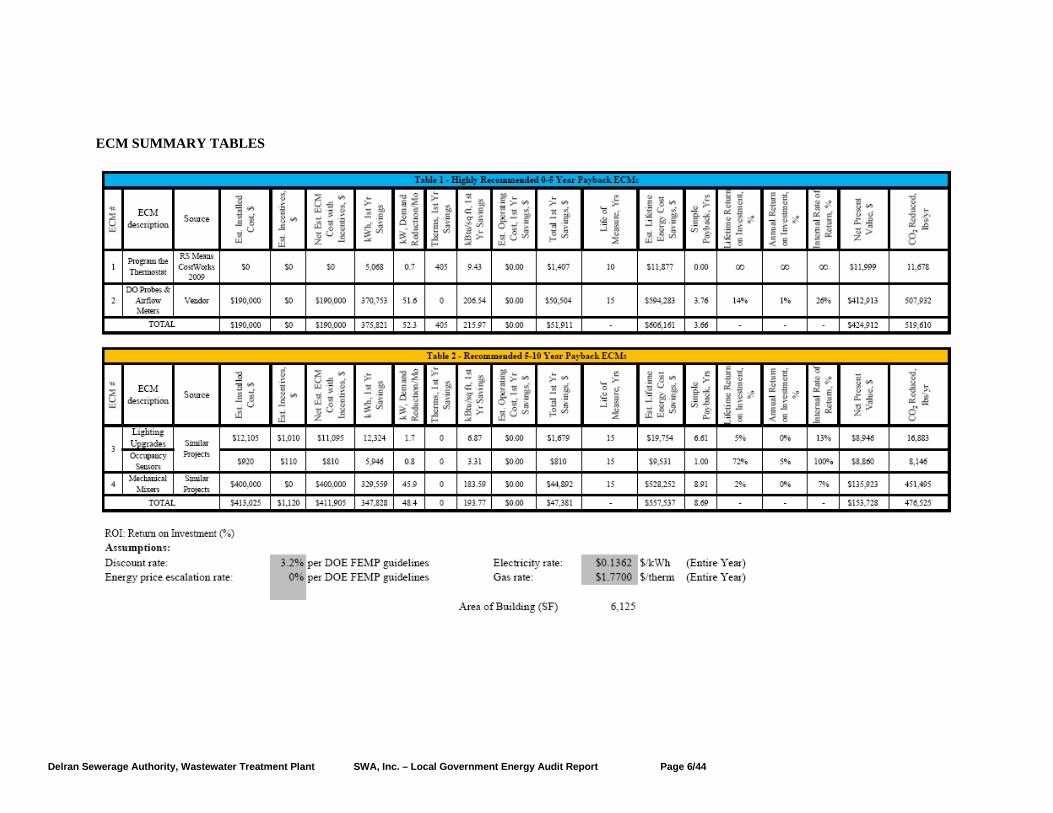
At this time, SWA/BSG-PMK highly recommends a total of 4 Energy Conservation Measures (ECMs) for the Delran Sewerage Authority (DSA) Wastewater Treatment Plant that are summarized in the following table. The total investment cost for these ECMs, with incentives, is $601,905. SWA/BSG-PMK estimates a first year savings of $99,292 with an aggregated simple payback of 6.1 years. SWA/BSG-PMK estimates that implementing the highly recommended ECMs will reduce the carbon footprint of the Wastewater Treatment Plant by 996,135 lbs of CO2.
There are various incentives that the Delran Sewerage Authority Wastewater Treatment Plant could apply for that could also help lower the cost of installing the ECMs. SWA/BSG-PMK recommends that the DSA apply for the NJ SmartStart program through the New Jersey Office of Clean Energy. This incentive can help provide technical assistance for the building in the implementation phase of any energy conservation project.
Delran Sewerage Authority, Wastewater Treatment Plant SWA, Inc. – Local Government Energy Audit Report Page 6/44
ECM SUMMARY TABLES
Delran Sewerage Authority, Wastewater Treatment Plant SWA, Inc. – Local Government Energy Audit Report Page 7/44
1. HISTORIC ENERGY CONSUMPTION
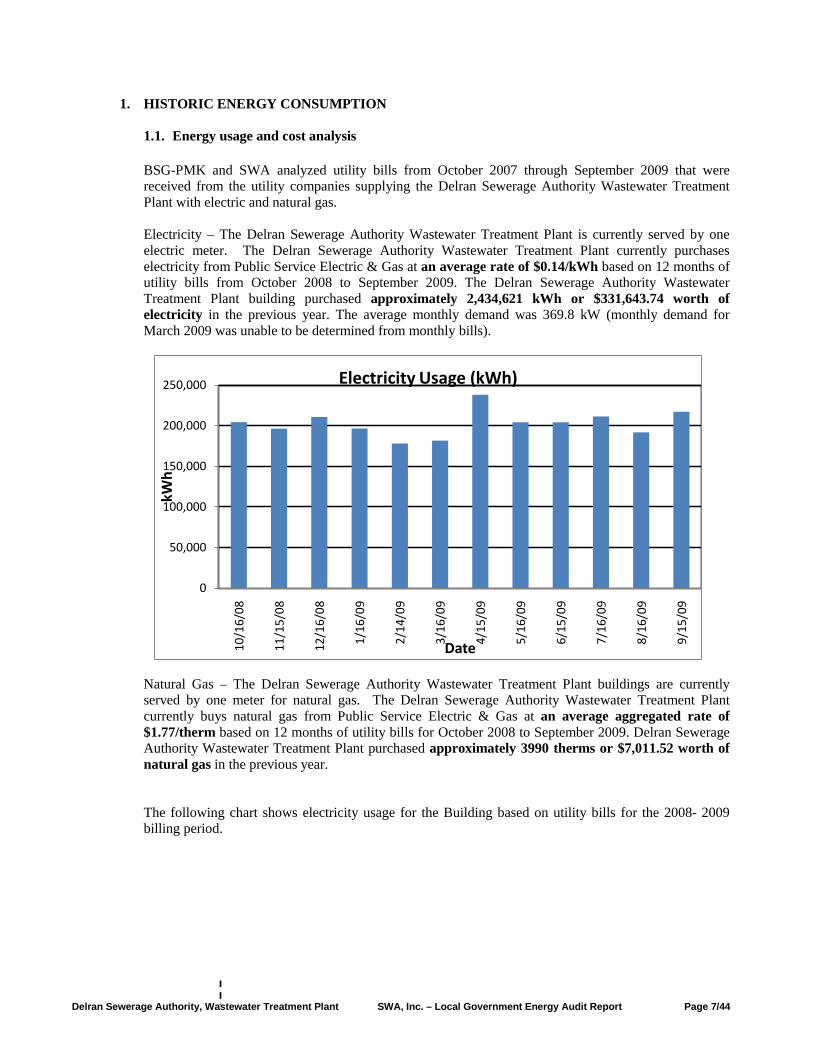
1.1. Energy usage and cost analysis BSG-PMK and SWA analyzed utility bills from October 2007 through September 2009 that were received from the utility companies supplying the Delran Sewerage Authority Wastewater Treatment Plant with electric and natural gas. Electricity – The Delran Sewerage Authority Wastewater Treatment Plant is currently served by one electric meter. The Delran Sewerage Authority Wastewater Treatment Plant currently purchases electricity from Public Service Electric & Gas at an average rate of $0.14/kWh based on 12 months of utility bills from October 2008 to September 2009. The Delran Sewerage Authority Wastewater Treatment Plant building purchased approximately 2,434,621 kWh or $331,643.74 worth of electricity in the previous year. The average monthly demand was 369.8 kW (monthly demand for March 2009 was unable to be determined from monthly bills).
Natural Gas – The Delran Sewerage Authority Wastewater Treatment Plant buildings are currently served by one meter for natural gas. The Delran Sewerage Authority Wastewater Treatment Plant currently buys natural gas from Public Service Electric & Gas at an average aggregated rate of $1.77/therm based on 12 months of utility bills for October 2008 to September 2009. Delran Sewerage Authority Wastewater Treatment Plant purchased approximately 3990 therms or $7,011.52 worth of natural gas in the previous year.
The following chart shows electricity usage for the Building based on utility bills for the 2008- 2009 billing period.
0
50,000
100,000
150,000
200,000
250,000
10/1
6/08
11/1
5/08
12/1
6/08
1/16
/09
2/14
/09
3/16
/09
4/15
/09
5/16
/09
6/15
/09
7/16
/09
8/16
/09
9/15
/09
kWh
Date
Electricity Usage (kWh)
Delran Sewerage Authority, Wastewater Treatment Plant SWA, Inc. – Local Government Energy Audit Report Page 8/44
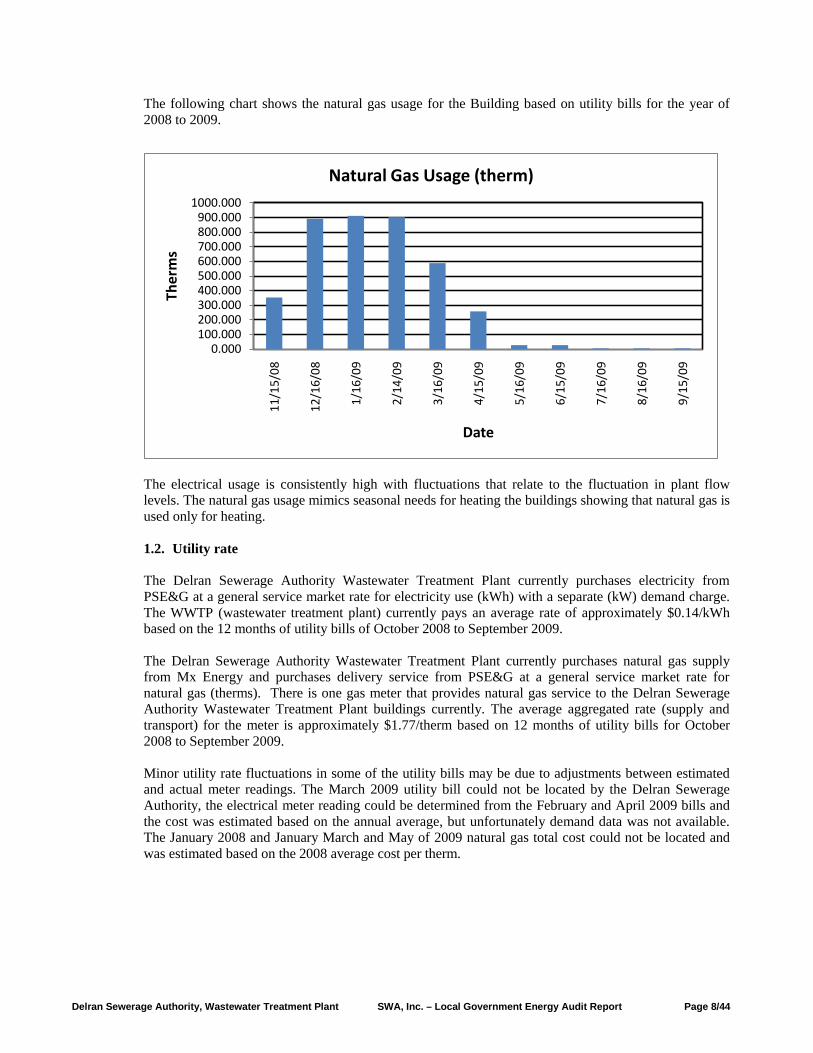
The following chart shows the natural gas usage for the Building based on utility bills for the year of 2008 to 2009.
The electrical usage is consistently high with fluctuations that relate to the fluctuation in plant flow levels. The natural gas usage mimics seasonal needs for heating the buildings showing that natural gas is used only for heating. 1.2. Utility rate
The Delran Sewerage Authority Wastewater Treatment Plant currently purchases electricity from PSE&G at a general service market rate for electricity use (kWh) with a separate (kW) demand charge. The WWTP (wastewater treatment plant) currently pays an average rate of approximately $0.14/kWh based on the 12 months of utility bills of October 2008 to September 2009. The Delran Sewerage Authority Wastewater Treatment Plant currently purchases natural gas supply from Mx Energy and purchases delivery service from PSE&G at a general service market rate for natural gas (therms). There is one gas meter that provides natural gas service to the Delran Sewerage Authority Wastewater Treatment Plant buildings currently. The average aggregated rate (supply and transport) for the meter is approximately $1.77/therm based on 12 months of utility bills for October 2008 to September 2009. Minor utility rate fluctuations in some of the utility bills may be due to adjustments between estimated and actual meter readings. The March 2009 utility bill could not be located by the Delran Sewerage Authority, the electrical meter reading could be determined from the February and April 2009 bills and the cost was estimated based on the annual average, but unfortunately demand data was not available. The January 2008 and January March and May of 2009 natural gas total cost could not be located and was estimated based on the 2008 average cost per therm.
0.000100.000200.000300.000400.000500.000600.000700.000800.000900.000
1000.000
11/1
5/08
12/1
6/08
1/16
/09
2/14
/09
3/16
/09
4/15
/09
5/16
/09
6/15
/09
7/16
/09
8/16
/09
9/15
/09
Ther
ms
Date
Natural Gas Usage (therm)
Delran Sewerage Authority, Wastewater Treatment Plant SWA, Inc. – Local Government Energy Audit Report Page 9/44
1.3. Energy benchmarking
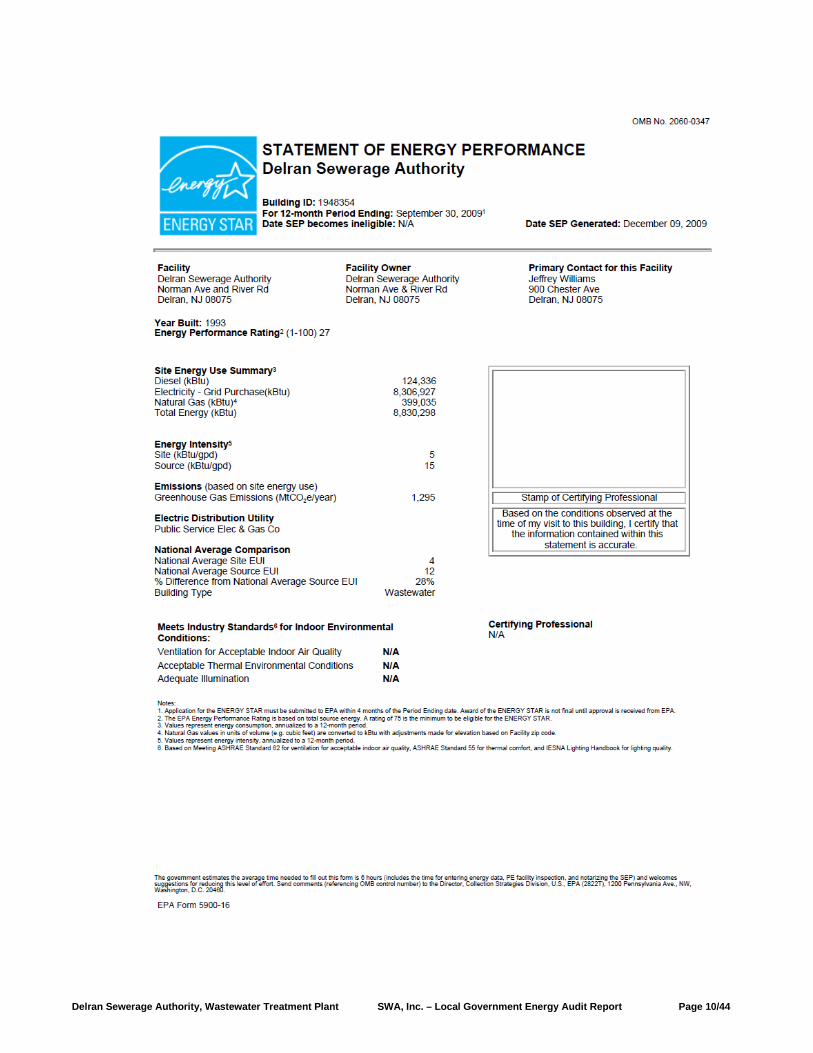
BSG-PMK has entered energy information about the Delran Sewerage Authority Wastewater Treatment Plant buildings in the U.S. Environmental Protection Agency’s (EPA) Energy Star Portfolio Manager Energy benchmarking system. The username is delransewerauth and the password is delransewer. The building performance rating received is a score of 27 when compared to other Wastewater Treatment Plants of its kind. Buildings achieving an Energy Star rating of 75 or higher and professionally verified to meet current indoor environmental standards are eligible to apply for the Energy Star award and receive the Energy Star plaque to convey superior performance to students, parents, taxpayers, and employees. These ratings also greatly help when applying for Leadership in Energy and Environmental Design (LEED) building certification to the United States Green Building Council (USGBC). SWA encourages the Delran Sewer Authority to continue to entering utility data in Energy Star Portfolio Manager in order to track weather normalized source energy use over time. The Site Energy Use Intensity is 5 kBtu/gpd/yr compared to the national average of a Wastewater Treatment plant consuming 4 kBtu/gpd/ yr. Implementing this report’s highly recommended Energy Conservations Measures (ECMs) will reduce use by approximately 1.43 kBtu/gpd/yr.
http://www.energystar.gov/index.cfm?c=evaluate_performance.bus_portfoliomanager Username: delransewerauth Password: delransewer
Delran Sewerage Authority, Wastewater Treatment Plant SWA, Inc. – Local Government Energy Audit Report Page 10/44
Delran Sewerage Authority, Wastewater Treatment Plant SWA, Inc. – Local Government Energy Audit Report Page 11/44
2. FACILITY AND SYSTEMS DESCRIPTION
2.1. Building Characteristics
The Wastewater Treatment Plant consists of three buildings; the Control Building, the Blower & Generator Building and the Sludge Processor Building. These buildings house the controls, pumps, and sludge processing equipment at the wastewater treatment plant. All are one story structures. The buildings were built in 1993 as part of the Wastewater Treatment Plant. The Control Building is approximately 2,495 sq. ft. The Blower & Generator Building is approximately 2,370 sq. ft. The Sludge Processor Building is approximately 1,560 sq. ft.
2.2. Building occupancy profiles
These buildings are occupied from 7:00am to 3:30pm Monday through Friday by 10 employees. On the weekends and holidays there is 1 employee that stays for 4 hours. These hours and occupancy rates are maintained year round.
2.3. Building envelope
2.3.1. Exterior walls
Control Building
The exterior walls consist of 8” split faced CMU and mortar, with interior walls made of drywall with metal studs and R-11 insulation in between. The total thickness of the outside walls is approximately 10”-12”. Exterior and interior finishes of the envelope were found to be in good condition and without cracks or water damage.
Blower and Generator Building
The exterior walls consist of 8” CMU and mortar with a painted interior finish. The total thickness of the walls is 8”. The walls were found to be in good condition without cracks or water damage.
Sludge Processor Building
The exterior walls consist of 8” CMU and mortar with a painted interior finish. The total thickness of the walls is 8”. The walls were found to be in good condition without cracks or water damage.
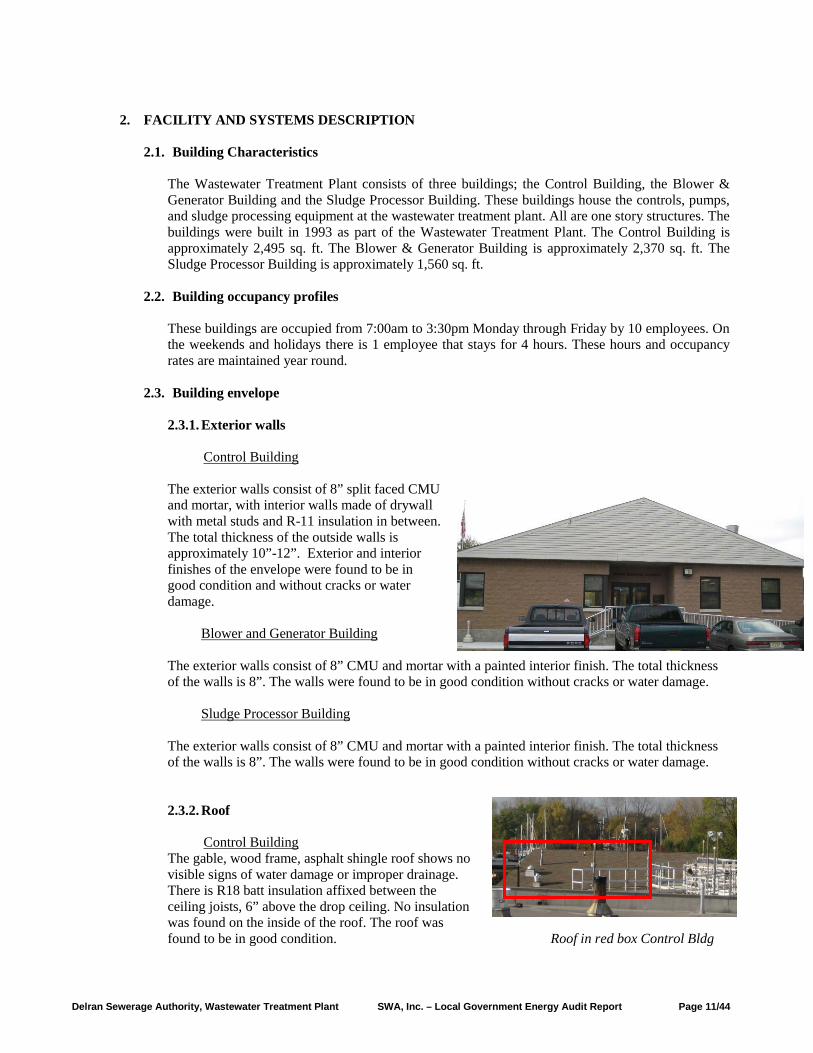
2.3.2. Roof
The gable, wood frame, asphalt shingle roof shows no visible signs of water damage or improper drainage. There is R18 batt insulation affixed between the ceiling joists, 6” above the drop ceiling. No insulation was found on the inside of the roof. The roof was found to be in good condition. Roof in red box Control Bldg
Control Building
Delran Sewerage Authority, Wastewater Treatment Plant SWA, Inc. – Local Government Energy Audit Report Page 12/44
Blower and Generator Building
The flat, light colored EPDM roof is constructed of steel decking with wood blocking around the perimeter. The mansard type roof has asphalt shingles on plywood and metal stud framing. The flat roof is white EPDM over tapered Isoboard. The roof is found to be in good condition with no signs of improper drainage or water damage.
Sludge Processor Building
The roof is white EPDM over Isoboard on metal decking. The roof was found to be in good condition with no signs of puncture, improper drainage or water damage. 2.3.3. Base
Control Building
The base of the building consists of reinforced, poured concrete. There are no signs of water damage or improper drainage. There is a pump room in the building which has an 18 foot deep basement where the pumps are located. This is also made of poured concrete and is in good condition.
Blower and Generator Building
The base of the building consists of reinforced, poured concrete. There are pipes that penetrate the floor and move wastewater from one portion of the plant to the other. The floor was found to be in good condition.
Sludge Processor Building
The base of the building consists of a reinforced poured concrete slab with no penetrations or basement. The base was found to be in good condition, but constantly wet because of the excess water being squeezed out of the solids.
2.3.4. Windows
Control Building
The windows measure 3’x 4 ½’ and have aluminum frames. The windows are double pane thermal windows with approximately 5/8” of space between the panes. There are a total of 11 windows on this building and none of them are to be damaged or in need of replacing. There were no complaints of drafts or infiltration.
Blower and Generator Building
There are no windows on this building.
Sludge Processor Building
The windows on this building measure 3’x 4 ½’ and have aluminum frames. The windows are double pane thermal windows with approximately 5/8” of space between the panes. There are a total of 6 windows on this building and none of them are to be damaged or in need of replacing. There were no complaints of drafts or infiltration.
Delran Sewerage Authority, Wastewater Treatment Plant SWA, Inc. – Local Government Energy Audit Report Page 13/44
2.3.5. Exterior doors
Control Building
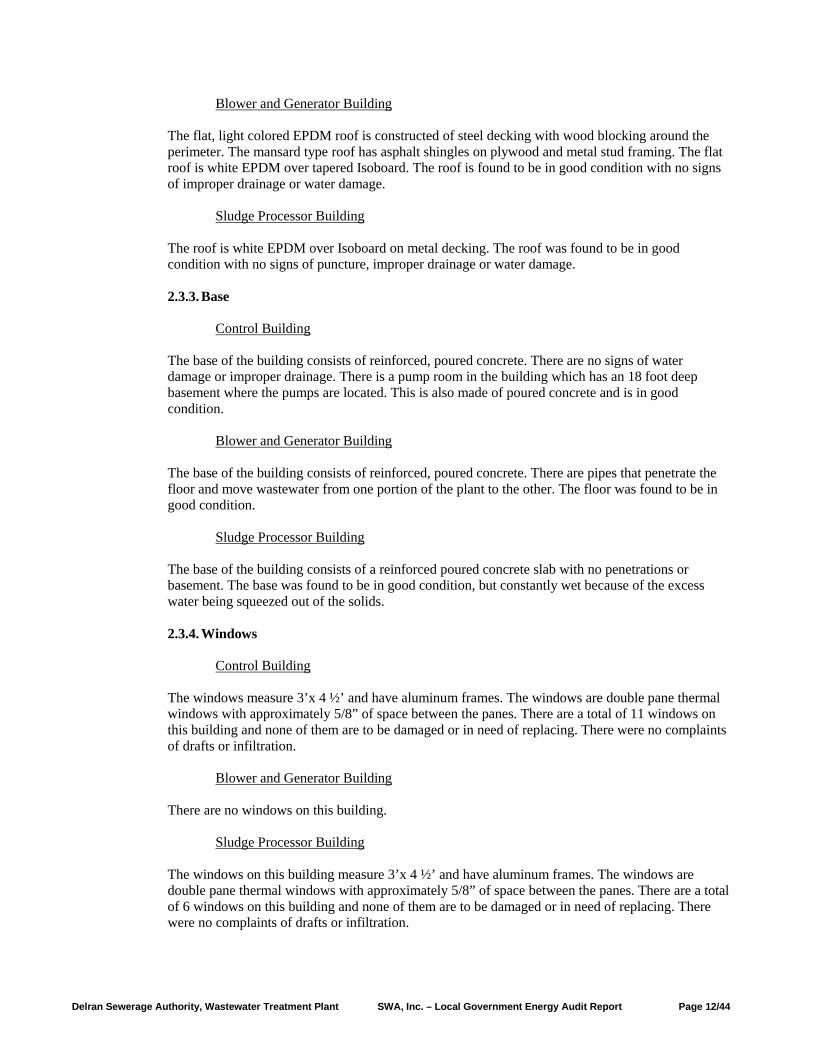
The front doors of the building are thermal, double pane glass set in an aluminum frame. The door is medium style with weather stripping. The bottom weather stripping needs repair. The side doors at the building are steel doors 5/8” thick and weather stripped with no infiltration.
Control Building front door
Blower and Generator Building
The building has 4 steel doors 5/8” thick and weather stripped with no infiltration.
Sludge Processor Building
The building has 4 aluminum medium style doors and 3 garage doors measuring 10’x 12’ made out of 1/8th” gauge metal. The roll-up doors were observed to be in good condition. A minor adjustment is necessary to close the gap at the bottom of the doors that is allowing air infiltration.
2.3.6. Building air tightness
Control Building
The building’s air tightness is in good condition. There are no areas other than the first set of front doors that require weather stripping repairs. There were no complaints from the occupants about drafts or cold spots.
Blower and Generator Building
The building’s air tightness is in good condition. There are no windows and the doors are fully weather tight. There were no complaints from the occupants about drafts.
Sludge Processor Building
The building is not air tight. The roll-up doors allow air to move in and out of the building. There is also an opening in the wall to allow the conveyer belt with the dried solids to exit and be dumped into containers. There is space outside the building over the solids disposal containers that are enclosed by a tarp attached to wooden framing.
Delran Sewerage Authority, Wastewater Treatment Plant SWA, Inc. – Local Government Energy Audit Report Page 14/44
2.4. HVAC systems
2.4.1. Heating
Control Building
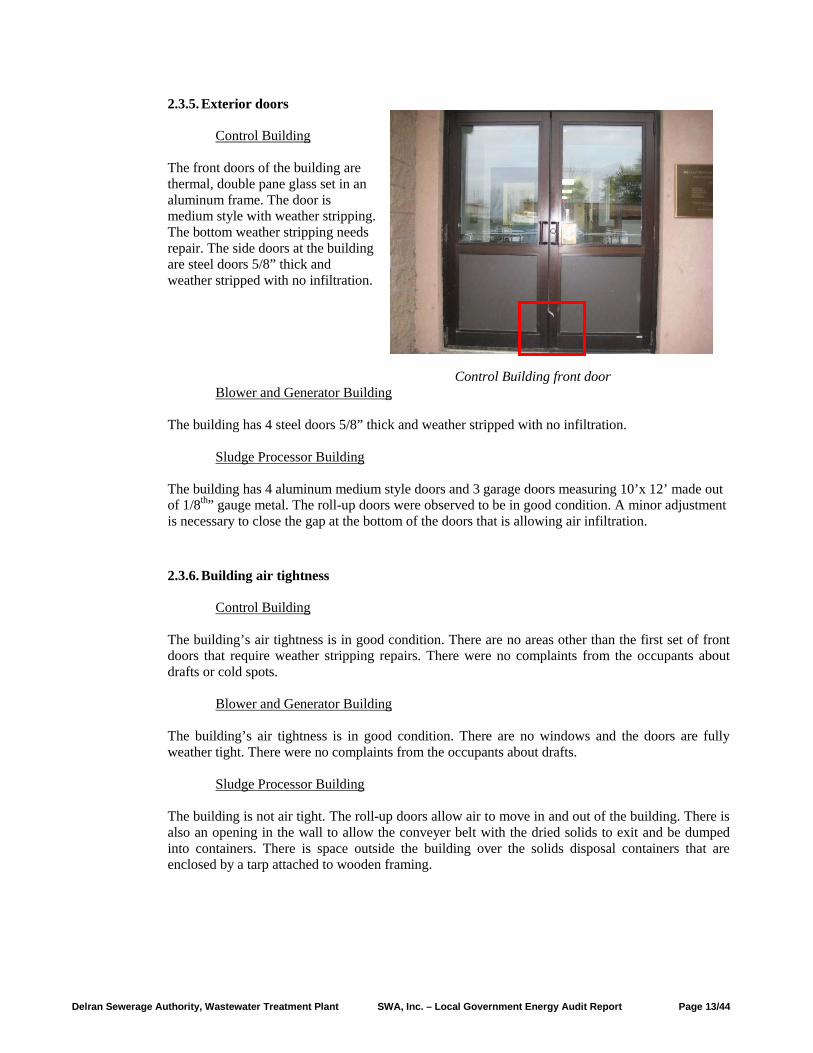
The heating is provided by a Lennox Whisper Heat forced hot air furnace (pictured to the right). The furnace is fueled by natural gas and services the entire building. The furnace is controlled by a digital, programmable thermostat that was set at 68 degrees. The unit is over ten years old and is operating poorly. The building occupants complain about not enough heat in the winter and supplement with portable, electric Lakewood space heaters in the laboratory, as well as electric wall mounted space heaters in the locker rooms and electric Q Mark
wall heaters in the bathrooms. The pump room attached to the building is heated by a Reznor natural gas powered unit heater mounted in the ceiling.
Blower and Generator Building
The heat in the building is mostly provided by the heat radiating off of the equipment. There are 4 natural gas fueled Reznor ceiling mounted unit heaters. As per the occupants account these unit heaters are rarely turned on because of the large amount of heat provided by the equipment.
Sludge Processor Building
The heat in the building is provided by 3 natural gas Reznor ceiling mounted unit heaters. These units are fueled by natural gas. Outside the building over the solids disposal containers there is an enclosed space which uses a Fastoria portable heating fan.
2.4.2. Cooling
Control Building
The building is cooled by a Rheem air conditioner condenser unit located in the back of the building that feeds a DX coil installed above the Lennox furnace. The occupants of the building complain that this unit is not sufficient to meet the cooling needs. This is why there are 4 supplemental wall mounted Air King fans located in the Laboratory, Lab Office, Administrative Office, and Entry Office.
Delran Sewerage Authority, Wastewater Treatment Plant SWA, Inc. – Local Government Energy Audit Report Page 15/44
Blower and Generator Building
The building has no central system for cooling. Located in the Control Room there is a mobile, electric powered Dayton 30” fan that is used for comfort. The fan is in good condition and there is no need for any central system.
Sludge Processor Building
The building is ventilated by opening the windows and garage doors. There is no central system for cooling.
2.4.3. Ventilation
Control Building
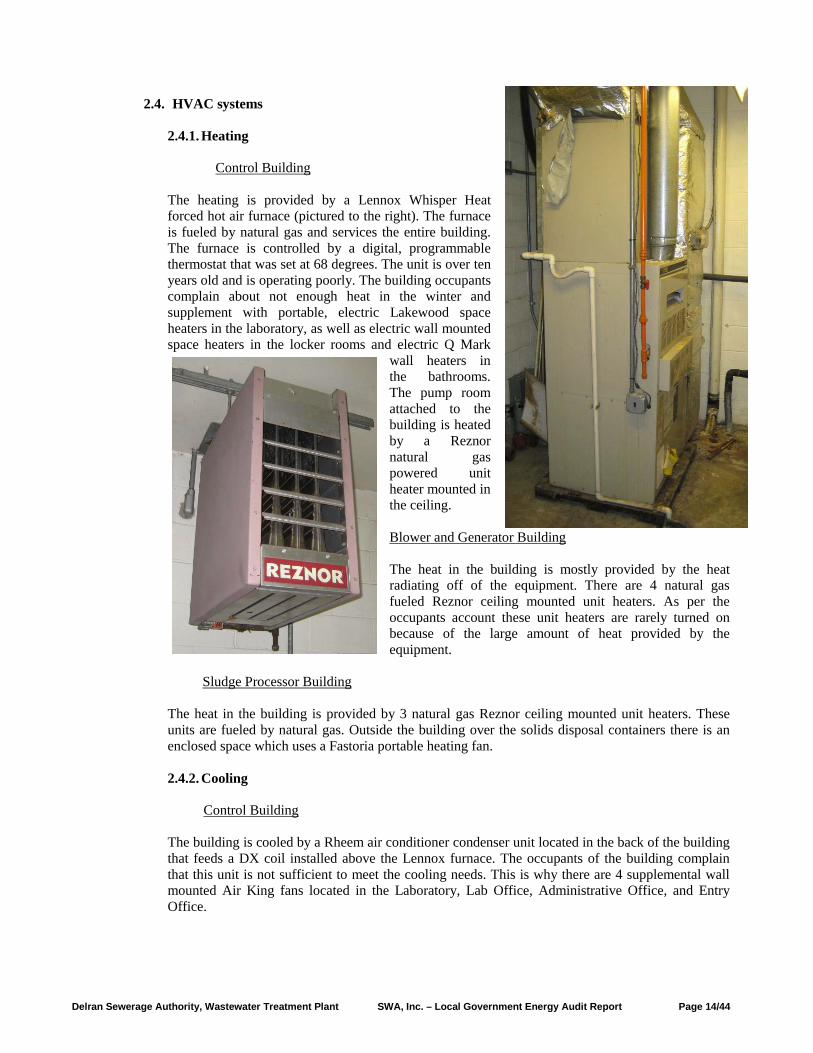
The building has exhaust fans and vent stacks on the roof. The bathroom spaces are ventilated by Penn Zephyr ceiling fans. There are 2 small Penn Ventilator upblast exhaust fans, mounted on the roof, that exhaust the air from the pump room. (Pictured in the background below)
Blower and Generator Building
Delran Sewerage Authority, Wastewater Treatment Plant SWA, Inc. – Local Government Energy Audit Report Page 16/44
The building has exhaust fans and hooded dampers on the roof to exhaust the air from the inside. There are 3 Greenheck centrifugal upblast exhaust fans over the generator room and the control room. Over the blower room there are three large barometric dampers with hoods mounted on the roof. (Pictured in the foreground above)
Sludge Processor Building
The building has 3 Greenheck centrifugal upblast exhaust fans mounted on the roof. These exhaust fans service the entire interior space.
2.4.4. Domestic Hot Water
Control Building
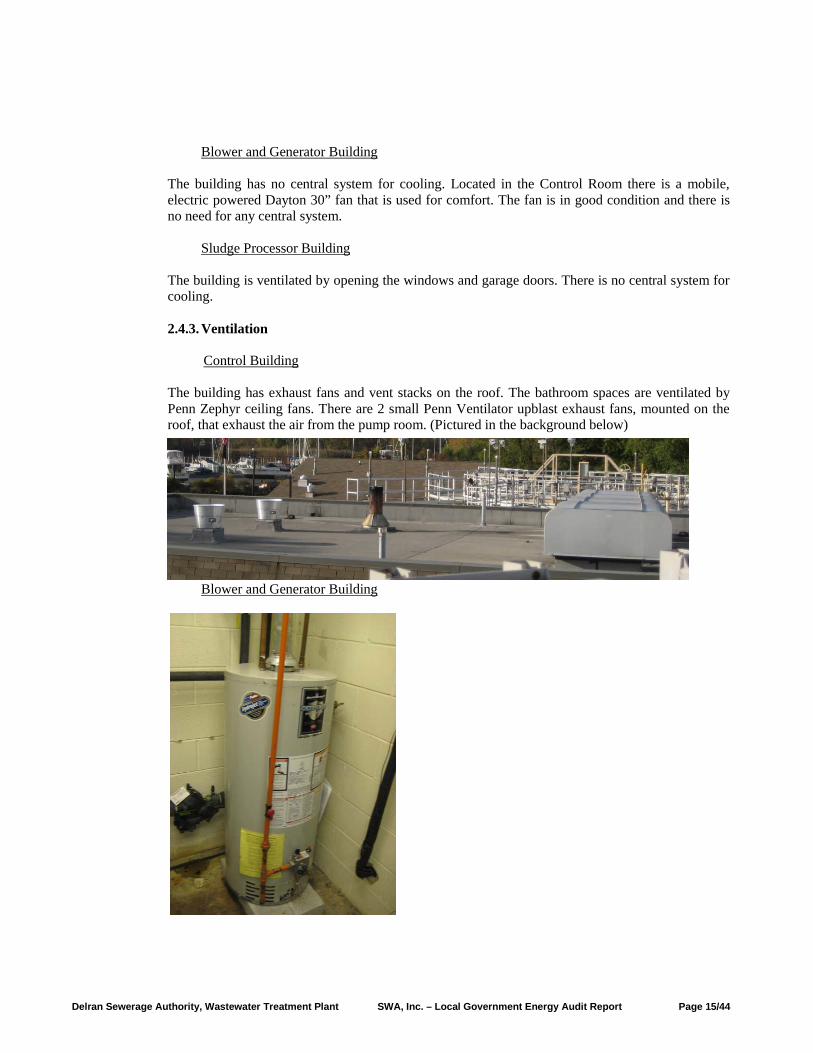
The building’s domestic hot water is supplied by a gas fired 40 gallon Bradford White Corporation Energy Saver water heater unit. The unit is fueled by natural gas and services the showers and sinks. (pictured here)
Blower and Generator Building
The building has no domestic hot water needs or equipment.
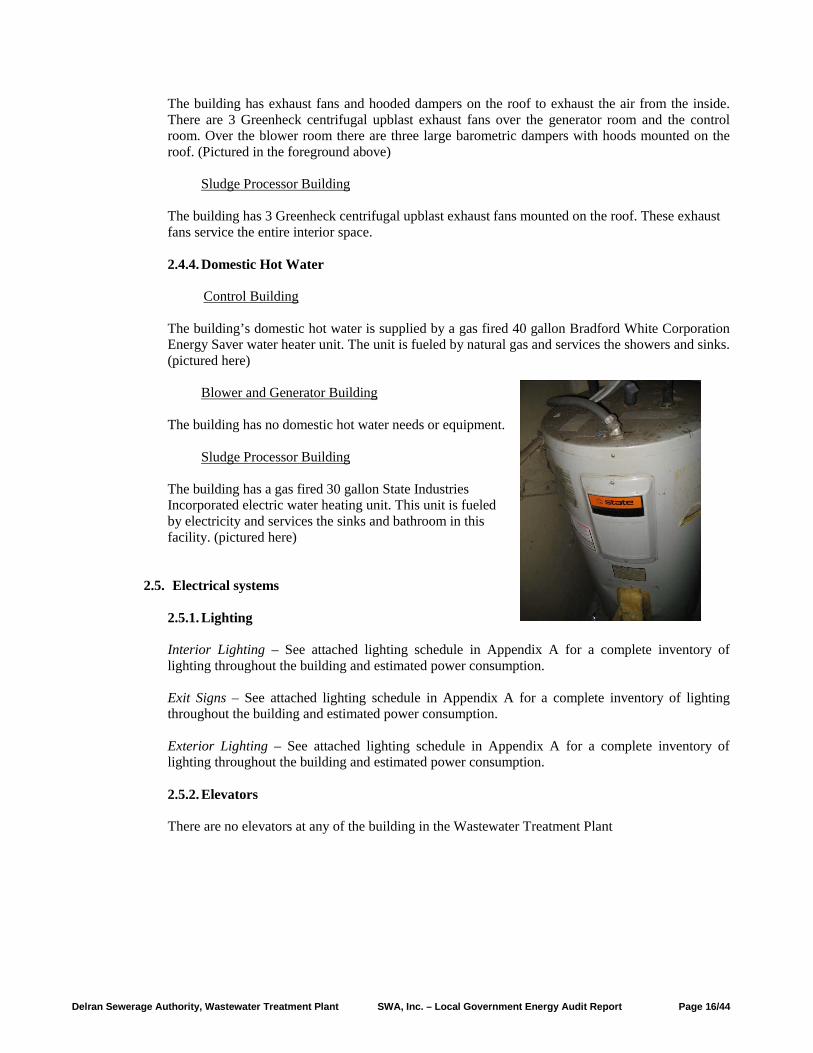
Sludge Processor Building
The building has a gas fired 30 gallon State Industries Incorporated electric water heating unit. This unit is fueled by electricity and services the sinks and bathroom in this facility. (pictured here)
2.5. Electrical systems
2.5.1. Lighting Interior Lighting – See attached lighting schedule in Appendix A for a complete inventory of lighting throughout the building and estimated power consumption.
Exit Signs – See attached lighting schedule in Appendix A for a complete inventory of lighting throughout the building and estimated power consumption. Exterior Lighting – See attached lighting schedule in Appendix A for a complete inventory of lighting throughout the building and estimated power consumption.
2.5.2. Elevators There are no elevators at any of the building in the Wastewater Treatment Plant
Delran Sewerage Authority, Wastewater Treatment Plant SWA, Inc. – Local Government Energy Audit Report Page 17/44
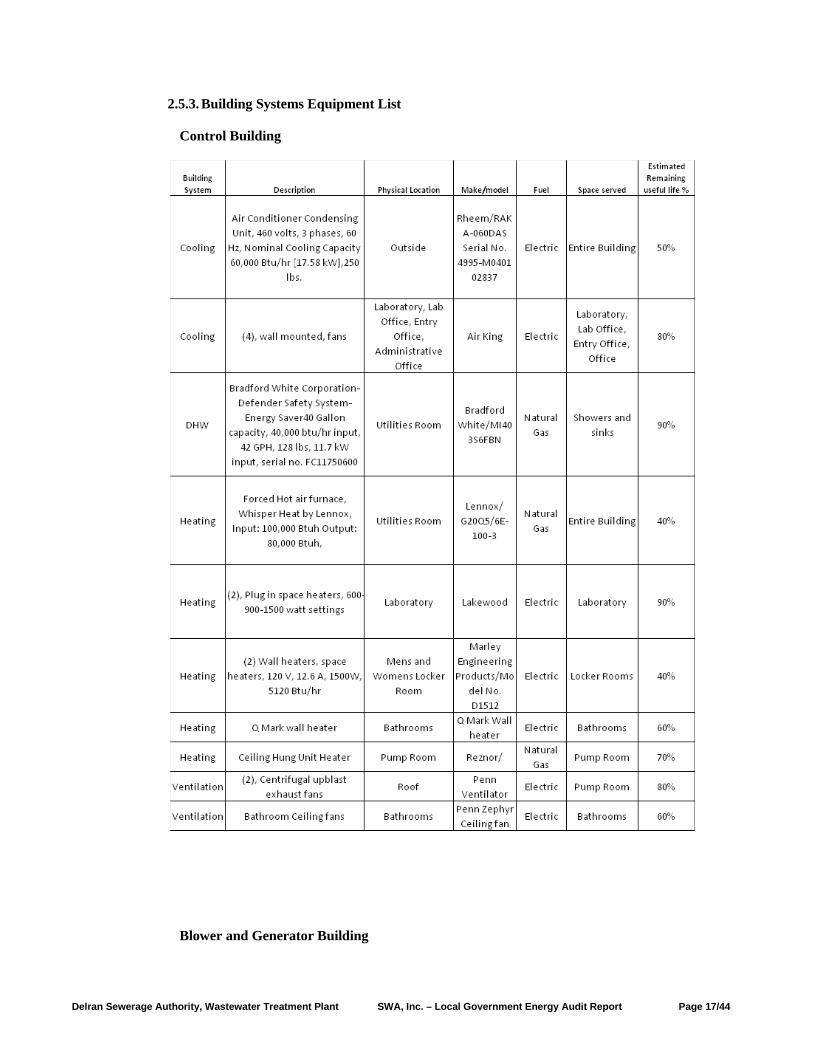
2.5.3. Building Systems Equipment List
Control Building
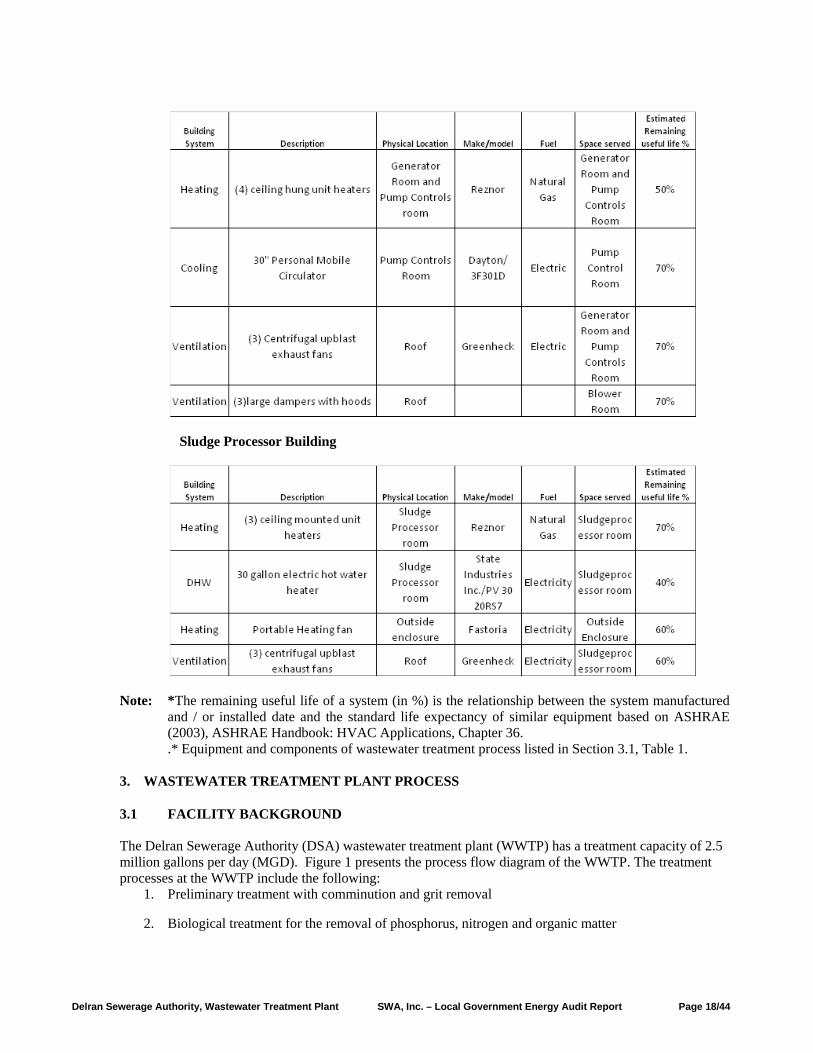
Blower and Generator Building
Delran Sewerage Authority, Wastewater Treatment Plant SWA, Inc. – Local Government Energy Audit Report Page 18/44
Sludge Processor Building
Note: *The remaining useful life of a system (in %) is the relationship between the system manufactured
and / or installed date and the standard life expectancy of similar equipment based on ASHRAE (2003), ASHRAE Handbook: HVAC Applications, Chapter 36. .* Equipment and components of wastewater treatment process listed in Section 3.1, Table 1.
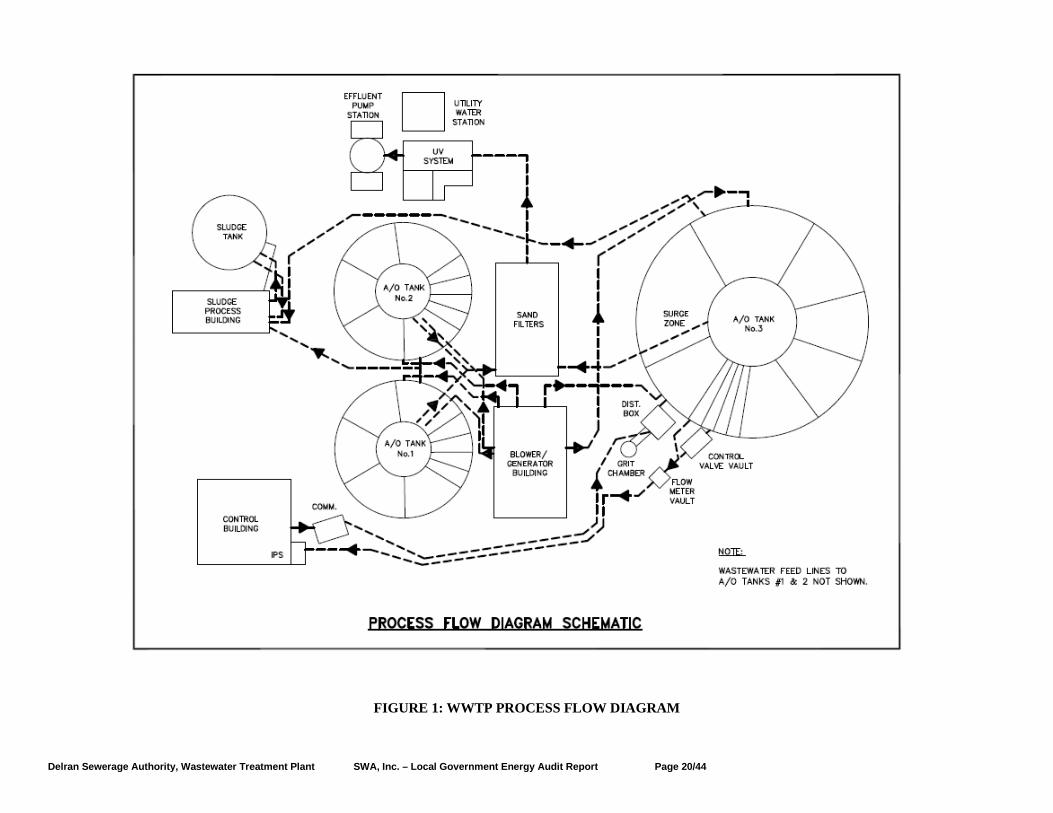
3. WASTEWATER TREATMENT PLANT PROCESS 3.1 FACILITY BACKGROUND The Delran Sewerage Authority (DSA) wastewater treatment plant (WWTP) has a treatment capacity of 2.5 million gallons per day (MGD). Figure 1 presents the process flow diagram of the WWTP. The treatment processes at the WWTP include the following:
1. Preliminary treatment with comminution and grit removal
2. Biological treatment for the removal of phosphorus, nitrogen and organic matter
Delran Sewerage Authority, Wastewater Treatment Plant SWA, Inc. – Local Government Energy Audit Report Page 19/44
3. Sand filtration for the removal of suspended solids from the biologically treated wastewater
4. Disinfection using ultraviolet (UV) light.
5. Waste activated sludge handling consisting of aerobic sludge stabilization followed by sludge thickening and dewatering.
Influent Wastewater Pumping
The influent wastewater enters the plant wet well and is pumped to a comminutor followed by a grit removal system before it enters a distribution box. The influent wastewater wet well is serviced by three (3) 50 HP Aurora centrifugal pumps each rated at 2,200 gallons per minute (GPM) with 72 feet TDH. One pump operates as a lead and the other two in a lag mode.
Comminution
The wastewater flows through an in-line 15 HP comminutor (Disposable Waste Systems, Model 4002) used to reduce the particle size of the solids contained in the wastewater.
Grit Removal
A TeaCup™ unit (Eutek Systems, Inc.) that utilizes a combination of free vortex and boundary layer effect to capture Sand, grit particles and high density solids.
Advanced Biological Treatment
The DSA employs an Anoxic - Oxic (A/O) biological process for the removal of phosphorus, nitrogen and biological oxygen demand (BOD) from the wastewater. There are three (3) steel-erected A/O units: A/O Tank No1, A/O Tank No2 and A/O Tank No2 with a design treatment capacity of 0.625 MGD, 0.625 MGD and 1.25 MGD, respectively. AO Tanks No 1 and 2 have nine (9) compartments (sections) and a secondary clarifier, while AO Tank N0 1 has ten (10) compartments and a secondary clarifier. These partitions provide the staging of anoxic conditions the removal of phosphorus and nitrogen and aerobic conditions for the removal of the BOD followed by sludge digestion aimed at reducing the mass of the waste activated sludge prior to its dewatering. Each A/O tanks has one section where the incoming wastewater from the primary treatment is mixed with the return activated sludge (RAS); three anoxic compartments where phosphorus and nitrogen are biological degraded under anoxic conditions, four sections operated in series where compressed air is injected and distributed in the water via flexible membrane fine bubble diffusers. Following the aerobic biological treatment, the water enters the circular second clarifier where the activated sludge is settled by gravity. A portion of the sludge, the RAS, is directed to the first compartment. The waste activated sludge (WAS) is fed to the ninth compartment where it is aerobically stabilized and thereby the mass of WAS is reduced. This compartment acts also at the end of the aerobic stabilization process as a sludge gravity thickener.
Delran Sewerage Authority, Wastewater Treatment Plant SWA, Inc. – Local Government Energy Audit Report Page 20/44
FIGURE 1: WWTP PROCESS FLOW DIAGRAM

Delran Sewerage Authority, Wastewater Treatment Plant SWA, Inc. – Local Government Energy Audit Report Page 21/44
Sand Filtration
The combined effluent from the secondary clarifiers (one per A/O Tank) is applied to sand filters to remove additional suspended solids. There are two (2) travelling bridge sand filters equipped with a 420 gpm backwash pump, a 24 gpm surface wash pump and a 77 gpm surface wash transfer pump. The traveling bridge is powered by a 0.25 HP reversible rotation motor.
Disinfection
The effluent from the sand filters is disinfected, metered and discharged to the Delaware River. Ultraviolet (UV) radiation is used disinfection. The originally installed UV disinfection system is currently being upgraded with a more efficient UV generation system.
Solids Handling
In each A/O Tank, waste activated sludge (WAS) from the secondary clarifier is fed to an aerobic sludge stabilization chamber. Following WAS mass reduction, and removal of water supernatant, the thickened sludge is pumped via rotary lobe positive displacement sludge transfer pumps to the sludge dewatering building. There, it is mixed with a polymeric flocculant and dewatered in a belt filter press.
Effluent Pumps
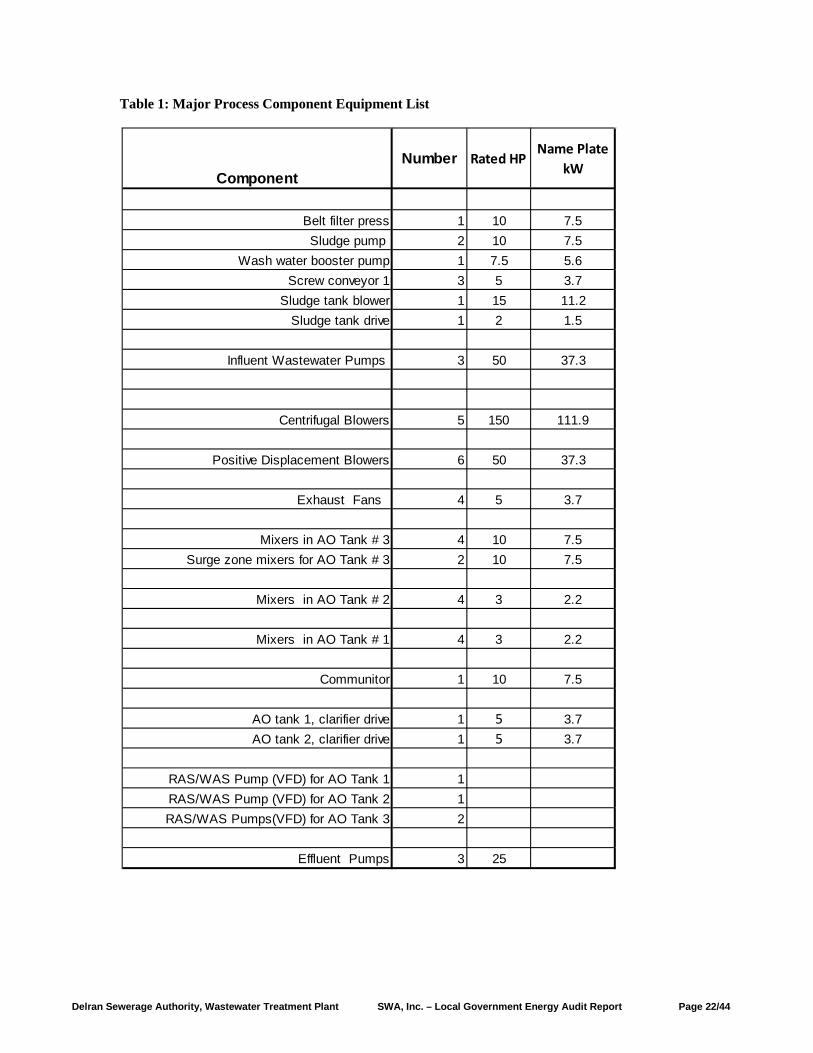
The treated effluent is discharged to the Rancocas Creek. There are three (3) nonclog 25 HP Flyght submersible pumps rated at 2,300 gpm @ 18 feet TDH each. One pump operates as the lead, the second one in lag mode and the third one is on stand-by. A list of the major electric equipment is provided in Table 1
Delran Sewerage Authority, Wastewater Treatment Plant SWA, Inc. – Local Government Energy Audit Report Page 22/44
Table 1: Major Process Component Equipment List
ComponentNumber Rated HP
Name Plate kW
Belt filter press 1 10 7.5Sludge pump 2 10 7.5
Wash water booster pump 1 7.5 5.6Screw conveyor 1 3 5 3.7
Sludge tank blower 1 15 11.2Sludge tank drive 1 2 1.5
Influent Wastewater Pumps 3 50 37.3
Centrifugal Blowers 5 150 111.9
Positive Displacement Blowers 6 50 37.3
Exhaust Fans 4 5 3.7
Mixers in AO Tank # 3 4 10 7.5Surge zone mixers for AO Tank # 3 2 10 7.5
Mixers in AO Tank # 2 4 3 2.2
Mixers in AO Tank # 1 4 3 2.2
Communitor 1 10 7.5
AO tank 1, clarifier drive 1 5 3.7AO tank 2, clarifier drive 1 5 3.7
RAS/WAS Pump (VFD) for AO Tank 1 1 RAS/WAS Pump (VFD) for AO Tank 2 1 RAS/WAS Pumps(VFD) for AO Tank 3 2
Effluent Pumps 3 25
Delran Sewerage Authority, Wastewater Treatment Plant SWA, Inc. – Local Government Energy Audit Report Page 23/44
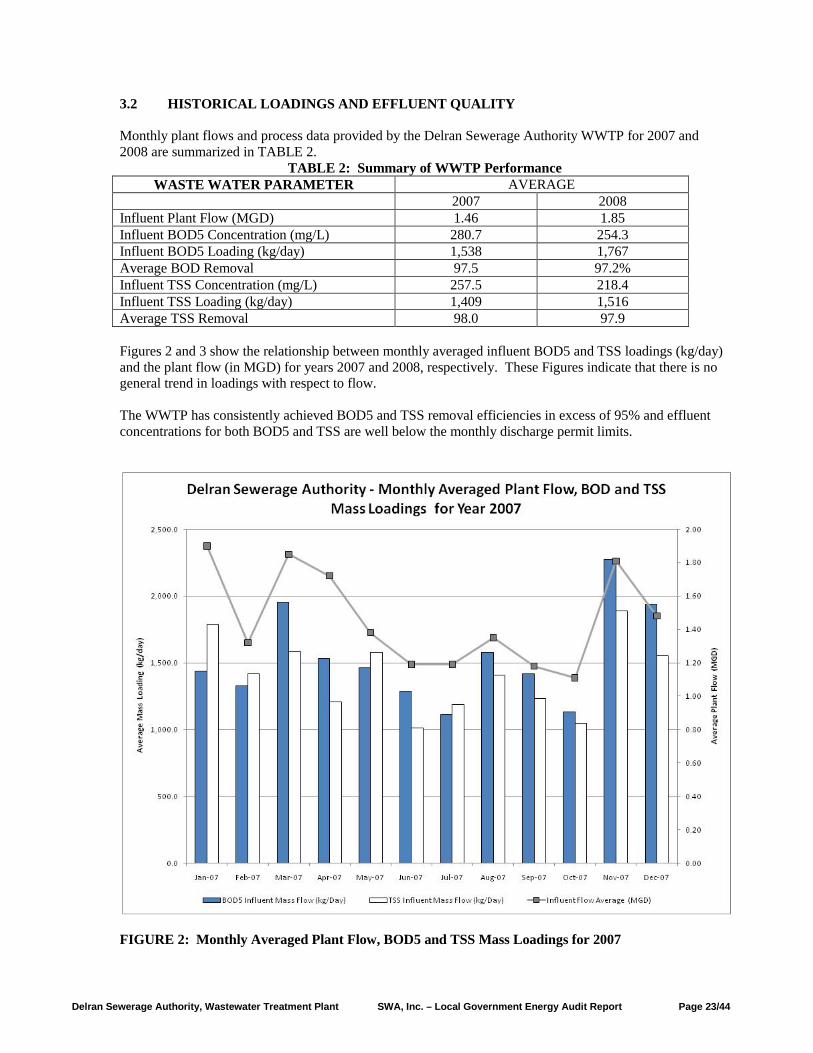
3.2 HISTORICAL LOADINGS AND EFFLUENT QUALITY Monthly plant flows and process data provided by the Delran Sewerage Authority WWTP for 2007 and 2008 are summarized in TABLE 2.
TABLE 2: Summary of WWTP Performance WASTE WATER PARAMETER AVERAGE
2007 2008 Influent Plant Flow (MGD) 1.46 1.85 Influent BOD5 Concentration (mg/L) 280.7 254.3 Influent BOD5 Loading (kg/day) 1,538 1,767 Average BOD Removal 97.5 97.2% Influent TSS Concentration (mg/L) 257.5 218.4 Influent TSS Loading (kg/day) 1,409 1,516 Average TSS Removal 98.0 97.9 Figures 2 and 3 show the relationship between monthly averaged influent BOD5 and TSS loadings (kg/day) and the plant flow (in MGD) for years 2007 and 2008, respectively. These Figures indicate that there is no general trend in loadings with respect to flow. The WWTP has consistently achieved BOD5 and TSS removal efficiencies in excess of 95% and effluent concentrations for both BOD5 and TSS are well below the monthly discharge permit limits.
FIGURE 2: Monthly Averaged Plant Flow, BOD5 and TSS Mass Loadings for 2007
Delran Sewerage Authority, Wastewater Treatment Plant SWA, Inc. – Local Government Energy Audit Report Page 24/44
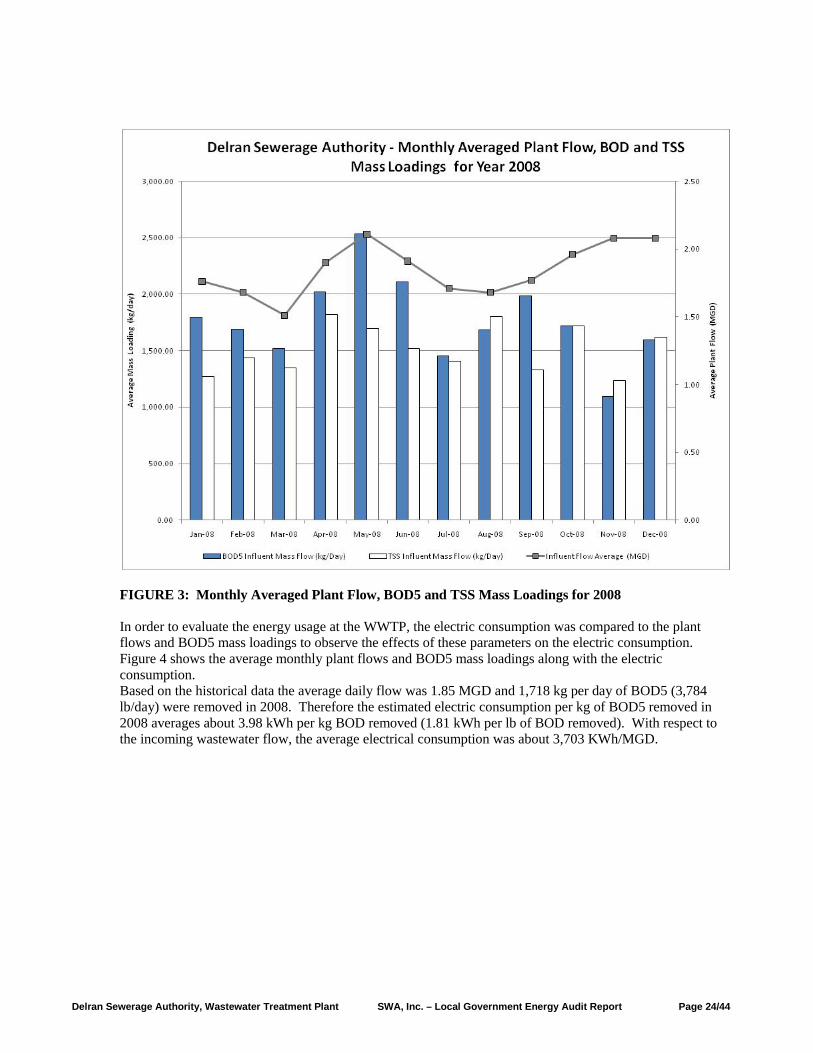
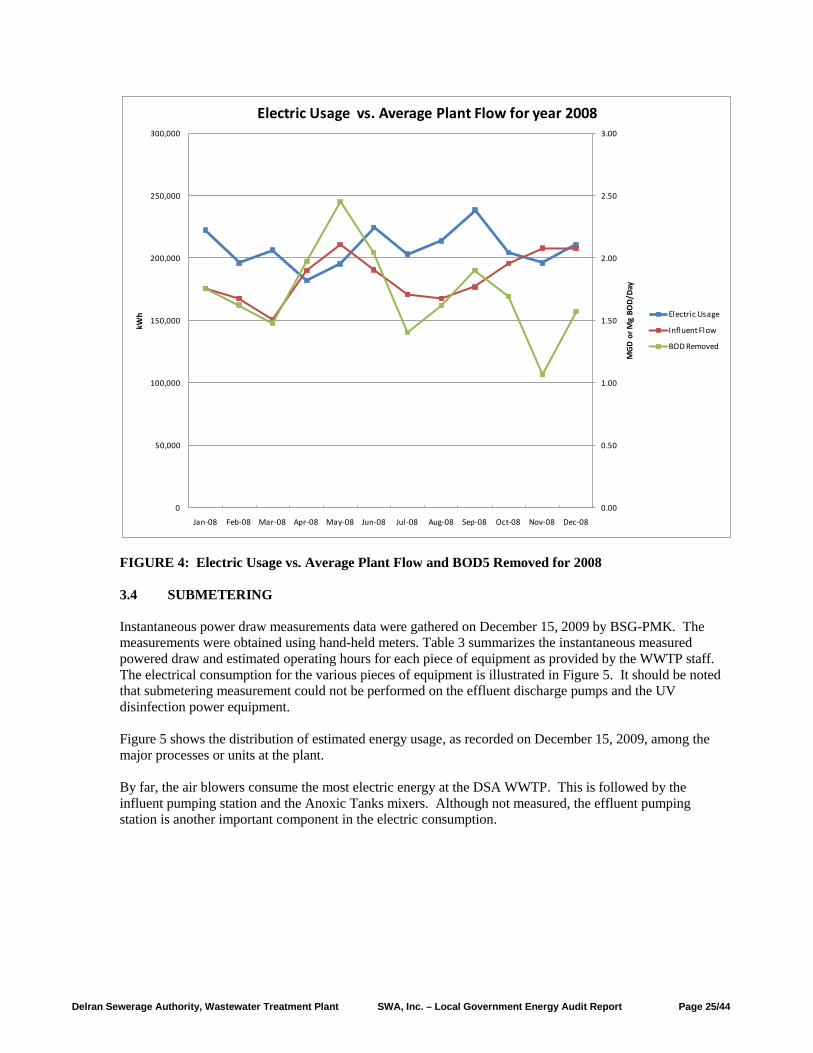
FIGURE 3: Monthly Averaged Plant Flow, BOD5 and TSS Mass Loadings for 2008 In order to evaluate the energy usage at the WWTP, the electric consumption was compared to the plant flows and BOD5 mass loadings to observe the effects of these parameters on the electric consumption. Figure 4 shows the average monthly plant flows and BOD5 mass loadings along with the electric consumption. Based on the historical data the average daily flow was 1.85 MGD and 1,718 kg per day of BOD5 (3,784 lb/day) were removed in 2008. Therefore the estimated electric consumption per kg of BOD5 removed in 2008 averages about 3.98 kWh per kg BOD removed (1.81 kWh per lb of BOD removed). With respect to the incoming wastewater flow, the average electrical consumption was about 3,703 KWh/MGD.
Delran Sewerage Authority, Wastewater Treatment Plant SWA, Inc. – Local Government Energy Audit Report Page 25/44
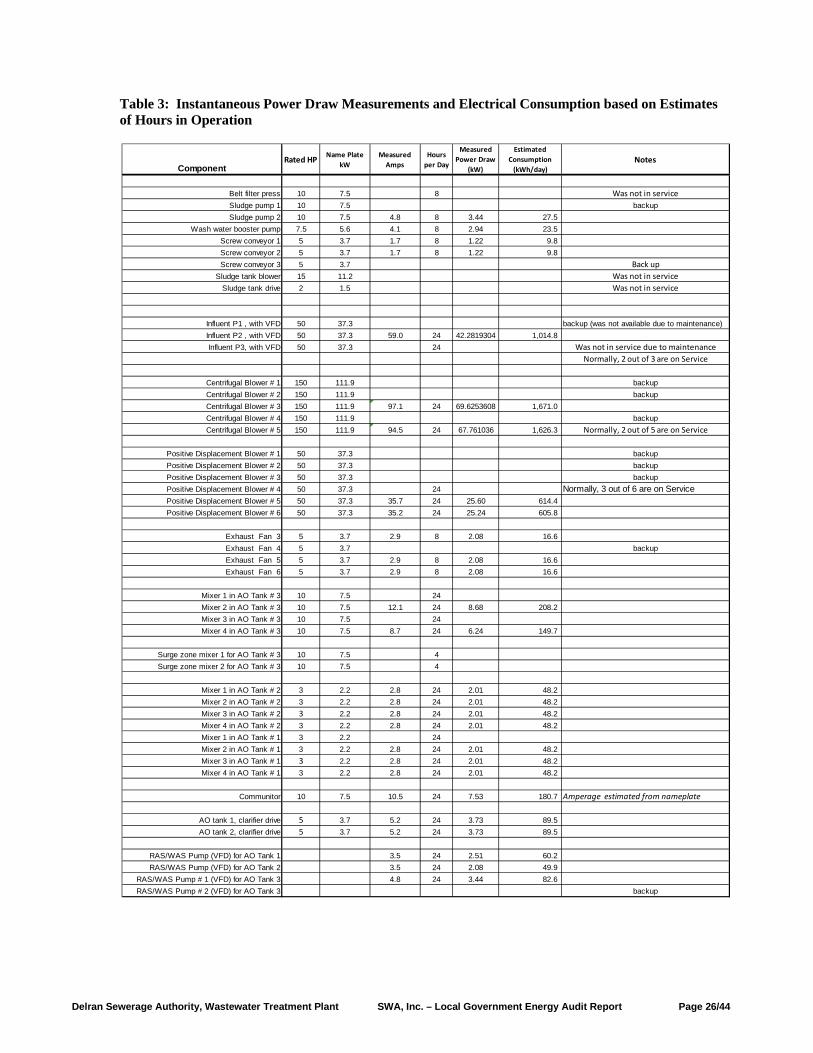
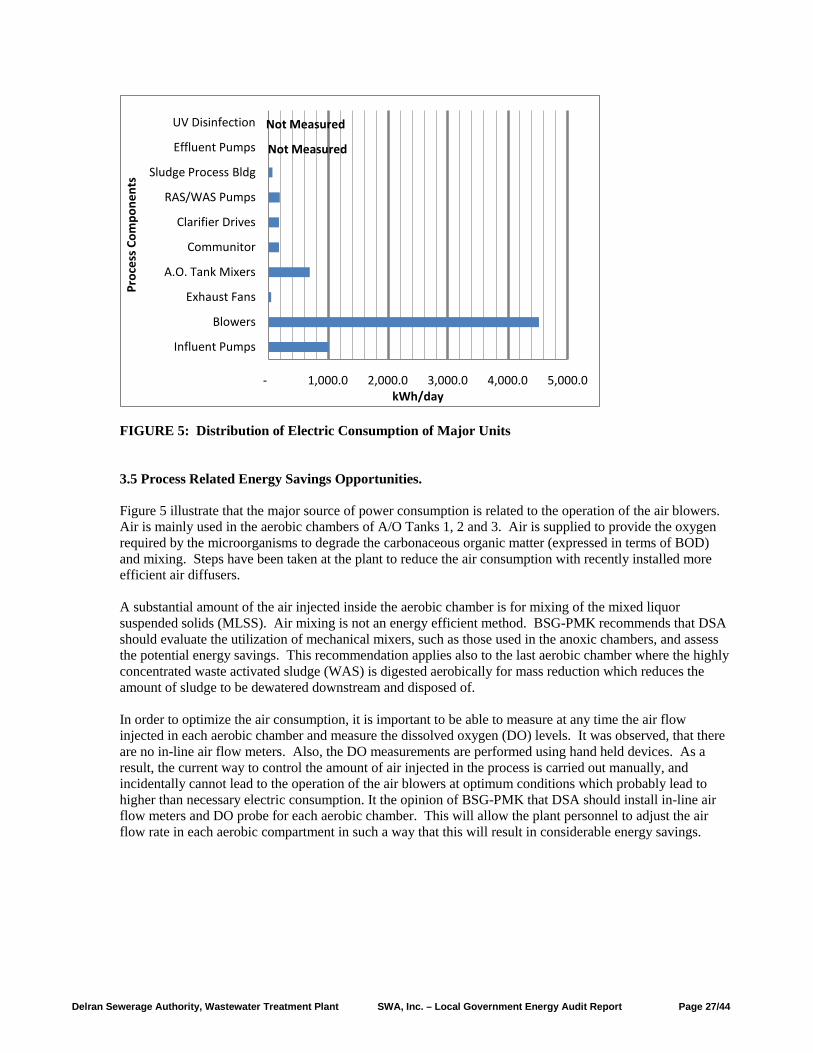
FIGURE 4: Electric Usage vs. Average Plant Flow and BOD5 Removed for 2008 3.4 SUBMETERING Instantaneous power draw measurements data were gathered on December 15, 2009 by BSG-PMK. The measurements were obtained using hand-held meters. Table 3 summarizes the instantaneous measured powered draw and estimated operating hours for each piece of equipment as provided by the WWTP staff. The electrical consumption for the various pieces of equipment is illustrated in Figure 5. It should be noted that submetering measurement could not be performed on the effluent discharge pumps and the UV disinfection power equipment. Figure 5 shows the distribution of estimated energy usage, as recorded on December 15, 2009, among the major processes or units at the plant. By far, the air blowers consume the most electric energy at the DSA WWTP. This is followed by the influent pumping station and the Anoxic Tanks mixers. Although not measured, the effluent pumping station is another important component in the electric consumption.
0.00
0.50
1.00
1.50
2.00
2.50
3.00
0
50,000
100,000
150,000
200,000
250,000
300,000
Jan-08 Feb-08 Mar-08 Apr-08 May-08 Jun-08 Jul-08 Aug-08 Sep-08 Oct-08 Nov-08 Dec-08
MG
D o
r Mg
BOD
/Day
kWh
Electric Usage vs. Average Plant Flow for year 2008
Electric Usage
Influent Flow
BOD Removed
Delran Sewerage Authority, Wastewater Treatment Plant SWA, Inc. – Local Government Energy Audit Report Page 26/44
Table 3: Instantaneous Power Draw Measurements and Electrical Consumption based on Estimates of Hours in Operation
ComponentRated HP
Name Plate kW
Measured Amps
Hours per Day
Measured Power Draw
(kW)
Estimated Consumption
(kWh/day)Notes
Belt filter press 10 7.5 8 Was not in serviceSludge pump 1 10 7.5 backupSludge pump 2 10 7.5 4.8 8 3.44 27.5
Wash water booster pump 7.5 5.6 4.1 8 2.94 23.5 Screw conveyor 1 5 3.7 1.7 8 1.22 9.8 Screw conveyor 2 5 3.7 1.7 8 1.22 9.8 Screw conveyor 3 5 3.7 Back up
Sludge tank blower 15 11.2 Was not in serviceSludge tank drive 2 1.5 Was not in service
Influent P1 , with VFD 50 37.3 backup (was not available due to maintenance)Influent P2 , with VFD 50 37.3 59.0 24 42.2819304 1,014.8 Influent P3, with VFD 50 37.3 24 Was not in service due to maintenance
Normally, 2 out of 3 are on Service
Centrifugal Blower # 1 150 111.9 backupCentrifugal Blower # 2 150 111.9 backupCentrifugal Blower # 3 150 111.9 97.1 24 69.6253608 1,671.0 Centrifugal Blower # 4 150 111.9 backupCentrifugal Blower # 5 150 111.9 94.5 24 67.761036 1,626.3 Normally, 2 out of 5 are on Service
Positive Displacement Blower # 1 50 37.3 backupPositive Displacement Blower # 2 50 37.3 backupPositive Displacement Blower # 3 50 37.3 backupPositive Displacement Blower # 4 50 37.3 24 Normally, 3 out of 6 are on ServicePositive Displacement Blower # 5 50 37.3 35.7 24 25.60 614.4 Positive Displacement Blower # 6 50 37.3 35.2 24 25.24 605.8
Exhaust Fan 3 5 3.7 2.9 8 2.08 16.6 Exhaust Fan 4 5 3.7 backupExhaust Fan 5 5 3.7 2.9 8 2.08 16.6 Exhaust Fan 6 5 3.7 2.9 8 2.08 16.6
Mixer 1 in AO Tank # 3 10 7.5 24Mixer 2 in AO Tank # 3 10 7.5 12.1 24 8.68 208.2 Mixer 3 in AO Tank # 3 10 7.5 24Mixer 4 in AO Tank # 3 10 7.5 8.7 24 6.24 149.7
Surge zone mixer 1 for AO Tank # 3 10 7.5 4Surge zone mixer 2 for AO Tank # 3 10 7.5 4
Mixer 1 in AO Tank # 2 3 2.2 2.8 24 2.01 48.2 Mixer 2 in AO Tank # 2 3 2.2 2.8 24 2.01 48.2 Mixer 3 in AO Tank # 2 3 2.2 2.8 24 2.01 48.2 Mixer 4 in AO Tank # 2 3 2.2 2.8 24 2.01 48.2 Mixer 1 in AO Tank # 1 3 2.2 24Mixer 2 in AO Tank # 1 3 2.2 2.8 24 2.01 48.2 Mixer 3 in AO Tank # 1 3 2.2 2.8 24 2.01 48.2 Mixer 4 in AO Tank # 1 3 2.2 2.8 24 2.01 48.2
Communitor 10 7.5 10.5 24 7.53 180.7 Amperage estimated from nameplate
AO tank 1, clarifier drive 5 3.7 5.2 24 3.73 89.5 AO tank 2, clarifier drive 5 3.7 5.2 24 3.73 89.5
RAS/WAS Pump (VFD) for AO Tank 1 3.5 24 2.51 60.2 RAS/WAS Pump (VFD) for AO Tank 2 3.5 24 2.08 49.9
RAS/WAS Pump # 1 (VFD) for AO Tank 3 4.8 24 3.44 82.6 RAS/WAS Pump # 2 (VFD) for AO Tank 3 backup
Delran Sewerage Authority, Wastewater Treatment Plant SWA, Inc. – Local Government Energy Audit Report Page 27/44
FIGURE 5: Distribution of Electric Consumption of Major Units 3.5 Process Related Energy Savings Opportunities. Figure 5 illustrate that the major source of power consumption is related to the operation of the air blowers. Air is mainly used in the aerobic chambers of A/O Tanks 1, 2 and 3. Air is supplied to provide the oxygen required by the microorganisms to degrade the carbonaceous organic matter (expressed in terms of BOD) and mixing. Steps have been taken at the plant to reduce the air consumption with recently installed more efficient air diffusers. A substantial amount of the air injected inside the aerobic chamber is for mixing of the mixed liquor suspended solids (MLSS). Air mixing is not an energy efficient method. BSG-PMK recommends that DSA should evaluate the utilization of mechanical mixers, such as those used in the anoxic chambers, and assess the potential energy savings. This recommendation applies also to the last aerobic chamber where the highly concentrated waste activated sludge (WAS) is digested aerobically for mass reduction which reduces the amount of sludge to be dewatered downstream and disposed of. In order to optimize the air consumption, it is important to be able to measure at any time the air flow injected in each aerobic chamber and measure the dissolved oxygen (DO) levels. It was observed, that there are no in-line air flow meters. Also, the DO measurements are performed using hand held devices. As a result, the current way to control the amount of air injected in the process is carried out manually, and incidentally cannot lead to the operation of the air blowers at optimum conditions which probably lead to higher than necessary electric consumption. It the opinion of BSG-PMK that DSA should install in-line air flow meters and DO probe for each aerobic chamber. This will allow the plant personnel to adjust the air flow rate in each aerobic compartment in such a way that this will result in considerable energy savings.
- 1,000.0 2,000.0 3,000.0 4,000.0 5,000.0
Influent Pumps
Blowers
Exhaust Fans
A.O. Tank Mixers
Communitor
Clarifier Drives
RAS/WAS Pumps
Sludge Process Bldg
Effluent Pumps
UV Disinfection
kWh/day
Proc
ess
Com
pone
nts
Not Measured
Not Measured
Delran Sewerage Authority, Wastewater Treatment Plant SWA, Inc. – Local Government Energy Audit Report Page 28/44
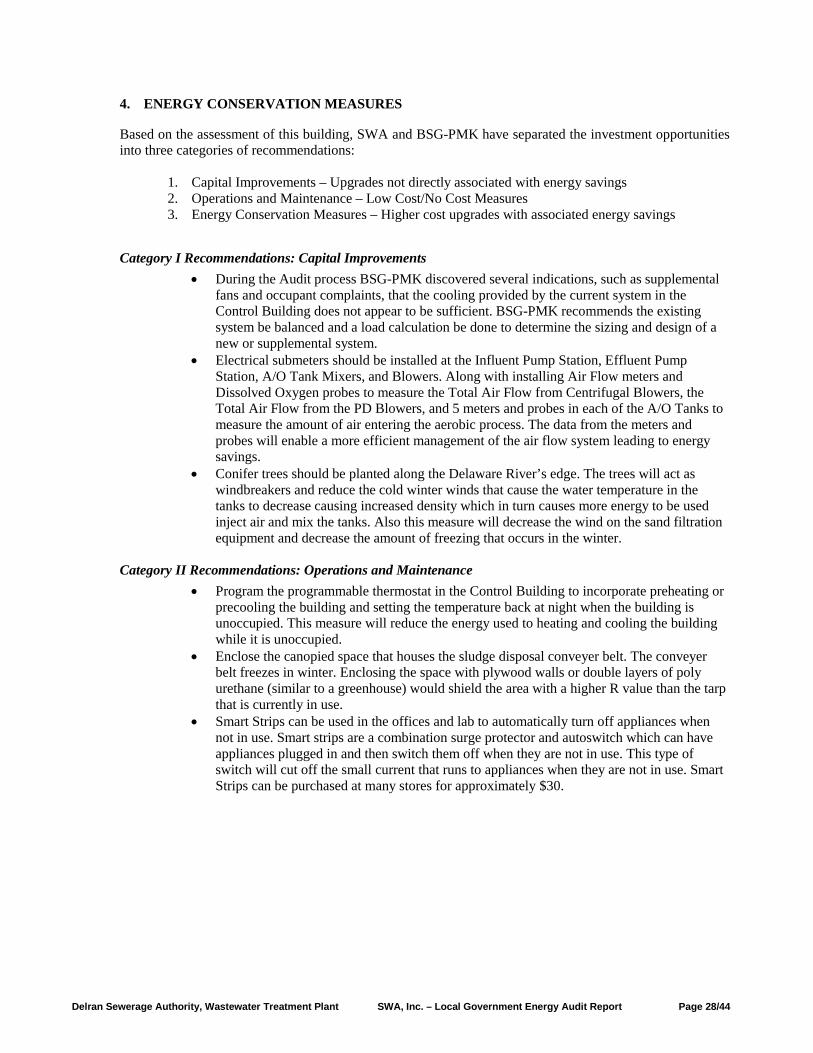
4. ENERGY CONSERVATION MEASURES Based on the assessment of this building, SWA and BSG-PMK have separated the investment opportunities into three categories of recommendations:
1. Capital Improvements – Upgrades not directly associated with energy savings 2. Operations and Maintenance – Low Cost/No Cost Measures 3. Energy Conservation Measures – Higher cost upgrades with associated energy savings
Category I Recommendations: Capital Improvements • During the Audit process BSG-PMK discovered several indications, such as supplemental
fans and occupant complaints, that the cooling provided by the current system in the Control Building does not appear to be sufficient. BSG-PMK recommends the existing system be balanced and a load calculation be done to determine the sizing and design of a new or supplemental system.
• Electrical submeters should be installed at the Influent Pump Station, Effluent Pump Station, A/O Tank Mixers, and Blowers. Along with installing Air Flow meters and Dissolved Oxygen probes to measure the Total Air Flow from Centrifugal Blowers, the Total Air Flow from the PD Blowers, and 5 meters and probes in each of the A/O Tanks to measure the amount of air entering the aerobic process. The data from the meters and probes will enable a more efficient management of the air flow system leading to energy savings.
• Conifer trees should be planted along the Delaware River’s edge. The trees will act as windbreakers and reduce the cold winter winds that cause the water temperature in the tanks to decrease causing increased density which in turn causes more energy to be used inject air and mix the tanks. Also this measure will decrease the wind on the sand filtration equipment and decrease the amount of freezing that occurs in the winter.
Category II Recommendations: Operations and Maintenance • Program the programmable thermostat in the Control Building to incorporate preheating or
precooling the building and setting the temperature back at night when the building is unoccupied. This measure will reduce the energy used to heating and cooling the building while it is unoccupied.
• Enclose the canopied space that houses the sludge disposal conveyer belt. The conveyer belt freezes in winter. Enclosing the space with plywood walls or double layers of poly urethane (similar to a greenhouse) would shield the area with a higher R value than the tarp that is currently in use.
• Smart Strips can be used in the offices and lab to automatically turn off appliances when not in use. Smart strips are a combination surge protector and autoswitch which can have appliances plugged in and then switch them off when they are not in use. This type of switch will cut off the small current that runs to appliances when they are not in use. Smart Strips can be purchased at many stores for approximately $30.
Delran Sewerage Authority, Wastewater Treatment Plant SWA, Inc. – Local Government Energy Audit Report Page 29/44
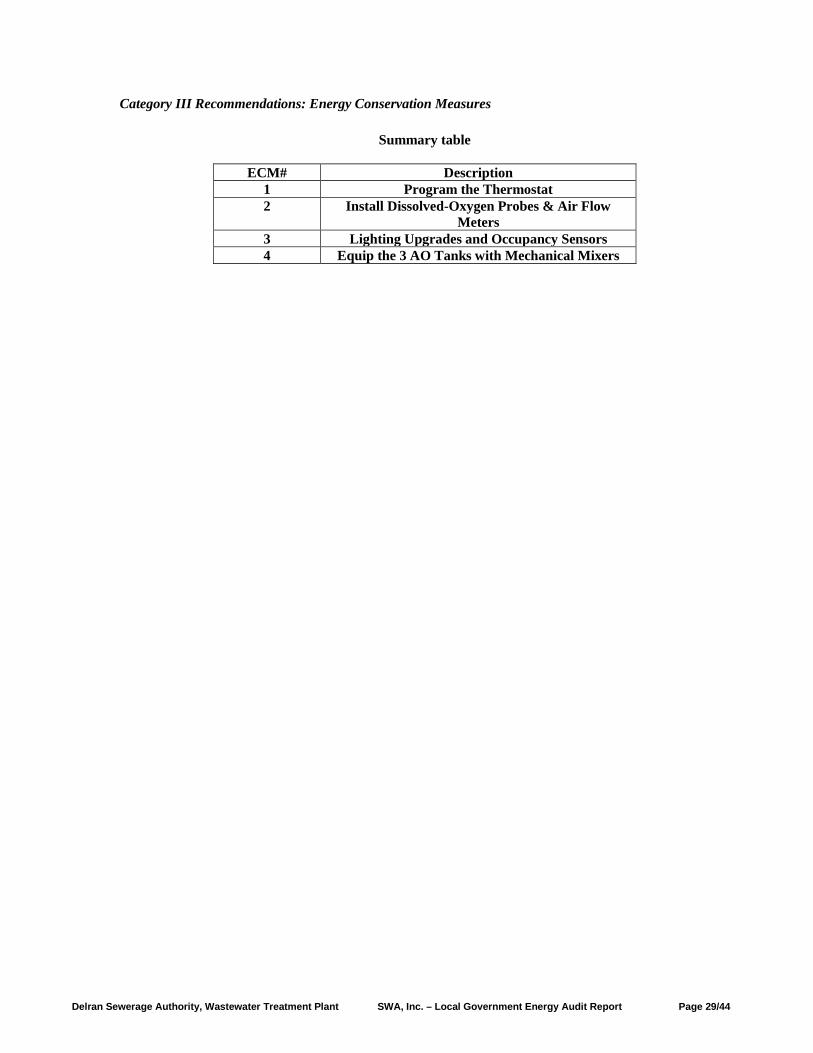
Category III Recommendations: Energy Conservation Measures
Summary table
ECM# Description 1 Program the Thermostat 2 Install Dissolved-Oxygen Probes & Air Flow
Meters 3 Lighting Upgrades and Occupancy Sensors 4 Equip the 3 AO Tanks with Mechanical Mixers
Delran Sewerage Authority, Wastewater Treatment Plant SWA, Inc. – Local Government Energy Audit Report Page 30/44
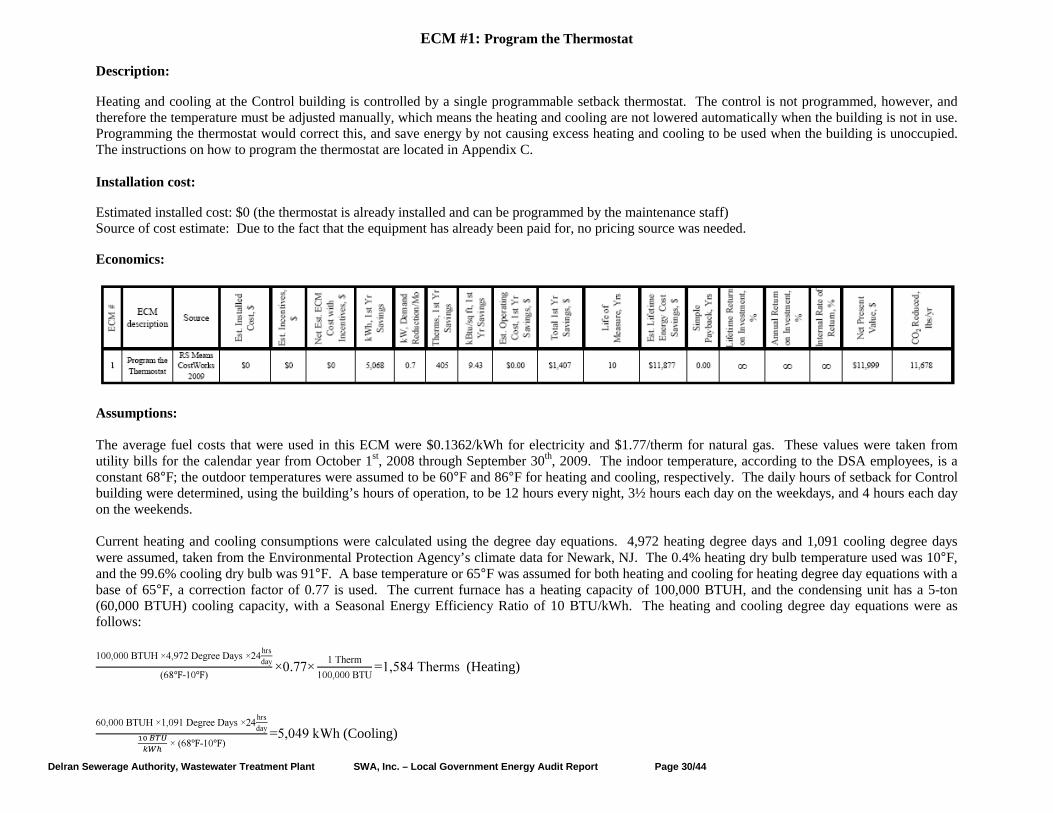
ECM #1: Program the Thermostat Description: Heating and cooling at the Control building is controlled by a single programmable setback thermostat. The control is not programmed, however, and therefore the temperature must be adjusted manually, which means the heating and cooling are not lowered automatically when the building is not in use. Programming the thermostat would correct this, and save energy by not causing excess heating and cooling to be used when the building is unoccupied. The instructions on how to program the thermostat are located in Appendix C. Installation cost: Estimated installed cost: $0 (the thermostat is already installed and can be programmed by the maintenance staff) Source of cost estimate: Due to the fact that the equipment has already been paid for, no pricing source was needed. Economics:
Assumptions: The average fuel costs that were used in this ECM were $0.1362/kWh for electricity and $1.77/therm for natural gas. These values were taken from utility bills for the calendar year from October 1st, 2008 through September 30th, 2009. The indoor temperature, according to the DSA employees, is a constant 68°F; the outdoor temperatures were assumed to be 60°F and 86°F for heating and cooling, respectively. The daily hours of setback for Control building were determined, using the building’s hours of operation, to be 12 hours every night, 3½ hours each day on the weekdays, and 4 hours each day on the weekends. Current heating and cooling consumptions were calculated using the degree day equations. 4,972 heating degree days and 1,091 cooling degree days were assumed, taken from the Environmental Protection Agency’s climate data for Newark, NJ. The 0.4% heating dry bulb temperature used was 10°F, and the 99.6% cooling dry bulb was 91°F. A base temperature or 65°F was assumed for both heating and cooling for heating degree day equations with a base of 65°F, a correction factor of 0.77 is used. The current furnace has a heating capacity of 100,000 BTUH, and the condensing unit has a 5-ton (60,000 BTUH) cooling capacity, with a Seasonal Energy Efficiency Ratio of 10 BTU/kWh. The heating and cooling degree day equations were as follows:
- (Heating)
- (Cooling)

Delran Sewerage Authority, Wastewater Treatment Plant SWA, Inc. – Local Government Energy Audit Report Page 31/44
The savings were calculated using Honeywell’s Commercial Programmable Thermostat Energy Savings Calculator, an Excel spreadsheet, which assumes 3% savings per degree of setback for the heating season, and 6% for the cooling season. This led to a 45% savings for cooling and a 20% savings for heating. Electric savings for the furnace’s blower were also calculated, and were added to the savings calculated by the Programmable Thermostat Calculator. The horsepower of the blower, 0.75, was converted to BTUH, which was multiplied by the annual heating hours, 6,625, to yield the BTUs consumed; this was then converted to kWh to yield the current electric consumption by the blower. The savings is a result of the thermostat decreasing the hours of operation from 24 hours per day to 48 hours per week, Due to the fact that this was a no-cost measure, the Lifetime Return on Investment, Annual Return on Investment, and Internal Rate of Return, which use the installed cost as the denominator in their formulas, are infinity (represented in the chart as “∞”), as the saving s pay off the investment an infinite number of times. Rebates/financial incentives: There are no rebates or incentives for this measure, as the equipment has already been purchased.
Delran Sewerage Authority, Wastewater Treatment Plant SWA, Inc. – Local Government Energy Audit Report Page 32/44
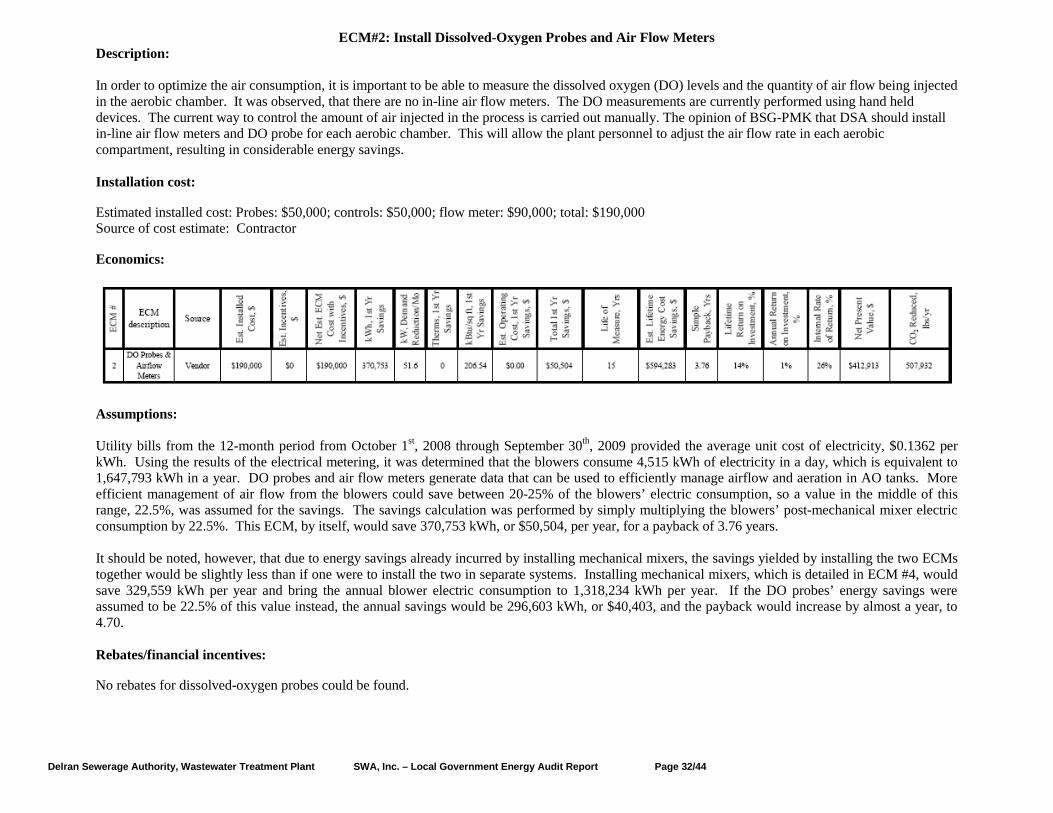
ECM#2: Install Dissolved-Oxygen Probes and Air Flow Meters Description: In order to optimize the air consumption, it is important to be able to measure the dissolved oxygen (DO) levels and the quantity of air flow being injected in the aerobic chamber. It was observed, that there are no in-line air flow meters. The DO measurements are currently performed using hand held devices. The current way to control the amount of air injected in the process is carried out manually. The opinion of BSG-PMK that DSA should install in-line air flow meters and DO probe for each aerobic chamber. This will allow the plant personnel to adjust the air flow rate in each aerobic compartment, resulting in considerable energy savings.
Installation cost: Estimated installed cost: Probes: $50,000; controls: $50,000; flow meter: $90,000; total: $190,000 Source of cost estimate: Contractor Economics:
Assumptions: Utility bills from the 12-month period from October 1st, 2008 through September 30th, 2009 provided the average unit cost of electricity, $0.1362 per kWh. Using the results of the electrical metering, it was determined that the blowers consume 4,515 kWh of electricity in a day, which is equivalent to 1,647,793 kWh in a year. DO probes and air flow meters generate data that can be used to efficiently manage airflow and aeration in AO tanks. More efficient management of air flow from the blowers could save between 20-25% of the blowers’ electric consumption, so a value in the middle of this range, 22.5%, was assumed for the savings. The savings calculation was performed by simply multiplying the blowers’ post-mechanical mixer electric consumption by 22.5%. This ECM, by itself, would save 370,753 kWh, or $50,504, per year, for a payback of 3.76 years. It should be noted, however, that due to energy savings already incurred by installing mechanical mixers, the savings yielded by installing the two ECMs together would be slightly less than if one were to install the two in separate systems. Installing mechanical mixers, which is detailed in ECM #4, would save 329,559 kWh per year and bring the annual blower electric consumption to 1,318,234 kWh per year. If the DO probes’ energy savings were assumed to be 22.5% of this value instead, the annual savings would be 296,603 kWh, or $40,403, and the payback would increase by almost a year, to 4.70. Rebates/financial incentives: No rebates for dissolved-oxygen probes could be found.
Delran Sewerage Authority, Wastewater Treatment Plant SWA, Inc. – Local Government Energy Audit Report Page 33/44
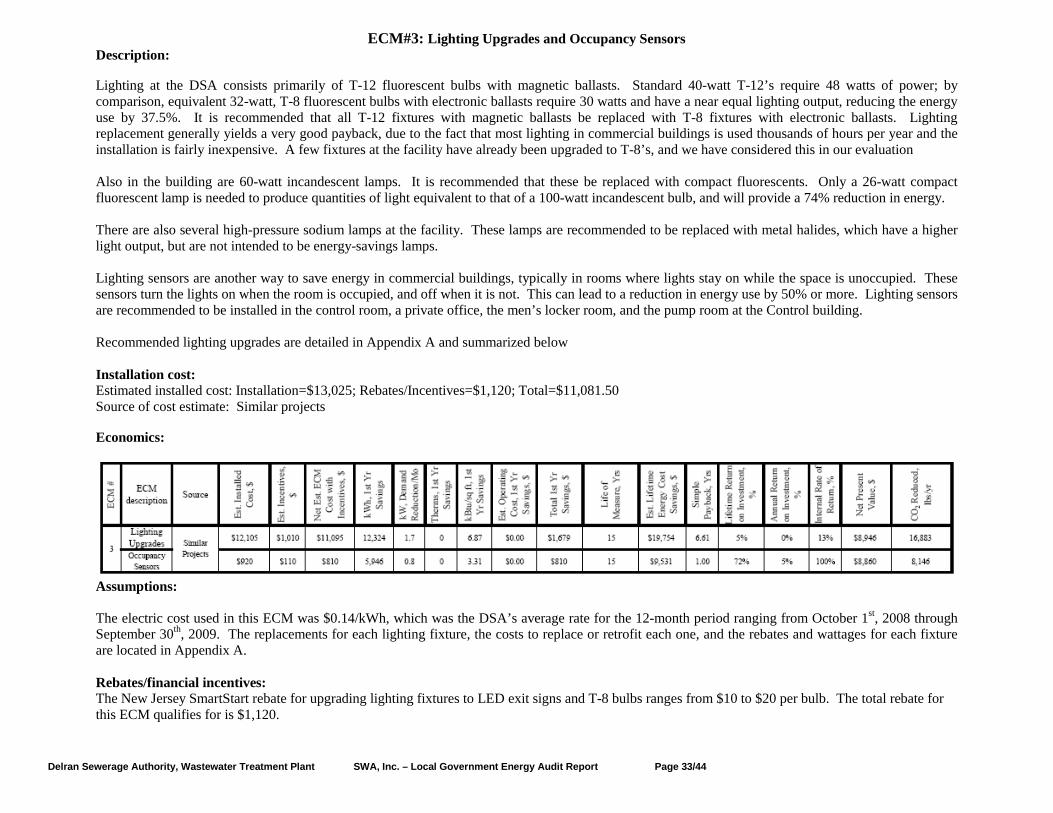
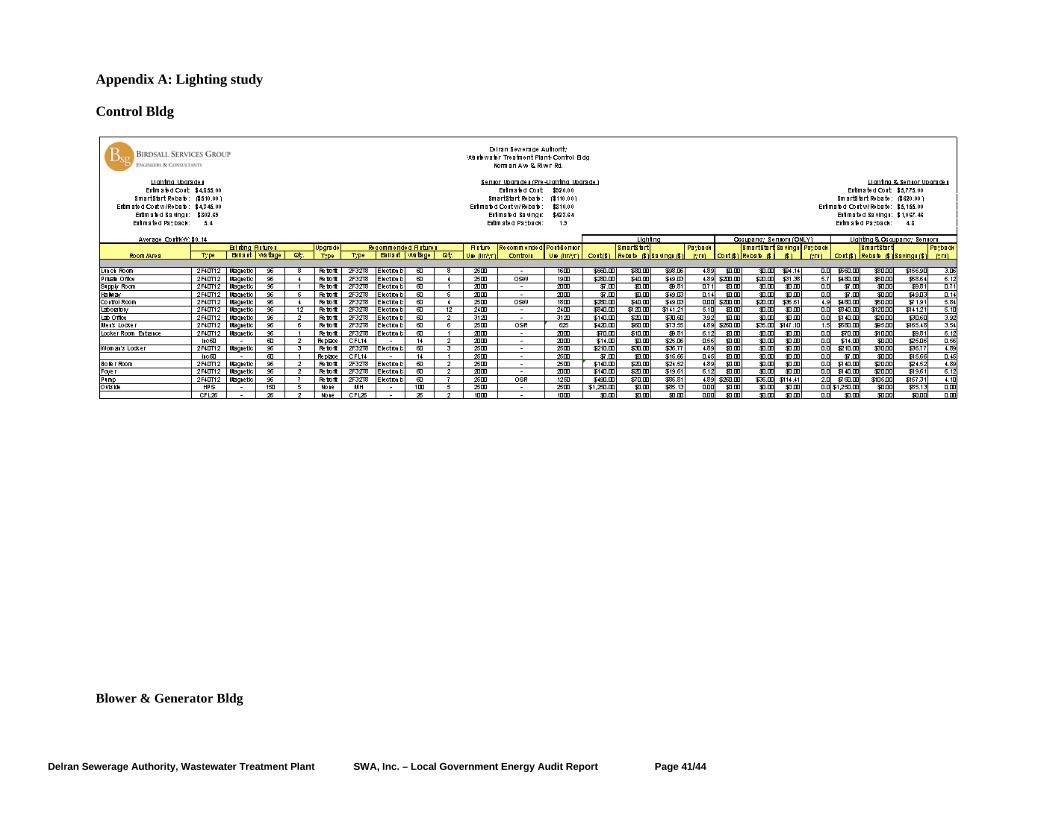
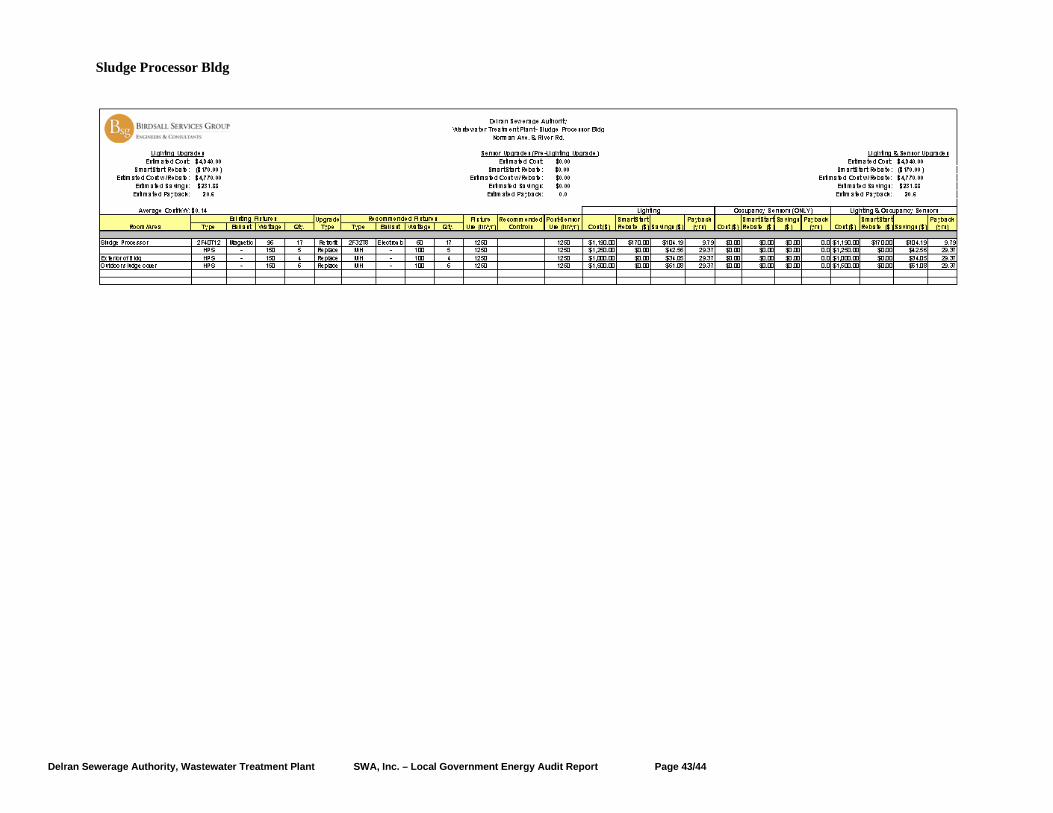
ECM#3: Lighting Upgrades and Occupancy Sensors Description: Lighting at the DSA consists primarily of T-12 fluorescent bulbs with magnetic ballasts. Standard 40-watt T-12’s require 48 watts of power; by comparison, equivalent 32-watt, T-8 fluorescent bulbs with electronic ballasts require 30 watts and have a near equal lighting output, reducing the energy use by 37.5%. It is recommended that all T-12 fixtures with magnetic ballasts be replaced with T-8 fixtures with electronic ballasts. Lighting replacement generally yields a very good payback, due to the fact that most lighting in commercial buildings is used thousands of hours per year and the installation is fairly inexpensive. A few fixtures at the facility have already been upgraded to T-8’s, and we have considered this in our evaluation Also in the building are 60-watt incandescent lamps. It is recommended that these be replaced with compact fluorescents. Only a 26-watt compact fluorescent lamp is needed to produce quantities of light equivalent to that of a 100-watt incandescent bulb, and will provide a 74% reduction in energy. There are also several high-pressure sodium lamps at the facility. These lamps are recommended to be replaced with metal halides, which have a higher light output, but are not intended to be energy-savings lamps. Lighting sensors are another way to save energy in commercial buildings, typically in rooms where lights stay on while the space is unoccupied. These sensors turn the lights on when the room is occupied, and off when it is not. This can lead to a reduction in energy use by 50% or more. Lighting sensors are recommended to be installed in the control room, a private office, the men’s locker room, and the pump room at the Control building. Recommended lighting upgrades are detailed in Appendix A and summarized below Installation cost: Estimated installed cost: Installation=$13,025; Rebates/Incentives=$1,120; Total=$11,081.50 Source of cost estimate: Similar projects Economics:
Assumptions: The electric cost used in this ECM was $0.14/kWh, which was the DSA’s average rate for the 12-month period ranging from October 1st, 2008 through September 30th, 2009. The replacements for each lighting fixture, the costs to replace or retrofit each one, and the rebates and wattages for each fixture are located in Appendix A. Rebates/financial incentives: The New Jersey SmartStart rebate for upgrading lighting fixtures to LED exit signs and T-8 bulbs ranges from $10 to $20 per bulb. The total rebate for this ECM qualifies for is $1,120.
Delran Sewerage Authority, Wastewater Treatment Plant SWA, Inc. – Local Government Energy Audit Report Page 34/44
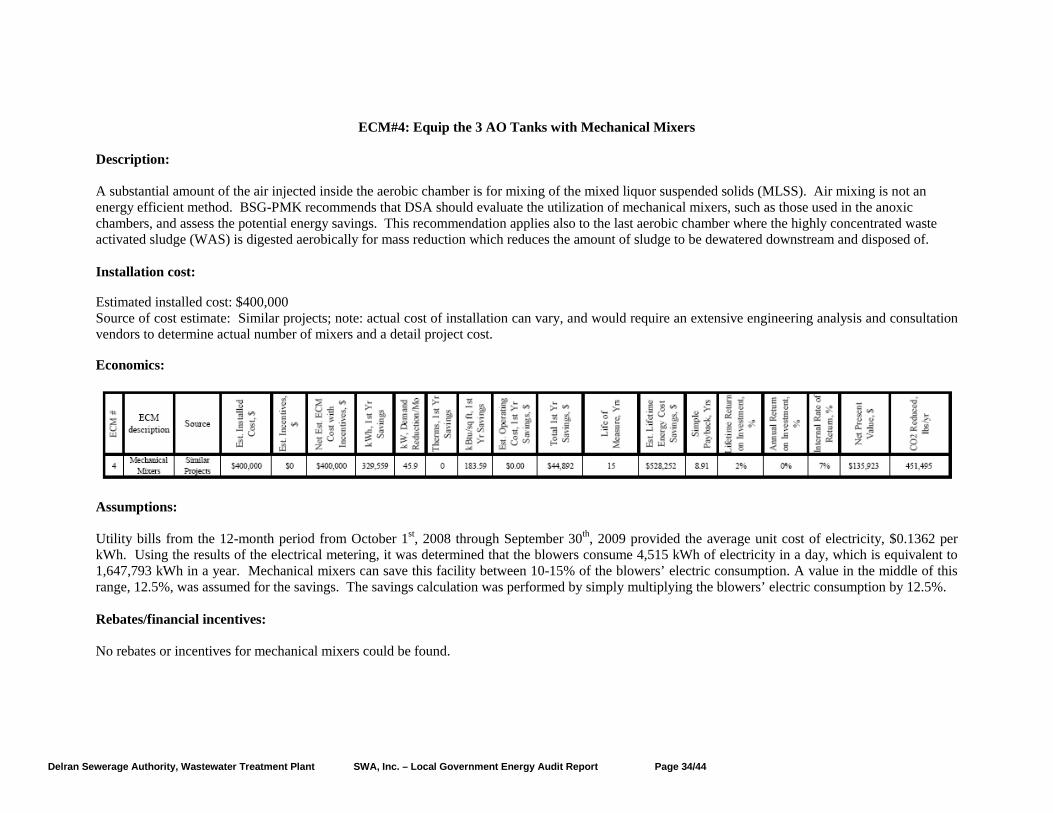
ECM#4: Equip the 3 AO Tanks with Mechanical Mixers Description: A substantial amount of the air injected inside the aerobic chamber is for mixing of the mixed liquor suspended solids (MLSS). Air mixing is not an energy efficient method. BSG-PMK recommends that DSA should evaluate the utilization of mechanical mixers, such as those used in the anoxic chambers, and assess the potential energy savings. This recommendation applies also to the last aerobic chamber where the highly concentrated waste activated sludge (WAS) is digested aerobically for mass reduction which reduces the amount of sludge to be dewatered downstream and disposed of. Installation cost: Estimated installed cost: $400,000 Source of cost estimate: Similar projects; note: actual cost of installation can vary, and would require an extensive engineering analysis and consultation vendors to determine actual number of mixers and a detail project cost. Economics:
Assumptions: Utility bills from the 12-month period from October 1st, 2008 through September 30th, 2009 provided the average unit cost of electricity, $0.1362 per kWh. Using the results of the electrical metering, it was determined that the blowers consume 4,515 kWh of electricity in a day, which is equivalent to 1,647,793 kWh in a year. Mechanical mixers can save this facility between 10-15% of the blowers’ electric consumption. A value in the middle of this range, 12.5%, was assumed for the savings. The savings calculation was performed by simply multiplying the blowers’ electric consumption by 12.5%. Rebates/financial incentives: No rebates or incentives for mechanical mixers could be found.
Delran Sewerage Authority, Wastewater Treatment Plant SWA, Inc. – Local Government Energy Audit Report Page 35/44
5. RENEWABLE AND DISTRIBUTED ENERGY MEASURES
5.1. Existing systems
There are currently no existing renewable energy systems.
5.2. Solar Photovoltaic Photovoltaic (PV) technology was considered for installation on the roofs of the Control Building and Blower & Generator Building. Based on the shading and the amount of roof area available it was determined that PV installations are not cost effective for this project. 5.3. Solar Thermal Collectors Solar thermal collectors are not recommended due to the low amount of domestic hot water use throughout the building.
5.4. Combined Heat and Power Combined Heat Power is not applicable to this project because of the HVAC system type and limited domestic hot water usage.
5.5. Geothermal Geothermal is not applicable to this project because it would require modifications to the existing heat distribution system, which would not be cost effective. 5.6. Wind
Wind power production is not appropriate for this location because required land is not available for the wind turbine. Also, the available wind energy resource is very low.
6. ENERGY PURCHASING AND PROCUREMENT STRATEGIES
6.1. Energy Purchasing
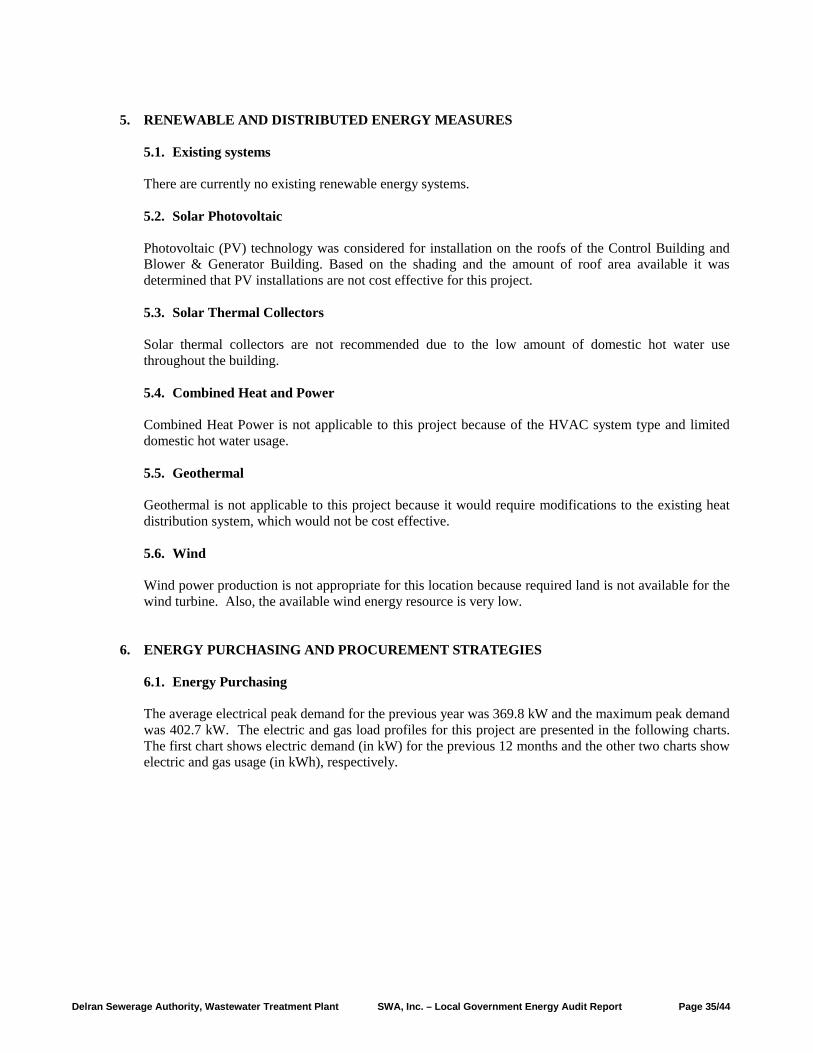
The average electrical peak demand for the previous year was 369.8 kW and the maximum peak demand was 402.7 kW. The electric and gas load profiles for this project are presented in the following charts. The first chart shows electric demand (in kW) for the previous 12 months and the other two charts show electric and gas usage (in kWh), respectively.
Delran Sewerage Authority, Wastewater Treatment Plant SWA, Inc. – Local Government Energy Audit Report Page 36/44
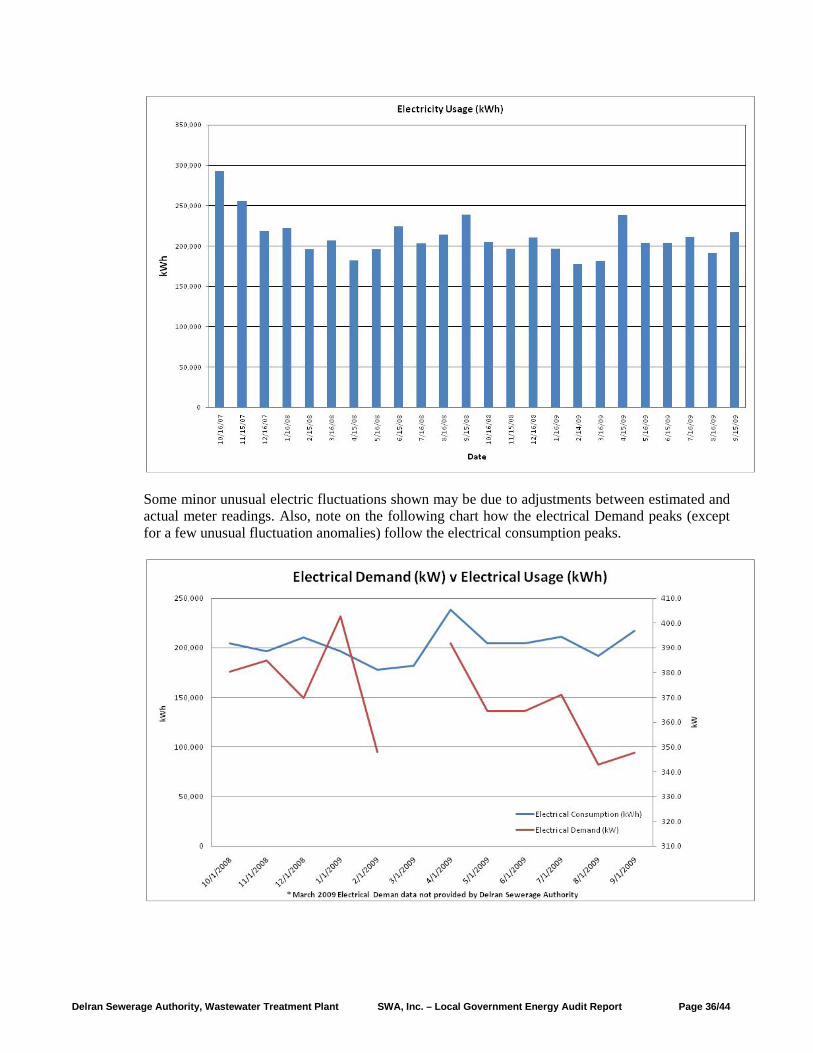
Some minor unusual electric fluctuations shown may be due to adjustments between estimated and actual meter readings. Also, note on the following chart how the electrical Demand peaks (except for a few unusual fluctuation anomalies) follow the electrical consumption peaks.
Delran Sewerage Authority, Wastewater Treatment Plant SWA, Inc. – Local Government Energy Audit Report Page 37/44
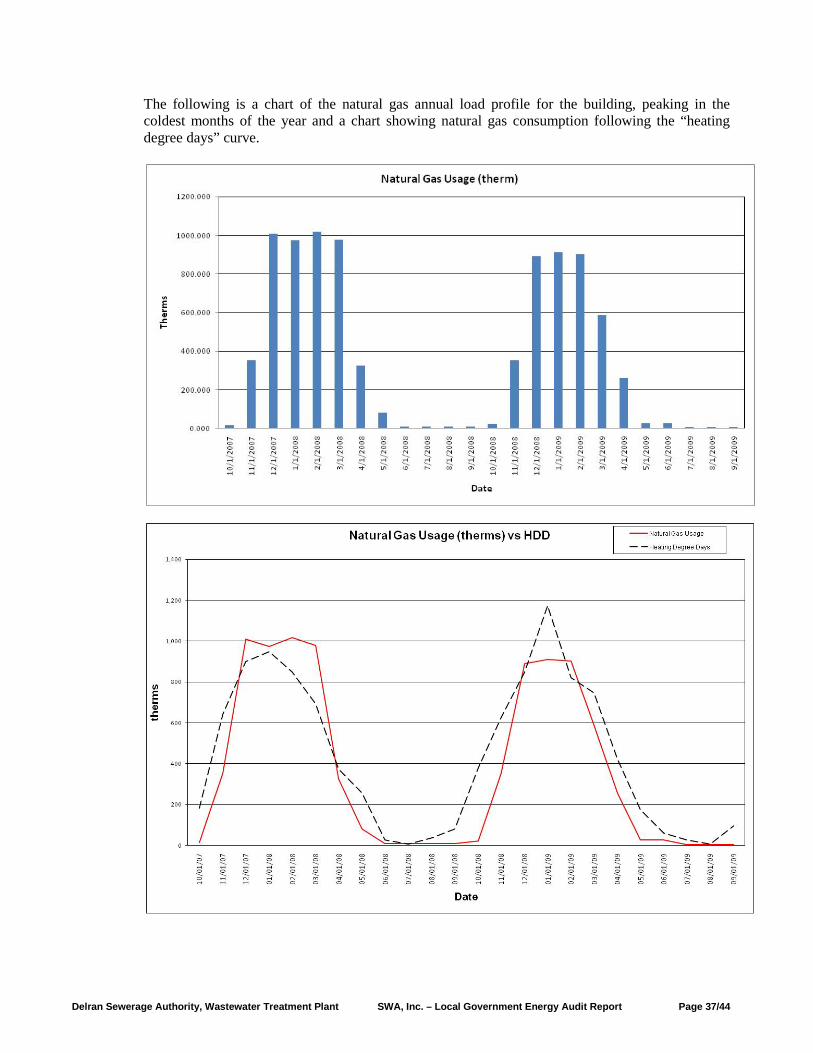
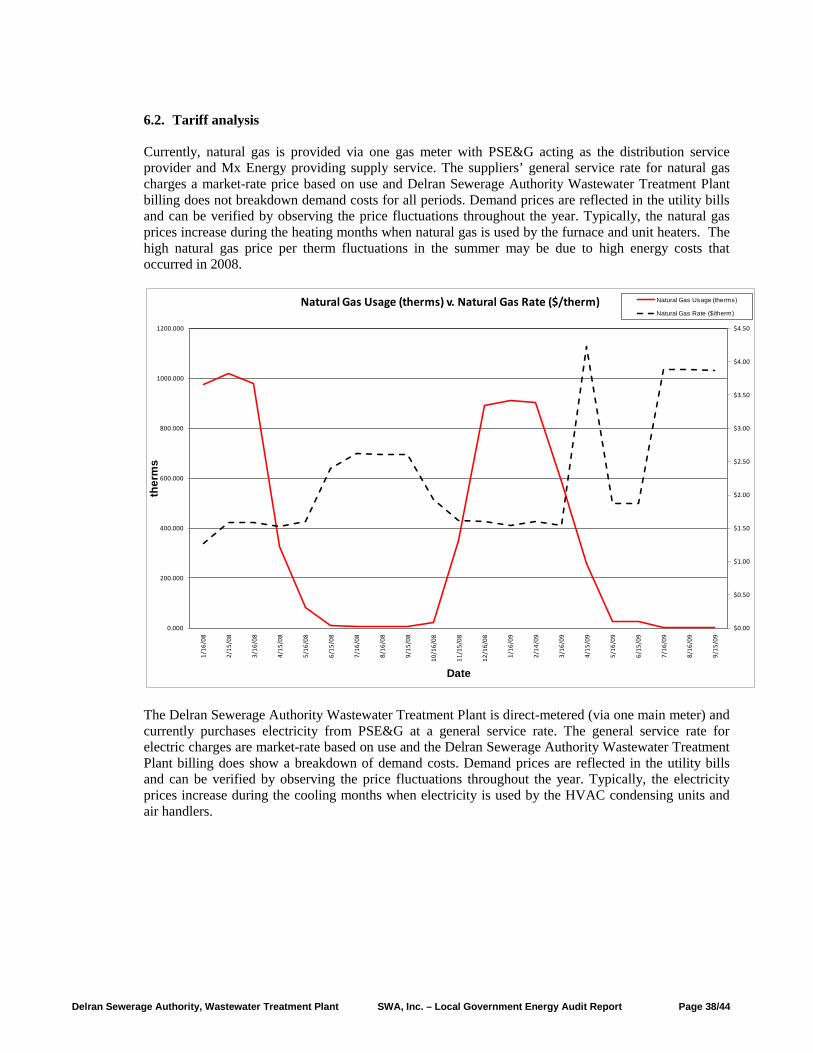
The following is a chart of the natural gas annual load profile for the building, peaking in the coldest months of the year and a chart showing natural gas consumption following the “heating degree days” curve.
Delran Sewerage Authority, Wastewater Treatment Plant SWA, Inc. – Local Government Energy Audit Report Page 38/44
6.2. Tariff analysis
Currently, natural gas is provided via one gas meter with PSE&G acting as the distribution service provider and Mx Energy providing supply service. The suppliers’ general service rate for natural gas charges a market-rate price based on use and Delran Sewerage Authority Wastewater Treatment Plant billing does not breakdown demand costs for all periods. Demand prices are reflected in the utility bills and can be verified by observing the price fluctuations throughout the year. Typically, the natural gas prices increase during the heating months when natural gas is used by the furnace and unit heaters. The high natural gas price per therm fluctuations in the summer may be due to high energy costs that occurred in 2008.
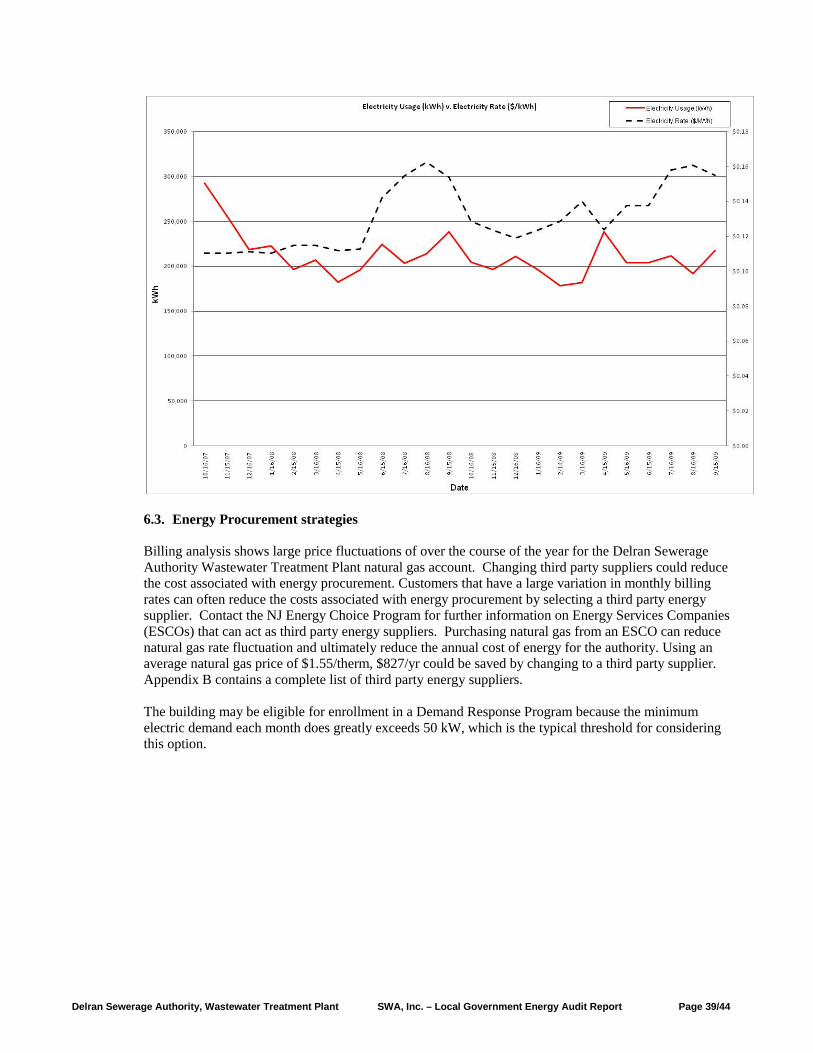
The Delran Sewerage Authority Wastewater Treatment Plant is direct-metered (via one main meter) and currently purchases electricity from PSE&G at a general service rate. The general service rate for electric charges are market-rate based on use and the Delran Sewerage Authority Wastewater Treatment Plant billing does show a breakdown of demand costs. Demand prices are reflected in the utility bills and can be verified by observing the price fluctuations throughout the year. Typically, the electricity prices increase during the cooling months when electricity is used by the HVAC condensing units and air handlers.
$0.00
$0.50
$1.00
$1.50
$2.00
$2.50
$3.00
$3.50
$4.00
$4.50
0.000
200.000
400.000
600.000
800.000
1000.000
1200.000
1/16
/08
2/15
/08
3/16
/08
4/15
/08
5/16
/08
6/15
/08
7/16
/08
8/16
/08
9/15
/08
10/1
6/08
11/1
5/08
12/1
6/08
1/16
/09
2/14
/09
3/16
/09
4/15
/09
5/16
/09
6/15
/09
7/16
/09
8/16
/09
9/15
/09
ther
ms
Date
Natural Gas Usage (therms) v. Natural Gas Rate ($/therm) Natural Gas Usage (therms)
Natural Gas Rate ($/therm)
Delran Sewerage Authority, Wastewater Treatment Plant SWA, Inc. – Local Government Energy Audit Report Page 39/44
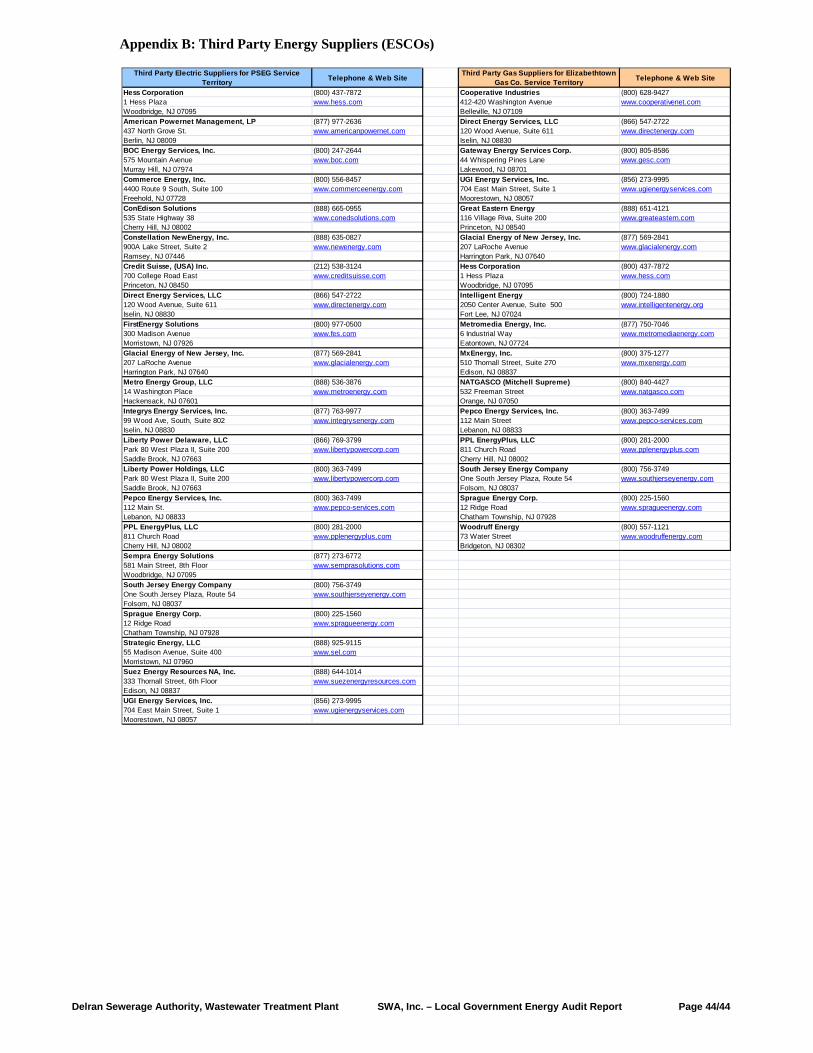
6.3. Energy Procurement strategies Billing analysis shows large price fluctuations of over the course of the year for the Delran Sewerage Authority Wastewater Treatment Plant natural gas account. Changing third party suppliers could reduce the cost associated with energy procurement. Customers that have a large variation in monthly billing rates can often reduce the costs associated with energy procurement by selecting a third party energy supplier. Contact the NJ Energy Choice Program for further information on Energy Services Companies (ESCOs) that can act as third party energy suppliers. Purchasing natural gas from an ESCO can reduce natural gas rate fluctuation and ultimately reduce the annual cost of energy for the authority. Using an average natural gas price of $1.55/therm, $827/yr could be saved by changing to a third party supplier. Appendix B contains a complete list of third party energy suppliers.
The building may be eligible for enrollment in a Demand Response Program because the minimum electric demand each month does greatly exceeds 50 kW, which is the typical threshold for considering this option.
Delran Sewerage Authority, Wastewater Treatment Plant SWA, Inc. – Local Government Energy Audit Report Page 40/44
7. METHOD OF ANALYSIS
7.1. Assumptions and methods
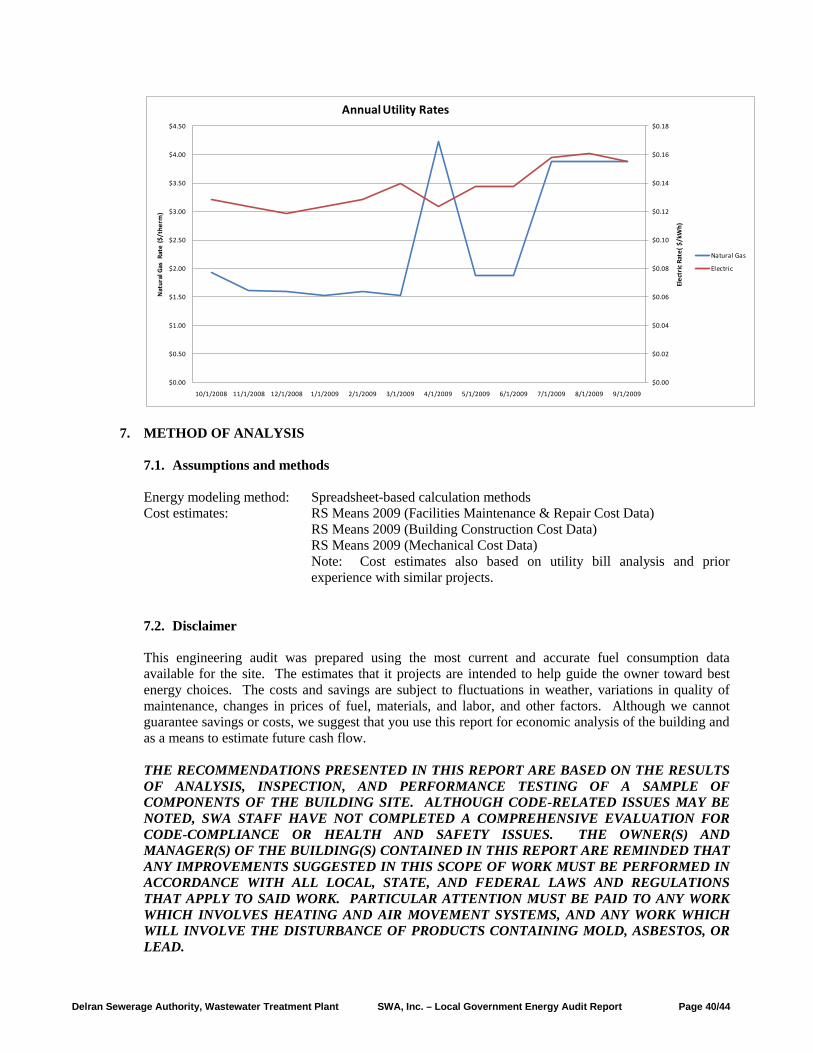
Energy modeling method: Spreadsheet-based calculation methods Cost estimates: RS Means 2009 (Facilities Maintenance & Repair Cost Data)
RS Means 2009 (Building Construction Cost Data) RS Means 2009 (Mechanical Cost Data)
Note: Cost estimates also based on utility bill analysis and prior experience with similar projects.
7.2. Disclaimer
This engineering audit was prepared using the most current and accurate fuel consumption data available for the site. The estimates that it projects are intended to help guide the owner toward best energy choices. The costs and savings are subject to fluctuations in weather, variations in quality of maintenance, changes in prices of fuel, materials, and labor, and other factors. Although we cannot guarantee savings or costs, we suggest that you use this report for economic analysis of the building and as a means to estimate future cash flow.
THE RECOMMENDATIONS PRESENTED IN THIS REPORT ARE BASED ON THE RESULTS OF ANALYSIS, INSPECTION, AND PERFORMANCE TESTING OF A SAMPLE OF COMPONENTS OF THE BUILDING SITE. ALTHOUGH CODE-RELATED ISSUES MAY BE NOTED, SWA STAFF HAVE NOT COMPLETED A COMPREHENSIVE EVALUATION FOR CODE-COMPLIANCE OR HEALTH AND SAFETY ISSUES. THE OWNER(S) AND MANAGER(S) OF THE BUILDING(S) CONTAINED IN THIS REPORT ARE REMINDED THAT ANY IMPROVEMENTS SUGGESTED IN THIS SCOPE OF WORK MUST BE PERFORMED IN ACCORDANCE WITH ALL LOCAL, STATE, AND FEDERAL LAWS AND REGULATIONS THAT APPLY TO SAID WORK. PARTICULAR ATTENTION MUST BE PAID TO ANY WORK WHICH INVOLVES HEATING AND AIR MOVEMENT SYSTEMS, AND ANY WORK WHICH WILL INVOLVE THE DISTURBANCE OF PRODUCTS CONTAINING MOLD, ASBESTOS, OR LEAD.
$0.00
$0.02
$0.04
$0.06
$0.08
$0.10
$0.12
$0.14
$0.16
$0.18
$0.00
$0.50
$1.00
$1.50
$2.00
$2.50
$3.00
$3.50
$4.00
$4.50
10/1/2008 11/1/2008 12/1/2008 1/1/2009 2/1/2009 3/1/2009 4/1/2009 5/1/2009 6/1/2009 7/1/2009 8/1/2009 9/1/2009
Elec
tric
Rat
e( $
/kW
h)
Nat
ural
Gas
Rat
e ($
/the
rm)
Annual Utility Rates
Natural Gas
Electric
Delran Sewerage Authority, Wastewater Treatment Plant SWA, Inc. – Local Government Energy Audit Report Page 41/44
Appendix A: Lighting study Control Bldg
Blower & Generator Bldg
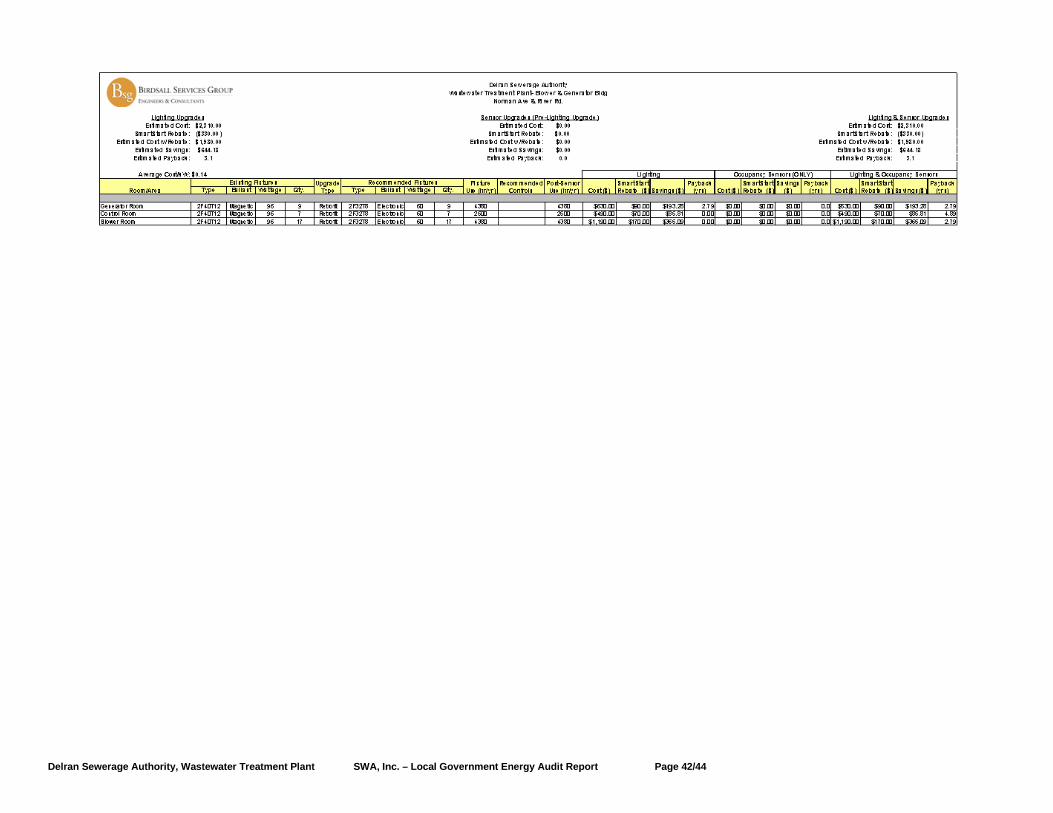
Delran Sewerage Authority, Wastewater Treatment Plant SWA, Inc. – Local Government Energy Audit Report Page 42/44
Delran Sewerage Authority, Wastewater Treatment Plant SWA, Inc. – Local Government Energy Audit Report Page 43/44
Sludge Processor Bldg
Delran Sewerage Authority, Wastewater Treatment Plant SWA, Inc. – Local Government Energy Audit Report Page 44/44
Appendix B: Third Party Energy Suppliers (ESCOs)
Third Party Electric Suppliers for PSEG Service Territory Telephone & Web Site Third Party Gas Suppliers for Elizabethtown
Gas Co. Service Territory Telephone & Web Site
Hess Corporation (800) 437-7872 Cooperative Industries (800) 628-94271 Hess Plaza www.hess.com 412-420 Washington Avenue www.cooperativenet.comWoodbridge, NJ 07095 Belleville, NJ 07109American Powernet Management, LP (877) 977-2636 Direct Energy Services, LLC (866) 547-2722437 North Grove St. www.americanpowernet.com 120 Wood Avenue, Suite 611 www.directenergy.comBerlin, NJ 08009 Iselin, NJ 08830BOC Energy Services, Inc. (800) 247-2644 Gateway Energy Services Corp. (800) 805-8586575 Mountain Avenue www.boc.com 44 Whispering Pines Lane www.gesc.comMurray Hill, NJ 07974 Lakewood, NJ 08701Commerce Energy, Inc. (800) 556-8457 UGI Energy Services, Inc. (856) 273-99954400 Route 9 South, Suite 100 www.commerceenergy.com 704 East Main Street, Suite 1 www.ugienergyservices.comFreehold, NJ 07728 Moorestown, NJ 08057ConEdison Solutions (888) 665-0955 Great Eastern Energy (888) 651-4121535 State Highway 38 www.conedsolutions.com 116 Village Riva, Suite 200 www.greateastern.comCherry Hill, NJ 08002 Princeton, NJ 08540Constellation NewEnergy, Inc. (888) 635-0827 Glacial Energy of New Jersey, Inc. (877) 569-2841900A Lake Street, Suite 2 www.newenergy.com 207 LaRoche Avenue www.glacialenergy.comRamsey, NJ 07446 Harrington Park, NJ 07640Credit Suisse, (USA) Inc. (212) 538-3124 Hess Corporation (800) 437-7872700 College Road East www.creditsuisse.com 1 Hess Plaza www.hess.comPrinceton, NJ 08450 Woodbridge, NJ 07095Direct Energy Services, LLC (866) 547-2722 Intelligent Energy (800) 724-1880120 Wood Avenue, Suite 611 www.directenergy.com 2050 Center Avenue, Suite 500 www.intelligentenergy.orgIselin, NJ 08830 Fort Lee, NJ 07024FirstEnergy Solutions (800) 977-0500 Metromedia Energy, Inc. (877) 750-7046300 Madison Avenue www.fes.com 6 Industrial Way www.metromediaenergy.comMorristown, NJ 07926 Eatontown, NJ 07724Glacial Energy of New Jersey, Inc. (877) 569-2841 MxEnergy, Inc. (800) 375-1277207 LaRoche Avenue www.glacialenergy.com 510 Thornall Street, Suite 270 www.mxenergy.comHarrington Park, NJ 07640 Edison, NJ 08837Metro Energy Group, LLC (888) 536-3876 NATGASCO (Mitchell Supreme) (800) 840-442714 Washington Place www.metroenergy.com 532 Freeman Street www.natgasco.comHackensack, NJ 07601 Orange, NJ 07050Integrys Energy Services, Inc. (877) 763-9977 Pepco Energy Services, Inc. (800) 363-749999 Wood Ave, South, Suite 802 www.integrysenergy.com 112 Main Street www.pepco-services.comIselin, NJ 08830 Lebanon, NJ 08833Liberty Power Delaware, LLC (866) 769-3799 PPL EnergyPlus, LLC (800) 281-2000Park 80 West Plaza II, Suite 200 www.libertypowercorp.com 811 Church Road www.pplenergyplus.comSaddle Brook, NJ 07663 Cherry Hill, NJ 08002Liberty Power Holdings, LLC (800) 363-7499 South Jersey Energy Company (800) 756-3749Park 80 West Plaza II, Suite 200 www.libertypowercorp.com One South Jersey Plaza, Route 54 www.southjerseyenergy.comSaddle Brook, NJ 07663 Folsom, NJ 08037Pepco Energy Services, Inc. (800) 363-7499 Sprague Energy Corp. (800) 225-1560112 Main St. www.pepco-services.com 12 Ridge Road www.spragueenergy.comLebanon, NJ 08833 Chatham Township, NJ 07928PPL EnergyPlus, LLC (800) 281-2000 Woodruff Energy (800) 557-1121811 Church Road www.pplenergyplus.com 73 Water Street www.woodruffenergy.comCherry Hill, NJ 08002 Bridgeton, NJ 08302Sempra Energy Solutions (877) 273-6772581 Main Street, 8th Floor www.semprasolutions.comWoodbridge, NJ 07095South Jersey Energy Company (800) 756-3749One South Jersey Plaza, Route 54 www.southjerseyenergy.comFolsom, NJ 08037Sprague Energy Corp. (800) 225-156012 Ridge Road www.spragueenergy.comChatham Township, NJ 07928Strategic Energy, LLC (888) 925-911555 Madison Avenue, Suite 400 www.sel.comMorristown, NJ 07960Suez Energy Resources NA, Inc. (888) 644-1014333 Thornall Street, 6th Floor www.suezenergyresources.comEdison, NJ 08837UGI Energy Services, Inc. (856) 273-9995704 East Main Street, Suite 1 www.ugienergyservices.comMoorestown, NJ 08057