Embed Size (px)
Citation preview

Windows Server 2012 Desktop Virtualization (VDI) on Dell Active InfrastructureJohn Russell, Solution Manager, Dell
Senthil Baladhandayutham, Solution Development Manager, Dell
DV-B393
Dell Desktop Virtualization Solutions
The Power to Do More
Combining a comprehensive end-to-end portfolio of solutions, Dell leverages its expertise in data center, services and end-points to empower IT to meet the needs of a rapidly changing workforce
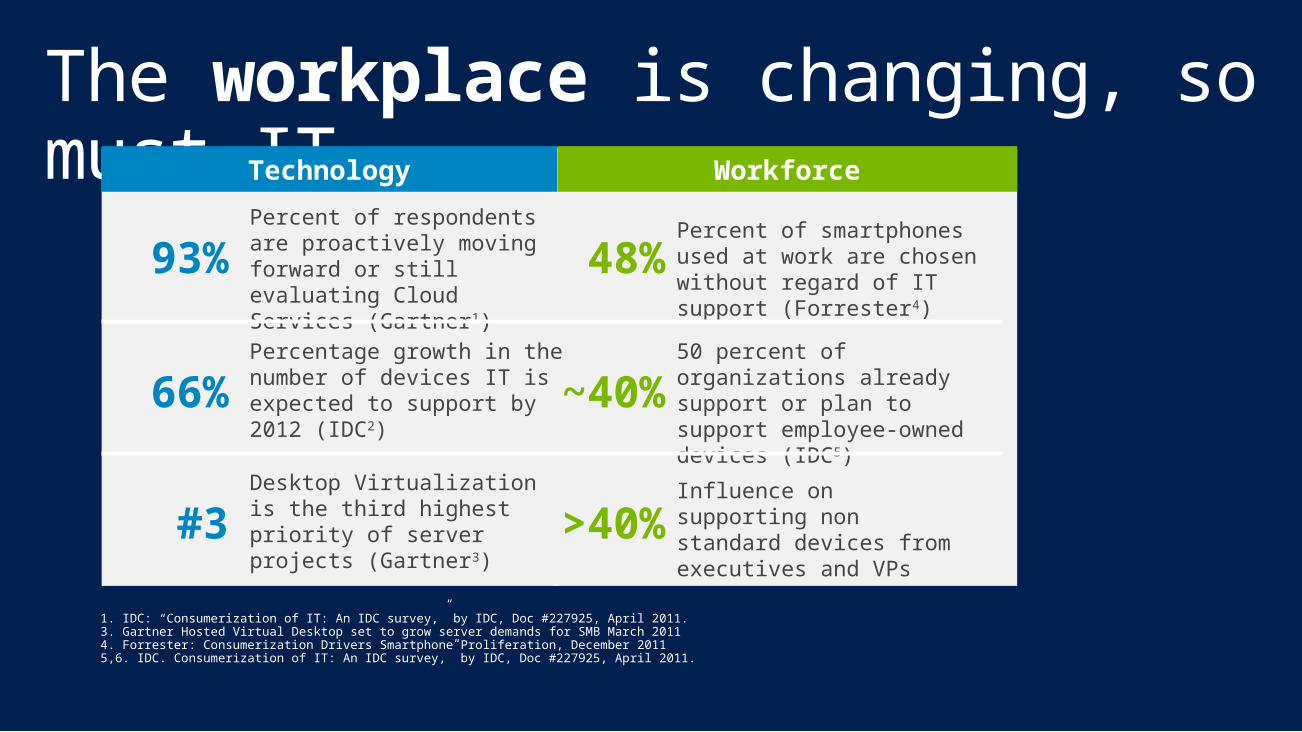
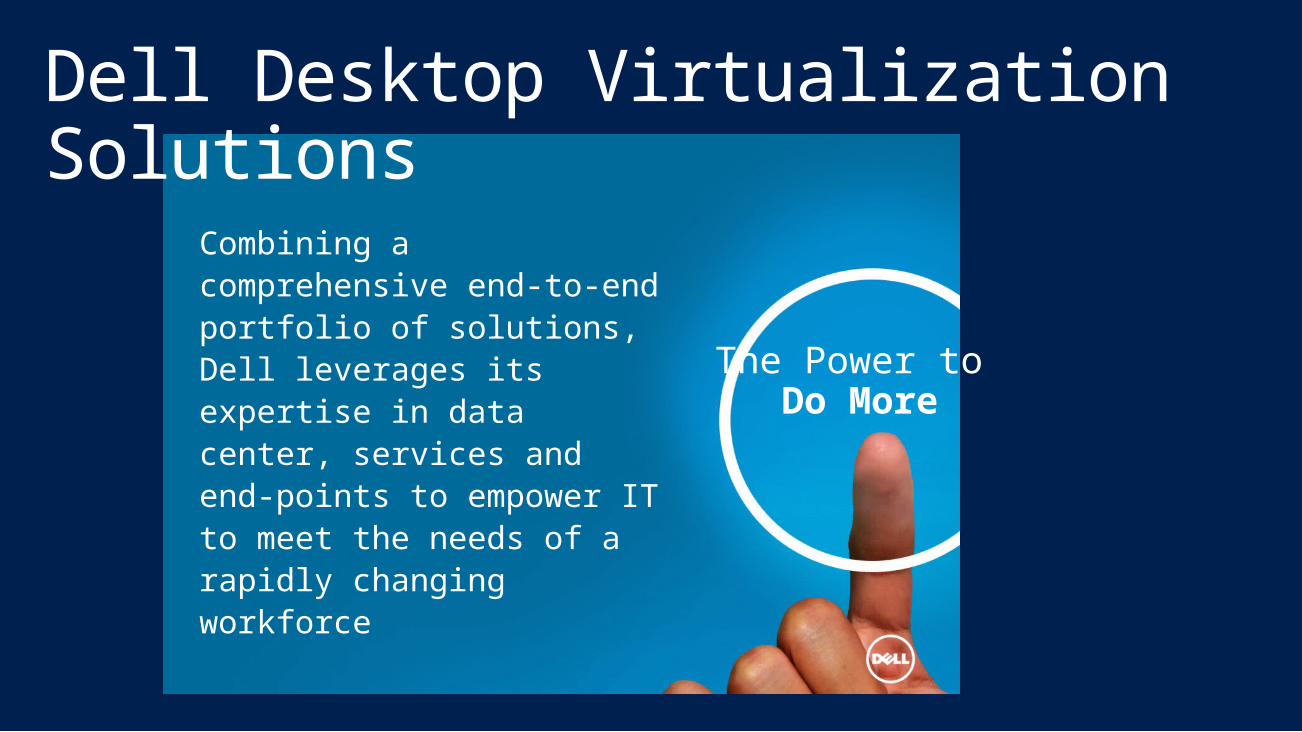
The workplace is changing, so must IT
48%Percent of smartphones used at work are chosen without regard of IT support (Forrester4)
~40%
50 percent of organizations already support or plan to support employee-owned devices (IDC5)
>40%
Influence on supporting non standard devices from executives and VPs
1. IDC: “Consumerization of IT: An IDC survey,” by IDC, Doc #227925, April 2011.3. Gartner Hosted Virtual Desktop set to grow server demands for SMB March 20114. Forrester: Consumerization Drivers Smartphone Proliferation, December 20115,6. IDC. Consumerization of IT: An IDC survey,” by IDC, Doc #227925, April 2011.
Technology
#3Desktop Virtualization is the third highest priority of server projects (Gartner3)
Workforce
66%Percentage growth in the number of devices IT isexpected to support by2012 (IDC2)
93%Percent of respondents are proactively moving forward or still evaluating Cloud Services (Gartner1)
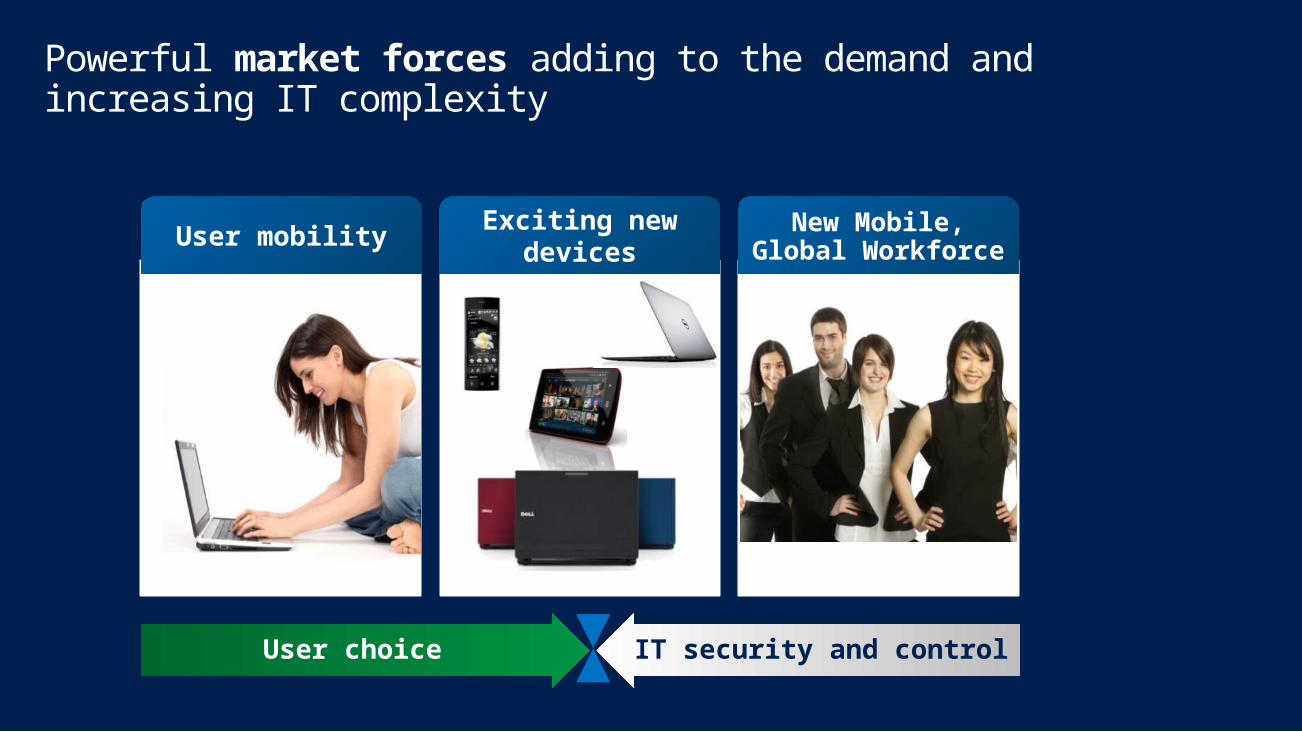
Powerful market forces adding to the demand and increasing IT complexity
User mobilityExciting new
devicesNew Mobile, Global
Workforce
User choice IT security and control
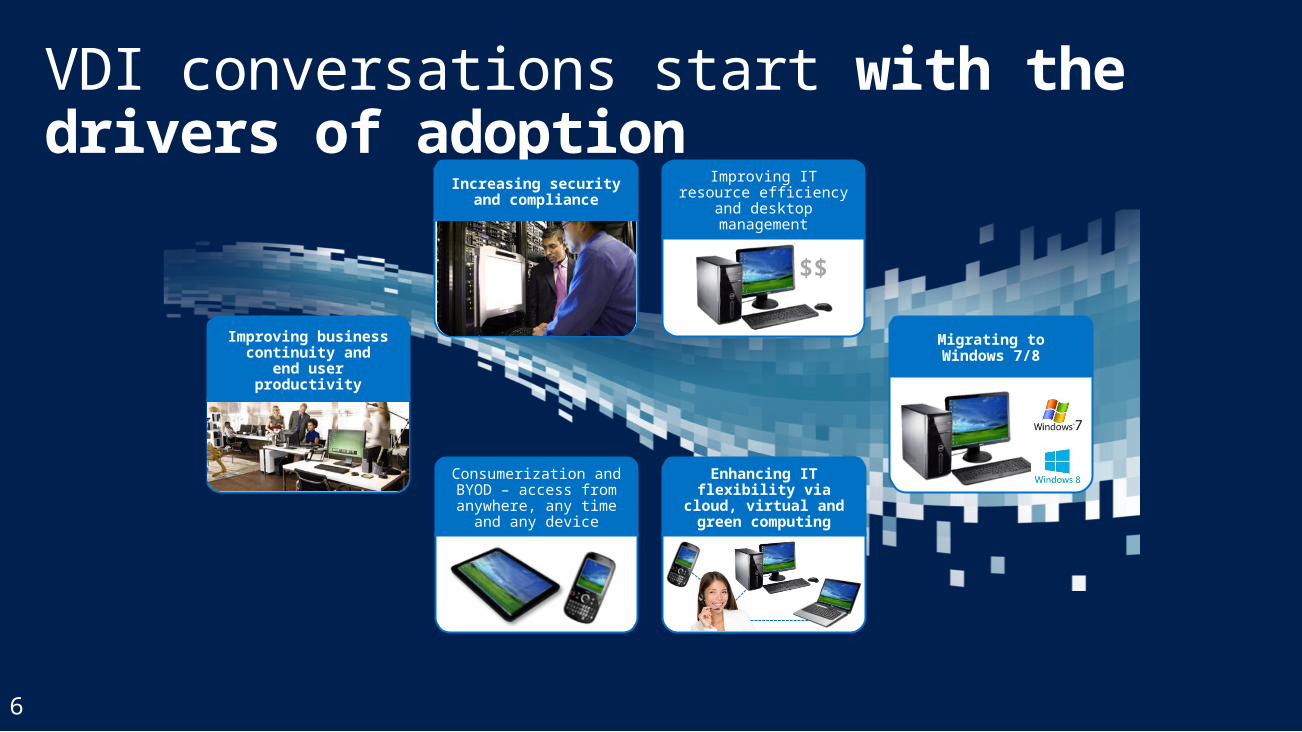
VDI conversations start with the drivers of adoption
6
Consumerization and BYOD – access from anywhere, any time
and any device
Migrating toWindows 7/8
Enhancing IT flexibility via cloud, virtual and green
computing
Improving IT resource efficiency and desktop
management
$$
Increasing securityand compliance
Improving businesscontinuity and
end user productivity

Enabling our customers to Do More
7
Improve end user productivityDeliver mobility freedom using any device
Secure dataCentralize & back up data plus end point to data center security options
Maximize IT investmentsReduce or redeploy desktop support resources
Simplify ManagementStreamline image & application updates, deployments and failure recovery
The Power to
Do More
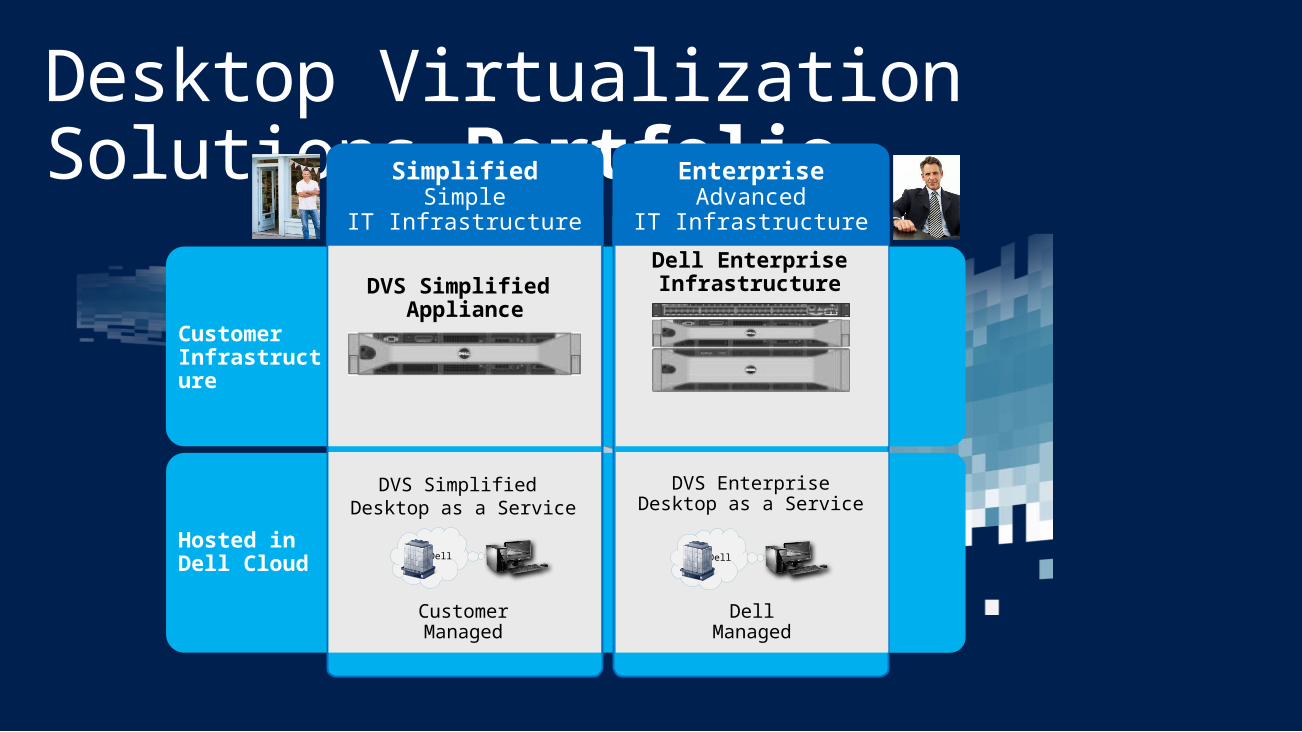
Desktop Virtualization Solutions Portfolio Simplified
SimpleIT Infrastructure
EnterpriseAdvanced
IT Infrastructure
CustomerInfrastructure
DVS Simplified Appliance
Dell EnterpriseInfrastructure
DVS Simplified Desktop as a Service
DVS EnterpriseDesktop as a Service
DellManaged
CustomerManaged
Hosted inDell Cloud Dell Dell
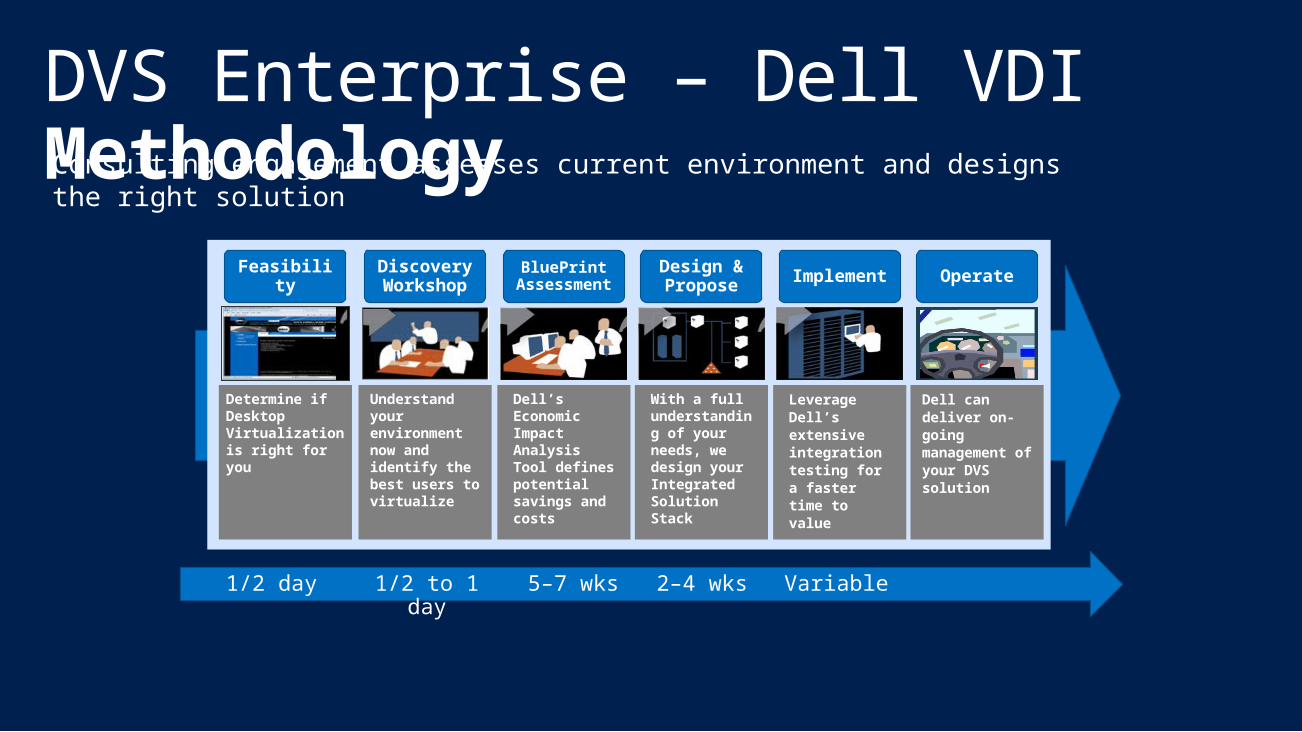
DVS Enterprise – Dell VDI Methodology
Workshop Discovery
Feasibility
BluePrint Assessment
Design / Plan
Implement Operate
Determine if Desktop Virtualization is right for you
Discovery Workshop
Feasibility
BluePrint Assessment
Design & Propose
Implement Operate
Dell can deliver on-going management of your DVS solution
Leverage Dell’s extensive integration testing for a faster time to value
With a full understanding of your needs, we design your Integrated Solution Stack
Dell’s Economic Impact Analysis Tool defines potential savings and costs
Understand your environment now and identify the best users to virtualize
Consulting engagement assesses current environment and designs the right solution
1/2 day 1/2 to 1 day 5–7 wks 2–4 wks Variable
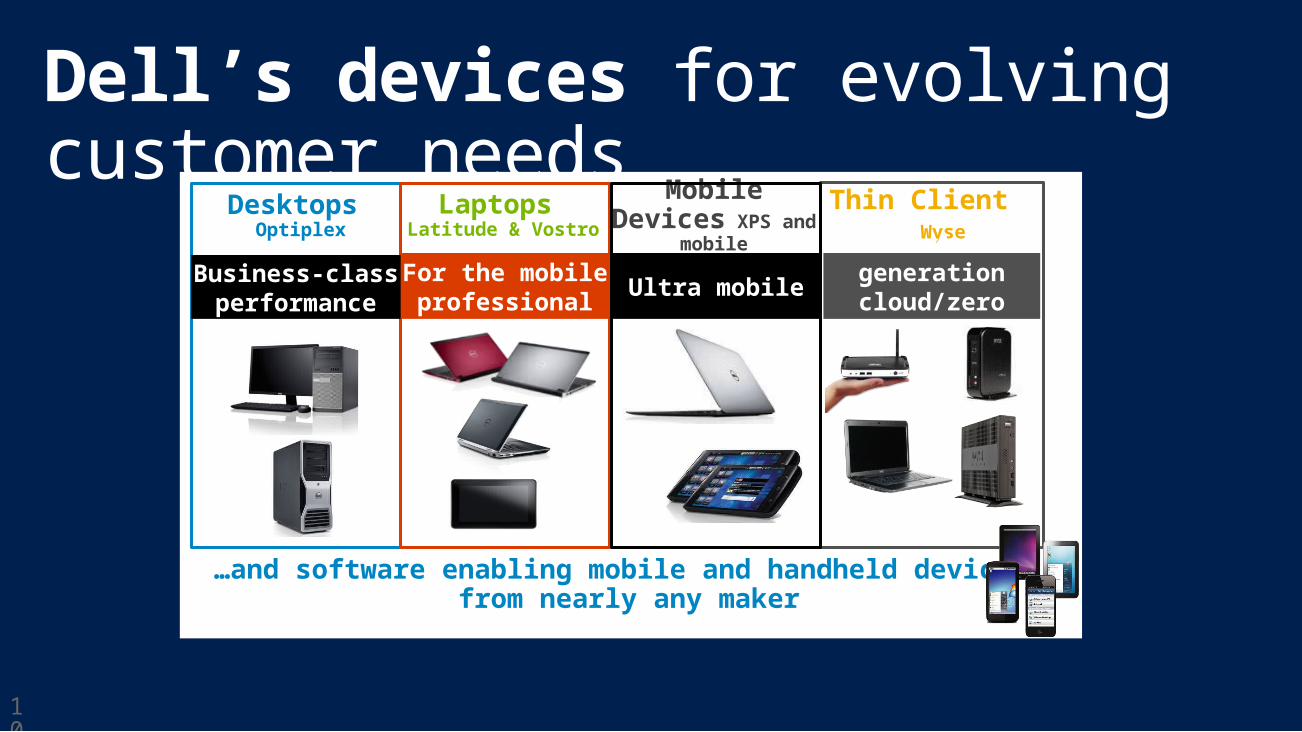
Dell’s devices for evolving customer needs
10
For the mobile professional
For the mobile professional
Business-class performance
Thin Client Wyse
Laptops Latitude & Vostro
Mobile Devices XPS
and mobile
Ultra mobile
Next-generation cloud/zero
clients
For the mobile professional
Business-class performance
…and software enabling mobile and handheld devices
from nearly any maker
Desktops Optiplex
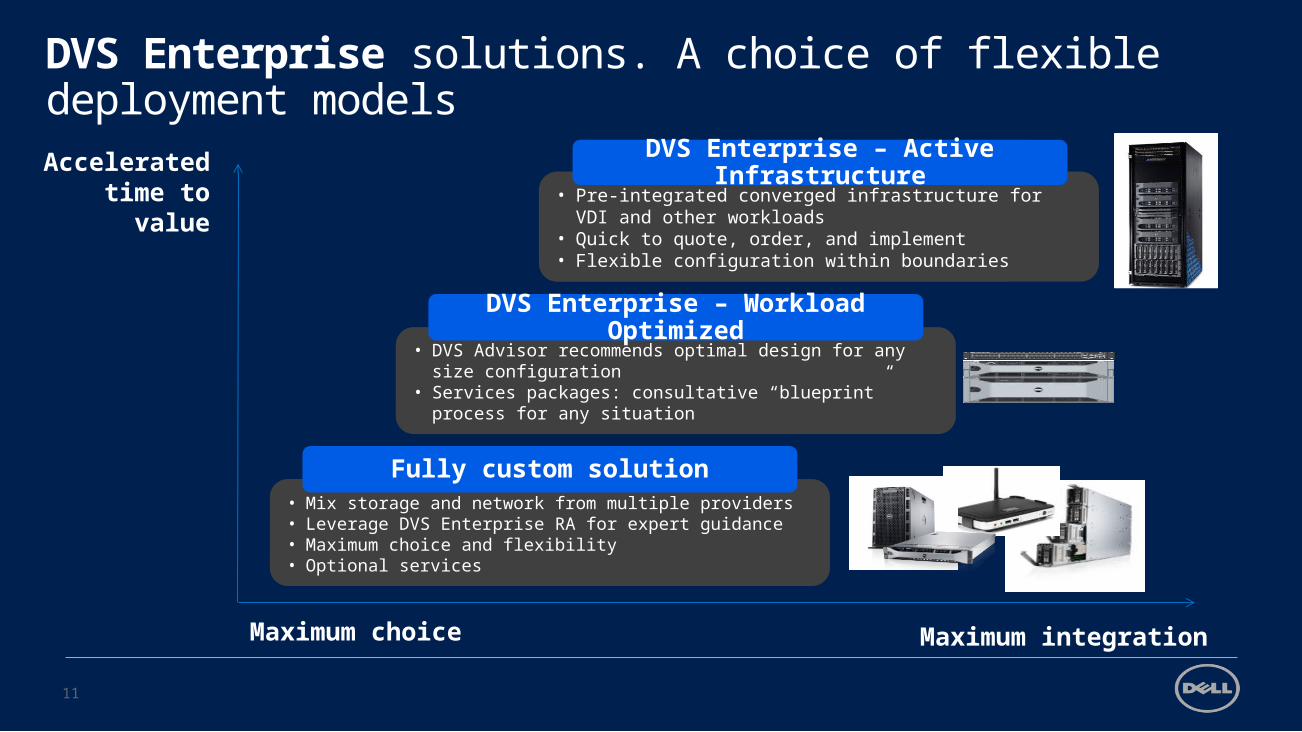
DVS Enterprise solutions. A choice of flexible deployment models
11
Maximum choice Maximum integration
Accelerated time to
value
• Mix storage and network from multiple providers• Leverage DVS Enterprise RA for expert guidance• Maximum choice and flexibility• Optional services
• DVS Advisor recommends optimal design for any size configuration
• Services packages: consultative “blueprint” process for any situation
• Pre-integrated converged infrastructure for VDI and other workloads
• Quick to quote, order, and implement• Flexible configuration within boundaries
DVS Enterprise – Active Infrastructure
DVS Enterprise – Workload Optimized
Fully custom solution
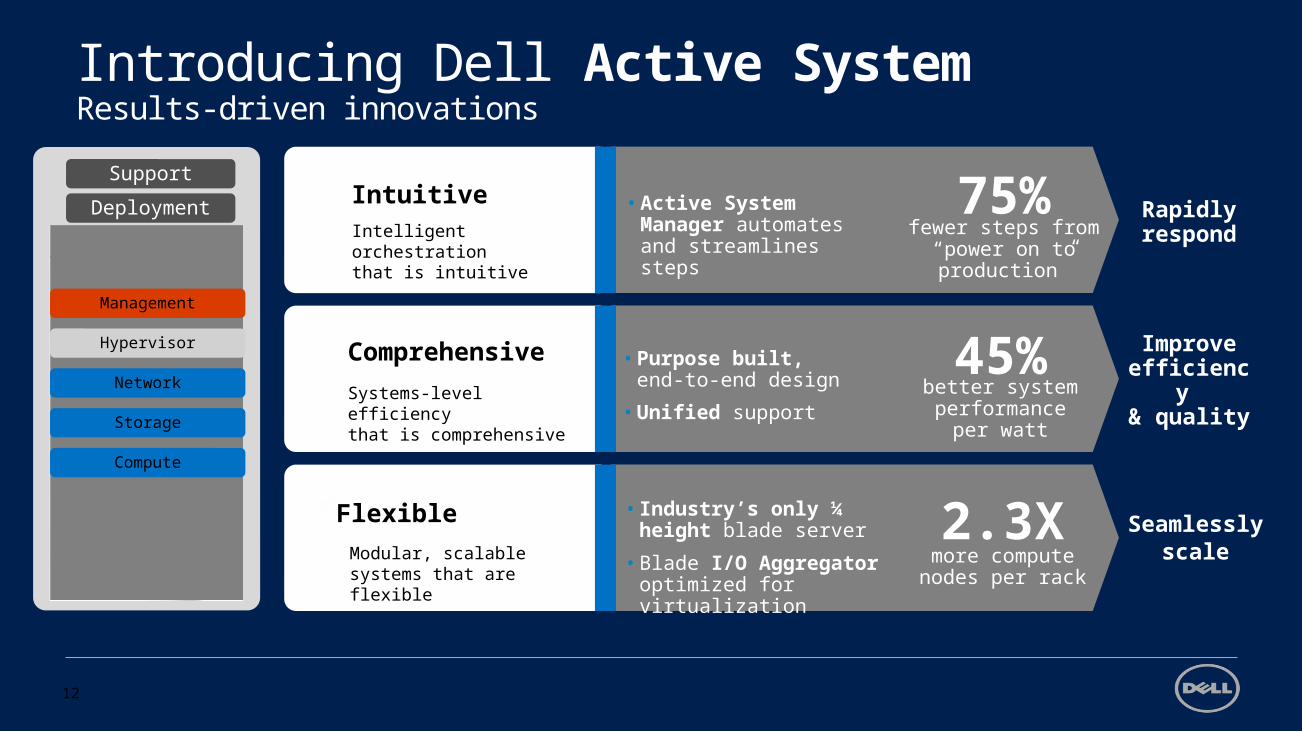
Introducing Dell Active System Results-driven innovations
12
SupportDeploymentManagement
Hypervisor
Network
Storage
Compute
RapidlyrespondIntelligent orchestration
that is intuitive
Intuitive • Active System Manager automates and streamlines steps
75%fewer steps from
“power on toproduction”
Improve efficiency & quality
Systems-level efficiency that is comprehensive
Comprehensive • Purpose built, end-to-end design
• Unified support
45%better systemperformance
per watt
Seamlessly
scaleModular, scalable systems that are flexible
Flexible • Industry’s only ¼ height blade server
• Blade I/O Aggregator optimized for virtualization
2.3Xmore computenodes per rack
Support
Deployment
Dell-Microsoft VDI Technical Overview
Senthil Baladhandayutham
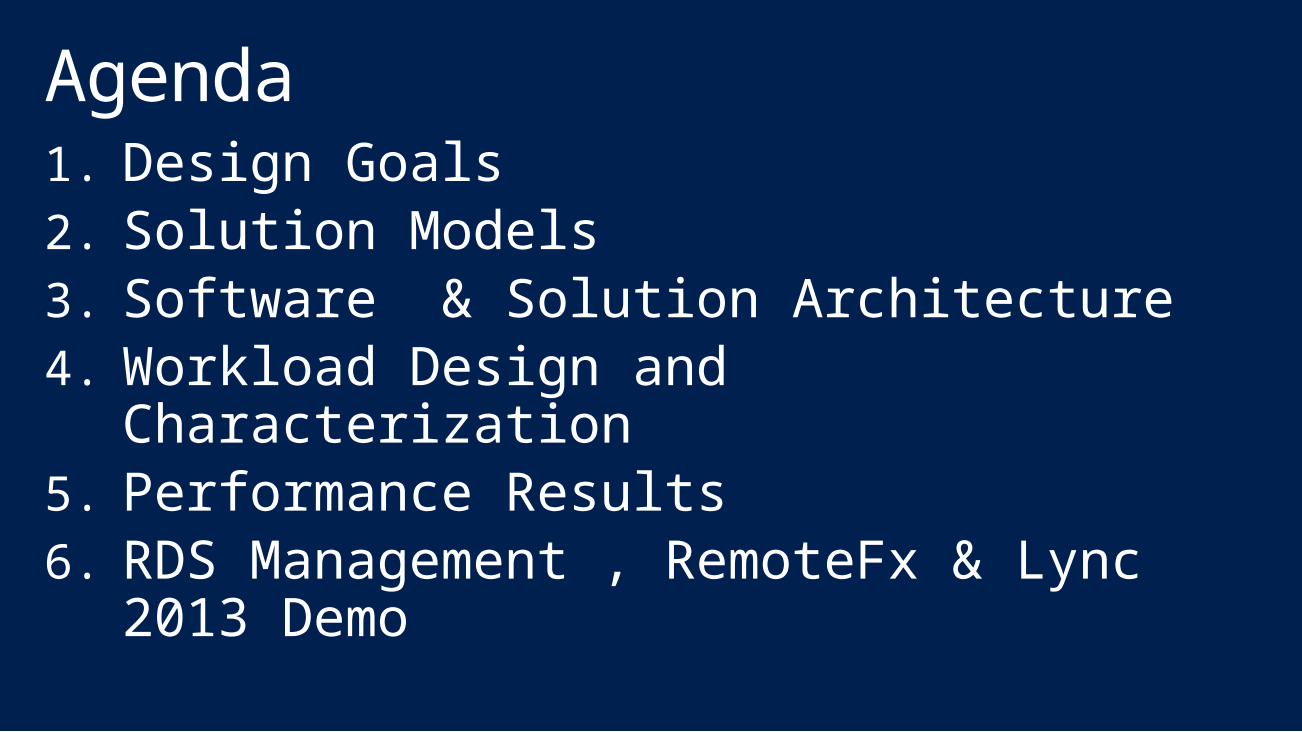
Agenda1. Design Goals2. Solution Models3. Software & Solution Architecture4. Workload Design and Characterization5. Performance Results6. RDS Management , RemoteFx & Lync
2013 Demo
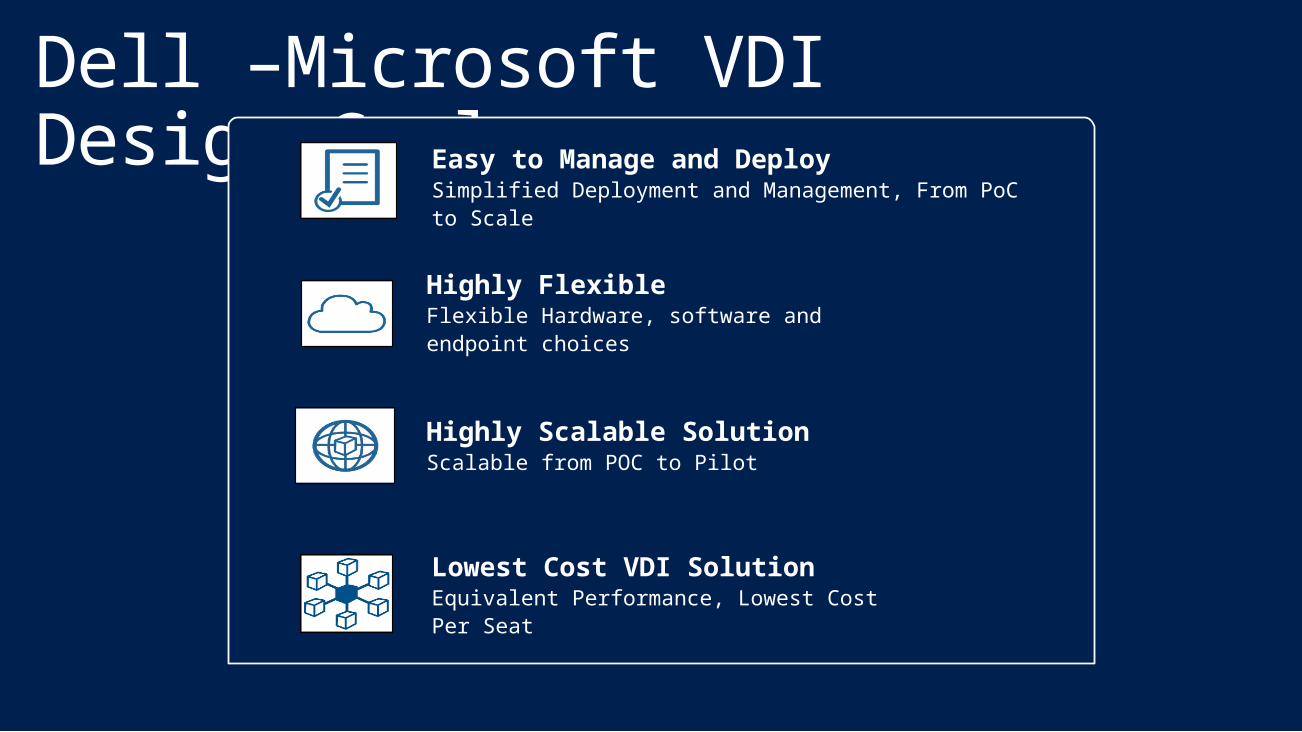
Dell –Microsoft VDI Design Goals
Lowest Cost VDI Solution Equivalent Performance, Lowest Cost Per Seat
Easy to Manage and DeploySimplified Deployment and Management, From PoC to Scale
Highly Flexible Flexible Hardware, software and endpoint choices
Highly Scalable Solution Scalable from POC to Pilot
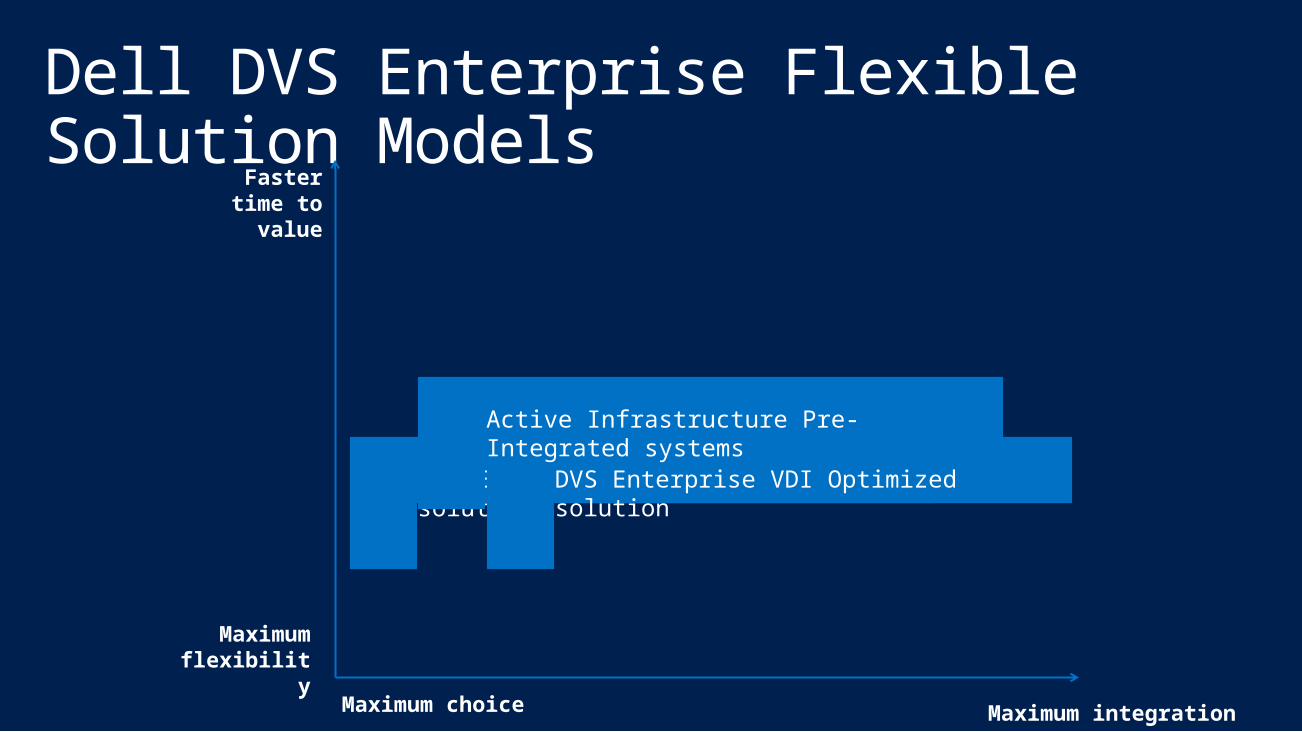
Dell DVS Enterprise Flexible Solution Models
Maximumflexibility
Faster time to
value
Maximum choice Maximum integration
DVS Enterprise highly flexible solutionDVS Enterprise VDI Optimized solution
Active Infrastructure Pre-Integrated systems
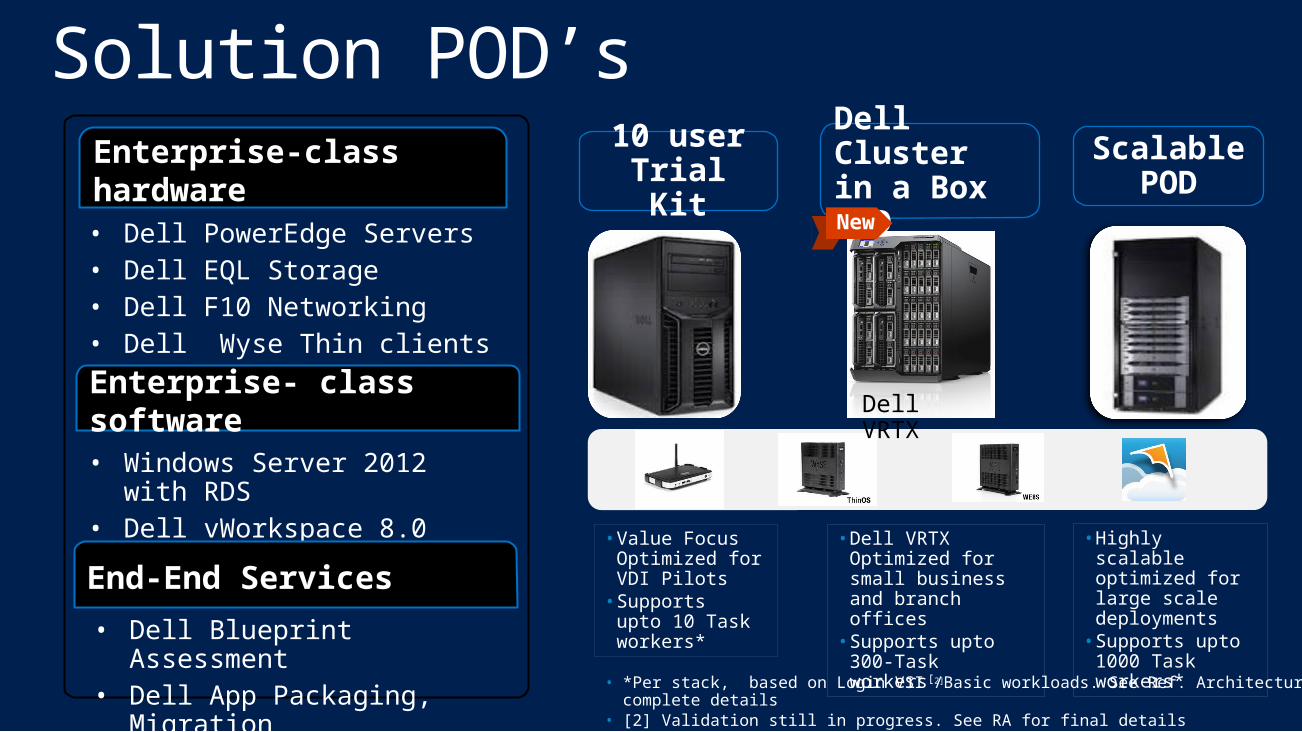
Solution POD’s
• Value Focus Optimized for VDI Pilots• Supports upto
10 Task workers*
Enterprise-class hardware
Enterprise- class software
10 user Trial Kit
• *Per stack, based on Login VSI /Basic workloads. See Ref. Architectures for complete details
• [2] Validation still in progress. See RA for final details
• Dell PowerEdge Servers• Dell EQL Storage• Dell F10 Networking• Dell Wyse Thin clients
• Windows Server 2012 with RDS
• Dell vWorkspace 8.0
End-End Services
• Dell Blueprint Assessment• Dell App Packaging,
Migration
Dell Cluster in a Box POD
Scalable POD
• Dell VRTX Optimized for small business and branch offices• Supports upto 300-
Task workers[2]
• Highly scalable optimized for large scale deployments• Supports upto
1000 Task workers*
Dell VRTX
New
RDS-Software Architecture
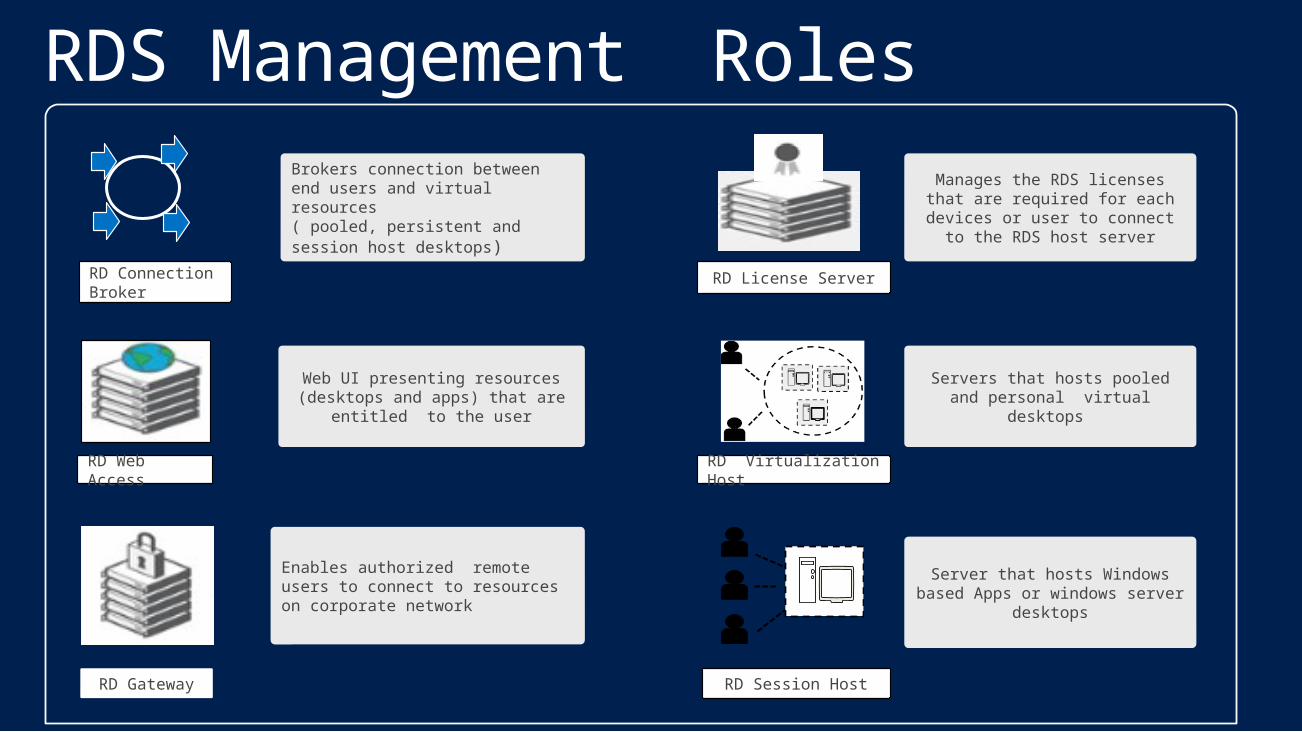
RDS Management RolesBrokers connection between end users and virtual resources( pooled, persistent and session host desktops)
RD Connection Broker
Web UI presenting resources (desktops and apps) that are
entitled to the user
RD Web Access
Manages the RDS licenses that are required for each devices or user to connect to the RDS host
server
RD License Server
Enables authorized remote users to connect to resources on corporate network
RD Gateway RD Session Host
Server that hosts Windows based Apps or windows server desktops
Servers that hosts pooled and personal virtual desktops
RD Virtualization Host
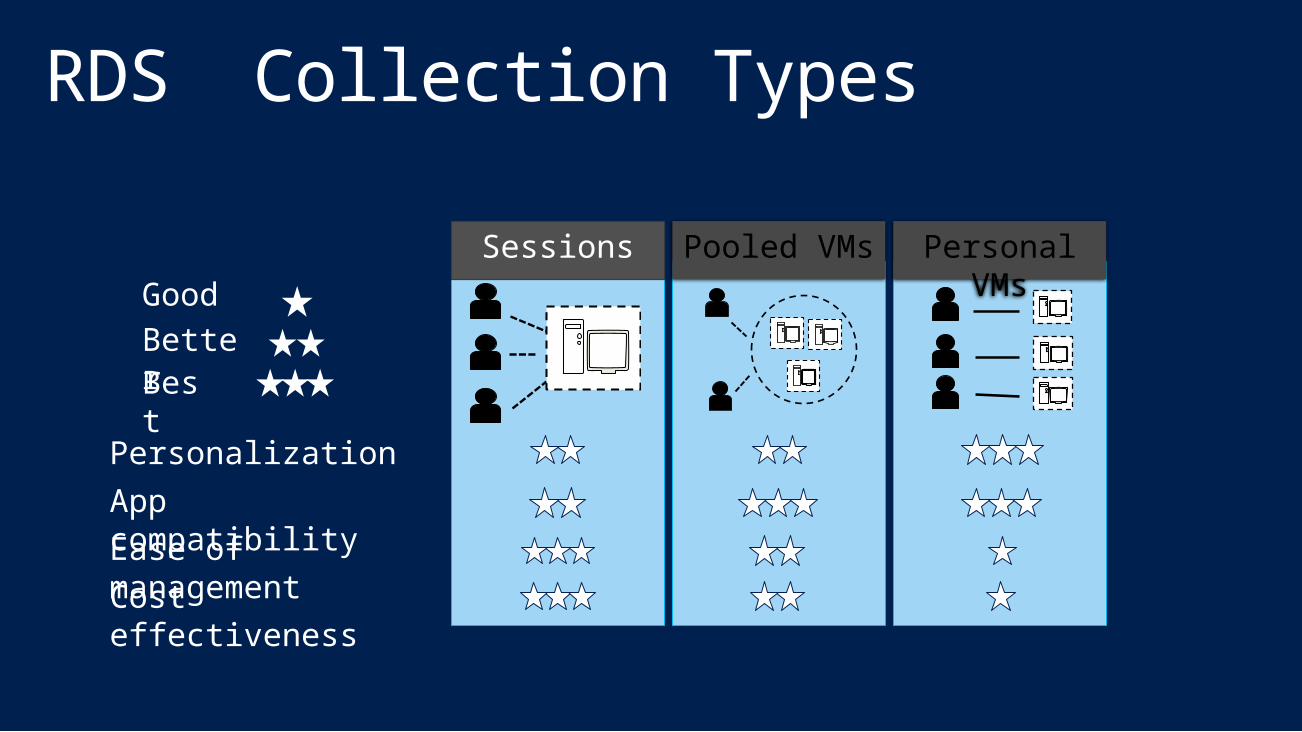
RDS Collection Types
Personal VMs
Pooled VMs
Ease of management
App compatibility
Personalization
Cost effectiveness
GoodBetterBest
Sessions
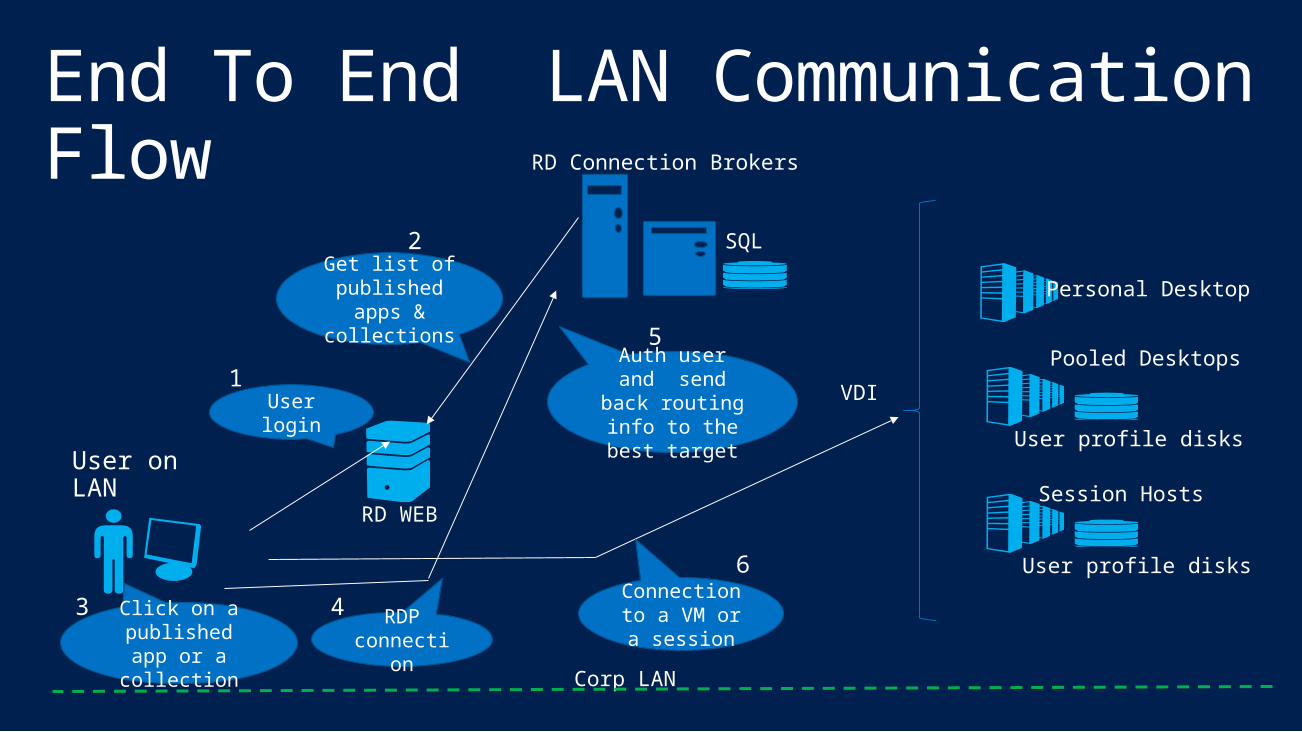
RD Connection Brokers
Personal Desktop
Pooled Desktops
RD WEBSession Hosts
User on LAN
VDI
Corp LAN
1User login
2Get list of published
apps & collections
End To End LAN Communication Flow
User profile disks
User profile disks
SQL
6Connection to a VM or a
sessionClick on a
published app or a collection
3 RDP connectio
n
4
Auth user and send back
routing info to the best target
5
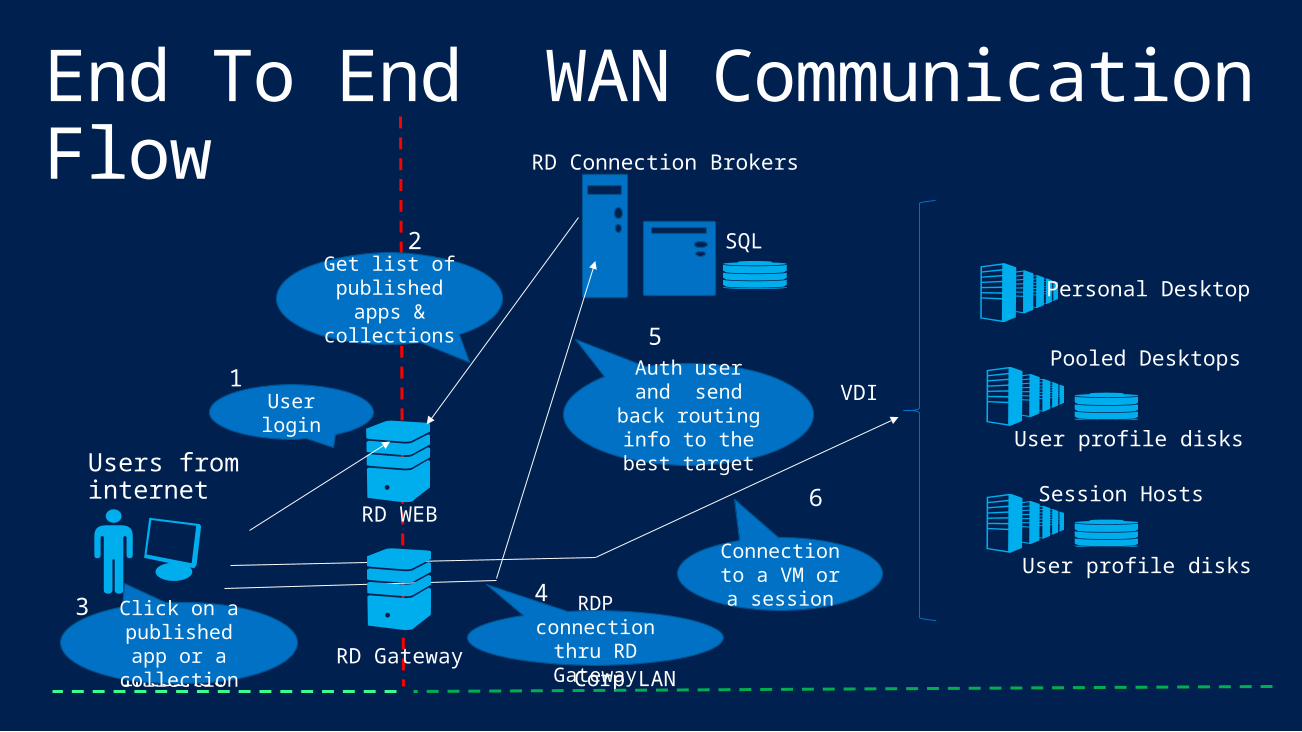
RD Connection Brokers
Personal Desktop
Pooled Desktops
RD WEB
RD Gateway
Session HostsUsers from internet
VDI
Corp LANInternet
End To End WAN Communication Flow
User profile disks
User profile disks
SQL
1User login
2Get list of published
apps & collections
Click on a published app or a collection
3 RDP connection thru RD Gateway
4
6
Auth user and send back
routing info to the best target
Connection to a VM or a
session
5
Solution Architecture
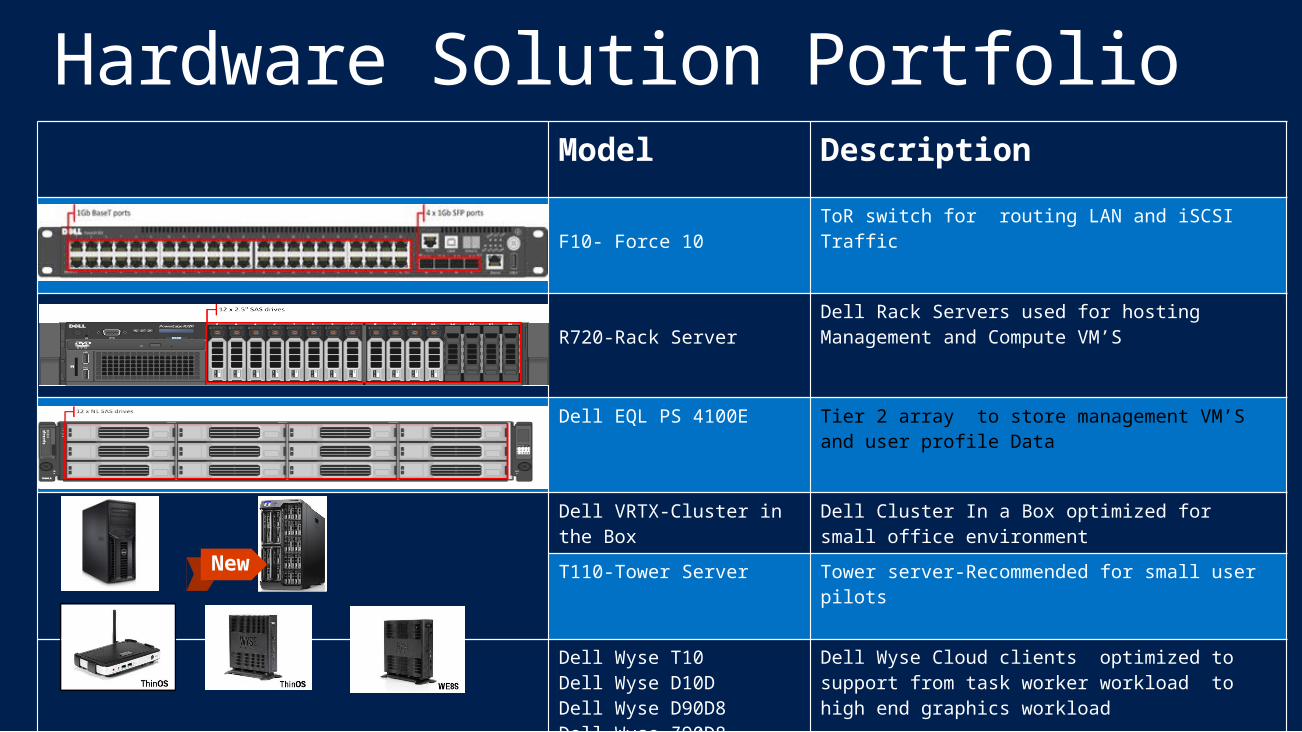
Hardware Solution PortfolioModel Description
F10- Force 10ToR switch for routing LAN and iSCSI Traffic
R720-Rack ServerDell Rack Servers used for hosting Management and Compute VM’S
Dell EQL PS 4100E Tier 2 array to store management VM’S and user profile Data
Dell VRTX-Cluster in the Box
Dell Cluster In a Box optimized for small office environment
T110-Tower Server Tower server-Recommended for small user pilots
Dell Wyse T10Dell Wyse D10DDell Wyse D90D8Dell Wyse Z90D8
Dell Wyse Cloud clients optimized to support from task worker workload to high end graphics workload
New
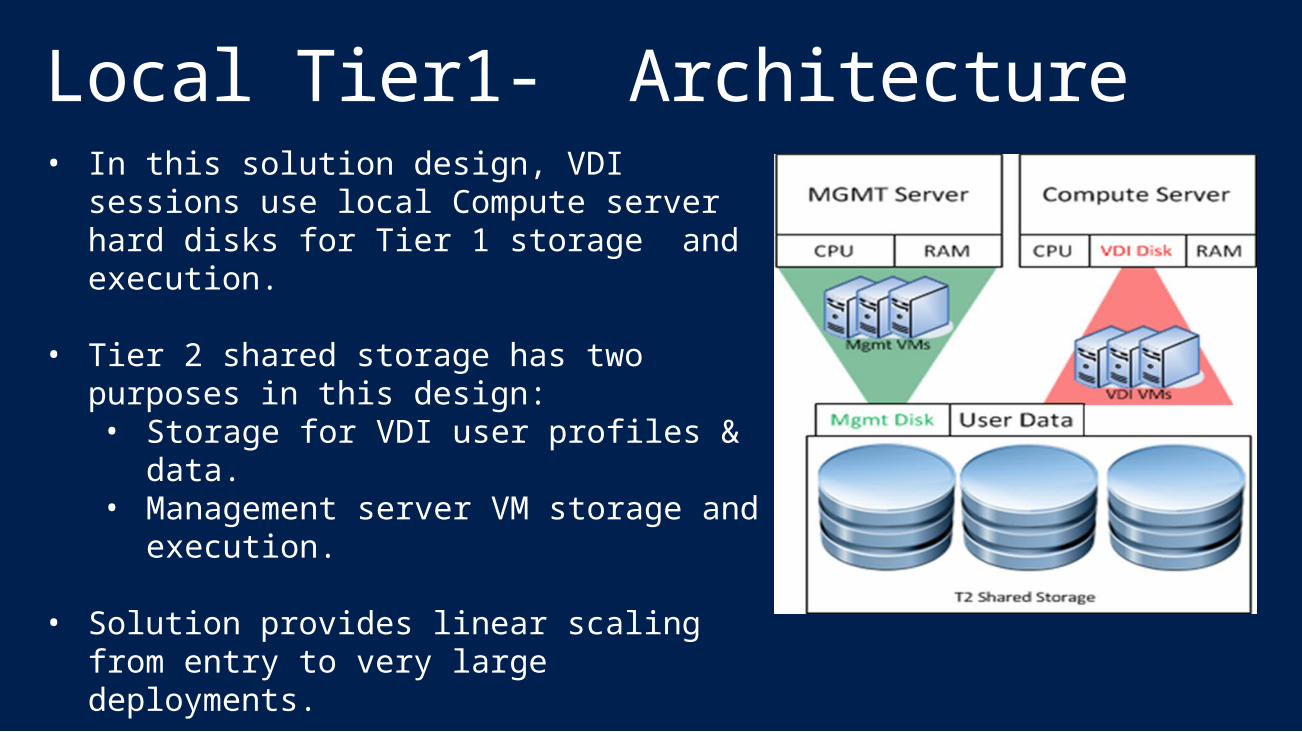
Local Tier1- Architecture• In this solution design, VDI sessions use
local Compute server hard disks for Tier 1 storage and execution.
• Tier 2 shared storage has two purposes in this design:• Storage for VDI user profiles & data.• Management server VM storage and
execution.
• Solution provides linear scaling from entry to very large deployments.
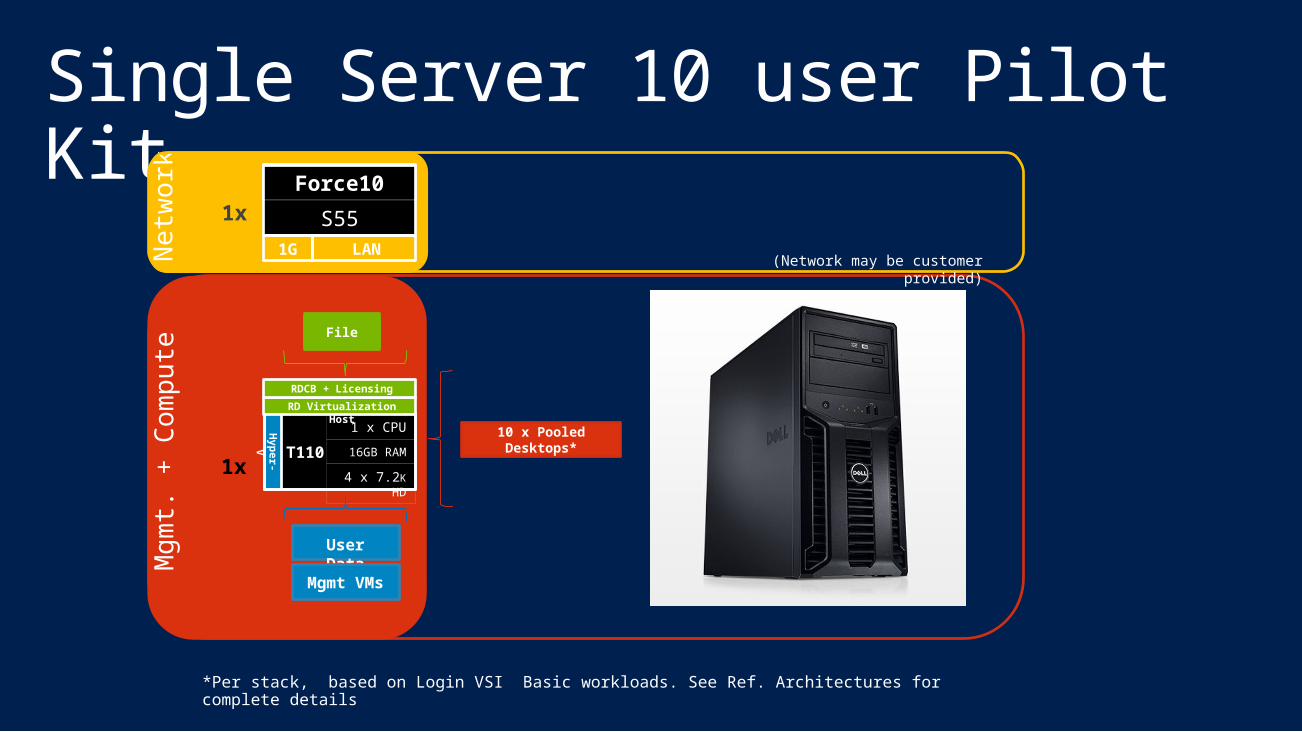
Single Server 10 user Pilot KitM
gm
t. +
Com
pu
teN
etw
ork
1x S55
Force10
1G LAN
File
1xT110
16GB RAM
4 x 7.2K HD
1 x CPUHyp
er-
V
User DataMgmt VMs
(Network may be customer provided)
RD Virtualization Host
RDCB + Licensing
10 x Pooled Desktops*
*Per stack, based on Login VSI Basic workloads. See Ref. Architectures for complete details
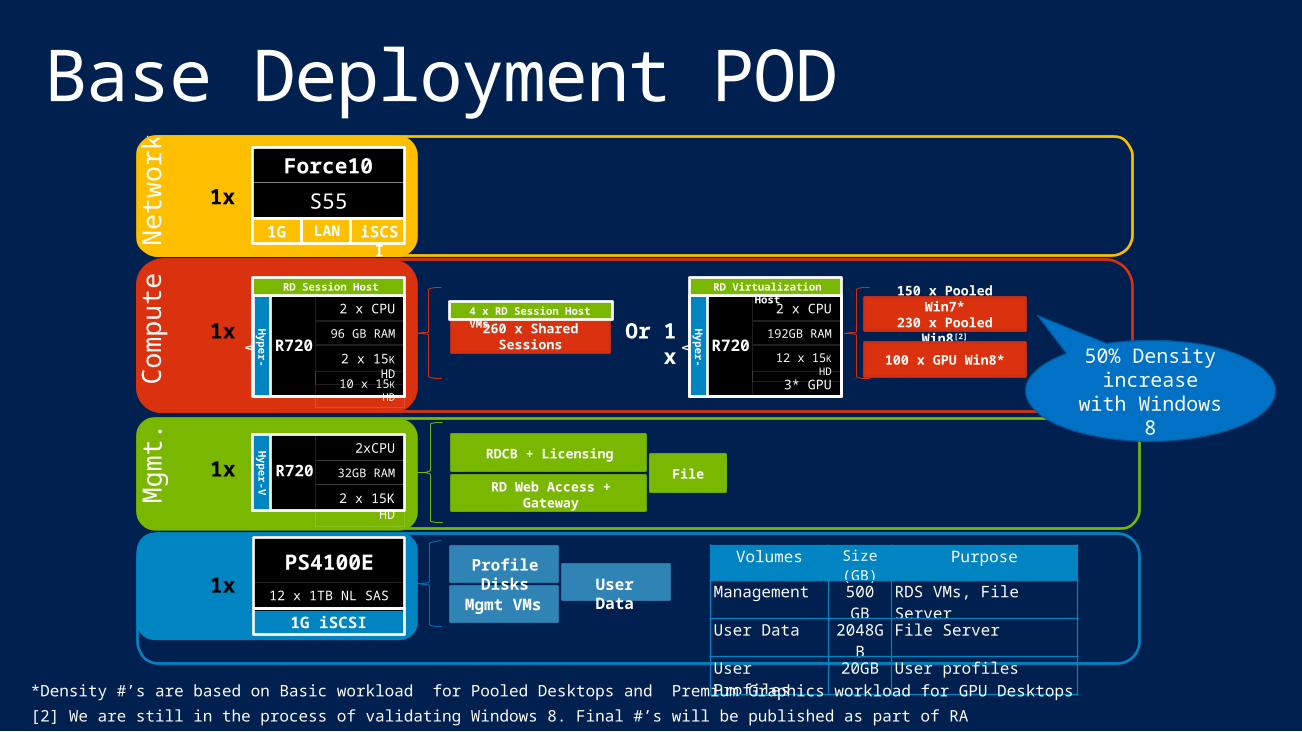
Base Deployment PODN
etw
ork
Com
pu
te
1x
Mg
mt.
R720 32GB RAM
2 x 15K HD
2xCPU
1x
Hyp
er-
V
1x
S55
Force10
1G LAN
iSCSI
RD Web Access + Gateway
File
RDCB + Licensing
R720
96 GB RAM
2 x 15K HD
2 x CPU
Hyp
er-
V
10 x 15K HD
RD Session Host 150 x Pooled Win7*
230 x Pooled Win8[2]
260 x Shared Sessions
4 x RD Session Host VMs
User DataMgmt
VMs
PS4100E12 x 1TB NL SAS
1G iSCSI
1xProfile Disks
R720
192GB RAM
12 x 15K HD
2 x CPU
Hyp
er-
V
3* GPU
RD Virtualization Host
Or 1 x
Volumes Size (GB)
Purpose
Management 500 GB
RDS VMs, File Server
User Data 2048GB
File Server
User Profiles 20GB User profiles
100 x GPU Win8*
*Density #’s are based on Basic workload for Pooled Desktops and Premium Graphics workload for GPU Desktops
[2] We are still in the process of validating Windows 8. Final #’s will be published as part of RA
50% Density increase with Windows 8
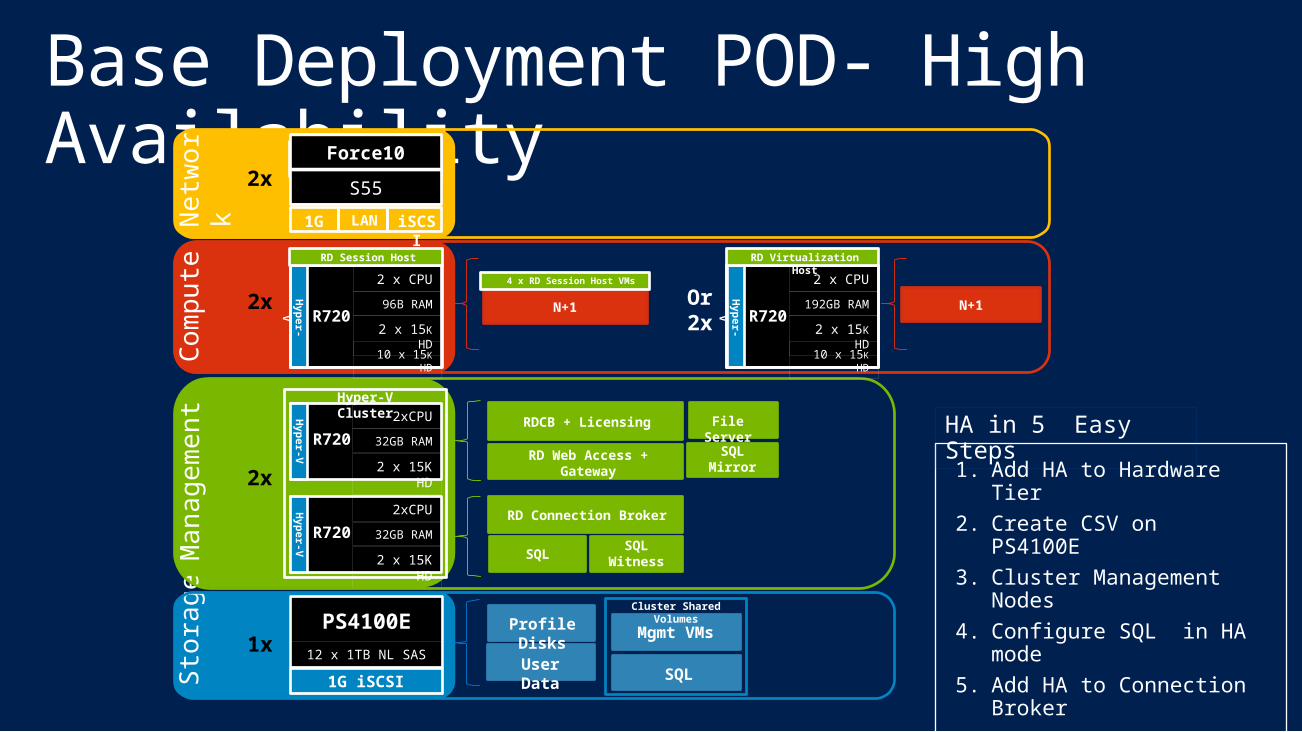
Base Deployment POD- High Availability
Netw
or
kC
om
pu
te2x
Man
ag
em
en
t
R720 32GB RAM
2 x 15K HD
2xCPU
2x
Hyp
er-
V
Sto
rag
e
2x
S55
Force10
1G LAN
iSCSI
RD Connection Broker
R720
96B RAM
2 x 15K HD
2 x CPU
Hyp
er-
V
10 x 15K HD
RD Session Host
N+1N+1
4 x RD Session Host VMs
User Data
PS4100E12 x 1TB NL SAS
1G iSCSI
1xProfile Disks
R720
192GB RAM
2 x 15K HD
2 x CPU
Hyp
er-
V
10 x 15K HD
RD Virtualization Host
Or 2x
R720 32GB RAM
2 x 15K HD
2xCPUHyp
er-
V
RD Web Access + Gateway
RDCB + Licensing
Hyper-V Cluster
Mgmt VMs
Cluster Shared Volumes
SQL
SQLMirror
SQLSQL
Witness
1. Add HA to Hardware Tier
2. Create CSV on PS4100E
3. Cluster Management Nodes
4. Configure SQL in HA mode
5. Add HA to Connection Broker
HA in 5 Easy StepsFile Server
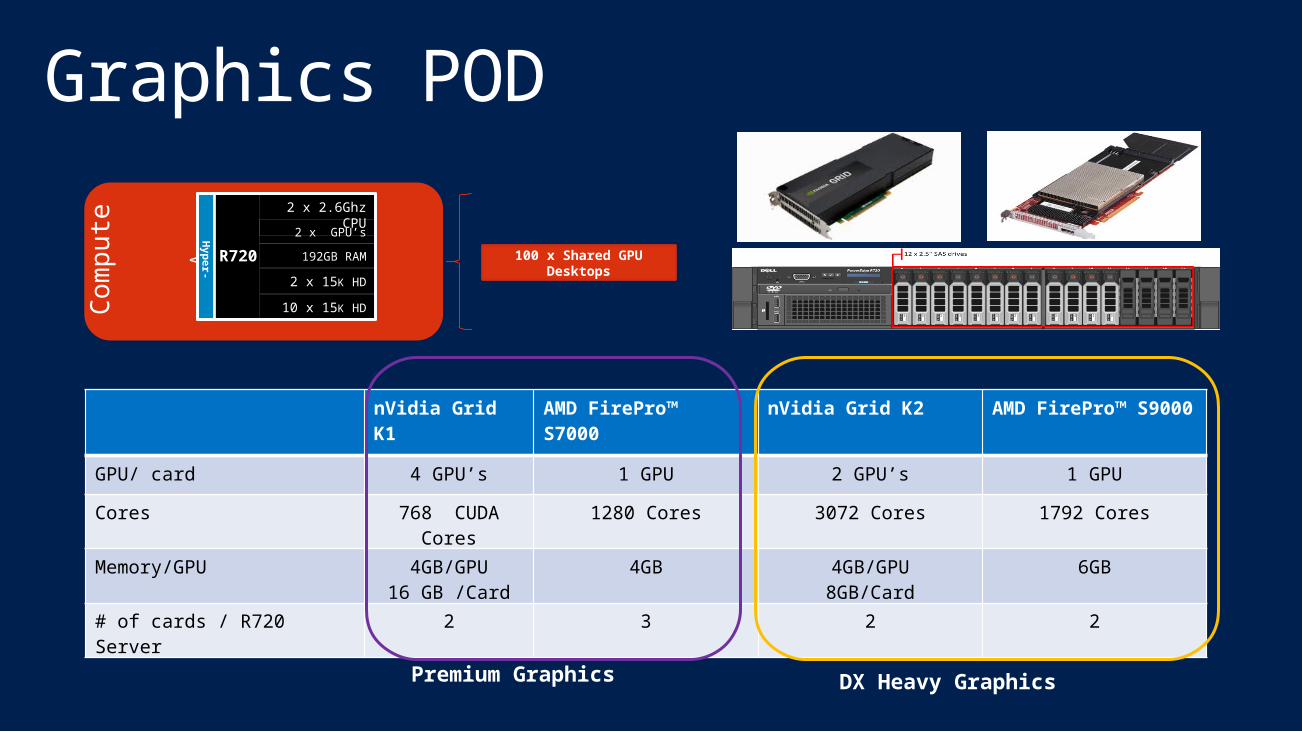
Graphics POD
R720
192GB RAM
2 x 15K HD
2 x 2.6Ghz CPU
Hyp
er-
V
10 x 15K HDCom
pu
te
2 x GPU’s
100 x Shared GPU Desktops
nVidia Grid K1
AMD FirePro™ S7000
nVidia Grid K2 AMD FirePro™ S9000
GPU/ card 4 GPU’s 1 GPU 2 GPU’s 1 GPU
Cores 768 CUDA Cores
1280 Cores 3072 Cores 1792 Cores
Memory/GPU 4GB/GPU16 GB /Card
4GB 4GB/GPU8GB/Card
6GB
# of cards / R720 Server 2 3 2 2
Premium Graphics DX Heavy Graphics
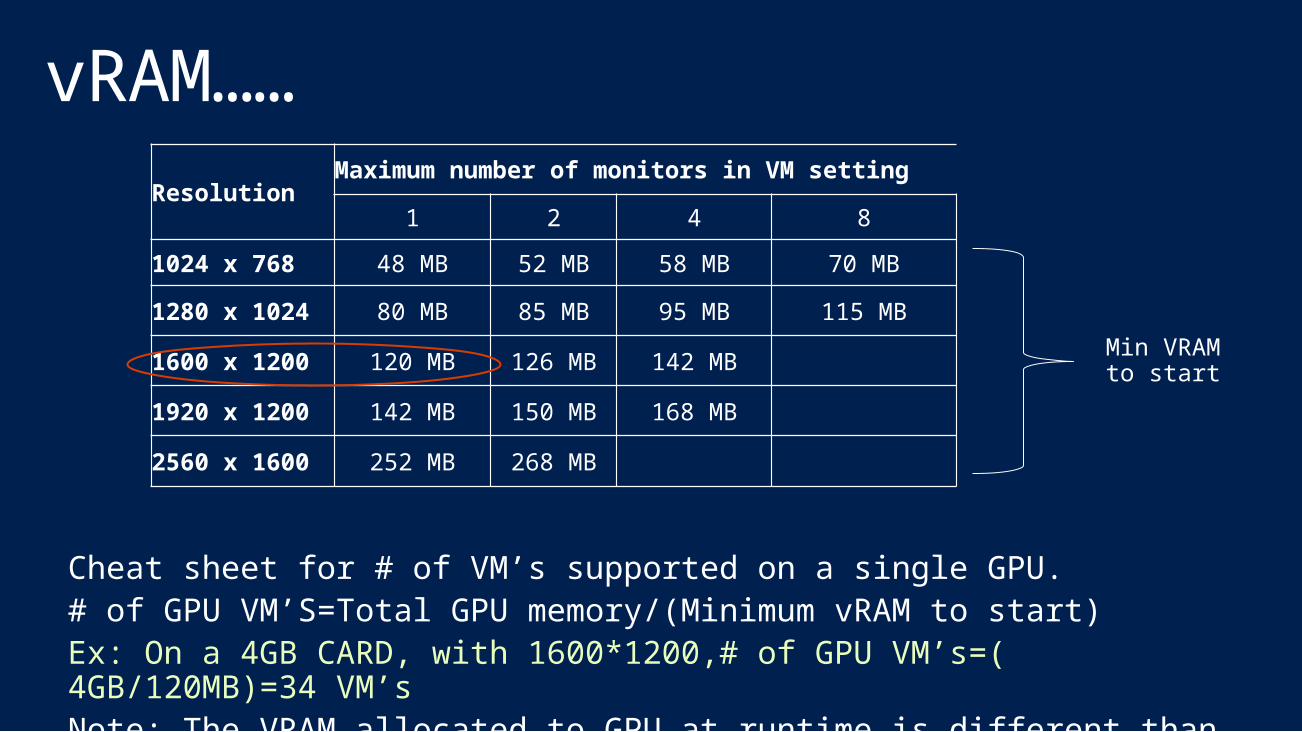
vRAM……Resolution
Maximum number of monitors in VM setting
1 2 4 8
1024 x 768 48 MB 52 MB 58 MB 70 MB
1280 x 1024 80 MB 85 MB 95 MB 115 MB
1600 x 1200 120 MB 126 MB 142 MB
1920 x 1200 142 MB 150 MB 168 MB
2560 x 1600 252 MB 268 MB
Cheat sheet for # of VM’s supported on a single GPU.# of GPU VM’S=Total GPU memory/(Minimum vRAM to start)Ex: On a 4GB CARD, with 1600*1200,# of GPU VM’s=( 4GB/120MB)=34 VM’sNote: The VRAM allocated to GPU at runtime is different than the startup vRAM
Min VRAM to start
Workload Design & Characterization
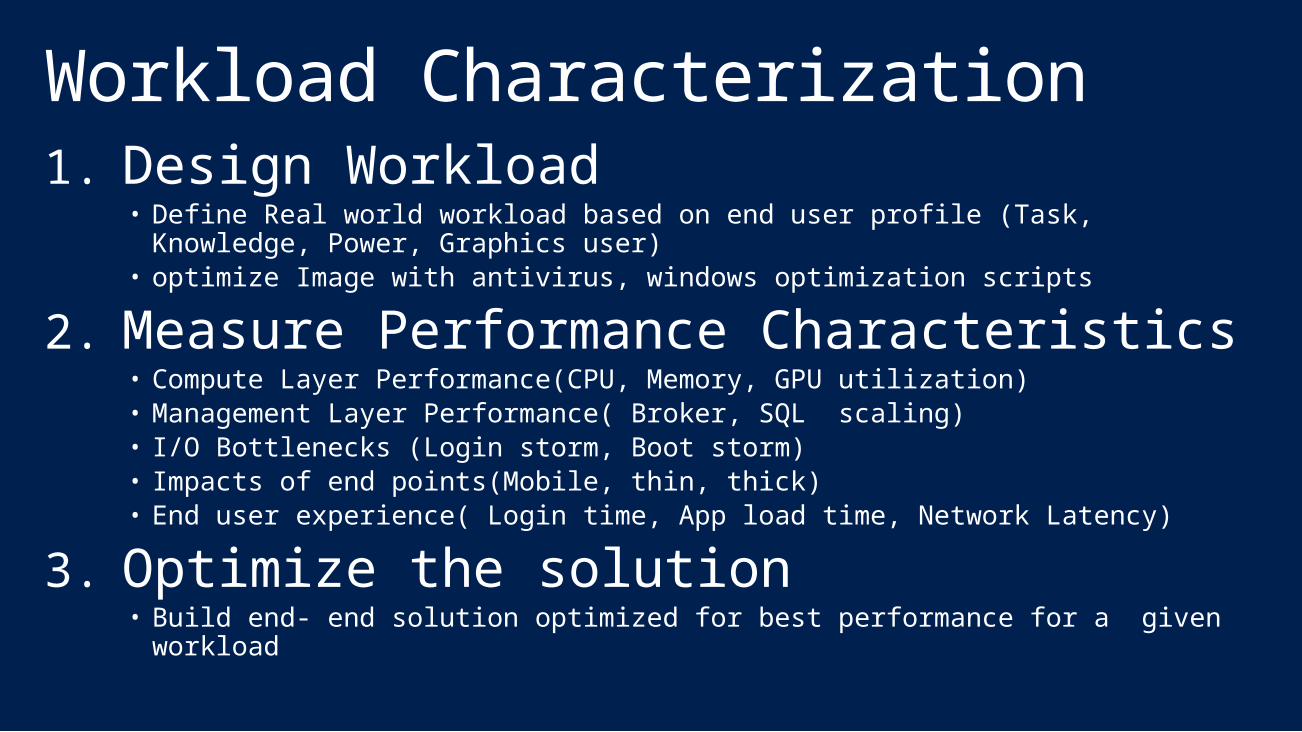
Workload Characterization1. Design Workload
• Define Real world workload based on end user profile (Task, Knowledge, Power, Graphics user)
• optimize Image with antivirus, windows optimization scripts
2. Measure Performance Characteristics• Compute Layer Performance(CPU, Memory, GPU utilization)• Management Layer Performance( Broker, SQL scaling)• I/O Bottlenecks (Login storm, Boot storm)• Impacts of end points(Mobile, thin, thick)• End user experience( Login time, App load time, Network Latency)
3. Optimize the solution • Build end- end solution optimized for best performance for a given workload
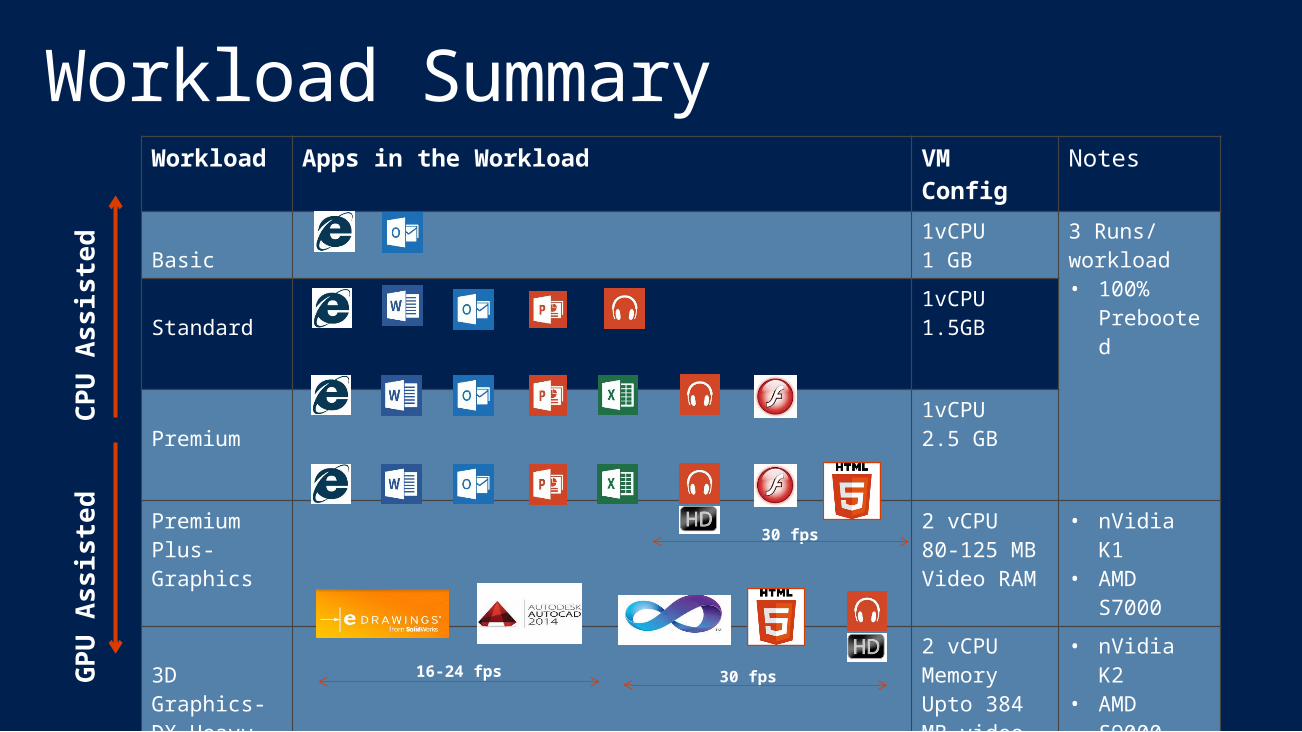
Workload SummaryWorkload Apps in the Workload VM
ConfigNotes
Basic1vCPU1 GB
3 Runs/ workload• 100%
PrebootedStandard1vCPU1.5GB
Premium1vCPU2.5 GB
Premium Plus-Graphics
2 vCPU80-125 MB Video RAM
• nVidia K1• AMD
S7000
3D Graphics-DX Heavy
2 vCPUMemoryUpto 384 MB video RAM
• nVidia K2• AMD
S9000
30 fps
30 fps16-24 fpsGP
U A
ssis
ted
CP
U A
ssis
ted
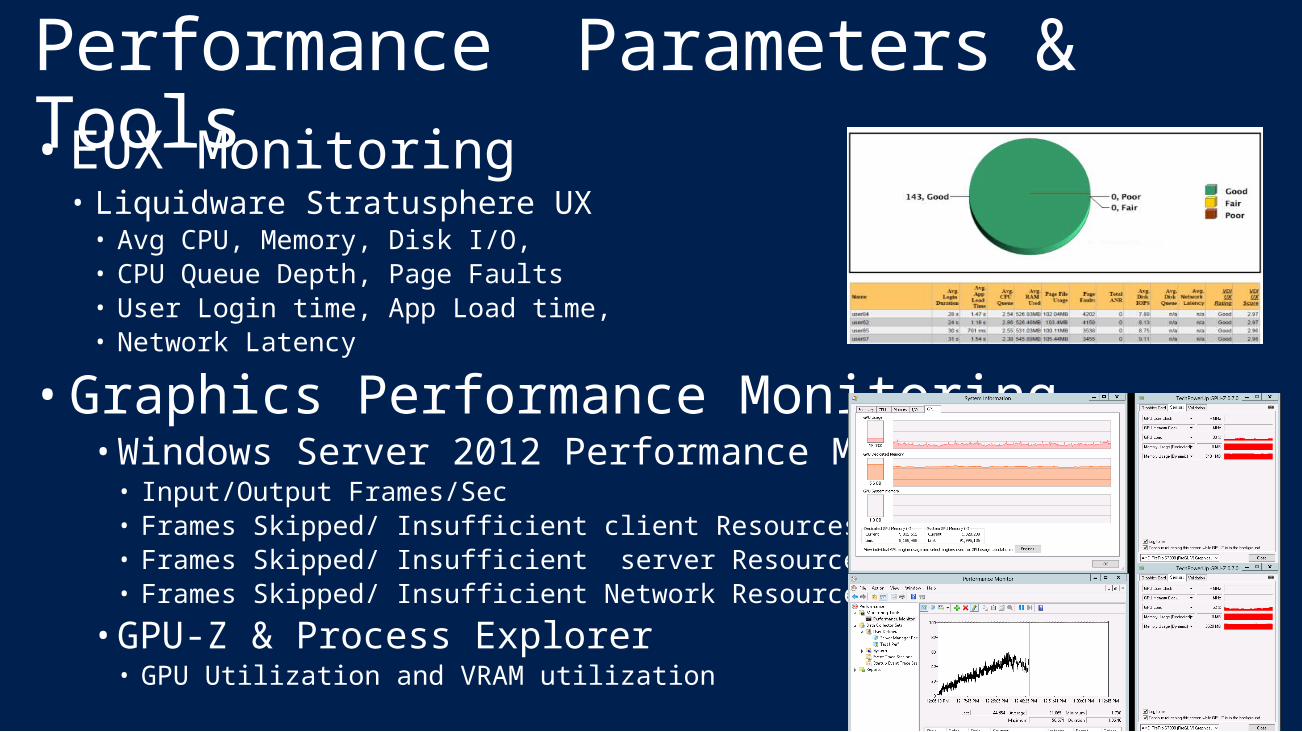
Performance Parameters & Tools• EUX Monitoring• Liquidware Stratusphere UX• Avg CPU, Memory, Disk I/O,• CPU Queue Depth, Page Faults• User Login time, App Load time,• Network Latency
• Graphics Performance Monitoring• Windows Server 2012 Performance Monitor • Input/Output Frames/Sec• Frames Skipped/ Insufficient client Resources• Frames Skipped/ Insufficient server Resources• Frames Skipped/ Insufficient Network Resources
• GPU-Z & Process Explorer• GPU Utilization and VRAM utilization
Performance Results
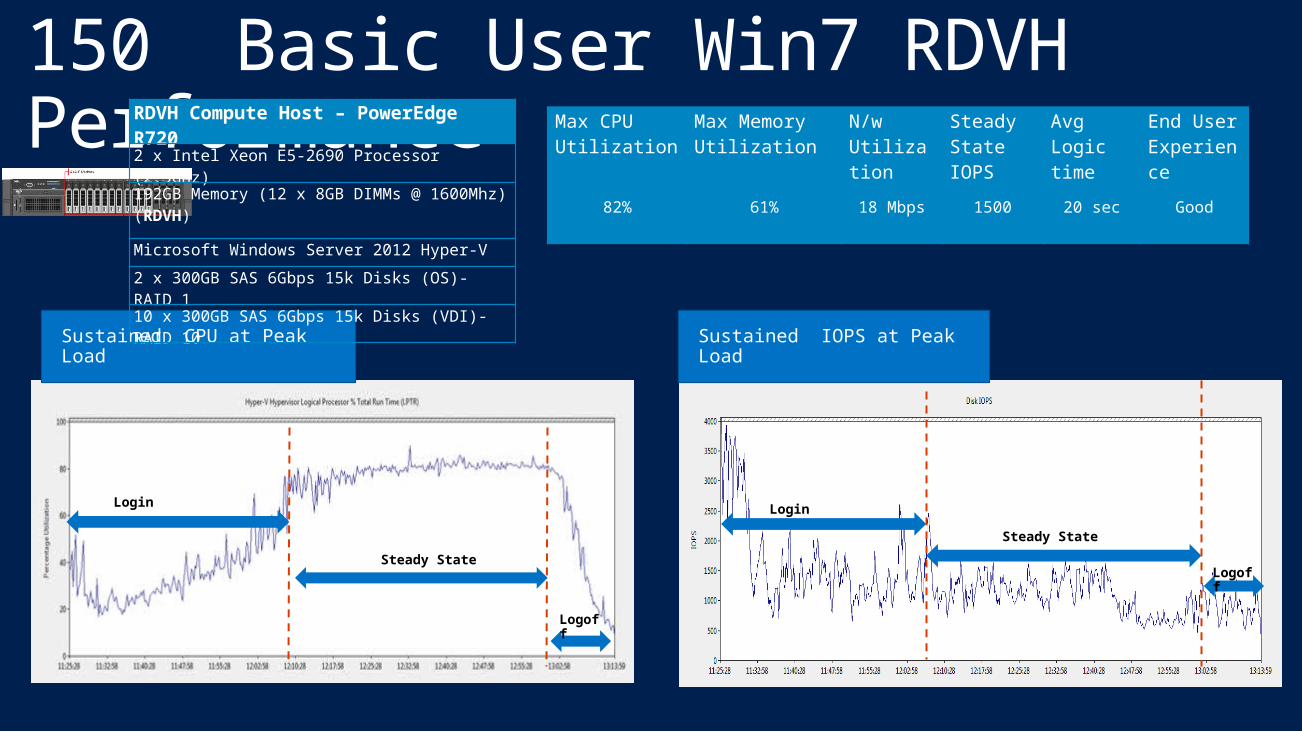
150 Basic User Win7 RDVH Performance
Sustained CPU at Peak Load Sustained IOPS at Peak Load
RDVH Compute Host – PowerEdge R7202 x Intel Xeon E5-2690 Processor (2.9Ghz)
192GB Memory (12 x 8GB DIMMs @ 1600Mhz) (RDVH)
Microsoft Windows Server 2012 Hyper-V
2 x 300GB SAS 6Gbps 15k Disks (OS)- RAID 1
10 x 300GB SAS 6Gbps 15k Disks (VDI)- RAID 10
Login
Steady State
Logoff
Logoff
Max CPU Utilization
Max Memory Utilization
N/w Utilization
Steady State IOPS
Avg Logic time
End User Experience
82% 61% 18 Mbps 1500 20 sec Good
Login
Steady State Logoff
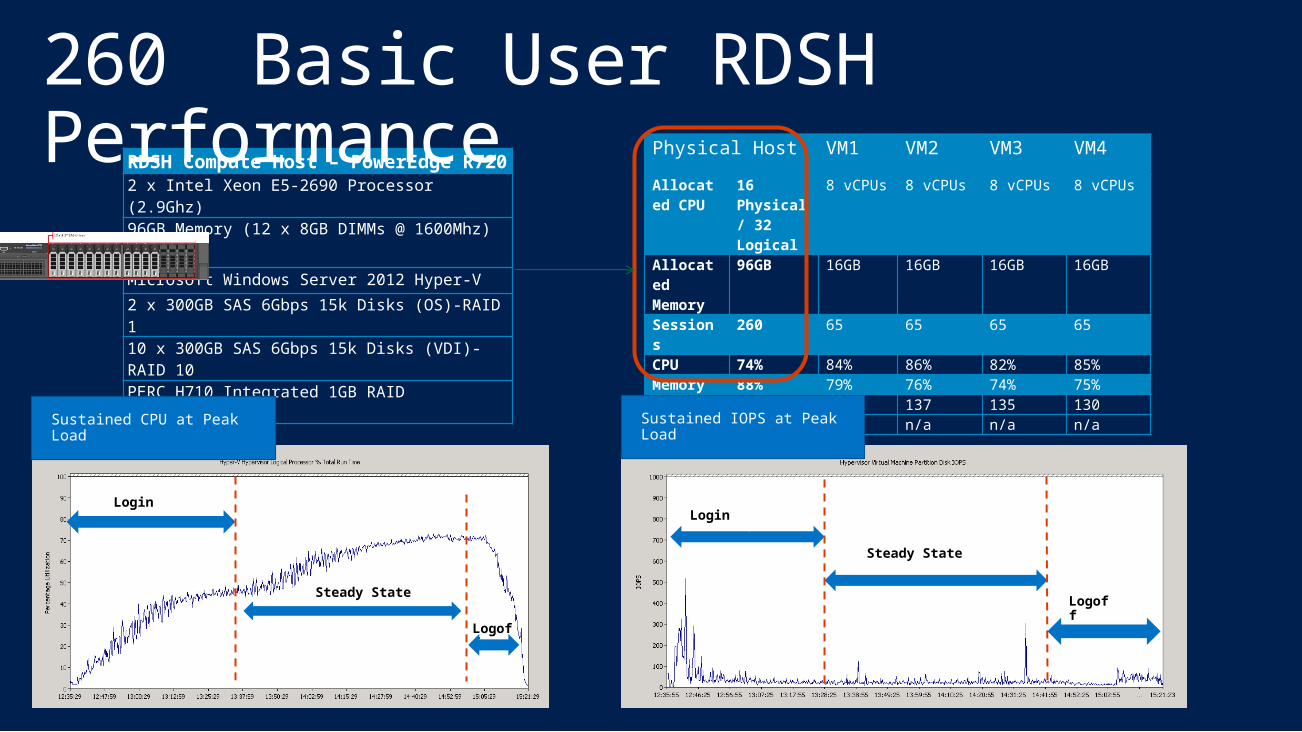
RDSH Compute Host – PowerEdge R7202 x Intel Xeon E5-2690 Processor (2.9Ghz)
96GB Memory (12 x 8GB DIMMs @ 1600Mhz) (RDSH)
Microsoft Windows Server 2012 Hyper-V
2 x 300GB SAS 6Gbps 15k Disks (OS)-RAID 1
10 x 300GB SAS 6Gbps 15k Disks (VDI)-RAID 10PERC H710 Integrated 1GB RAID Controller
Physical Host VM1 VM2 VM3 VM4
Allocated CPU
16 Physical/ 32 Logical
8 vCPUs 8 vCPUs 8 vCPUs 8 vCPUs
Allocated Memory
96GB 16GB 16GB 16GB 16GB
Sessions
260 65 65 65 65
CPU 74% 84% 86% 82% 85%Memory 88% 79% 76% 74% 75%IOPS 542 140 137 135 130Network 26 Mbps n/a n/a n/a n/a
Sustained CPU at Peak Load
Sustained IOPS at Peak Load
260 Basic User RDSH Performance
`
Login
Steady State
Logoff
Login
Steady State
Logoff
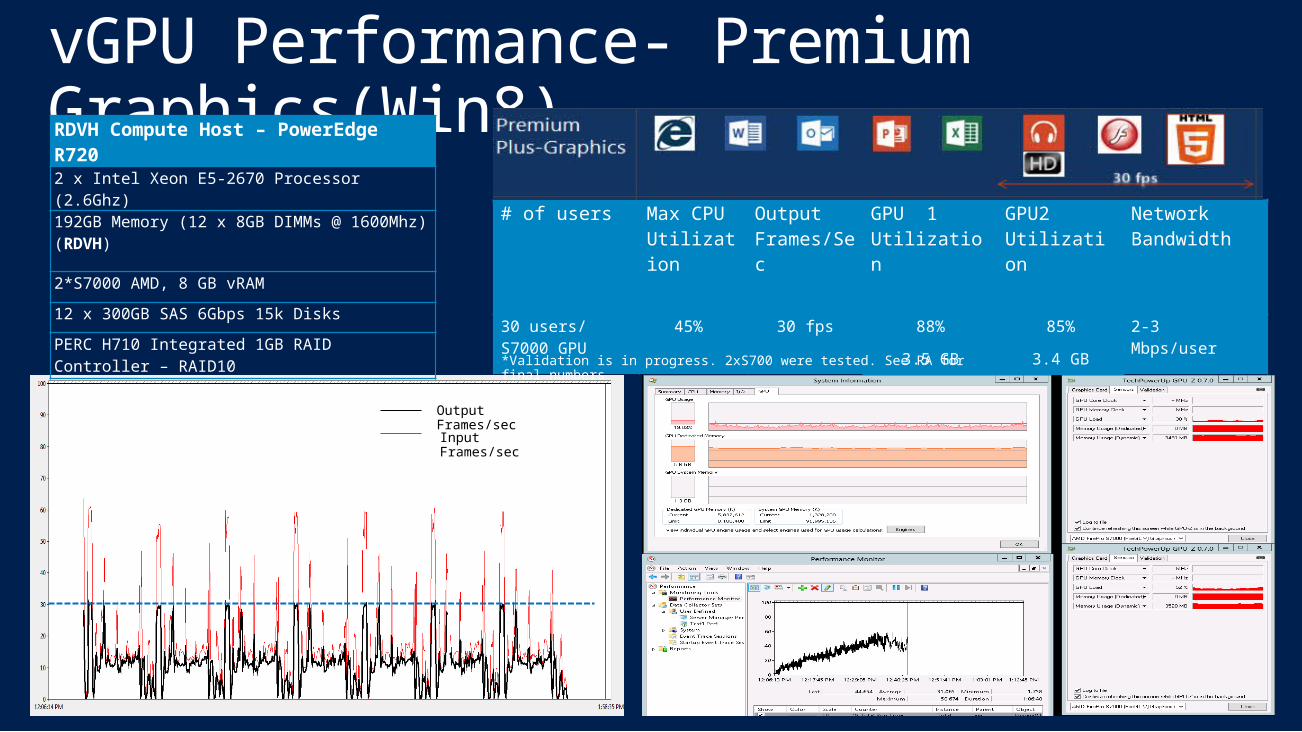
vGPU Performance- Premium Graphics(Win8)RDVH Compute Host – PowerEdge R7202 x Intel Xeon E5-2670 Processor (2.6Ghz)
192GB Memory (12 x 8GB DIMMs @ 1600Mhz) (RDVH)
2*S7000 AMD, 8 GB vRAM
12 x 300GB SAS 6Gbps 15k Disks
PERC H710 Integrated 1GB RAID Controller – RAID10
# of users Max CPU Utilization
Output Frames/Sec
GPU 1 Utilization
GPU2 Utilization
Network Bandwidth
30 users/ S7000 GPU
45% 30 fps 88% 85% 2-3 Mbps/user
3.5 GB 3.4 GB
Output Frames/sec
Input Frames/sec
*Validation is in progress. 2xS700 were tested. See RA for final numbers
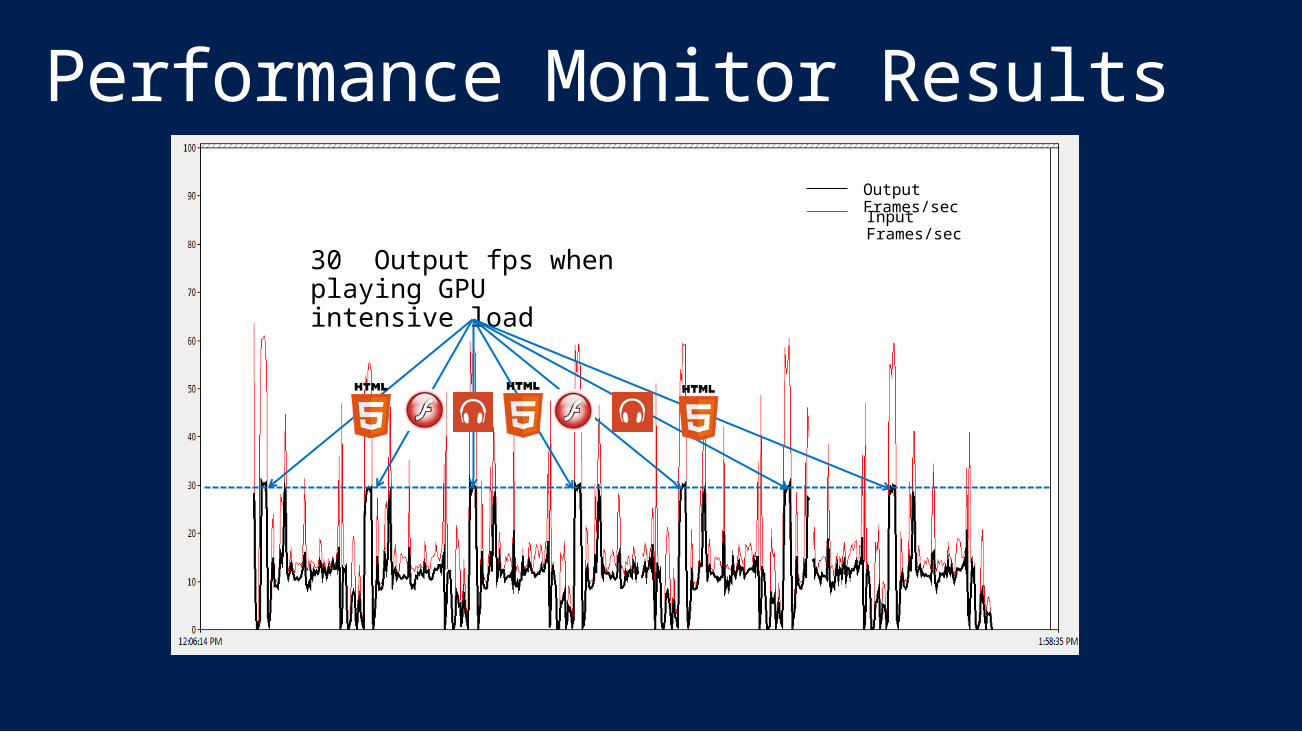
Performance Monitor ResultsOutput Frames/secInput Frames/sec
30 Output fps when playing GPU intensive load
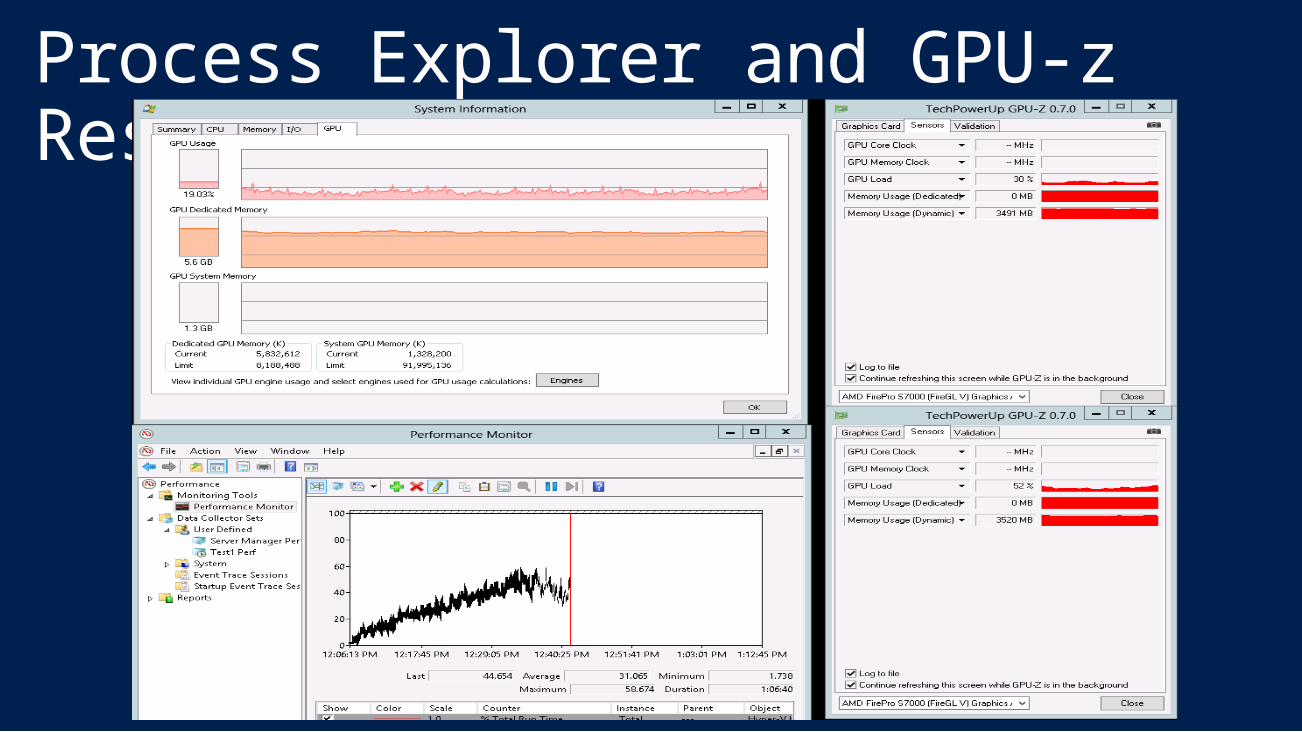
Process Explorer and GPU-z Results
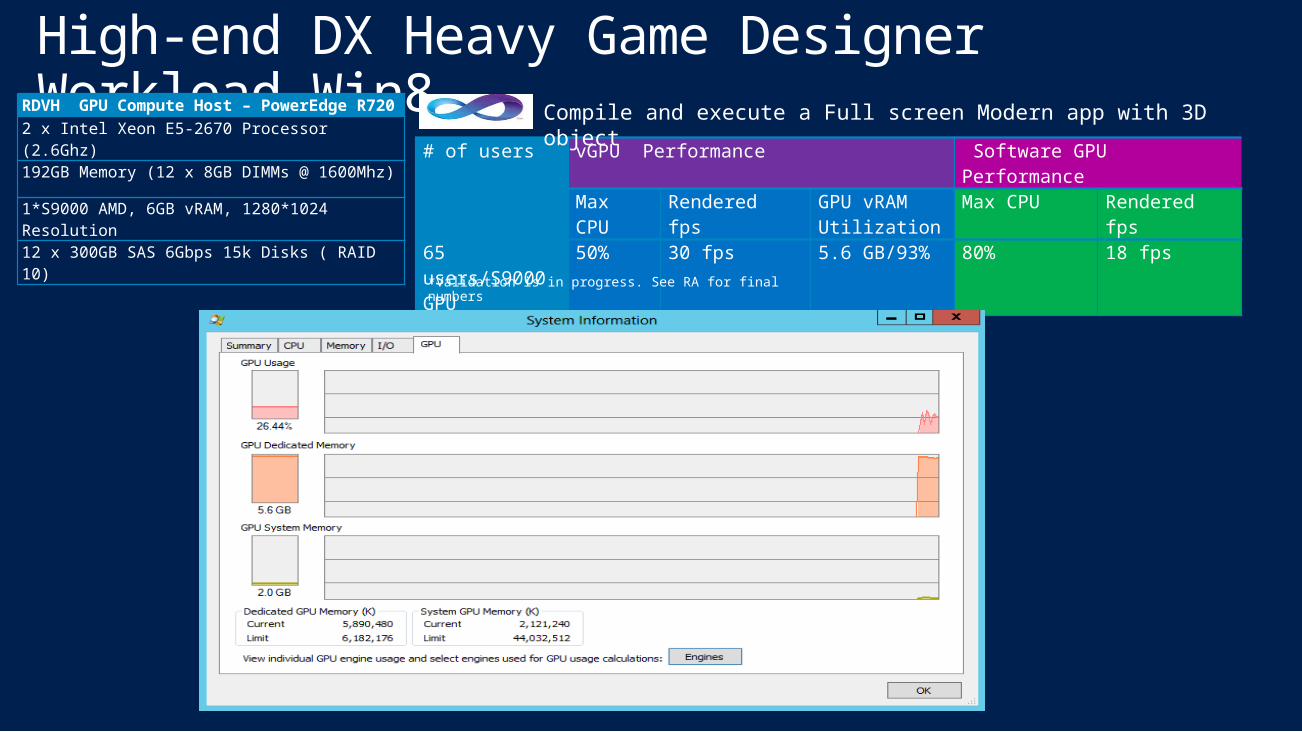
High-end DX Heavy Game Designer Workload-Win8RDVH GPU Compute Host – PowerEdge
R7202 x Intel Xeon E5-2670 Processor (2.6Ghz)
192GB Memory (12 x 8GB DIMMs @ 1600Mhz)
1*S9000 AMD, 6GB vRAM, 1280*1024 Resolution12 x 300GB SAS 6Gbps 15k Disks ( RAID 10)
# of users vGPU Performance Software GPU PerformanceMax CPU
Rendered fps GPU vRAM Utilization
Max CPU Rendered fps
65 users/S9000 GPU
50% 30 fps 5.6 GB/93% 80% 18 fps
Compile and execute a Full screen Modern app with 3D object
*Validation is in progress. See RA for final numbers
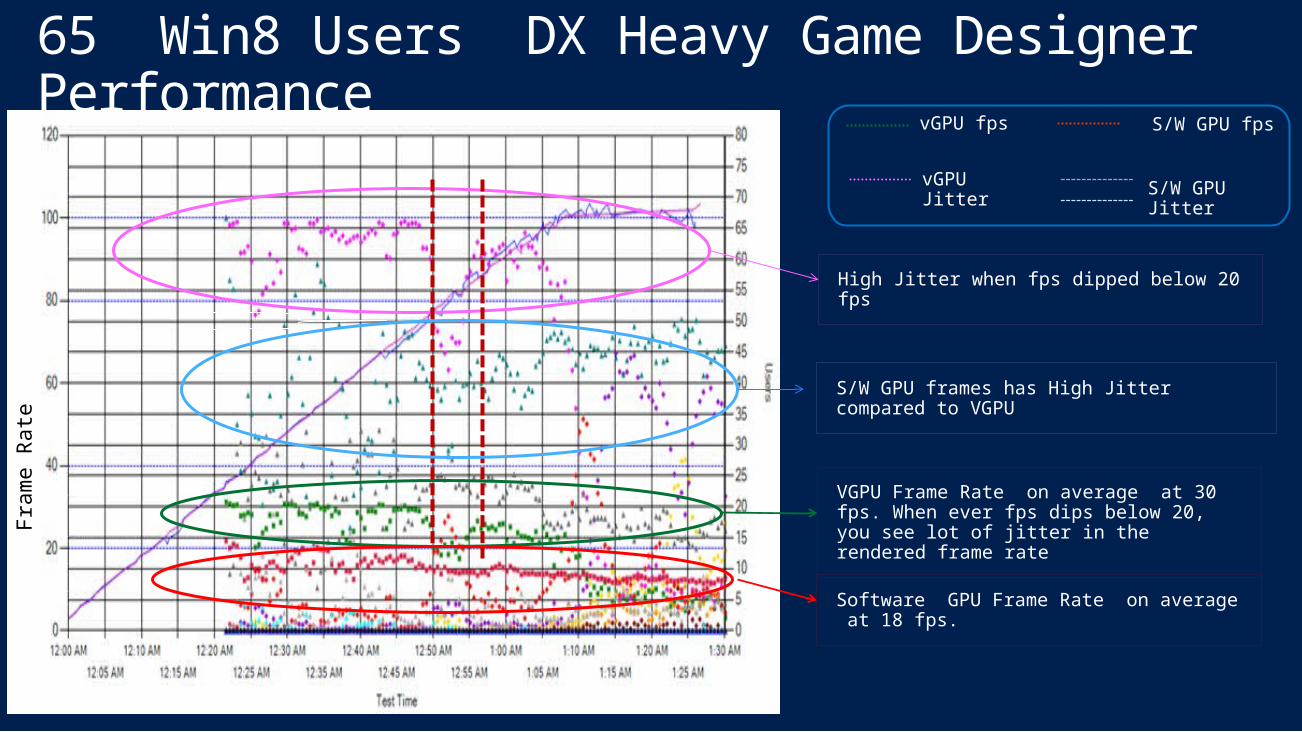
65 Win8 Users DX Heavy Game Designer Performance
vGPU fps S/W GPU fps
vGPU Jitter
S/W GPU Jitter
VGPU Frame Rate on average at 30 fps. When ever fps dips below 20, you see lot of jitter in the rendered frame rateFr
am
e R
ate
High Jitter when fps dipped below 20 fps
Software GPU Frame Rate on average at 18 fps.
S/W GPU frames has High Jitter compared to VGPU
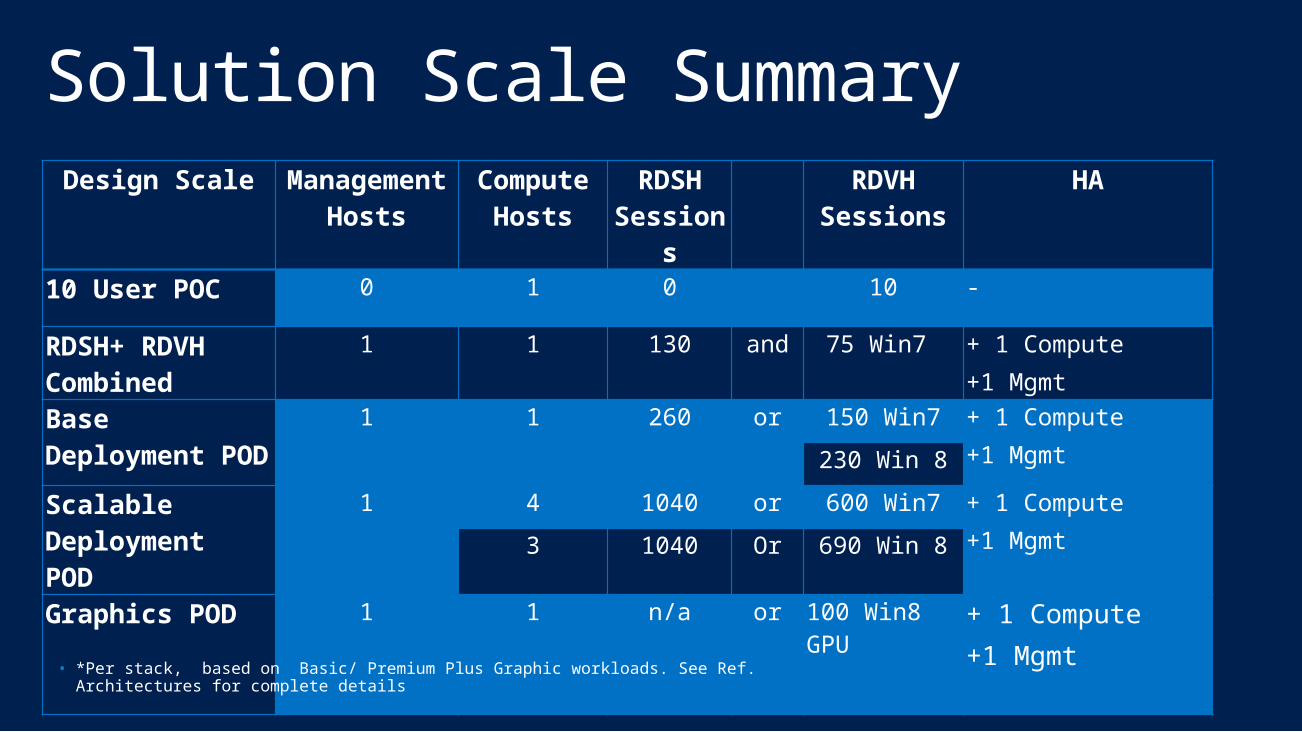
Solution Scale SummaryDesign Scale Manageme
nt HostsCompute
HostsRDSH
Sessions
RDVH Sessions
HA
10 User POC 0 1 0 10 -
RDSH+ RDVH Combined
1 1 130 and 75 Win7 + 1 Compute+1 Mgmt
Base Deployment POD
1 1 260 or 150 Win7 + 1 Compute+1 Mgmt230 Win 8
Scalable Deployment POD
1 4 1040 or 600 Win7 + 1 Compute+1 Mgmt3 1040 Or 690 Win 8
Graphics POD 1 1 n/a or 100 Win8 GPU
+ 1 Compute+1 Mgmt
• *Per stack, based on Basic/ Premium Plus Graphic workloads. See Ref. Architectures for complete details
Test Test Test EUX!
Key Take-Aways• Optimize for best performance and best EUX.• In your VDI planning, do account for end point
and network performance in-addition to Datacenter performance
• Software GPU is good enough for 2D Model and entry level 3D Rendering . As you move up to high end graphic apps, considering adding GPU to your deployment
• Always test your high end Graphics Apps for App compatibility before large scale production roll-out
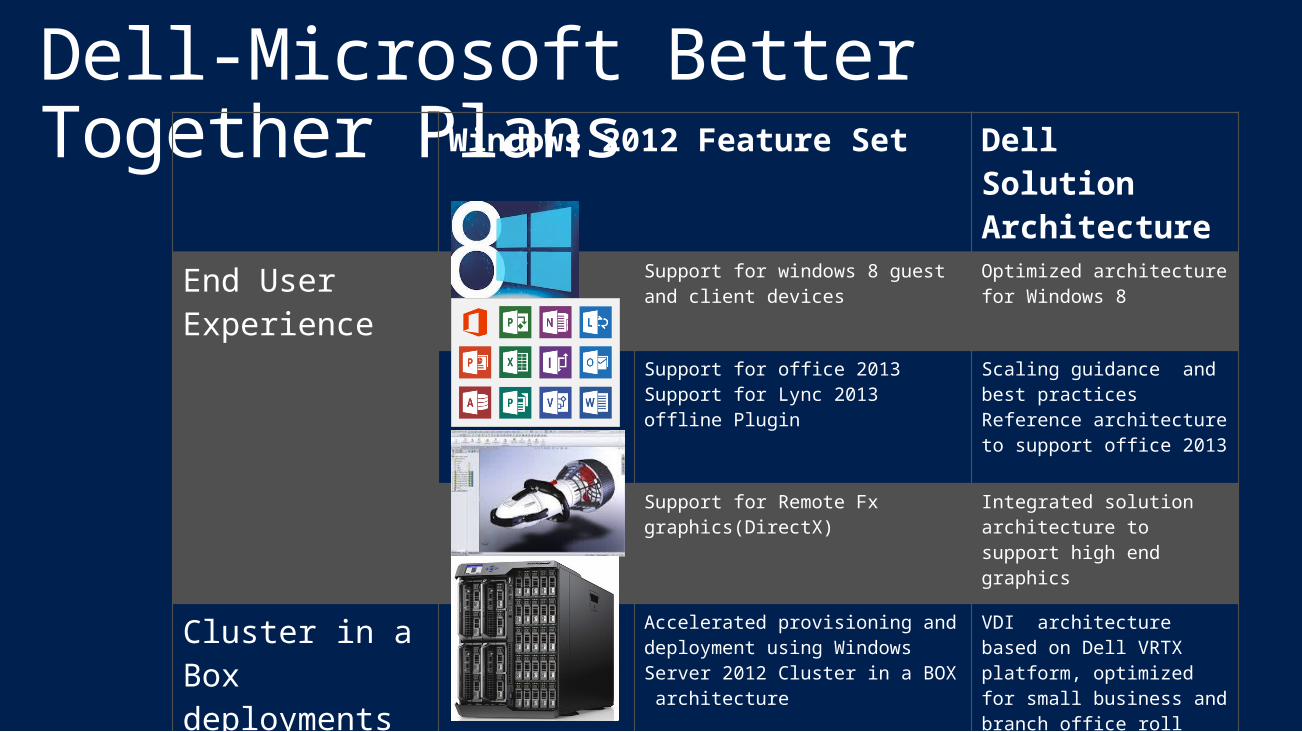
Dell-Microsoft Better Together Plans Windows 2012 Feature Set Dell Solution
Architecture
End User Experience
Support for windows 8 guest and client devices
Optimized architecture for Windows 8
Support for office 2013Support for Lync 2013 offline Plugin
Scaling guidance and best practices Reference architecture to support office 2013
Support for Remote Fx graphics(DirectX)
Integrated solution architecture to support high end graphics
Cluster in a Box deployments
Accelerated provisioning and deployment using Windows Server 2012 Cluster in a BOX architecture
VDI architecture based on Dell VRTX platform, optimized for small business and branch office roll outs
RDS Management ,RemoteFX & Lync 2013 DemoSenthil BaladhandayuthamJohn Russell
Related Sessions to View• What's New in Windows Server 2012 Virtual
Desktop Infrastructure and Remote Desktop Services (WCA-B350 )
• Designing a VDI Architecture for Scale and Performance on Server 2012 (WCA-B314)
• Tuning Images for VDI Usage(WCA-B341 )
• Reduce Storage Costs with Data Deduplication(MDC-B342 )
Resources• Dell Microsoft VDI on Windows Server 2012 http://
www.dell.com/Learn/us/en/555/flexible-computing/dvs-enterprise-windows-server-2012?c=us&l=en&s=biz
• Dell Microsoft 2000 seat VDI deployment Benchmark
http://blogs.msdn.com/b/rds/rss.aspx
Windows Track ResourcesWindows Enterprise: windows.com/enterprise
Windows Springboard: windows.com/ITpro
Microsoft Desktop Optimization Package (MDOP): microsoft.com/mdop
Desktop Virtualization (DV): microsoft.com/dv
Windows To Go: microsoft.com/windows/wtg
Outlook.com: tryoutlook.com

System Center 2012 Configuration Managerhttp://technet.microsoft.com/en-us/evalcenter/hh667640.aspx?wt.mc_id=TEC_105_1_33
Windows Intunehttp://www.microsoft.com/en-us/windows/windowsintune/try-and-buy
Windows Server 2012 http://www.microsoft.com/en-us/server-cloud/windows-server
Windows Server 2012 VDI and Remote Desktop Serviceshttp://technet.microsoft.com/en-us/evalcenter/hh670538.aspx?ocid=&wt.mc_id=TEC_108_1_33
http://www.microsoft.com/en-us/server-cloud/windows-server/virtual-desktop-infrastructure.aspx
More Resources:microsoft.com/workstylemicrosoft.com/server-cloud/user-device-management
For More Information
msdn
Resources for Developers
http://microsoft.com/msdn
Learning
Microsoft Certification & Training Resources
www.microsoft.com/learning
TechNet
Resources
Sessions on Demand
http://channel9.msdn.com/Events/TechEd
Resources for IT Professionals
http://microsoft.com/technet
Complete an evaluation on CommNet and enter to win!
Evaluate this session
Scan this QR code to evaluate this session and be automatically entered in a drawing to win a prize
© 2013 Microsoft Corporation. All rights reserved. Microsoft, Windows and other product names are or may be registered trademarks and/or trademarks in the U.S. and/or other countries.The information herein is for informational purposes only and represents the current view of Microsoft Corporation as of the date of this presentation. Because Microsoft must respond to changing market conditions, it should not be interpreted to be a commitment on the part of Microsoft, and Microsoft cannot guarantee the accuracy of any information provided after the date of this presentation. MICROSOFT MAKES NO WARRANTIES, EXPRESS, IMPLIED OR STATUTORY, AS TO THE INFORMATION IN THIS PRESENTATION.