Embed Size (px)
Citation preview
Dell Compellent Storage Center SAN & VMware View 1,000 Desktop Reference Architecture
Dell Compellent Technical Solutions

Dell Compellent Storage Center SAN & VMware View 1,000 Desktop Reference Architecture
Page ii
THIS WHITE PAPER IS FOR INFORMATIONAL PURPOSES ONLY, AND MAY CONTAIN TYPOGRAPHICAL ERRORS AND TECHNICAL INACCURACIES. THE CONTENT IS PROVIDED AS IS, WITHOUT EXPRESS OR IMPLIED WARRANTIES OF ANY KIND.
© 2011 Dell Inc. All rights reserved. Reproduction of this material in any manner whatsoever without the express written permission of Dell Inc. is strictly forbidden. For more information, contact Dell.
Dell, the DELL logo, and the DELL badge and Compellent are trademarks of Dell Inc. vSphere, View, and ESX are trademarks of VMware Inc. Microsoft, Windows, Windows Server, and Active Directory are either trademarks or registered trademarks of Microsoft Corporation in the United States and/or other countries. Other trademarks and trade names may be used in this document to refer to either the entities claiming the marks and names or their products. Dell Inc. disclaims any proprietary interest in trademarks and trade names other than its own.
April 2011
Dell Compellent Storage Center SAN & VMware View 1,000 Desktop Reference Architecture
Page 1
Contents Contents .................................................................................................................. 1
Introduction .............................................................................................................. 3
Executive summary ..................................................................................................... 3
Key findings .............................................................................................................. 4
Tested architecture ..................................................................................................... 5
VMware vSphere 4.1 ................................................................................................. 7
VMware View 4.5 ..................................................................................................... 7
Scripted Load Generation ........................................................................................... 9
Windows 7 ............................................................................................................. 9
Antivirus ............................................................................................................... 9
Testing results .......................................................................................................... 10
Test 1 - 1,000 users replica/OS delta combined ............................................................... 10
Test 1 - Recommended storage configuration .................................................................. 12
Test 2 - 1,000 users on 15K ........................................................................................ 13
Test 2 - Recommended storage configuration .................................................................. 15
Test 3 - 1,000 users on SSD/15K .................................................................................. 15
Test 3 - Recommended storage configuration .................................................................. 18
SSD vs. 15K Replica I/O Offload ..................................................................................... 19
SSD replica performance test ..................................................................................... 19
15K replica performance test ..................................................................................... 20
SSD summary ......................................................................................................... 20
Conclusion ............................................................................................................... 21
Reference Materials ................................................................................................... 21
Dell Compellent Storage Center SAN & VMware View 1,000 Desktop Reference Architecture
Page 2
Figures
Figure 1. Tested Architecture ..................................................................................... 6 Figure 2. View 4.5 Datastore Selection .......................................................................... 7
Figure 3. View 4.5 Linked Clones.................................................................................. 8 Figure 4. View 4.5 Linked Clones.................................................................................. 8 Figure 5. Test1 – Pool Datastore Layout......................................................................... 10
Figure 6. Test 1 - Virtual Machine Disk Layout ................................................................. 11 Figure 7. Test 1 – 1,000 Desktop I/O Ramp ..................................................................... 12 Figure 8. 1,000 Users Replica/OS Combined Pool Datastore Layout ........................................ 13 Figure 9. Test 2 - Virtual Machine Disk Layout ................................................................. 14
Figure 10. Test 2 - 1,000 Desktop I/O Ramp .................................................................. 14 Figure 11. 1,000 Users Replica/OS Combined Pool Datastore Layout ..................................... 16 Figure 12. 1,000 Users Replica/OS combined pool datastore layout ...................................... 16
Figure 13. Test 3 – 1,000 Desktop I/O Ramp .................................................................. 17 Figure 14. Reboot 1,000 Virtual Machines SSD Performance ............................................... 19 Figure 15. Reboot 1,000 Virtual Machines Replica on 92 x 15K ............................................ 20 Figure 16. Reboot 1,000 Virtual Machines OS Volume I/O .................................................. 21
Dell Compellent Storage Center SAN & VMware View 1,000 Desktop Reference Architecture
Page 3
Introduction This document is intended to provide technical personnel (architects, engineers and consultants) with data to assist with planning, design and deployment of a Dell™ Compellent™ Storage Center SAN in a VMware® View environment with 1,000 or more users. This document is based on internal testing and validation performed and findings gathered in Dell Compellent’s virtualization lab.
This document specifically focuses on storage and the impact of a virtual desktop infrastructure (VDI) on the Dell Compellent Storage Center SAN. This document does not contain information on Host, Network or WAN sizing, all of which are also important aspects of VDI architectures.
This document serves as a reference architecture to implement VDI with the Dell Compellent Storage Center SAN. When deploying a VDI solution, the workload results will be different for each organization and each application. It is strongly recommended that organizations run a VDI pilot group to test and determine the appropriate storage sizing for each environment.
Executive summary An efficient storage solution is integral to a successful VDI implementation. With a Fluid Data architecture and integrated software features such as Automated Tiered Storage, Thin Provisioning, Continuous Snapshots and Remote Replication, the Dell Compellent Storage Center SAN proves to be a highly effective storage option for VMware View. Dell Compellent Thin Provisioning software separates storage allocation from utilization. While administrators can create storage volumes of any size for virtualized applications, physical capacity is consumed only when data is written to the disk. With Thin Provisioning, IT groups can avoid having to purchase excess capacity up front. When an application requires more storage, the system provisions more from the pool of unused capacity. For instance, Thin Provisioning can present 10 virtual storage volumes, 1TB each, for use by 10 unique virtual machines (VMs), but only require the physical capacity that is actually written for each VM. In addition, Automated Tiered Storage from Dell Compellent can help organizations optimize the use of storage for a VMware environment. The software, called Data Progression, dynamically classifies and moves block-level data between tiers of storage based on the frequency of data access. It reduces the need for high-performance, high-cost disks by moving infrequently used data to less expensive media while ensuring that frequently accessed blocks remain on the fastest drives. These technologies help to create an efficient storage platform for VMware View.

Dell Compellent Storage Center SAN & VMware View 1,000 Desktop Reference Architecture
Page 4
Key findings Dell Compellent tested a sample 1,000 Desktop VDI deployment designed for high availability and simulated real-world workloads using VMware View 4.5, the Dell Compellent Storage Center SAN, 10GB iSCSI connectivity and a scripted load-generation solution. The scripted solution utilized office applications and wait times to generate the load of a typical knowledge worker. 1,000 Active Desktops generated 15,000+ Total IOPS and 300,000+ Total KBPS. Out of the total IOPS, about 60% were read and 40% were write. Read IOPS outweighed write IOPS due to the ramp-up of virtual desktops logging in over the 90-minute time period, a read-intensive operation. Once all users are logged on and using their desktops, read/write I/O ratio usually changes to anywhere from 50/50 at best to 30/70 or below, depending on the application and workload characteristics of the users.
• Client Workloads and Boot/Logon Storms have a large impact on scaling VDI storage
• Dell Compellent solid state disks (SSDs) can offload Read I/O in a Linked Clone environment and largely offset Boot/Login storms
• Two active Dell Compellent SSDs can perform the read I/O performance of 92 active 15K drives.

Dell Compellent Storage Center SAN & VMware View 1,000 Desktop Reference Architecture
Page 5
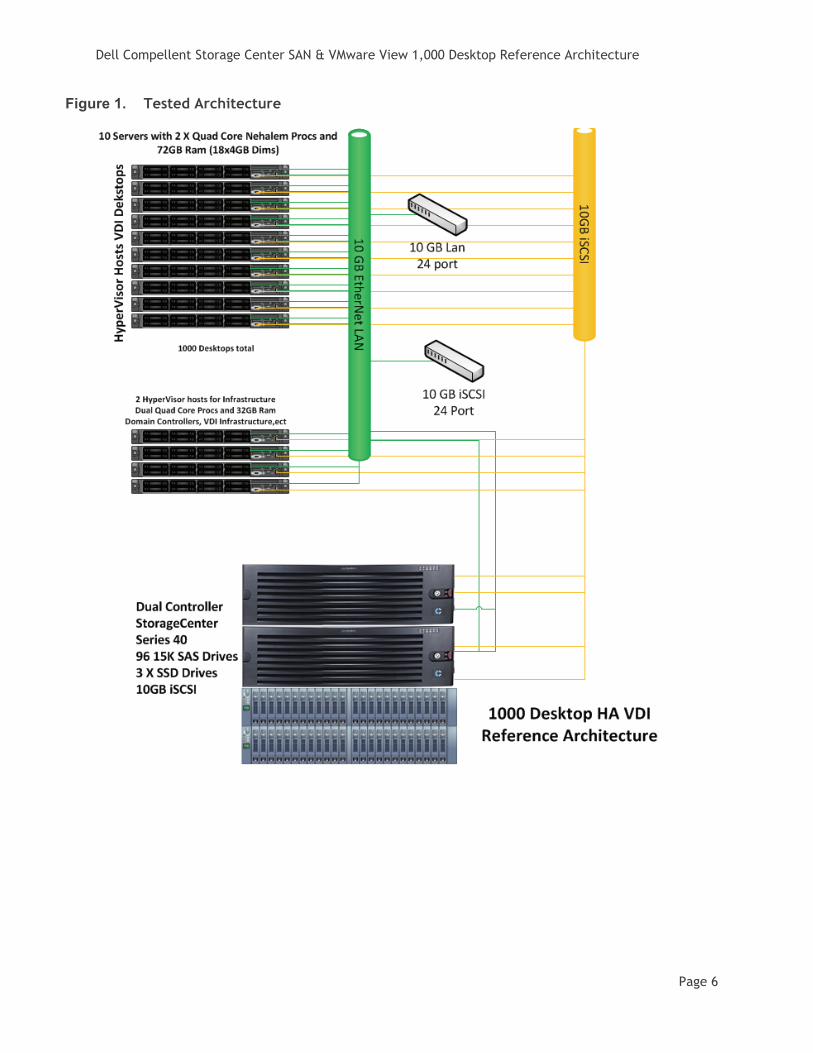
Tested architecture The tested environment was comprised of 10 VMware ESX Servers running ESX 4.1 for Virtual Desktops, 5 ESX Servers per ESX Cluster, for a total of 2 Clusters. Each VMware Cluster supported 500 desktops.
The VDI infrastructure was comprised of the following components:
• Dell Compellent Storage Center SAN Series 40 Controller
o 96 x 2.5” 146Gb SAS 15K drives (4 SAS enclosures)
o 3 x 3.5” 146GB SSD drives (1 Fibre Channel enclosure)
o Firmware Version 5.4.1
• 10Gb iSCSI Switches
• VMware vSphere 4.1
• VMware View 4.5
o VMware View Composer
• 10 x ESX 4.1 Servers for Virtual Desktops
o Dual Quad Core Intel Xeon X5550 2.67GHz processor
o 72GB RAM
o Dual Port Intel 10gbE Nics, Model X520-DA2, Port 1 Network, Port 2 iSCSI
o Software iSCSI initiator
• 2 x ESX 4.1 Servers for View Infrastructure
o 1 Domain Controller, 1 Virtual Center, 1 Connection Server, 1 SQL Server
o Dual Quad Core Intel Xeon X5506 2.13GHz
o 72GB RAM
o Dual Port Intel 10gbE Nics, Model X520-DA2, Port 1 Network, Port 2 iSCSI
Dell Compellent Storage Center SAN & VMware View 1,000 Desktop Reference Architecture
Page 6
Figure 1. Tested Architecture

Dell Compellent Storage Center SAN & VMware View 1,000 Desktop Reference Architecture
Page 7
VMware vSphere 4.1 VMware vSphere 4.1 was utilized for the backend infrastructure for VMware View. VMware View is only supported with VMware vSphere environments.
VMware View 4.5 VMware View 4.5 offers a tiered storage option, allowing administrators to select the storage placement of Replica disks, OS disks (Linked Clones) and Persistent disks (User Data). As shown in Figure 2 (below), the View Datastore Selection Pool is a depicted separating Replica, OS and Persistent disk onto separate VMFS datastores. There can be multiple OS disks and Persistent disks; however, there can be only one Replica disk per View Pool. View 4.5 Composer can create and provision up to 512 desktops per pool.
Figure 2. View 4.5 Datastore Selection
Figure 3 (below) depicts the Linked Clone Layout using View Composer 2.5. This reference architecture uses the tiered storage feature of Composer to builded linked clones and their replica images on separate datastores. These separate datastores can be deployed on different tiers of disk, such as in Test Case 3 below, where SSD is utilized for the Replica datastores and 15K disk is utilized for the Linked Clones.

Dell Compellent Storage Center SAN & VMware View 1,000 Desktop Reference Architecture
Page 8
Figure 3. View 4.5 Linked Clones
Figure 4 (below) depicts a logical representation of the Virtual Desktop reading the common shared Operating System data from the replica disk and storing unique data in the linked clone disk.
Figure 4. View 4.5 Linked Clones
Dell Compellent Storage Center SAN & VMware View 1,000 Desktop Reference Architecture
Page 9
Scripted Load Generation To accurately represent a real-world user workflow, the same scripted test solution was utilized throughout the testing process. This solution uses Microsoft Outlook to send and receive emails, Internet Explorer to browse a few websites, Microsoft Word to create randomized documents, Microsoft Excel, 7-Zip to compress/extract documents, Bull-Zip PDF Writer to print documents to PDF and play a Flash movie trailer.
Windows 7 The tested desktop platform utilized was 32-bit Windows 7 Professional. The Windows desktop was optimized using optimization recommended by Project VRC, which greatly decreased the memory usage and storage I/O of Windows 7 by disabling features of Windows 7 such as Prefetch, Disk Defragmentation, Areo Effects and more. The VRC optimization is documented in the Project Virtual Reality Check: Phase III document at http://www.projectvrc.nl/.
Each virtual machine is configured with one vCPU and 1GB of memory.
Note: In a production deployment of Windows 7 virtual desktop, it may be necessary to provide more than 1GB of RAM, depending on the applications utilized and optimization performed on the desktops.
The Windows 7 page file was set to utilize 1.5X memory (2560MB), the minimum recommended by Microsoft. Office 2007, Adobe Reader 9.4, Adobe Flash Player, Adobe Shockwave Player, Bull-Zip PDF Printer 6, 7-Zip, VMware Tools and the VMware View agent were the software components installed into the desktop templates.
Antivirus No antivirus product was utilized within the VMs. Introducing traditional antivirus may increase the I/O load on the VMs dramatically, depending on whether a native antivirus agent is installed for each VM or if VMware vShield™ Endpoint is used to offload antivirus scanning from the VMs.
Dell Compellent Storage Center SAN & VMware View 1,000 Desktop Reference Architecture
Page 10
Testing results The following details the tested configurations and results of the three different View Storage configurations on the Dell Compellent Storage Center SAN. All tests were conducted using the same Windows 7 virtual desktop image, VMware infrastructure and load test configuration. The only difference between tests was the Storage Configuration and View Datastores use selection. All the tests utilized View Composer Linked Clones for deployment.
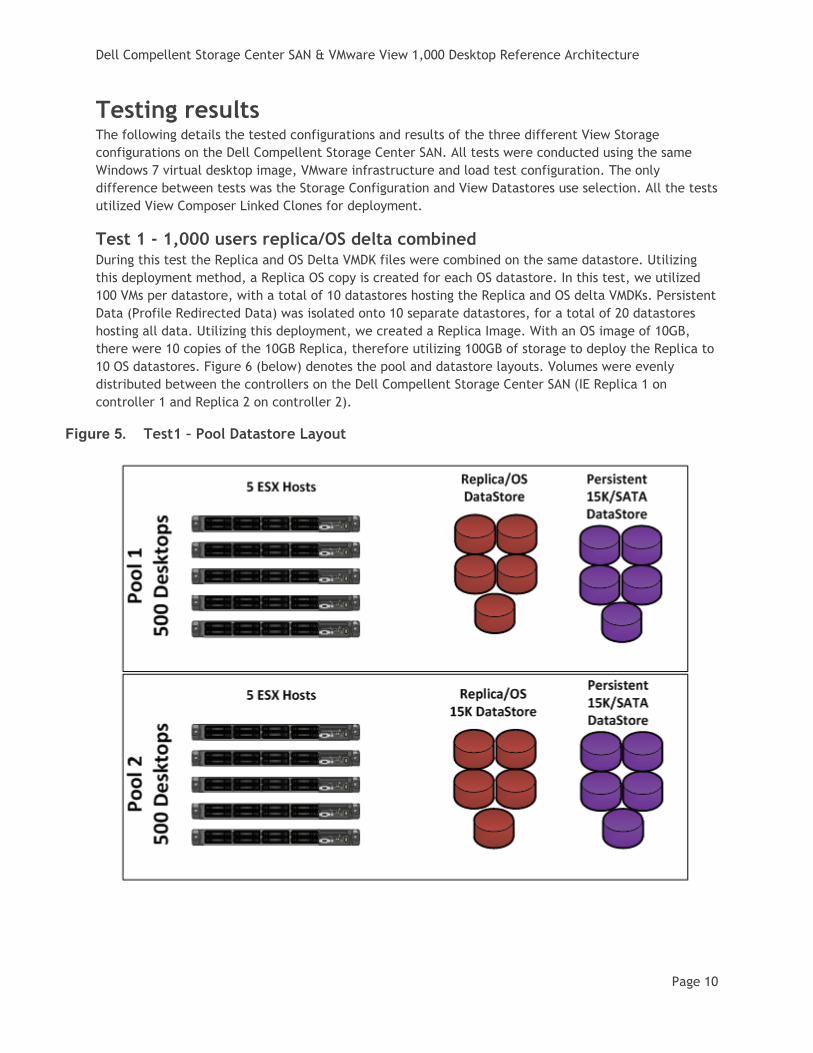
Test 1 - 1,000 users replica/OS delta combined During this test the Replica and OS Delta VMDK files were combined on the same datastore. Utilizing this deployment method, a Replica OS copy is created for each OS datastore. In this test, we utilized 100 VMs per datastore, with a total of 10 datastores hosting the Replica and OS delta VMDKs. Persistent Data (Profile Redirected Data) was isolated onto 10 separate datastores, for a total of 20 datastores hosting all data. Utilizing this deployment, we created a Replica Image. With an OS image of 10GB, there were 10 copies of the 10GB Replica, therefore utilizing 100GB of storage to deploy the Replica to 10 OS datastores. Figure 6 (below) denotes the pool and datastore layouts. Volumes were evenly distributed between the controllers on the Dell Compellent Storage Center SAN (IE Replica 1 on controller 1 and Replica 2 on controller 2).
Figure 5. Test1 – Pool Datastore Layout
Dell Compellent Storage Center SAN & VMware View 1,000 Desktop Reference Architecture
Page 11
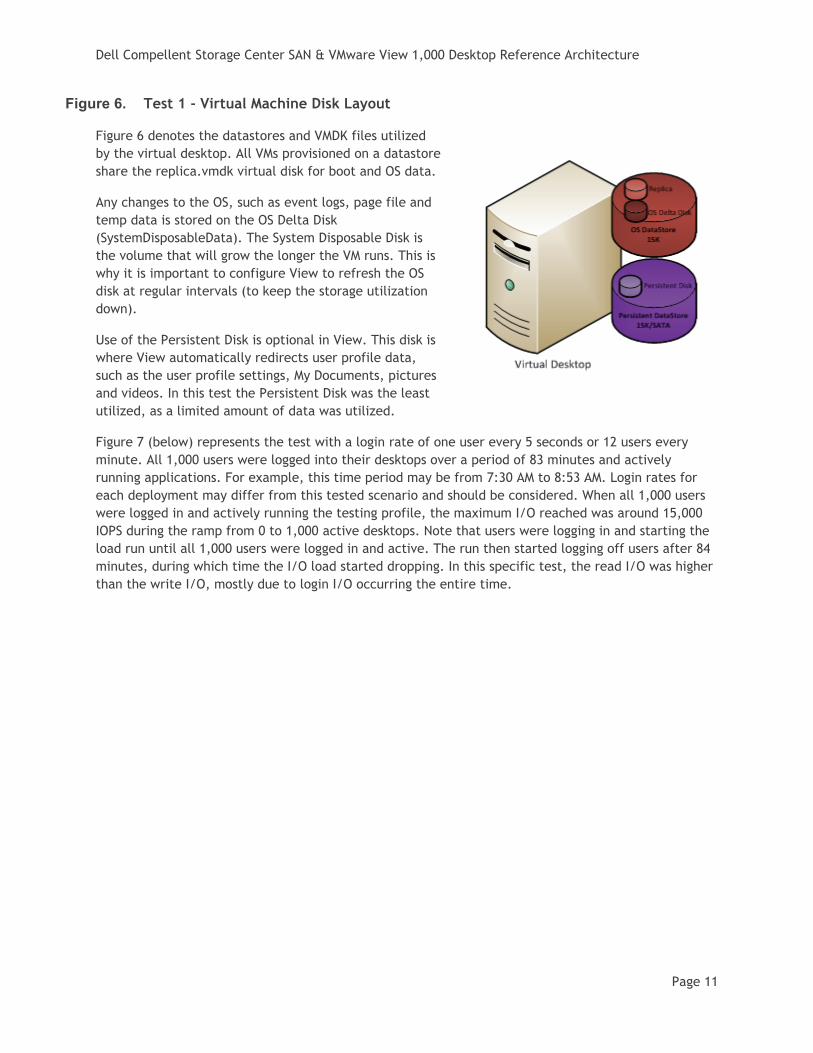
Figure 6. Test 1 - Virtual Machine Disk Layout
Figure 6 denotes the datastores and VMDK files utilized by the virtual desktop. All VMs provisioned on a datastore share the replica.vmdk virtual disk for boot and OS data.
Any changes to the OS, such as event logs, page file and temp data is stored on the OS Delta Disk (SystemDisposableData). The System Disposable Disk is the volume that will grow the longer the VM runs. This is why it is important to configure View to refresh the OS disk at regular intervals (to keep the storage utilization down).
Use of the Persistent Disk is optional in View. This disk is where View automatically redirects user profile data, such as the user profile settings, My Documents, pictures and videos. In this test the Persistent Disk was the least utilized, as a limited amount of data was utilized.
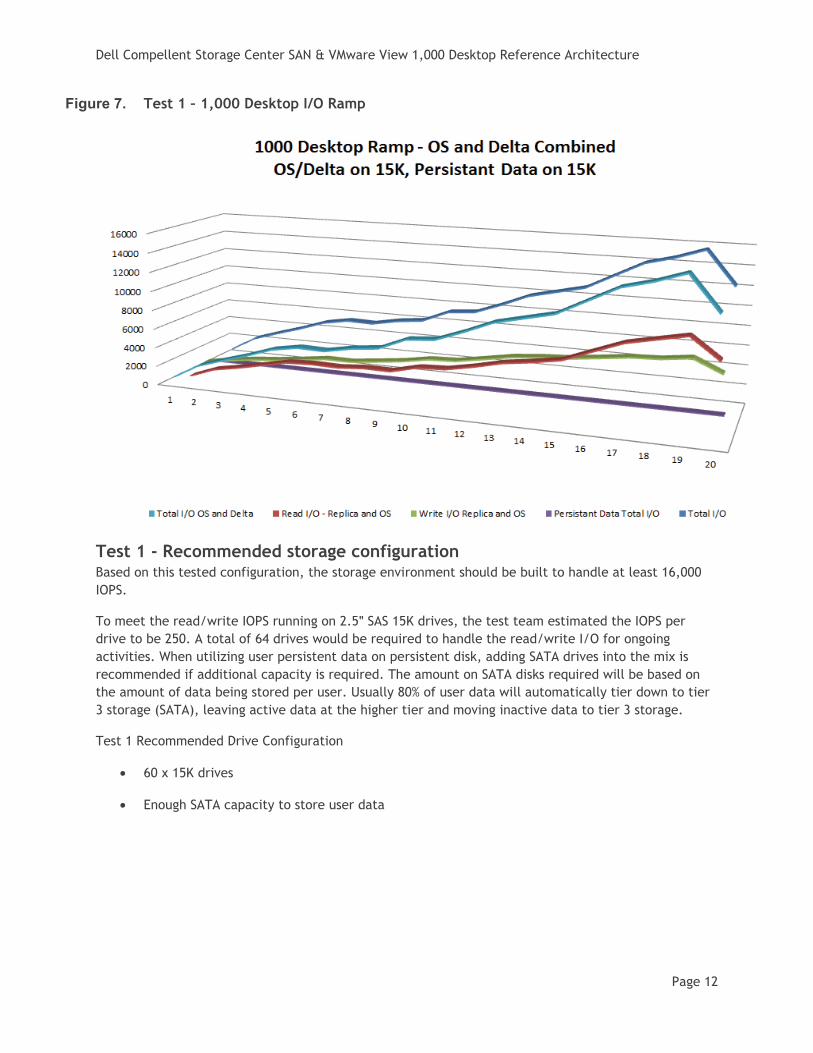
Figure 7 (below) represents the test with a login rate of one user every 5 seconds or 12 users every minute. All 1,000 users were logged into their desktops over a period of 83 minutes and actively running applications. For example, this time period may be from 7:30 AM to 8:53 AM. Login rates for each deployment may differ from this tested scenario and should be considered. When all 1,000 users were logged in and actively running the testing profile, the maximum I/O reached was around 15,000 IOPS during the ramp from 0 to 1,000 active desktops. Note that users were logging in and starting the load run until all 1,000 users were logged in and active. The run then started logging off users after 84 minutes, during which time the I/O load started dropping. In this specific test, the read I/O was higher than the write I/O, mostly due to login I/O occurring the entire time.
Dell Compellent Storage Center SAN & VMware View 1,000 Desktop Reference Architecture
Page 12
Figure 7. Test 1 – 1,000 Desktop I/O Ramp
Test 1 - Recommended storage configuration Based on this tested configuration, the storage environment should be built to handle at least 16,000 IOPS.
To meet the read/write IOPS running on 2.5ʺ SAS 15K drives, the test team estimated the IOPS per drive to be 250. A total of 64 drives would be required to handle the read/write I/O for ongoing activities. When utilizing user persistent data on persistent disk, adding SATA drives into the mix is recommended if additional capacity is required. The amount on SATA disks required will be based on the amount of data being stored per user. Usually 80% of user data will automatically tier down to tier 3 storage (SATA), leaving active data at the higher tier and moving inactive data to tier 3 storage.
Test 1 Recommended Drive Configuration
• 60 x 15K drives
• Enough SATA capacity to store user data
Dell Compellent Storage Center SAN & VMware View 1,000 Desktop Reference Architecture
Page 13
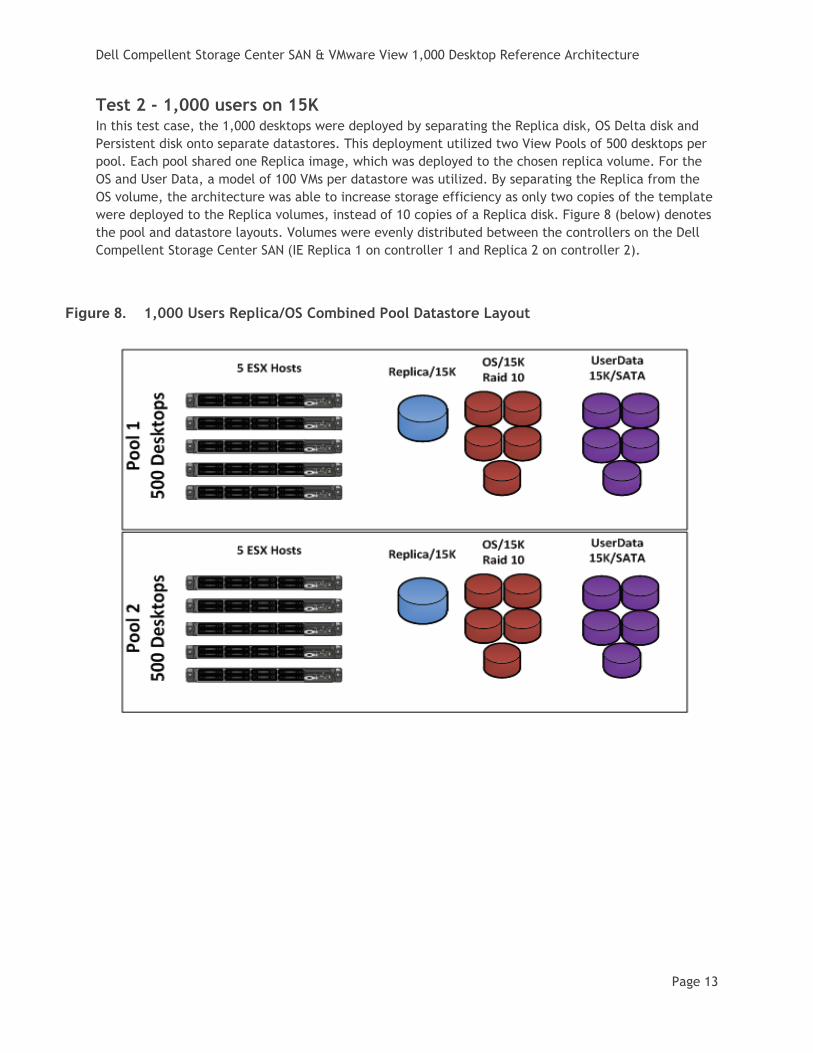
Test 2 - 1,000 users on 15K In this test case, the 1,000 desktops were deployed by separating the Replica disk, OS Delta disk and Persistent disk onto separate datastores. This deployment utilized two View Pools of 500 desktops per pool. Each pool shared one Replica image, which was deployed to the chosen replica volume. For the OS and User Data, a model of 100 VMs per datastore was utilized. By separating the Replica from the OS volume, the architecture was able to increase storage efficiency as only two copies of the template were deployed to the Replica volumes, instead of 10 copies of a Replica disk. Figure 8 (below) denotes the pool and datastore layouts. Volumes were evenly distributed between the controllers on the Dell Compellent Storage Center SAN (IE Replica 1 on controller 1 and Replica 2 on controller 2).
Figure 8. 1,000 Users Replica/OS Combined Pool Datastore Layout
Dell Compellent Storage Center SAN & VMware View 1,000 Desktop Reference Architecture
Page 14
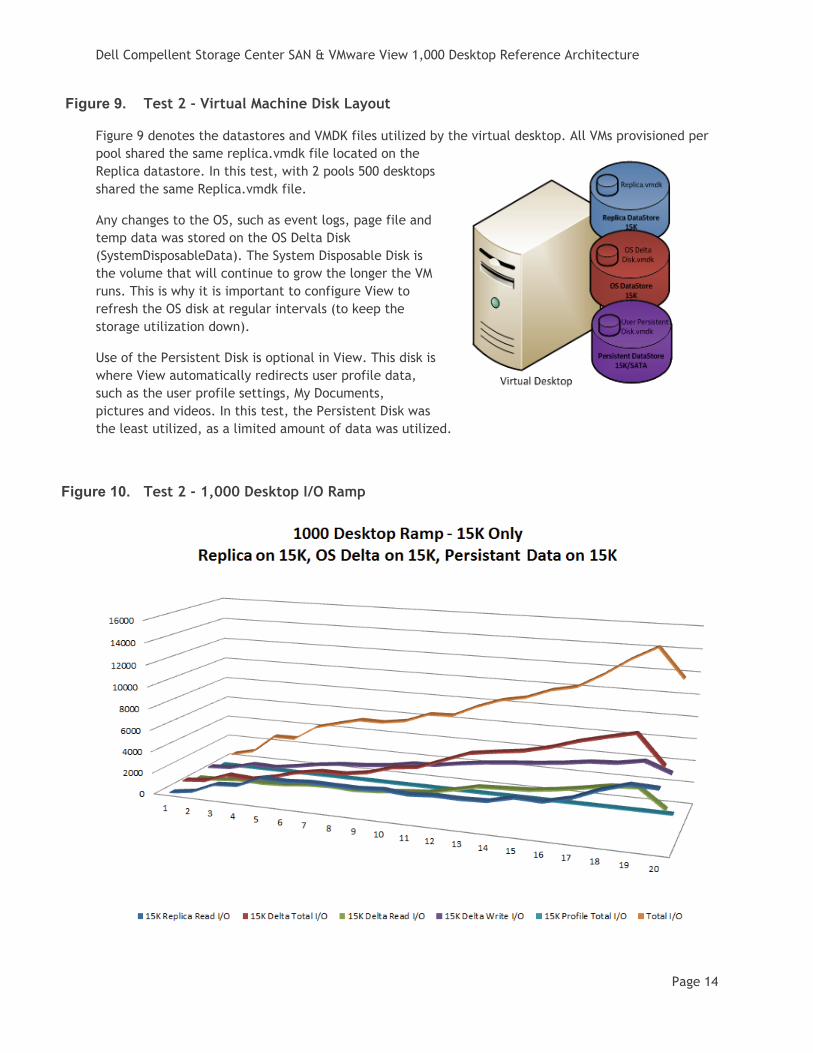
Figure 9. Test 2 - Virtual Machine Disk Layout
Figure 9 denotes the datastores and VMDK files utilized by the virtual desktop. All VMs provisioned per pool shared the same replica.vmdk file located on the Replica datastore. In this test, with 2 pools 500 desktops shared the same Replica.vmdk file.
Any changes to the OS, such as event logs, page file and temp data was stored on the OS Delta Disk (SystemDisposableData). The System Disposable Disk is the volume that will continue to grow the longer the VM runs. This is why it is important to configure View to refresh the OS disk at regular intervals (to keep the storage utilization down).
Use of the Persistent Disk is optional in View. This disk is where View automatically redirects user profile data, such as the user profile settings, My Documents, pictures and videos. In this test, the Persistent Disk was the least utilized, as a limited amount of data was utilized.
Figure 10. Test 2 - 1,000 Desktop I/O Ramp

Dell Compellent Storage Center SAN & VMware View 1,000 Desktop Reference Architecture
Page 15
Figure 10 (above) represents the test with a login rate of one user every 5 seconds or 12 users every minute. All 1,000 users were logged into their desktops over a period of 83 minutes. For example, this time period may be from 7:30 AM to 8:53 AM. Login rates for each deployment may differ from this tested scenario and should be considered. When all 1,000 users were logged in and actively running the testing profile, the maximum I/O reached was around 15,000 IOPS during the ramp from 0 to 1,000 active desktops.
Note: All desktops were logging in and running the workload profile until all 1,000 users were logged in and active. The test would then start logging off users after 84 minutes, during which time the I/O load started dropping. In this specific test, the read I/O was higher than the write I/O, mostly due to login I/O occurring the entire time.
Test 2 - Recommended storage configuration Based on this tested configuration, the storage environment should be built to handle at least 15,000 IOPS, which leaves a little overhead for abnormal I/O without impacting end users.
To meet the read/write IOPS running on 2.5ʺ SAS 15K drives, the test team estimated the IOPS per drive to be 250. A total of 64 drives would be required to handle the read/write I/O for ongoing activities. If utilizing user persistent data on persistent disk, adding SATA drives into the mix is recommended. The amount on SATA capacity required is based on the amount of data being stored per user. Usually 80% of user data will automatically tier down to tier 3 storage (SATA).
Test 2 Recommended Drive Configuration
• 64 x 15K drives
• Enough SATA capacity to store user data
Test 3 - 1,000 users on SSD/15K In this test case, the 1,000 desktops were deployed by separating the Replica disk onto SSD drives, OS Linked Clone Delta disks onto 15K drives, and persistent disks onto separate datastores. This deployment utilized two View Pools of 500 desktops per pool. Each pool shared one Replica image, which was deployed to the chosen Replica volume. For the OS and user data, a model of 100 VMs per datastore was utilized. By separating the Replica from the OS volume, the architecture was able to achieve maximum storage utilization efficiency, as only two copies of the template were deployed to the Replica volumes.
Figure 12 (below) denotes the pools and datastore layouts. Volumes were evenly distributed between the controllers on the Dell Compellent Storage Center SAN (IE Replica 1 on controller 1 and Replica 2 on controller 2).

Dell Compellent Storage Center SAN & VMware View 1,000 Desktop Reference Architecture
Page 16
Figure 11. 1,000 Users Replica/OS Combined Pool Datastore Layout
Figure 12. 1,000 Users Replica/OS combined pool datastore layout
Figure 12 denotes the datastores and VMDK files utilized by the virtual desktop. All VMs provisioned per pool shared the same replica.vmdk file located on the Replica datastore. In this test, with 2 pools 500 desktops shared the same Replica.vmdk file located on SSD.
Any changes to the OS, such as event logs, page file and temp data, is stored on the OS Delta Disk (SystemDisposableData). The System Disposable Disk is the volume that will grow the longer the VM runs. This is why it is important to configure View to refresh the OS disk at regular intervals (to keep the storage utilization down).
Use of the Persistent Disk is optional in View. This disk is where View automatically redirects user profile data, such as the user profile settings, My Documents, pictures and videos. In this test, the Persistent Disk was the least utilized, as a limited amount of data was utilized.
Dell Compellent Storage Center SAN & VMware View 1,000 Desktop Reference Architecture
Page 17
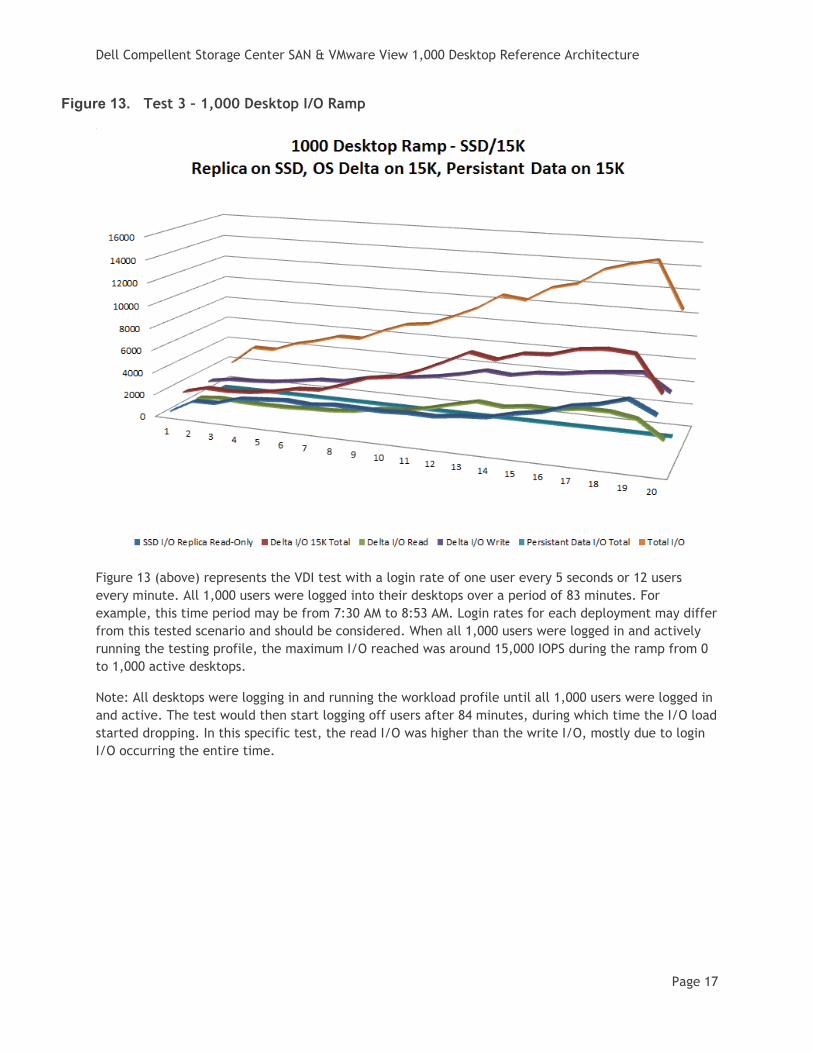
Figure 13. Test 3 – 1,000 Desktop I/O Ramp
Figure 13 (above) represents the VDI test with a login rate of one user every 5 seconds or 12 users every minute. All 1,000 users were logged into their desktops over a period of 83 minutes. For example, this time period may be from 7:30 AM to 8:53 AM. Login rates for each deployment may differ from this tested scenario and should be considered. When all 1,000 users were logged in and actively running the testing profile, the maximum I/O reached was around 15,000 IOPS during the ramp from 0 to 1,000 active desktops.
Note: All desktops were logging in and running the workload profile until all 1,000 users were logged in and active. The test would then start logging off users after 84 minutes, during which time the I/O load started dropping. In this specific test, the read I/O was higher than the write I/O, mostly due to login I/O occurring the entire time.
Dell Compellent Storage Center SAN & VMware View 1,000 Desktop Reference Architecture
Page 18
Test 3 - Recommended storage configuration Based on this tested configuration, the storage environment should be built to handle at least 15,000 IOPS.
Essentially, the system offloads a significant amount of the read I/O to the SSDs, allowing for a lower number of 15K spindles required. To meet the read/write IOPS running on SSD and 2.5ʺ SAS 15K drives, the test team estimated the IOPS per drive to be at 250. Since the Replica datastores were stored on SSD, the test team could plan to offload all the read I/O for the Replica to two active SSDs. That means a total of 30 15K drives would be required to handle the read/write I/O for ongoing activities. If utilizing user persistent data on persistent disk, adding SATA drives into the mix is recommended. The amount on SATA capacity required is based on the amount of data being stored per user. With Data Progression running, it is typical for 80% of user data to automatically migrate down to tier 3 storage (SATA).
As the environnent scales up, only 15K and SATA drives need to be added to the system. The only reason to add additional SSDs to the system would be if enough desktop pools were deployed to consume all the Replica space on the drives, as the SSDs can handle nearly 30,000 read IOPS.
Test 3 Recommended Drive Configuration
• 3 x SSDs (2 active, 1 hot spare)
• 30 x 15K drives
• Enough SATA capacity to store user data
Dell Compellent Storage Center SAN & VMware View 1,000 Desktop Reference Architecture
Page 19
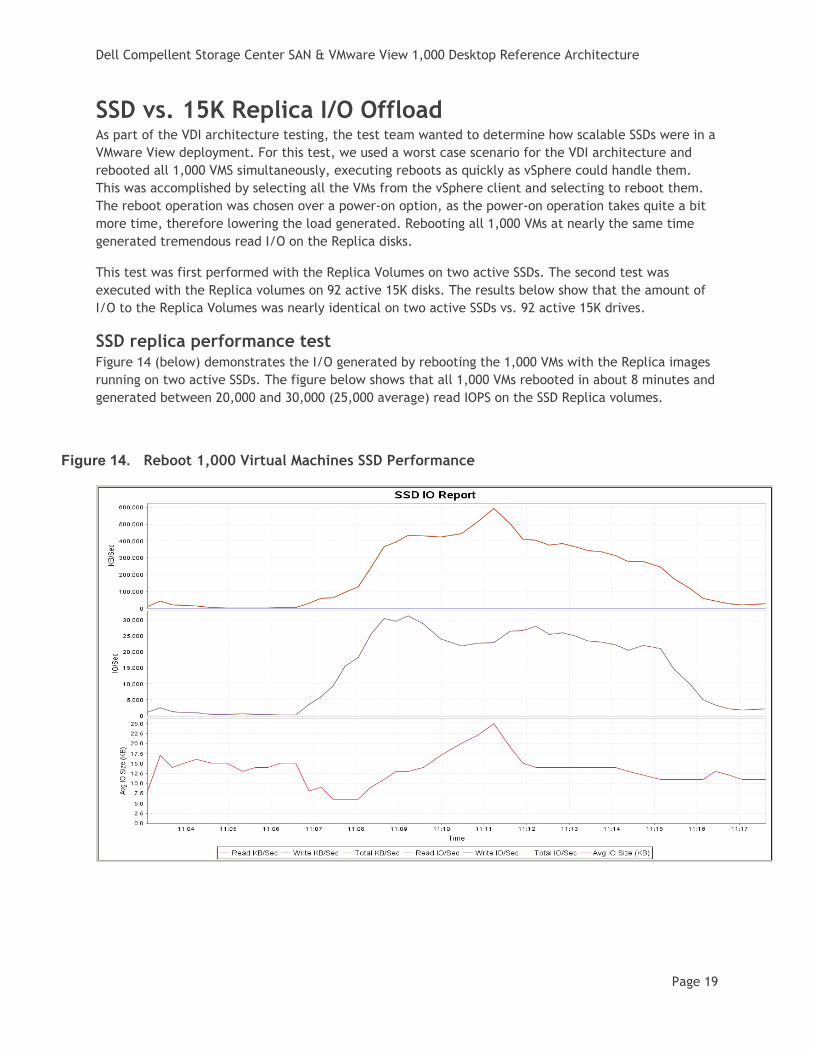
SSD vs. 15K Replica I/O Offload As part of the VDI architecture testing, the test team wanted to determine how scalable SSDs were in a VMware View deployment. For this test, we used a worst case scenario for the VDI architecture and rebooted all 1,000 VMS simultaneously, executing reboots as quickly as vSphere could handle them. This was accomplished by selecting all the VMs from the vSphere client and selecting to reboot them. The reboot operation was chosen over a power-on option, as the power-on operation takes quite a bit more time, therefore lowering the load generated. Rebooting all 1,000 VMs at nearly the same time generated tremendous read I/O on the Replica disks.
This test was first performed with the Replica Volumes on two active SSDs. The second test was executed with the Replica volumes on 92 active 15K disks. The results below show that the amount of I/O to the Replica Volumes was nearly identical on two active SSDs vs. 92 active 15K drives.
SSD replica performance test Figure 14 (below) demonstrates the I/O generated by rebooting the 1,000 VMs with the Replica images running on two active SSDs. The figure below shows that all 1,000 VMs rebooted in about 8 minutes and generated between 20,000 and 30,000 (25,000 average) read IOPS on the SSD Replica volumes.
Figure 14. Reboot 1,000 Virtual Machines SSD Performance
Dell Compellent Storage Center SAN & VMware View 1,000 Desktop Reference Architecture
Page 20
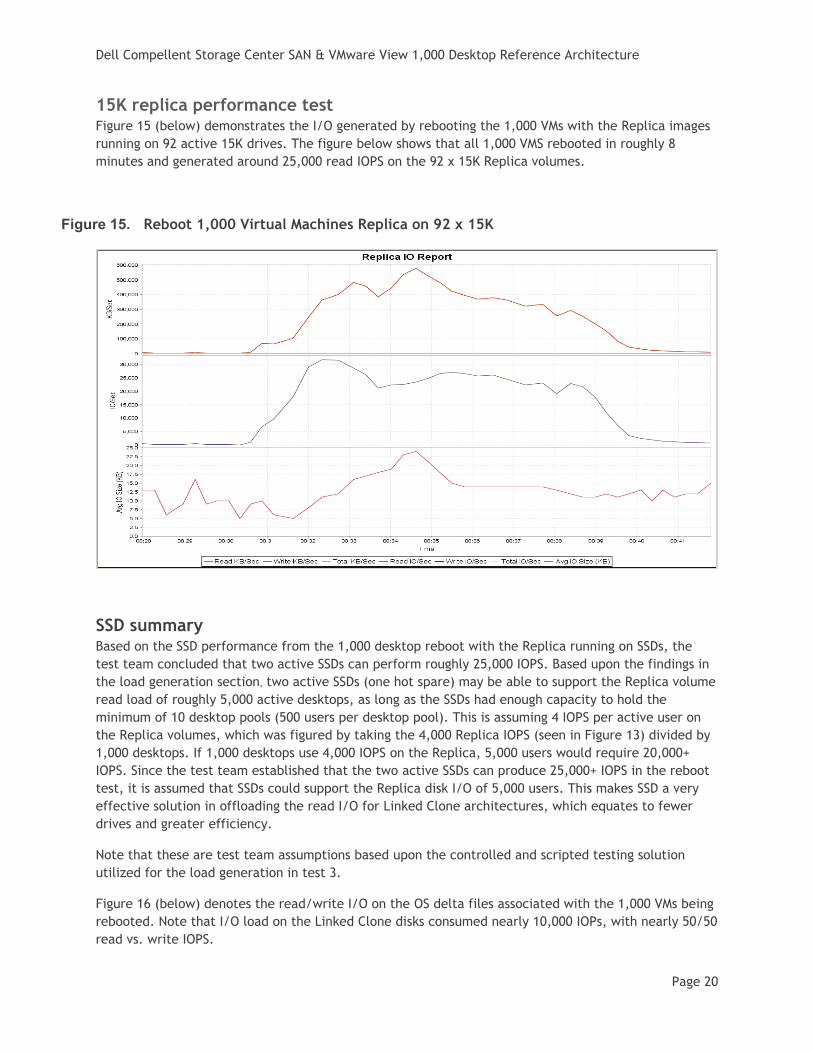
15K replica performance test Figure 15 (below) demonstrates the I/O generated by rebooting the 1,000 VMs with the Replica images running on 92 active 15K drives. The figure below shows that all 1,000 VMS rebooted in roughly 8 minutes and generated around 25,000 read IOPS on the 92 x 15K Replica volumes.
Figure 15. Reboot 1,000 Virtual Machines Replica on 92 x 15K
SSD summary Based on the SSD performance from the 1,000 desktop reboot with the Replica running on SSDs, the test team concluded that two active SSDs can perform roughly 25,000 IOPS. Based upon the findings in the load generation section, two active SSDs (one hot spare) may be able to support the Replica volume read load of roughly 5,000 active desktops, as long as the SSDs had enough capacity to hold the minimum of 10 desktop pools (500 users per desktop pool). This is assuming 4 IOPS per active user on the Replica volumes, which was figured by taking the 4,000 Replica IOPS (seen in Figure 13) divided by 1,000 desktops. If 1,000 desktops use 4,000 IOPS on the Replica, 5,000 users would require 20,000+ IOPS. Since the test team established that the two active SSDs can produce 25,000+ IOPS in the reboot test, it is assumed that SSDs could support the Replica disk I/O of 5,000 users. This makes SSD a very effective solution in offloading the read I/O for Linked Clone architectures, which equates to fewer drives and greater efficiency.
Note that these are test team assumptions based upon the controlled and scripted testing solution utilized for the load generation in test 3.
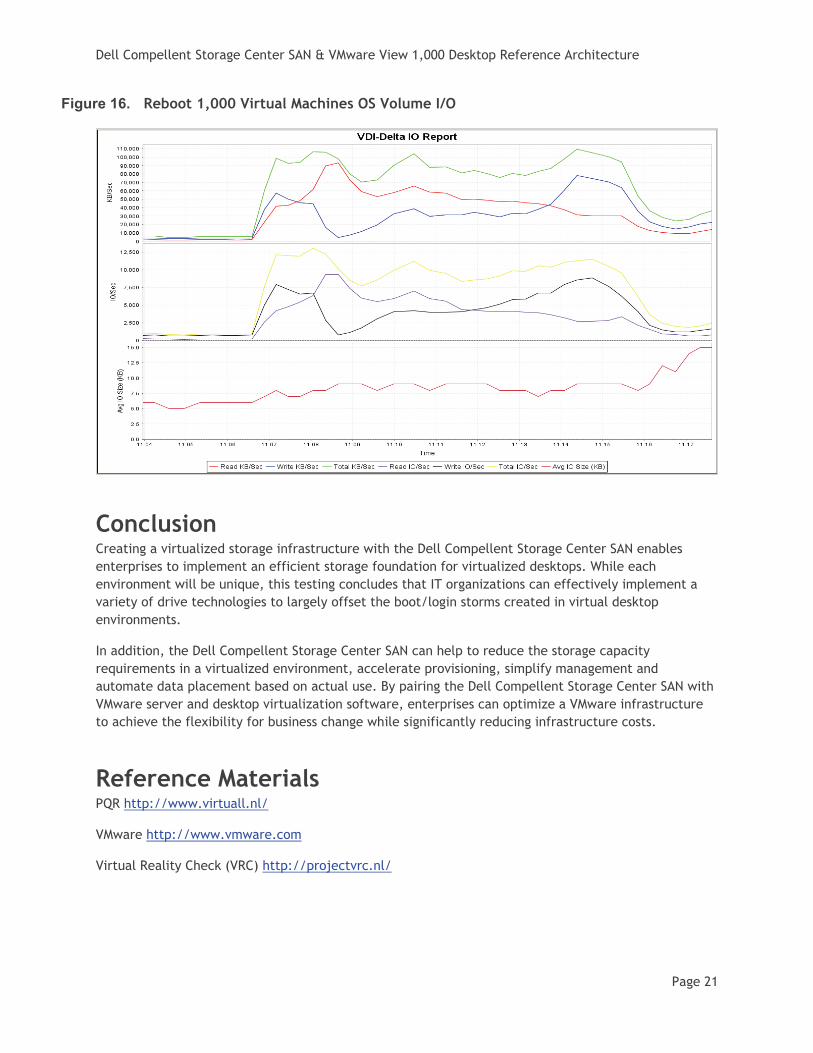
Figure 16 (below) denotes the read/write I/O on the OS delta files associated with the 1,000 VMs being rebooted. Note that I/O load on the Linked Clone disks consumed nearly 10,000 IOPs, with nearly 50/50 read vs. write IOPS.
Dell Compellent Storage Center SAN & VMware View 1,000 Desktop Reference Architecture
Page 21
Figure 16. Reboot 1,000 Virtual Machines OS Volume I/O
Conclusion Creating a virtualized storage infrastructure with the Dell Compellent Storage Center SAN enables enterprises to implement an efficient storage foundation for virtualized desktops. While each environment will be unique, this testing concludes that IT organizations can effectively implement a variety of drive technologies to largely offset the boot/login storms created in virtual desktop environments.
In addition, the Dell Compellent Storage Center SAN can help to reduce the storage capacity requirements in a virtualized environment, accelerate provisioning, simplify management and automate data placement based on actual use. By pairing the Dell Compellent Storage Center SAN with VMware server and desktop virtualization software, enterprises can optimize a VMware infrastructure to achieve the flexibility for business change while significantly reducing infrastructure costs.
Reference Materials PQR http://www.virtuall.nl/
VMware http://www.vmware.com
Virtual Reality Check (VRC) http://projectvrc.nl/


![Compellent Best Practices for Linux[1]](https://img.pdfslide.us/doc/110x75/544ed81daf7959e51e8b4d20/compellent-best-practices-for-linux1.jpg)