Embed Size (px)
Citation preview
Delivering Value from the Higher Education Estate Diamond Review Phase II: Efficiency and Effectiveness in Higher Education
April 2015
Excellence in Estates and Facilities
Diamond Review Phase II 2015 April 2015 · 2
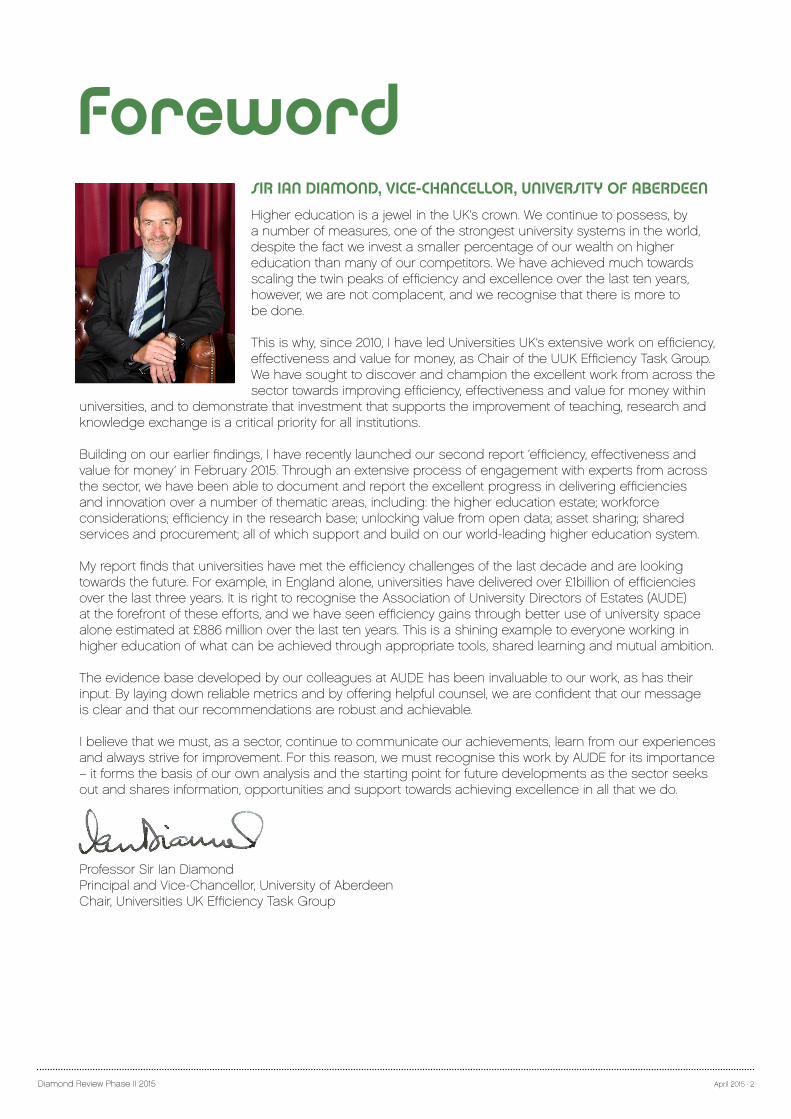
Foreword SIR IAN DIAMOND, VICE-CHANCELLOR, UNIVERSITY OF ABERDEEN
Higher education is a jewel in the UK’s crown. We continue to possess, by a number of measures, one of the strongest university systems in the world, despite the fact we invest a smaller percentage of our wealth on higher education than many of our competitors. We have achieved much towards scaling the twin peaks of efficiency and excellence over the last ten years, however, we are not complacent, and we recognise that there is more to be done.
This is why, since 2010, I have led Universities UK’s extensive work on efficiency, effectiveness and value for money, as Chair of the UUK Efficiency Task Group. We have sought to discover and champion the excellent work from across the sector towards improving efficiency, effectiveness and value for money within
universities, and to demonstrate that investment that supports the improvement of teaching, research and knowledge exchange is a critical priority for all institutions.
Building on our earlier findings, I have recently launched our second report ‘efficiency, effectiveness and value for money’ in February 2015. Through an extensive process of engagement with experts from across the sector, we have been able to document and report the excellent progress in delivering efficiencies and innovation over a number of thematic areas, including: the higher education estate; workforce considerations; efficiency in the research base; unlocking value from open data; asset sharing; shared services and procurement; all of which support and build on our world-leading higher education system.
My report finds that universities have met the efficiency challenges of the last decade and are looking towards the future. For example, in England alone, universities have delivered over £1billion of efficiencies over the last three years. It is right to recognise the Association of University Directors of Estates (AUDE) at the forefront of these efforts, and we have seen efficiency gains through better use of university space alone estimated at £886 million over the last ten years. This is a shining example to everyone working in higher education of what can be achieved through appropriate tools, shared learning and mutual ambition.
The evidence base developed by our colleagues at AUDE has been invaluable to our work, as has their input. By laying down reliable metrics and by offering helpful counsel, we are confident that our message is clear and that our recommendations are robust and achievable.
I believe that we must, as a sector, continue to communicate our achievements, learn from our experiences and always strive for improvement. For this reason, we must recognise this work by AUDE for its importance – it forms the basis of our own analysis and the starting point for future developments as the sector seeks out and shares information, opportunities and support towards achieving excellence in all that we do.
Professor Sir Ian DiamondPrincipal and Vice-Chancellor, University of AberdeenChair, Universities UK Efficiency Task Group
Diamond Review Phase II 2015 April 2015 · 3
SIAN KILNER Director Kilner Planning
Sian is a Director of Kilner Planning. She has worked with some 40 individual HEIs on projects including space management, space utilisation, space needs assessments, estate strategies, business plans and project appraisals. Sian carries out research and assists with the preparation of guidance for the education sector on estate strategies and space management, including the UK Funding Councils’ Space Management Project, the development of the Sustainable Estate Toolkit for AUDE and the National Audit Office Space Management Good Practice Guide.
Sian is a chartered surveyor and town planner, and has worked in both the public and private sectors.
DR GHAZWA ALWANI-STARR Director of Estates and Campus Services University of Roehampton - London
Ghazwa is a chartered civil and structural engineer with 28 years’ experience in the private, public and not-for-profit sectors. She gained both her BSc and PhD at the University of Leeds and started her career in Yorkshire as a structural engineer then moved to bridge engineering and from there into Project Directorship roles at BAA, the Prince’s Foundation and the NHS. She then held a role as Chief Operating Officer of a shared service in the NHS.
Ghaz joined the higher education sector 7 years ago and is Director of Estates and Campus Services at the University of Roehampton in London. She chairs the London Region of AUDE and is Deputy Chair of AUDE.
She was a member of the Oversight Panel for the UUK’s Diamond II review of efficiency and effectiveness in HE and the lead for the work stream focussing on space efficiency in UK HE.
PATRICE MULLER Senior Partner London Economics
Patrice Muller is a Senior Partner at London Economics, a specialist economics and policy consultancy advising clients in both the public and private sectors on economic and financial analysis, policy development and evaluation, business strategy, and regulatory and competition policy.
About the authors
Diamond Review Phase II 2015 April 2015 · 4
SECTION PAGE
EXECUTIVE SUMMARY 1
1 INTRODUCTION 6
2 CHARACTERISTICS OF THE HE ESTATE 7
3 SECTOR PROGRESS 10
4 IMPACT OF EFFICIENCY GAINS 22
5 CASE STUDIES 29
6 INTERNATIONAL COMPARATORS 48
7 RECOMMENDATIONS FOR THE FUTURE 51
Appendix 1 PREVIOUS REPORT AND GOOD PRACTICE GUIDANCE 55
The report is accompanied by:A statistical annex on selected indicators for the HEI non-residential estate Full report on the case studiesExecutive summary of report
Contents

EXECUTIVE SUMMARY This report on delivering value from the higher education estate forms part of Phase II of Sir Ian Diamond’s Review into efficiency and effectiveness in higher education.
The results of the work led by Sir Ian Diamond are set out in Universities UK’s report Efficiency, Effectiveness and Value for Money. This highlights the economic impact of UK universities:
• Contributing at least £73 billion a year to the national economy• Responsible for over £10 billion in export earnings• Supporting more than 700,000 jobs across the UK• Generating more gross domestic product (GDP) per unit of
resource than health, public administration and construction• Creating 117 jobs in the wider economy for every 100 people
employed directly in universities.
The report states that universities’ impact on the economy and society is grounded in providing world-class education; in excellence and diversity in research and innovation; in supporting the needs of business and industry; and in their global reputation for quality higher education.

Diamond Review Phase II 2015 April 2015 · 6
The sector is moving towards a ten-year track record in delivering efficiencies. Universities have had to work hard to continue delivering value for money. They are responding to a more competitive environment, with the needs of a diverse student population paramount. There is an imperative to invest in facilities in a more restrained public funding environment, and to ensure that a world-class workforce is available to serve the needs of learners and deliver excellent research.
DELIVERING VALUE FROM THE ESTATEDelivering value from the estate is a core element of the Phase II Review. The estate work stream covers:
• Investigating the extent of progress made in the sector in delivering efficiency gains and value from the higher education estate
• Benchmarking UK higher education space efficiency against international comparators
• Recommending strategies and tools for enabling further improvements in efficiency and effectiveness to be delivered in the future.
The work stream was undertaken by the Association of University Directors of Estates (AUDE) working with Universities UK, supported by the British University Finance Directors Group (BUFDG) and the Higher Education Funding Council for England (HEFCE). Kilner Planning and London Economics carried out research for the project.
CONTEXTHigher education institutions (HEIs) have undertaken major investment to adapt and improve their estates to meet changing demand and accommodate growth, but this has taken place within the constraints of a comparatively inflexible building stock.
The distinctive characteristics of the HE estate present challenges for maximising space utilisation. The estate is highly diverse and complex, accommodating a very wide range of activities. Nearly two thirds of the non-residential estate was built before 1980. In general, older buildings are less flexible and fit for purpose. Sixteen per cent of HEIs’ floor area on average is in listed buildings which is a major restriction on the scope for adaptation and reconfiguration.
Space use is not a discrete space management issue. It is the product a number of factors including not only estate quality and flexibility, but academic practice, student choice, research funding, and student and staff expectations.
Recent research identifies estates and facilities as key factors for students and staff with high quality facilities as one of the most important attributes of universities. Research by the Higher Education Design Quality Forum found that when students are deciding which university to study at, over a third rejected institutions because of the quality of their buildings, facilities and physical environment.
PROGRESS IN ACHIEVING EFFICIENCY GAINS AND INCREASING VALUE FROM THE ESTATEThese factors set the context for the research into the extent of progress in delivering efficiency gains and value from the non-residential estate. The research focused on three areas:
• The extent of improvements in the quality of the estate
• Changes in the efficiency and effectiveness of space use
• Trends in the value, or income, derived from the estate and property costs.
The statistical analysis focuses on HE sector-wide trends over a ten year period from 2003-04 to 2012-13 and uses Estate Management Returns from the Higher Education Statistics Agency (HESA). All cost and income variables have been adjusted to eliminate the effect of inflation.
Diamond Review Phase II 2015 April 2015 · 7
QUALITY INDICATORSSector-wide trends computed for the sample of HEIs with no missing data for the ten year period show a marked improvement in the quality of the estate over the period measured in terms of improvements both in building condition and fitness for purpose.
• The percentage of space rated as Condition Codes A (as new) and B (sound, operationally safe and exhibiting only minor deterioration) has increased by over 19 per cent to 78 per cent.
• There has also been a marked increase in the proportion of space rated as being fit for purpose. The percentage of space rated as functional suitability Grades 1 (excellent) and 2 (good) is now 85 per cent, an increase of nearly 22 per cent.
SPACE USE INDICATORSAnalysis of space indicators for the constant sample of HEIs over the ten year period shows that the sector has increased its effectiveness and efficiency of space use.
• Although the size of the non-residential estate has grown over the past ten years, the expansion in the size of the estate has been outpaced by growth in student and staff numbers. Factors such as improvements in functional suitability and effective space management have enabled space to be used more effectively to accommodate the expansion in student numbers, leading to an overall reduction in the space per student by over eight per cent.
• All the indicators by types of space reflect increasingly efficient use over the period, with the exception of support space per student and specialist research space per research student.
• Over the ten year period, the ratio of space per student declined until 2011-12, followed by a spike in 2012-13. The hypothesis was tested that the spike was the result of a fall in undergraduate numbers following the change in the fee regime in England. Counterfactual scenarios created for the space indicators involving taught students show that without the recent reduction in student numbers, the ratios of space per student would have continued to decline while support space per student would only have increased slightly.
• Staff office space ratios show reductions in the office area per person. Within the total, the reduction was only slight for academic staff offices, but over ten per cent for support staff.
• Analysis of trends in the utilisation of teaching space reveals that overall utilisation increased by over nine per cent. The utilisation rate is a combination of a frequency of use rate (how often rooms are used) and an occupancy rate (how full they are when they are in use).
• The frequency rate rose faster than the occupancy rate. Frequency of use increased by nearly nine per cent, whereas occupancy rose slightly – just under three per cent. Occupancy rates are highly dependent on student patterns of attendance.
INCOME AND PROPERTY COST INDICATORSAcross the sector, HEIs have delivered increasing value for money from the estate over the past ten years.
• Total income per student and staff FTE increased by over 21 per cent over the period.
• Income per square metre increased by over 34 per cent over the same time.
• Thus the increase in the ratio of income per square metre exceeded the income generated per student and staff FTE, indicating more efficient and effective use of space over the period.
• In terms of different types of income, the lowest rate of growth income per square metre was associated with research space (just over 16 per cent) and the highest with the category designated as other income at 87 per cent. This suggests that the sector has been diversifying its income base and increasing sources in addition to teaching and research.
• Property costs per square metre have increased, rising by 26 per cent, primarily as a result of increased spending on maintenance and the rising cost of electricity.
• Although property costs per student have also risen, they have increased at a lower rate than the cost per square metre (just above 15 per cent) as a result of increases in the effectiveness of space use.
• The ratio of maintenance costs and capital expenditure to insurance replacement value is often
Diamond Review Phase II 2015 April 2015 · 8
used as a guide to the level of annual expenditure needed to maintain an estate in good condition and keep it for purpose through upgrading or redevelopment. Sector-wide, this ratio has seen a recent decline, with the fall being marked since 2010-11.
A major issue of concern in the sector is that income from Government is not increasing and therefore reducing in real terms. At the same time, staff costs and other operating costs are increasing by at least inflation. As a result, surpluses are becoming increasingly difficult to achieve, and within time will turn into deficits and cash reserves are being used. This will inevitably lead to a decline in estates and facilities expenditure and investment. This is particularly illustrated by the reduction in the ratio of maintenance costs and capital expenditure.
IMPACT OF EFFICIENCY GAINS – COST AND CARBON SAVINGSThe overall reduction in space per student FTE indicates that the sector has used its space more effectively to accommodate the expansion in student and staff numbers.
This project estimated what the size of the non-residential estate would have been had the sector not delivered this efficiency in space use over the ten years to 2012-13. The cumulative efficiency savings are estimated to total £7.2 billion (£6.29 billion savings in capital expenditure and £886 million on property costs such as maintenance and energy).
For the period 2003/04 – 2012/13, it is estimated that an additional 1,178 million Kg CO2e would have been produced in the absence of efficiency gains in space usage.
CASE STUDIESThe project undertook a series of case studies. These illustrate not only how individual institutions are making efficiency gains but also how they are working to deliver increased value from their estates for the benefit of student and staff experience and attainment, and for the benefit of local communities and the wider economy.
Coventry University – Engineering and Computing BuildingImperial West – Imperial College’s campus in White CityLoughborough University – new uses for a historic buildingManchester Metropolitan University – delivering a far reaching strategyUniversity of Strathclyde – the Technology and Innovation CentreUniversity of Sunderland – Sciences Complex Refurbishment project
INTERNATIONAL COMPARATORSResults from the international benchmarking space measures indicates that the UK has less space per student than the comparator groups in North America and in Australia, New Zealand and Hong Kong.The Tertiary Facilities Management Association (TEFMA) with data for HEIs in Australia, New Zealand and Hong Kong reports more detail on utilisation than UK HEIs report through EMR. TEFMA data includes a breakdown by space type and two reporting periods – daytime and evening.
RECOMMENDATIONS FOR THE FUTUREThe estate work stream makes a series of recommendations for further enabling strategies and tools and strategies designed to support future improvement in the performance of the estate and to promote further efficient and effective space use.
1. Key performance indicatorsIt is recommended that eight key performance indicators (KPIs) are adopted and reported on an annual basis.
Efficiency• Area per student and staff FTE (GIA m²)
• Total property cost per m² (GIA)
Diamond Review Phase II 2015 April 2015 · 9
Quality• Percentage of GIA in condition grades A and B
• Percentage of GIA in functional suitability grades 1 and 2
Value• Income per m² (GIA)
• Insurance replacement value as a proportion of total income
Sustainability• Maintenance and capital expenditure as percentage of insurance replacement value (rolling
average of three years)
• Carbon emissions scope 1 and 2, tonnes by m²
All definitions are as HESA’s Estates Management Record with the exception that total property cost excludes rateable value. It is recommended that if national results are collated and reported through HEFCE or HESA that the ability to report results by TRAC1 Peer Group is included to enable comparisons of similar institutions.
The estate has a critical role to play in student and staff satisfaction. At such time as the National Student Survey, it is recommended that an additional question is included to ask about students’ satisfaction with the estate and campus facilities. Similarly institutions may consider collecting and reporting on this measure independently of the National Student Survey for both students and staff. This would complete the value elements of the estate and balance the measures.
2. Governance, strategic planning and decision makingEffective governance, strategic planning and decision making are critical success factors in delivering future improvements in the KPIs. It is recommended that the goal of improving KPI performance is integrated with wider institutional planning and decision making and that to support this recommendation, guidance for governing bodies and HEIs is updated.
This will include revision, rationalisation and updating of the AUDE Self Assessment Tool (AUDESAT) to reinforce the role of governance and build in a greater focus on the delivery of efficient and effective use of the estate and delivery of the KPIs in each of the core competencies: leadership, strategy, processes, people, resources and outcomes. The update will focus on which actions/decisions will assist in improving performance.
3. Enabling models and toolsIt is recommended that models and tools used by estates professionals and institutional leaders for managing the efficiency and effectiveness of space use are reviewed and updated to make them fit for purpose for the future. These include the model for benchmarking the size of the estate, tools for assessing space needs and tools for measuring space utilisation.
1 Transparent Approach to Costing

1INTRODUCTION Delivering value from the estate is a core element of Phase II of Diamond Review of efficiency and effectiveness in higher education (HE).
Diamond Review Phase II 2015 April 2015 · 11
BACKGROUNDThe research into delivering value from the HE estate was undertaken by the Association of University Directors of Estates (AUDE) working with Universities UK, supported by the British University Finance Directors Group (BUFDG) and the Higher Education Funding Council for England (HEFCE). Kilner Planning and London Economics carried out research for the project.
The project originated in universities UK’s 2013 report Working for a Smarter, Stronger Sector2. This progress report on Phase I of the work of Universities UK Efficiency and Modernisation Task Group led by Sir Ian Diamond3, showed how efficiency programmes had played a critical role in the sector in delivering efficiency savings and value for money. In the context of continuing austerity, it identified future challenges for the sector and a series of areas for further work in Phase II of the review. These were:
• Enhancing utilisation of and value from the higher education estate
• Extending work on asset sharing to ensure that benefits are disseminated across the sector
• Understanding the human resources challenges facing the sector
• Building on work set in train by the Wakeham review of efficiency in the research base to ensure that research funding remains efficient and sustainable
• Creating a more robust evidence base to account for progress.
Sir Ian Diamond’s report Efficiency, Effectiveness and Value for Money4 on the outcome of the work streams for each of these areas and the future agenda for efficiency in the HE sector was published in February 2015.
SCOPE OF THE REPORTThis is the report on the findings of the estate work stream. It covers:
• The characteristics of the HE estate
• Results of research into progress in delivering efficiency gains and increasing value from the estate
• Quantification of the financial and environmental impact of efficiency gains
• Summaries of case studies
• International comparators
• Recommendations for future performance measures and for the development of strategies and tools to enable further improvements in efficiency and value to be delivered in the future.
There are two companion reports: a statistical annex supporting the research into efficiency gains and a report setting out full information on the case studies.
2 http://www.universitiesuk.ac.uk/highereducation/Pages/WorkingForaSmarterStrongerSector.aspx3 Report: Universities UK Efficiency and Effectiveness in Higher Education 20114 http://www.universitiesuk.ac.uk/highereducation/Pages/EfficiencyEffectivenessValueForMoney.aspx

22BACKGROUND AND CHARACTERISTICS OF THE HE ESTATE Over the ten years from 2003-04 to 2012-13, the total number of FTE students rose from 1,479,000 FTEs to 1,675,000, having peaked at 1,767,000 in 2011-12. During this time, the size of the non-residential estate grew from nearly 12.5 to 13.5 million square metres5.
5 Net internal area
Diamond Review Phase II 2015 April 2015 · 13
COMPLEXITY OF THE ESTATEThe HE estate is unusual in its diversity. Institutions vary widely in their mission and size. They are also complex in terms of types of space and facilities.
Data from the Estate Management Returns 2012-13 show that across the sector HEIs range in size from some 4,000m² in a small specialist institution to over 550,000m² of gross internal non-residential area in large multi-disciplinary universities with missions combining teaching and research.
In terms of the types of space provided by HEIs, on average, nearly half of an institution’s non-residential estate is used for teaching comprising general purpose spaces such as lecture theatres and seminar rooms, specialist areas, such as laboratories and studios, and offices used by staff. Fourteen per cent is allocated to research covering both specialist research space and offices for research staff. Just over 30 per cent is used for support purposes including libraries, catering, support, central administration and sports facilities. The remainder is used for other purposes including students unions, galleries and museums (six per cent), and three per cent is vacant. These average figures, however, conceal wide variations between individual institutions with some having no dedicated research space and others having more than 50 per cent devoted to research activity.
HEIs often use data from EMR to benchmark their space use, with many using selected peer groups, such as TRAC Groups, so that comparisons are made with other institutions sharing similar missions and characteristics.
AGE, FITNESS FOR PURPOSE AND HERITAGEHEIs have undertaken major investment in their estates to adapt and renew their estates to meet changes in demand, but this has taken place within the constraints of a comparatively inflexible estate. Over 98 per cent of the non-residential estate is held by HEIs on a freehold or long leasehold basis. On average, 63 per cent of the HEIs’ estates was constructed before 1980, and over 21 per cent pre 1940. In general, older buildings are less fit for purpose having been designed to space standards and norms that are now outdated, and they are often less flexible or capable of adaptation to meet changing needs.
Part of the inflexibility of the older stock stems from the extent of listed building coverage. Listed buildings comprise on average 16 per cent of HEIs’ non-residential space. The percentage is much higher for some institutions. Twenty nine HEIs have more than 25 per cent of their space listed, and a small number have all or nearly all of their non-residential estate listed. HEIs play an important role in conserving many important buildings of architectural or historic interest, but listed status can impose significant constraints on the scope to reconfigure buildings in order to use space more efficiently and to meet changing needs. They are also costly to maintain. In England, the old and historic buildings fund was withdrawn in 2010-11.
Inflexibility and poor fitness for purpose are also characteristics of much of stock built in the 1960s. AUDE published a report in 2008 The Legacy of 1960s University Buildings. It identified problems typical of buildings of this age including asbestos, system building techniques and deep plan buildings, combined with the need for major upgrading. Many of these buildings were designed using space norms which do not reflect current patterns of working or course delivery. The report noted that in the private sector commercial buildings of this age usually stand alone and are not located on any equivalent of a university campus. Commercial building operators have a range of choices available to them, such as disposal, change of use or relocation, which are not generally available to universities. Instead, universities need to consider whether and how aging buildings which no longer meet academic and support needs should be refurbished, demolished or redeveloped.
STUDENT AND STAFF PERSPECTIVE Notwithstanding these challenges, a series of research reports identify the quality of the estate and campus facilities as key factors for students and staff.
• In the Times Higher Education Student Experience Survey 2014, respondents stated that high quality facilities were one of the most important attributes of universities.
• The Higher Education Design Quality Forum (HEDQF) supported by AUDE researched the
Diamond Review Phase II 2015 April 2015 · 14
importance and impact of the estate on students’ choice of institution as well as their experience while at university. Their findings in the report Estates Matter included:
— When deciding which universities to study at, over a third of students said that they rejected certain institutions because of the quality of their buildings, facilities and physical environment.
— Only eight per cent thought that the estate was not very or not at all important in deciding where to study.
— In terms of priorities for spending on estates and facilities, students identified spending more on the repair and maintenance of existing buildings as the top priority, followed by increasing the environmental sustainability of existing buildings, enhancing outdoor spaces and replacing old buildings with new ones.
• In 2014, AUDE commissioned a survey of two thousand students on their university choice and the facilities that were most important to them. The survey asked whether the facilities available (such as sports facilities, buildings, libraries and accommodation) played a role in their choice of university. Nearly eight out of ten (77 per cent) students said yes. Respondents cited the library and IT facilities as the university resources that they used most. Sports facilities and the students union also featured.
• The Sodexo university lifestyle survey 2014 reported that first hand experience of a campus is key for students with 50 per cent saying that they made their choice of university after gaining a good impression on open day, and 38 per cent mentioned the attractiveness of the campus as a prime factor in their decision making process.
The findings from these recent surveys echo the outcome of research carried out ten years ago by the Commission for Architecture and the Built Environment (CABE). CABE published a report in 2005, Design with Distinction – the Value of Good Building Design in Higher Education. It explored the links between building design and recruitment, retention and performance of staff and students in higher education. It found that existence of well designed buildings on a campus was a significant factor in the recruitment of staff and students. When asked to identify specific features of buildings that would most influence their decision to work in a particular institution, staff identified cleanliness, a feeling of space and bright working areas as being most influential. Most students identified the quality of facilities as most important, including the library, sports centre, atriums and lecture rooms.
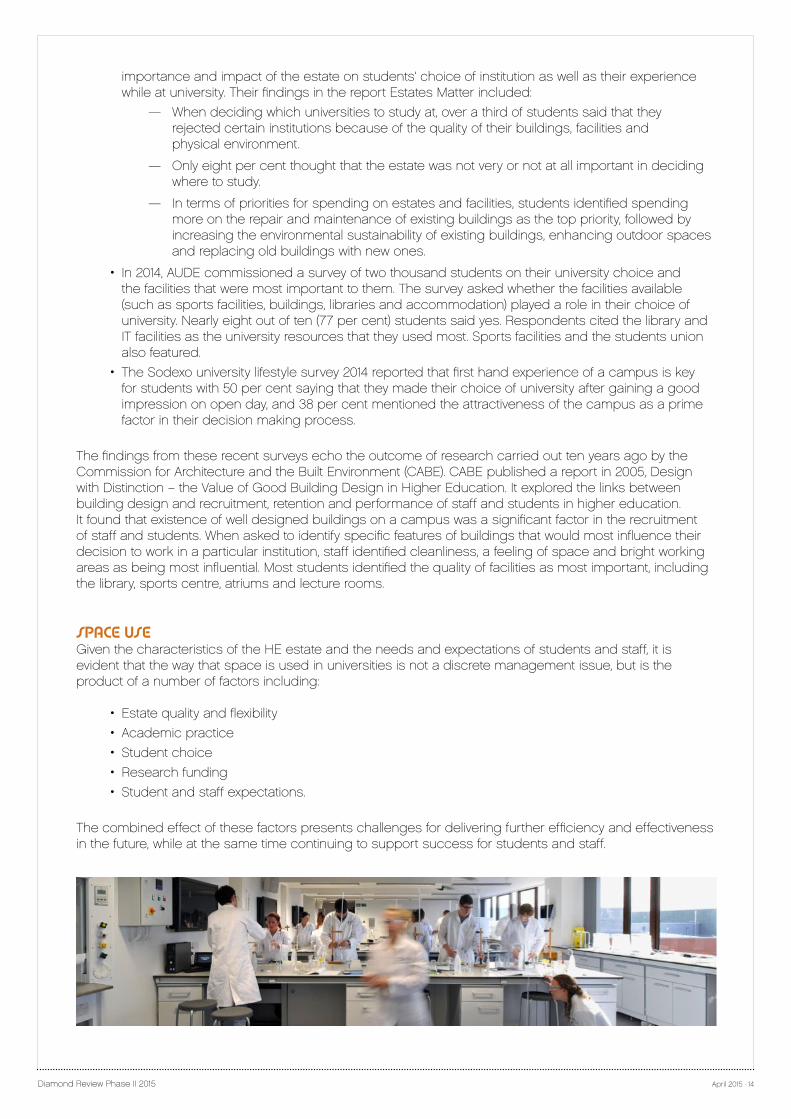
SPACE USEGiven the characteristics of the HE estate and the needs and expectations of students and staff, it is evident that the way that space is used in universities is not a discrete management issue, but is the product of a number of factors including:
• Estate quality and flexibility
• Academic practice
• Student choice
• Research funding
• Student and staff expectations.
The combined effect of these factors presents challenges for delivering further efficiency and effectiveness in the future, while at the same time continuing to support success for students and staff.

3SECTOR PROGRESS The work stream reviewed the performance of the HE estate to seek to identify progress made by the sector in achieving efficiency gains and delivering value from the estate.
Diamond Review Phase II 2015 April 2015 · 16
APPROACH TO THE RESEARCHThe research used data from HESA’s Estates Management Returns to analyse trends in space performance under three headings:
• Condition and fitness for purpose
• Space use
• Institutional income and property costs.
The research took account of the annual EMR reports published by HEFCE and the AUDE report published in 20146 analysing estate management data from 2012-13 and preceding years.
There are possible differences between the figures in this report and those reported in other publications, such as the annual AUDE EMR report. They may be driven by a combination of the following factors:
• The statistical analysis focused on HE sector-wide trends over a ten year period from 2003-04 to 2012-13 and used Estate Management Returns from the Higher Education Statistics Agency (HESA). For each HE estate indicator discussed in the report, the population of HEIs covered in the analysis is the one for which data is available over the entire period of interest. The use of a constant population of HEIs in the analysis avoids potential biases in assessing sector-wide trends which may arise from year-to-year changes in the number of HEIs for which data for a particular indicator exist. As the focus is on sector-wide trends, the HE estate indicators presented in the report are weighted averages of the HEI-specific values of the indicators. 7 The detailed statistical annex also provides information on trends in the indicators based on unweighted averages and varying population sizes over time.
• All income and costs series have been adjusted for inflation using the appropriate price index and as a consequence may not be directly comparable with figures reported in other publications.
• The property cost measures are based on the EMR definition of total property costs excluding rateable value. Although the inclusion of rateable value in the EMR definition of total property costs provides a closer approximation to a full economic cost of space (it is a proxy for the cost of capital), it is excluded for the purposes of this particular analysis, because it is not a cash cost and to assist with benchmarking against international comparators in the event that equivalent international data can be obtained.
Full details of the statistical analysis are contained in the accompanying report in the accompanying document, Statistical Annex on the HE Non-residential estate: Selected Indicators.
The analysis was structured in two parts: an analysis of the median value for each indicator over time using all HEIs with available data in a given year and thus having a changing sample over time;an analysis of the sector-wide trend over time using only the constant sample of HEIs having no gaps in the data for a given indicator in the period considered (2003/04 to 2012/13); sector-wide trends can be expressed as an unweighted average of the indicator (simply taking the average across all HEIs) or as a weighted average computed as the sum of the numerators divided by the sum of the denominators (i.e. weighting by the relative size of each HEI).
The trends described below are based on the weighted average using a constant sample. All the results refer to the net internal area of the non-residential estate unless otherwise specified.
6 AUDE Higher Education Statistics Report 2014 published September 20147 The following, admittedly somewhat extreme, example shows why it is preferable to use a weighted average when examining sector-wide trends. The sector comprises two HEIs with HE A having an estate of 1,000 and 500 students, and HE B an estate of 500 and 100 students. Therefore, the sector-wide estate and student body are respectively 1,500 and 600, and the space per student is 2.5 (i.e., 1,500/600). In contrast, a simple average of the HE specific ratios of 2.0 (HE A) and 5.0 (HE B) is equal to 3.5. In this particular example, the simple average overstates the sector-wide ratio of because it implicitly gives the same weight to the smaller HEI with the more generous space per student as to the larger HE with less space per student. A weighted average of the HE indicators (with the weights equal to the share of each HE’s student body in the total sector-wide student body) will yield the correct sector-wide figure of 2.5 (i.e. 2*(500/600)+3.5*(100/600)).
Diamond Review Phase II 2015 April 2015 · 17
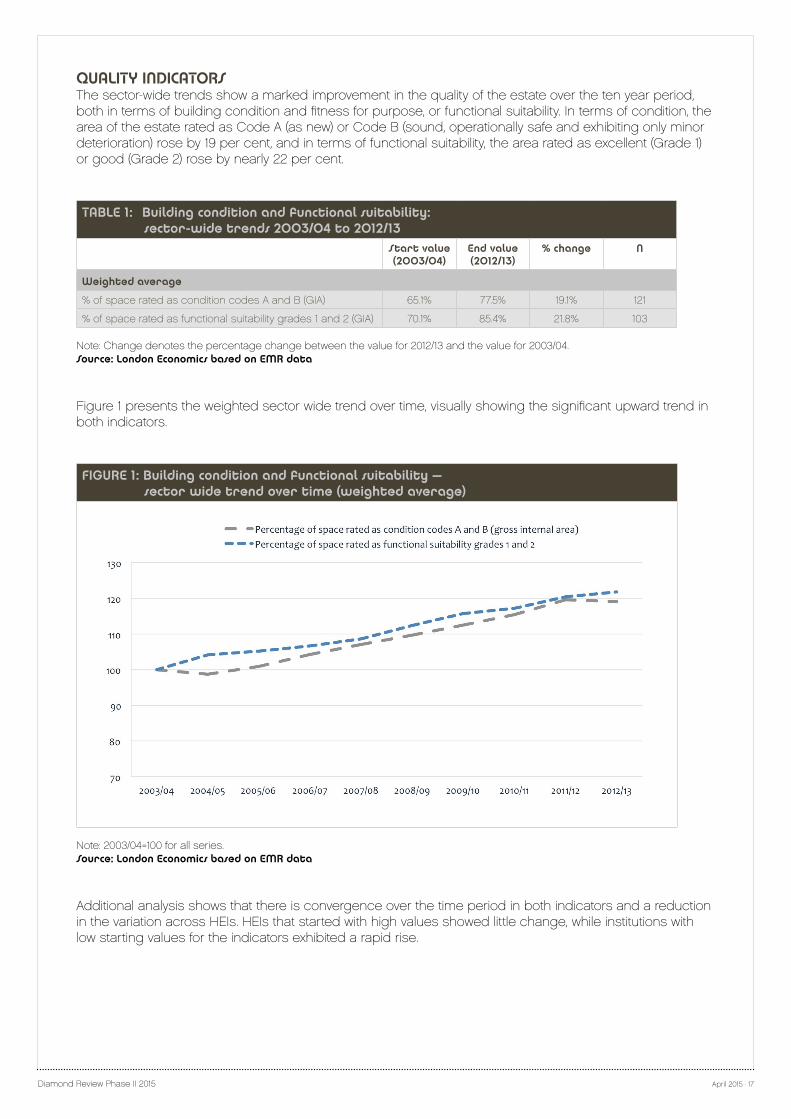
QUALITY INDICATORSThe sector-wide trends show a marked improvement in the quality of the estate over the ten year period, both in terms of building condition and fitness for purpose, or functional suitability. In terms of condition, the area of the estate rated as Code A (as new) or Code B (sound, operationally safe and exhibiting only minor deterioration) rose by 19 per cent, and in terms of functional suitability, the area rated as excellent (Grade 1) or good (Grade 2) rose by nearly 22 per cent.
TABLE 1: Building condition and functional suitability: sector-wide trends 2003/04 to 2012/13
Start value (2003/04)
End value (2012/13)
% change N
Weighted average
% of space rated as condition codes A and B (GIA) 65.1% 77.5% 19.1% 121
% of space rated as functional suitability grades 1 and 2 (GIA) 70.1% 85.4% 21.8% 103
Note: Change denotes the percentage change between the value for 2012/13 and the value for 2003/04.Source: London Economics based on EMR data
Figure 1 presents the weighted sector wide trend over time, visually showing the significant upward trend in both indicators.
FIGURE 1: Building condition and functional suitability – sector wide trend over time (weighted average)
Note: 2003/04=100 for all series.Source: London Economics based on EMR data
Additional analysis shows that there is convergence over the time period in both indicators and a reduction in the variation across HEIs. HEIs that started with high values showed little change, while institutions with low starting values for the indicators exhibited a rapid rise.
Diamond Review Phase II 2015 April 2015 · 18
SPACE INDICATORSThe space indicators used in the analysis covered a series of different types of space ratios per student and staff FTE and indicators relating to space utilisation of teaching space.
i. Space ratiosAll the space ratio indicators show a declining trend in the period, with the exception of specialist research space per student and support space per student when using the weighted average. The overall reduction indicates that the sector has used its space more efficiently to accommodate the expansion in student numbers. Within the total net non-residential internal area, the area of support space per student has increased, while core teaching space has declined. This may reflect the expansion of sports facilities and informal social learning spaces combined with increased sharing and improved utilisation of teaching facilities and shifts in delivery models providing more on line and independent learning.
Support staff office ratios show a decline in the area per member of staff, whereas academic office space is relatively unchanged. It is noted, however, that the average space per FTE at over 13m² is close to the former University Grants Committee (UGC) space norm of 13.5m² for academic staff, and the current ratio may be in part a legacy of the expansion of the sector in the 1960s and 1970s and the difficulties of adapting buildings of that era.
TABLE 2: Space indicators: sector-wide trends 2003/04 to 2012/13Start value (2003/04)
End value (2012/13)
% change N
Weighted average
Total non-residential net internal area per student 8.70 7.99 -8.2% 130
Teaching space per taught student 2.80 2.33 -16.7% 106
Specialist research space per research student FTE 13.66 14.94 9.3% 69
Support space per student FTE 2.39 2.45 2.8% 115
Academic office space per academic staff FTE 13.99 13.91 -0.5% 98
Support office space per support staff FTE 14.40 12.86 -10.7% 97 Note: Change denotes the percentage change between the value for 2012/13 and the value for 2003/04. All space indicators refer to non-residential Net Internal Area except where otherwise indicated. Source: London Economics based on EMR data
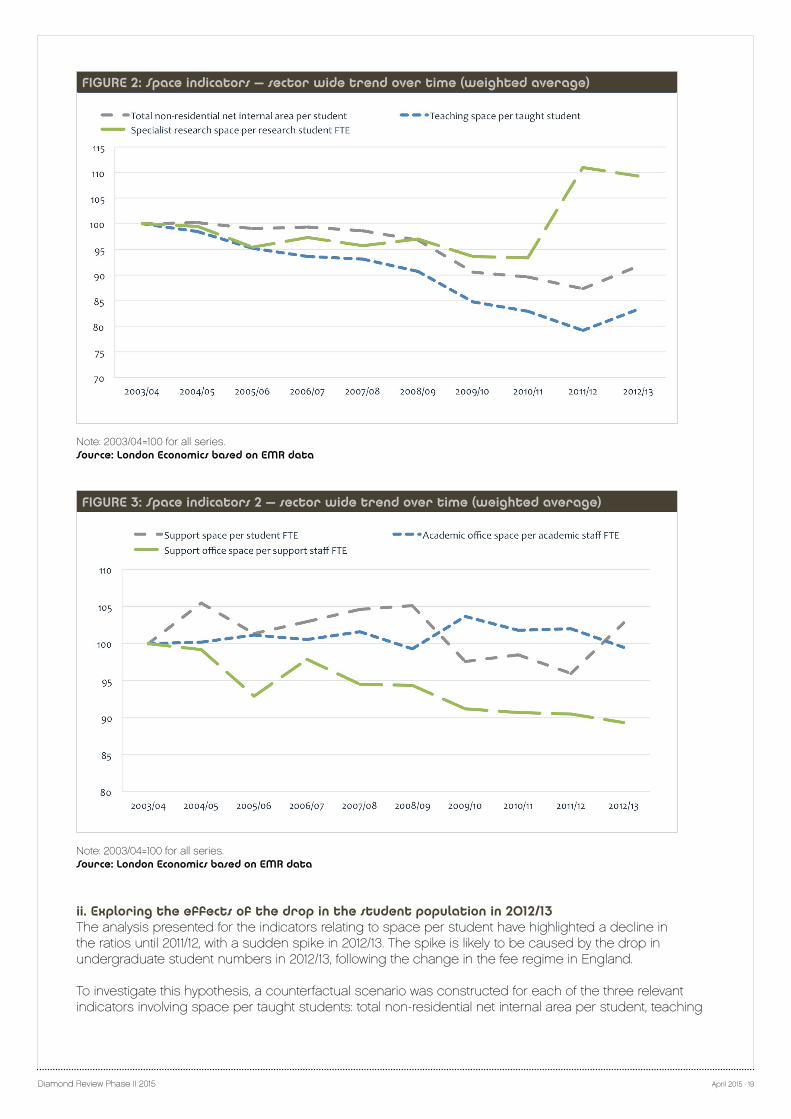
Figure 2 and Figure 3 present the weighted sector wide trend over time for the space indicators. There is a decline in the ratios of total non-residential area per student and teaching area per taught student up until 2011/12 and an increase in 2012/13, probably explained by the fall in the number of students between 2011/12 and 2012/13.
As the detailed analysis in the Statistical Annex shows, the trend in research space per research student is significantly different from the median trend, probably due to the different sample composition (compared to the full sample used for the median) and the presence of a few large HEIs driving up the ratio8.
8 A number of HEIs accounting for a relevant share of specialist research area (on the total for the sector) experienced high growth rates in the ratio of research space per research student, thus driving up the weighted average for the sector.
Diamond Review Phase II 2015 April 2015 · 19
FIGURE 2: Space indicators – sector wide trend over time (weighted average)
Note: 2003/04=100 for all series. Source: London Economics based on EMR data
FIGURE 3: Space indicators 2 – sector wide trend over time (weighted average)
Note: 2003/04=100 for all series.Source: London Economics based on EMR data
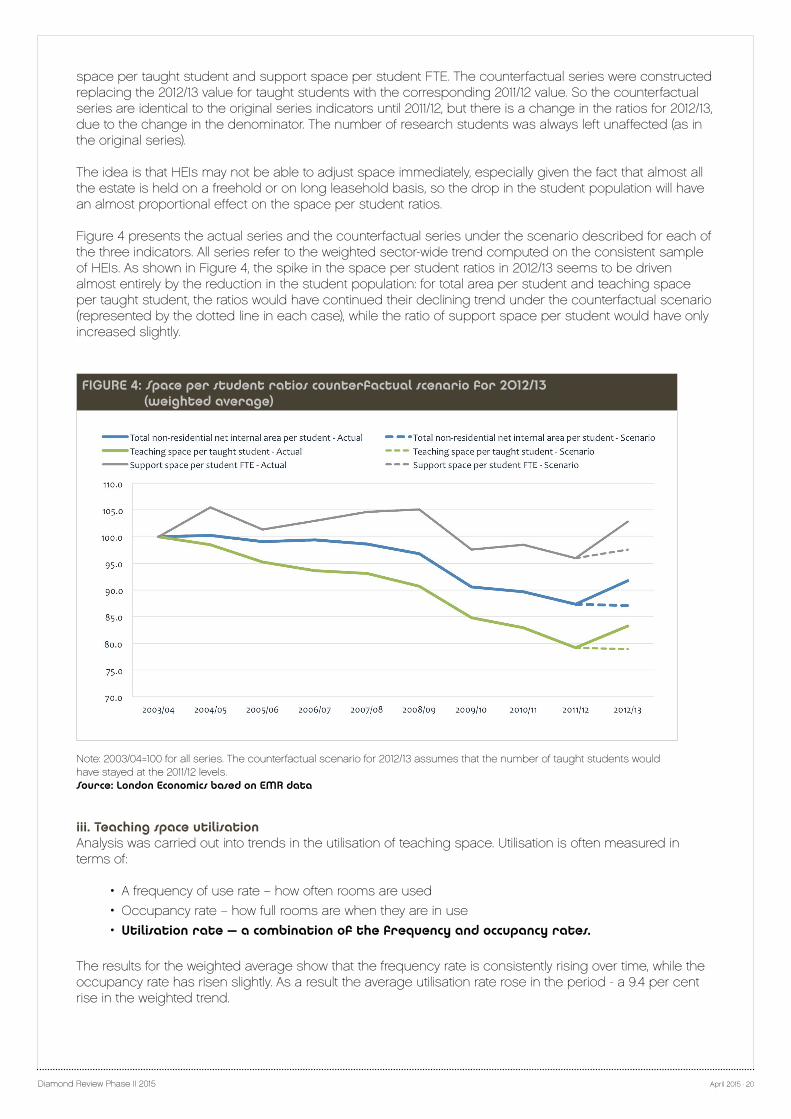
ii. Exploring the effects of the drop in the student population in 2012/13The analysis presented for the indicators relating to space per student have highlighted a decline in the ratios until 2011/12, with a sudden spike in 2012/13. The spike is likely to be caused by the drop in undergraduate student numbers in 2012/13, following the change in the fee regime in England.
To investigate this hypothesis, a counterfactual scenario was constructed for each of the three relevant indicators involving space per taught students: total non-residential net internal area per student, teaching
Diamond Review Phase II 2015 April 2015 · 20
space per taught student and support space per student FTE. The counterfactual series were constructed replacing the 2012/13 value for taught students with the corresponding 2011/12 value. So the counterfactual series are identical to the original series indicators until 2011/12, but there is a change in the ratios for 2012/13, due to the change in the denominator. The number of research students was always left unaffected (as in the original series).
The idea is that HEIs may not be able to adjust space immediately, especially given the fact that almost all the estate is held on a freehold or on long leasehold basis, so the drop in the student population will have an almost proportional effect on the space per student ratios.
Figure 4 presents the actual series and the counterfactual series under the scenario described for each of the three indicators. All series refer to the weighted sector-wide trend computed on the consistent sample of HEIs. As shown in Figure 4, the spike in the space per student ratios in 2012/13 seems to be driven almost entirely by the reduction in the student population: for total area per student and teaching space per taught student, the ratios would have continued their declining trend under the counterfactual scenario (represented by the dotted line in each case), while the ratio of support space per student would have only increased slightly.
FIGURE 4: Space per student ratios counterfactual scenario for 2012/13 (weighted average)
Note: 2003/04=100 for all series. The counterfactual scenario for 2012/13 assumes that the number of taught students would have stayed at the 2011/12 levels.Source: London Economics based on EMR data
iii. Teaching space utilisation Analysis was carried out into trends in the utilisation of teaching space. Utilisation is often measured in terms of:
• A frequency of use rate – how often rooms are used
• Occupancy rate – how full rooms are when they are in use
• Utilisation rate – a combination of the frequency and occupancy rates.
The results for the weighted average show that the frequency rate is consistently rising over time, while the occupancy rate has risen slightly. As a result the average utilisation rate rose in the period - a 9.4 per cent rise in the weighted trend.
Diamond Review Phase II 2015 April 2015 · 21
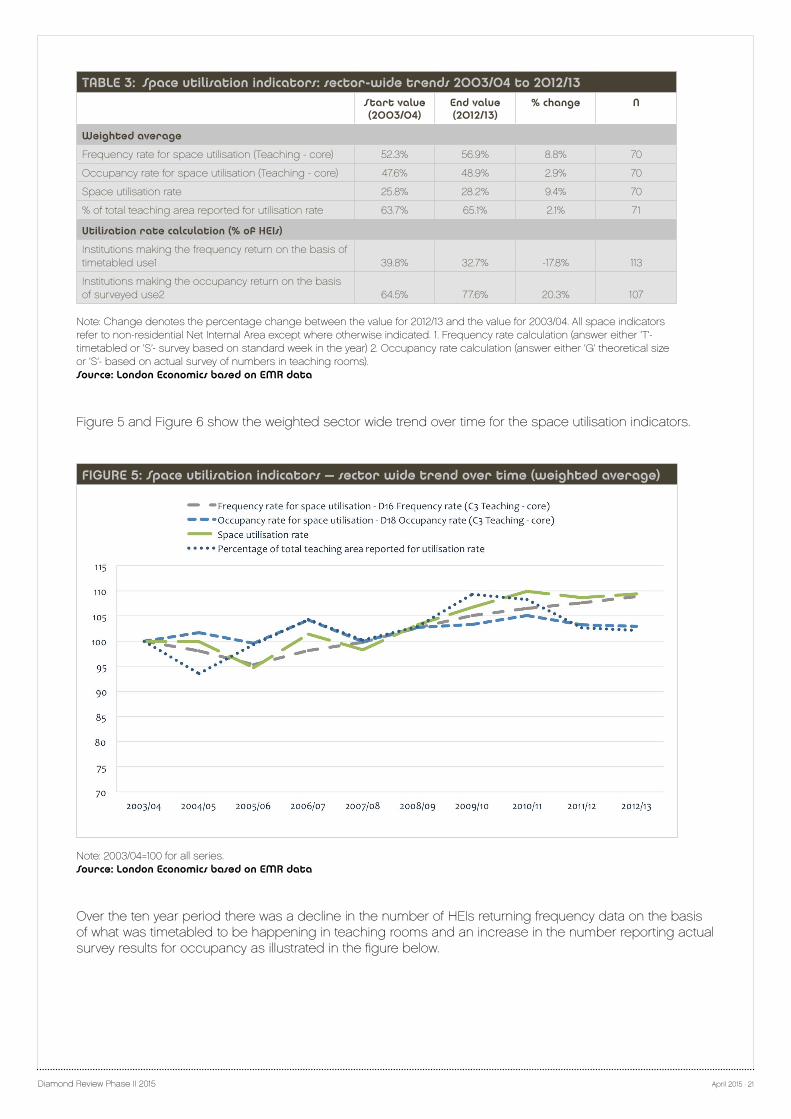
TABLE 3: Space utilisation indicators: sector-wide trends 2003/04 to 2012/13Start value (2003/04)
End value (2012/13)
% change N
Weighted average
Frequency rate for space utilisation (Teaching - core) 52.3% 56.9% 8.8% 70
Occupancy rate for space utilisation (Teaching - core) 47.6% 48.9% 2.9% 70
Space utilisation rate 25.8% 28.2% 9.4% 70
% of total teaching area reported for utilisation rate 63.7% 65.1% 2.1% 71
Utilisation rate calculation (% of HEIs)
Institutions making the frequency return on the basis of timetabled use1 39.8% 32.7% -17.8% 113
Institutions making the occupancy return on the basis of surveyed use2 64.5% 77.6% 20.3% 107
Note: Change denotes the percentage change between the value for 2012/13 and the value for 2003/04. All space indicators refer to non-residential Net Internal Area except where otherwise indicated. 1. Frequency rate calculation (answer either ‘T’- timetabled or ‘S’- survey based on standard week in the year) 2. Occupancy rate calculation (answer either ‘G’ theoretical size or ‘S’- based on actual survey of numbers in teaching rooms). Source: London Economics based on EMR data
Figure 5 and Figure 6 show the weighted sector wide trend over time for the space utilisation indicators.
FIGURE 5: Space utilisation indicators – sector wide trend over time (weighted average)
Note: 2003/04=100 for all series.Source: London Economics based on EMR data
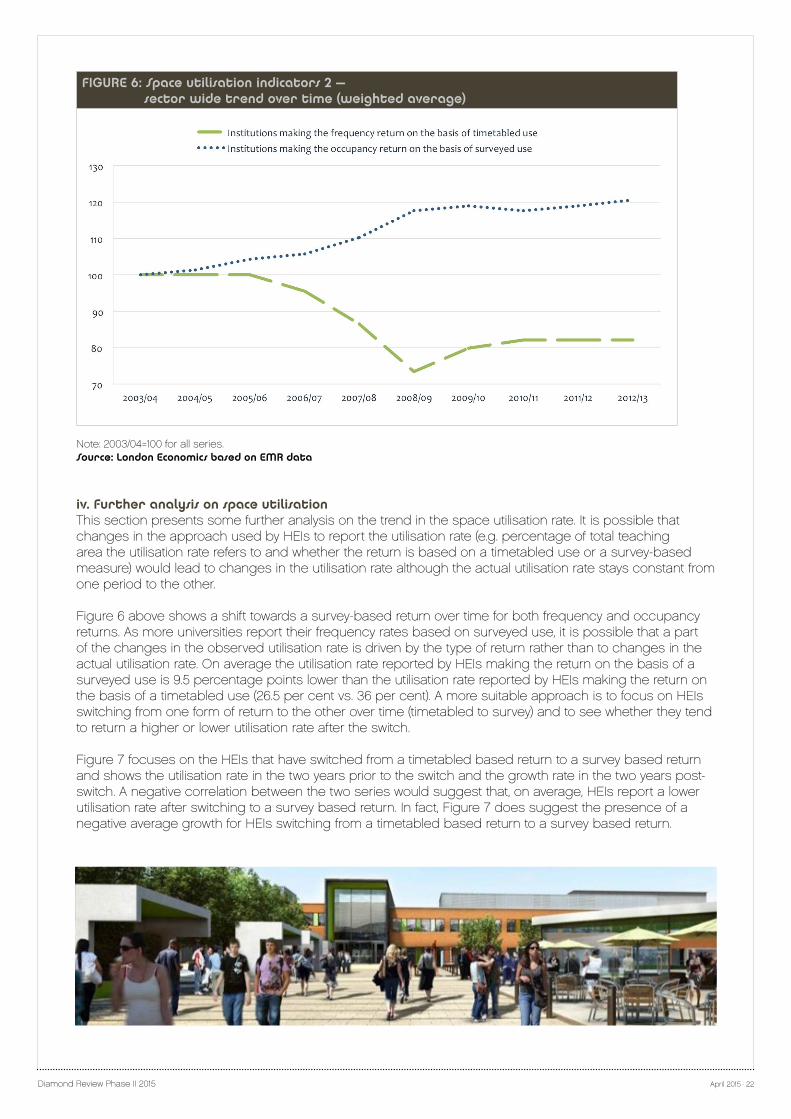
Over the ten year period there was a decline in the number of HEIs returning frequency data on the basis of what was timetabled to be happening in teaching rooms and an increase in the number reporting actual survey results for occupancy as illustrated in the figure below.
Diamond Review Phase II 2015 April 2015 · 22
FIGURE 6: Space utilisation indicators 2 – sector wide trend over time (weighted average)
Note: 2003/04=100 for all series.Source: London Economics based on EMR data
iv. Further analysis on space utilisationThis section presents some further analysis on the trend in the space utilisation rate. It is possible that changes in the approach used by HEIs to report the utilisation rate (e.g. percentage of total teaching area the utilisation rate refers to and whether the return is based on a timetabled use or a survey-based measure) would lead to changes in the utilisation rate although the actual utilisation rate stays constant from one period to the other.
Figure 6 above shows a shift towards a survey-based return over time for both frequency and occupancy returns. As more universities report their frequency rates based on surveyed use, it is possible that a part of the changes in the observed utilisation rate is driven by the type of return rather than to changes in the actual utilisation rate. On average the utilisation rate reported by HEIs making the return on the basis of a surveyed use is 9.5 percentage points lower than the utilisation rate reported by HEIs making the return on the basis of a timetabled use (26.5 per cent vs. 36 per cent). A more suitable approach is to focus on HEIs switching from one form of return to the other over time (timetabled to survey) and to see whether they tend to return a higher or lower utilisation rate after the switch.
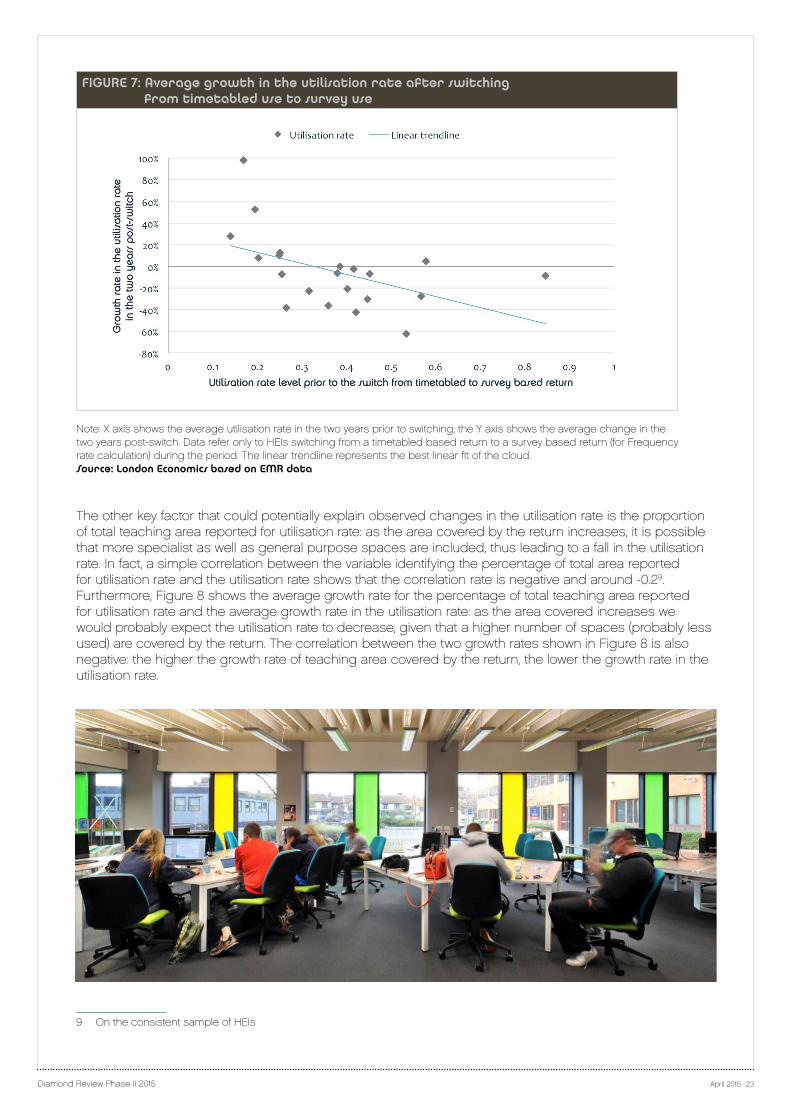
Figure 7 focuses on the HEIs that have switched from a timetabled based return to a survey based return and shows the utilisation rate in the two years prior to the switch and the growth rate in the two years post-switch. A negative correlation between the two series would suggest that, on average, HEIs report a lower utilisation rate after switching to a survey based return. In fact, Figure 7 does suggest the presence of a negative average growth for HEIs switching from a timetabled based return to a survey based return.
Diamond Review Phase II 2015 April 2015 · 23
FIGURE 7: Average growth in the utilisation rate after switching from timetabled use to survey use
Note: X axis shows the average utilisation rate in the two years prior to switching; the Y axis shows the average change in the two years post-switch. Data refer only to HEIs switching from a timetabled based return to a survey based return (for Frequency rate calculation) during the period. The linear trendline represents the best linear fit of the cloud.Source: London Economics based on EMR data
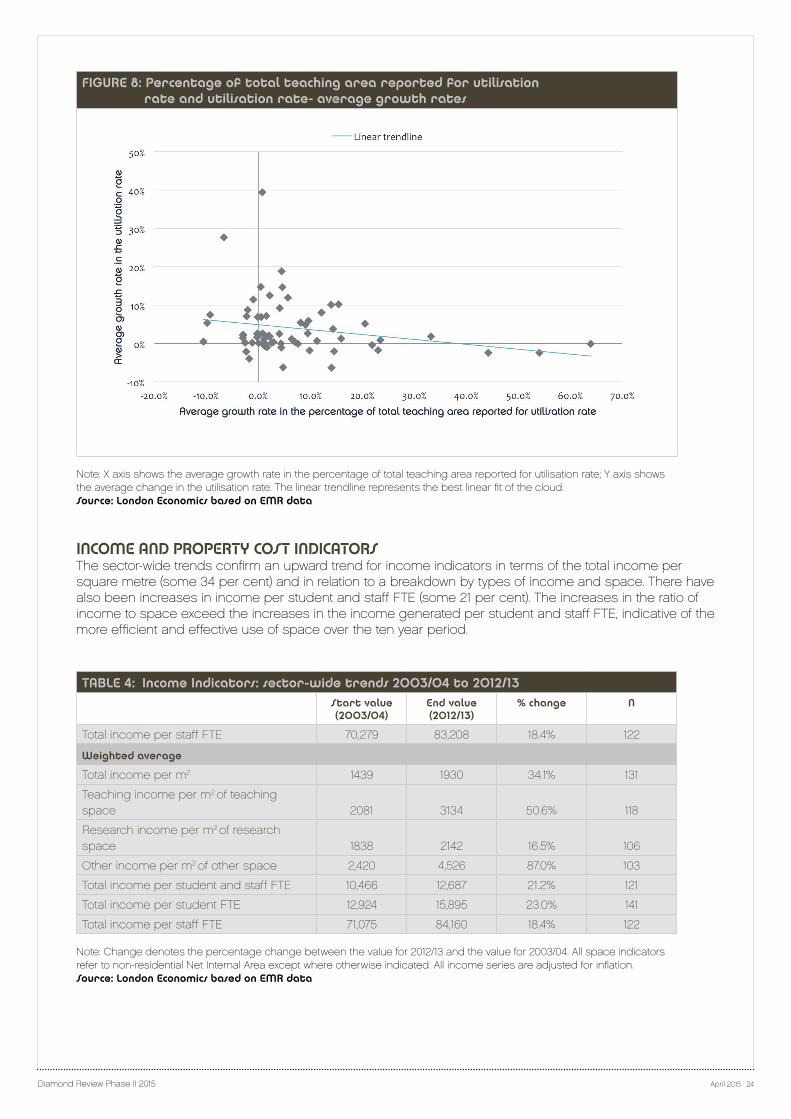
The other key factor that could potentially explain observed changes in the utilisation rate is the proportion of total teaching area reported for utilisation rate: as the area covered by the return increases, it is possible that more specialist as well as general purpose spaces are included, thus leading to a fall in the utilisation rate. In fact, a simple correlation between the variable identifying the percentage of total area reported for utilisation rate and the utilisation rate shows that the correlation rate is negative and around -0.29. Furthermore, Figure 8 shows the average growth rate for the percentage of total teaching area reported for utilisation rate and the average growth rate in the utilisation rate: as the area covered increases we would probably expect the utilisation rate to decrease, given that a higher number of spaces (probably less used) are covered by the return. The correlation between the two growth rates shown in Figure 8 is also negative: the higher the growth rate of teaching area covered by the return, the lower the growth rate in the utilisation rate.
9 On the consistent sample of HEIs
Diamond Review Phase II 2015 April 2015 · 24
FIGURE 8: Percentage of total teaching area reported for utilisation rate and utilisation rate- average growth rates
Note: X axis shows the average growth rate in the percentage of total teaching area reported for utilisation rate; Y axis shows the average change in the utilisation rate. The linear trendline represents the best linear fit of the cloud.Source: London Economics based on EMR data
INCOME AND PROPERTY COST INDICATORSThe sector-wide trends confirm an upward trend for income indicators in terms of the total income per square metre (some 34 per cent) and in relation to a breakdown by types of income and space. There have also been increases in income per student and staff FTE (some 21 per cent). The increases in the ratio of income to space exceed the increases in the income generated per student and staff FTE, indicative of the more efficient and effective use of space over the ten year period.
TABLE 4: Income Indicators: sector-wide trends 2003/04 to 2012/13Start value (2003/04)
End value (2012/13)
% change N
Total income per staff FTE 70,279 83,208 18.4% 122
Weighted average
Total income per m2 1439 1930 34.1% 131
Teaching income per m2 of teaching space 2081 3134 50.6% 118
Research income per m2 of research space 1838 2142 16.5% 106
Other income per m2 of other space 2,420 4,526 87.0% 103
Total income per student and staff FTE 10,466 12,687 21.2% 121
Total income per student FTE 12,924 15,895 23.0% 141
Total income per staff FTE 71,075 84,160 18.4% 122 Note: Change denotes the percentage change between the value for 2012/13 and the value for 2003/04. All space indicators refer to non-residential Net Internal Area except where otherwise indicated. All income series are adjusted for inflation. Source: London Economics based on EMR data
Diamond Review Phase II 2015 April 2015 · 25
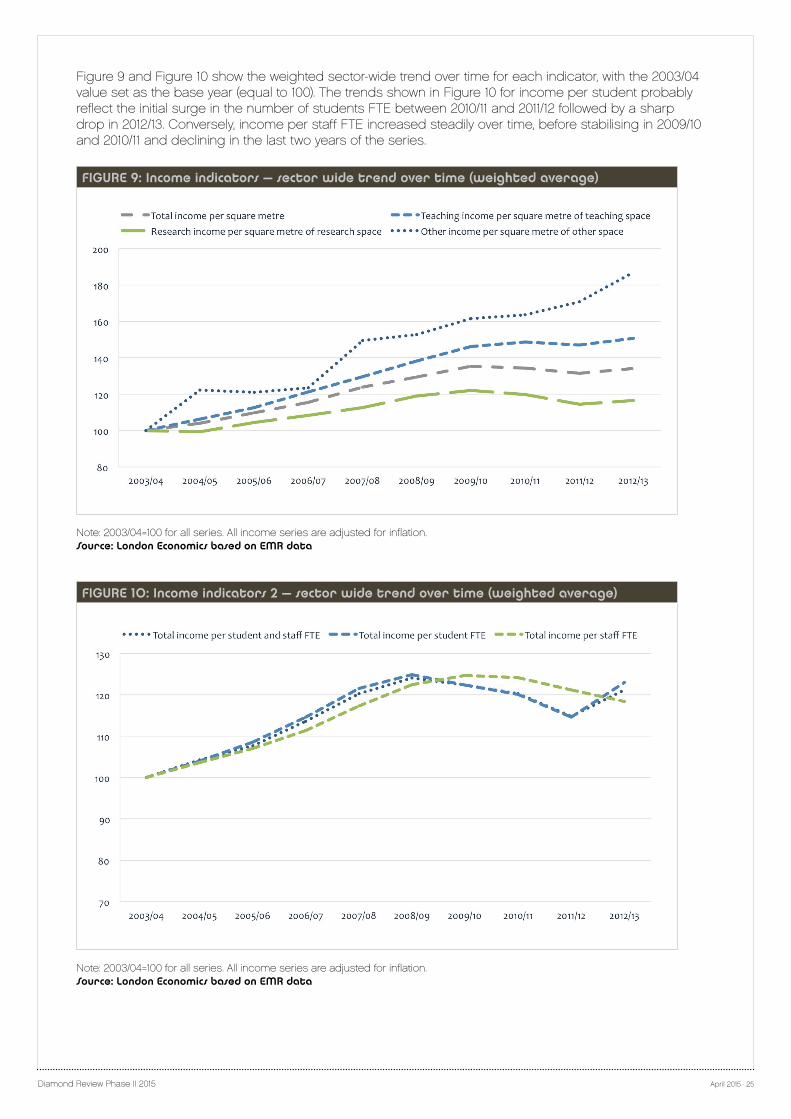
Figure 9 and Figure 10 show the weighted sector-wide trend over time for each indicator, with the 2003/04 value set as the base year (equal to 100). The trends shown in Figure 10 for income per student probably reflect the initial surge in the number of students FTE between 2010/11 and 2011/12 followed by a sharp drop in 2012/13. Conversely, income per staff FTE increased steadily over time, before stabilising in 2009/10 and 2010/11 and declining in the last two years of the series.
FIGURE 9: Income indicators – sector wide trend over time (weighted average)
Note: 2003/04=100 for all series. All income series are adjusted for inflation. Source: London Economics based on EMR data
FIGURE 10: Income indicators 2 – sector wide trend over time (weighted average)
Note: 2003/04=100 for all series. All income series are adjusted for inflation. Source: London Economics based on EMR data
Diamond Review Phase II 2015 April 2015 · 26
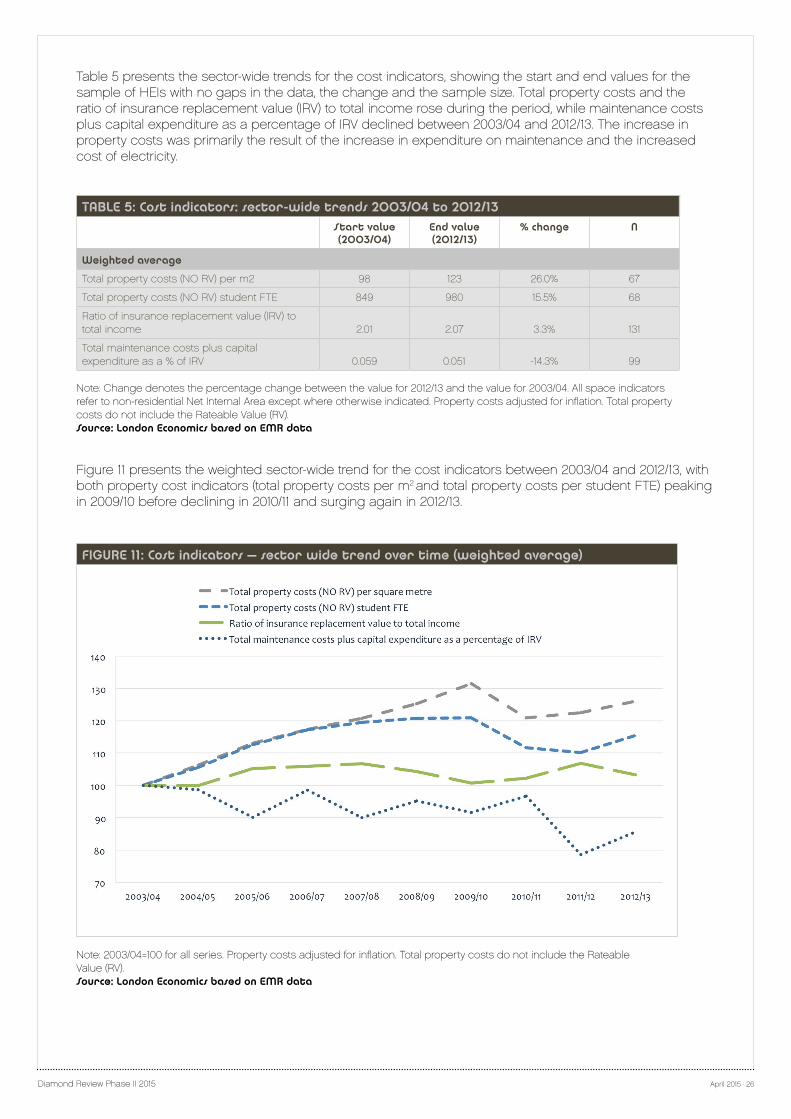
Table 5 presents the sector-wide trends for the cost indicators, showing the start and end values for the sample of HEIs with no gaps in the data, the change and the sample size. Total property costs and the ratio of insurance replacement value (IRV) to total income rose during the period, while maintenance costs plus capital expenditure as a percentage of IRV declined between 2003/04 and 2012/13. The increase in property costs was primarily the result of the increase in expenditure on maintenance and the increased cost of electricity.
TABLE 5: Cost indicators: sector-wide trends 2003/04 to 2012/13Start value (2003/04)
End value (2012/13)
% change N
Weighted average
Total property costs (NO RV) per m2 98 123 26.0% 67
Total property costs (NO RV) student FTE 849 980 15.5% 68
Ratio of insurance replacement value (IRV) to total income 2.01 2.07 3.3% 131
Total maintenance costs plus capital expenditure as a % of IRV 0.059 0.051 -14.3% 99
Note: Change denotes the percentage change between the value for 2012/13 and the value for 2003/04. All space indicators refer to non-residential Net Internal Area except where otherwise indicated. Property costs adjusted for inflation. Total property costs do not include the Rateable Value (RV). Source: London Economics based on EMR data
Figure 11 presents the weighted sector-wide trend for the cost indicators between 2003/04 and 2012/13, with both property cost indicators (total property costs per m2 and total property costs per student FTE) peaking in 2009/10 before declining in 2010/11 and surging again in 2012/13.
FIGURE 11: Cost indicators – sector wide trend over time (weighted average)
Note: 2003/04=100 for all series. Property costs adjusted for inflation. Total property costs do not include the Rateable Value (RV). Source: London Economics based on EMR data

4IMPACT OF EFFICIENCY GAINS The work stream considered the question of what would have happened to property costs (recurrent and capital) and carbon emissions if the sector had not made the efficiency gains in space use reported in Section 3, but had still experienced the same expansion in student numbers over the ten years from 2003-04 to 2012-13.
Diamond Review Phase II 2015 April 2015 · 28
APPROACH TO THE ASSESSMENTEMR data was analysed to:
• Estimate what the size of the non-residential estate would have been had the sector not delivered efficiencies in space use (using the net internal area per student FTE as the principal measure of efficiency) over the period 2003-04 to 2012-13
• Estimate what the additional operating costs would have been for the enlarged size of the non-residential estate compared with the actual size of the estate
• Estimate what additional capital costs of construction would have been incurred to achieve the required size of the estate in the absence of efficiency gains
• Estimate the additional level of carbon emissions that would have been produced if HEIs had not made efficiencies in space use.
None of the cost estimates are adjusted for inflation. Thus, the cost estimates reported below provide an estimate of the year on year additional cash spending that would have been required in the absence of efficiency gains in space usage.
NO EFFICIENCY GAIN SCENARIO - ESTIMATED IMPACT ON SIZE OF THE ESTATEFor each HEI with no data gaps in net internal non-residential area (130 HEIs) over the period 2003/04 to 2012/13, an alternative scenario was derived for the estate size keeping fixed the space (NIA) per FTE student ratio at the 2003/04 values. This alternative scenario is referred to as the ‘no efficiency gain’ scenario in the discussion below.
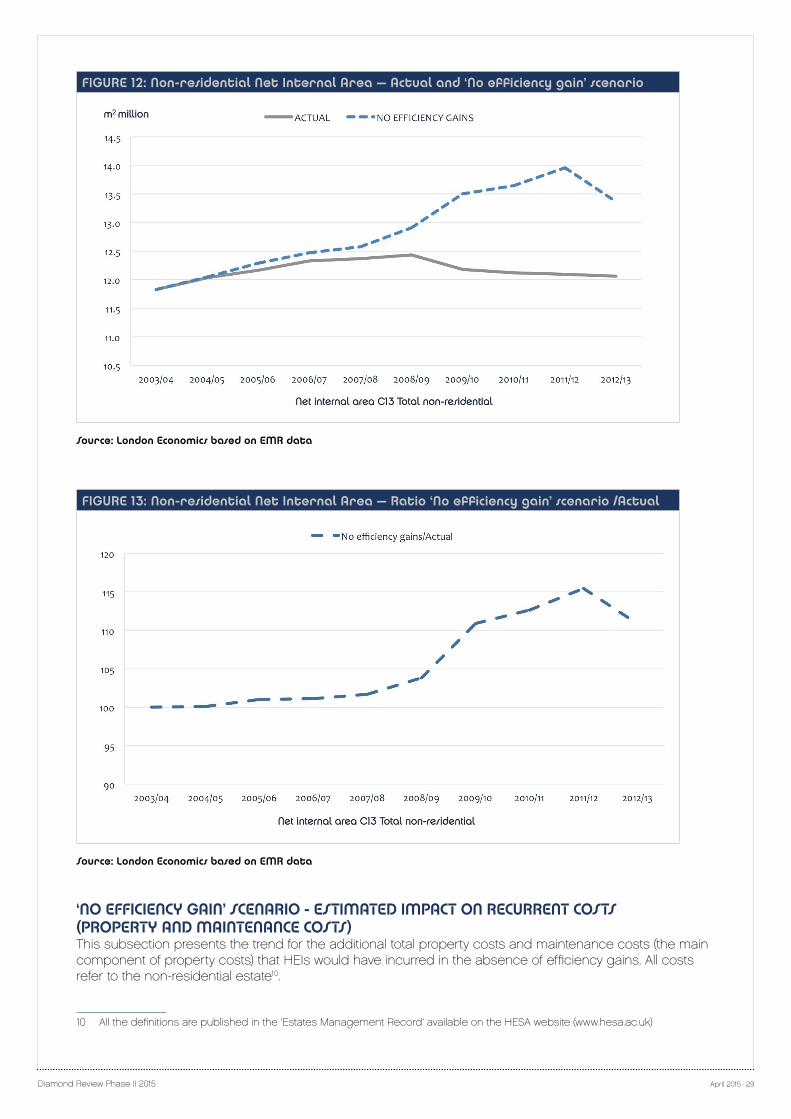
This resulting size was then purely driven by the growth in the number of FTE students over time.The sector wide resulting estate was generated as the sum of the estate sizes under the ‘no efficiency gain’ scenario across all HEIs with no gaps in the data. Figure 12 presents the size of the actual non-residential estate (NIA) and the size of the estate under the ‘no efficiency gain’ scenario. In order to illustrate the amount of additional space that would have been required in the absence of any efficiency gains, Figure 13 shows the ratio of the estate in the ‘no efficiency gain’ scenario size to the actual size of the estate.
In the absence of efficiency gains in space usage, HEIs would have needed more than 10 per cent additional space in 2012/13 (corresponding to around 1.31 million square metres for the entire sector).
The figure for 2011/12 was even higher (around 15 per cent additional space corresponding to 1.87 million square metres). In 2012/13, the amount of additional space that would have been required is somewhat lower due the fall in the number of FTE students between 2011/12 and 2012/13.
Diamond Review Phase II 2015 April 2015 · 29
FIGURE 12: Non-residential Net Internal Area – Actual and ‘No efficiency gain’ scenario
Source: London Economics based on EMR data
FIGURE 13: Non-residential Net Internal Area – Ratio ‘No efficiency gain’ scenario /Actual
Source: London Economics based on EMR data
‘NO EFFICIENCY GAIN’ SCENARIO - ESTIMATED IMPACT ON RECURRENT COSTS (PROPERTY AND MAINTENANCE COSTS)This subsection presents the trend for the additional total property costs and maintenance costs (the main component of property costs) that HEIs would have incurred in the absence of efficiency gains. All costs refer to the non-residential estate10.
10 All the definitions are published in the ‘Estates Management Record’ available on the HESA website (www.hesa.ac.uk)
Diamond Review Phase II 2015 April 2015 · 30
Total property costs include energy costs (electricity, gas, oil, coal, steam and hot water, other fuels), water and sewerage costs, internal and external property management costs, cleaning costs, maintenance costs, net service charges, rates paid and insurance premium, but exclude the rateable value of the estate.
Total property costs under the ‘no efficiency gain’ scenario were first estimated on the sample of HEIs with no data gaps in the EMR with regards to property costs over the period 2003/04 to 2012/2013. This sample includes 66 HEIs.
To estimate the sector-wide property costs under the ‘no efficiency gain’ scenario, first, the actual property costs per square metre times were multiplied by the size of the ‘no efficiency gain’ non-residential estate of the 66 HEIs. Next, to generate a sector-wide estimate (for all HEIs with no data gaps in the NIA), any missing values were imputed using the average computed on the non-missing observations.
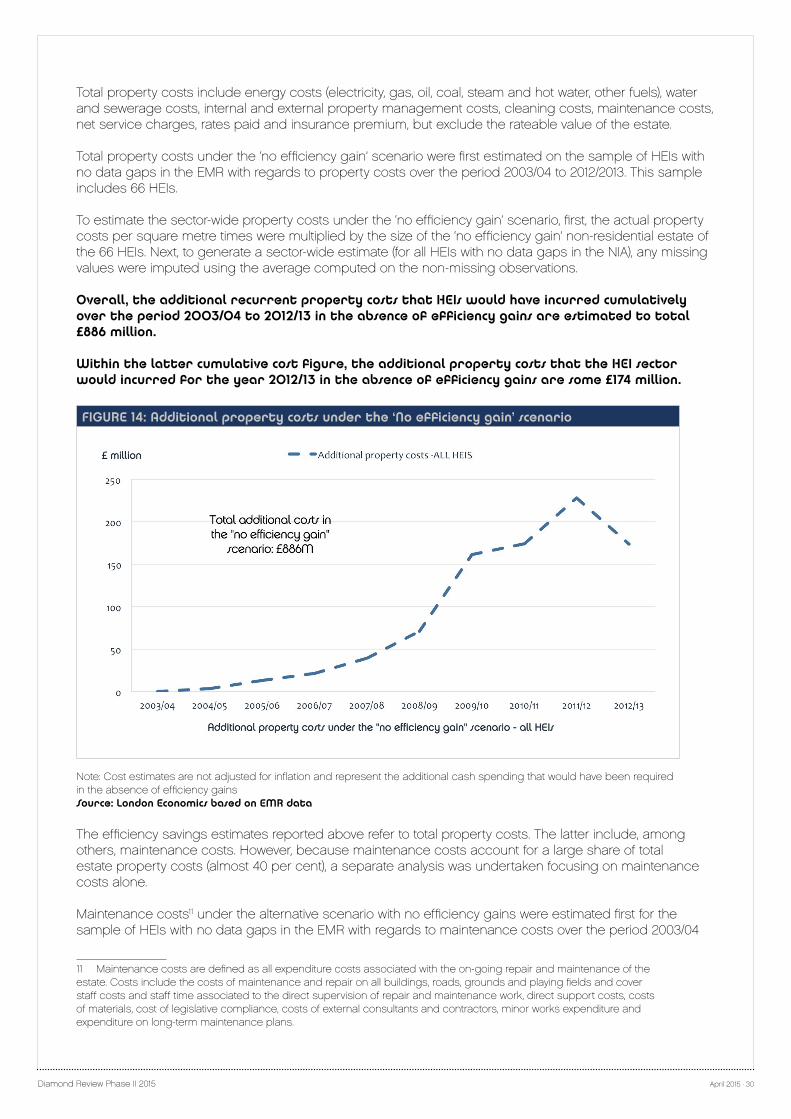
Overall, the additional recurrent property costs that HEIs would have incurred cumulatively over the period 2003/04 to 2012/13 in the absence of efficiency gains are estimated to total £886 million.
Within the latter cumulative cost figure, the additional property costs that the HEI sector would incurred for the year 2012/13 in the absence of efficiency gains are some £174 million.
FIGURE 14: Additional property costs under the ‘No efficiency gain’ scenario
Note: Cost estimates are not adjusted for inflation and represent the additional cash spending that would have been required in the absence of efficiency gainsSource: London Economics based on EMR data
The efficiency savings estimates reported above refer to total property costs. The latter include, among others, maintenance costs. However, because maintenance costs account for a large share of total estate property costs (almost 40 per cent), a separate analysis was undertaken focusing on maintenance costs alone.
Maintenance costs11 under the alternative scenario with no efficiency gains were estimated first for the sample of HEIs with no data gaps in the EMR with regards to maintenance costs over the period 2003/04
11 Maintenance costs are defined as all expenditure costs associated with the on-going repair and maintenance of the estate. Costs include the costs of maintenance and repair on all buildings, roads, grounds and playing fields and cover staff costs and staff time associated to the direct supervision of repair and maintenance work, direct support costs, costs of materials, cost of legislative compliance, costs of external consultants and contractors, minor works expenditure and expenditure on long-term maintenance plans.
Diamond Review Phase II 2015 April 2015 · 31
to 2012/13. This sample includes 110 HEIs.
To estimate maintenance property costs under the ‘no efficiency gain’ scenario, actual maintenance costs per square metre were multiplied by the ‘no efficiency gain’ size. Next, to generate estimate for maintenance costs for all HEIs with no NIA data gaps in the EMR, missing values were imputed using the average computed on the non-missing observations.
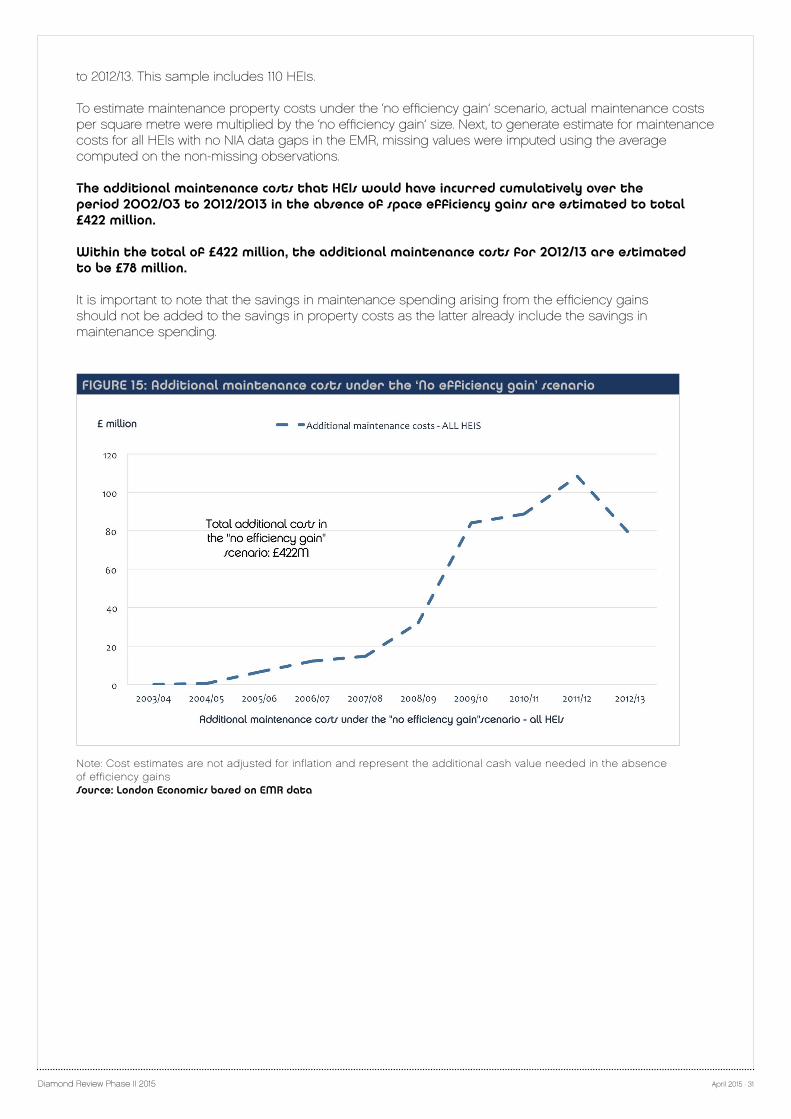
The additional maintenance costs that HEIs would have incurred cumulatively over the period 2002/03 to 2012/2013 in the absence of space efficiency gains are estimated to total £422 million.
Within the total of £422 million, the additional maintenance costs for 2012/13 are estimated to be £78 million.
It is important to note that the savings in maintenance spending arising from the efficiency gains should not be added to the savings in property costs as the latter already include the savings in maintenance spending.
FIGURE 15: Additional maintenance costs under the ‘No efficiency gain’ scenario
Note: Cost estimates are not adjusted for inflation and represent the additional cash value needed in the absence of efficiency gainsSource: London Economics based on EMR data
Diamond Review Phase II 2015 April 2015 · 32
‘NO EFFICIENCY GAIN’ SCENARIO – ESTIMATED IMPACT ON CAPITAL SPENDINGThe additional annual capital expenditure12 that would have been incurred in the absence of any space efficiency gains over the period 2012/13 reflect the annual change in the non-residential area under the ‘no efficiency gain’ scenario (shown in Figure 12). In other words, any increase in the required space in the ‘no efficiency gain’ scenario was assumed to be met by new capital spending in the same year. The additional capital spending in the ‘no efficiency scenario’ refers only to additional spending on buildings (expansion of existing building and new build).
Whenever the required space decreased in the ‘no efficiency gain’ scenario because of reductions in the number of FTE students, no additional capital spending was incurred. In addition, no revenues from disposals were accrued because it was assumed that HEIs would not reduce their estate due to the high likelihood that the fall in the number of student FTEs would be viewed as transitory.
The cost per square metre of additional space was assumed to be equal to the Insurance Replacement Value13 per square metre of gross internal area. The total additional capital expenditure was computed in relation the additional gross internal area required.
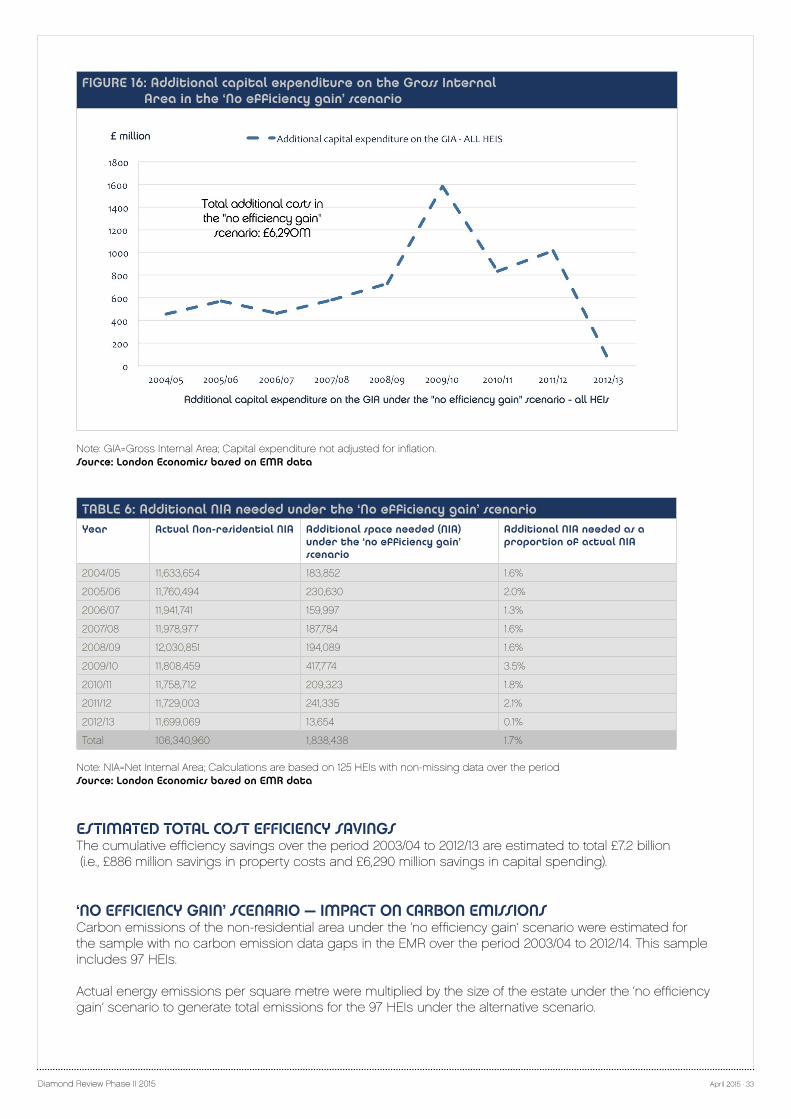
Cumulatively, in the absence of space efficiencies, total additional capital expenditure over the period 2003/04 to 2012/13 would have been around £6,290 million.
The estimated capital expenditure figure assumes that HEIs would have built (or bought) new space in response to an increase in the number of students. However, HEIs may also decide to lease the additional space needed, especially if they expect the increase to be temporary.
Table 6 shows actual Net Internal Area (for the sample with no gaps in the data for space and Insurance Replacement Value), additional NIA needed and the additional NIA needed as a proportion of actual NIA.
12 According to the Estates Management Record, ‘Capital expenditure covers all expenditure which increases the value of an HEI’s fixed assets, including the purchase of land, buildings, and those items of equipment which are included in the HEI’s register of fixed assets and shown in the balance sheet’. In particular, non-residential capital expenditure ‘includes capital expenditure incurred on non-residential, non-catering and non-conference land and building projects’, 13 The Insurance Replacement Value is defined in the Estates Management Record as ‘the current cost of re-building the property to a standard similar to that of the existing, subject to appropriate allowances being made for any extra work which may be required as a result of physical conditions or statutory provisions, such as changes in building regulations. It does not record the value for which the property is insured’
Diamond Review Phase II 2015 April 2015 · 33
FIGURE 16: Additional capital expenditure on the Gross Internal Area in the ‘No efficiency gain’ scenario
Note: GIA=Gross Internal Area; Capital expenditure not adjusted for inflation. Source: London Economics based on EMR data
TABLE 6: Additional NIA needed under the ‘No efficiency gain’ scenarioYear Actual Non-residential NIA Additional space needed (NIA)
under the ‘no efficiency gain’ scenario
Additional NIA needed as a proportion of actual NIA
2004/05 11,633,654 183,852 1.6%
2005/06 11,760,494 230,630 2.0%
2006/07 11,941,741 159,997 1.3%
2007/08 11,978,977 187,784 1.6%
2008/09 12,030,851 194,089 1.6%
2009/10 11,808,459 417,774 3.5%
2010/11 11,758,712 209,323 1.8%
2011/12 11,729,003 241,335 2.1%
2012/13 11,699,069 13,654 0.1%
Total 106,340,960 1,838,438 1.7% Note: NIA=Net Internal Area; Calculations are based on 125 HEIs with non-missing data over the periodSource: London Economics based on EMR data
ESTIMATED TOTAL COST EFFICIENCY SAVINGSThe cumulative efficiency savings over the period 2003/04 to 2012/13 are estimated to total £7.2 billion (i.e., £886 million savings in property costs and £6,290 million savings in capital spending).
‘NO EFFICIENCY GAIN’ SCENARIO – IMPACT ON CARBON EMISSIONSCarbon emissions of the non-residential area under the ‘no efficiency gain’ scenario were estimated for the sample with no carbon emission data gaps in the EMR over the period 2003/04 to 2012/14. This sample includes 97 HEIs.
Actual energy emissions per square metre were multiplied by the size of the estate under the ‘no efficiency gain’ scenario to generate total emissions for the 97 HEIs under the alternative scenario.
Diamond Review Phase II 2015 April 2015 · 34
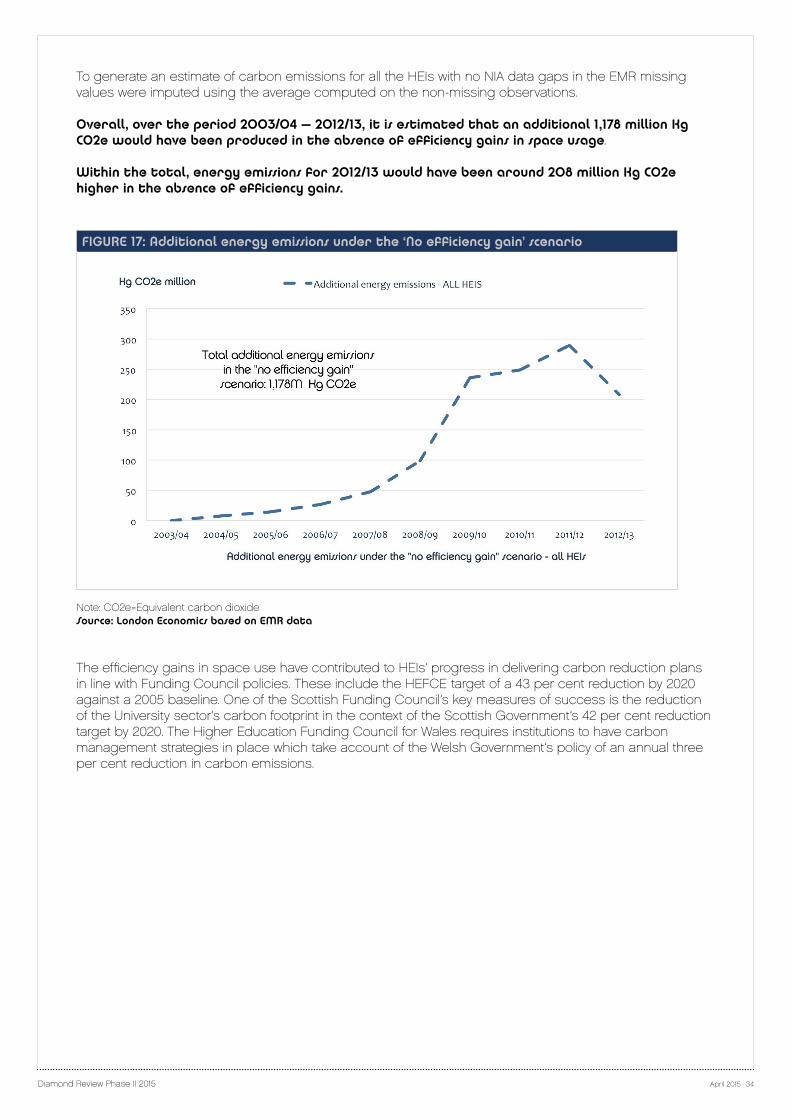
To generate an estimate of carbon emissions for all the HEIs with no NIA data gaps in the EMR missing values were imputed using the average computed on the non-missing observations.
Overall, over the period 2003/04 – 2012/13, it is estimated that an additional 1,178 million Kg CO2e would have been produced in the absence of efficiency gains in space usage.
Within the total, energy emissions for 2012/13 would have been around 208 million Kg CO2e higher in the absence of efficiency gains.
FIGURE 17: Additional energy emissions under the ‘No efficiency gain’ scenario
Note: CO2e=Equivalent carbon dioxideSource: London Economics based on EMR data
The efficiency gains in space use have contributed to HEIs’ progress in delivering carbon reduction plans in line with Funding Council policies. These include the HEFCE target of a 43 per cent reduction by 2020 against a 2005 baseline. One of the Scottish Funding Council’s key measures of success is the reduction of the University sector’s carbon footprint in the context of the Scottish Government’s 42 per cent reduction target by 2020. The Higher Education Funding Council for Wales requires institutions to have carbon management strategies in place which take account of the Welsh Government’s policy of an annual three per cent reduction in carbon emissions.

5CASE STUDIESThe six case studies presented here illustrate how individual institutions are making efficiency gains. They also show how they are working to deliver estates, support student and staff experience and attainment, accommodate changing practice and benefit the national economy and local economies and communities.
Diamond Review Phase II 2015 April 2015 · 36
This section provides a summary of each case study and discusses the existing and projected impact of the actions taken by the six institutions which have kindly participated in the project:
Coventry University – Engineering and Computing BuildingImperial College – Imperial WestLoughborough University – new uses for a historic buildingManchester Metropolitan University – delivering the strategyUniversity of Strathclyde – Technology and Innovation CentreUniversity of Sunderland – Sciences Complex Refurbishment Project
The case studies focus on different scales and types of projects designed to meet a range of objectives.
• Supporting the evolving needs of students
• Creating efficient and effective working environments for staff
• Supporting collaboration and efficiency with versatile space that can used by different disciplines
• A major drive to improve the quality to meet needs and expectations
• The importance of major projects as forces for change in supporting regeneration, local communities and creating enabling environments for research and business to work together
• The role of universities as custodians of the built heritage
The full text for the studies is available in the companion report Case Studies of Delivering Value from the Higher Education Estate available to download on the AUDE website.
Diamond Review Phase II 2015 April 2015 · 37
COVENTRY UNIVERSITY - ENGINEERING AND COMPUTING BUILDINGKey points:
• New fit for purpose, accessible space to replace dispersed and outdated accommodation and accommodate growth for the Faculty of Engineering and Computing
• Space that promotes increased levels of collaboration and engagement between departments, staff, students and visitors
• Space designed to support the Faculty’s Activity Led Learning approach to teaching
• Very positive student feedback and increased utilisation
• Flexibility in the use of general purpose and specialist space
• Year-round use
• Shared staff accommodation supporting different ways of working
• Environmental sustainability – BREEAM excellent building.
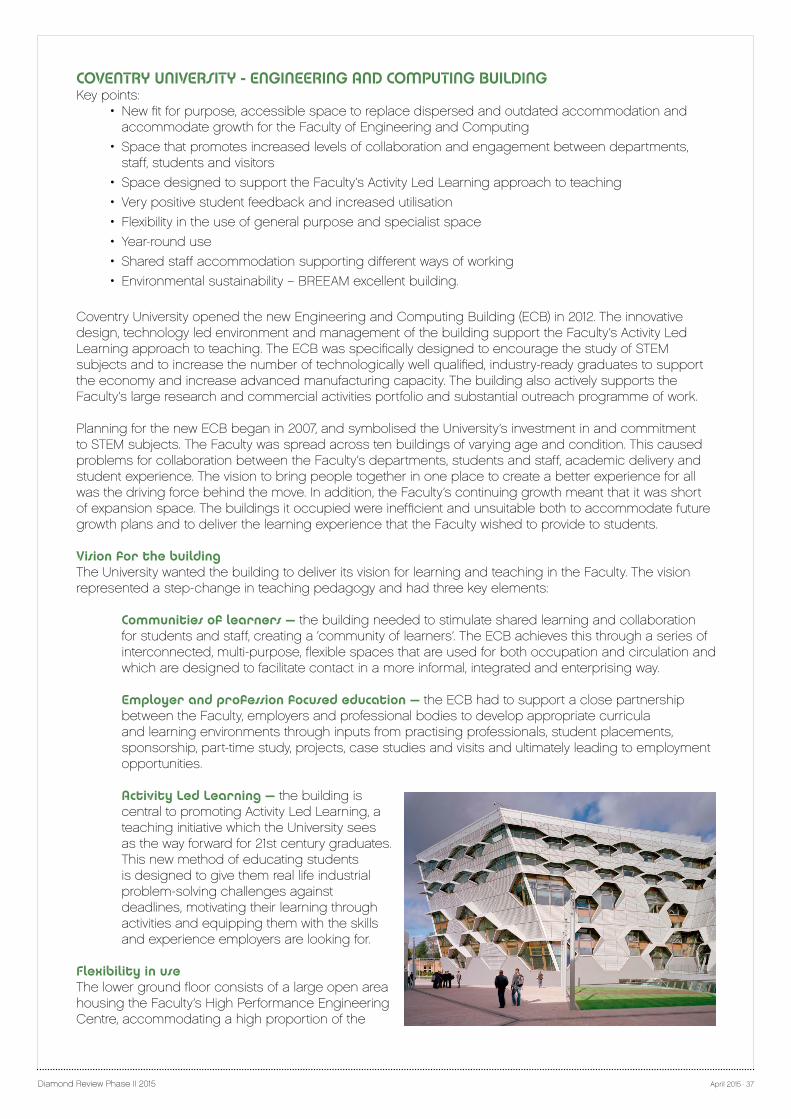
Coventry University opened the new Engineering and Computing Building (ECB) in 2012. The innovative design, technology led environment and management of the building support the Faculty’s Activity Led Learning approach to teaching. The ECB was specifically designed to encourage the study of STEM subjects and to increase the number of technologically well qualified, industry-ready graduates to support the economy and increase advanced manufacturing capacity. The building also actively supports the Faculty’s large research and commercial activities portfolio and substantial outreach programme of work.
Planning for the new ECB began in 2007, and symbolised the University’s investment in and commitment to STEM subjects. The Faculty was spread across ten buildings of varying age and condition. This caused problems for collaboration between the Faculty’s departments, students and staff, academic delivery and student experience. The vision to bring people together in one place to create a better experience for all was the driving force behind the move. In addition, the Faculty’s continuing growth meant that it was short of expansion space. The buildings it occupied were inefficient and unsuitable both to accommodate future growth plans and to deliver the learning experience that the Faculty wished to provide to students.
Vision for the buildingThe University wanted the building to deliver its vision for learning and teaching in the Faculty. The vision represented a step-change in teaching pedagogy and had three key elements:
Communities of learners – the building needed to stimulate shared learning and collaboration for students and staff, creating a ‘community of learners’. The ECB achieves this through a series of interconnected, multi-purpose, flexible spaces that are used for both occupation and circulation and which are designed to facilitate contact in a more informal, integrated and enterprising way.
Employer and profession focused education – the ECB had to support a close partnership between the Faculty, employers and professional bodies to develop appropriate curricula and learning environments through inputs from practising professionals, student placements, sponsorship, part-time study, projects, case studies and visits and ultimately leading to employment opportunities.
Activity Led Learning – the building is central to promoting Activity Led Learning, a teaching initiative which the University sees as the way forward for 21st century graduates. This new method of educating students is designed to give them real life industrial problem-solving challenges against deadlines, motivating their learning through activities and equipping them with the skills and experience employers are looking for.
Flexibility in useThe lower ground floor consists of a large open area housing the Faculty’s High Performance Engineering Centre, accommodating a high proportion of the
Diamond Review Phase II 2015 April 2015 · 38
Faculty’s specialist equipment. This arrangement both enhances and facilitates the interaction among a range of different disciplines (for example, between Mechanical, Aerospace, Manufacturing and Automotive Engineering). The design of the space allows specialist equipment and associated facilities to be moved around and new requirements accommodated without the constraints of walls, fixed room sizes and services.
General teaching rooms are designed to support different delivery styles and activities and offer a degree of flexibility. The rooms do not have a traditional, linear ‘front-facing’ design, but are instead laid out as an integrated space with shaped tables accommodating groups of either six or nine.
Year round useThe building is well used not only during the core semester weeks, but throughout the year. Because the University has student intakes in January as well as September, teaching takes place year round. Over the summer, the building is the base for a substantial programme of STEM master classes and outreach activity with local schools and partners. It provides an excellent environment for CPD events and for a variety of interactions with SMEs. The building is also in demand across the University for hosting conferences and other activities.
In the first year of operation, to enhance student experience, a pilot project was carried out to extend the opening times of the building, keeping it open 24/7 for a six week period before exams. The success of the pilot has led to the building now regularly operating extended opening hours at weekends between January and June each year and for a six week period prior to final coursework and project submissions and exams operating on a 24/7 basis.
Staff accommodationBefore they moved into the new building, staff were located in a variety of office types, with many in single offices. A new approach to staff workspaces was taken focused on increasing staff interactions, making different functional spaces available to staff that they would move through during their working day and ensuring a consistency of provision for all. This approach was articulated with new language to describe these functional spaces: personal; private; and conversation space.
Student feedbackThe ECB has been well received by students and has a ‘pull’ factor in attracting large numbers to open days. In the two years that the ECB has been in operation the number of students attending Applicant Experience Open Days has increased significantly, and Post Applicant Open Day attendees have risen from 607 in 2012 to 1,436 in 2014. The University has found that both student and staff satisfaction levels have increased, with the building cited as a direct influence on this.
Using the building to develop student employability and business engagementThe excellent facilities available within the ECB have allowed EC Futures, the Faculty’s dedicated employability unit, to host larger scale events, host employers and facilitate more student interaction with industry. The flexible exhibition space within the ECB enables the Faculty to run large scale Engineering and Computing Careers Fairs that are free for employers, allowing it to attract a large and diverse pool of employers that would not otherwise target Coventry University.
The facilities in the ECB also support the way that the Faculty engages with businesses through conferences, exhibitions, workshops and presentations. Business feedback on the building is very positive. For example, the Manufacturing Technology Centre said: ‘The Engineering and Computing Building is an inspirational space that will help facilitate the development of future engineers.’ The building was also the inspiration for a new University collaboration with Unipart Manufacturing Group.
Diamond Review Phase II 2015 April 2015 · 39
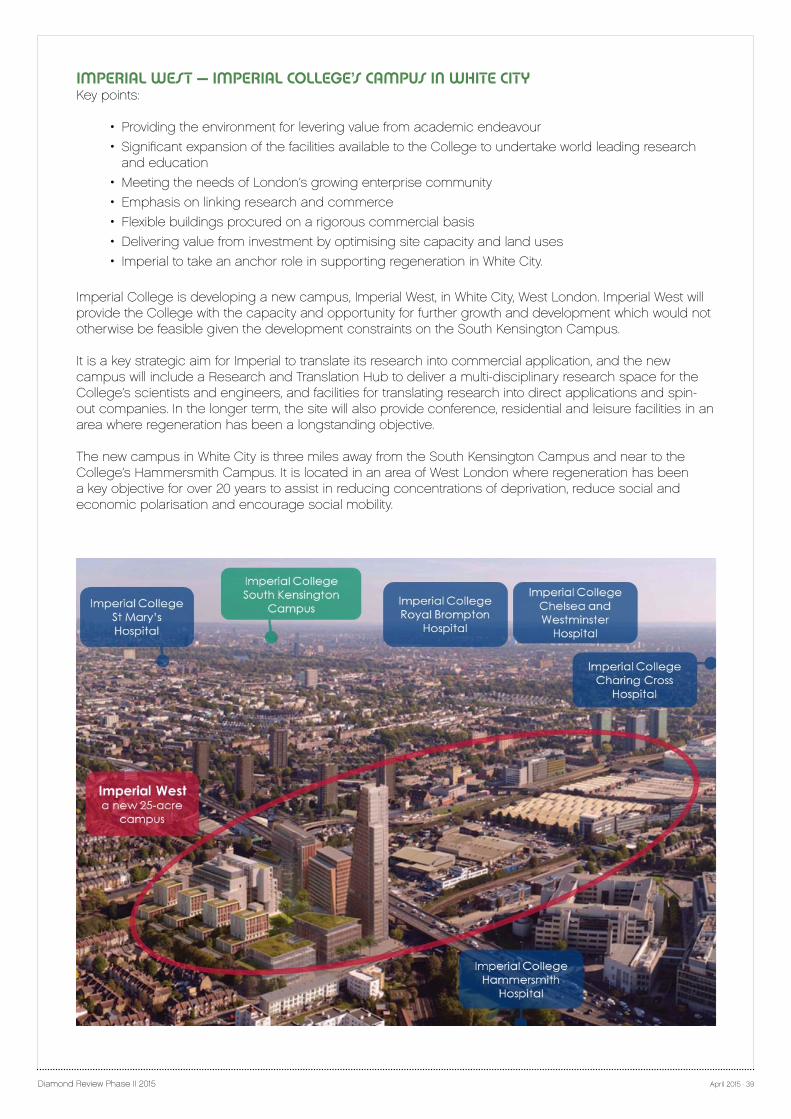
IMPERIAL WEST – IMPERIAL COLLEGE’S CAMPUS IN WHITE CITYKey points:
• Providing the environment for levering value from academic endeavour
• Significant expansion of the facilities available to the College to undertake world leading research and education
• Meeting the needs of London’s growing enterprise community
• Emphasis on linking research and commerce
• Flexible buildings procured on a rigorous commercial basis
• Delivering value from investment by optimising site capacity and land uses
• Imperial to take an anchor role in supporting regeneration in White City.
Imperial College is developing a new campus, Imperial West, in White City, West London. Imperial West will provide the College with the capacity and opportunity for further growth and development which would not otherwise be feasible given the development constraints on the South Kensington Campus.
It is a key strategic aim for Imperial to translate its research into commercial application, and the new campus will include a Research and Translation Hub to deliver a multi-disciplinary research space for the College’s scientists and engineers, and facilities for translating research into direct applications and spin-out companies. In the longer term, the site will also provide conference, residential and leisure facilities in an area where regeneration has been a longstanding objective.
The new campus in White City is three miles away from the South Kensington Campus and near to the College’s Hammersmith Campus. It is located in an area of West London where regeneration has been a key objective for over 20 years to assist in reducing concentrations of deprivation, reduce social and economic polarisation and encourage social mobility.
Diamond Review Phase II 2015 April 2015 · 40
The vision for Imperial WestThe Imperial West vision expands on the success of the main campus in South Kensington and will create an open access academic campus that will provide the physical infrastructure for teaching, research, translation, commercialisation and collaborative activities. The campus will co-locate world class researchers, businesses and higher education partners to create value on a local, national and global scale.
A key element and early stage of the development of the campus is the Research and Translation Hub which will provide a high specification, multidisciplinary research and incubator space for researchers to collaborate. This collaboration will both generate new businesses and enable existing small businesses to scale more rapidly. This approach will have a direct impact on national economic growth and provide jobs and economic stimulus in one of the poorest localised urban areas in London and the UK.
To date, Imperial has produced more spin-out businesses than any other UK university, 140 over the last ten years, but has been able to accommodate only 10-15 at any one time within the limited space available in its South Kensington Campus Incubator. The new Research and Translation Hub will provide facilities for many more spin outs, and to support the flexible growth demands of the existing spin out community so that the College can support companies from inception through to maturity.
Progress to dateIn 2009 Imperial acquired the freehold of the seven acre ‘Woodlands’ site in White City from the BBC. In the following year, planning permission was obtained for 25,000 square metres of development, and within two years, Wood Lane Studios were completed. The Wood Lane Studios development is made up of 600 studios for postgraduate students and nine College key worker residential apartments to support early-career researchers in an area where affordable accommodation is hard to find.
The next phase of the development entailed securing permission for a further 100,000 square metres of development with the Research and Translation Hub accounting for around half of this. Implementation of the Hub depended on obtaining development funding. In 2012, the Higher Education Funding Council for England provided a grant funding commitment of £35million through the UK Research Partnership Investment Fund. The grant was contingent on the overall funding being on a ratio of at least 2:1 private to public funding. The balance of the funding for the £150million project is being provided by the College and through a £90million contribution from investor Voreda which was secured via a development and investment facility from Santander Corporate Banking.
The Research and Translation HubDue to open in 2016, the Research and Translation Hub will provide flexible multi-disciplinary research space with adjoining translational and commercialisation facilities with space for co-location of other institutions and businesses. The Hub will create space for at least 1,000 scientists and engineers in 48,000 square metres of space in two buildings:
• One building is the research centre (25,000 square metres). This is a core College building which will include primarily research facilities and some postgraduate teaching accommodation.
• The second building is the translation centre (23,000 square metres). The Translation Centre consists of incubator laboratories and offices, ‘grow on’ space and commercial office accommodation. It can facilitate up to 50 new incubator units for university and industry spinouts and new ventures. The College believes it will offer the largest concentration of affordable, flexible laboratory and office space (with specialised commercialisation services) in central London. The incubator space will accommodate each stage of a company’s growth, from its early stages through to maturity, providing scalable next-generation facilities.
LINKING RESEARCH AND COMMERCEThe Research and Translation Hub will have flexiblve, adaptable space in which the potentially changing future focus of discovery and translational work can be accommodated.
Diamond Review Phase II 2015 April 2015 · 41
To optimise success, a financial model has been developed based on a residual rent level, payable by Imperial as head lessee, calculated prior to the start on site when all costs have been tendered. This maximises the Imperial covenant, based on the lowest possible rent, which will allow flexibility in subsequent sublettings. The gives the College the scope to select tenants along a ‘curve of indifference’ between academic alignment and commercial return. It is hoped that this will allow an effective ‘curation’ of the tenants rather than a simplistic rent based first come first served model.
Optimising site and building efficiencyWorking with their partners Voreda, Laing O’Rourke and Santander, Imperial secured the project on a rigorous commercial basis from the outset designed to deliver buildings on time and in budget, recognising that the focus needed to be on an efficient and flexible Shell and Core given that over 40 years there is no operational certainty about the specific use of the structure.
The building design for the Translation Hub was subject to design optimisation reviews to improve the quality of the internal accommodation and the overall efficiency of the building including increases in the internal area. This has resulted in a net to gross ratio of 75:100 within the total of some 23,000 square metres – an efficient ratio for a higher education building including specialist laboratory space given the challenges of central London planning.
A design review on the Research Hub was carried out to assess the flexibility of the building to accommodate maximal alternative uses and in particular to enable the conversion of offices/teaching space to both wet and dry laboratory uses to meet future College demand. Whilst this this has increased cost and impacted on net efficiency, it provides a far more flexible building in the longer term. The College therefore elected to prioritise optionality over cost in the short term.
Regeneration and the communityImperial West is located in an area where regeneration of the local economy is a longstanding objective.
Obligations under the Section 106 Agreement attached to the permission for development and contributions to the Mayoral Construction Infrastructure Levy will deliver supporting infrastructure to the benefit of the development and the community including health and education facilities, public open space and employment and training.
Diamond Review Phase II 2015 April 2015 · 42
LOUGHBOROUGH UNIVERSITY - NEW USES FOR A HISTORIC BUILDING Key points:
• Efficient and effective re-use of a historic building in a conservation area which was no longer fit for purpose for its original use as student accommodation
• Retaining the historic features of the building while providing modern open plan offices
• Key enabling role in delivering the master plan for co-location of departments
• Delivering space efficiencies in office use as well as providing an improved internal working environment for staff
• Creation of open plan working for the Vice Chancellor’s Office: the senior team of four are leading by example in adopting new office working practices
• Implementation supported a Clear Space Policy
• Contributing to the carbon reduction policy.
This case study centres on the conversion of a historic building, the Hazlerigg Building, from its original use as a student hall of residence into flexible shared offices for the Vice Chancellor and administration teams.
It was important to the University to retain Hazlerigg. It is the oldest building on campus and a cornerstone of the surrounding conservation area. The building has a total gross internal area of some 3,400 square metres. It was constructed in 1937 as a hall of residence, but it became obsolescent. It could not accommodate the specifications needed for modern student residential accommodation.
The University implemented a £25 million master plan for the Central Park area of the campus. This resulted in the co-location of academic departments in single buildings or adjacent buildings both to support academic aims and improve the student experience. Co-location of academic activity could not be achieved, however, without freeing up space occupied by administration and support activities which were dispersed across the Central Park area.
The use of the Hazlerigg and Rutland Buildings to accommodate Professional Services departments provided the key to enabling Professional Services to move out of the Central Park. The reconfiguration of the space also delivered the opportunity to deliver integrated administration teams and created an HQ and focal point for the University.
Project objectivesThe project to convert the Hazlerigg Building as a first phase and Rutland Building as a second phase into offices was designed to meet a range of objectives:
• Not only is Hazlerigg Building one of the oldest on campus, it is also well-regarded by current and former students. The University wanted to retain its character and the heritage feel of the interior, while at the same time creating a modern, open plan office environment for 140 staff moving from cellular offices.
• It was a core project objective to support new ways of working. The Professional Services teams had been based in a range of buildings across the Central Park with a high percentage of cellular offices. Co-location was aimed at improving working practices within and between teams to create a more efficient, effective and flexible administration combined with the technologies to assist this. There was also a desire to improve communication and improve effectiveness.
• From the outset, the Hazlerigg Project was intended to be an exemplar for further future moves of Professional Services in the next phases of the implementation of the master plan. The VC and senior management team were also leading by example in moving into open plan offices in the reconfigured building.
• It was also an objective to deliver space efficiencies through the layout of accommodation and increased use of shared facilities, such as printing capabilities.
• Delivering space efficiencies was linked to the objective of contributing to the University’s carbon reduction targets by avoiding the need to construct the additional space that would otherwise have been required to accommodate the co-location of academic departments and the expansion of the library.
Diamond Review Phase II 2015 April 2015 · 43
Meeting the challengesThe move to shared and open plan offices from largely cellular accommodation was a major change for many staff.
Creating open plan working for the Vice Chancellor’s senior team showed leadership in new working practices and office arrangements. The project was endorsed from the outset by the Vice Chancellor and the senior management team who asked the Director of Change Projects to work alongside the Project Manager for the building.
Space PolicyLoughborough University has a Space Policy, which supports the implementation of projects such as the reconfiguration of the Hazlerigg Building.
Policy aims• To provide the optimum amount of flexible space to support the University’s overall strategy. Space
should be functionally suitable for its purpose, in excellent condition, and utilised as efficiently as possible.
• To reduce the costs of both provision and maintenance of the built estate and reduce carbon emissions.
• To support the effective implementation of the University strategy.
Policy principles for space allocation Guiding principles for decision making on space allocation include:
• Increase space utilisation and functional suitability across the University leading to potential decommissioning of legacy, poor carbon performing and unattractive buildings.
• Eliminate ‘entitlement’ and ensure allocation is based on need.
• Encourage sharing of space and collaboration across Schools and Professional Services.
• Plan for and encourage alternative methods of working to include open plan and hot-desking.
Policy principles for office use The policy sets out principles for different types of space. The principles for office use are:
• The use of dedicated open-plan areas for all staff will be encouraged together with hot-desking provision. There is no automatic right to occupy an individual office unless a need is demonstrated.
• Rooms that are suitable for offices should not be used for storage, to locate printers/photocopiers etc.
• When Academic Schools and Professional Services appoint additional staff, accommodation must first be found by ensuring that all offices with an area >13 square metres have an occupancy of at least two persons.
• Visiting staff should normally be located in shared offices or have hot-desk provision.
• PhD students should normally share office accommodation or use open plan spaces or hot desk.
• Professional Services staff should normally be located in shared offices or use open-plan spaces.
• Alternative accommodation for light users of workstations will be provided by using shared desk space or providing touchdown points for laptops.
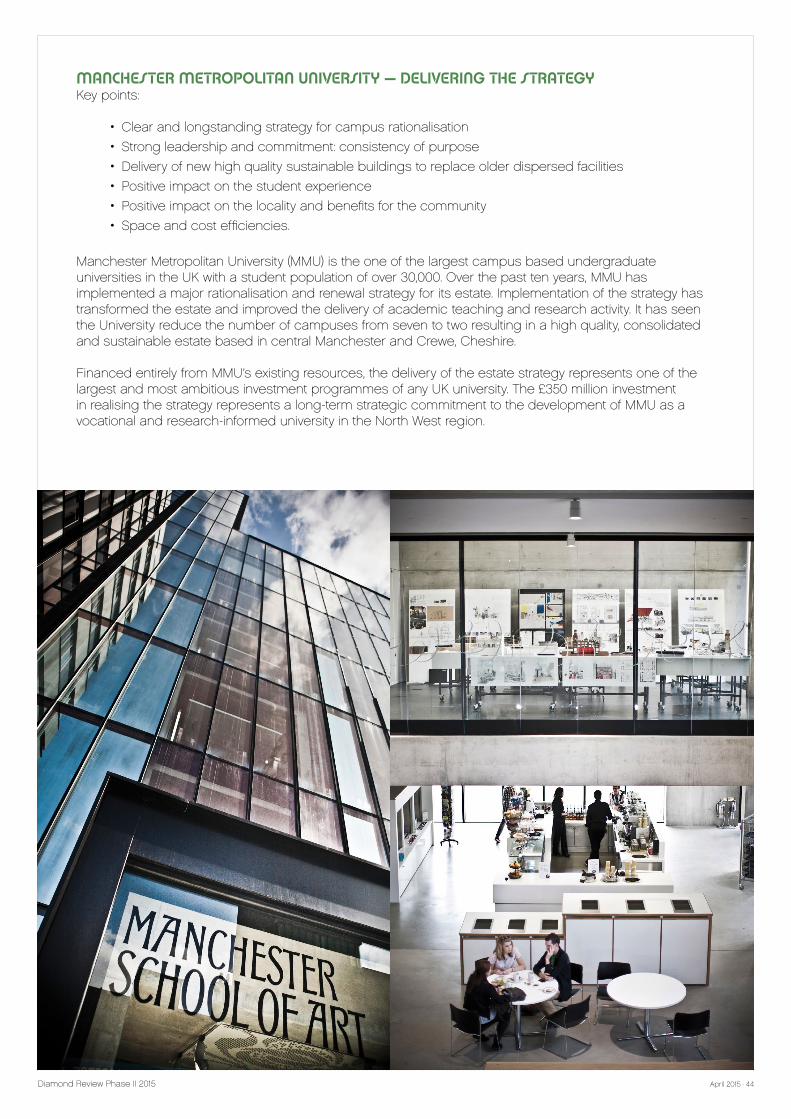
Diamond Review Phase II 2015 April 2015 · 44
MANCHESTER METROPOLITAN UNIVERSITY – DELIVERING THE STRATEGYKey points:
• Clear and longstanding strategy for campus rationalisation
• Strong leadership and commitment: consistency of purpose
• Delivery of new high quality sustainable buildings to replace older dispersed facilities
• Positive impact on the student experience
• Positive impact on the locality and benefits for the community
• Space and cost efficiencies.
Manchester Metropolitan University (MMU) is the one of the largest campus based undergraduate universities in the UK with a student population of over 30,000. Over the past ten years, MMU has implemented a major rationalisation and renewal strategy for its estate. Implementation of the strategy has transformed the estate and improved the delivery of academic teaching and research activity. It has seen the University reduce the number of campuses from seven to two resulting in a high quality, consolidated and sustainable estate based in central Manchester and Crewe, Cheshire.
Financed entirely from MMU’s existing resources, the delivery of the estate strategy represents one of the largest and most ambitious investment programmes of any UK university. The £350 million investment in realising the strategy represents a long-term strategic commitment to the development of MMU as a vocational and research-informed university in the North West region.
Diamond Review Phase II 2015 April 2015 · 45
The StrategyThe initial plan for estate consolidation took shape in 2004. At that time, the University was dispersed across five campuses in central and south Manchester: All Saints, Aytoun, Elizabeth Gaskell, Hollings and Didsbury. There were also two campuses at Crewe and Alsager nearly 40 miles away from central Manchester.
Drivers for campus rationalisationThere were multiple drivers behind the decision to rationalise the estate, principally:
• An urgent need to modernise the learning and teaching environments for staff and students, raising aspirations and ambitions of both groups
• Providing world-class facilities for teaching and research to attract high quality staff and students from UK and international markets
• Increasing competition for students and research at all levels regionally, nationally and internationally
• The raising of students fees in 2003 and again following the Browne Report in 2012 – the changing relationship of students and universities
• Leveraging economies of scale and institution-wide benefits from having two campuses to focus teaching, research, services and support
• Removing duplication of services (for example reducing the number of libraries from seven to two and the number of catering outlets from 14 to five)
• Improving overall efficiency in the size of the estate
• Improving the quality of the estate and environmental sustainability.
The new estateThe strategy delivered major change across the estate. In central Manchester, it led to:
The Business School and Student HubThe Business School was based at the Aytoun Campus which was made up of a range of buildings some with poor fitness for purpose and condition. Aytoun was closed in 2012, and a new 25,000 square metre Business School opened on the All Saints Campus at a cost of some £75million.
John Dalton TowerThere has been investment of £56 million in the Science and Engineering complex including high specification teaching laboratories and research facilities including blood biochemistry, biomechanics, motor control, exercise performance laboratories, multimedia research laboratory and a computer games usability laboratory.
Benzie BuildingThe new School of Art Building called the Benzie Building provides classrooms, workshops and hybrid studios with multifunctional spaces and galleries. The £35 million project delivers high quality facilities for students of the School of Art.
Birley FieldsHistorically the Faculty of Health, Psychology and Social Care was based on the Elizabeth Gaskell Campus, and the Faculty of Education was located in Didsbury. Utilisation was low in both locations, and the campuses were in need of major modernisation and investment.
The new Birley Fields site (a £140 million project) opened for the 2014-15 academic year and provides facilities shared by 6,000 students in the two Faculties.
Strong leadership and commitment – consistency of purposeThis scale of change across the estate required strong leadership throughout strategy development and implementation. The principles of the strategy were initially developed by Dame Sandra Burslem, Vice-Chancellor of MMU until 2005 and ultimately led and directed by Professor John Brooks, the University’s Vice-Chancellor since 2005. It was also about seeking and gaining buy-in from senior colleagues and their teams about the short-term pain (limited investment in acknowledged poor estates and infrastructure) that would be necessary to pending completion of the long-term vision.
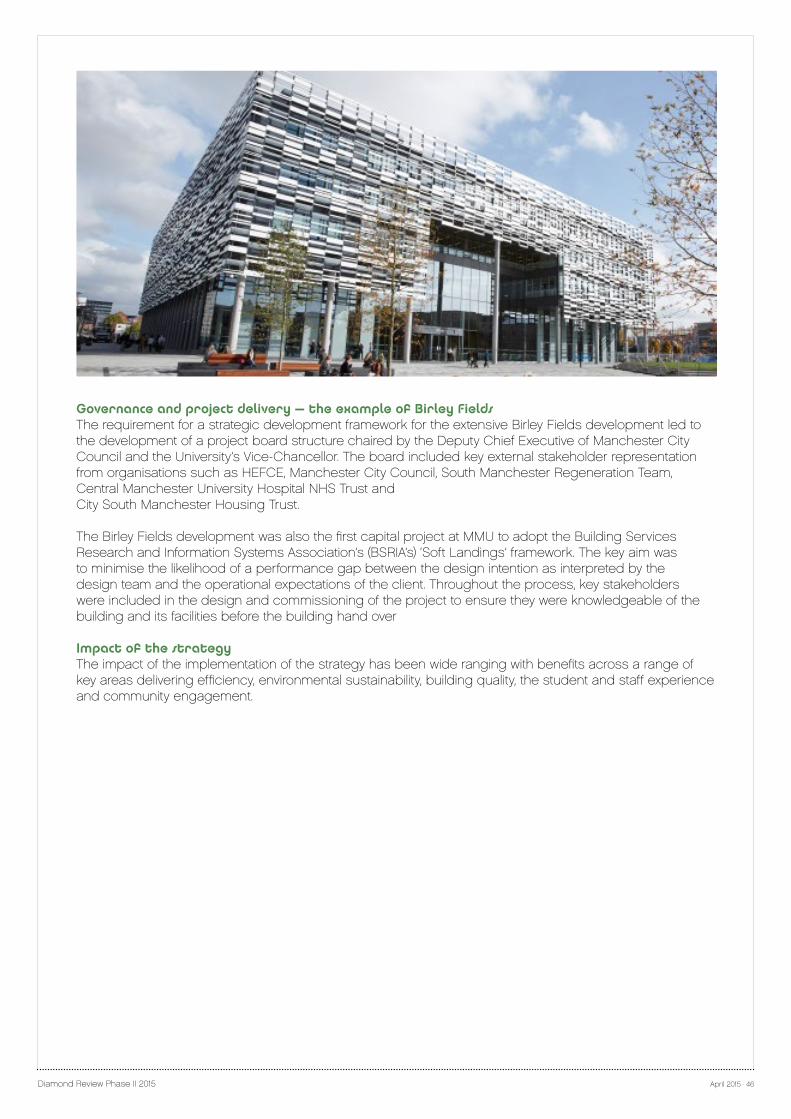
Diamond Review Phase II 2015 April 2015 · 46
Governance and project delivery – the example of Birley FieldsThe requirement for a strategic development framework for the extensive Birley Fields development led to the development of a project board structure chaired by the Deputy Chief Executive of Manchester City Council and the University’s Vice-Chancellor. The board included key external stakeholder representation from organisations such as HEFCE, Manchester City Council, South Manchester Regeneration Team, Central Manchester University Hospital NHS Trust andCity South Manchester Housing Trust.
The Birley Fields development was also the first capital project at MMU to adopt the Building Services Research and Information Systems Association’s (BSRIA’s) ‘Soft Landings’ framework. The key aim was to minimise the likelihood of a performance gap between the design intention as interpreted by the design team and the operational expectations of the client. Throughout the process, key stakeholders were included in the design and commissioning of the project to ensure they were knowledgeable of the building and its facilities before the building hand over
Impact of the strategyThe impact of the implementation of the strategy has been wide ranging with benefits across a range of key areas delivering efficiency, environmental sustainability, building quality, the student and staff experience and community engagement.
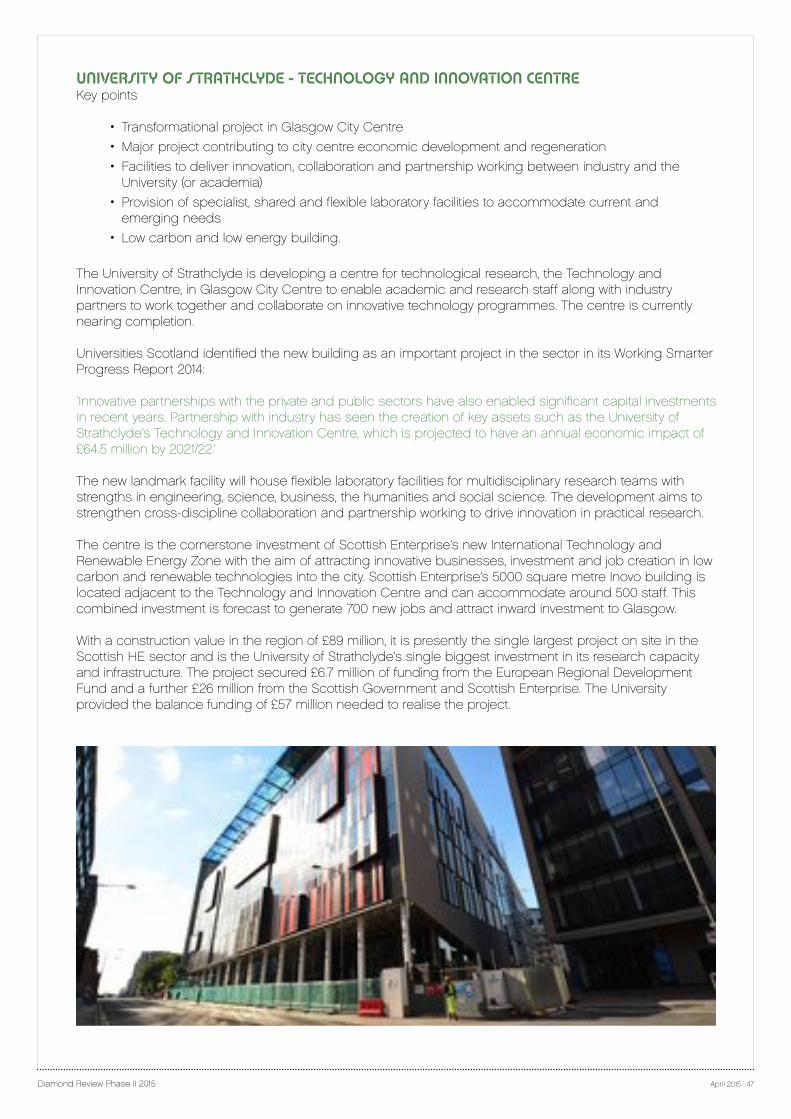
Diamond Review Phase II 2015 April 2015 · 47
UNIVERSITY OF STRATHCLYDE - TECHNOLOGY AND INNOVATION CENTREKey points
• Transformational project in Glasgow City Centre
• Major project contributing to city centre economic development and regeneration
• Facilities to deliver innovation, collaboration and partnership working between industry and the University (or academia)
• Provision of specialist, shared and flexible laboratory facilities to accommodate current and emerging needs
• Low carbon and low energy building.
The University of Strathclyde is developing a centre for technological research, the Technology and Innovation Centre, in Glasgow City Centre to enable academic and research staff along with industry partners to work together and collaborate on innovative technology programmes. The centre is currently nearing completion.
Universities Scotland identified the new building as an important project in the sector in its Working Smarter Progress Report 2014:
‘Innovative partnerships with the private and public sectors have also enabled significant capital investments in recent years. Partnership with industry has seen the creation of key assets such as the University of Strathclyde’s Technology and Innovation Centre, which is projected to have an annual economic impact of £64.5 million by 2021/22.’
The new landmark facility will house flexible laboratory facilities for multidisciplinary research teams with strengths in engineering, science, business, the humanities and social science. The development aims to strengthen cross-discipline collaboration and partnership working to drive innovation in practical research.
The centre is the cornerstone investment of Scottish Enterprise’s new International Technology and Renewable Energy Zone with the aim of attracting innovative businesses, investment and job creation in low carbon and renewable technologies into the city. Scottish Enterprise’s 5000 square metre Inovo building is located adjacent to the Technology and Innovation Centre and can accommodate around 500 staff. This combined investment is forecast to generate 700 new jobs and attract inward investment to Glasgow.
With a construction value in the region of £89 million, it is presently the single largest project on site in the Scottish HE sector and is the University of Strathclyde’s single biggest investment in its research capacity and infrastructure. The project secured £6.7 million of funding from the European Regional Development Fund and a further £26 million from the Scottish Government and Scottish Enterprise. The University provided the balance funding of £57 million needed to realise the project.
Diamond Review Phase II 2015 April 2015 · 48
The Technology and Innovation BuildingThe building is nine storeys high, with a gross internal floor area of 25,900 square metres. It is a steel framed triangular structure occupying a sloping brownfield site. Site preparation began in 2012, and the building is due to open in 2015.
Site opportunities were taken advantage of at an early stage. These included assessing the micro climate, the most effective orientation of the building, land use, noise impact, space availability, planning requirements, associated logistics and risk of each technology that was considered for the building.
The building provides flexible open plan offices, conference and laboratory facilities. It has over 100 laboratories and will house up to 700 researchers, academics and industry partners, all working in collaboration in an environment which nurtures academic and industrial cross-fertilisation opening up new research and commercialisation opportunities.
The range of space types contained within the building reflect its complex character and had an impact on the detailed planning of the building itself. Over one hundred specialist lab and workshop spaces sit alongside research workspace accommodation and the knowledge exchange and social elements that form the core of the development. Key to the building‘s success are the correct disposition of these various elements to ensure: long term flexibility and the potential to easily re-configure space, ease of servicing, legibility of circulation, using defined and visible cores and attractive accommodation stairs within the atrium void and optimum adjacencies of the various elements to assist partnering and space efficiencies.
As well as research space, the building will also provide conferencing and event facilities, a café and exhibition space including a 450 seat auditorium which can be divided into three self-contained/soundproof areas seating 150.
Benefits of the projectProjected economic impact and regenerationThe Technology and Innovation Centre is a major contribution by the University of Strathclyde to the large scale economic development project known as the International Technology and Renewable Energy Zone located in Glasgow City Centre.
The presence of the University in the centre of Glasgow has a qualitative impact through adding to the vibrancy of the city centre and a quantitative impact through capital projects, which support the regeneration of the city centre. In particular the International Technology and Renewable Energy Zone, of which the Technology and Innovation Centre is the largest component, will be a key element in the regeneration of Glasgow city centre and is identified as a regeneration priority in various local and regional planning and regeneration strategies.
The Centre is designed to raise Glasgow’s profile internationally and help restore the city’s reputation as an Engineering and Technology Centre of Excellence.
Business and industry engagementThe development seeks to bridge the gap between academia and industry and in so doing strengthen collaboration and encourage innovation in practical research. Opportunities emerging in growth industries such as renewable energy and enabling technologies provide a renewed focus on the strengths of the University for collaborative research and direct knowledge exchange and interface with industry in these key areas, enabling a rapid technology pipeline, taking projects from concept through demonstration to exploitation.
The Technology and Innovation Centre has attracted funding from major business partners including SSE, Iberdrola, Rolls-Royce, the Weir group, GlaxoSmithKline, Novartis and Astra-Zeneca. In building these partnerships, a variety of flexible engagement approaches and business models have been developed to support strategic programme development, open innovation and effective industry collaboration. The new centre will focus on building these programmes from supply chain partners and innovative small to medium-sized enterprises.
StudentsThe benefits of working closely with industry are already being delivered to enhance the student experience. The Technology and Innovation Centre is intended to build on the existing strengths and
Diamond Review Phase II 2015 April 2015 · 49
permeate activities across the University. It brings together multidisciplinary teams to combine strengths in engineering, science, business, humanities and the social sciences. This will benefit the student experience providing more opportunities for students to interact with external agencies.
Construction projectThe project had a very positive impact on the local economy during construction with 550 staff operatives on site and has exceeded all its targets on new entrants to the construction industry (55), apprentices (27), work placements (49), volunteering projects (4), charitable events (15), engagement with SEs/ SMEs (32), education visits/ community events (24), guest lectures (6), research projects with University students (5), NVQ completions (15) plus NVQ starts (27), Lifelong Learning (48) and training events (138).
Low carbonThe building was designed with low carbon principles to the fore in line with the University of Strathclyde Sustainable Design Quality Standard ‘to incorporate option appraisal and proactive pursuit of the best value options of low and zero carbon technology (LZC) energy options’. The standard requires building to have a 30 per cent improvement in regulated carbon emissions. The building is on target to achieve ‘Excellent’ in terms of BREEAM and an ‘A’ rated EPC Certificate.
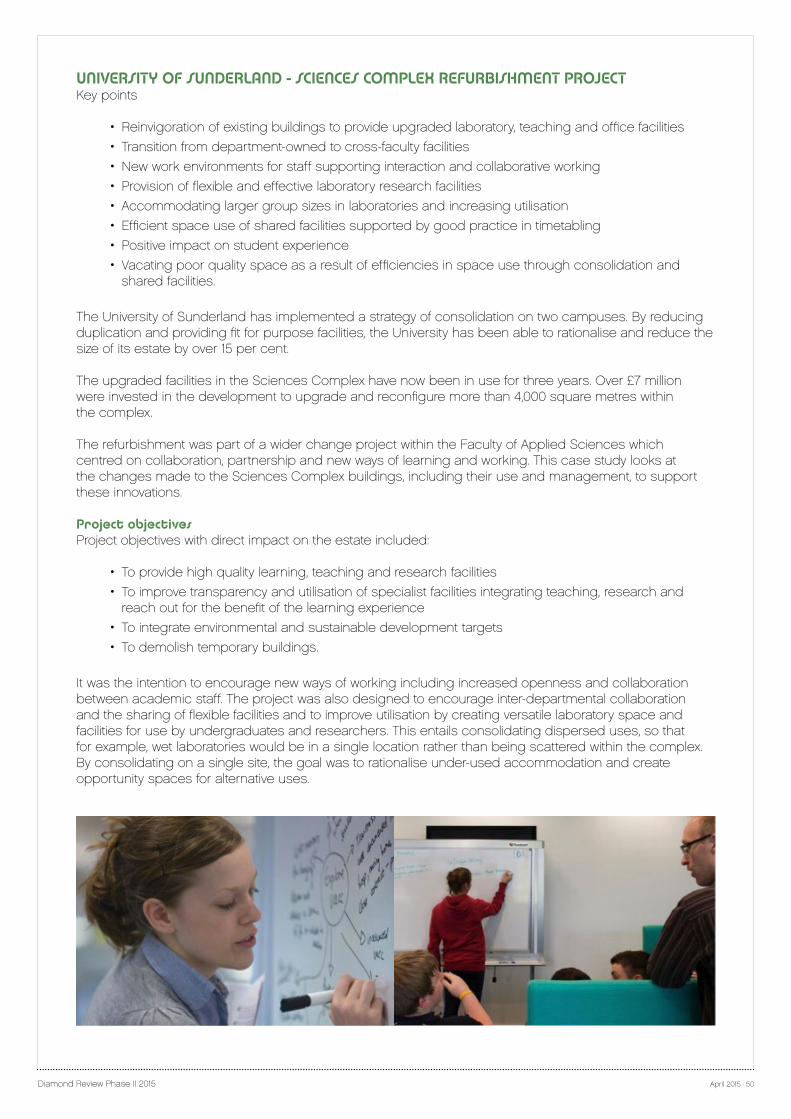
Diamond Review Phase II 2015 April 2015 · 50
UNIVERSITY OF SUNDERLAND - SCIENCES COMPLEX REFURBISHMENT PROJECTKey points
• Reinvigoration of existing buildings to provide upgraded laboratory, teaching and office facilities
• Transition from department-owned to cross-faculty facilities
• New work environments for staff supporting interaction and collaborative working
• Provision of flexible and effective laboratory research facilities
• Accommodating larger group sizes in laboratories and increasing utilisation
• Efficient space use of shared facilities supported by good practice in timetabling
• Positive impact on student experience
• Vacating poor quality space as a result of efficiencies in space use through consolidation and shared facilities.
The University of Sunderland has implemented a strategy of consolidation on two campuses. By reducing duplication and providing fit for purpose facilities, the University has been able to rationalise and reduce the size of its estate by over 15 per cent.
The upgraded facilities in the Sciences Complex have now been in use for three years. Over £7 million were invested in the development to upgrade and reconfigure more than 4,000 square metres within the complex.
The refurbishment was part of a wider change project within the Faculty of Applied Sciences which centred on collaboration, partnership and new ways of learning and working. This case study looks at the changes made to the Sciences Complex buildings, including their use and management, to support these innovations.
Project objectivesProject objectives with direct impact on the estate included:
• To provide high quality learning, teaching and research facilities
• To improve transparency and utilisation of specialist facilities integrating teaching, research and reach out for the benefit of the learning experience
• To integrate environmental and sustainable development targets
• To demolish temporary buildings.
It was the intention to encourage new ways of working including increased openness and collaboration between academic staff. The project was also designed to encourage inter-departmental collaboration and the sharing of flexible facilities and to improve utilisation by creating versatile laboratory space and facilities for use by undergraduates and researchers. This entails consolidating dispersed uses, so that for example, wet laboratories would be in a single location rather than being scattered within the complex. By consolidating on a single site, the goal was to rationalise under-used accommodation and create opportunity spaces for alternative uses.
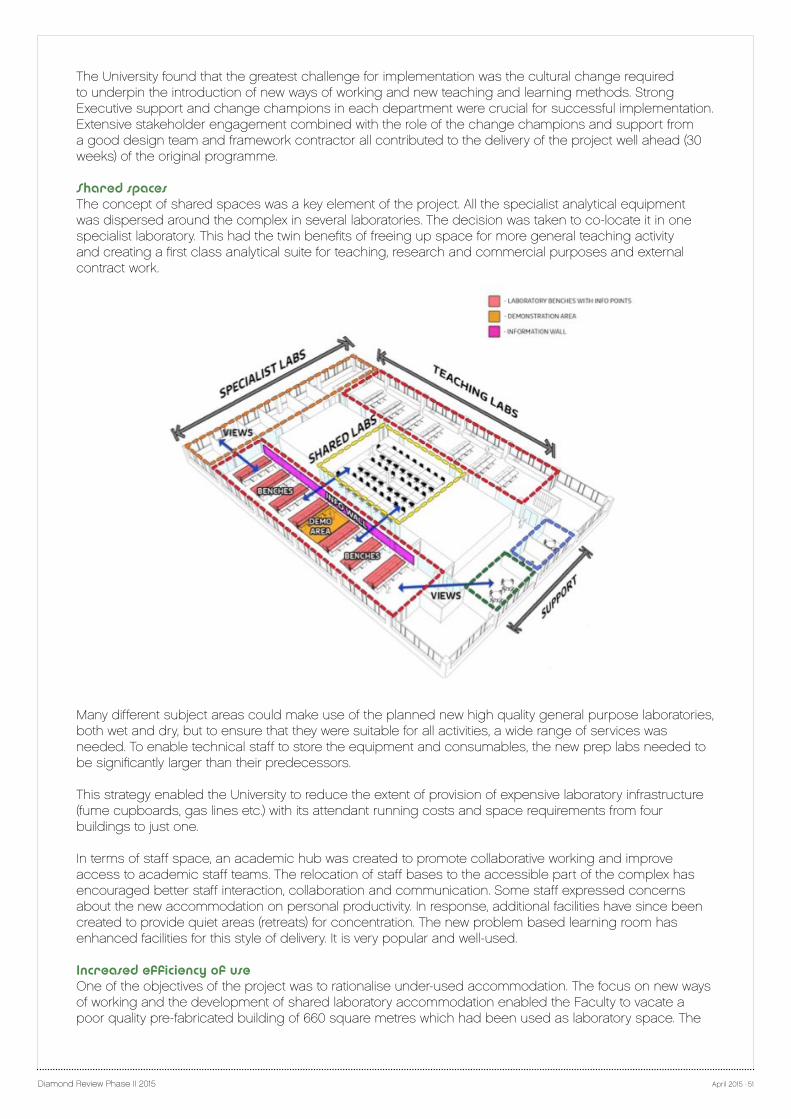
Diamond Review Phase II 2015 April 2015 · 51
The University found that the greatest challenge for implementation was the cultural change required to underpin the introduction of new ways of working and new teaching and learning methods. Strong Executive support and change champions in each department were crucial for successful implementation. Extensive stakeholder engagement combined with the role of the change champions and support from a good design team and framework contractor all contributed to the delivery of the project well ahead (30 weeks) of the original programme.
Shared spacesThe concept of shared spaces was a key element of the project. All the specialist analytical equipment was dispersed around the complex in several laboratories. The decision was taken to co-locate it in one specialist laboratory. This had the twin benefits of freeing up space for more general teaching activity and creating a first class analytical suite for teaching, research and commercial purposes and external contract work.
Many different subject areas could make use of the planned new high quality general purpose laboratories, both wet and dry, but to ensure that they were suitable for all activities, a wide range of services was needed. To enable technical staff to store the equipment and consumables, the new prep labs needed to be significantly larger than their predecessors.
This strategy enabled the University to reduce the extent of provision of expensive laboratory infrastructure (fume cupboards, gas lines etc.) with its attendant running costs and space requirements from four buildings to just one.
In terms of staff space, an academic hub was created to promote collaborative working and improve access to academic staff teams. The relocation of staff bases to the accessible part of the complex has encouraged better staff interaction, collaboration and communication. Some staff expressed concerns about the new accommodation on personal productivity. In response, additional facilities have since been created to provide quiet areas (retreats) for concentration. The new problem based learning room has enhanced facilities for this style of delivery. It is very popular and well-used.
Increased efficiency of useOne of the objectives of the project was to rationalise under-used accommodation. The focus on new ways of working and the development of shared laboratory accommodation enabled the Faculty to vacate a poor quality pre-fabricated building of 660 square metres which had been used as laboratory space. The
Diamond Review Phase II 2015 April 2015 · 52
University’s long term plan is to dispose of this space, but it may be needed in the short term for decanting purposes during the next phase of the project.
With the new configuration of office space, the ratio of space per staff FTE reduced from 11.5 to 7.6 square metres. The total area of laboratory space changed from 5,536 square metres to 4,195 square metres, and utilisation has increased from 10 to nearly 30 per cent.
Feedback from students and staffStudents expressed very positive views about the Sciences Complex refurbishment in the post-occupancy evaluation. In particular, the ‘contemporary’ aesthetics of the refurbished areas are well-liked, and the overall design is considered to have taken into account student preferences and needs.
The complex, especially its laboratory facilities, is viewed as fostering a positive impression of the University and of how students are valued. The refurbished laboratories are highly regarded, and considered by the majority of users to be an improvement on the previous provision.
The transition from department ‘owned’ to cross-faculty laboratories has gone unnoticed by the vast majority of students, and this was not considered to have a negative impact on student sense of ownership or on the wider student experience of using the laboratories.

6INTERNATIONAL COMPARATORS This section reports on investigations into the performance of the UK HE estate in the context of international comparators.
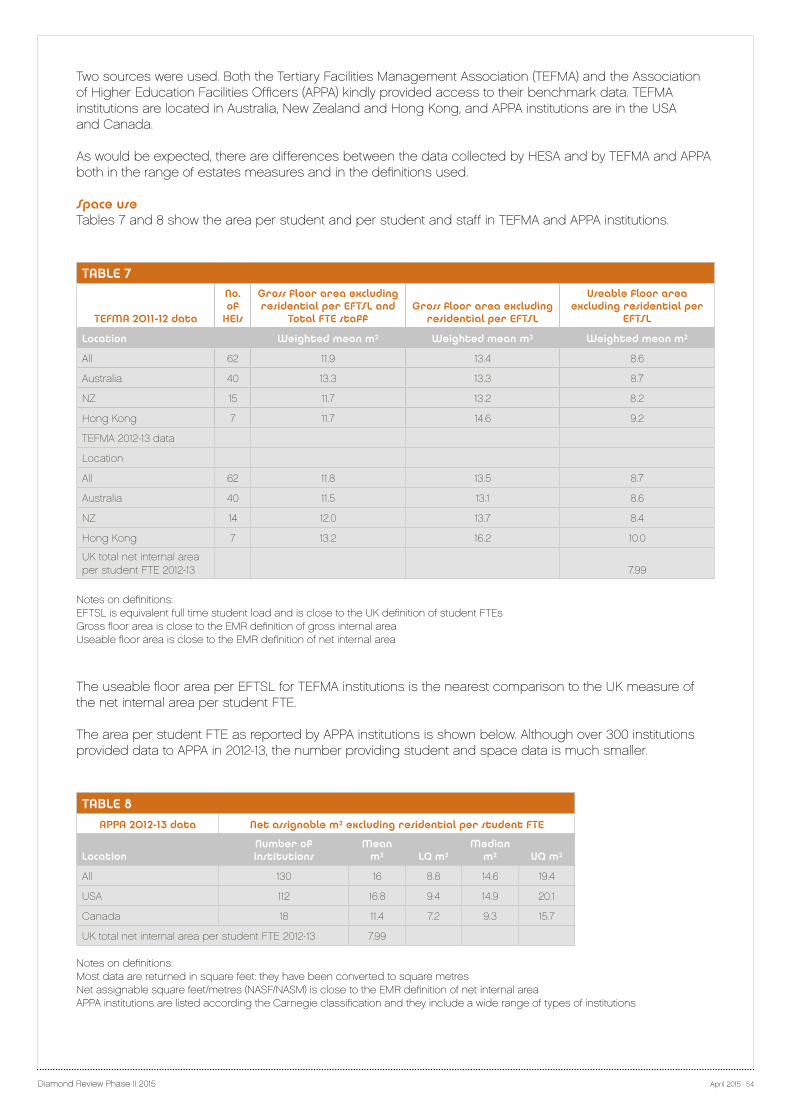
Diamond Review Phase II 2015 April 2015 · 54
Two sources were used. Both the Tertiary Facilities Management Association (TEFMA) and the Association of Higher Education Facilities Officers (APPA) kindly provided access to their benchmark data. TEFMA institutions are located in Australia, New Zealand and Hong Kong, and APPA institutions are in the USA and Canada.
As would be expected, there are differences between the data collected by HESA and by TEFMA and APPA both in the range of estates measures and in the definitions used.
Space useTables 7 and 8 show the area per student and per student and staff in TEFMA and APPA institutions.
TABLE 7
TEFMA 2011-12 data
No. of
HEIs
Gross floor area excluding residential per EFTSL and
Total FTE staffGross floor area excluding
residential per EFTSL
Useable floor area excluding residential per
EFTSL
Location Weighted mean m² Weighted mean m² Weighted mean m²
All 62 11.9 13.4 8.6
Australia 40 13.3 13.3 8.7
NZ 15 11.7 13.2 8.2
Hong Kong 7 11.7 14.6 9.2
TEFMA 2012-13 data
Location
All 62 11.8 13.5 8.7
Australia 40 11.5 13.1 8.6
NZ 14 12.0 13.7 8.4
Hong Kong 7 13.2 16.2 10.0
UK total net internal area per student FTE 2012-13 7.99
Notes on definitions:EFTSL is equivalent full time student load and is close to the UK definition of student FTEsGross floor area is close to the EMR definition of gross internal areaUseable floor area is close to the EMR definition of net internal area
The useable floor area per EFTSL for TEFMA institutions is the nearest comparison to the UK measure of the net internal area per student FTE.
The area per student FTE as reported by APPA institutions is shown below. Although over 300 institutions provided data to APPA in 2012-13, the number providing student and space data is much smaller.
TABLE 8APPA 2012-13 data Net assignable m² excluding residential per student FTE
LocationNumber of institutions
Mean m² LQ m²
Median m² UQ m²
All 130 16 8.8 14.6 19.4
USA 112 16.8 9.4 14.9 20.1
Canada 18 11.4 7.2 9.3 15.7
UK total net internal area per student FTE 2012-13 7.99
Notes on definitions:Most data are returned in square feet: they have been converted to square metresNet assignable square feet/metres (NASF/NASM) is close to the EMR definition of net internal areaAPPA institutions are listed according the Carnegie classification and they include a wide range of types of institutions
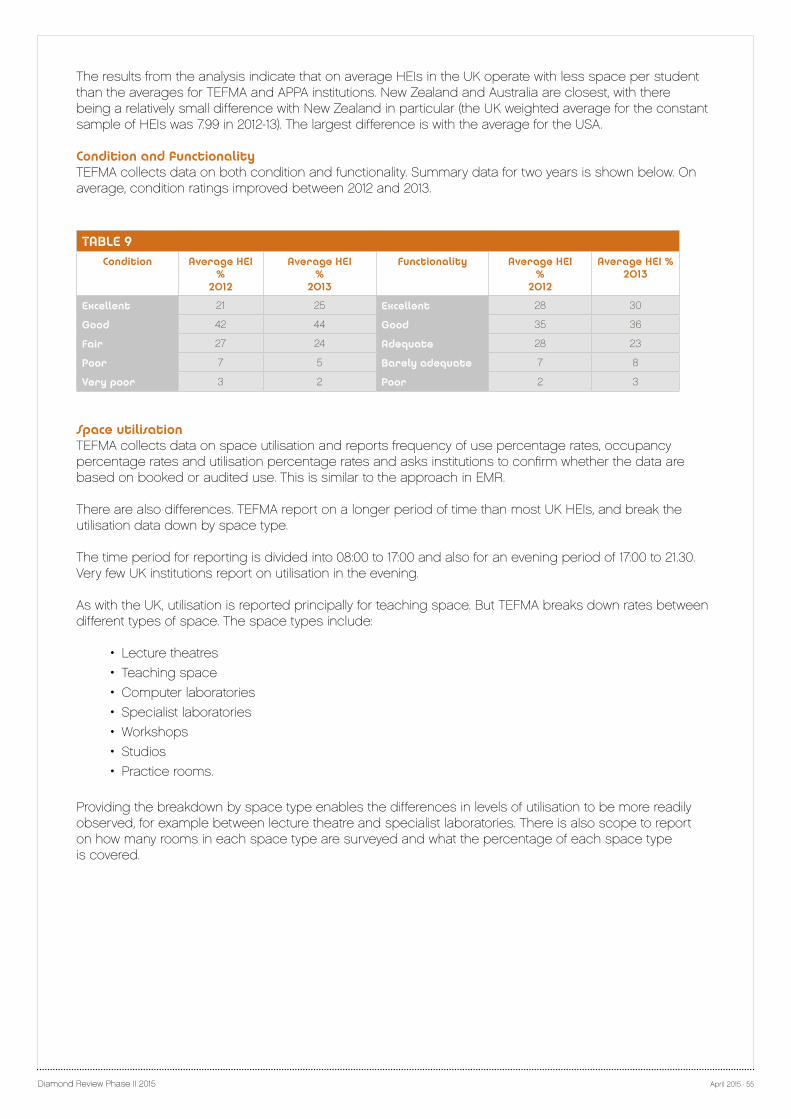
Diamond Review Phase II 2015 April 2015 · 55
The results from the analysis indicate that on average HEIs in the UK operate with less space per student than the averages for TEFMA and APPA institutions. New Zealand and Australia are closest, with there being a relatively small difference with New Zealand in particular (the UK weighted average for the constant sample of HEIs was 7.99 in 2012-13). The largest difference is with the average for the USA.
Condition and functionalityTEFMA collects data on both condition and functionality. Summary data for two years is shown below. On average, condition ratings improved between 2012 and 2013.
TABLE 9Condition Average HEI
%2012
Average HEI%
2013
Functionality Average HEI%
2012
Average HEI % 2013
Excellent 21 25 Excellent 28 30
Good 42 44 Good 35 36
Fair 27 24 Adequate 28 23
Poor 7 5 Barely adequate 7 8
Very poor 3 2 Poor 2 3
Space utilisationTEFMA collects data on space utilisation and reports frequency of use percentage rates, occupancy percentage rates and utilisation percentage rates and asks institutions to confirm whether the data are based on booked or audited use. This is similar to the approach in EMR.
There are also differences. TEFMA report on a longer period of time than most UK HEIs, and break the utilisation data down by space type.
The time period for reporting is divided into 08:00 to 17:00 and also for an evening period of 17:00 to 21.30. Very few UK institutions report on utilisation in the evening.
As with the UK, utilisation is reported principally for teaching space. But TEFMA breaks down rates between different types of space. The space types include:
• Lecture theatres
• Teaching space
• Computer laboratories
• Specialist laboratories
• Workshops
• Studios
• Practice rooms.
Providing the breakdown by space type enables the differences in levels of utilisation to be more readily observed, for example between lecture theatre and specialist laboratories. There is also scope to report on how many rooms in each space type are surveyed and what the percentage of each space type is covered.

RECOMMENDATIONS FOR THE FUTURE This report demonstrates that the sector has shown clear improvement across a range of measures including space use, increasing and diversifying income, and the quality and suitability of the estate. There has also been continued investment in infrastructure in spite of cuts to public funding. This direction of travel must be maintained.
7
Diamond Review Phase II 2015 April 2015 · 57
This section sets out the estate work stream’s recommendations for further enabling tools and strategies designed to support future improvement in the performance of the estate and to promote further efficient and effective space use.
CONTEXT OF GOOD PRACTICE GUIDANCEThe progress made in achieving efficiency gains and delivering value from the estate has taken place in the context of a body of existing guidance and recommendations on good practice on space use and management. These are listed in Appendix 1.
The recommendations made in this section take account of the guidance and expand and develop it to meet the challenges of the future.
RECOMMENDATIONSa. Key performance indicatorsIt is recommended that eight key performance indicators (KPIs) are adopted.
The KPIs focus on core constituents of estate performance: efficiency (in cost and use); value (supporting income generation and delivering a return on capital); quality (condition and fitness for purpose); and sustainability (investing to meet universities’ current and future needs and reducing carbon emissions).
The indicators listed below are based on HESA EMR data and definitions and apply to the non-residential estate.
Efficiency· Area per student and staff FTE (GIA m²)· Total property cost per m² (GIA)
Quality· Percentage of GIA in condition grades A and B· Percentage of GIA in functional suitability grades 1 and 2
Value· Income per m² (GIA)· Insurance replacement value as a proportion of total income
Sustainability· Maintenance and capital expenditure as a percentage of insurance replacement value (rolling
average over three years)· Carbon emissions scope 1 and 2, tonnes by m²
All definitions are as HESA’s Estates Management Record with the exception that total property cost excludes rateable value. It is recommended that if national results are collated and reported through HEFCE or HESA that the ability to report results by TRAC14 Peer Group is included to enable comparisons of similar institutions.
The estate has a critical role to play in student and staff satisfaction. It is recommended that an additional question is included in the National Student Survey to ask about students’ satisfaction with the estate and campus facilities. Similarly institutions may consider collecting and reporting on this measure independently of the National Student Survey for both students and staff. This would complete the value elements of the estate and balance the measures.
b. Governance, strategic planning and decision makingEffective governance, strategic planning and decision making are critical success factors in delivering future improvements in the KPIs.
14 Transparent Approach to Costing
Diamond Review Phase II 2015 April 2015 · 58
Overall institutional strategic planning, forecasting and resource management will have significant impacts on the KPIs, and significant progress may not be feasible if responsibility for delivery is ring fenced to estate management.
It is recommended that the goal of improving KPI performance must be integrated with wider institutional planning and decision making to reinforce and build in:
• Strategy and forecasts – assessing the impact on space and the estate before institutional plans are approved
• Estate performance – targeting priorities for improvement in quality and efficiency
• Financial sustainability of the asset base – planning the size of the estate and the level of investment needed to support an affordable and fit for purpose estate
• Business plans – selecting criteria designed to improve performance in the KPIs for business cases and prioritising capital planning.
To support this approach, it is recommended that good practice advice for governing bodies and HE institutions is updated.
i. Guidance for governing bodiesGood practice guidance on estates and infrastructure is available to governors, for example the Leadership Foundation’s Getting to Grips with Estates and Infrastructure. It is recommended that the key issues are expanded to take account of these strategic issues and to incorporate KPIs.
ii. Guidance for institutionsIt is also recommended that the Association of University Directors of Estates self assessment tool (AUDESAT) is revised. AUDESAT is a toolkit for self-assessment of estate management to assist institutions in ensuring appropriate governance and skills are employed in managing their estate, including space, more effectively and helping to deliver institutional strategic goals.
It is proposed that the toolkit is reviewed and updated in the light of the changes in the performance and priorities for the sector since its introduction over ten years ago. It is proposed that the core objective of promoting consistent good practice in estates management will continue.
The framework will be reviewed, revised and rationalised in order to reinforce the role of governance and build in a greater focus on the delivery of efficient and effective use of the estate and delivery of the KPIs in each of the core competencies: leadership, strategy, processes, people, resources and outcomes. The update will focus on which actions/decisions will assist in improving performance.
c. Enabling models and toolsIt is recommended that models and tools used by estates professionals and institutional leaders for managing the efficiency and effectiveness of space use are reviewed and updated to make them fit for purpose for the future.
i. Benchmarking the size of the estateThis will include an update of the strategic tool for assisting with the assessment of the affordability of the size of the estate.
Since the model was last significantly recalibrated, the HE sector in the UK has undergone considerable change. For example, the HE funding system has changed in England with the increase of the student fee limit to £9,000 and removal of caps on student numbers. The make-up of the student population has also changed with significantly fewer part-time and mature students, and HEIs have made considerable progress in making more efficient use of their non-residential estate. In the light of these factors, the current model needs to be updated to ensure that it is relevant in the current operating environment. It is appropriate, therefore, to a) review the fundamental structure of the benchmarking model, b) examine whether new variables should be introduced into the model and, c) possibly exclude some factors currently included in the model.
Diamond Review Phase II 2015 April 2015 · 59
At the a minimum, to take account of the differences in the evolution of the HEI funding regimes in the four home countries, the model would need to be recalibrated for England alone and the other home countries.
ii. Assessing space needsIt is recommended that space planning guidance is reviewed and updated, including the approach to space assessment models, available as part of the AUDE Sustainable Estate Toolkit (2010).
The approach to space assessment models will be reviewed in the light of the additional data now available through sources such as Key Information Sets and to provide clear links to academic planning and space costs. This will enable the space modelling tools to be refined to assist with modelling scope for delivering efficiencies in space use and for assessing the potential requirements associated with plans for innovation, growth and restructuring.
iii. Measuring space utilisationSpace utilisation data is collected by most institutions. For the purposes of reporting to HESA as part of the Estate Management Return, utilisation data is collected for teaching spaces.
The results are helpful for space planning and management purposes in providing an insight into how space is being used. There are limitations with the existing approach, however, in that it is usually restricted to teaching space, and there can be difficulties in interpreting results. For example, the headline utilisation rate is combination of how often rooms are used and how full they are when they are in use.
It is recommended that space utilisation ratios should be updated. It is proposed that the study will also assess the scope for extending the review of utilisation to other key components of the HE estate, including office, research and support space in order to provide a wider understanding the pressure points and opportunities for additional or alternative uses across the estate.
The study will also review the approach to reporting on frequency and occupancy factors and providing clearer links to the efficiency and effectiveness of space use.

APPENDIX 1PREVIOUS RESEARCH AND GOOD PRACTICE GUIDANCE
The following pages provide a summary of previous projects and good practice guidance which provided the context for the estate work stream.

Diamond Review Phase II 2015 April 2015 · 61
PROJECT FOCUSPRINCIPAL ADVICE/RECOMMENDATIONS
1996
National Audit Office (NAO)
The Management of Space in Higher Education Intuitions in Wales
The NAO recognised that the provision and maintenance of space and the way in which an institution manages its space are key factors in the efficient application of resources at its disposal.
It noted, however, that there was little guidance available to institutions on space management in higher education.
The NAO examined the key issues affecting the utilisation of the Welsh higher education estate and considered techniques which might be applied to improve space management.
The NAO recommended a framework for good practice in higher education to improve the way that the academic estate was used and how well it could meet users’ requirements.
The publication A Good Practice Guide on Space Management in Higher Education set out the framework’s recommendations:
• Effective management structure
• Up to date and comprehensive database of information about the use of the estate
• Integrated package of space management measures to achieve the optimum allocation and distribution of space.
200
0 HEFCE
Estate Strategy Guidance
The objective was to provide guidance explaining the benefits of a strategy for managing and developing one of HEIs’ most valuable assets, and to set out the issues to be considered and the key people to be consulted.
Key points from the guidance were:
• An estate strategy needs to be part of an HEI’s corporate strategy, supporting the achievement of its aims and objectives
• It should contain a full performance assessment of the estate
• It should be developed in the context of the institution’s financial strategy
• The support and approval of the governing body are essential.
1999
Estate Management Returns
AUDE began the HE estate data collection initiative began within the sector with joint funding from the UK funding councils. In 2010, it moved to HESA and the exercise became known as the Estate Management Return.
EMR was established to provide the HE sector with standardised, reliable and useful property information to help managers understand current performance, promote sharing of best practice and drive improvements. Return of data was optional for institutions, though in practice the majority of institutions have provided data in each year.
Annual collection of data on the estate which has been expanded to cover the HE non-residential and residential estates including:
• Buildings and functionality
• Environment, energy and emissions
• Finance
• Health and safety
• Space measurement
• Student and staff date
Data is used by institutions to monitor trends, benchmark performance and form the basis of their key performance indicators for estate management.
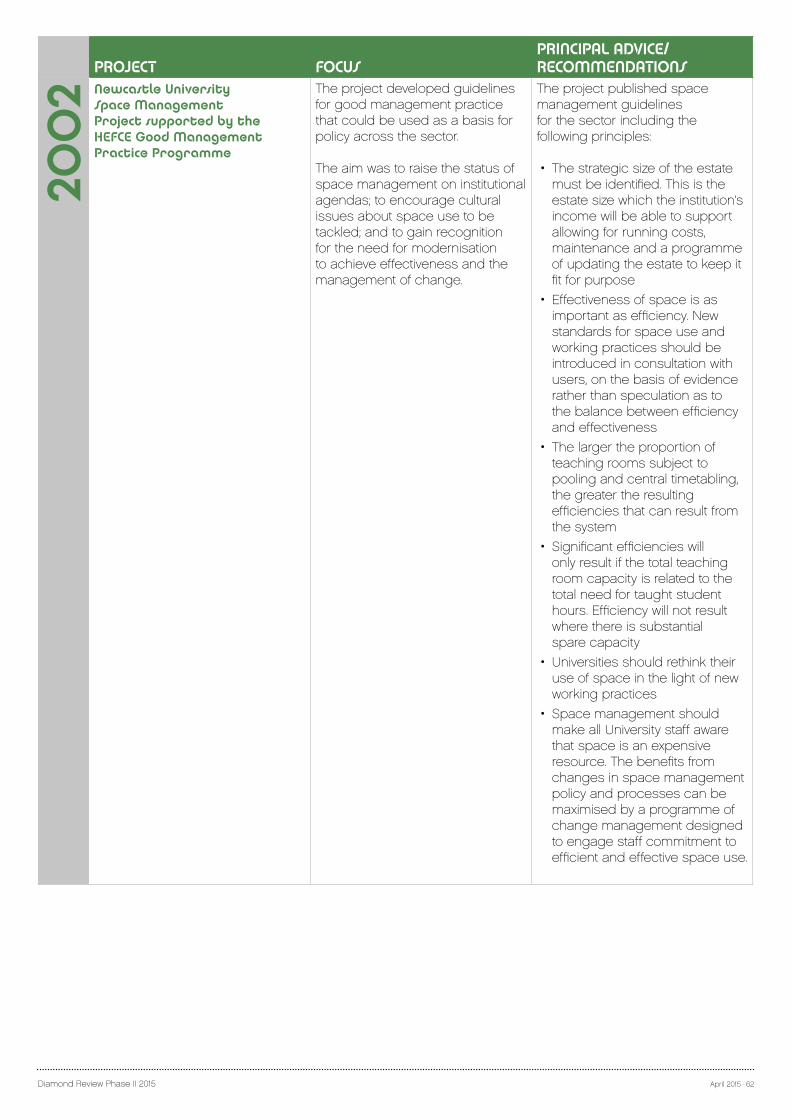
Diamond Review Phase II 2015 April 2015 · 62
PROJECT FOCUSPRINCIPAL ADVICE/RECOMMENDATIONS
200
2 Newcastle University Space Management Project supported by the HEFCE Good Management Practice Programme
The project developed guidelines for good management practice that could be used as a basis for policy across the sector.
The aim was to raise the status of space management on institutional agendas; to encourage cultural issues about space use to be tackled; and to gain recognition for the need for modernisation to achieve effectiveness and the management of change.
The project published space management guidelines for the sector including the following principles:
• The strategic size of the estate must be identified. This is the estate size which the institution’s income will be able to support allowing for running costs, maintenance and a programme of updating the estate to keep it fit for purpose
• Effectiveness of space is as important as efficiency. New standards for space use and working practices should be introduced in consultation with users, on the basis of evidence rather than speculation as to the balance between efficiency and effectiveness
• The larger the proportion of teaching rooms subject to pooling and central timetabling, the greater the resulting efficiencies that can result from the system
• Significant efficiencies will only result if the total teaching room capacity is related to the total need for taught student hours. Efficiency will not result where there is substantial spare capacity
• Universities should rethink their use of space in the light of new working practices
• Space management should make all University staff aware that space is an expensive resource. The benefits from changes in space management policy and processes can be maximised by a programme of change management designed to engage staff commitment to efficient and effective space use.

Diamond Review Phase II 2015 April 2015 · 63
PROJECT FOCUSPRINCIPAL ADVICE/RECOMMENDATIONS
200
2 Education and Learning Wales (ELWa)
Space Management – A Good Practice Guide
A joint study between the Higher Education Funding Council for Wales and Swansea University built on the NAO research and looked at additional practical ways in which space use and space management could be improved.
It highlighted that the estate can have inherent constraints which affect space use and management including poor condition, unsuitable space designed for different teaching and research processes. It noted that space utilisation was not an end in itself but a means of obtaining wider benefits for institutions.
The study developed a space management change model and recommended that institutions should develop their own action plans for change.
A key recommendation was that institutions should identify real current and future needs on a proactive rather than a reactive basis.
200
1 Effective Estate Management – A guide to Self Assessment(AUDESAT)
AUDE
The project comprised the development of a self assessment tool to assist heads of institutions, senior managers and directors of estates to manage more effectively and so help them to deliver their institution’s strategic goals. It added qualitative information to the EMR quantitative data.
The framework of the toolkit was based around six core competencies:
• Leadership
• Strategy
• Processes
• People
• Resources
• Outcomes
200
2-20
06 Science Research Investment
Fund (SRIF)
SRIF was a major programme of investment in physical infrastructure for research funded jointly by the Office of Science and Technology (OST) and the UK higher education funding bodies.
Its aims were:
• to contribute to the long-term financial sustainability of institutions’ research activities and the physical infrastructure that supports them to contribute to addressing past under-investment in institutions’ physical infrastructure for research
• to promote collaborative partnerships between HEIs, industry, charities, Government and NHS Trusts
• to promote high quality research capability in areas of national strategic importance as set out in the Government’s 10 year science and innovation investment framework.
The priorities for the use of SRIF funding were on securing the effective use of facilities, specifically:
• to maintain the productive capacity of the existing research infrastructure in a fit state. It was not expected that SRIF3 funding would be used to increase space, except in new or emerging fields of research
• to invest so that the existing capacity was used more productively or efficiently without increasing gross floor area or capacity
• to enable institutions to enhance and maximise the public and private use of higher education’s research expertise and facilities.
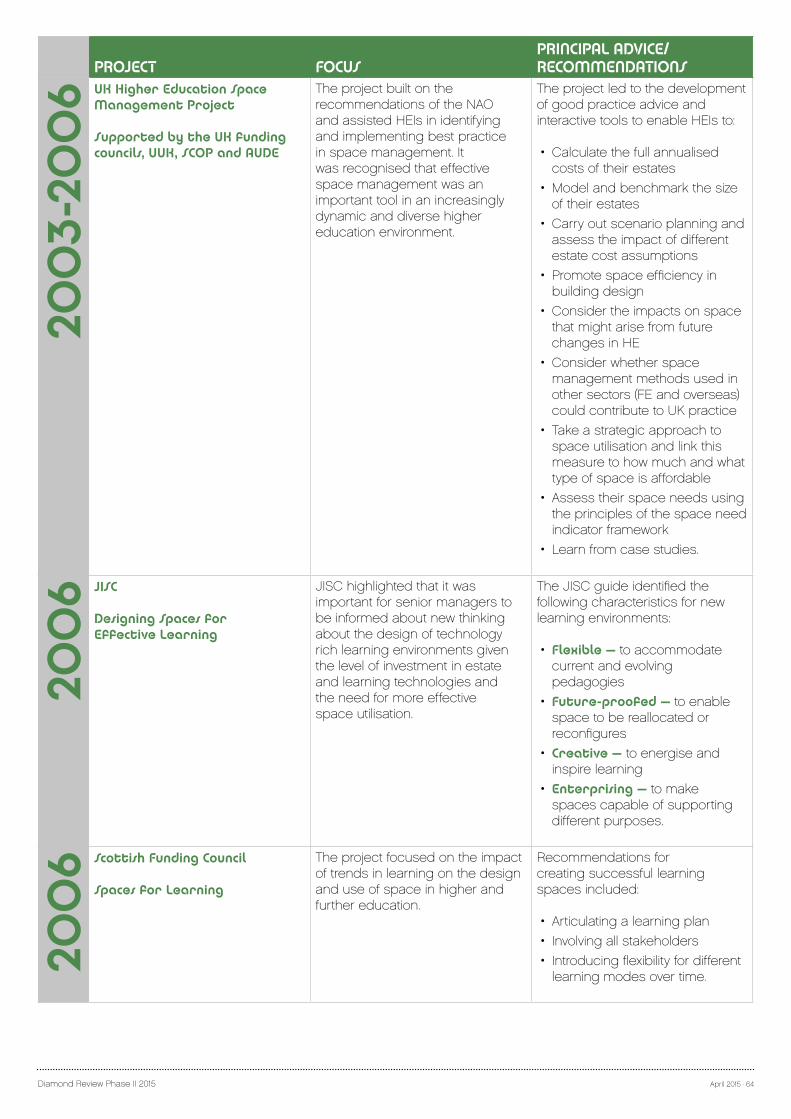
Diamond Review Phase II 2015 April 2015 · 64
PROJECT FOCUSPRINCIPAL ADVICE/RECOMMENDATIONS
200
3-20
06 UK Higher Education Space
Management Project
Supported by the UK funding councils, UUK, SCOP and AUDE
The project built on the recommendations of the NAO and assisted HEIs in identifying and implementing best practice in space management. It was recognised that effective space management was an important tool in an increasingly dynamic and diverse higher education environment.
The project led to the development of good practice advice and interactive tools to enable HEIs to:
• Calculate the full annualised costs of their estates
• Model and benchmark the size of their estates
• Carry out scenario planning and assess the impact of different estate cost assumptions
• Promote space efficiency in building design
• Consider the impacts on space that might arise from future changes in HE
• Consider whether space management methods used in other sectors (FE and overseas) could contribute to UK practice
• Take a strategic approach to space utilisation and link this measure to how much and what type of space is affordable
• Assess their space needs using the principles of the space need indicator framework
• Learn from case studies.
200
6 JISC
Designing Spaces for Effective Learning
JISC highlighted that it was important for senior managers to be informed about new thinking about the design of technology rich learning environments given the level of investment in estate and learning technologies and the need for more effective space utilisation.
The JISC guide identified the following characteristics for new learning environments:
• Flexible – to accommodate current and evolving pedagogies
• Future-proofed – to enable space to be reallocated or reconfigures
• Creative – to energise and inspire learning
• Enterprising – to make spaces capable of supporting different purposes.
200
6 Scottish Funding Council
Spaces for Learning
The project focused on the impact of trends in learning on the design and use of space in higher and further education.
Recommendations for creating successful learning spaces included:
• Articulating a learning plan
• Involving all stakeholders
• Introducing flexibility for different learning modes over time.
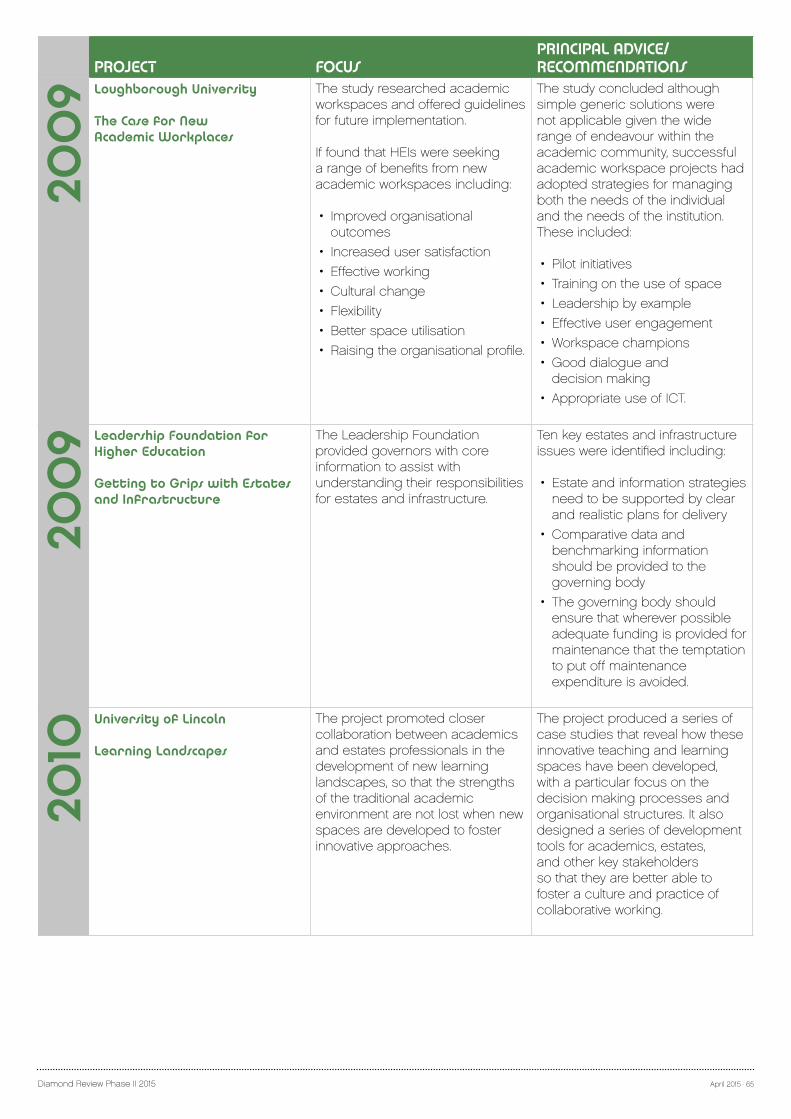
Diamond Review Phase II 2015 April 2015 · 65
PROJECT FOCUSPRINCIPAL ADVICE/RECOMMENDATIONS
200
9 Loughborough University
The Case for New Academic Workplaces
The study researched academic workspaces and offered guidelines for future implementation.
If found that HEIs were seeking a range of benefits from new academic workspaces including:
• Improved organisational outcomes
• Increased user satisfaction
• Effective working
• Cultural change
• Flexibility
• Better space utilisation
• Raising the organisational profile.
The study concluded although simple generic solutions were not applicable given the wide range of endeavour within the academic community, successful academic workspace projects had adopted strategies for managing both the needs of the individual and the needs of the institution. These included:
• Pilot initiatives
• Training on the use of space
• Leadership by example
• Effective user engagement
• Workspace champions
• Good dialogue and decision making
• Appropriate use of ICT.
200
9 Leadership Foundation for Higher Education
Getting to Grips with Estates and Infrastructure
The Leadership Foundation provided governors with core information to assist with understanding their responsibilities for estates and infrastructure.
Ten key estates and infrastructure issues were identified including:
• Estate and information strategies need to be supported by clear and realistic plans for delivery
• Comparative data and benchmarking information should be provided to the governing body
• The governing body should ensure that wherever possible adequate funding is provided for maintenance that the temptation to put off maintenance expenditure is avoided.
2010
University of Lincoln
Learning Landscapes
The project promoted closer collaboration between academics and estates professionals in the development of new learning landscapes, so that the strengths of the traditional academic environment are not lost when new spaces are developed to foster innovative approaches.
The project produced a series of case studies that reveal how these innovative teaching and learning spaces have been developed, with a particular focus on the decision making processes and organisational structures. It also designed a series of development tools for academics, estates, and other key stakeholders so that they are better able to foster a culture and practice of collaborative working.
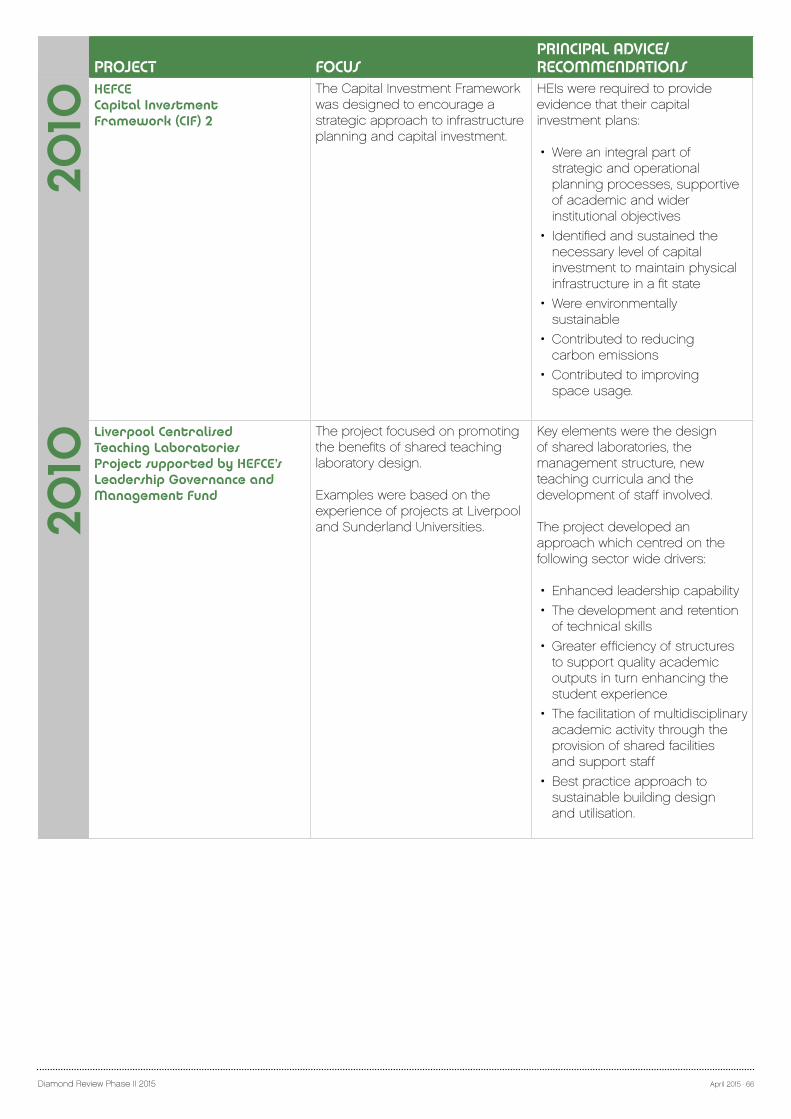
Diamond Review Phase II 2015 April 2015 · 66
PROJECT FOCUSPRINCIPAL ADVICE/RECOMMENDATIONS
2010
HEFCECapital Investment Framework (CIF) 2
The Capital Investment Framework was designed to encourage a strategic approach to infrastructure planning and capital investment.
HEIs were required to provide evidence that their capital investment plans:
• Were an integral part of strategic and operational planning processes, supportive of academic and wider institutional objectives
• Identified and sustained the necessary level of capital investment to maintain physical infrastructure in a fit state
• Were environmentally sustainable
• Contributed to reducing carbon emissions
• Contributed to improving space usage.
2010
Liverpool Centralised Teaching Laboratories Project supported by HEFCE’s Leadership Governance and Management Fund
The project focused on promoting the benefits of shared teaching laboratory design.
Examples were based on the experience of projects at Liverpool and Sunderland Universities.
Key elements were the design of shared laboratories, the management structure, new teaching curricula and the development of staff involved. The project developed an approach which centred on the following sector wide drivers:
• Enhanced leadership capability
• The development and retention of technical skills
• Greater efficiency of structures to support quality academic outputs in turn enhancing the student experience
• The facilitation of multidisciplinary academic activity through the provision of shared facilities and support staff
• Best practice approach to sustainable building design and utilisation.
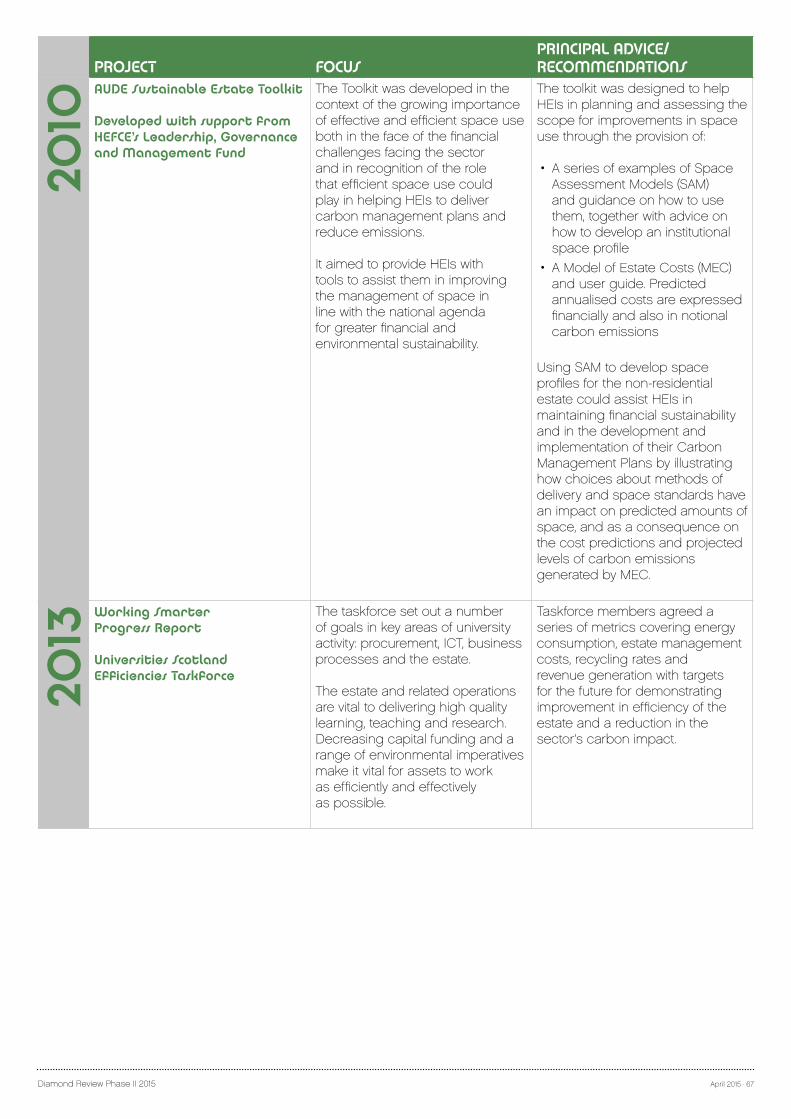
Diamond Review Phase II 2015 April 2015 · 67
PROJECT FOCUSPRINCIPAL ADVICE/RECOMMENDATIONS
2010
AUDE Sustainable Estate Toolkit
Developed with support from HEFCE’s Leadership, Governance and Management Fund
The Toolkit was developed in the context of the growing importance of effective and efficient space use both in the face of the financial challenges facing the sector and in recognition of the role that efficient space use could play in helping HEIs to deliver carbon management plans and reduce emissions.
It aimed to provide HEIs with tools to assist them in improving the management of space in line with the national agenda for greater financial and environmental sustainability.
The toolkit was designed to help HEIs in planning and assessing the scope for improvements in space use through the provision of:
• A series of examples of Space Assessment Models (SAM) and guidance on how to use them, together with advice on how to develop an institutional space profile
• A Model of Estate Costs (MEC) and user guide. Predicted annualised costs are expressed financially and also in notional carbon emissions
Using SAM to develop space profiles for the non-residential estate could assist HEIs in maintaining financial sustainability and in the development and implementation of their Carbon Management Plans by illustrating how choices about methods of delivery and space standards have an impact on predicted amounts of space, and as a consequence on the cost predictions and projected levels of carbon emissions generated by MEC.
2013
Working Smarter Progress Report
Universities ScotlandEfficiencies Taskforce
The taskforce set out a number of goals in key areas of university activity: procurement, ICT, business processes and the estate.
The estate and related operations are vital to delivering high quality learning, teaching and research. Decreasing capital funding and a range of environmental imperatives make it vital for assets to work as efficiently and effectively as possible.
Taskforce members agreed a series of metrics covering energy consumption, estate management costs, recycling rates and revenue generation with targets for the future for demonstrating improvement in efficiency of the estate and a reduction in the sector’s carbon impact.
For report enquiries please contact:
DR. GHAZWA ALWANI-STARRDirector of Estates and Campus Services, University of RoehamptonChair, AUDE London Group
020 8392 [email protected]
Excellence in Estates and Facilities


![Learning WebMatrix: Part 2 of 3 Akber Alwani ]](https://img.pdfslide.us/doc/110x75/56649e2a5503460f94b17de9/learning-webmatrix-part-2-of-3-akber-alwani-httptwittercomepdotnet-.jpg)