Embed Size (px)
Citation preview
Delivering the Nuclear Promise
Rod McCullumNuclear Energy Institute
NCSL Nuclear Legislative Working GroupNew Orleans, LA
November 16, 2016
1
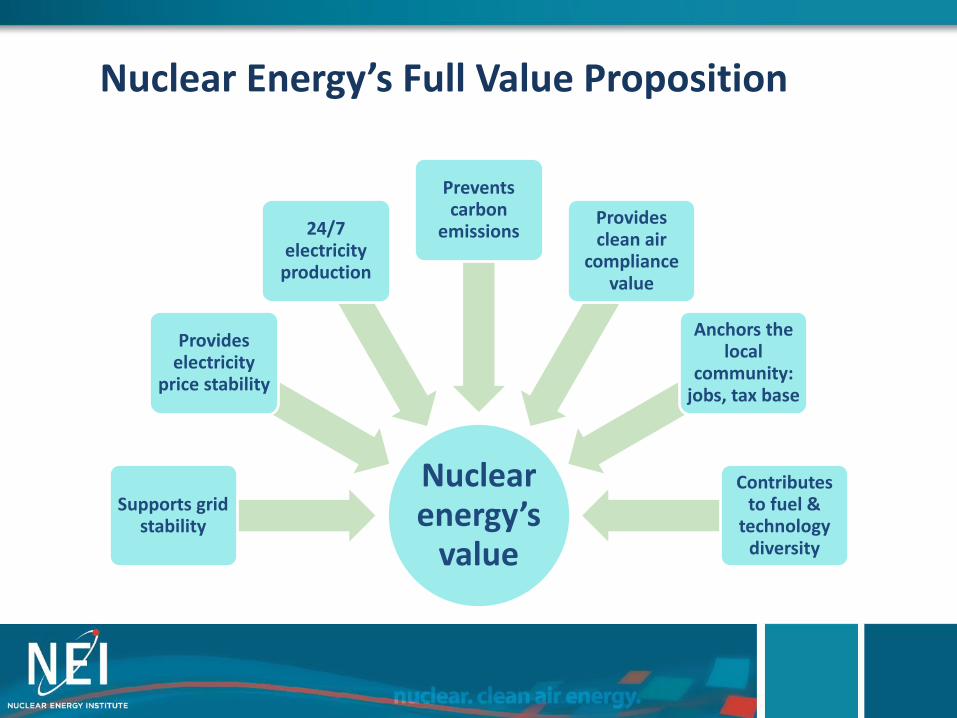
Nuclear Energy’s Full Value Proposition
Nuclear energy’s
value
Supports grid stability
Provides electricity
price stability
24/7 electricity
production
Prevents carbon
emissionsProvides clean air
compliance value
Anchors the local
community: jobs, tax base
Contributes to fuel &
technology diversity

Nuclear – Ready to Deliver
U.S. Nuclear Plant Capacity
Factor*
*Source: Energy Information Administration
92.2% in 2015
91.7% in 2014
89.9% in 2013
86.1% in 2012
89.1% in 2011
91.1% in 2010
• U.S. reactors set record 92%
capacity factor in 2015
• 798 billion kWh
• 62.9% of U.S. carbon free electricity
• 4 new reactors being built
• 81 licenses extended to 60 yrs.
• 1st application for extension to 80
years submitted (Surry in VA)

Nuclear Plant Shutdowns: The Situation
• Reactor shutdowns
- Four in 2013 (2 in California, Florida, Wisconsin)
- One at the end of 2014 (Vermont)
- One in 2016 (Nebraska)
• Wisconsin, Vermont, Nebraska shut down because of adverse market conditions
• Announced shutdowns
• Prior to 2020: 3 in Illinois, 1 in Massachusetts, 1 in New Jersey
• 2025: 2 in California
• Others at risk
The carbon-free electricity lost when San Onofre closed down was greater than the carbon-free electricity from all California’s wind and solar
generating capacity
18,097 GWh 16,985
GWh
San Onofre 2 & 3 generation inlast full year of operation (2011)
California wind and solargeneration full-year 2013
4

• Average generating costs have decreased from peak of $39.75/MWh in 2012 to $35.50/MWh in 2015.
• Average generating costs have decreased 2.4% from 2014.
• Capital spending down 3% from 2014, and 26% from 2012 peak.
• $6.25 billion in 2015 capex.
Snapshot of 2015 U.S. Nuclear Plant Costs($ per MWh)
2015 Average Generating Costs
2015 Generating Cost
Total generating cost = fuel + capital + operating. Source: Electric Utility Cost Group.
FirstQuartile
IndustryAverage
Single Unit Sites
Multi-UnitSites

Forward Prices
Declining Wholesale Electricity Prices
$45-75/MWhPrice Range
$30-50/MWhPrice Range $30-42/MWh
Price Range

Market Stresses … In Brief
• Low growth (in some cases, no growth) in electricity demand
• Continuing surge in supply of low-cost shale gas• Market design issues
- Fuel/technology diversity taken for granted and undervalued
- State and federal mandates and subsidies for renewables - Lack of recognition of valuable attributes of nuclear- Price suppression in energy markets
• Transmission constraints

8
New England Forward Power Prices for 2019
Sources: Platts Mass Hub average forward power prices; 2020 New
England Energy Demand: 145 GWh; ISONE 2015 CELT Report
New England Forward Power Prices for 2015
Pilgrim Announcement Oct. 2015
Vermont Yankee Announcement Aug. 2013
$2.30/MWh
$2.50/MWh
• Pilgrim announcement met with $2.30/MWh increase in futures price for New England
- ~$330 million in additional costs to consumers in one year
• Market reaction to Vermont Yankee similar to Pilgrim
• PJM estimated losing three at-risk Illinois plants would raise prices $2.70 - $3.80/MWh in ComEd zone
Losing Nuclear = Higher Prices to Customers

You are here
9
Genesis of the Nuclear Promise
• Our industry is operating in electricity markets that are deluged with natural gas at historically low prices
• Nuclear industry capability factor and reliability is at extraordinary levels…but total generating costs at nuclear plants have increased 28% in the last 12 years.
• “Business as usual” approach will not successfully address the challenges of rising costs and inadequate revenue
• Advance safety, reliability and economic performance together.

Part of the Solution: Delivering the Nuclear Promise
• Sustain high levels of safety and reliability
• Identify opportunities to re-design plant processes, drive innovation to improve efficiency and effectiveness
• Gain greater value for nuclear energy in electricity and clean air policy
Goal: Average cost of electricity is $28 per megawatt-hour

Four Building Blocks
Analysis and MonitoringObjective: Analyze plant cost drivers and identify opportunities to improve efficiency
Value RecognitionObjective: Leverage federal and state policies to ensure recognition of nuclear energy’s value
Process and Program RedesignObjective: Re-design nuclear plant processes to improve efficiency while advancing the fundamentals of safe, reliable operation
Strategic CommunicationsObjective: Implement a communications strategy to ensure industry engagement and stakeholder awareness

Building Block: Analysis and Monitoring
• CNO-led teams identified priority areas Including improvement opportunities in work management, radiation
protection, training, security and preventive maintenance
• Completed analysis of plant cost drivers Identified opportunities for efficiencies to be gained and
administrative burden reduced…
While maintaining safety and reliability
• Steering committee identified implementation “windows”
Pace and scope of site implementation to be determined by the company that owns and operates plant

Teams and CNO Leads
• Corrective Action Program Danny Bost, Southern Nuclear
• Engineering Tim Rausch, Talen Energy
• In-Processing Bill Pitesa, Duke Energy
• Oversight and Assessment Mano Nazar, NextEra Energy
• Preventive Maintenance Templates Neil Wilmshurst, EPRI
• Radiation Protection Fadi Diya, Ameren Missouri
• Regulatory Efficiency Mano Nazar, NextEra Energy
• Risk-Informed Operations Bob Bement, Arizona Public Service
• Security Bryan Hanson, Exelon
• Training Randy Edington, Arizona Public Service
• Transform Organization Tim O’Connor, Xcel Energy
• Work Management Preparation Dennis Koehl, South Texas Project
• Supply Chain Adam Heflin, Wolf Creek Nuclear Operating Corp.
Building Block: Process and Program Redesign
• 45 efficiency bulletins expected by end 2016
• Enabled savings approaching $500 million
Efficiency must take its place with hallmarks of
safety, reliability
• Anticipating and addressing emerging regulatory or technological issues

NEI Efficiency Bulletins
16
• Vehicle for deploying efficiency ideas to fleet
• Value proposition - explains how idea advances safety, reliability and efficiency; Points to applicable guidance
• Levels of Commitment:- Mandatory Initiative
o All must implement if approved by 80% vote of industry CNOs
- All expected to implement
- Utility discretion
Examples of Completed Efficiency Bulletins
• EB 16-02: Implement Graded Approach to Walk-downs
• EB 16-04: Source Checking Personnel and Tool Contamination Monitors
• EB 16-22: Implementing and Effective and Efficient Work Management Process
• EB 16-26a,b,c,d: Standardization of Nuclear Access Requirements, In-processing Training, Radiation Worker Training, and Supplemental Supplier Contracts

Building Block: Value Recognition
• Increasing value recognition for existing reactors- Earning value for clean air attributes
New York’s new clean energy standard
Upstate nuclear plants to receive appropriate compensation
Precedent for other state, regional policy
- Advocating changes in electricity markets for additional value: Capacity pricing
Energy price formation
- Pursuing changes at FERC and RTOs
- Clean Power Plan implementation plans should recognize value of nuclear energy

Solutions Emerging Among the States (redesign)
• New York – Clean Energy Standard approved by Public Service Commission
• Ohio/Pennsylvania – First Energy actively seeking a solution for nuclear units recognizes their environmental benefits
• Illinois – Evaluating legislative proposal similar to New York
• Connecticut – Legislation including Millstone cleared Senate

Building Block: Strategic Communications
• Communications emphasizing industry’s effort to enhance efficiency, need for value recognition
• Advocating greater value for nuclear power plants in electricity and clean air markets
• Workforce Communications
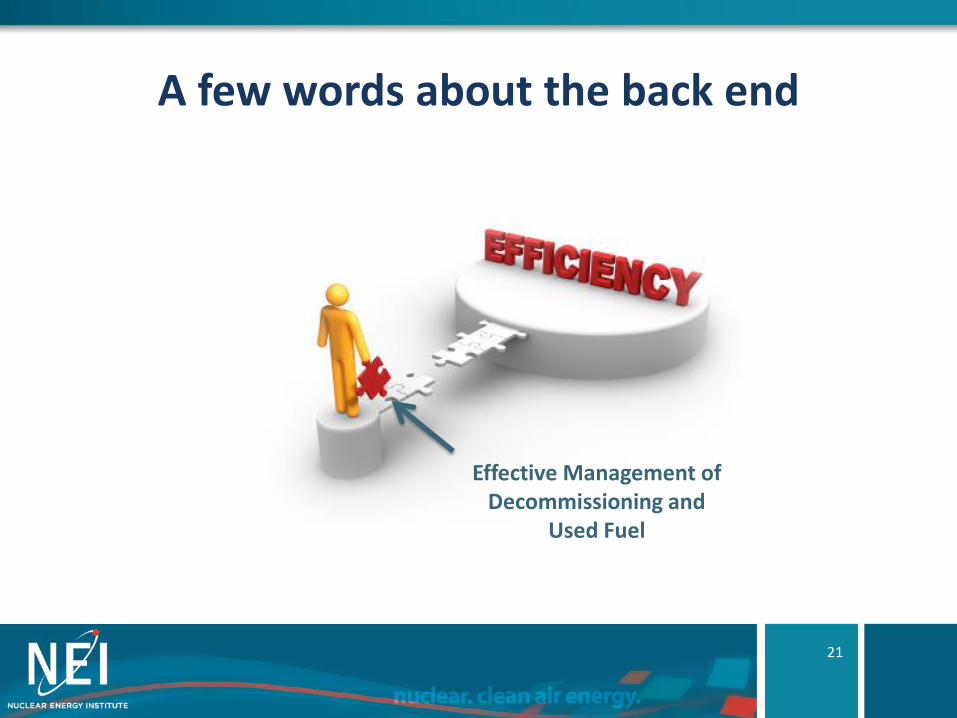
A few words about the back end
21
Effective Management of Decommissioning and
Used Fuel
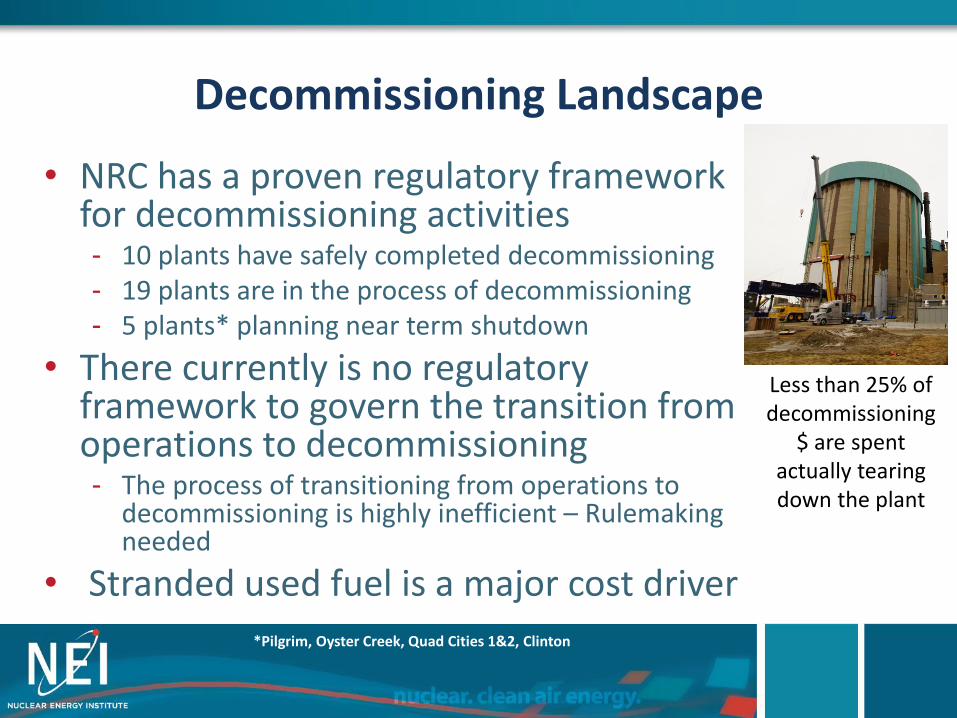
Decommissioning Landscape
• NRC has a proven regulatory framework for decommissioning activities- 10 plants have safely completed decommissioning- 19 plants are in the process of decommissioning- 5 plants* planning near term shutdown
• There currently is no regulatory framework to govern the transition from operations to decommissioning- The process of transitioning from operations to
decommissioning is highly inefficient – Rulemaking needed
• Stranded used fuel is a major cost driver
*Pilgrim, Oyster Creek, Quad Cities 1&2, Clinton
Less than 25% of decommissioning
$ are spent actually tearing down the plant

Vast Energy Produced – Small Volume
23
All the used nuclear fuel generated, if stacked, would only cover one football field <10 yards high
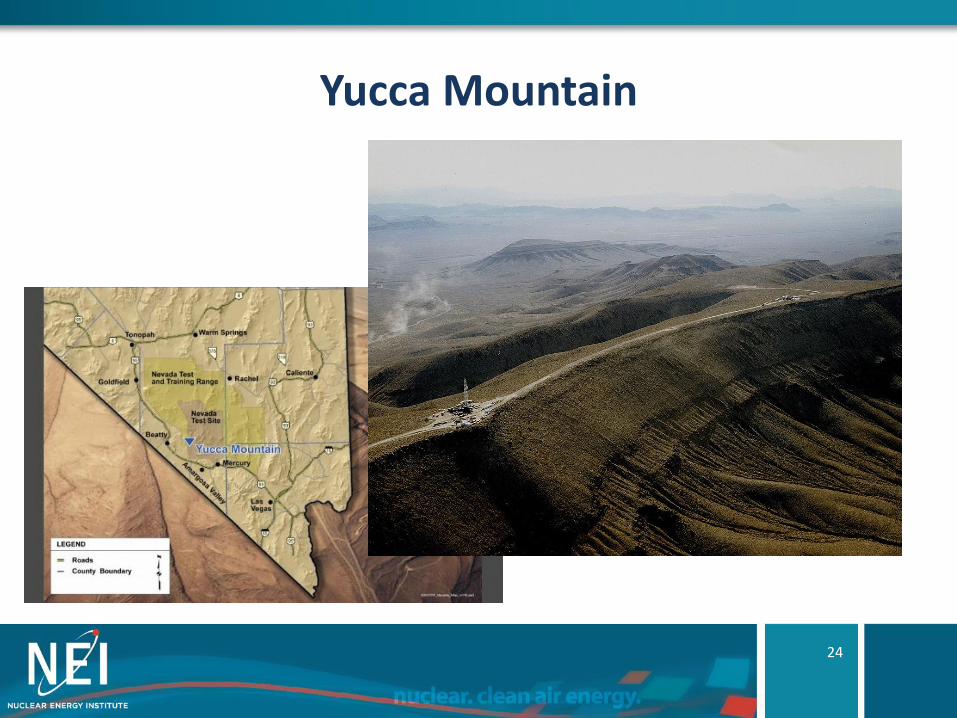
Yucca Mountain
24

Other Used Fuel Management Improvements
Private entities are seeking to develop consolidated interim storage at away from reactor sites
• Waste Control Specialists has applied for an NRC license to store used fuel in West Texas
• The Eddy-Lea Energy Alliance plans to do the same thing in New Mexico
• DOE is now seeking to engage
25

Game Changers on the Drawing Board
• Accident Tolerant Fuel
• Small Modular Reactors
• Advanced Reactors
26

Conclusion
• The future of nuclear energy in the U.S.
• Industry’s Delivering the Nuclear Promise initiative seeks to keep nuclear in the mix
• How states interact with electricity markets will significantly affect the outcome
27
Growth? Decline?

Questions?
Rod McCullum
Nuclear Energy Institute
202-739-8082
28