Embed Size (px)
Citation preview
Delivering superior returns
Chris Lynch, chief financial officerBMO Global Metals & Mining Conference 26 February 2018
Cautionary statements
©2018, Rio Tinto, All Rights Reserved
2
This presentation has been prepared by Rio Tinto plc and Rio Tinto Limited (“Rio Tinto”). By accessing/attending this presentation you acknowledge that you have read and understood the following statement.
Forward-looking statements
This document, including but not limited to all forward looking figures, contains certain forward-looking statements with respect to the financial condition, results of operations and business of the Rio Tinto Group. These statements are forward-looking statements within the meaning of Section 27A of the US Securities Act of 1933, and Section 21E of the US Securities Exchange Act of 1934. The words “intend”, “aim”, “project”, “anticipate”, “estimate”, “plan”, “believes”, “expects”, “may”, “should”, “will”, “target”, “set to” or similar expressions, commonly identify such forward-looking statements.
Examples of forward-looking statements include those regarding estimated ore reserves, anticipated production or construction dates, costs, outputs and productive lives of assets or similar factors. Forward-looking statements involve known and unknown risks, uncertainties, assumptions and other factors set forth in this presentation.
For example, future ore reserves will be based in part on market prices that may vary significantly from current levels. These may materially affect the timing and feasibility of particular developments. Other factors include the ability to produce and transport products profitably, demand for our products, changes to the assumptions regarding the recoverable value of our tangible and intangible assets, the effect of foreign currency exchange rates on market prices and operating costs, and activities by governmental authorities, such as changes in taxation or regulation, and political uncertainty.
In light of these risks, uncertainties and assumptions, actual results could be materially different from projected future results expressed or implied by these forward-looking statements which speak only as to the date of this presentation. Except as required by applicable regulations or by law, the Rio Tinto Group does not undertake any obligation to publicly update or revise any forward-looking statements, whether as a result of new information or future events. The Group cannot guarantee that its forward-looking statements will not differ materially from actual results. In this presentation all figures are US dollars unless stated otherwise.
Disclaimer
Neither this presentation, nor the question and answer session, nor any part thereof, may be recorded, transcribed, distributed, published or reproduced in any form, except as permitted by Rio Tinto. By accessing/ attending this presentation, you agree with the foregoing and, upon request, you will promptly return any records or transcripts at the presentation without retaining any copies.
This presentation contains a number of non-IFRS financial measures. Rio Tinto management considers these to be key financial performance indicators of the business and they are defined and/or reconciled in Rio Tinto’s annual results press release and/or Annual report.
Reference to consensus figures are not based on Rio Tinto’s own opinions, estimates or forecasts and are compiled and published without comment from, or endorsement or verification by, Rio Tinto. The consensus figures do not necessarily reflect guidance provided from time to time by Rio Tinto where given in relation to equivalent metrics, which to the extent available can be found on the Rio Tinto website.
By referencing consensus figures, Rio Tinto does not imply that it endorses, confirms or expresses a view on the consensus figures. The consensus figures are provided for informational purposes only and are not intended to, nor do they, constitute investment advice or any solicitation to buy, hold or sell securities or other financial instruments. No warranty or representation, either express or implied, is made by Rio Tinto or its affiliates, or their respective directors, officers and employees, in relation to the accuracy, completeness or achievability of the consensus figures and, to the fullest extent permitted by law, no responsibility or liability is accepted by any of those persons in respect of those matters. Rio Tinto assumes no obligation to update, revise or supplement the consensus figures to reflect circumstances existing after the date hereof.
Supporting statements
Ore Reserves (slide 15)
Reserve grade for Oyu Tolgoi Underground – Hugo Dummett North and Hugo Dummett North Extension. Probable Ore Reserves for Hugo Dummett North and Hugo Dummett North Extension (499 Mt at 1.66% Cu, 0.35g/t Au)
were released to the market in the 2016 Rio Tinto Annual Report on 2 March 2017 and can be found on p224 of that report. The Competent Person responsible for reporting of those Ore Reserves was J Dudley.
Reserve grade for Amrun (formerly South of Embley). Proved and Probable Ore Reserves (1409Mt at 52.4% Al2O3) for Amrun (South of Embley) were released to the market in the 2016 Rio Tinto Annual Report on 2 March 2017
and can be found on p223 of that report. The Competent Person responsible for reporting of those Ore Reserves was L McAndrew.
Rio Tinto is not aware of any new information or data that materially affects the above reserve grade estimates as reported in the 2016 Annual Report, and confirms that all material assumptions and technical parameters
underpinning these estimates continue to apply and have not materially changed. The form and context in which each Competent Person’s findings are presented have not been materially modified.
Production Targets
The production target for Oyu Tolgoi shown on slide 15 is the average production 2025-2030, including open pit production. This production target was disclosed in a release to the market on 6 May 2016 (“Rio Tinto approves
development of Oyu Tolgoi underground mine”). All material assumptions underpinning these production targets continue to apply and have not materially changed.
©2018, Rio Tinto, All Rights Reserved
3
Our strategy is delivering
©2018, Rio Tinto, All Rights Reserved
4
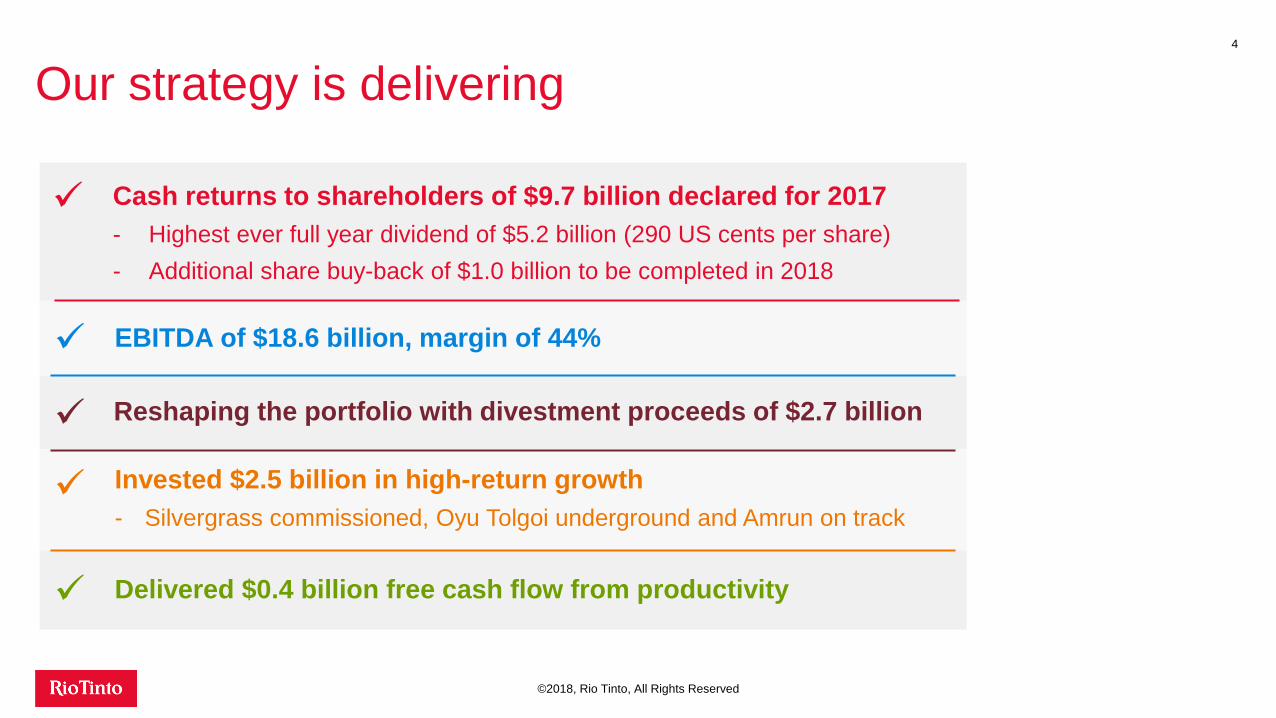
EBITDA of $18.6 billion, margin of 44%
Reshaping the portfolio with divestment proceeds of $2.7 billion
Cash returns to shareholders of $9.7 billion declared for 2017
- Highest ever full year dividend of $5.2 billion (290 US cents per share)
- Additional share buy-back of $1.0 billion to be completed in 2018
Invested $2.5 billion in high-return growth
- Silvergrass commissioned, Oyu Tolgoi underground and Amrun on track
Delivered $0.4 billion free cash flow from productivity
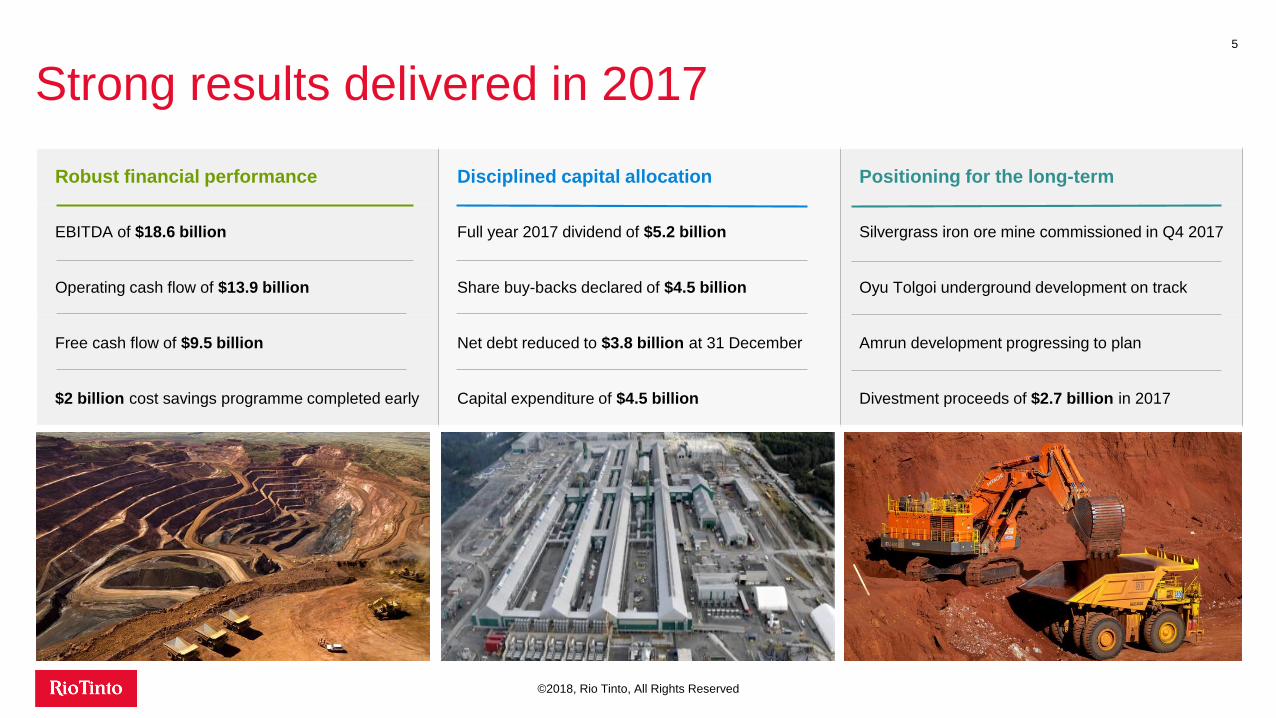
Strong results delivered in 2017
©2018, Rio Tinto, All Rights Reserved
5
Robust financial performance Disciplined capital allocation Positioning for the long-term
EBITDA of $18.6 billion Full year 2017 dividend of $5.2 billion Silvergrass iron ore mine commissioned in Q4 2017
Operating cash flow of $13.9 billion Share buy-backs declared of $4.5 billion Oyu Tolgoi underground development on track
Free cash flow of $9.5 billion Net debt reduced to $3.8 billion at 31 December Amrun development progressing to plan
$2 billion cost savings programme completed early Capital expenditure of $4.5 billion Divestment proceeds of $2.7 billion in 2017
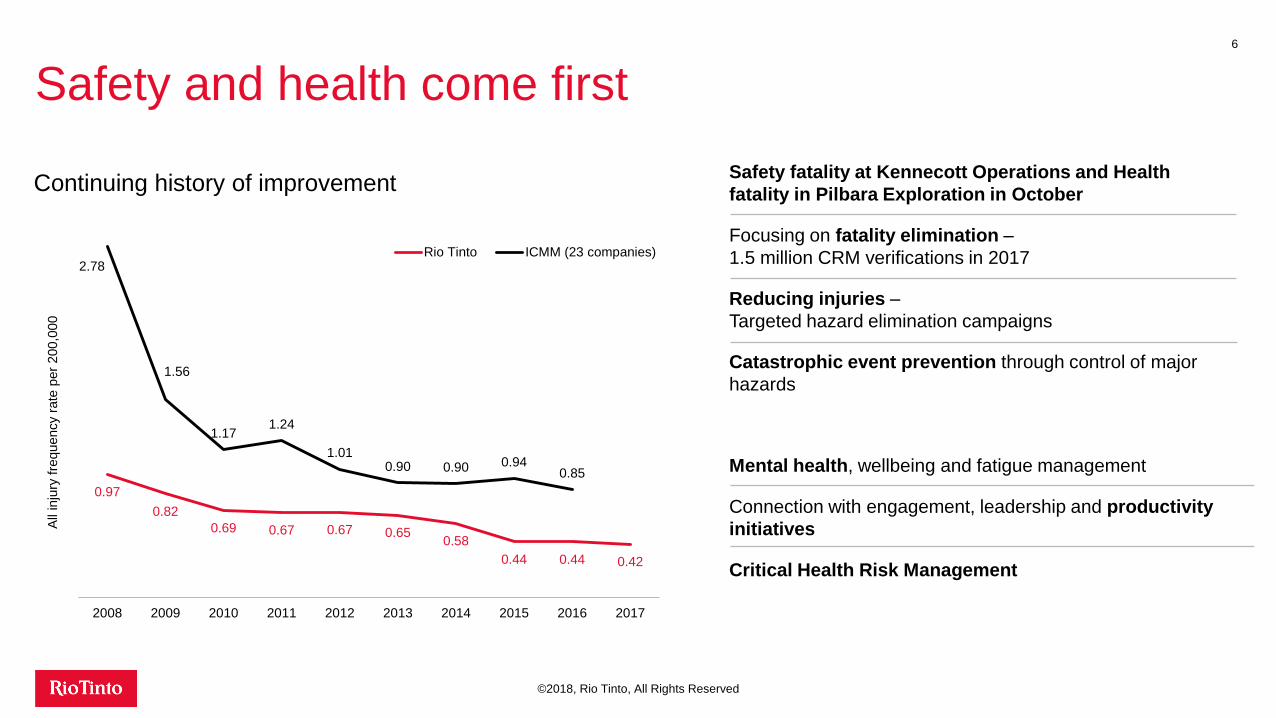
Safety and health come first6
©2018, Rio Tinto, All Rights Reserved
Continuing history of improvement
Mental health, wellbeing and fatigue management
Connection with engagement, leadership and productivity
initiatives
Critical Health Risk Management
Safety fatality at Kennecott Operations and Health
fatality in Pilbara Exploration in October
Focusing on fatality elimination –
1.5 million CRM verifications in 2017
Reducing injuries –
Targeted hazard elimination campaigns
Catastrophic event prevention through control of major
hazards
0.97
0.82
0.69 0.67 0.67 0.650.58
0.44 0.44 0.42
2.78
1.56
1.171.24
1.010.90 0.90 0.94
0.85
2008 2009 2010 2011 2012 2013 2014 2015 2016 2017
All
inju
ry f
requency r
ate
per
200,0
00
Rio Tinto ICMM (23 companies)
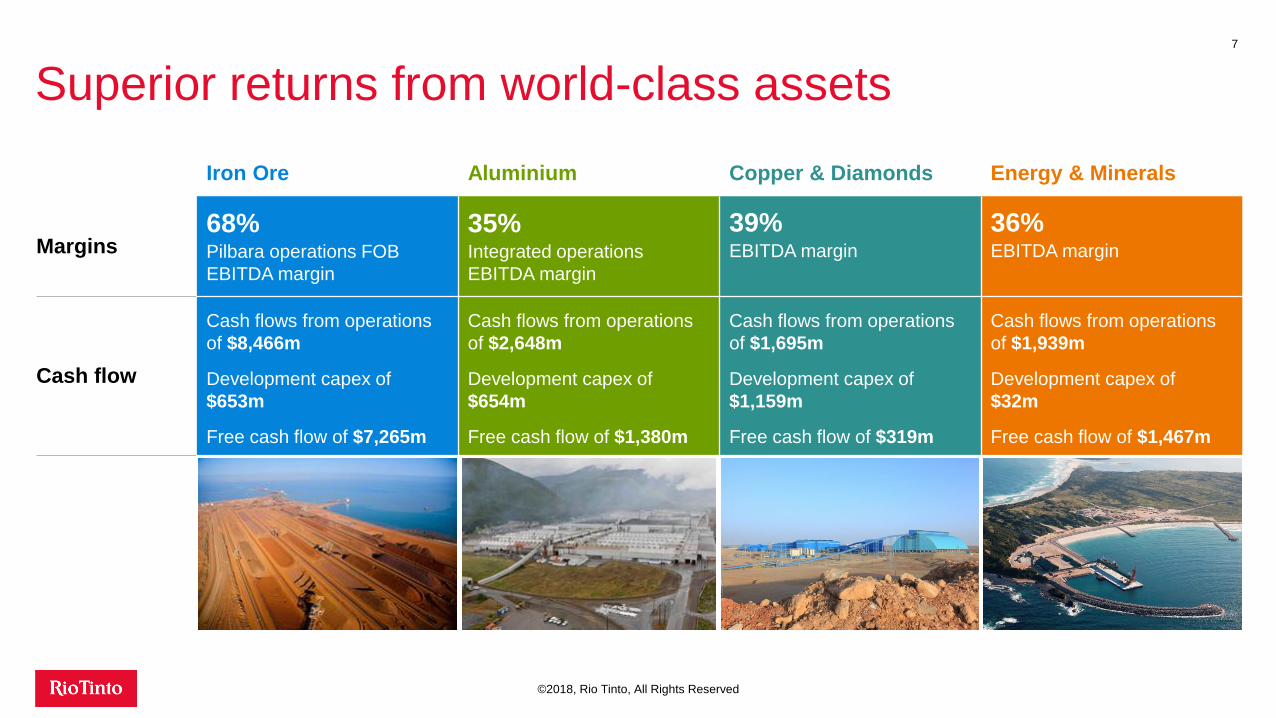
Superior returns from world-class assets
Iron Ore Aluminium Copper & Diamonds Energy & Minerals
Margins68%Pilbara operations FOB
EBITDA margin
35%Integrated operations
EBITDA margin
39%EBITDA margin
36%EBITDA margin
Cash flow
Cash flows from operations
of $8,466m
Development capex of
$653m
Free cash flow of $7,265m
Cash flows from operations
of $2,648m
Development capex of
$654m
Free cash flow of $1,380m
Cash flows from operations
of $1,695m
Development capex of
$1,159m
Free cash flow of $319m
Cash flows from operations
of $1,939m
Development capex of
$32m
Free cash flow of $1,467m
7
©2018, Rio Tinto, All Rights Reserved
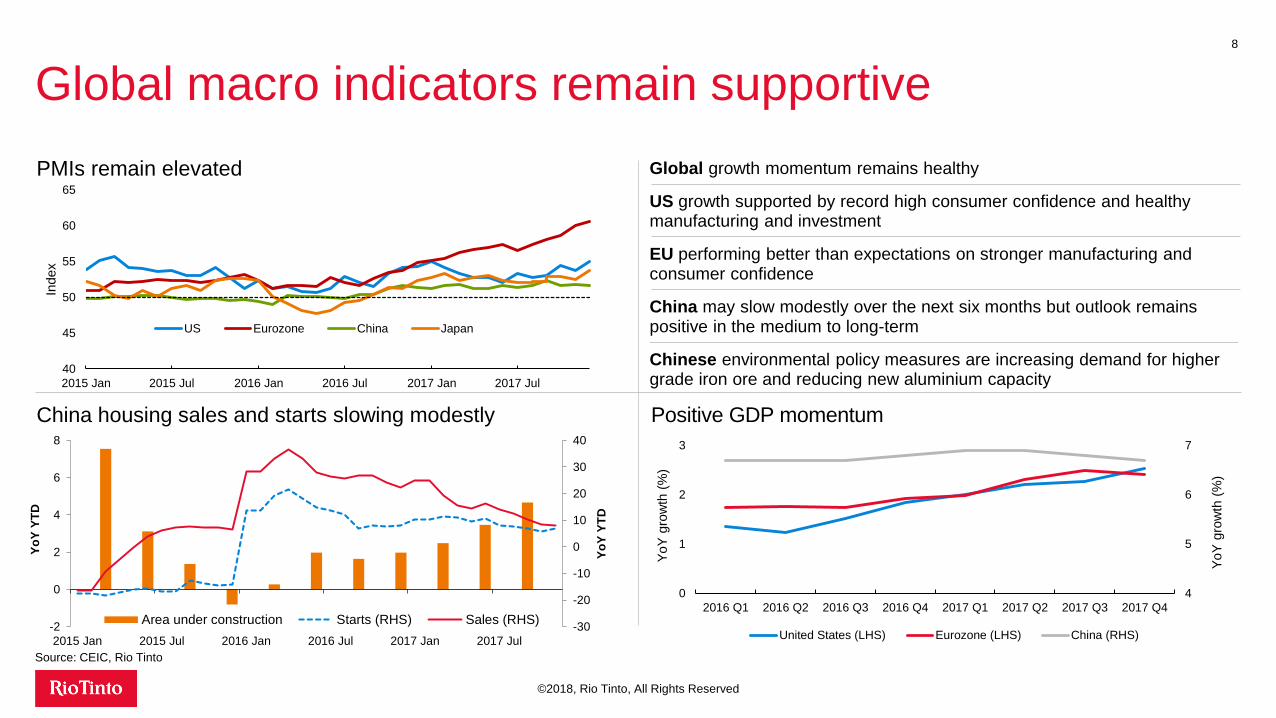
Global macro indicators remain supportive8
©2018, Rio Tinto, All Rights Reserved
Source: CEIC, Rio Tinto
China housing sales and starts slowing modestly Positive GDP momentum
PMIs remain elevated Global growth momentum remains healthy
US growth supported by record high consumer confidence and healthy manufacturing and investment
EU performing better than expectations on stronger manufacturing and consumer confidence
China may slow modestly over the next six months but outlook remains positive in the medium to long-term
Chinese environmental policy measures are increasing demand for higher grade iron ore and reducing new aluminium capacity
4
5
6
7
0
1
2
3
2016 Q1 2016 Q2 2016 Q3 2016 Q4 2017 Q1 2017 Q2 2017 Q3 2017 Q4
YoY
gro
wth
(%
)
YoY
gro
wth
(%
)
United States (LHS) Eurozone (LHS) China (RHS)-30
-20
-10
0
10
20
30
40
-2
0
2
4
6
8
2015 Jan 2015 Jul 2016 Jan 2016 Jul 2017 Jan 2017 Jul
Yo
Y Y
TD
Yo
Y Y
TD
Area under construction Starts (RHS) Sales (RHS)
40
45
50
55
60
65
2015 Jan 2015 Jul 2016 Jan 2016 Jul 2017 Jan 2017 Jul
Index
US Eurozone China Japan
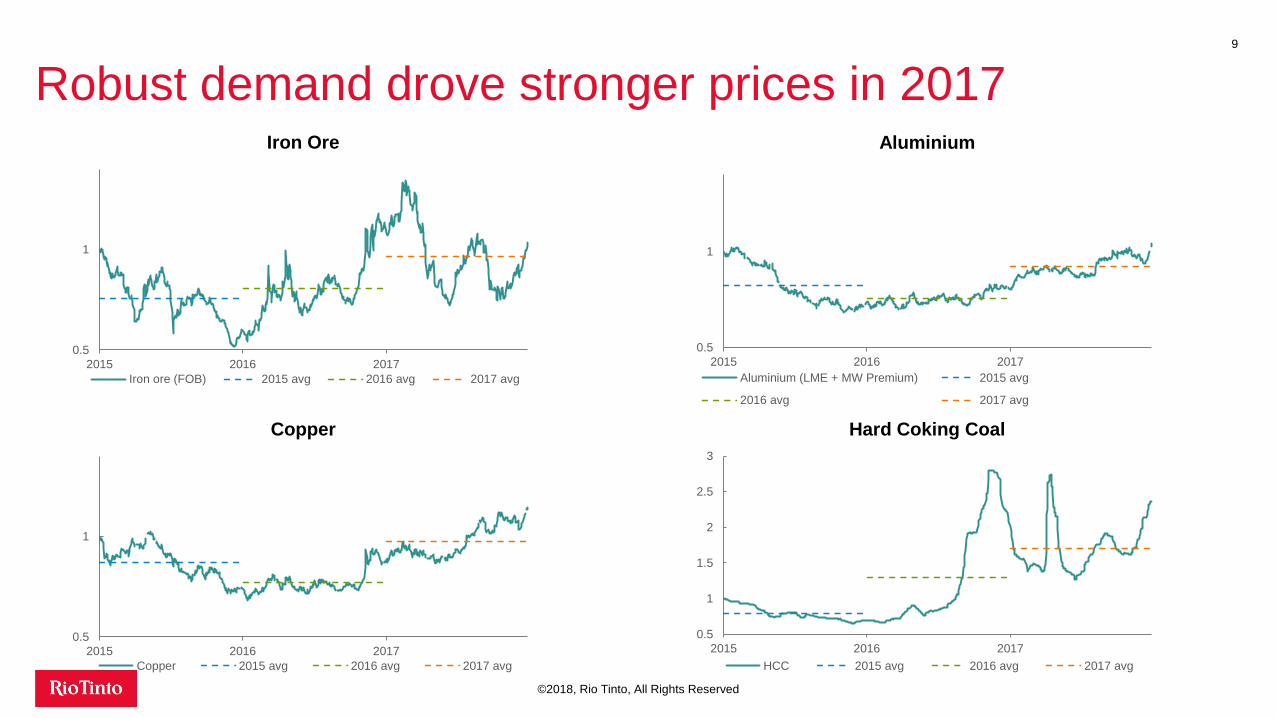
Robust demand drove stronger prices in 20179
©2018, Rio Tinto, All Rights Reserved
0.5
1
2015 2016 2017
Aluminium
Aluminium (LME + MW Premium) 2015 avg
2016 avg 2017 avg
0.5
1
2015 2016 2017
Iron Ore
Iron ore (FOB) 2015 avg 2016 avg 2017 avg
0.5
1
2015 2016 2017
Copper
Copper 2015 avg 2016 avg 2017 avg
0.5
1
1.5
2
2.5
3
2015 2016 2017
Hard Coking Coal
HCC 2015 avg 2016 avg 2017 avg
0%
10%
20%
30%
40%
50%
Q12015
Q22015
Q32015
Q42015
Q12016
Q22016
Q32016
Q42016
Q12017
Q22017
Q32017
Q42017
-50%
-40%
-30%
-20%
-10%
0%
20%
30%
40%
50%
60%
70%
H115 H215 H116 H216 H117 H217
RTIO (LHS) 58% price relativity (RHS)
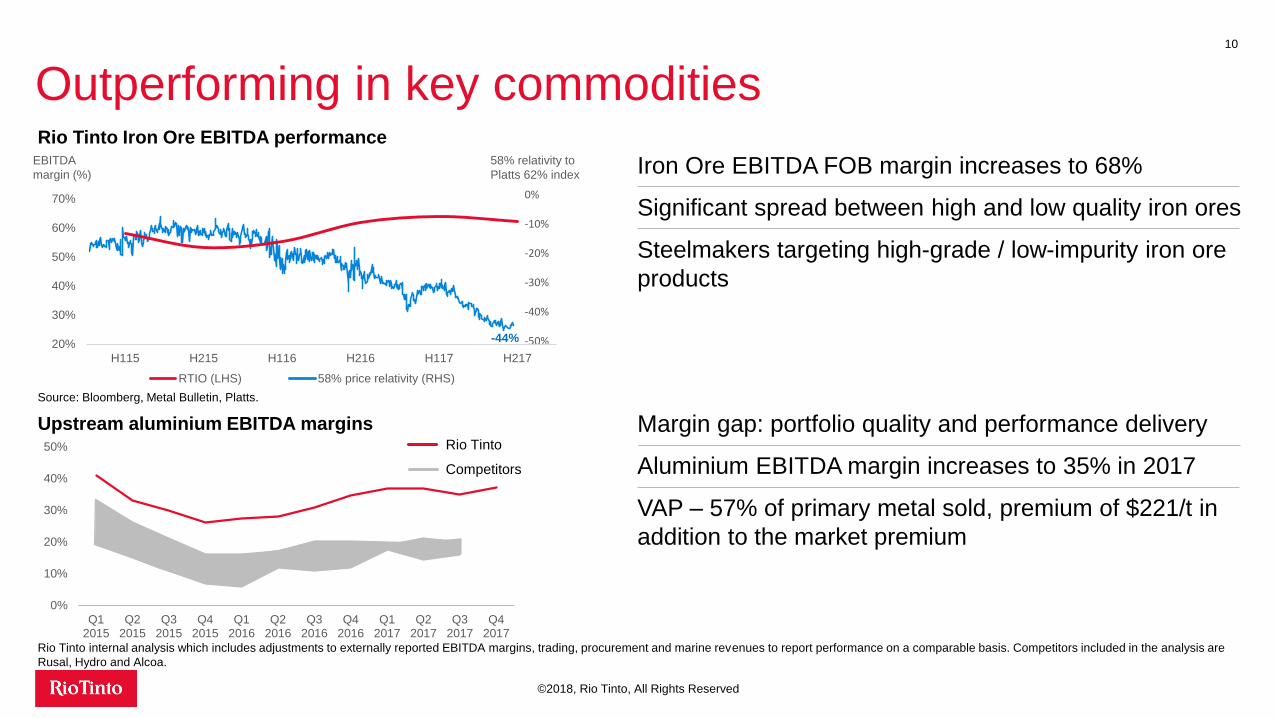
Margin gap: portfolio quality and performance delivery
Aluminium EBITDA margin increases to 35% in 2017
VAP – 57% of primary metal sold, premium of $221/t in
addition to the market premium
Outperforming in key commodities10
©2018, Rio Tinto, All Rights Reserved
Iron Ore EBITDA FOB margin increases to 68%
Significant spread between high and low quality iron ores
Steelmakers targeting high-grade / low-impurity iron ore
products
Rio Tinto Iron Ore EBITDA performance
Source: Bloomberg, Metal Bulletin, Platts.
Upstream aluminium EBITDA marginsRio Tinto
Rio Tinto internal analysis which includes adjustments to externally reported EBITDA margins, trading, procurement and marine revenues to report performance on a comparable basis. Competitors included in the analysis are
Rusal, Hydro and Alcoa.
58% relativity to
Platts 62% index
EBITDA
margin (%)
-44%
Competitors
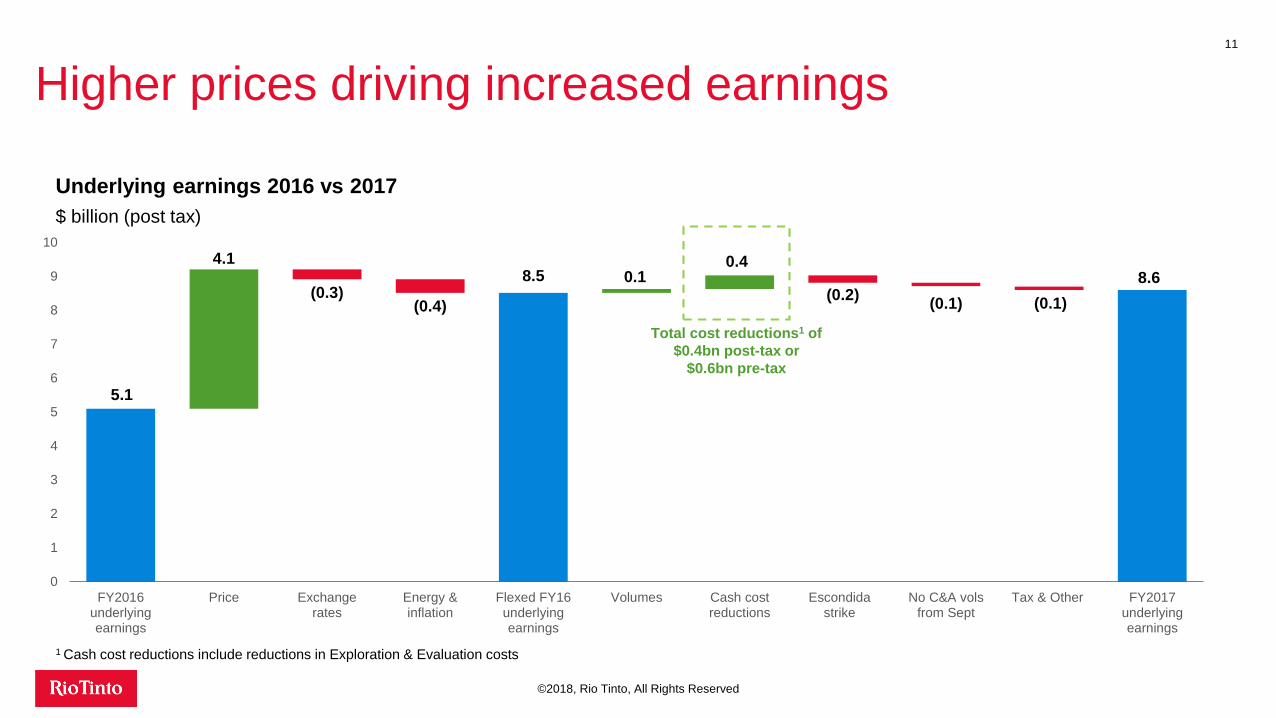
5.1
8.5 8.6
4.10.1
0.4
(0.3)(0.4)
(0.2)(0.1) (0.1)
0
1
2
3
4
5
6
7
8
9
10
FY2016underlyingearnings
Price Exchangerates
Energy &inflation
Flexed FY16underlyingearnings
Volumes Cash costreductions
Escondidastrike
No C&A volsfrom Sept
Tax & Other FY2017underlyingearnings
Higher prices driving increased earnings11
©2018, Rio Tinto, All Rights Reserved
Underlying earnings 2016 vs 2017
$ billion (post tax)
Total cost reductions1 of
$0.4bn post-tax or
$0.6bn pre-tax
1 Cash cost reductions include reductions in Exploration & Evaluation costs
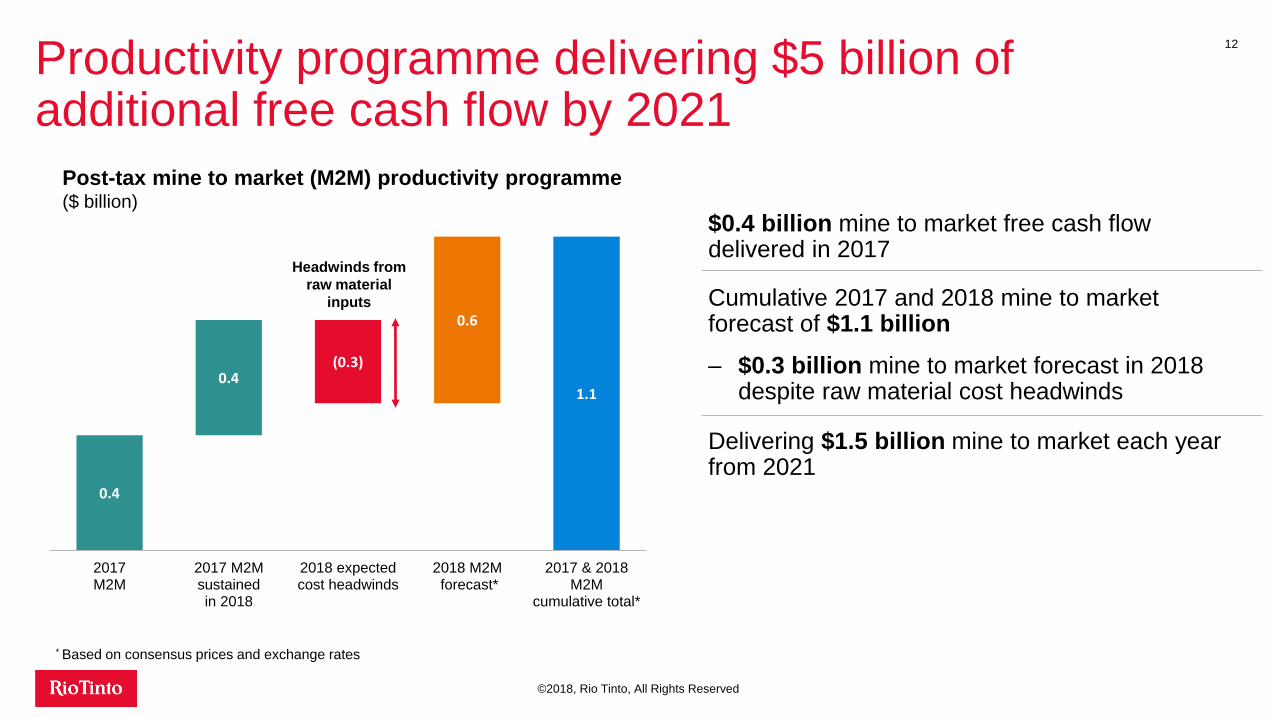
Productivity programme delivering $5 billion of additional free cash flow by 2021
12
©2018, Rio Tinto, All Rights Reserved
0.4
0.4(0.3)
0.6
1.1
2017M2M
2017 M2Msustainedin 2018
2018 expectedcost headwinds
2018 M2M forecast*
2017 & 2018M2M
cumulative total*
Post-tax mine to market (M2M) productivity programme($ billion)
Headwinds from
raw material
inputs
* Based on consensus prices and exchange rates
$0.4 billion mine to market free cash flow delivered in 2017
Cumulative 2017 and 2018 mine to market forecast of $1.1 billion
– $0.3 billion mine to market forecast in 2018 despite raw material cost headwinds
Delivering $1.5 billion mine to market each year from 2021
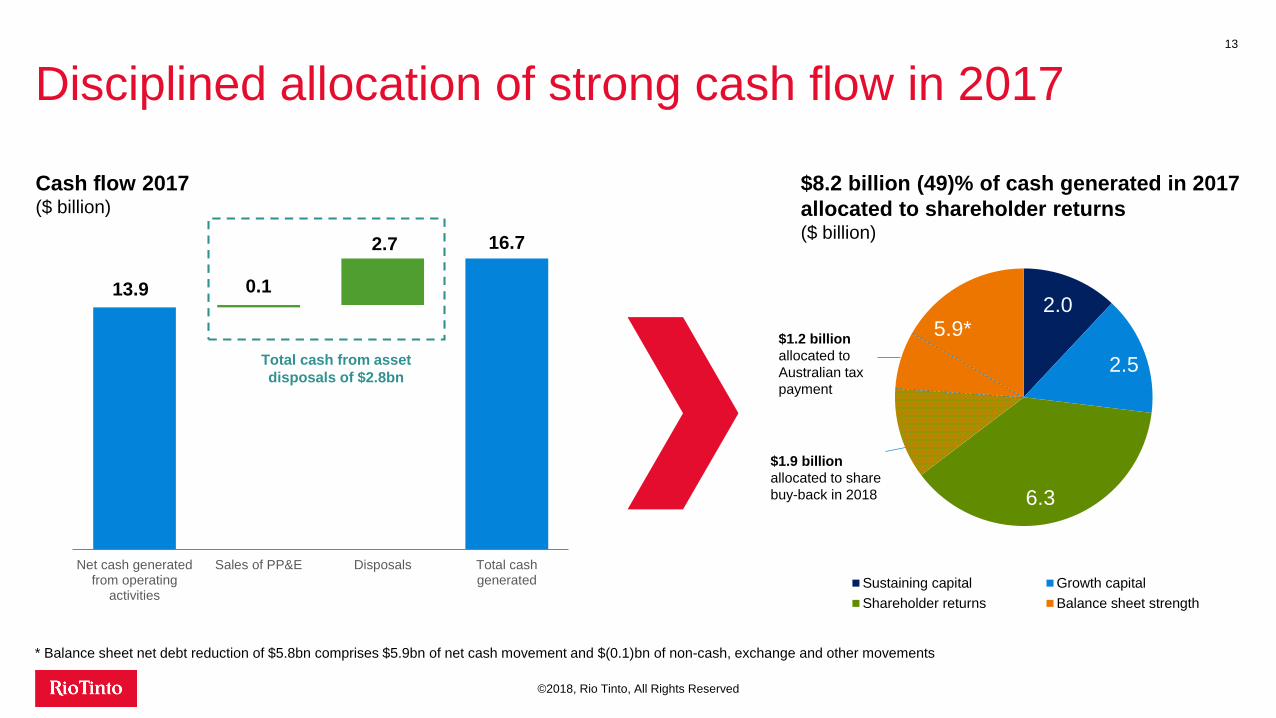
Disciplined allocation of strong cash flow in 201713
©2018, Rio Tinto, All Rights Reserved
13.9
16.7
0.1
2.7
Net cash generatedfrom operating
activities
Sales of PP&E Disposals Total cashgenerated
Cash flow 2017($ billion)
2.0
2.5
6.3
5.9*
Sustaining capital Growth capital
Shareholder returns Balance sheet strength
$8.2 billion (49)% of cash generated in 2017
allocated to shareholder returns($ billion)
Total cash from asset
disposals of $2.8bn
$1.9 billion
allocated to share
buy-back in 2018
$1.2 billion
allocated to
Australian tax
payment
* Balance sheet net debt reduction of $5.8bn comprises $5.9bn of net cash movement and $(0.1)bn of non-cash, exchange and other movements
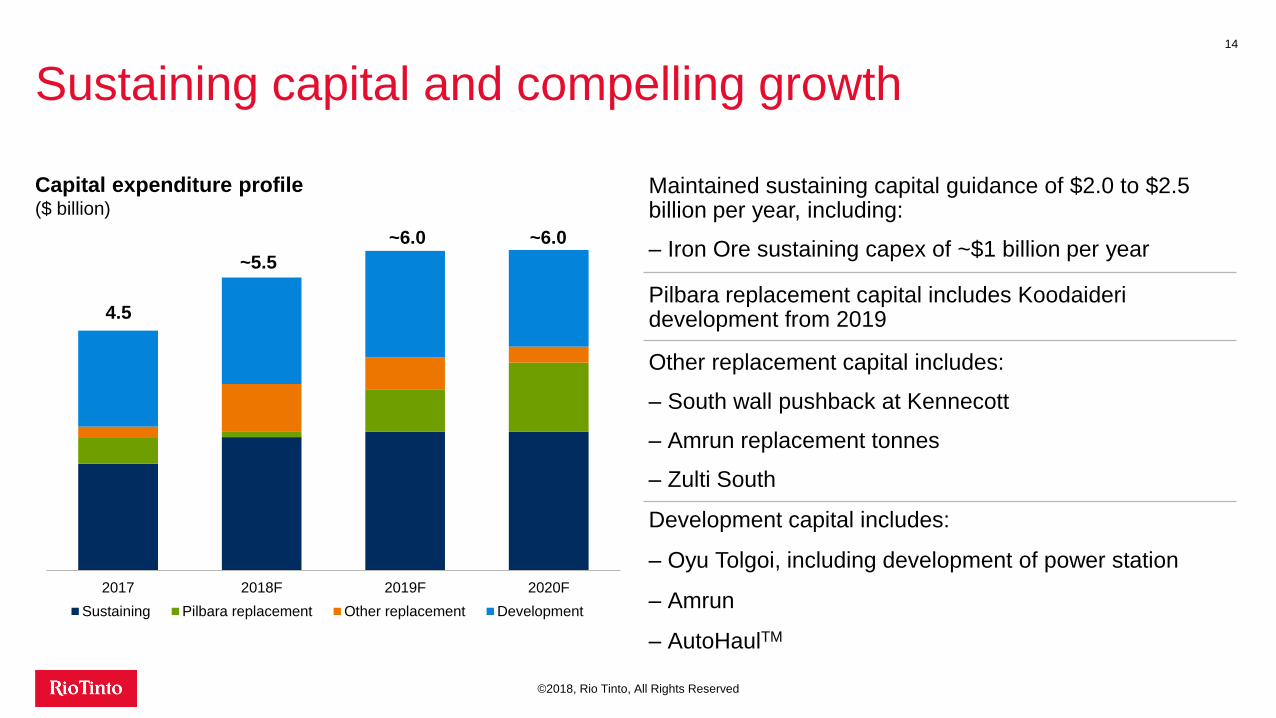
Sustaining capital and compelling growth 14
©2018, Rio Tinto, All Rights Reserved
Maintained sustaining capital guidance of $2.0 to $2.5 billion per year, including:
– Iron Ore sustaining capex of ~$1 billion per year
Pilbara replacement capital includes Koodaideridevelopment from 2019
Other replacement capital includes:
– South wall pushback at Kennecott
– Amrun replacement tonnes
– Zulti South
Development capital includes:
– Oyu Tolgoi, including development of power station
– Amrun
– AutoHaulTM
Capital expenditure profile($ billion)
2017 2018F 2019F 2020F
Sustaining Pilbara replacement Other replacement Development
4.5
~5.5
~6.0 ~6.0
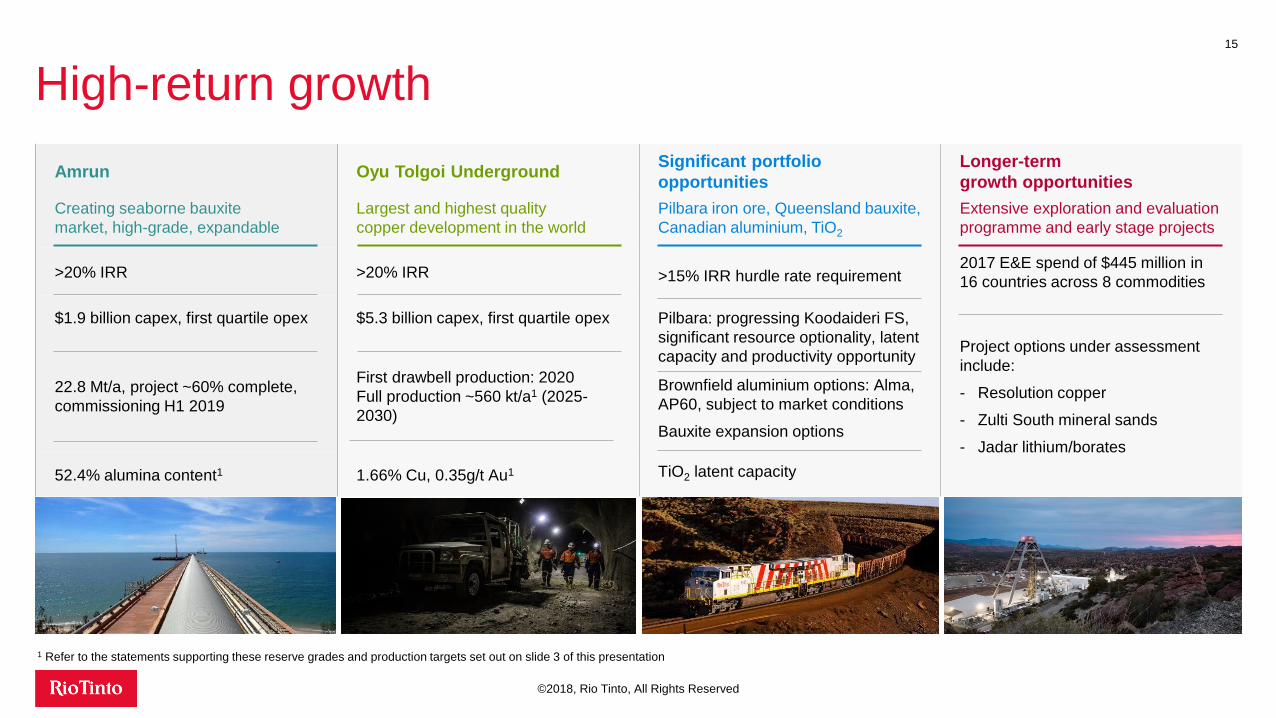
High-return growth15
©2018, Rio Tinto, All Rights Reserved
Amrun Oyu Tolgoi UndergroundSignificant portfolio
opportunities
Longer-term
growth opportunities
Creating seaborne bauxite
market, high-grade, expandable
Largest and highest quality
copper development in the world
Pilbara iron ore, Queensland bauxite,
Canadian aluminium, TiO2
Extensive exploration and evaluation
programme and early stage projects
>20% IRR >20% IRR >15% IRR hurdle rate requirement2017 E&E spend of $445 million in
16 countries across 8 commodities
$1.9 billion capex, first quartile opex $5.3 billion capex, first quartile opex
Project options under assessment
include:
- Resolution copper
- Zulti South mineral sands
- Jadar lithium/borates
Pilbara: progressing Koodaideri FS,
significant resource optionality, latent
capacity and productivity opportunity
22.8 Mt/a, project ~60% complete,
commissioning H1 2019
First drawbell production: 2020
Full production ~560 kt/a1 (2025-
2030)
Brownfield aluminium options: Alma,
AP60, subject to market conditions
Bauxite expansion options
TiO2 latent capacity 52.4% alumina content1 1.66% Cu, 0.35g/t Au1
1 Refer to the statements supporting these reserve grades and production targets set out on slide 3 of this presentation
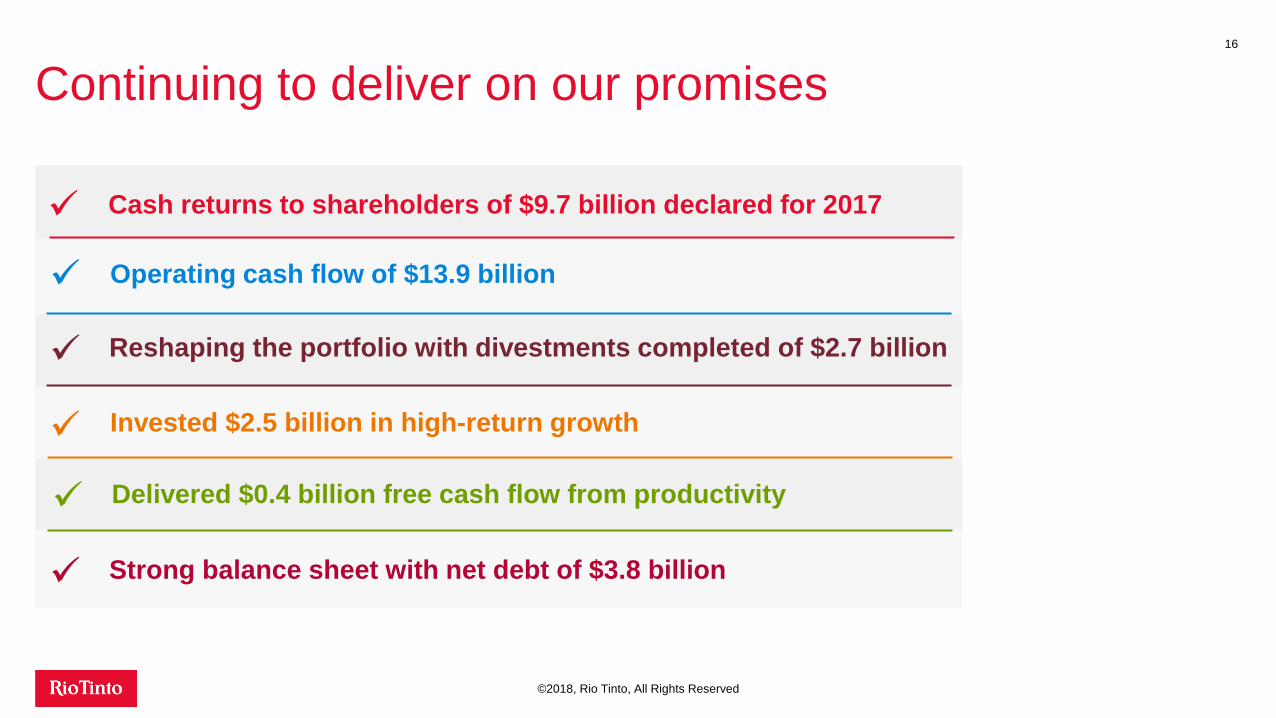
Continuing to deliver on our promises
©2018, Rio Tinto, All Rights Reserved
16
Operating cash flow of $13.9 billion
Reshaping the portfolio with divestments completed of $2.7 billion
Cash returns to shareholders of $9.7 billion declared for 2017
Invested $2.5 billion in high-return growth
Strong balance sheet with net debt of $3.8 billion
Delivered $0.4 billion free cash flow from productivity