Embed Size (px)
Citation preview
17-18 February 2016 (Sydney)
22 February 2016 (Melbourne)
Delivering Strong Performance &
Furthering Momentum for Market Leadership
Aram Mirkazemi
Martin Ive
Kim Besharati
Altium Half Year Investor Presentation
- CEO
- VP Finance
- VP IR
2
Future performance - Forward looking statements, opinions and estimates
provided in this presentation are based on assumptions and contingencies which
are subject to change without notice, as are statements about market and
industry trends, which are based on interpretations of current market conditions.
Forward looking statements including projections, guidance on future earnings
and estimates are provided as a general guide only and should not be relied upon
as an indication or guarantee of future performance. An investment in Altium
shares is subject to investment and other known and unknown risks, some of
which are beyond the control of Altium Limited. No representation or warranty,
express or implied, is made as to the fairness, accuracy, completeness or
correctness of the information, opinions and conclusions contained in this
presentation. To the maximum extent permitted by law, none of Altium
employees, its directors, employees or agents, nor any other person accepts any
liability, including, without limitation, any liability arising out of fault or negligence,
for any loss arising from the use of the information contained in this presentation.
In particular, no representation or warranty, express or implied is given as to the
accuracy, completeness or correctness, likelihood of achievement or
reasonableness of any forecasts, prospects or returns contained in this
Presentation nor is any obligation assumed to update such information. Such
forecasts, prospects or returns are by their nature subject to significant
uncertainties and contingencies. Before making an investment decision, you
should consider, with or without the assistance of a financial adviser, whether an
investment is appropriate in light of your particular investment needs, objectives
and financial circumstances.
Financial data
All dollar values are in US dollars (US$) unless as otherwise presented.
Disclaimer
This presentation has been prepared by Altium Limited (ACN 009 568 772) and
is for information purposes only. It does not constitute financial product or
investment advice or a recommendation to acquire Altium shares and has been
prepared without taking into account the objectives, financial situation or needs
of individuals. Before making an investment decision prospective investors
should consider the appropriateness of the information having regard to their
own objectives, financial situation and needs and seek legal and taxation advice
appropriate to their jurisdiction. Altium is not licensed to provide financial
product advice in respect of Altium shares.
Altium, Altium Designer, Altium Vault, Ciiva, Circuitmaker, Circuistudio,
Octopart, PCBWorks, Protel and Tasking, and their respective logos, are
trademarks or registered trademarks of Altium Limited, or its subsidiaries. All
other registered or unregistered trademarks mentioned in this presentation are
the property of their respective owners, and no trademark rights to the same are
claimed
Agenda
2016 Half Year Financial Performance2
1
Pursuing Market Leadership in PCB Design Software
Company Highlights & Successful Execution
3
4 Appendix: Company Overview & Long–Term Outlook
4
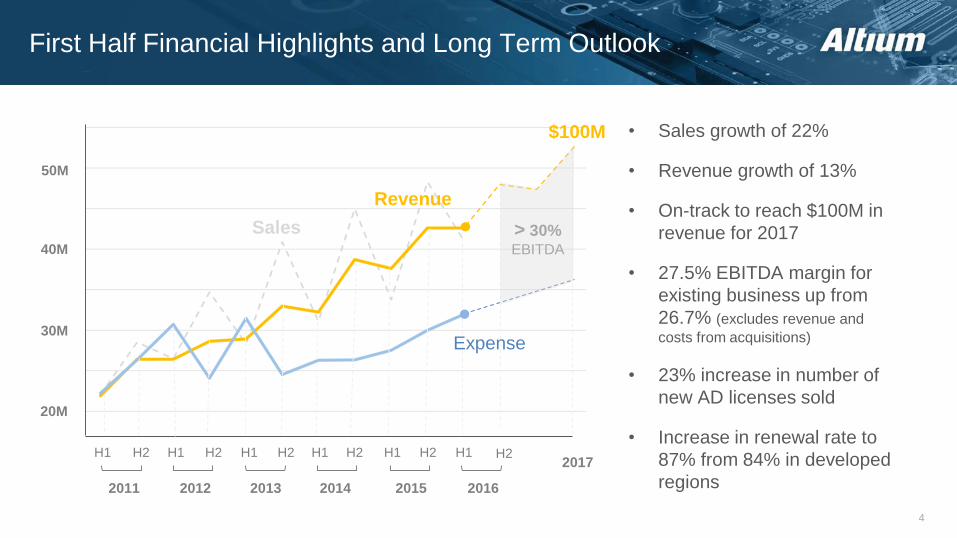
First Half Financial Highlights and Long Term Outlook
50M
40M
30M
20M
H1 H2 H1 H2 H1 H2 H1 H2 H1 H2 H1 H2
Sales
$100M
2011 2012 2013 2014 2015 2016
• Sales growth of 22%
• Revenue growth of 13%
• On-track to reach $100M in
revenue for 2017
• 27.5% EBITDA margin for
existing business up from
26.7% (excludes revenue and
costs from acquisitions)
• 23% increase in number of
new AD licenses sold
• Increase in renewal rate to
87% from 84% in developed
regions2017
> 30%EBITDA
Expense
Revenue
INVESTOR PRESENTATION 5
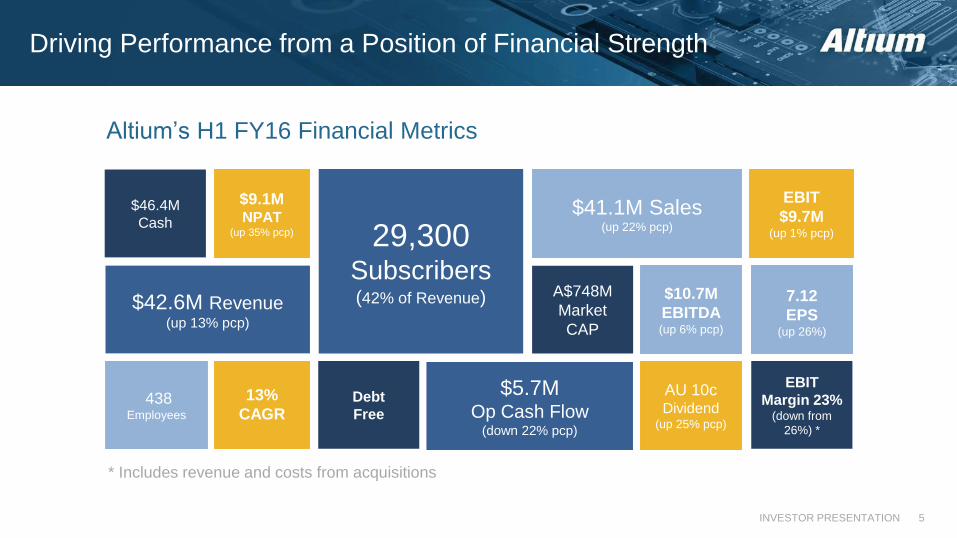
IntroductionDriving Performance from a Position of Financial Strength
$5.7MOp Cash Flow
(down 22% pcp)
$42.6M Revenue (up 13% pcp)
$46.4M
Cash
$9.1M NPAT
(up 35% pcp)
438 Employees
A$748M
Market
CAP
EBIT
$9.7M(up 1% pcp)29,300
Subscribers(42% of Revenue) $10.7M
EBITDA(up 6% pcp)
$41.1M Sales (up 22% pcp)
7.12
EPS(up 26%)
AU 10c Dividend
(up 25% pcp)
Debt
Free
Altium’s H1 FY16 Financial Metrics
13%
CAGR
EBIT
Margin 23% (down from
26%) *
* Includes revenue and costs from acquisitions
6
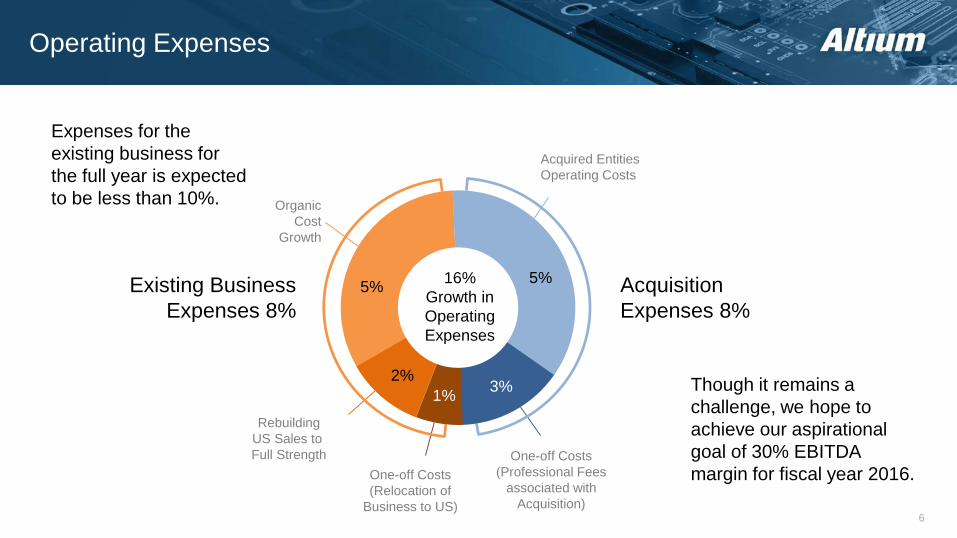
Operating Expenses
Expenses for the
existing business for
the full year is expected
to be less than 10%.
Though it remains a
challenge, we hope to
achieve our aspirational
goal of 30% EBITDA
margin for fiscal year 2016.
5%
3%2%
5%
Rebuilding
US Sales to
Full Strength One-off Costs
(Professional Fees
associated with
Acquisition)
Existing Business
Expenses 8%
Acquired Entities
Operating Costs
16%
Growth in
Operating
Expenses
1%
One-off Costs
(Relocation of
Business to US)
Acquisition
Expenses 8%
Organic
Cost
Growth
7
America delivered a record breaking first half (25% revenue growth and 40% sales growth)
EMEA is back on track delivering a solid performance (19% revenue growth and 24% sales
growth in local currency)
Partnered with Dassault Systemes SOLIDWORKS to introduce a new line of electronic
CAD products reinforcing Altium’s bid for market leadership
Released our fourth consecutive annual update to our flagship product Altium Designer 16
Successfully completed and integrated our first acquisitions (Octopart and Ciiva)
Closed the largest multi-year TASKING deal with a tier 1 automotive supplier ($2.7 million)
Progress Update – First Half Significant Milestones
8
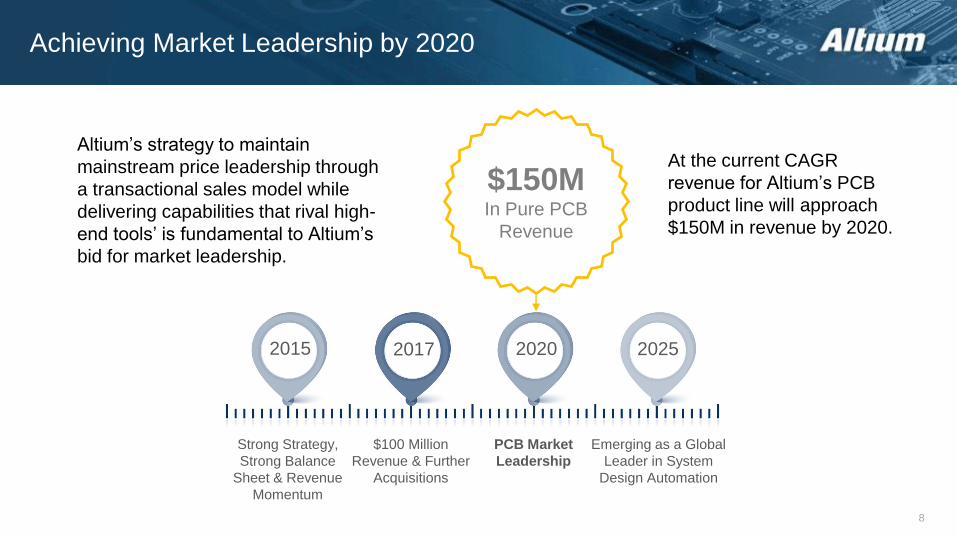
Achieving Market Leadership by 2020
2015 2017 2020 2025
Strong Strategy,
Strong Balance
Sheet & Revenue
Momentum
$100 Million
Revenue & Further
Acquisitions
PCB Market
Leadership
Emerging as a Global
Leader in System
Design Automation
$150M In Pure PCB
Revenue
At the current CAGR
revenue for Altium’s PCB
product line will approach
$150M in revenue by 2020.
Altium’s strategy to maintain
mainstream price leadership through
a transactional sales model while
delivering capabilities that rival high-
end tools’ is fundamental to Altium’s
bid for market leadership.
9
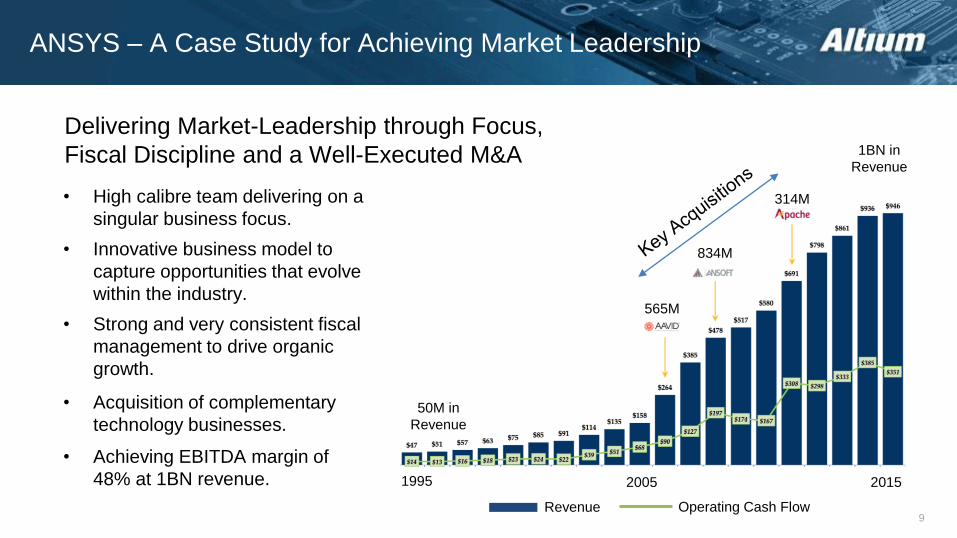
ANSYS – A Case Study for Achieving Market Leadership
Delivering Market-Leadership through Focus,
Fiscal Discipline and a Well-Executed M&A
565M
834M
314M
1BN in
Revenue
20051995 2015
50M in
Revenue
Revenue Operating Cash Flow
• High calibre team delivering on a
singular business focus.
• Innovative business model to
capture opportunities that evolve
within the industry.
• Strong and very consistent fiscal
management to drive organic
growth.
• Acquisition of complementary
technology businesses.
• Achieving EBITDA margin of
48% at 1BN revenue.
Agenda
2016 Half Year Financial Performance2
1
Pursuing Market Leadership in PCB Design Software
Company Highlights & Successful Execution
3
4 Appendix: Company Overview & Long–Term Outlook
11
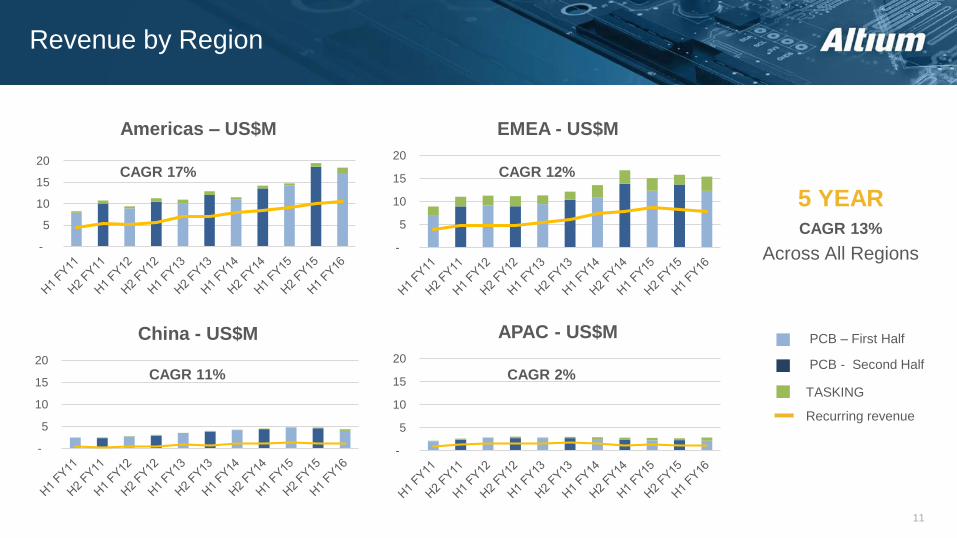
Revenue by Region
5 YEARCAGR 13%
Across All Regions
TASKING
PCB – First Half
Recurring revenue
-
5
10
15
20
Americas – US$M
CAGR 17%
-
5
10
15
20
EMEA - US$M
CAGR 12%
-
5
10
15
20
China - US$M
CAGR 11%
-
5
10
15
20
APAC - US$M
CAGR 2%PCB - Second Half
12
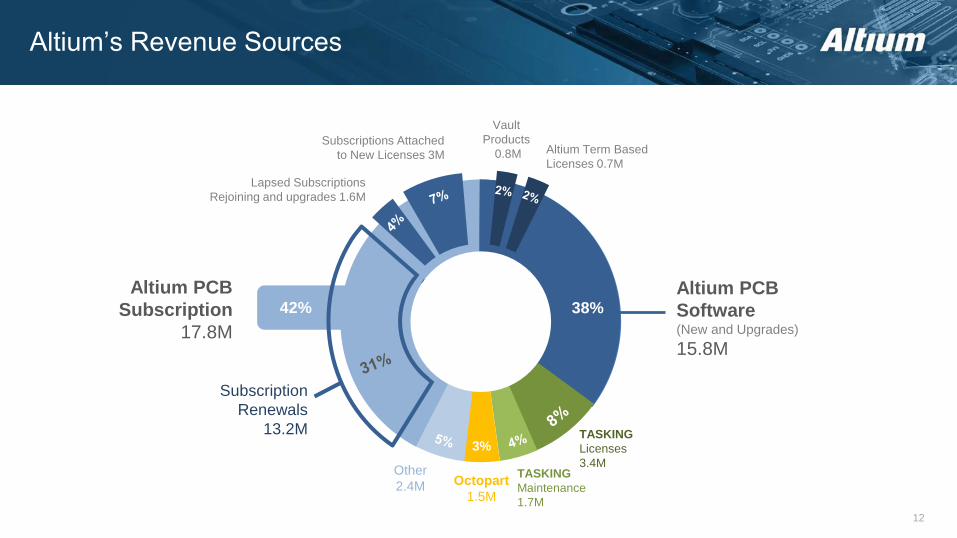
Altium’s Revenue Sources
Vault
Products
0.8M
Altium PCB
Software (New and Upgrades)
15.8M
Altium Term Based
Licenses 0.7M
TASKING
Licenses
3.4MTASKING
Maintenance
1.7M
Octopart
1.5M
Other
2.4M
Subscription
Renewals
13.2M
Lapsed Subscriptions
Rejoining and upgrades 1.6M
Subscriptions Attached
to New Licenses 3M
Altium PCB
Subscription
17.8M
42% 38%
3%
13
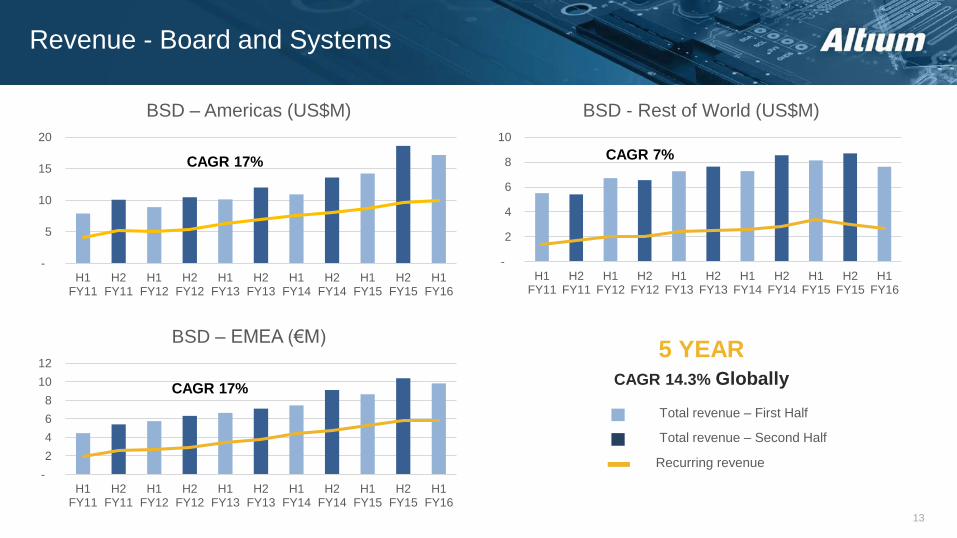
Revenue - Board and Systems
5 YEARCAGR 14.3% Globally
Total revenue – Second Half
Recurring revenue
-
5
10
15
20
H1FY11
H2FY11
H1FY12
H2FY12
H1FY13
H2FY13
H1FY14
H2FY14
H1FY15
H2FY15
H1FY16
BSD – Americas (US$M)
CAGR 17%
-
2
4
6
8
10
12
H1FY11
H2FY11
H1FY12
H2FY12
H1FY13
H2FY13
H1FY14
H2FY14
H1FY15
H2FY15
H1FY16
BSD – EMEA (€M)
-
2
4
6
8
10
H1FY11
H2FY11
H1FY12
H2FY12
H1FY13
H2FY13
H1FY14
H2FY14
H1FY15
H2FY15
H1FY16
BSD - Rest of World (US$M)
CAGR 17%
CAGR 7%
Total revenue – First Half
14
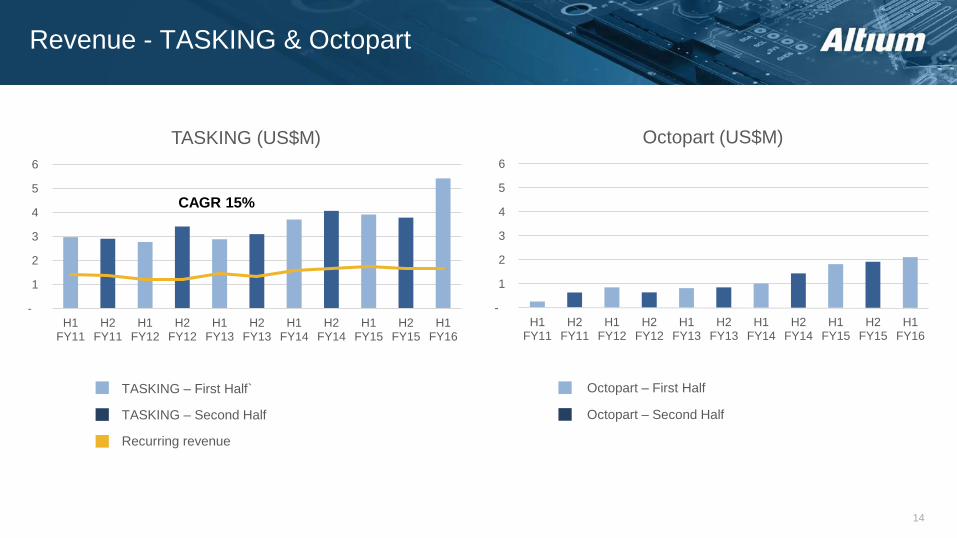
Revenue - TASKING & Octopart
TASKING – First Half`
TASKING – Second Half
Recurring revenue
-
1
2
3
4
5
6
H1FY11
H2FY11
H1FY12
H2FY12
H1FY13
H2FY13
H1FY14
H2FY14
H1FY15
H2FY15
H1FY16
TASKING (US$M)
CAGR 15%
-
1
2
3
4
5
6
H1FY11
H2FY11
H1FY12
H2FY12
H1FY13
H2FY13
H1FY14
H2FY14
H1FY15
H2FY15
H1FY16
Octopart (US$M)
Octopart – First Half
Octopart – Second Half
15
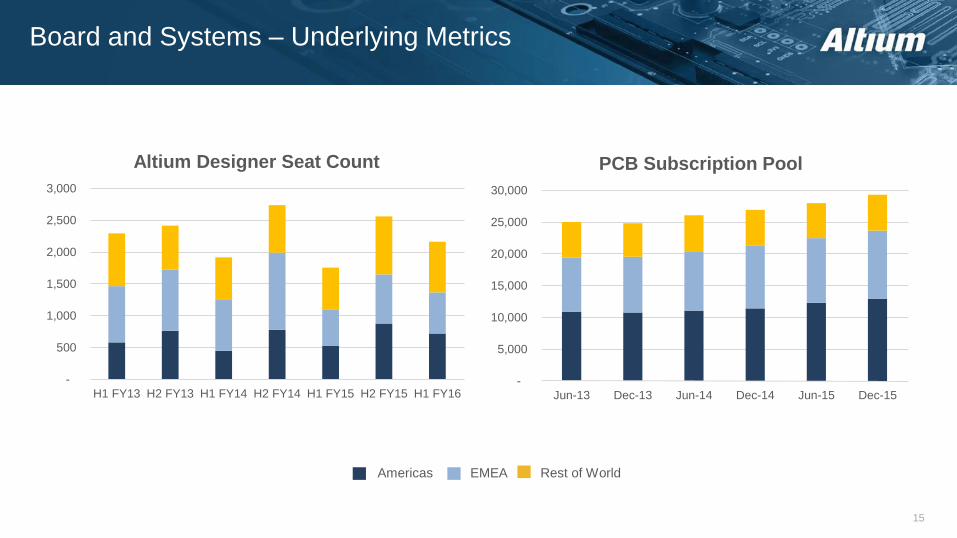
Board and Systems – Underlying Metrics
EMEAAmericas Rest of World
-
500
1,000
1,500
2,000
2,500
3,000
H1 FY13 H2 FY13 H1 FY14 H2 FY14 H1 FY15 H2 FY15 H1 FY16
Altium Designer Seat Count
-
5,000
10,000
15,000
20,000
25,000
30,000
Jun-13 Dec-13 Jun-14 Dec-14 Jun-15 Dec-15
PCB Subscription Pool
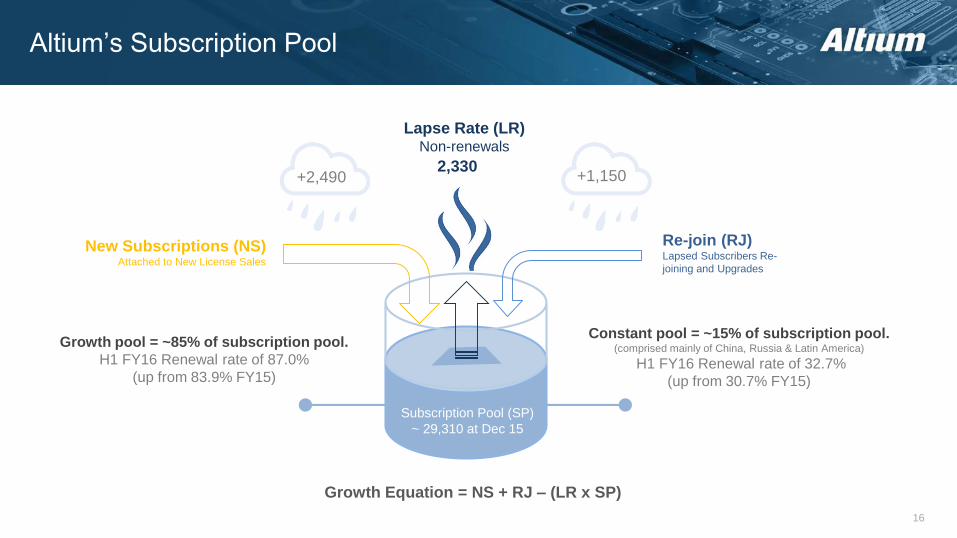
16
Lapse Rate (LR)Non-renewals
New Subscriptions (NS) Attached to New License Sales
Re-join (RJ)Lapsed Subscribers Re-
joining and Upgrades
Growth Equation = NS + RJ – (LR x SP)
Growth pool = ~85% of subscription pool.
H1 FY16 Renewal rate of 87.0%
(up from 83.9% FY15)
Constant pool = ~15% of subscription pool. (comprised mainly of China, Russia & Latin America)
H1 FY16 Renewal rate of 32.7%
(up from 30.7% FY15)
Subscription Pool (SP)
~ 29,310 at Dec 15
+2,490 +1,1502,330
Altium’s Subscription Pool
1717
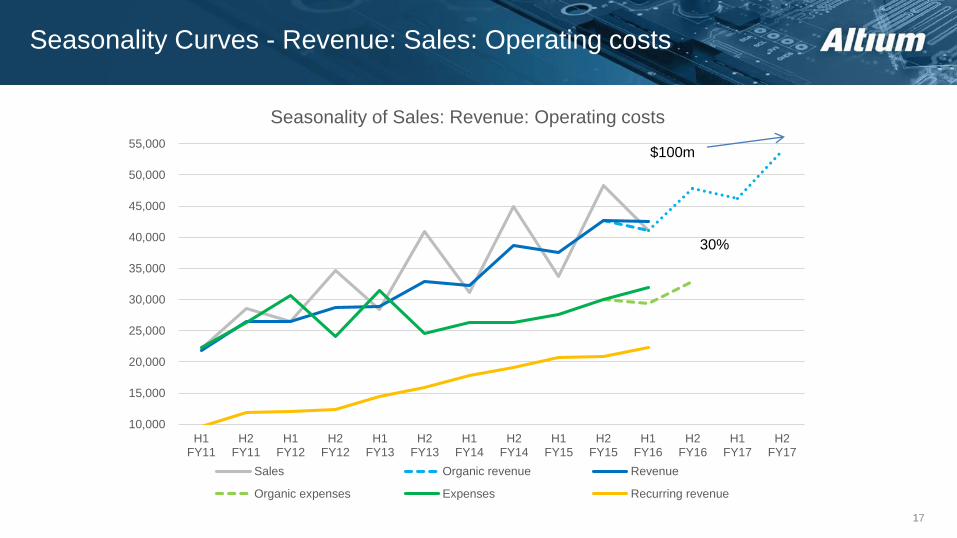
Seasonality Curves - Revenue: Sales: Operating costs
10,000
15,000
20,000
25,000
30,000
35,000
40,000
45,000
50,000
55,000
H1FY11
H2FY11
H1FY12
H2FY12
H1FY13
H2FY13
H1FY14
H2FY14
H1FY15
H2FY15
H1FY16
H2FY16
H1FY17
H2FY17
Seasonality of Sales: Revenue: Operating costs
Sales Organic revenue Revenue
Organic expenses Expenses Recurring revenue
30%
$100m
18
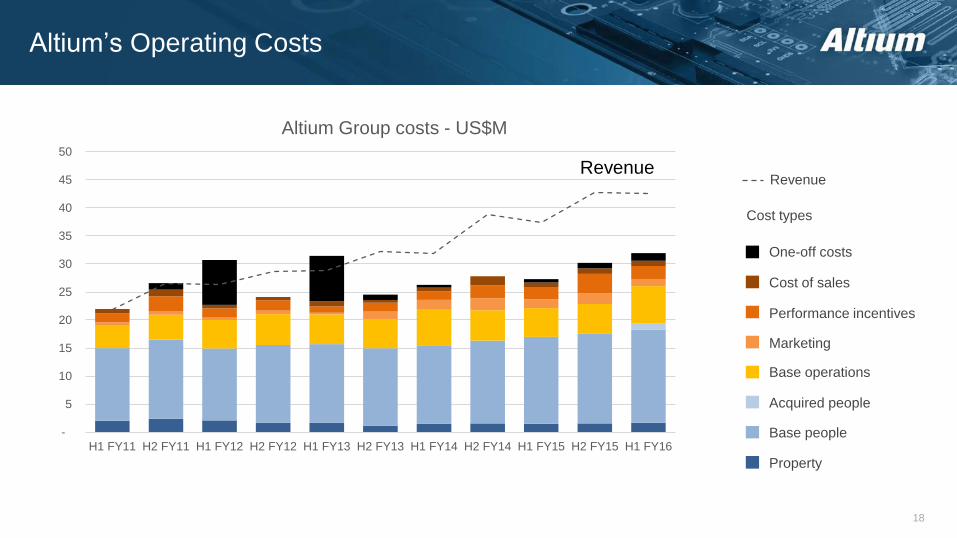
Altium’s Operating Costs
Cost types
-
5
10
15
20
25
30
35
40
45
50
H1 FY11 H2 FY11 H1 FY12 H2 FY12 H1 FY13 H2 FY13 H1 FY14 H2 FY14 H1 FY15 H2 FY15 H1 FY16
Altium Group costs - US$M
Revenue
Property
Base people
Acquired people
Base operations
Marketing
Performance incentives
Cost of sales
One-off costs
Revenue
19
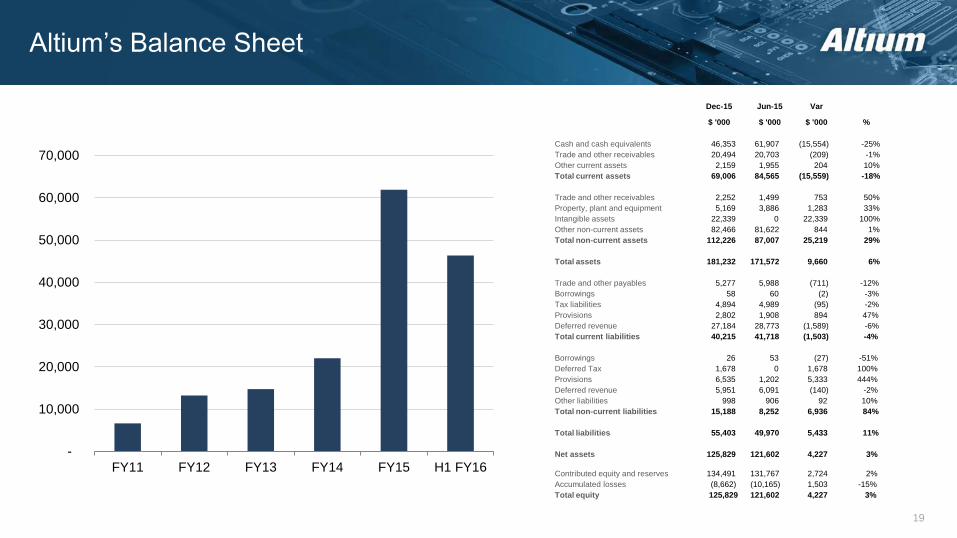
Altium’s Balance Sheet
Dec-15 Jun-15 Var
$ '000 $ '000 $ '000 %
Cash and cash equivalents 46,353 61,907 (15,554) -25%
Trade and other receivables 20,494 20,703 (209) -1%
Other current assets 2,159 1,955 204 10%
Total current assets 69,006 84,565 (15,559) -18%
Trade and other receivables 2,252 1,499 753 50%
Property, plant and equipment 5,169 3,886 1,283 33%
Intangible assets 22,339 0 22,339 100%
Other non-current assets 82,466 81,622 844 1%
Total non-current assets 112,226 87,007 25,219 29%
Total assets 181,232 171,572 9,660 6%
Trade and other payables 5,277 5,988 (711) -12%
Borrowings 58 60 (2) -3%
Tax liabilities 4,894 4,989 (95) -2%
Provisions 2,802 1,908 894 47%
Deferred revenue 27,184 28,773 (1,589) -6%
Total current liabilities 40,215 41,718 (1,503) -4%
Borrowings 26 53 (27) -51%
Deferred Tax 1,678 0 1,678 100%
Provisions 6,535 1,202 5,333 444%
Deferred revenue 5,951 6,091 (140) -2%
Other liabilities 998 906 92 10%
Total non-current liabilities 15,188 8,252 6,936 84%
Total liabilities 55,403 49,970 5,433 11%
Net assets 125,829 121,602 4,227 3%
Contributed equity and reserves 134,491 131,767 2,724 2%
Accumulated losses (8,662) (10,165) 1,503 -15%
Total equity 125,829 121,602 4,227 3%
-
10,000
20,000
30,000
40,000
50,000
60,000
70,000
FY11 FY12 FY13 FY14 FY15 H1 FY16
20
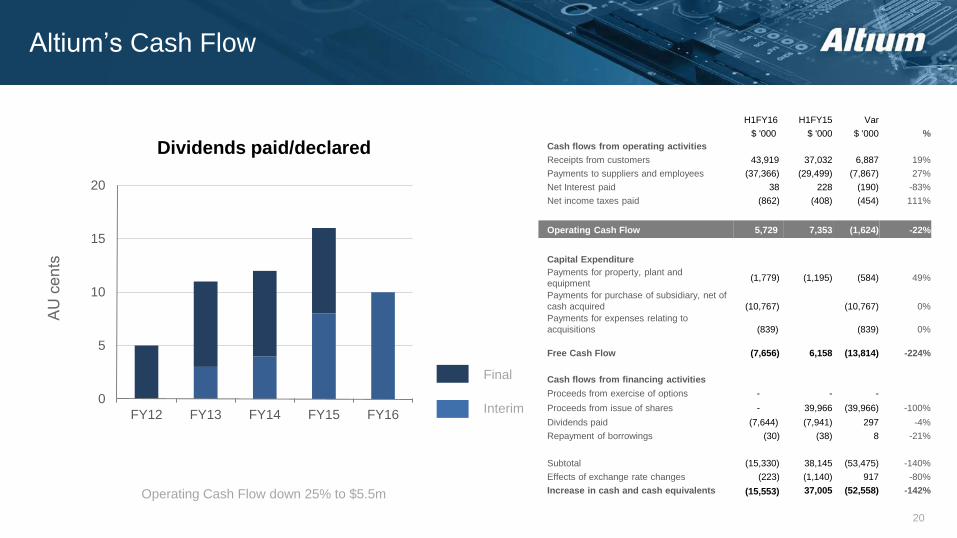
Altium’s Cash Flow
Dividends paid/declared
Operating Cash Flow down 25% to $5.5m
Interim
Final
H1FY16 H1FY15 Var
$ '000 $ '000 $ '000 %
Cash flows from operating activities
Receipts from customers 43,919 37,032 6,887 19%
Payments to suppliers and employees (37,366) (29,499) (7,867) 27%
Net Interest paid 38 228 (190) -83%
Net income taxes paid (862) (408) (454) 111%
Operating Cash Flow 5,729 7,353 (1,624) -22%
Capital Expenditure
Payments for property, plant and
equipment(1,779) (1,195) (584) 49%
Payments for purchase of subsidiary, net of
cash acquired (10,767) (10,767) 0%
Payments for expenses relating to
acquisitions (839) (839) 0%
Free Cash Flow (7,656) 6,158 (13,814) -224%
Cash flows from financing activities
Proceeds from exercise of options - - -
Proceeds from issue of shares - 39,966 (39,966) -100%
Dividends paid (7,644) (7,941) 297 -4%
Repayment of borrowings (30) (38) 8 -21%
Subtotal (15,330) 38,145 (53,475) -140%
Effects of exchange rate changes (223) (1,140) 917 -80%
Increase in cash and cash equivalents (15,553) 37,005 (52,558) -142%
0
5
10
15
20
FY12 FY13 FY14 FY15 FY16
21
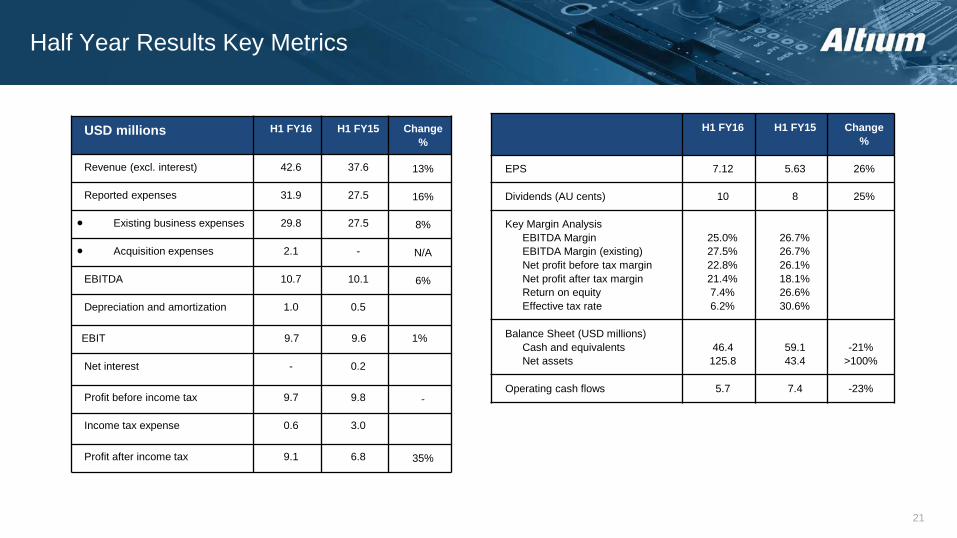
Half Year Results Key Metrics
USD millions H1 FY16 Change %H1 FY15 H1 FY16USD millions H1 FY16 H1 FY15 Change
%
Revenue (excl. interest) 42.6 37.6 13%
Reported expenses 31.9 27.5 16%
Existing business expenses 29.8 27.5 8%
Acquisition expenses 2.1 - N/A
EBITDA 10.7 10.1 6%
Depreciation and amortization 1.0 0.5
EBIT 9.7 9.6 1%
Net interest - 0.2
Profit before income tax 9.7 9.8 -
Income tax expense 0.6 3.0
Profit after income tax 9.1 6.8 35%
H1 FY16 H1 FY15 Change
%
EPS 7.12 5.63 26%
Dividends (AU cents) 10 8 25%
Key Margin Analysis
EBITDA Margin
EBITDA Margin (existing)
Net profit before tax margin
Net profit after tax margin
Return on equity
Effective tax rate
25.0%
27.5%
22.8%
21.4%
7.4%
6.2%
26.7%
26.7%
26.1%
18.1%
26.6%
30.6%
Balance Sheet (USD millions)
Cash and equivalents
Net assets
46.4
125.8
59.1
43.4
-21%
>100%
Operating cash flows 5.7 7.4 -23%
Agenda
2016 Half Year Financial Performance2
1
Pursuing Market Leadership in PCB Design Software
Company Highlights & Successful Execution
3
4 Appendix: Company Overview & Long–Term Outlook
23
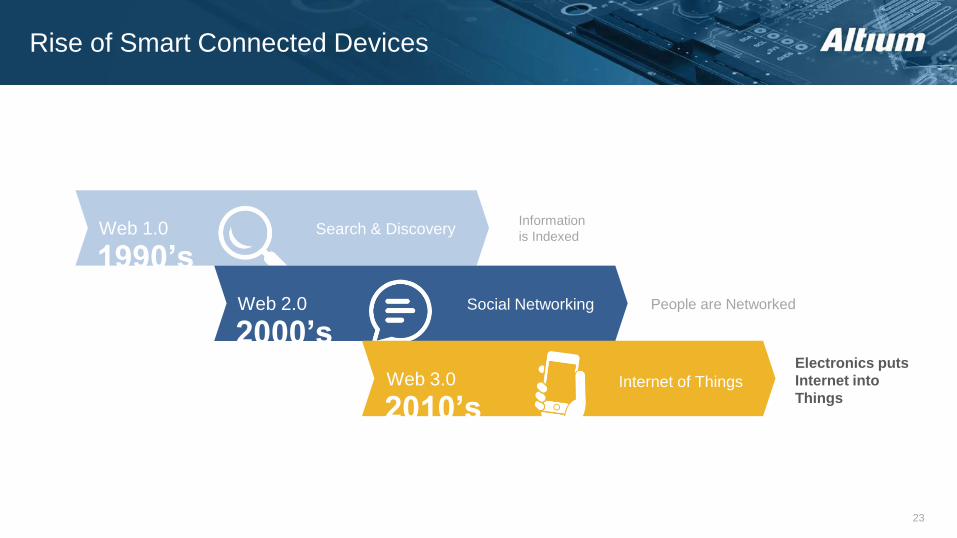
Rise of Smart Connected Devices
Information
is IndexedSearch & Discovery
1990’sWeb 1.0
Social Networking
2000’sWeb 2.0 People are Networked
Electronics puts
Internet into
ThingsInternet of Things
2010’sWeb 3.0
24
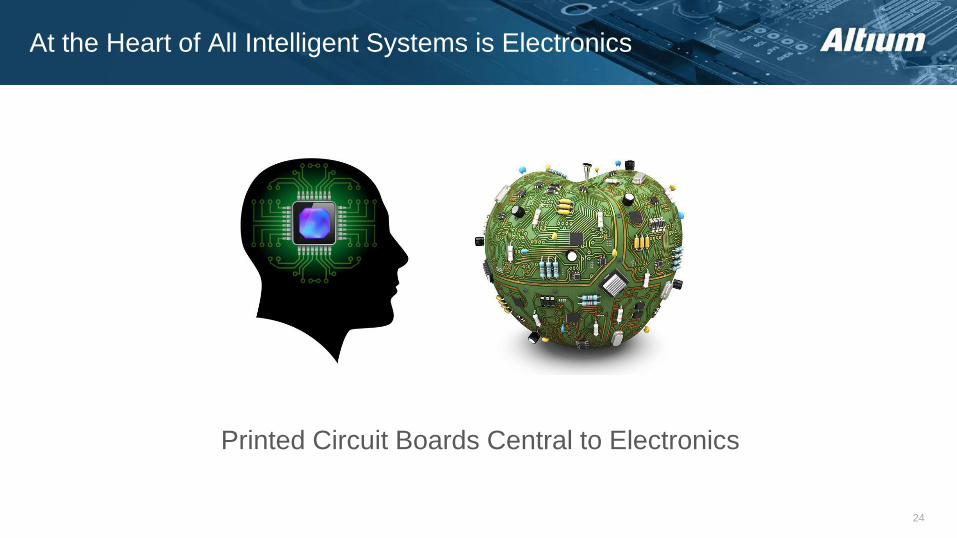
At the Heart of All Intelligent Systems is Electronics
Printed Circuit Boards Central to Electronics
1
2
3
45
6
7
25
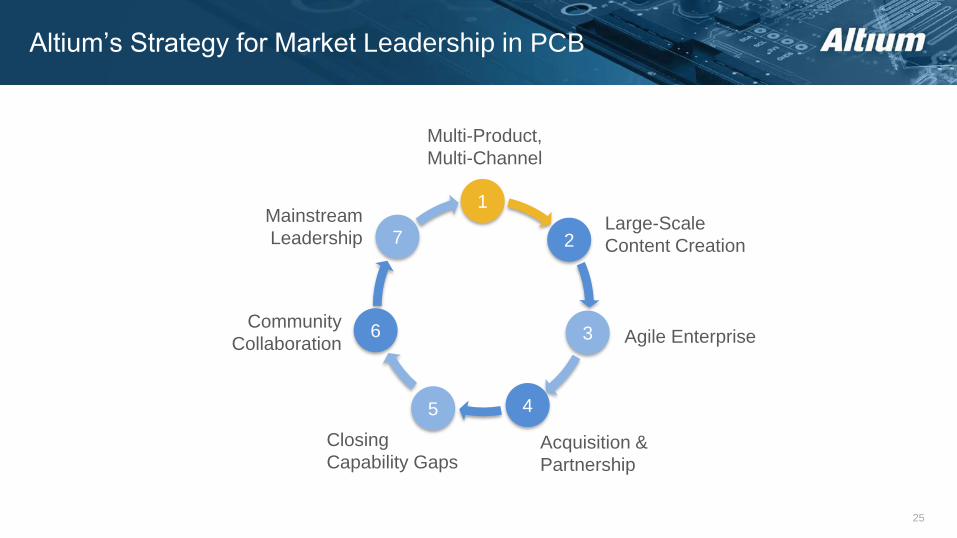
Altium’s Strategy for Market Leadership in PCB
Large-Scale
Content Creation
Acquisition &
Partnership
Agile Enterprise
Closing
Capability Gaps
Multi-Product,
Multi-Channel
Community
Collaboration
Mainstream
Leadership
26
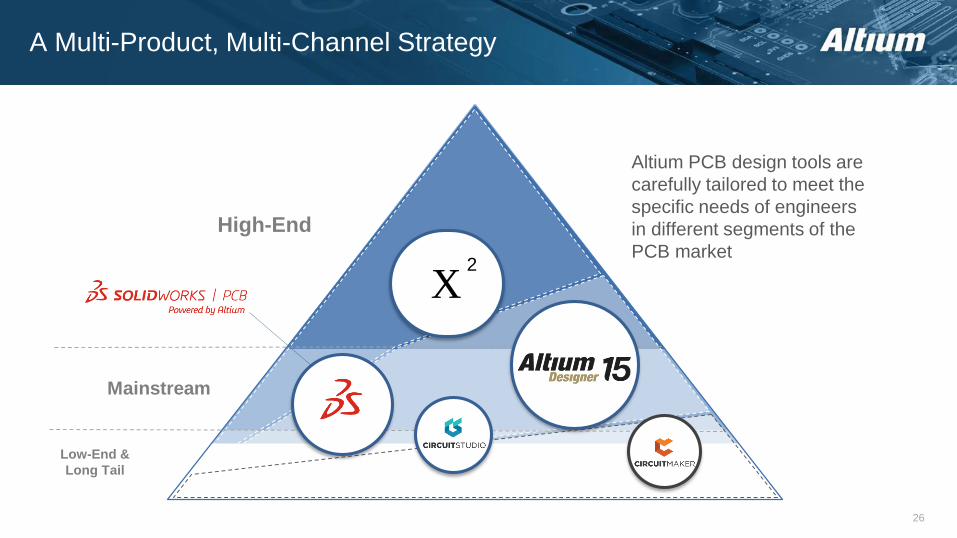
A Multi-Product, Multi-Channel Strategy
Low-End &
Long Tail
Mainstream
High-End
Altium PCB design tools are
carefully tailored to meet the
specific needs of engineers
in different segments of the
PCB market
X2
27
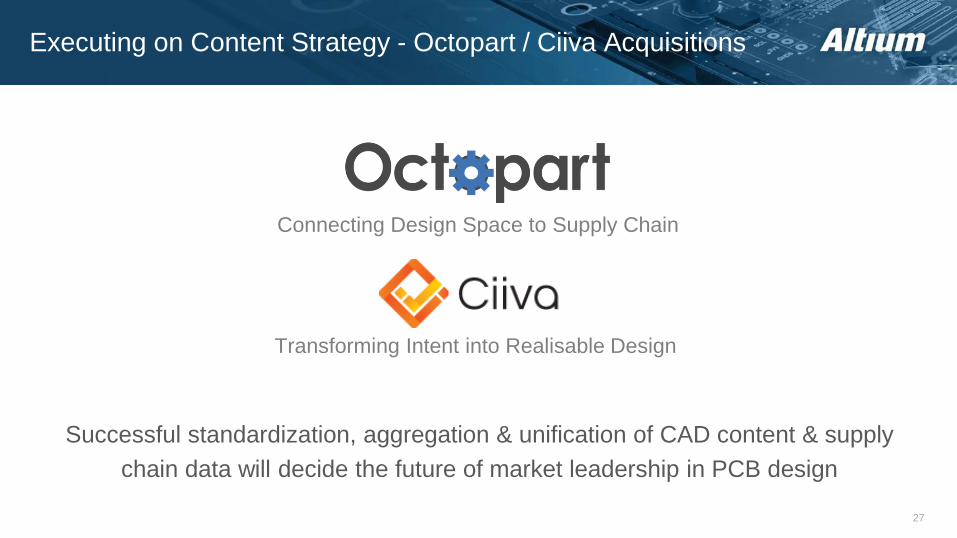
Executing on Content Strategy - Octopart / Ciiva Acquisitions
Connecting Design Space to Supply Chain
Transforming Intent into Realisable Design
Successful standardization, aggregation & unification of CAD content & supply
chain data will decide the future of market leadership in PCB design
28
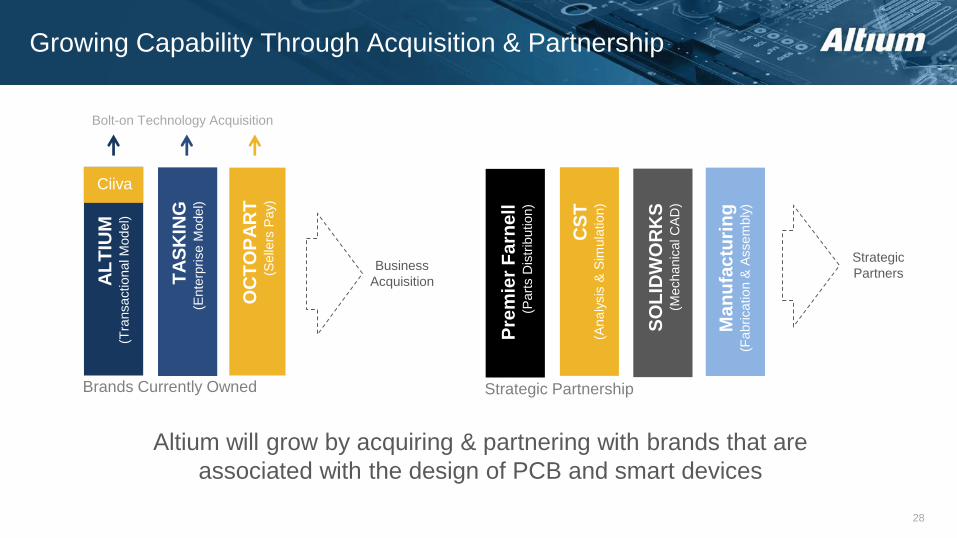
Growing Capability Through Acquisition & Partnership
AL
TIU
M(T
ransactional M
odel)
Brands Currently Owned
Bolt-on Technology Acquisition
Altium will grow by acquiring & partnering with brands that are
associated with the design of PCB and smart devices
SO
LID
WO
RK
S(M
echanic
al C
AD
)
Pre
mie
r F
arn
ell
(Part
s D
istr
ibution)
Strategic Partnership
TA
SK
ING
(Ente
rprise M
odel)
OC
TO
PA
RT
(Selle
rs P
ay)
Ciiva
Business
Acquisition
CS
T(A
naly
sis
& S
imula
tion)
Strategic
Partners
Ma
nu
fac
turi
ng
(Fabrication &
Assem
bly
)
Questions and Answers
Agenda
2016 Half Year Financial Performance2
1
Pursuing Market Leadership in PCB Design Software
Company Highlights & Successful Execution
3
4 Appendix: Company Overview & Long–Term Outlook
31
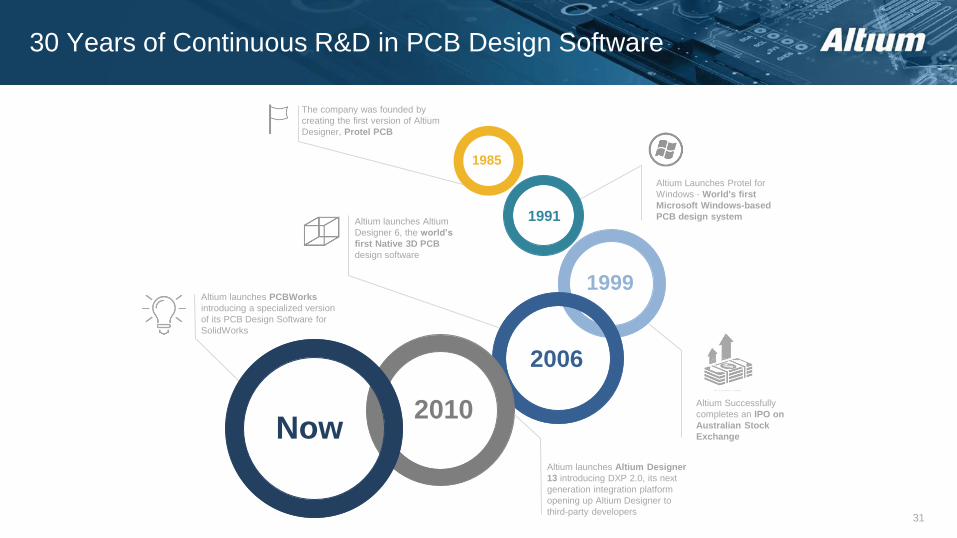
30 Years of Continuous R&D in PCB Design Software
2010
1985
1991
1999
The company was founded by
creating the first version of Altium
Designer, Protel PCB
Altium Launches Protel for
Windows - World's first
Microsoft Windows-based
PCB design system
Altium Successfully
completes an IPO on
Australian Stock
Exchange
2006
Now
Altium launches Altium
Designer 6, the world’s
first Native 3D PCB
design software
Altium launches Altium Designer
13 introducing DXP 2.0, its next
generation integration platform
opening up Altium Designer to
third-party developers
Altium launches PCBWorks
introducing a specialized version
of its PCB Design Software for
SolidWorks
32
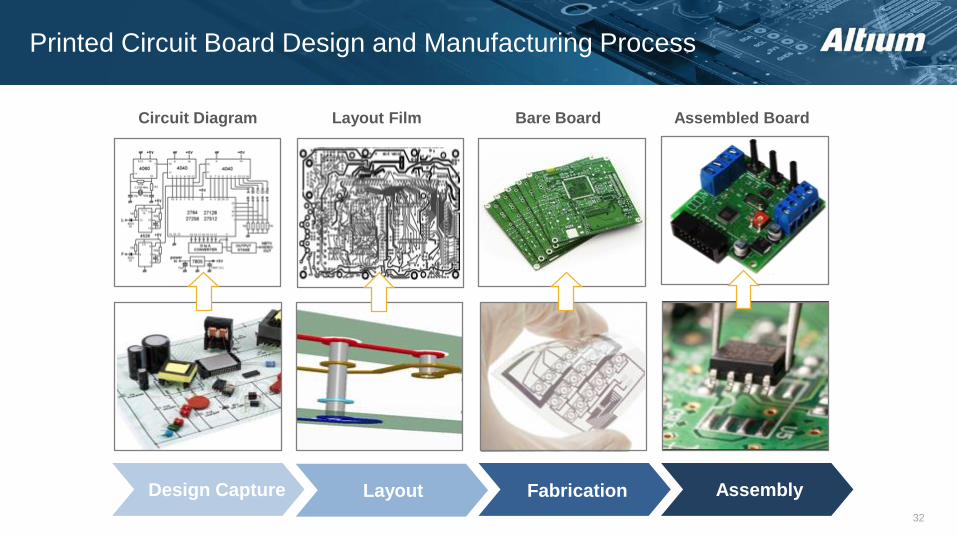
Printed Circuit Board Design and Manufacturing Process
Bare BoardLayout Film Assembled BoardCircuit Diagram
Design Capture Layout Fabrication Assembly
33
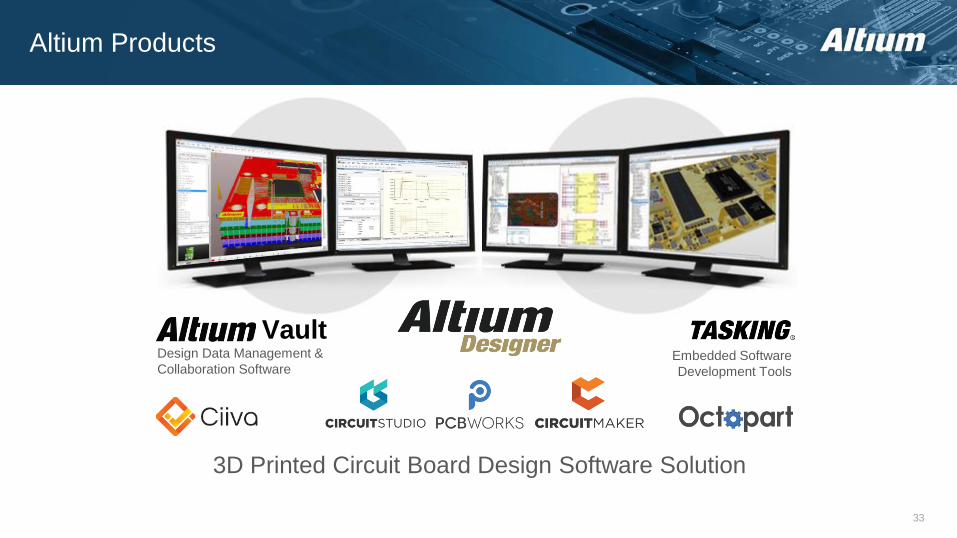
Altium Products
Electronic
Design
Design Data Management &
Collaboration SoftwareEmbedded Software
Development Tools
3D Printed Circuit Board Design Software Solution
Vault
34
Diversity of Applications
Automotive
Electronics &
High-Tech
Life SciencesAerospace &
Defence
Consumer-
Electronics
SemiconductorsIndustrial Controls
Automation
Research &
Education
Mobile Devices &
Communications
Computers
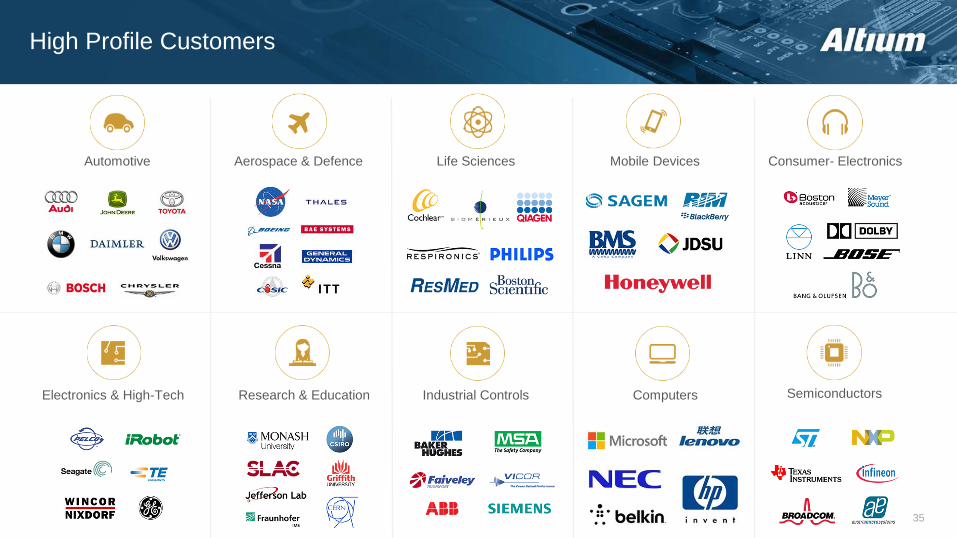
35
High Profile Customers
Automotive
Electronics & High-Tech
Life SciencesAerospace & Defence Consumer- Electronics
SemiconductorsIndustrial ControlsResearch & Education
Mobile Devices
Computers
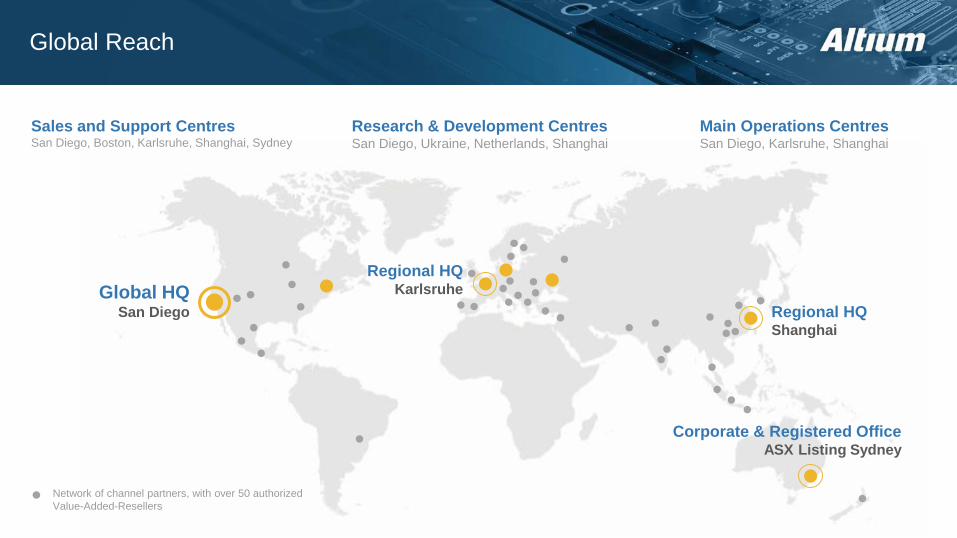
36
Global Reach
Main Operations CentresSan Diego, Karlsruhe, Shanghai
Research & Development CentresSan Diego, Ukraine, Netherlands, Shanghai
Sales and Support CentresSan Diego, Boston, Karlsruhe, Shanghai, Sydney
Network of channel partners, with over 50 authorized
Value-Added-Resellers
Global HQSan Diego
Corporate & Registered OfficeASX Listing Sydney
Regional HQShanghai
Regional HQKarlsruhe
37
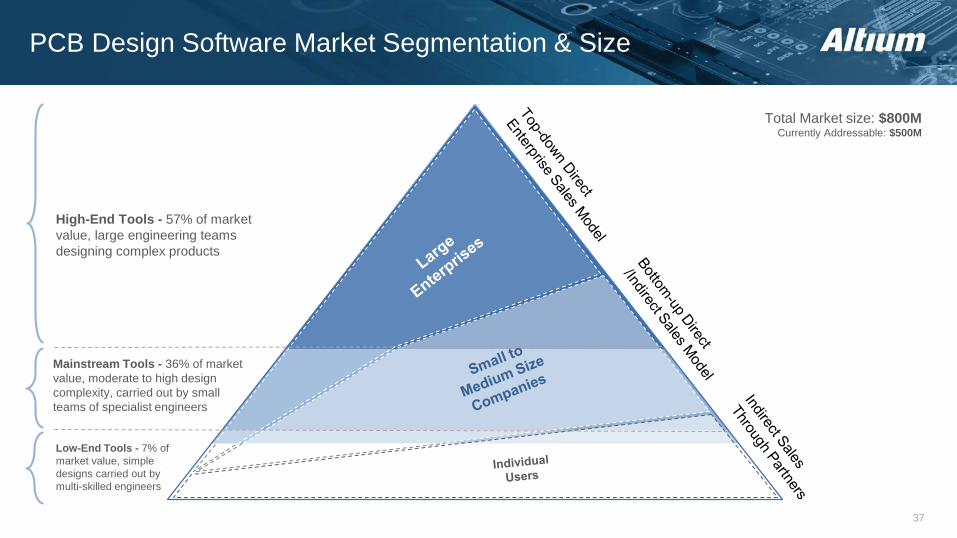
PCB Design Software Market Segmentation & Size
Total Market size: $800MCurrently Addressable: $500M
High-End Tools - 57% of market
value, large engineering teams
designing complex products
Low-End Tools - 7% of
market value, simple
designs carried out by
multi-skilled engineers
Mainstream Tools - 36% of market
value, moderate to high design
complexity, carried out by small
teams of specialist engineers
38
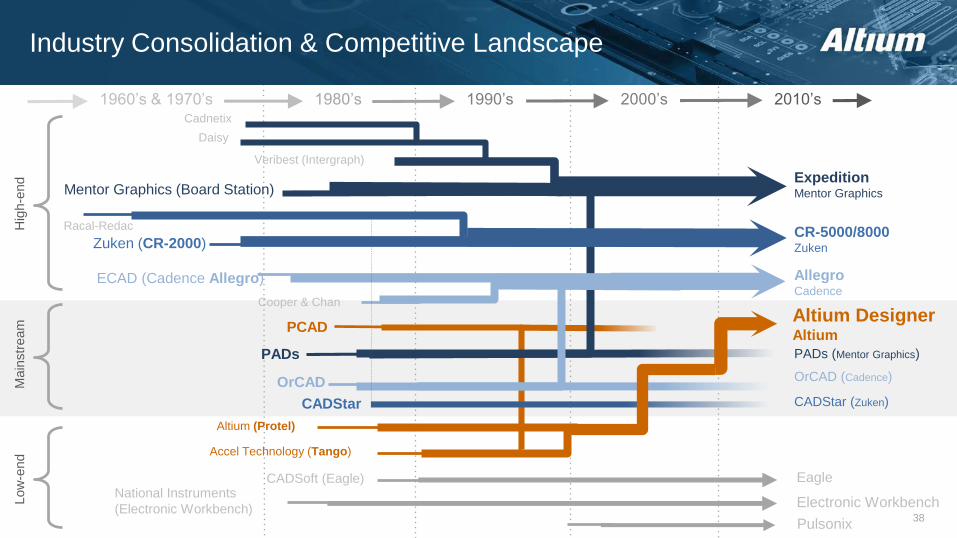
Industry Consolidation & Competitive Landscape
PADs
AllegroCadence
ECAD (Cadence Allegro)
Cooper & Chan
OrCAD
CADStar
Daisy
Cadnetix
Veribest (Intergraph)
ExpeditionMentor GraphicsMentor Graphics (Board Station)
Altium DesignerAltium
PCAD
Altium (Protel)
Accel Technology (Tango)
PADs (Mentor Graphics)
OrCAD (Cadence)
CADStar (Zuken)
Main
str
eam
Low
-end
CADSoft (Eagle) Eagle
CR-5000/8000Zuken
Racal-Redac
Zuken (CR-2000)
National Instruments
(Electronic Workbench)Electronic Workbench
Pulsonix
Hig
h-e
nd
1960’s & 1970’s 1980’s 1990’s 2000’s 2010’s
39
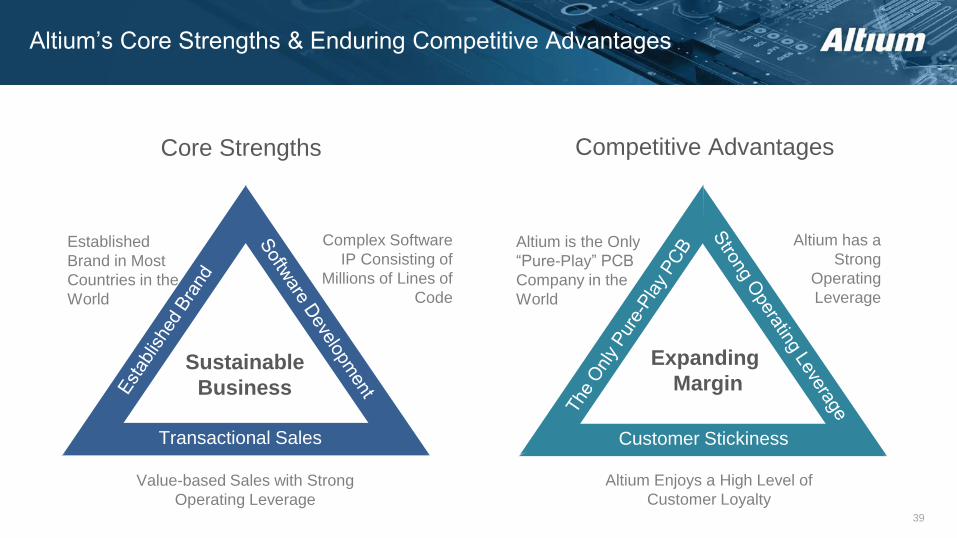
Altium’s Core Strengths & Enduring Competitive Advantages
Established
Brand in Most
Countries in the
World
Complex Software
IP Consisting of
Millions of Lines of
Code
Value-based Sales with Strong
Operating Leverage
Transactional Sales
Altium is the Only
“Pure-Play” PCB
Company in the
World
Altium has a
Strong
Operating
Leverage
Altium Enjoys a High Level of
Customer Loyalty
Customer Stickiness
Core Strengths Competitive Advantages
Expanding
MarginSustainable
Business
40
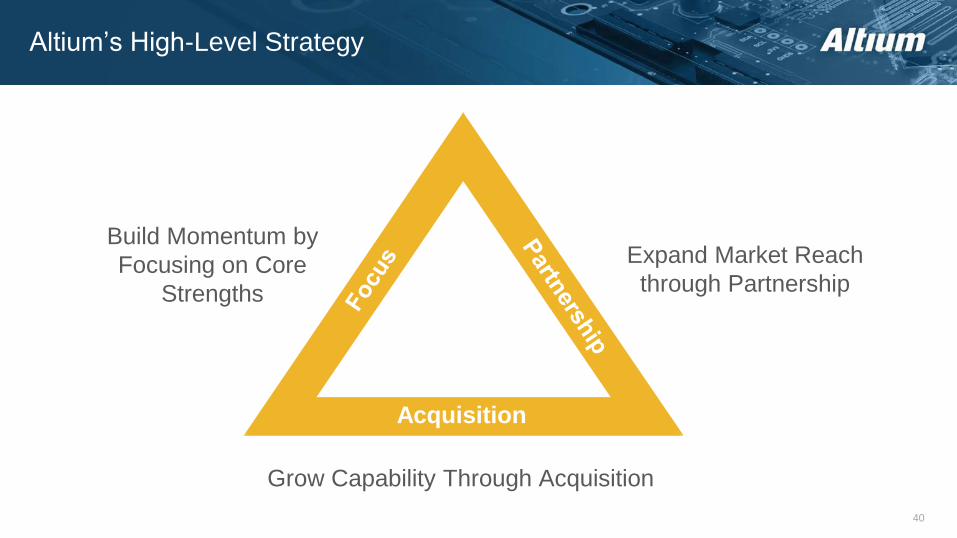
Altium’s High-Level Strategy
Build Momentum by
Focusing on Core
Strengths
Expand Market Reach
through Partnership
Grow Capability Through Acquisition
Acquisition
41
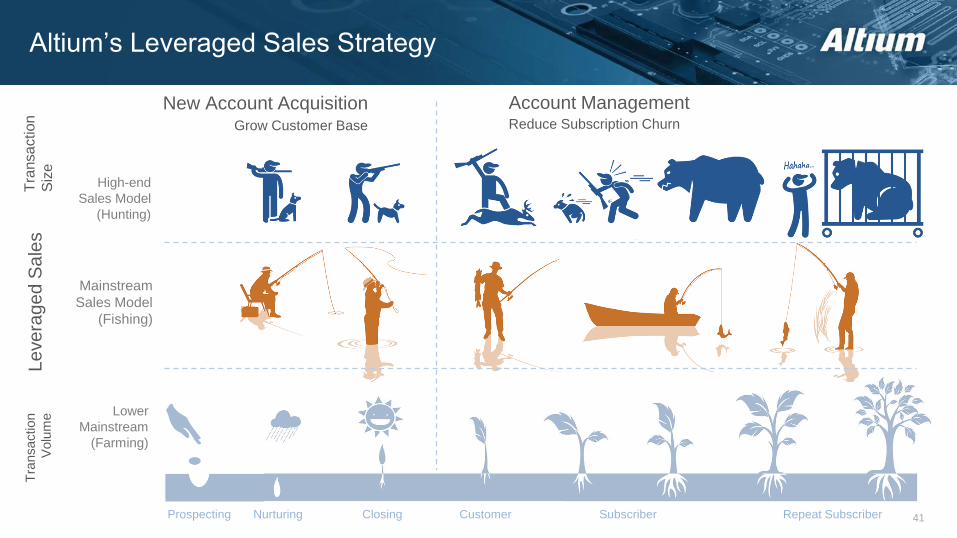
Altium’s Leveraged Sales Strategy
Mainstream
Sales Model
(Fishing)
Lower
Mainstream
(Farming)
High-end
Sales Model
(Hunting)
New Account Acquisition Account ManagementGrow Customer Base Reduce Subscription Churn
Le
ve
rag
ed
Sa
les
Tra
nsa
ction
Siz
e
Tra
nsaction
Volu
me
Repeat SubscriberClosing SubscriberCustomerNurturingProspecting
42
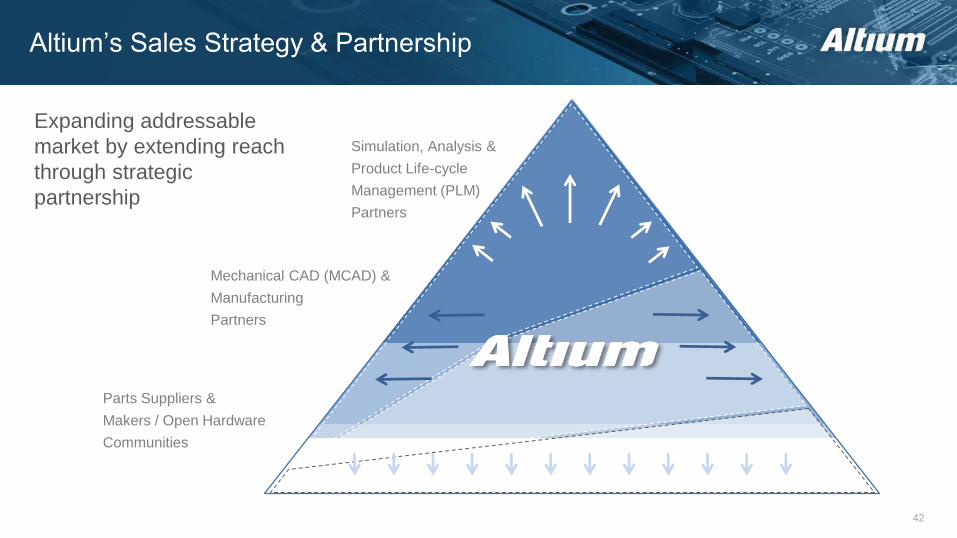
Altium’s Sales Strategy & Partnership
Parts Suppliers &
Makers / Open Hardware
Communities
Mechanical CAD (MCAD) &
Manufacturing
Partners
Simulation, Analysis &
Product Life-cycle
Management (PLM)
Partners
Expanding addressable
market by extending reach
through strategic
partnership
Long – Term Outlook
The proliferation of intelligent products is driver of growth for our
business for the foreseeable future
Altium will continue to deliver double-digit top line growth while
expanding operating margin to enter and maintain 30% plus
Altium is on-track to achieve its revenue goal of $100 million by FY17
Altium is confident that achieving market leadership in PCB design
software by 2020 is well within its reach