Embed Size (px)
Citation preview
1
SFMTA 2016 ANNUAL REPORT
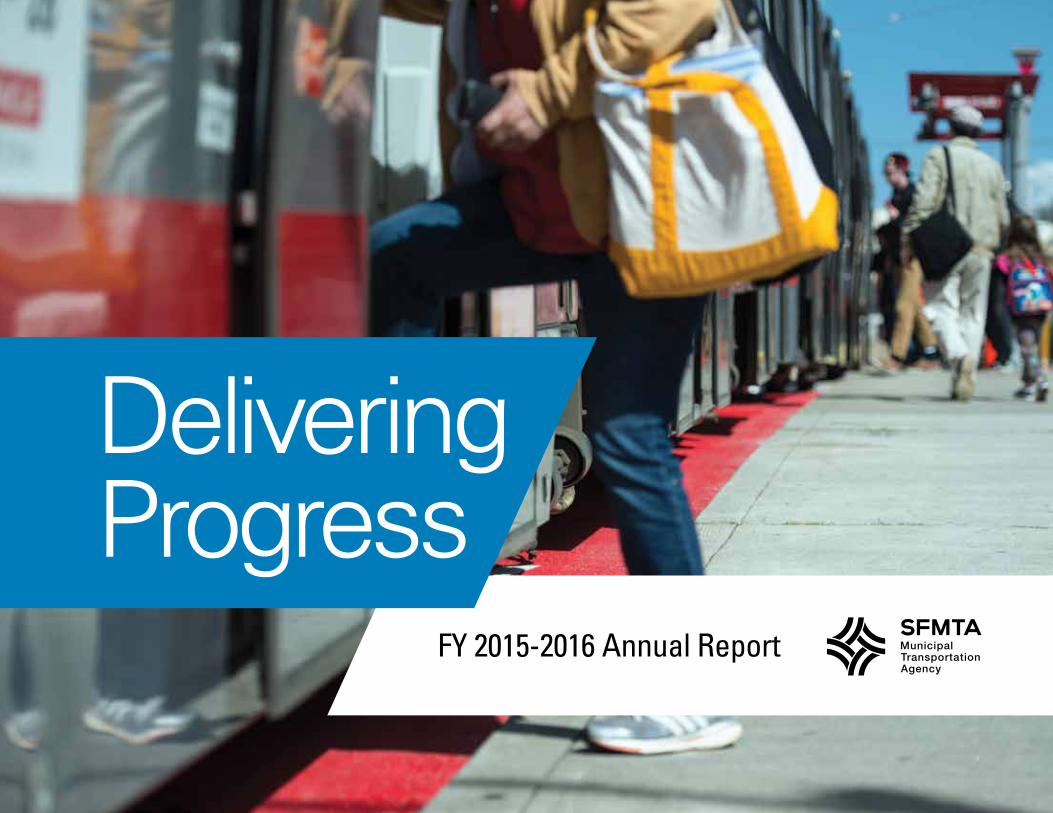
FY 2015-2016 Annual Report
DeliveringProgress
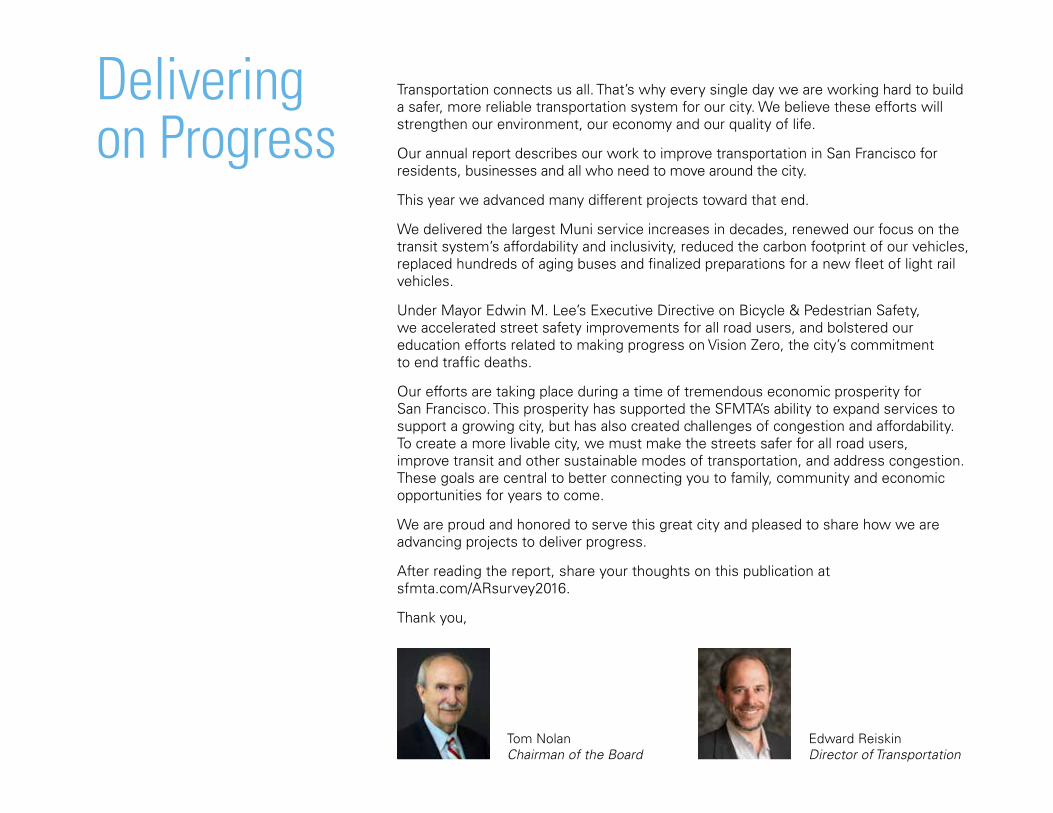
Transportation connects us all. That’s why every single day we are working hard to build a safer, more reliable transportation system for our city. We believe these efforts will strengthen our environment, our economy and our quality of life.
Our annual report describes our work to improve transportation in San Francisco for residents, businesses and all who need to move around the city.
This year we advanced many different projects toward that end.
We delivered the largest Muni service increases in decades, renewed our focus on the transit system’s affordability and inclusivity, reduced the carbon footprint of our vehicles, replaced hundreds of aging buses and finalized preparations for a new fleet of light rail vehicles.
Under Mayor Edwin M. Lee’s Executive Directive on Bicycle & Pedestrian Safety, we accelerated street safety improvements for all road users, and bolstered our education efforts related to making progress on Vision Zero, the city’s commitment to end traffic deaths.
Our efforts are taking place during a time of tremendous economic prosperity for San Francisco. This prosperity has supported the SFMTA’s ability to expand services to support a growing city, but has also created challenges of congestion and affordability. To create a more livable city, we must make the streets safer for all road users, improve transit and other sustainable modes of transportation, and address congestion. These goals are central to better connecting you to family, community and economic opportunities for years to come.
We are proud and honored to serve this great city and pleased to share how we are advancing projects to deliver progress.
After reading the report, share your thoughts on this publication at sfmta.com/ARsurvey2016.
Thank you,
Tom NolanChairman of the Board
Edward ReiskinDirector of Transportation
Delivering on Progress
1
SFMTA 2016 ANNUAL REPORT
2
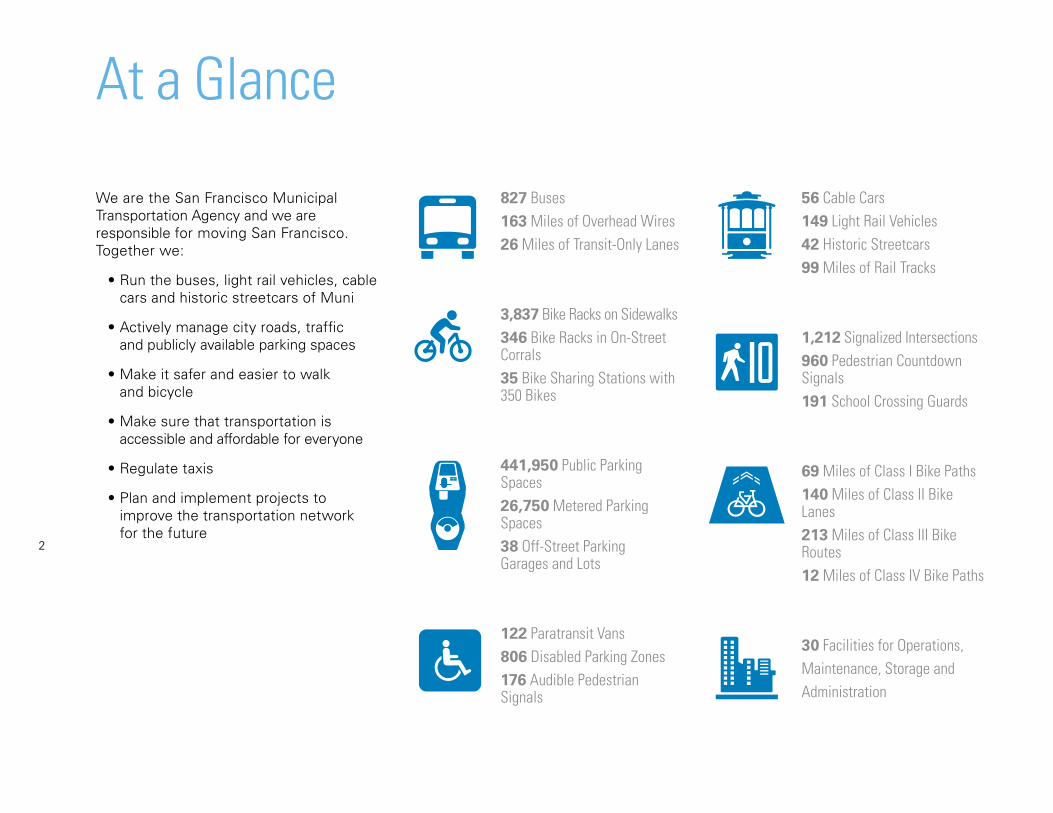
We are the San Francisco Municipal Transportation Agency and we are responsible for moving San Francisco. Together we:
• Run the buses, light rail vehicles, cable cars and historic streetcars of Muni
• Actively manage city roads, traffic and publicly available parking spaces
• Make it safer and easier to walk and bicycle
• Make sure that transportation is accessible and affordable for everyone
• Regulate taxis
• Plan and implement projects to improve the transportation network for the future
827 Buses163 Miles of Overhead Wires26 Miles of Transit-Only Lanes
3,837 Bike Racks on Sidewalks346 Bike Racks in On-Street Corrals35 Bike Sharing Stations with 350 Bikes
441,950 Public Parking Spaces26,750 Metered Parking Spaces38 Off-Street Parking Garages and Lots
122 Paratransit Vans806 Disabled Parking Zones176 Audible Pedestrian Signals
56 Cable Cars149 Light Rail Vehicles42 Historic Streetcars 99 Miles of Rail Tracks
1,212 Signalized Intersections960 Pedestrian Countdown Signals191 School Crossing Guards
69 Miles of Class I Bike Paths140 Miles of Class II Bike Lanes213 Miles of Class III Bike Routes12 Miles of Class IV Bike Paths
30 Facilities for Operations, Maintenance, Storage and Administration
At a Glance
3
SFMTA 2016 ANNUAL REPORT
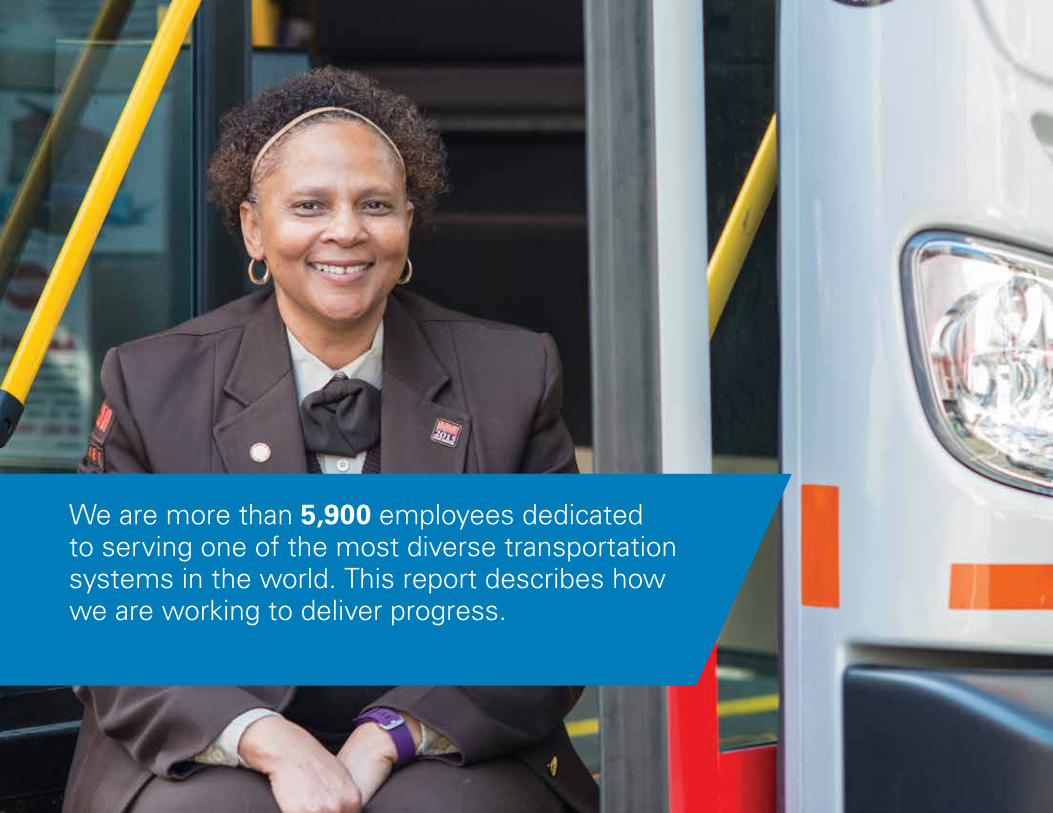
We are more than 5,900 employees dedicated to serving one of the most diverse transportation systems in the world. This report describes how we are working to deliver progress.
4
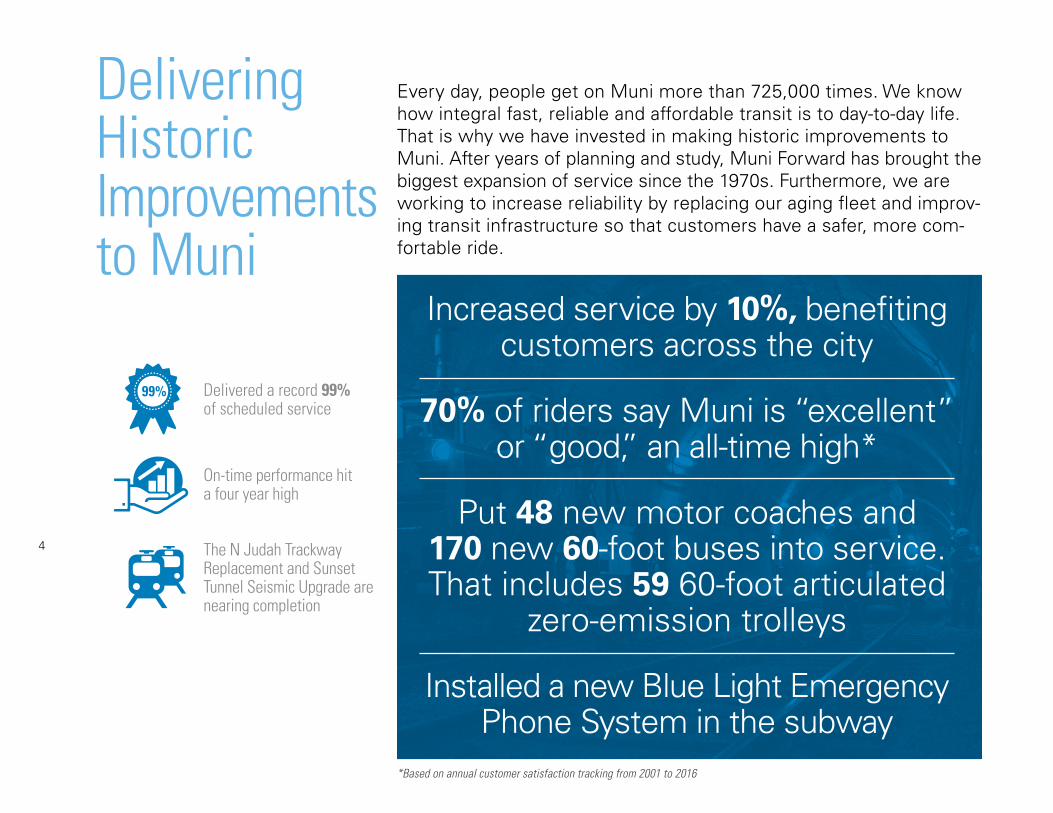
Delivering Historic Improvements to Muni
Every day, people get on Muni more than 725,000 times. We know how integral fast, reliable and affordable transit is to day-to-day life. That is why we have invested in making historic improvements to Muni. After years of planning and study, Muni Forward has brought the biggest expansion of service since the 1970s. Furthermore, we are working to increase reliability by replacing our aging fleet and improv-ing transit infrastructure so that customers have a safer, more com-fortable ride.
Delivered a record 99% of scheduled service
On-time performance hit a four year high The N Judah Trackway Replacement and Sunset Tunnel Seismic Upgrade are nearing completion
Increased service by 10%, benefiting customers across the city
70% of riders say Muni is “excellent” or “good,” an all-time high*
Put 48 new motor coaches and 170 new 60-foot buses into service. That includes 59 60-foot articulated
zero-emission trolleys
Installed a new Blue Light Emergency Phone System in the subway
99%
*Based on annual customer satisfaction tracking from 2001 to 2016
5
SFMTA 2016 ANNUAL REPORT
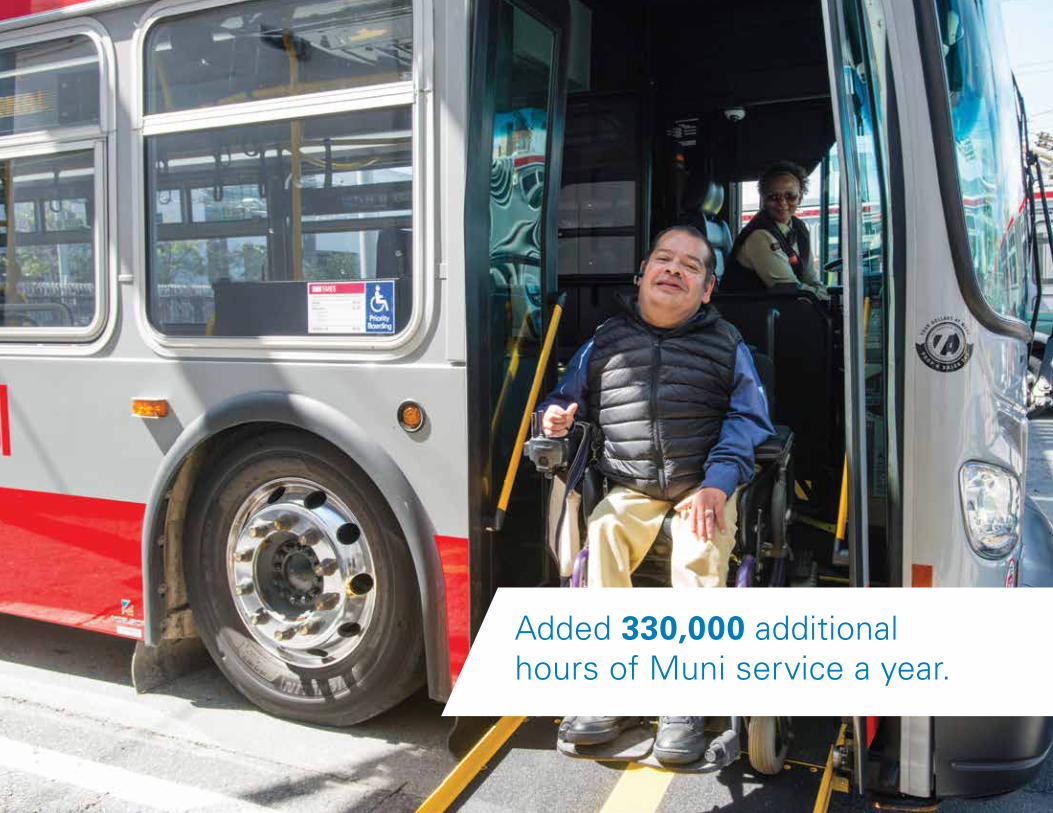
Added 330,000 additional hours of Muni service a year.
6
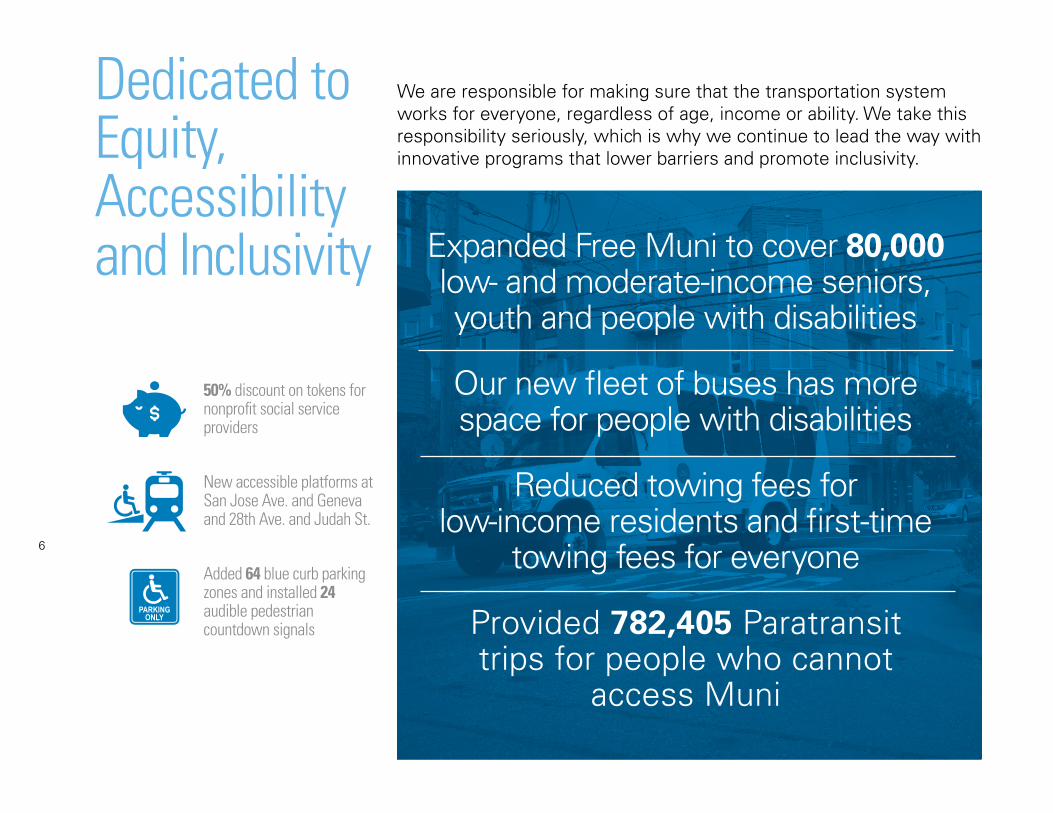
Dedicated to Equity, Accessibility and Inclusivity
We are responsible for making sure that the transportation system works for everyone, regardless of age, income or ability. We take this responsibility seriously, which is why we continue to lead the way with innovative programs that lower barriers and promote inclusivity.
50% discount on tokens for nonprofit social service providers
New accessible platforms at San Jose Ave. and Geneva and 28th Ave. and Judah St.
Added 64 blue curb parking zones and installed 24 audible pedestrian countdown signals
Expanded Free Muni to cover 80,000 low- and moderate-income seniors, youth and people with disabilities
Our new fleet of buses has more space for people with disabilities
Reduced towing fees for low-income residents and first-time
towing fees for everyone
Provided 782,405 Paratransit trips for people who cannot
access Muni
7
SFMTA 2016 ANNUAL REPORT
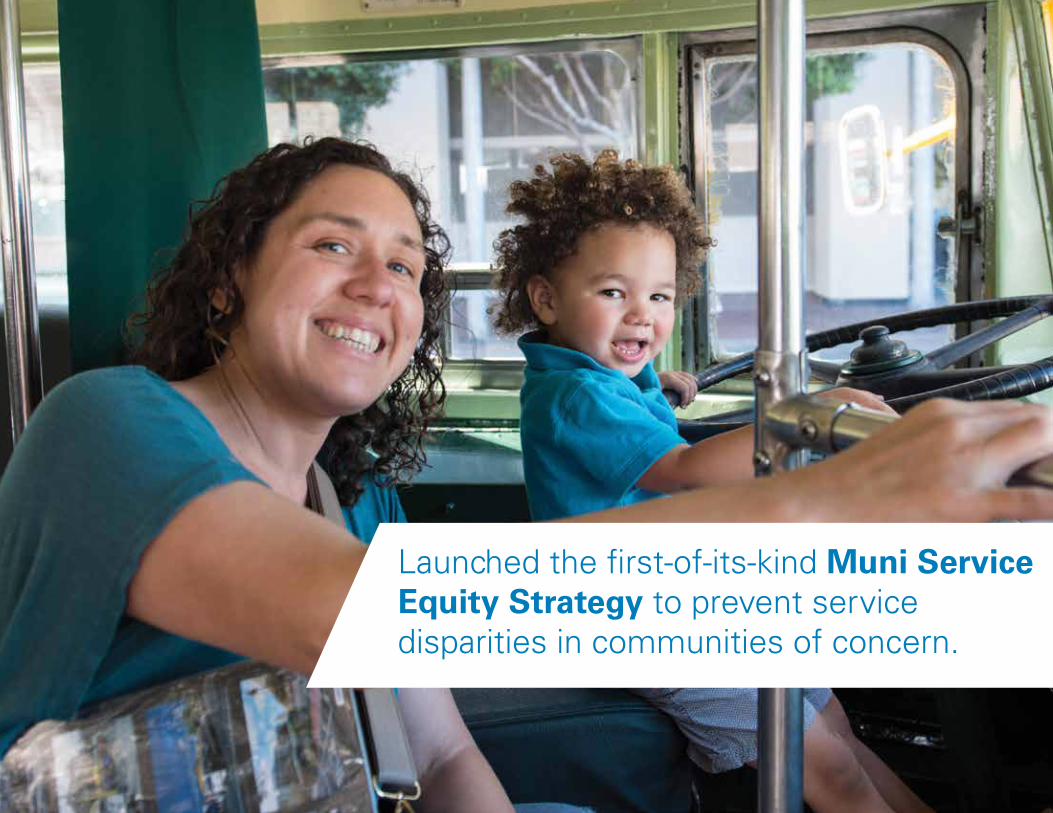
Launched the first-of-its-kind Muni Service Equity Strategy to prevent service disparities in communities of concern.
8
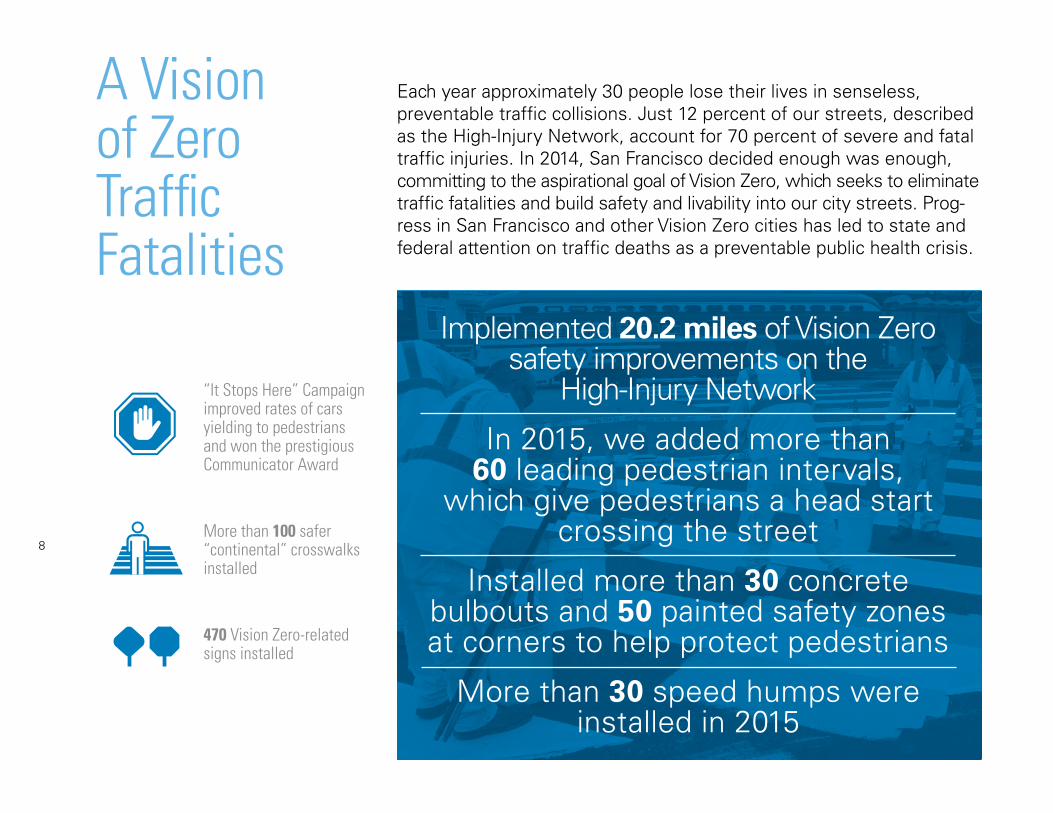
A Vision of Zero Traffic Fatalities
“It Stops Here” Campaign improved rates of cars yielding to pedestrians and won the prestigious Communicator Award
More than 100 safer “continental” crosswalks installed
470 Vision Zero-related signs installed
Each year approximately 30 people lose their lives in senseless, preventable traffic collisions. Just 12 percent of our streets, described as the High-Injury Network, account for 70 percent of severe and fatal traffic injuries. In 2014, San Francisco decided enough was enough, committing to the aspirational goal of Vision Zero, which seeks to eliminate traffic fatalities and build safety and livability into our city streets. Prog-ress in San Francisco and other Vision Zero cities has led to state and federal attention on traffic deaths as a preventable public health crisis.
Implemented 20.2 miles of Vision Zero safety improvements on the
High-Injury Network
In 2015, we added more than 60 leading pedestrian intervals,
which give pedestrians a head start crossing the street
Installed more than 30 concrete bulbouts and 50 painted safety zones at corners to help protect pedestrians
More than 30 speed humps were installed in 2015
9
SFMTA 2016 ANNUAL REPORT
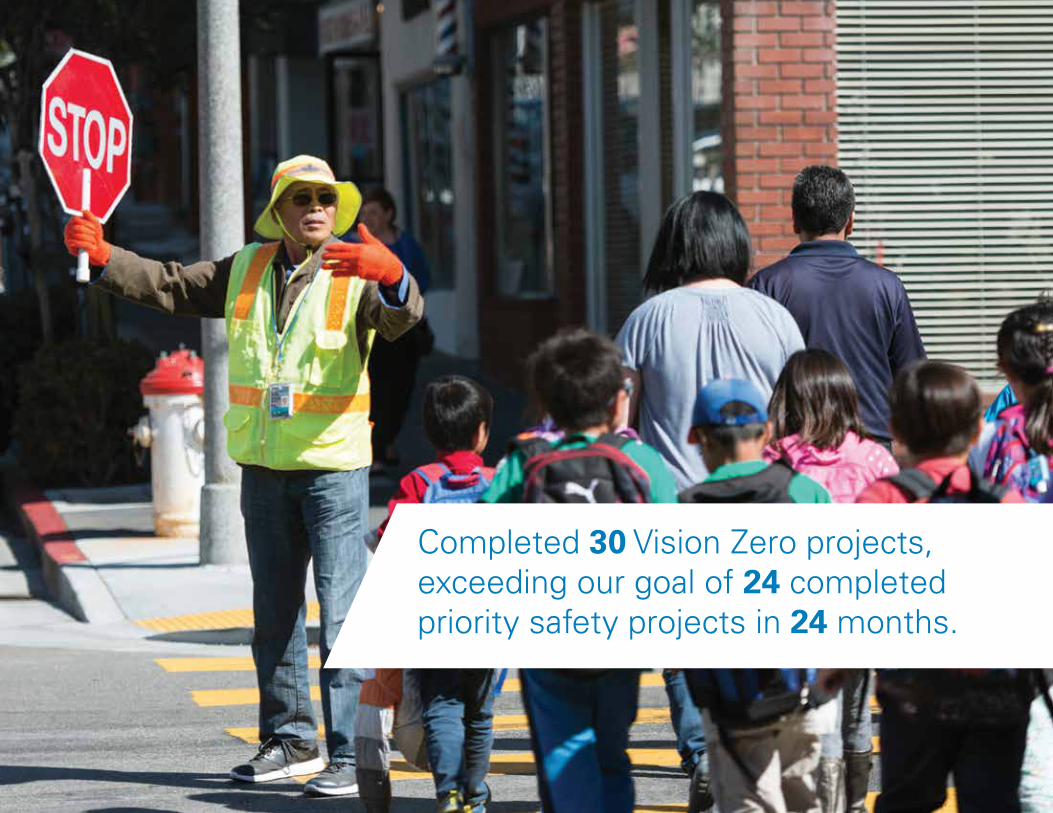
Completed 30 Vision Zero projects, exceeding our goal of 24 completed priority safety projects in 24 months.
10
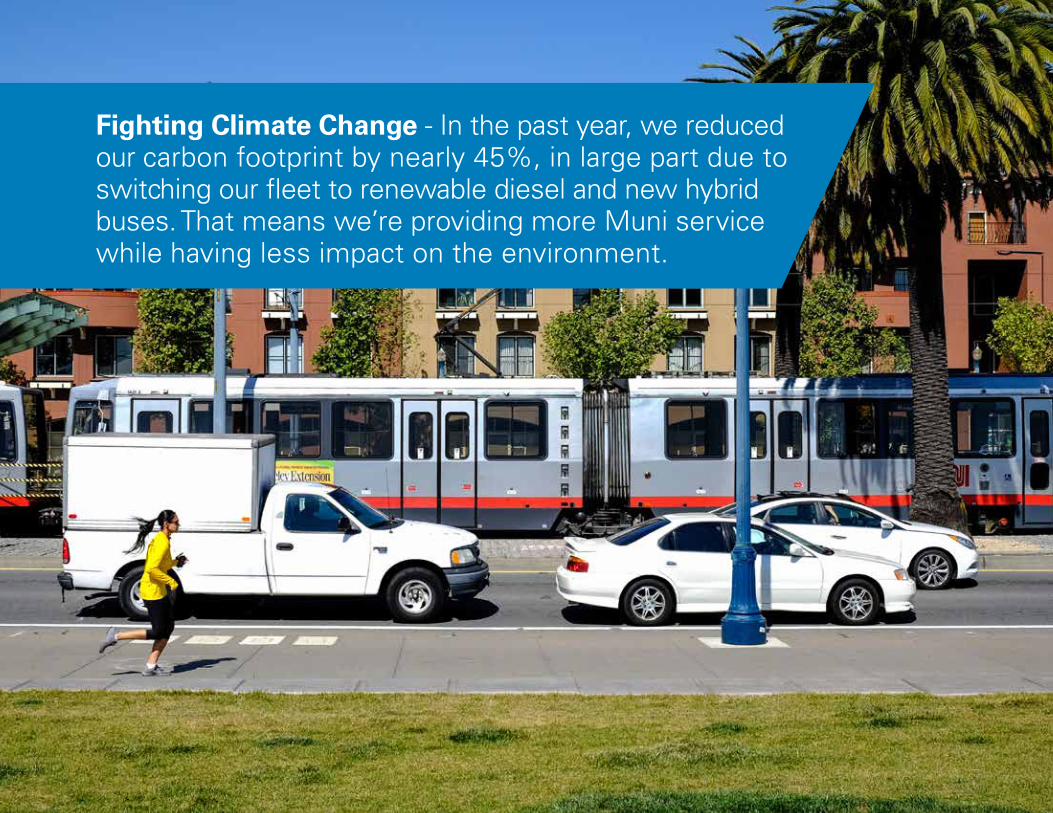
Fighting Climate Change - In the past year, we reduced our carbon footprint by nearly 45%, in large part due to switching our fleet to renewable diesel and new hybrid buses. That means we’re providing more Muni service while having less impact on the environment.
11
SFMTA 2016 ANNUAL REPORT
Continuing Environmental
Leadership
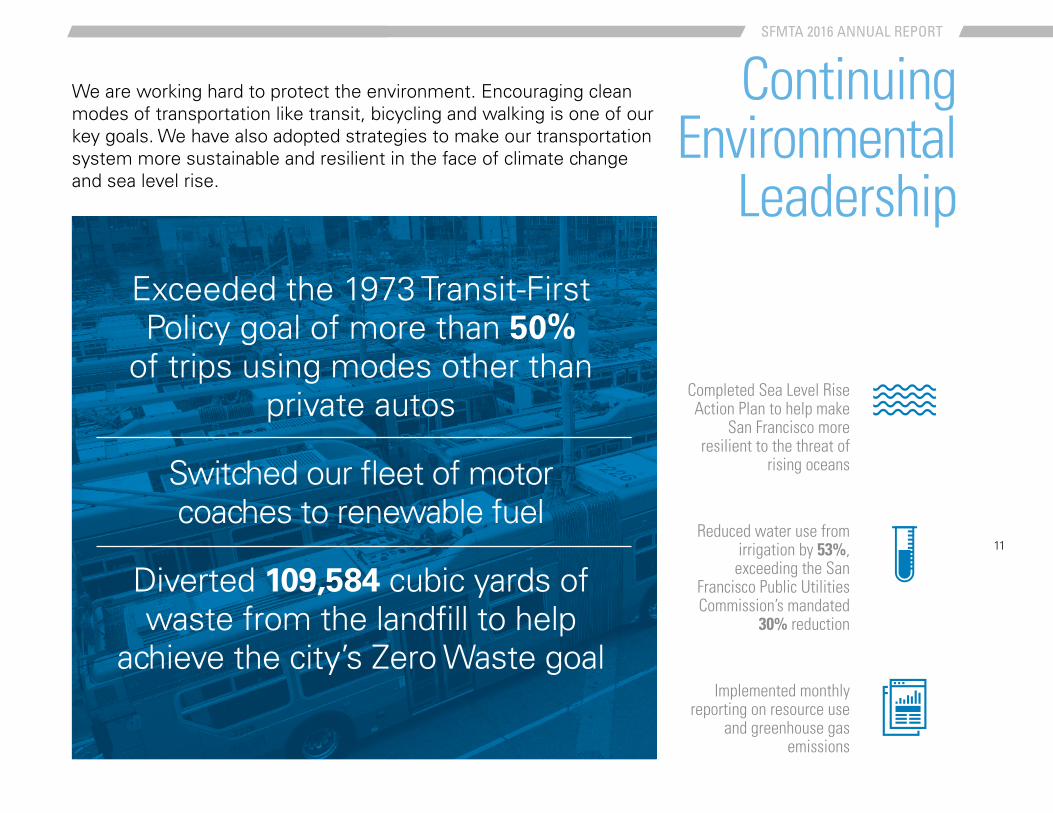
We are working hard to protect the environment. Encouraging clean modes of transportation like transit, bicycling and walking is one of our key goals. We have also adopted strategies to make our transportation system more sustainable and resilient in the face of climate change and sea level rise.
Completed Sea Level Rise Action Plan to help make
San Francisco more resilient to the threat of
rising oceans
Reduced water use from irrigation by 53%,
exceeding the San Francisco Public Utilities Commission’s mandated
30% reduction
Implemented monthly reporting on resource use
and greenhouse gas emissions
Exceeded the 1973 Transit-First Policy goal of more than 50%
of trips using modes other than private autos
Switched our fleet of motor coaches to renewable fuel
Diverted 109,584 cubic yards of waste from the landfill to help
achieve the city’s Zero Waste goal
12
Better for Bicycling
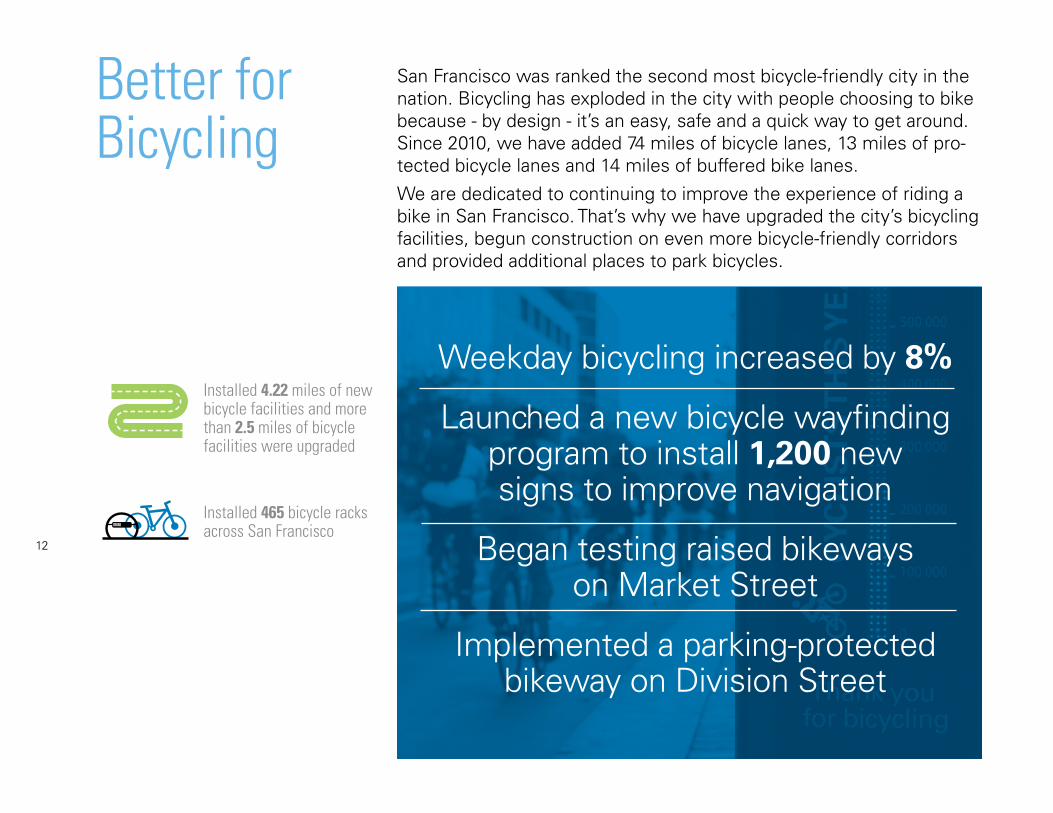
San Francisco was ranked the second most bicycle-friendly city in the nation. Bicycling has exploded in the city with people choosing to bike because - by design - it’s an easy, safe and a quick way to get around. Since 2010, we have added 74 miles of bicycle lanes, 13 miles of pro-tected bicycle lanes and 14 miles of buffered bike lanes.
We are dedicated to continuing to improve the experience of riding a bike in San Francisco. That’s why we have upgraded the city’s bicycling facilities, begun construction on even more bicycle-friendly corridors and provided additional places to park bicycles.
Installed 4.22 miles of new bicycle facilities and more than 2.5 miles of bicycle facilities were upgraded
Installed 465 bicycle racks across San Francisco
Weekday bicycling increased by 8%
Launched a new bicycle wayfinding program to install 1,200 new signs to improve navigation
Began testing raised bikeways on Market Street
Implemented a parking-protected bikeway on Division Street
13
SFMTA 2016 ANNUAL REPORT
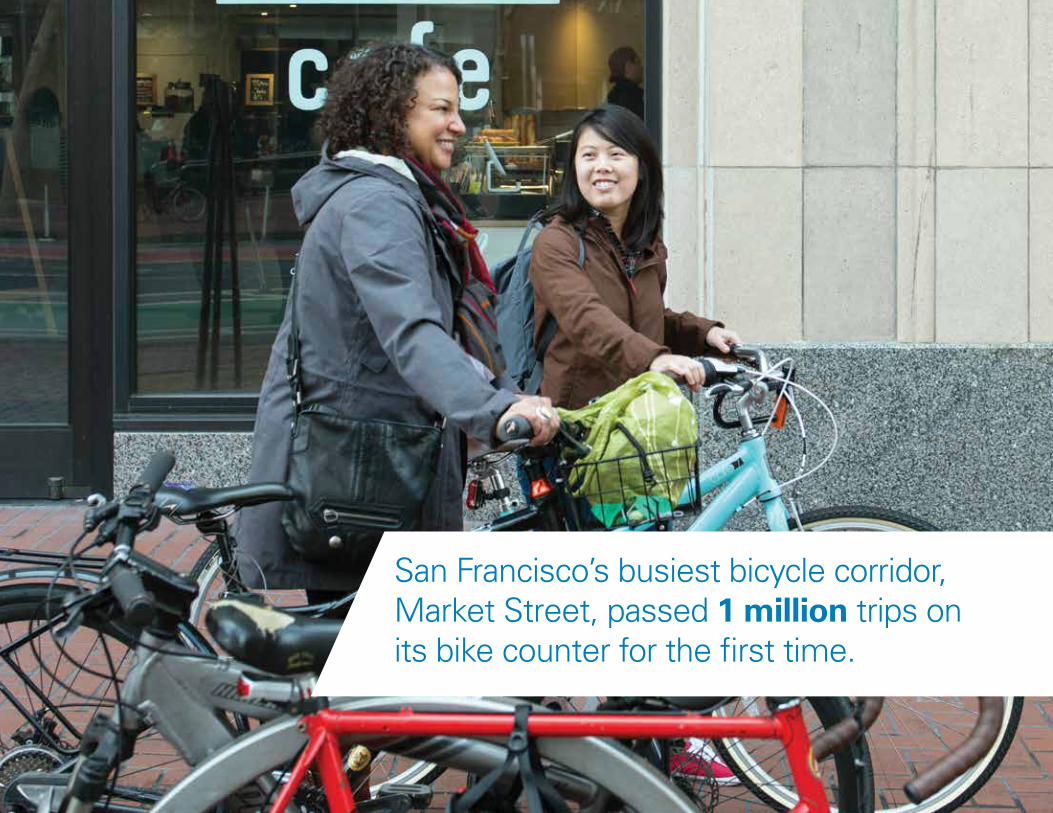
San Francisco’s busiest bicycle corridor, Market Street, passed 1 million trips on its bike counter for the first time.
14
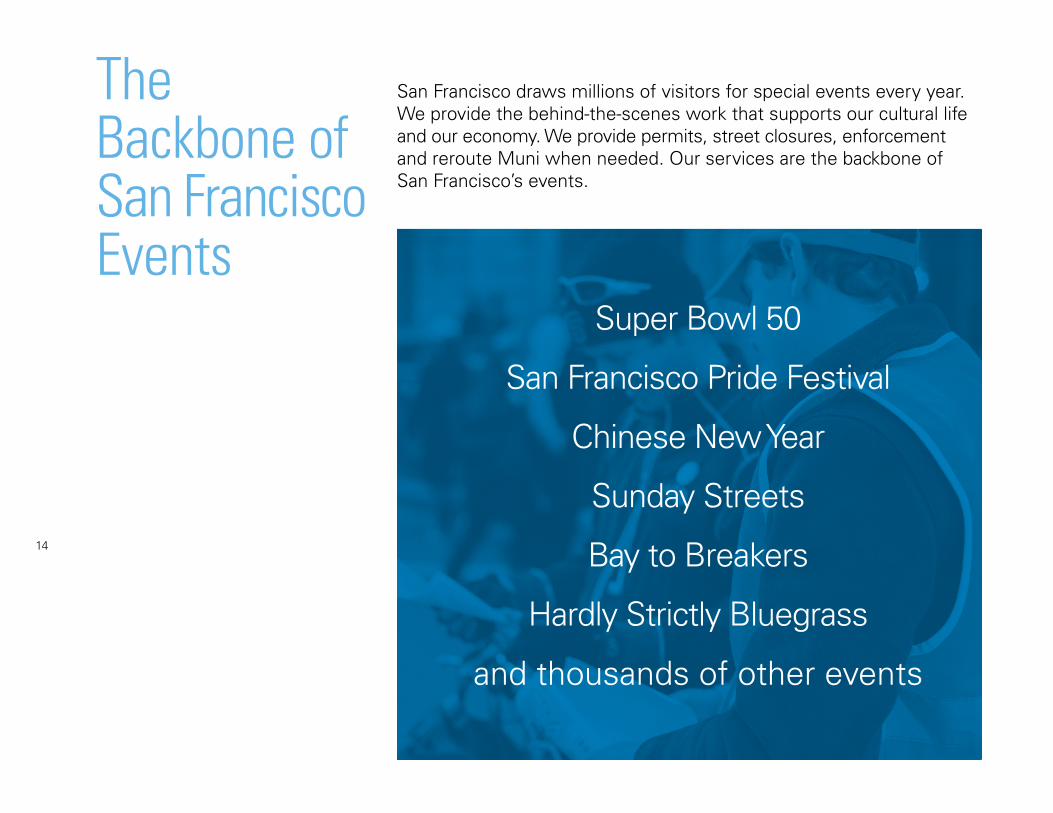
The Backbone of San Francisco Events
San Francisco draws millions of visitors for special events every year. We provide the behind-the-scenes work that supports our cultural life and our economy. We provide permits, street closures, enforcement and reroute Muni when needed. Our services are the backbone of San Francisco’s events.
Super Bowl 50
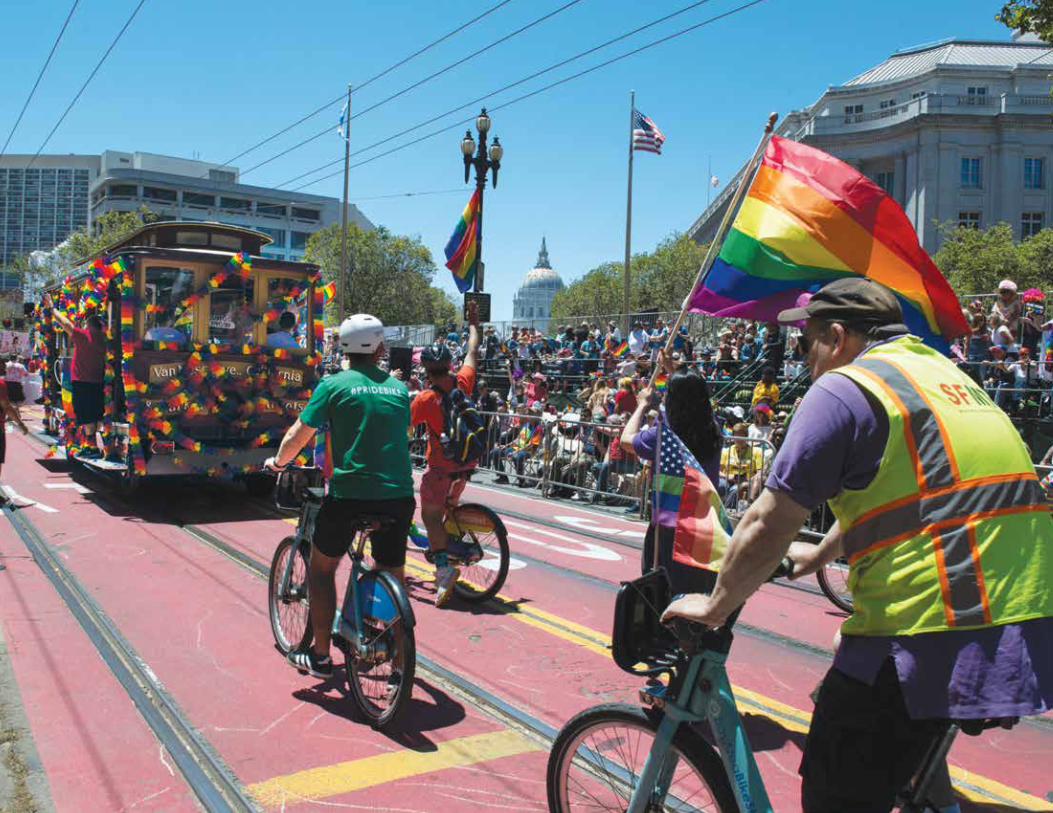
San Francisco Pride Festival
Chinese New Year
Sunday Streets
Bay to Breakers
Hardly Strictly Bluegrass
and thousands of other events
15
SFMTA 2016 ANNUAL REPORT
16
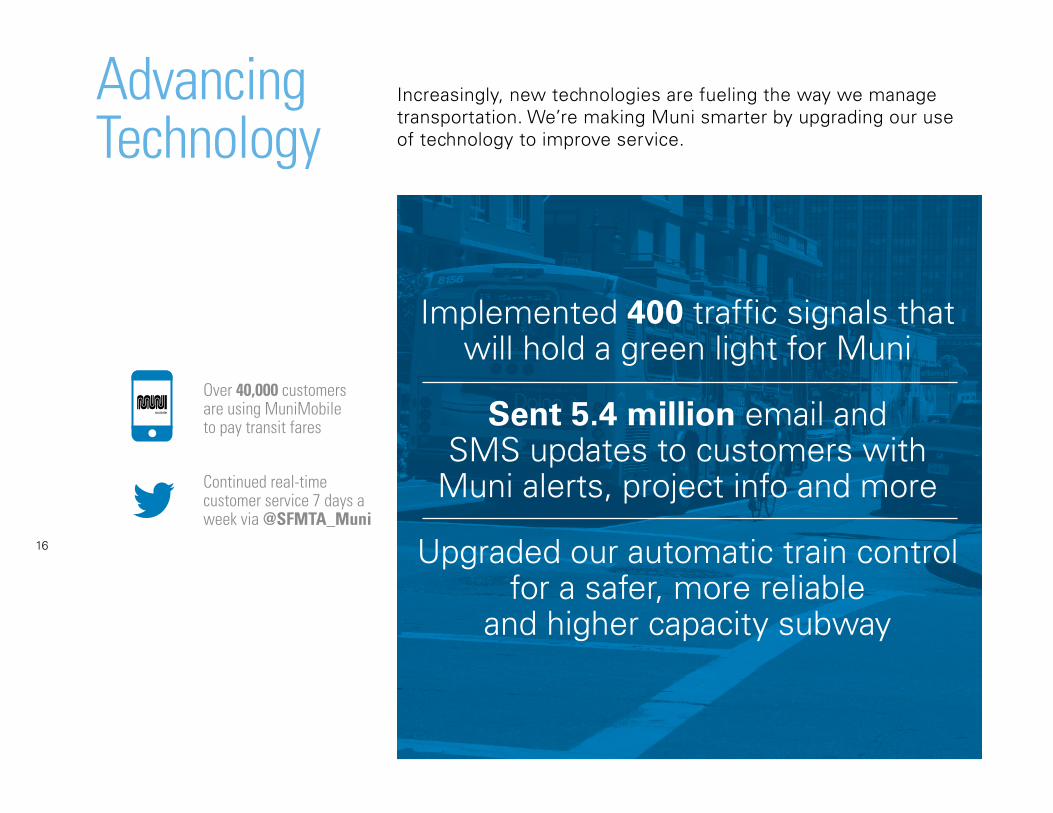
Advancing Technology
Increasingly, new technologies are fueling the way we manage transportation. We’re making Muni smarter by upgrading our use of technology to improve service.
Implemented 400 traffic signals that will hold a green light for Muni
Sent 5.4 million email and SMS updates to customers with
Muni alerts, project info and more
Upgraded our automatic train control for a safer, more reliable
and higher capacity subway
Over 40,000 customers are using MuniMobile to pay transit fares
Continued real-time customer service 7 days a week via @SFMTA_Muni
17
SFMTA 2016 ANNUAL REPORT
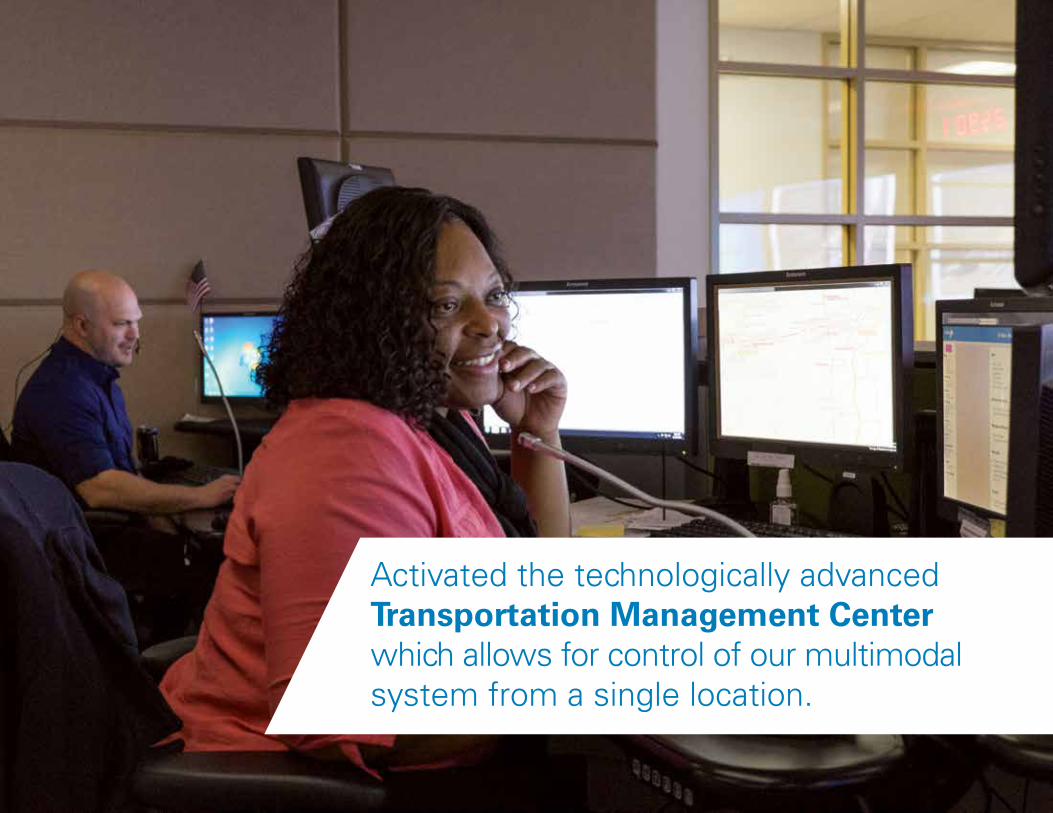
Activated the technologically advanced Transportation Management Center which allows for control of our multimodal system from a single location.
18
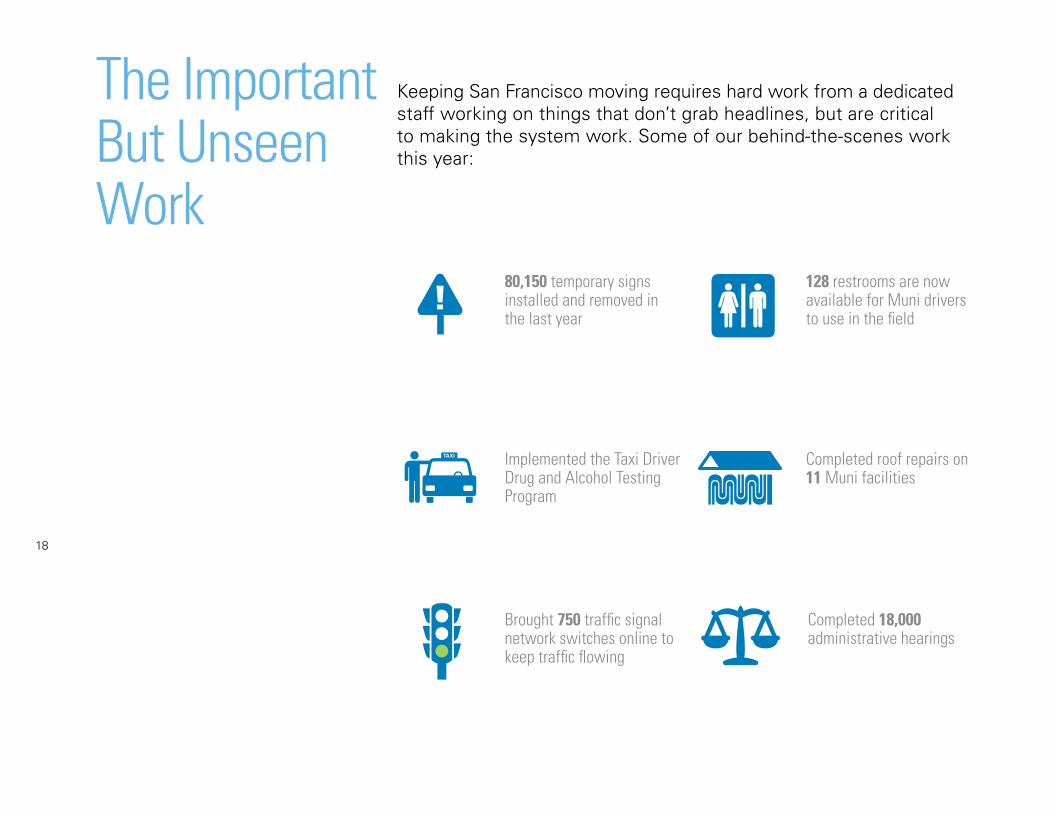
The Important But Unseen Work
Keeping San Francisco moving requires hard work from a dedicated staff working on things that don’t grab headlines, but are critical to making the system work. Some of our behind-the-scenes work this year:
80,150 temporary signs installed and removed in the last year
128 restrooms are now available for Muni drivers to use in the field
Completed roof repairs on 11 Muni facilities
Implemented the Taxi Driver Drug and Alcohol Testing Program
Brought 750 traffic signal network switches online to keep traffic flowing
Completed 18,000 administrative hearings
19
SFMTA 2016 ANNUAL REPORT
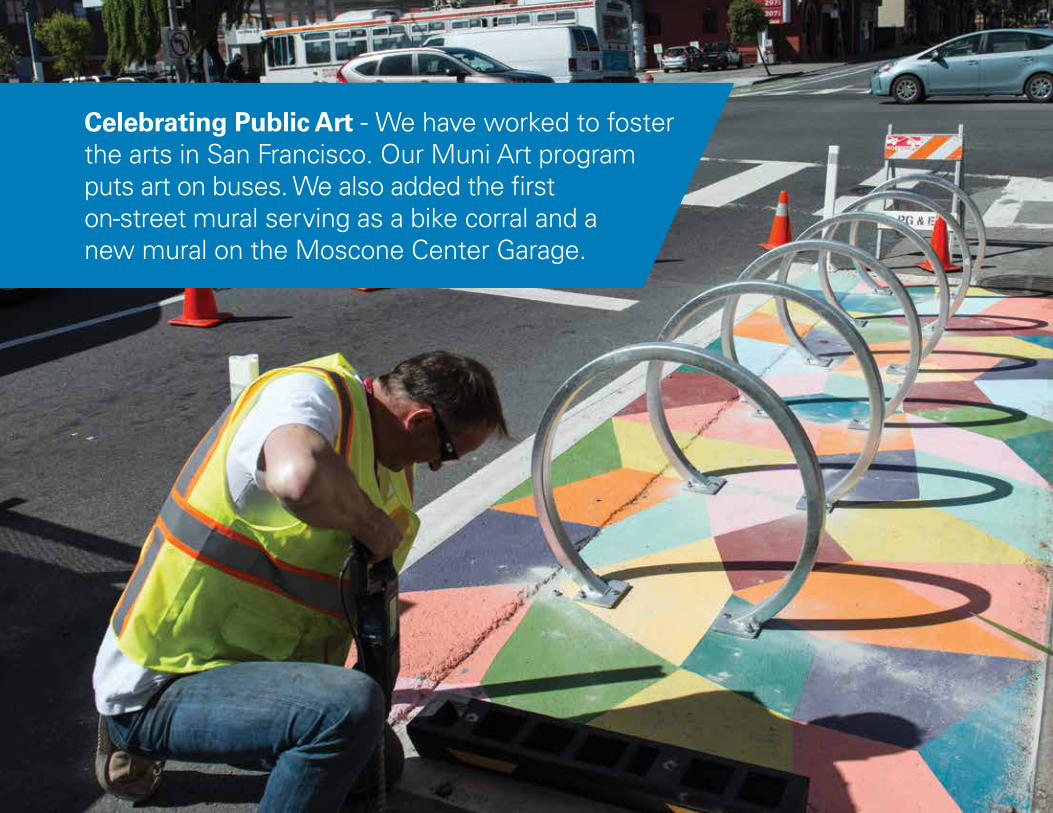
Celebrating Public Art - We have worked to foster the arts in San Francisco. Our Muni Art program puts art on buses. We also added the first on-street mural serving as a bike corral and a new mural on the Moscone Center Garage.
20
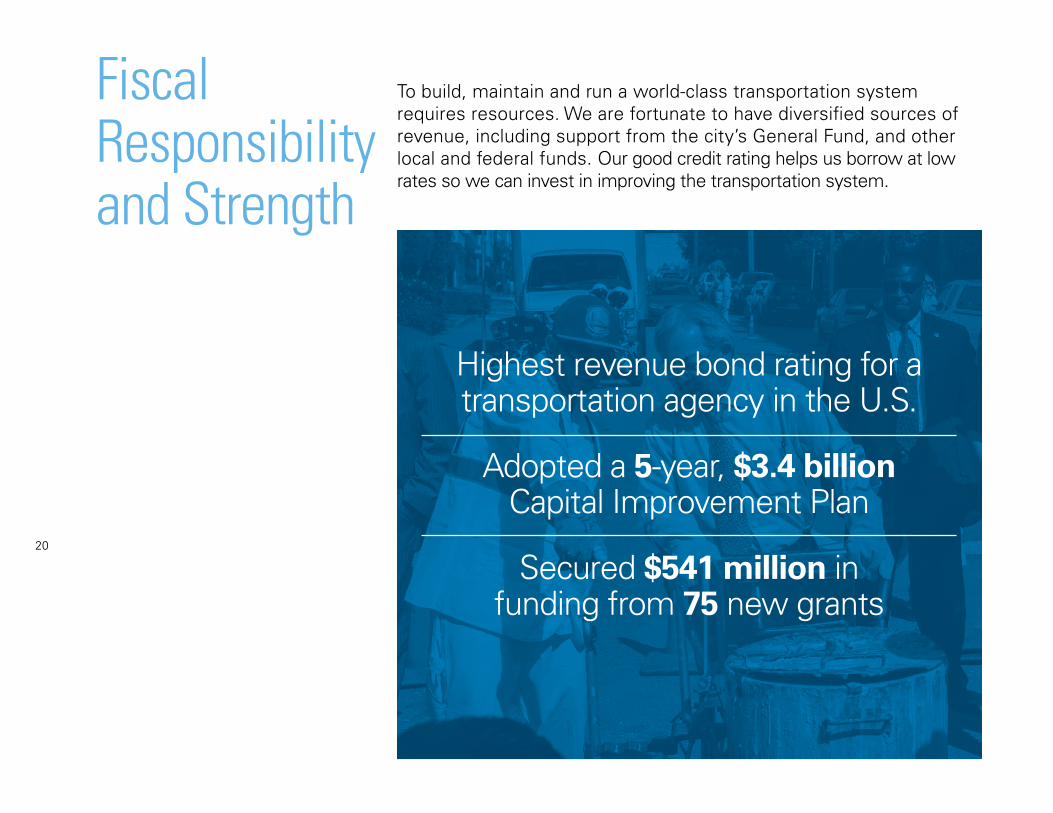
To build, maintain and run a world-class transportation system requires resources. We are fortunate to have diversified sources of revenue, including support from the city’s General Fund, and other local and federal funds. Our good credit rating helps us borrow at low rates so we can invest in improving the transportation system.
Fiscal Responsibility and Strength
Highest revenue bond rating for a transportation agency in the U.S.
Adopted a 5-year, $3.4 billion Capital Improvement Plan
Secured $541 million in funding from 75 new grants
21
SFMTA 2016 ANNUAL REPORT
22
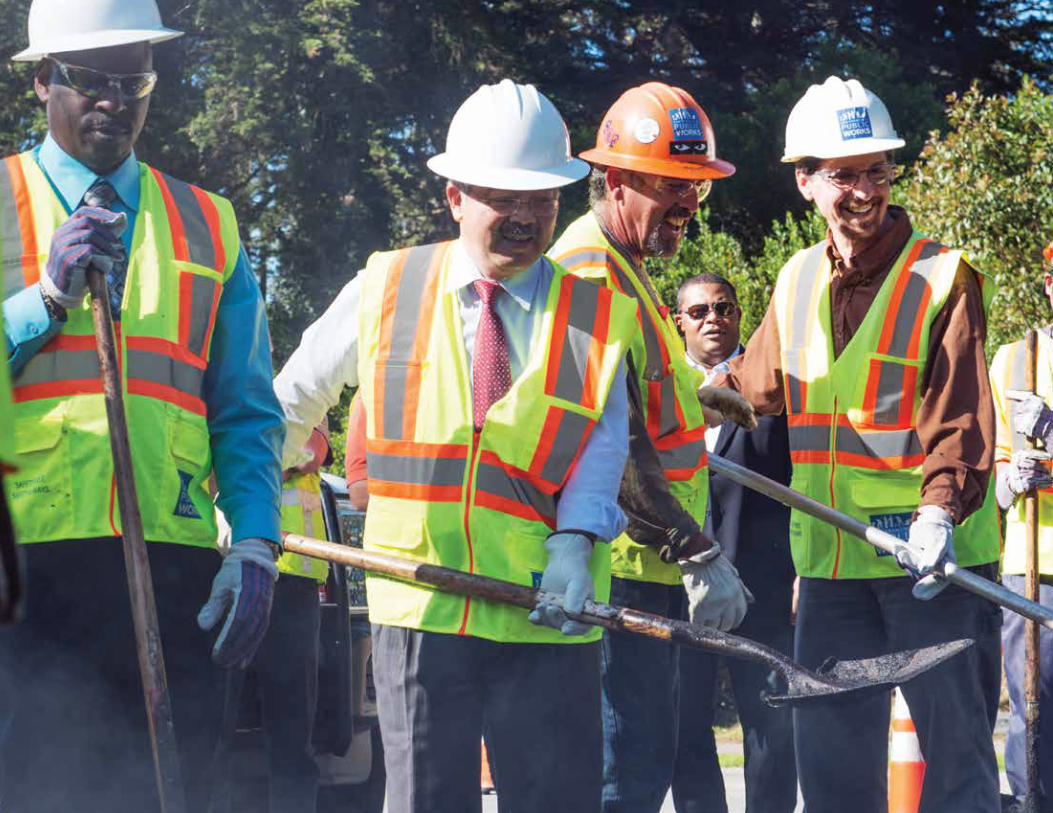
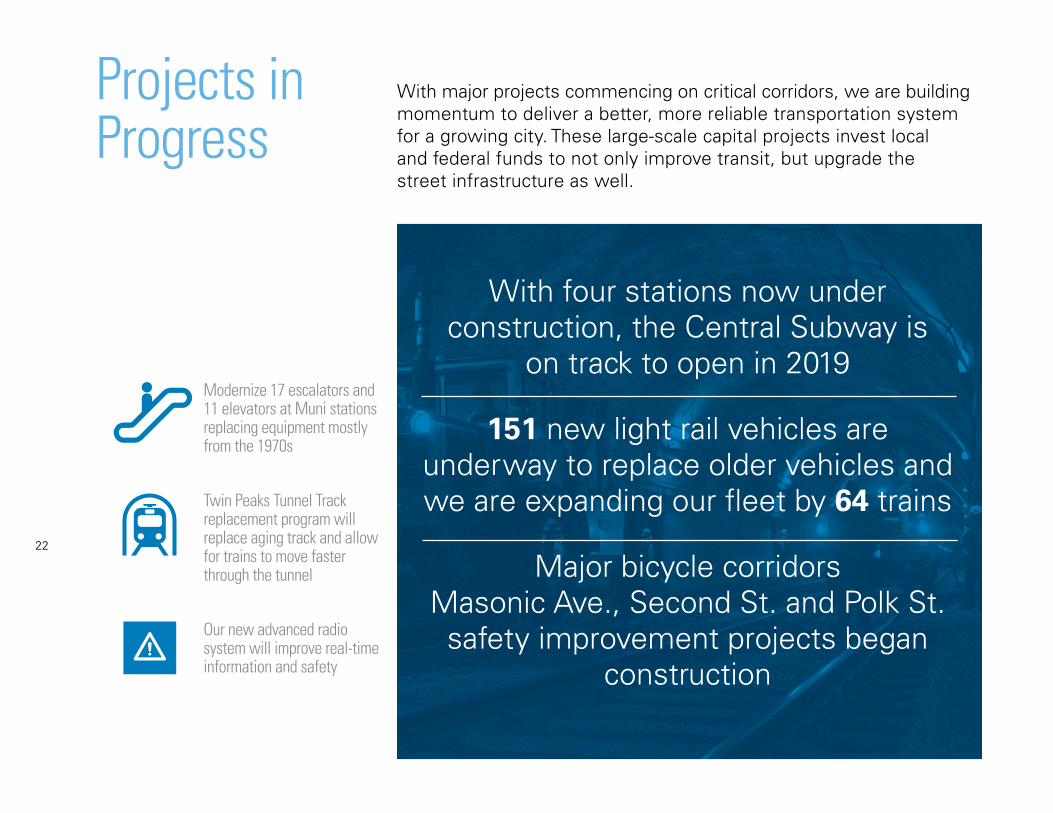
With major projects commencing on critical corridors, we are building momentum to deliver a better, more reliable transportation system for a growing city. These large-scale capital projects invest local and federal funds to not only improve transit, but upgrade the street infrastructure as well.
Projects in Progress
With four stations now under construction, the Central Subway is
on track to open in 2019
151 new light rail vehicles are underway to replace older vehicles and we are expanding our fleet by 64 trains
Major bicycle corridors Masonic Ave., Second St. and Polk St.
safety improvement projects began construction
Modernize 17 escalators and 11 elevators at Muni stations replacing equipment mostly from the 1970s
Twin Peaks Tunnel Track replacement program will replace aging track and allow for trains to move faster through the tunnel
Our new advanced radio system will improve real-time information and safety
23
SFMTA 2016 ANNUAL REPORT
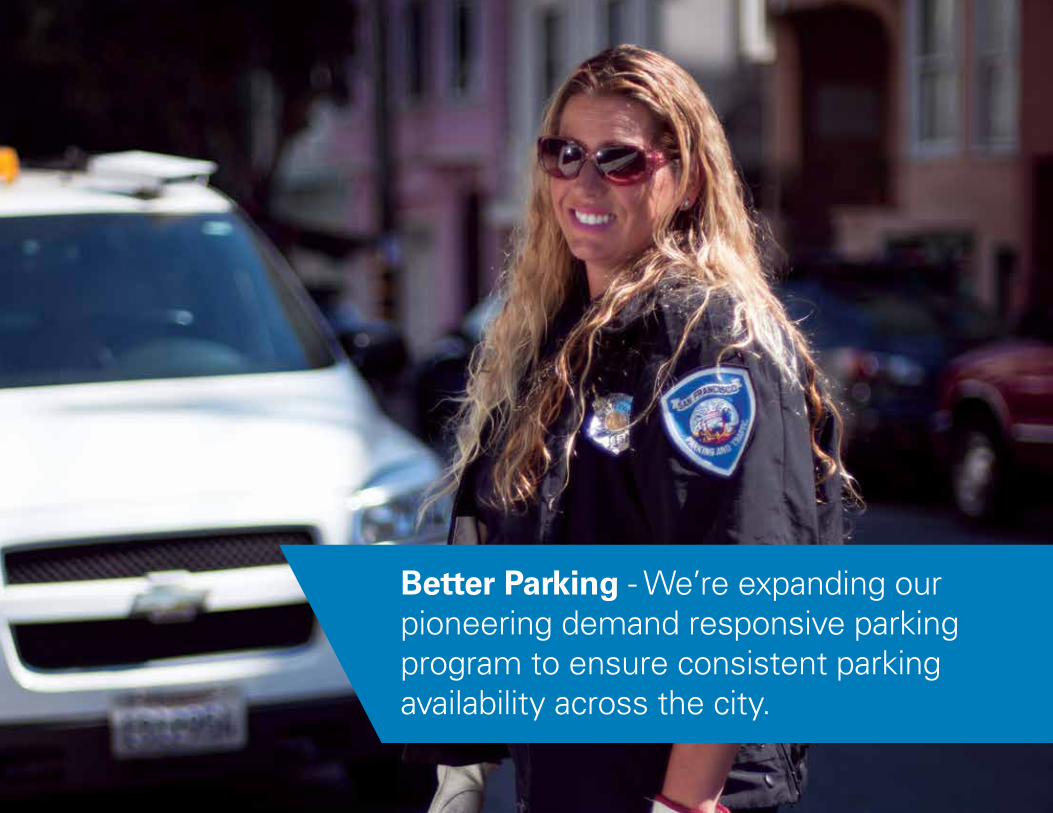
Better Parking - We’re expanding our pioneering demand responsive parking program to ensure consistent parking availability across the city.
24
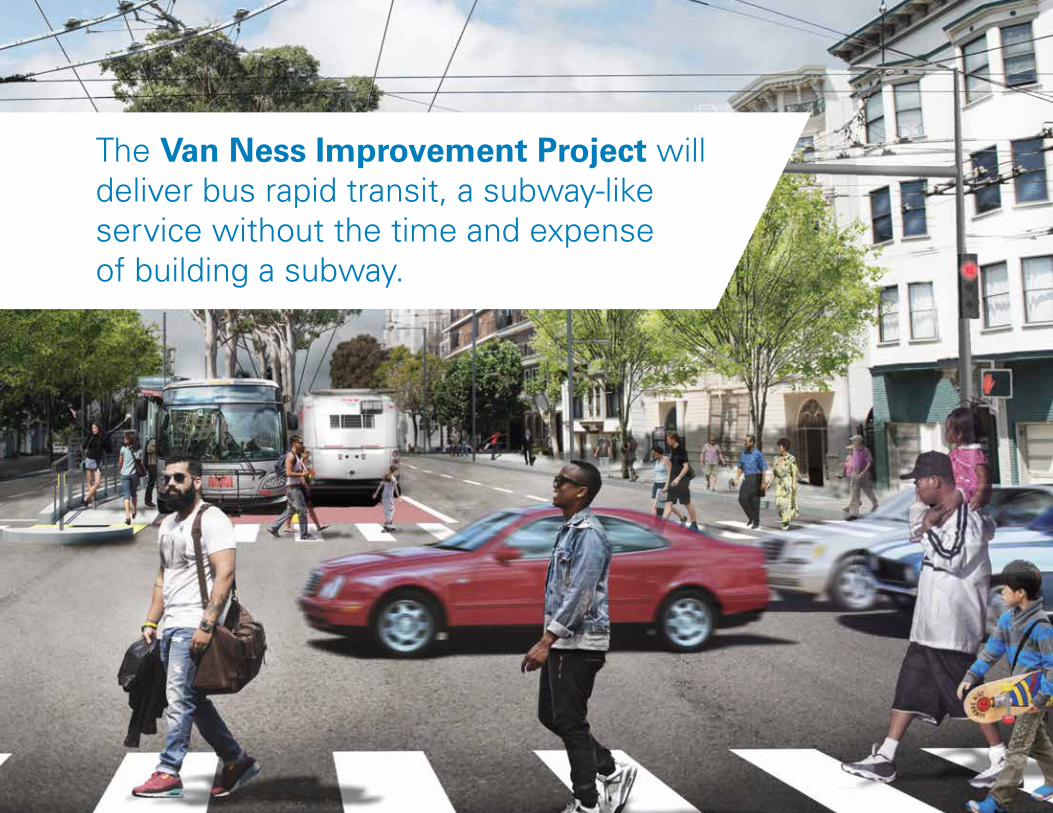
The Van Ness Improvement Project will deliver bus rapid transit, a subway-like service without the time and expense of building a subway.
25
SFMTA 2016 ANNUAL REPORT
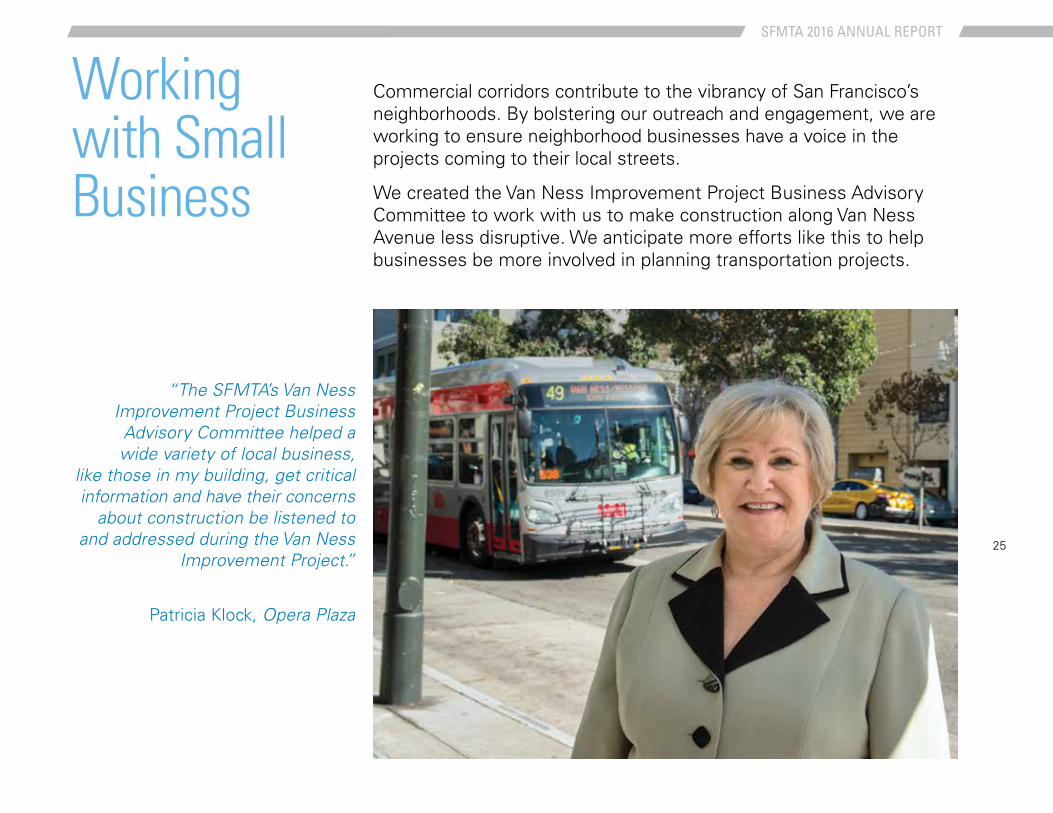
“The SFMTA’s Van Ness Improvement Project Business Advisory Committee helped a wide variety of local business,
like those in my building, get critical information and have their concerns
about construction be listened to and addressed during the Van Ness
Improvement Project.”
Patricia Klock, Opera Plaza
Commercial corridors contribute to the vibrancy of San Francisco’s neighborhoods. By bolstering our outreach and engagement, we are working to ensure neighborhood businesses have a voice in the projects coming to their local streets.
We created the Van Ness Improvement Project Business Advisory Committee to work with us to make construction along Van Ness Avenue less disruptive. We anticipate more efforts like this to help businesses be more involved in planning transportation projects.
Working with Small Business
26
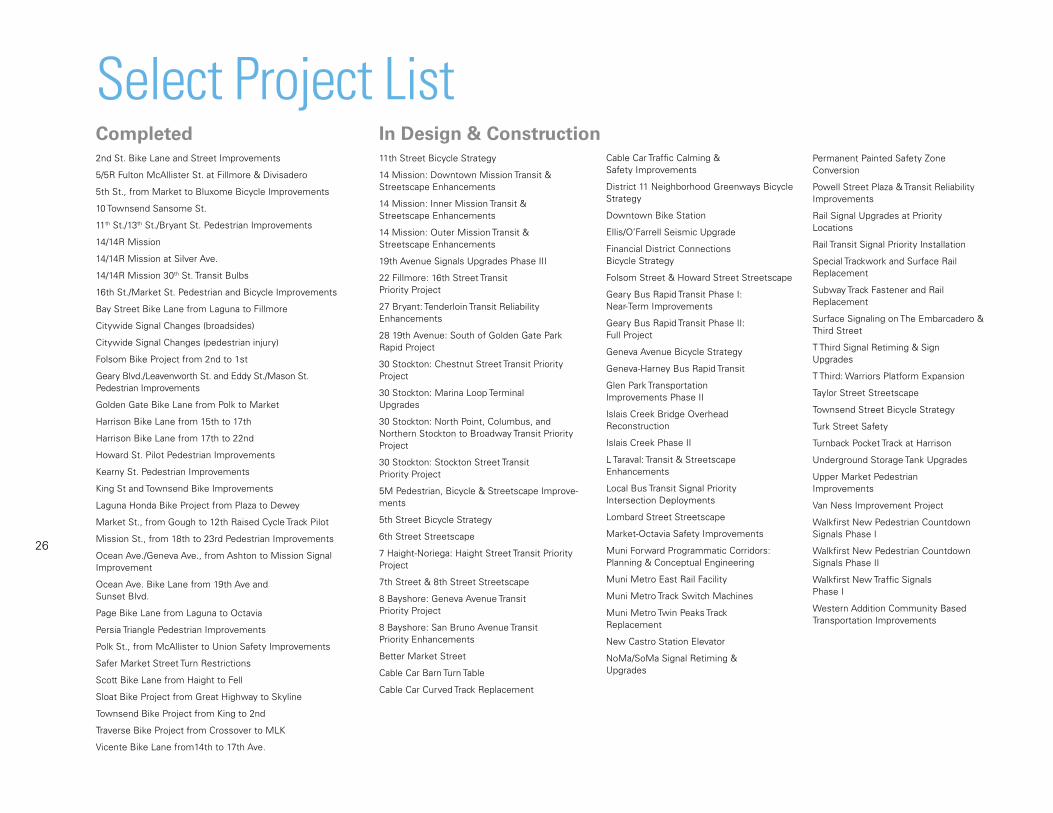
Select Project List2nd St. Bike Lane and Street Improvements
5/5R Fulton McAllister St. at Fillmore & Divisadero
5th St., from Market to Bluxome Bicycle Improvements
10 Townsend Sansome St.
11th St./13th St./Bryant St. Pedestrian Improvements
14/14R Mission
14/14R Mission at Silver Ave.
14/14R Mission 30th St. Transit Bulbs
16th St./Market St. Pedestrian and Bicycle Improvements
Bay Street Bike Lane from Laguna to Fillmore
Citywide Signal Changes (broadsides)
Citywide Signal Changes (pedestrian injury)
Folsom Bike Project from 2nd to 1st
Geary Blvd./Leavenworth St. and Eddy St./Mason St. Pedestrian Improvements
Golden Gate Bike Lane from Polk to Market
Harrison Bike Lane from 15th to 17th
Harrison Bike Lane from 17th to 22nd
Howard St. Pilot Pedestrian Improvements
Kearny St. Pedestrian Improvements
King St and Townsend Bike Improvements
Laguna Honda Bike Project from Plaza to Dewey
Market St., from Gough to 12th Raised Cycle Track Pilot
Mission St., from 18th to 23rd Pedestrian Improvements
Ocean Ave./Geneva Ave., from Ashton to Mission Signal Improvement
Ocean Ave. Bike Lane from 19th Ave and Sunset Blvd.
Page Bike Lane from Laguna to Octavia
Persia Triangle Pedestrian Improvements
Polk St., from McAllister to Union Safety Improvements
Safer Market Street Turn Restrictions
Scott Bike Lane from Haight to Fell
Sloat Bike Project from Great Highway to Skyline
Townsend Bike Project from King to 2nd
Traverse Bike Project from Crossover to MLK
Vicente Bike Lane from14th to 17th Ave.
Completed In Design & Construction11th Street Bicycle Strategy
14 Mission: Downtown Mission Transit & Streetscape Enhancements
14 Mission: Inner Mission Transit & Streetscape Enhancements
14 Mission: Outer Mission Transit & Streetscape Enhancements
19th Avenue Signals Upgrades Phase III
22 Fillmore: 16th Street Transit Priority Project
27 Bryant: Tenderloin Transit Reliability Enhancements
28 19th Avenue: South of Golden Gate Park Rapid Project
30 Stockton: Chestnut Street Transit Priority Project
30 Stockton: Marina Loop Terminal Upgrades
30 Stockton: North Point, Columbus, and Northern Stockton to Broadway Transit Priority Project
30 Stockton: Stockton Street Transit Priority Project
5M Pedestrian, Bicycle & Streetscape Improve-ments
5th Street Bicycle Strategy
6th Street Streetscape
7 Haight-Noriega: Haight Street Transit Priority Project
7th Street & 8th Street Streetscape
8 Bayshore: Geneva Avenue Transit Priority Project
8 Bayshore: San Bruno Avenue Transit Priority Enhancements
Better Market Street
Cable Car Barn Turn Table
Cable Car Curved Track Replacement
Cable Car Traffic Calming & Safety Improvements
District 11 Neighborhood Greenways Bicycle Strategy
Downtown Bike Station
Ellis/O’Farrell Seismic Upgrade
Financial District Connections Bicycle Strategy
Folsom Street & Howard Street Streetscape
Geary Bus Rapid Transit Phase I: Near-Term Improvements
Geary Bus Rapid Transit Phase II: Full Project
Geneva Avenue Bicycle Strategy
Geneva-Harney Bus Rapid Transit
Glen Park Transportation Improvements Phase II
Islais Creek Bridge Overhead Reconstruction
Islais Creek Phase II
L Taraval: Transit & Streetscape Enhancements
Local Bus Transit Signal Priority Intersection Deployments
Lombard Street Streetscape
Market-Octavia Safety Improvements
Muni Forward Programmatic Corridors: Planning & Conceptual Engineering
Muni Metro East Rail Facility
Muni Metro Track Switch Machines
Muni Metro Twin Peaks Track Replacement
New Castro Station Elevator
NoMa/SoMa Signal Retiming & Upgrades
Permanent Painted Safety Zone Conversion
Powell Street Plaza & Transit Reliability Improvements
Rail Signal Upgrades at Priority Locations
Rail Transit Signal Priority Installation
Special Trackwork and Surface Rail Replacement
Subway Track Fastener and Rail Replacement
Surface Signaling on The Embarcadero & Third Street
T Third Signal Retiming & Sign Upgrades
T Third: Warriors Platform Expansion
Taylor Street Streetscape
Townsend Street Bicycle Strategy
Turk Street Safety
Turnback Pocket Track at Harrison
Underground Storage Tank Upgrades
Upper Market Pedestrian Improvements
Van Ness Improvement Project
Walkfirst New Pedestrian Countdown Signals Phase I
Walkfirst New Pedestrian Countdown Signals Phase II
Walkfirst New Traffic Signals Phase I
Western Addition Community Based Transportation Improvements
27
SFMTA 2016 ANNUAL REPORT
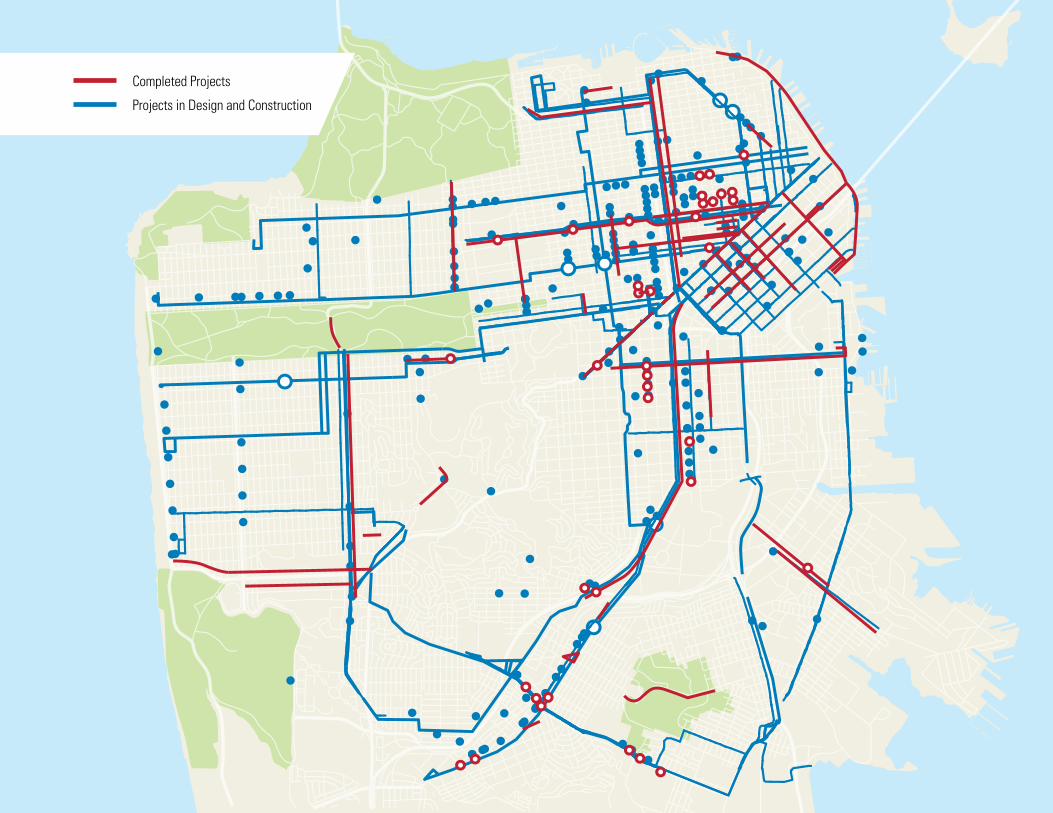
Project MapCompleted Projects
Projects in Design and Construction
28
Page Title
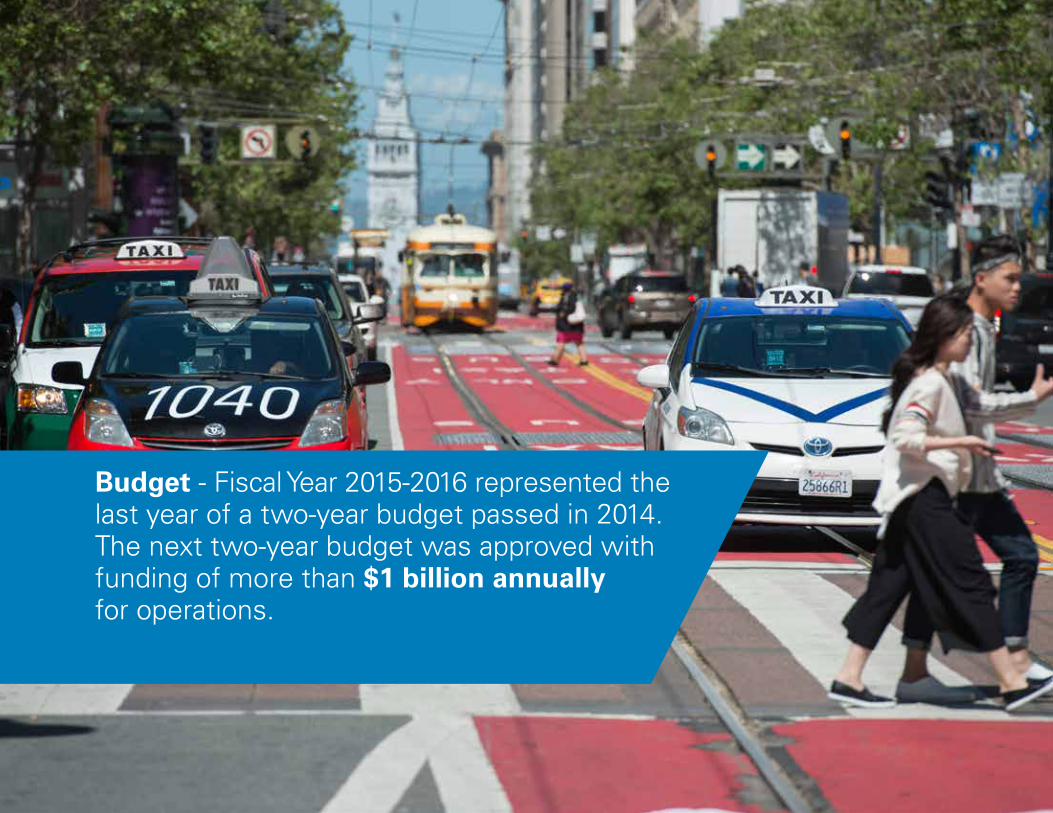
Budget - Fiscal Year 2015-2016 represented the last year of a two-year budget passed in 2014.The next two-year budget was approved with funding of more than $1 billion annually for operations.
29
SFMTA 2016 ANNUAL REPORT
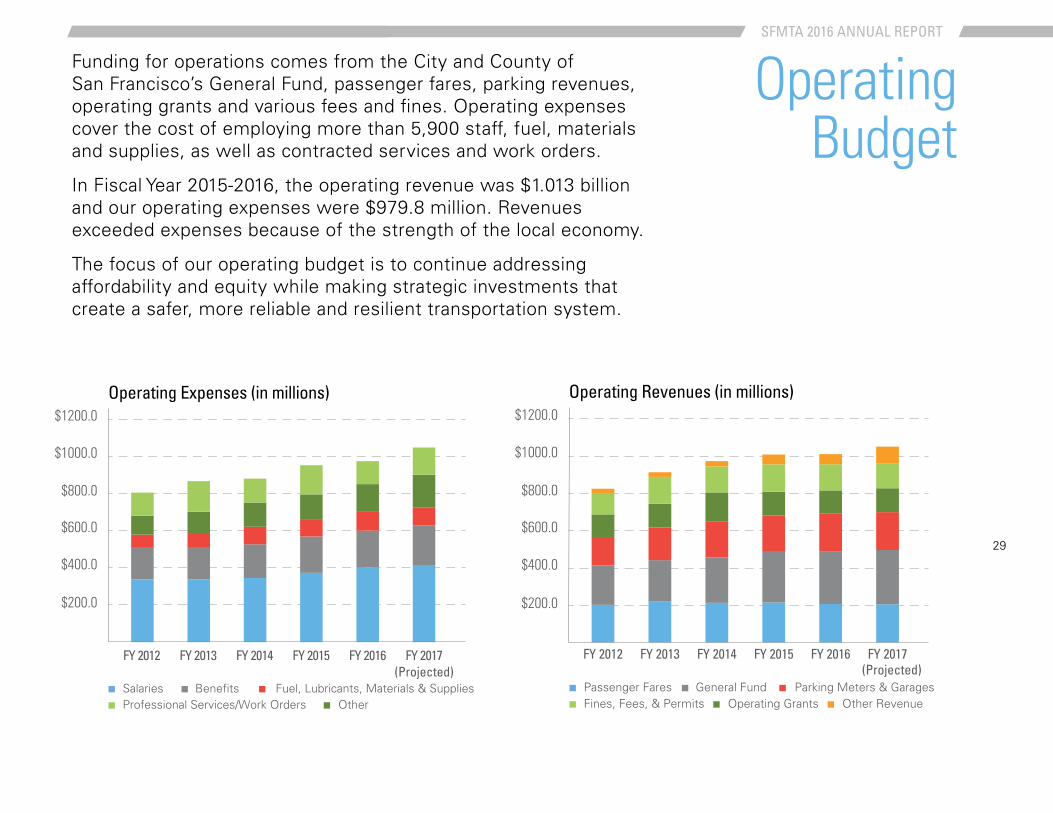
OperatingBudget
Funding for operations comes from the City and County of San Francisco’s General Fund, passenger fares, parking revenues, operating grants and various fees and fines. Operating expenses cover the cost of employing more than 5,900 staff, fuel, materials and supplies, as well as contracted services and work orders.
In Fiscal Year 2015-2016, the operating revenue was $1.013 billion and our operating expenses were $979.8 million. Revenues exceeded expenses because of the strength of the local economy.
The focus of our operating budget is to continue addressing affordability and equity while making strategic investments that create a safer, more reliable and resilient transportation system.
$200.0
$400.0
$600.0
$800.0
$1000.0
$1200.0
Salaries Benefits Fuel, Lubricants, Materials & SuppliesProfessional Services/Work Orders Other
FY 2012 FY 2013 FY 2014 FY 2015 FY 2016 FY 2017
Operating Expenses (in millions)
(Projected)Passenger Fares General Fund Parking Meters & GaragesFines, Fees, & Permits Operating Grants
FY 2012 FY 2013 FY 2014 FY 2015 FY 2016 FY 2017
$200.0
$400.0
$600.0
$800.0
$1000.0
$1200.0
Other Revenue
Operating Revenues (in millions)
(Projected)
30
FY 2016(Budgeted)
Central Subway
FY 2017(Planned)
FY 2018(Planned)
FY 2019(Planned)
FY 2020(Planned)
FY 2021(Planned)
Fleet & Facilities Transit Street System Support/Other
$200.0
$400.0
$600.0
$800.0
$1000.0
$1200.0
(Millions)
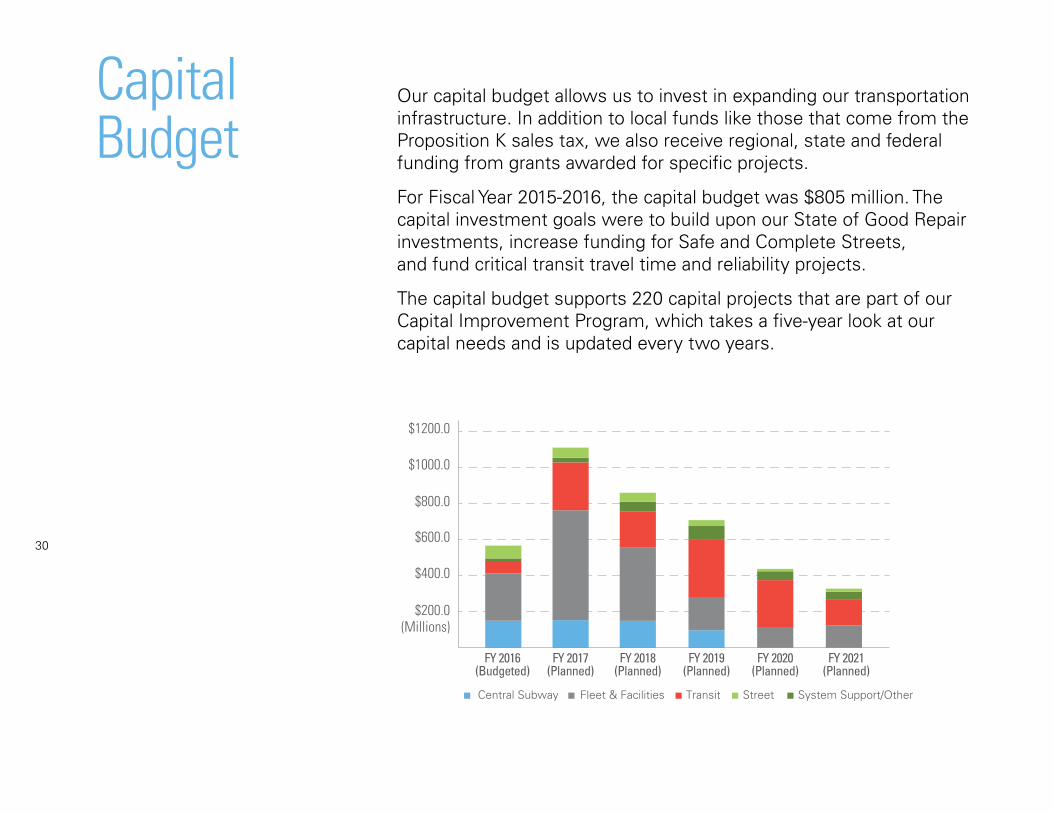
Our capital budget allows us to invest in expanding our transportation infrastructure. In addition to local funds like those that come from the Proposition K sales tax, we also receive regional, state and federal funding from grants awarded for specific projects.
For Fiscal Year 2015-2016, the capital budget was $805 million. The capital investment goals were to build upon our State of Good Repair investments, increase funding for Safe and Complete Streets, and fund critical transit travel time and reliability projects.
The capital budget supports 220 capital projects that are part of our Capital Improvement Program, which takes a five-year look at our capital needs and is updated every two years.
CapitalBudget
31
SFMTA 2016 ANNUAL REPORT
32
Page Title
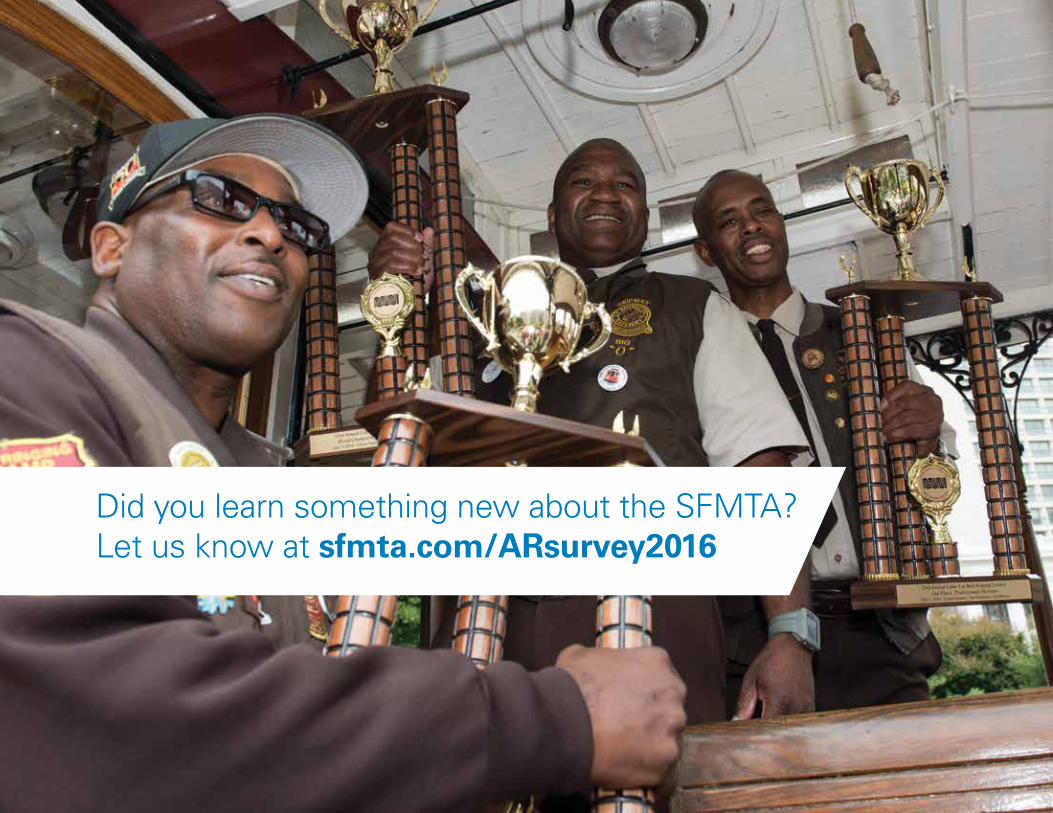
Did you learn something new about the SFMTA? Let us know at sfmta.com/ARsurvey2016
33
SFMTA 2016 ANNUAL REPORT
We are the more than 5,900 public servants dedicated to serving the transportation needs of San Francisco. But we cannot do it alone. We need your partnership to keep people safe and to keep people moving. Our achievements this past year occurred because of your support.
We pledge to continue working with you to deliver progress.
Thank You
34
Page Title
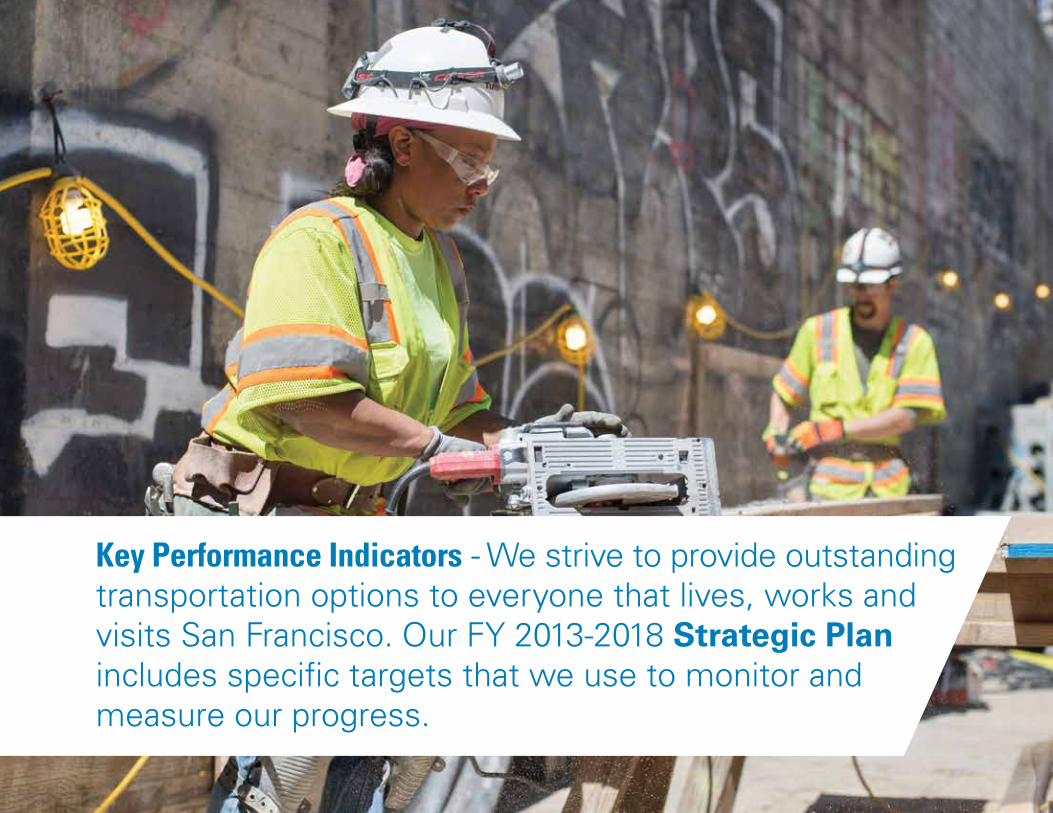
Key Performance Indicators - We strive to provide outstanding transportation options to everyone that lives, works and visits San Francisco. Our FY 2013-2018 Strategic Plan includes specific targets that we use to monitor and measure our progress.
35
SFMTA 2016 ANNUAL REPORT
Key Performance Indicators FY 2015-2016
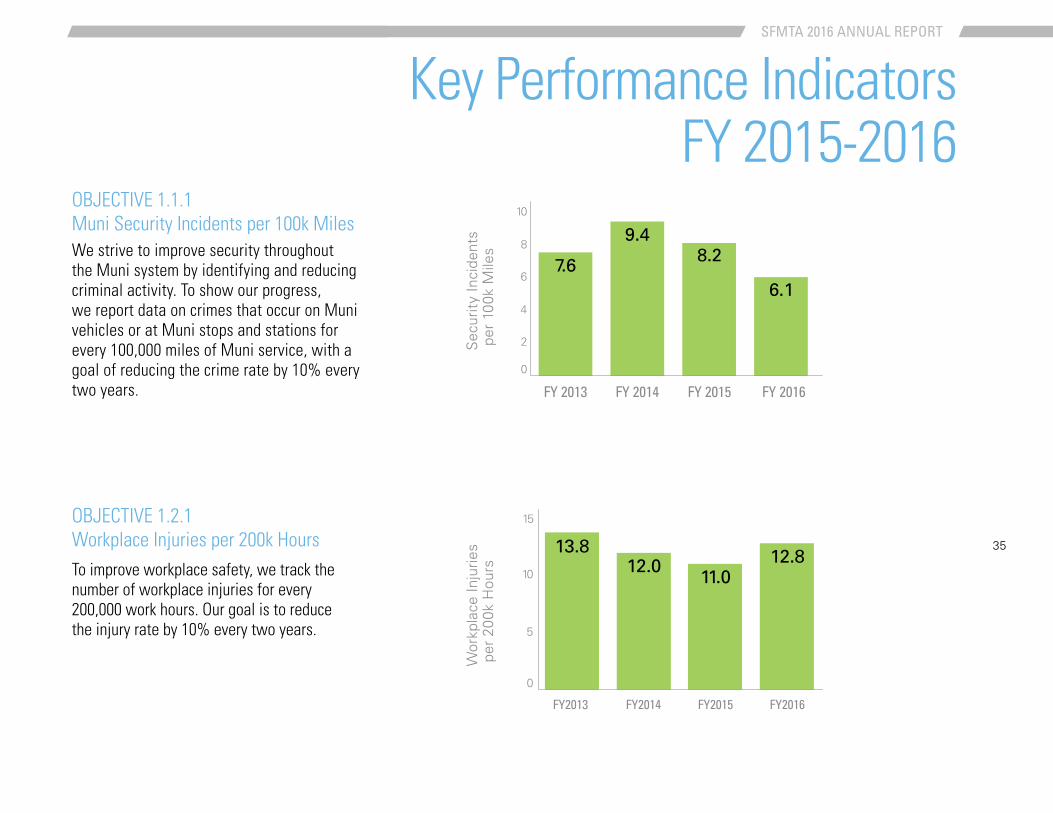
OBJECTIVE 1.1.1 Muni Security Incidents per 100k MilesWe strive to improve security throughout the Muni system by identifying and reducing criminal activity. To show our progress, we report data on crimes that occur on Muni vehicles or at Muni stops and stations for every 100,000 miles of Muni service, with a goal of reducing the crime rate by 10% every two years.
OBJECTIVE 1.2.1 Workplace Injuries per 200k HoursTo improve workplace safety, we track the number of workplace injuries for every 200,000 work hours. Our goal is to reduce the injury rate by 10% every two years.
0
2
4
6
8
10
7.6
9.48.2
6.1
FY 2013 FY 2014 FY 2015 FY 2016
0
5
10
15
13.812.0
11.012.8
FY2013 FY2014 FY2015 FY2016
Sec
urity
Inci
dent
s pe
r 10
0k M
iles
Wor
kpla
ce In
jurie
s pe
r 20
0k H
ours
36
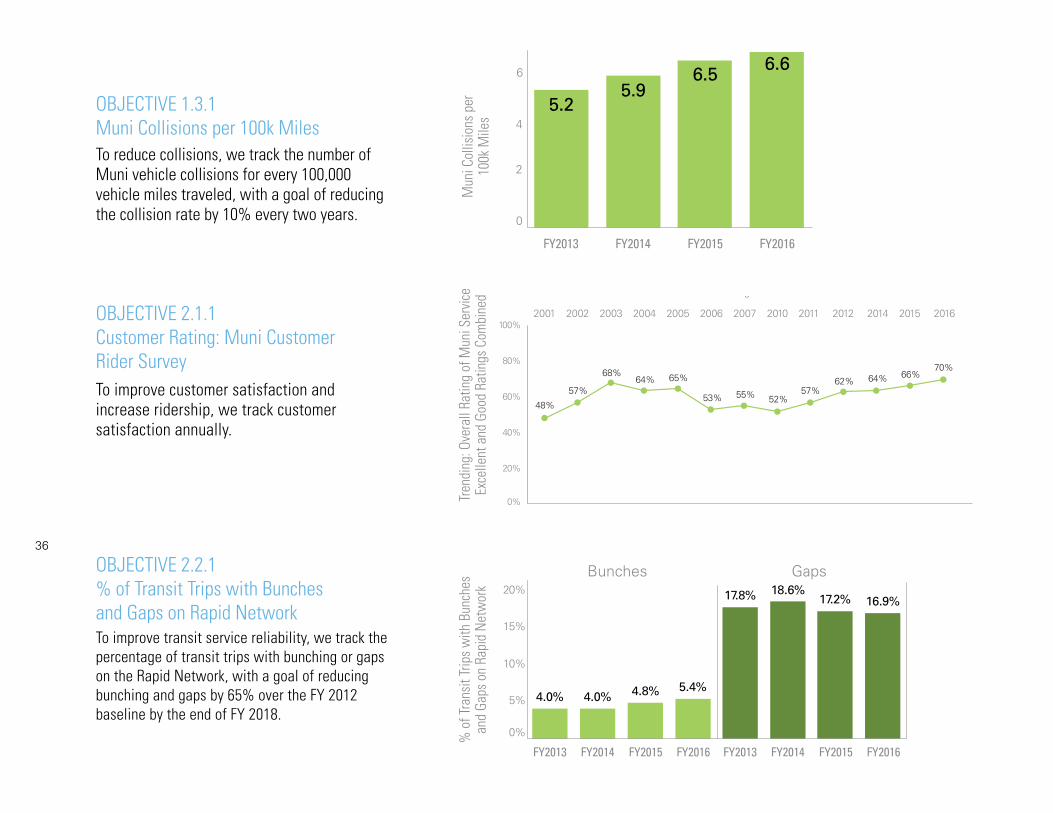
OBJECTIVE 1.3.1 Muni Collisions per 100k MilesTo reduce collisions, we track the number of Muni vehicle collisions for every 100,000 vehicle miles traveled, with a goal of reducing the collision rate by 10% every two years. 0
2
4
6
5.25.9
6.5 6.6
FY2013 FY2014 FY2015 FY2016
OBJECTIVE 2.1.1 Customer Rating: Muni Customer Rider SurveyTo improve customer satisfaction and increase ridership, we track customer satisfaction annually.
OBJECTIVE 2.2.1 % of Transit Trips with Bunches and Gaps on Rapid NetworkTo improve transit service reliability, we track the percentage of transit trips with bunching or gaps on the Rapid Network, with a goal of reducing bunching and gaps by 65% over the FY 2012 baseline by the end of FY 2018.
4.0%
Bunches Gaps
0%
5%
10%
15%
20%
4.0% 4.8% 5.4%
17.8% 18.6%17.2% 16.9%
FY2013 FY2014 FY2015 FY2016 FY2013 FY2014 FY2015 FY2016
Mun
i Col
lisio
ns p
er
100k
Mile
s%
of T
rans
it Tr
ips
with
Bun
ches
an
d Ga
ps o
n Ra
pid
Net
wor
kTr
endi
ng: O
vera
ll Ra
ting
of M
uni S
ervi
ce
Exce
llent
and
Goo
d Ra
tings
Com
bine
d
Trending: Overall Rating of Muni ServiceExcellent and Good Ratings Combined
100%
80%
60%
40%
20%
0%
2001 2002 2003 2004 2005 2006 2007 2010 2011 2012 2014 2015 2016
48%
57%
68%64% 65%
53% 55% 52%57%
62% 64% 66%70%
37
SFMTA 2016 ANNUAL REPORT
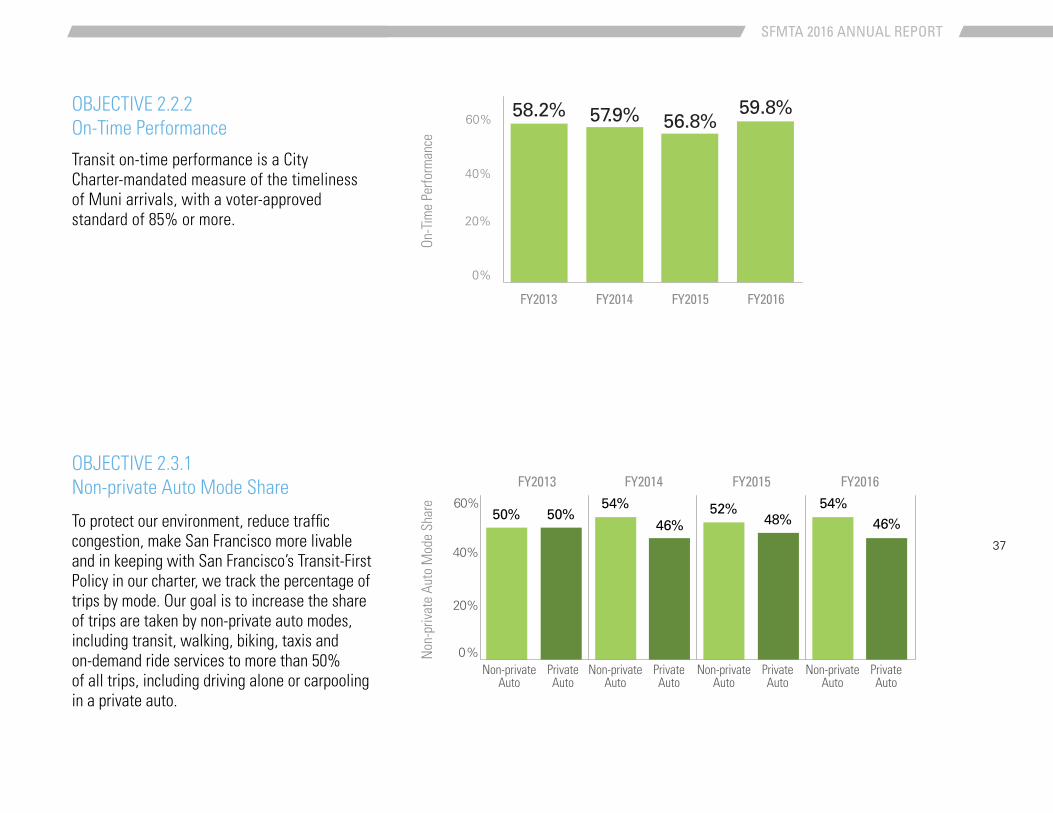
OBJECTIVE 2.3.1 Non-private Auto Mode Share
To protect our environment, reduce traffic congestion, make San Francisco more livable and in keeping with San Francisco’s Transit-First Policy in our charter, we track the percentage of trips by mode. Our goal is to increase the share of trips are taken by non-private auto modes, including transit, walking, biking, taxis and on-demand ride services to more than 50% of all trips, including driving alone or carpooling in a private auto.
0%
20%
40%
60%50% 50%
54%
46%52%
48%54%
46%
Non-privateAuto
PrivateAuto
Non-privateAuto
PrivateAuto
Non-privateAuto
PrivateAuto
Non-privateAuto
PrivateAuto
FY2013 FY2014 FY2015 FY2016
Non
-priv
ate
Auto
Mod
e Sh
are
OBJECTIVE 2.2.2 On-Time Performance
Transit on-time performance is a City Charter-mandated measure of the timeliness of Muni arrivals, with a voter-approved standard of 85% or more.
0%
20%
40%
60% 58.2% 57.9% 56.8%59.8%
FY2013 FY2014 FY2015 FY2016
On-T
ime
Perfo
rman
ce
38
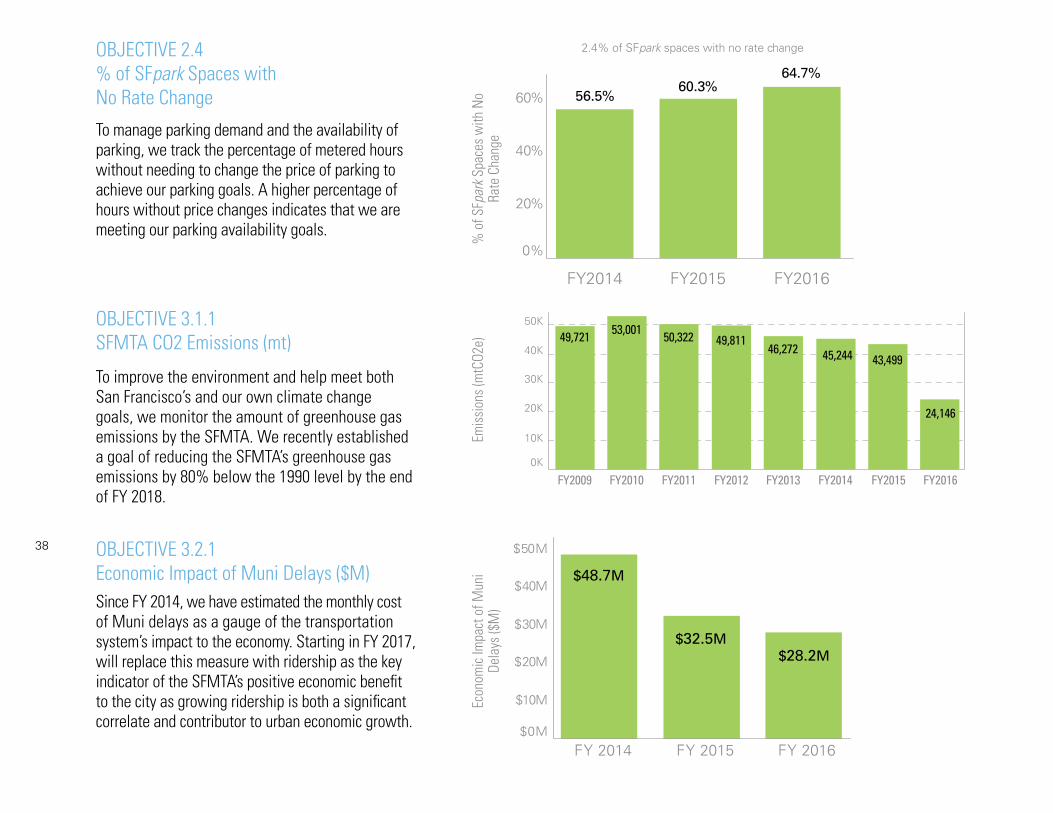
OBJECTIVE 3.1.1 SFMTA CO2 Emissions (mt)
To improve the environment and help meet both San Francisco’s and our own climate change goals, we monitor the amount of greenhouse gas emissions by the SFMTA. We recently established a goal of reducing the SFMTA’s greenhouse gas emissions by 80% below the 1990 level by the end of FY 2018.
OBJECTIVE 3.2.1 Economic Impact of Muni Delays ($M)Since FY 2014, we have estimated the monthly cost of Muni delays as a gauge of the transportation system’s impact to the economy. Starting in FY 2017, will replace this measure with ridership as the key indicator of the SFMTA’s positive economic benefit to the city as growing ridership is both a significant correlate and contributor to urban economic growth.
FY20090K
10K
20K
30K
40K
50K
Em
issi
on
s (m
tco
2e) 49,721 53,001 50,322 49,811
46,272 45,244 43,499
24,146
FY2010 FY2011 FY2012 FY2013 FY2014 FY2015 FY2016
FY 2014 FY 2015 FY 2016$0M
$10M
$20M
$30M
$40M
$50M
$48.7M
$32.5M$28.2M
Econ
omic
Impa
ct o
f Mun
i De
lays
($M
)
OBJECTIVE 2.4 % of SFpark Spaces with No Rate Change
To manage parking demand and the availability of parking, we track the percentage of metered hours without needing to change the price of parking to achieve our parking goals. A higher percentage of hours without price changes indicates that we are meeting our parking availability goals.
56.5%
0%
20%
40%
60%
2.4% of SFpark spaces with no rate change
60.3%64.7%
FY2014 FY2015 FY2016
% o
f SFp
ark
Spac
es w
ith N
o Ra
te C
hang
eEm
issi
ons
(mtC
O2e)
39
SFMTA 2016 ANNUAL REPORT
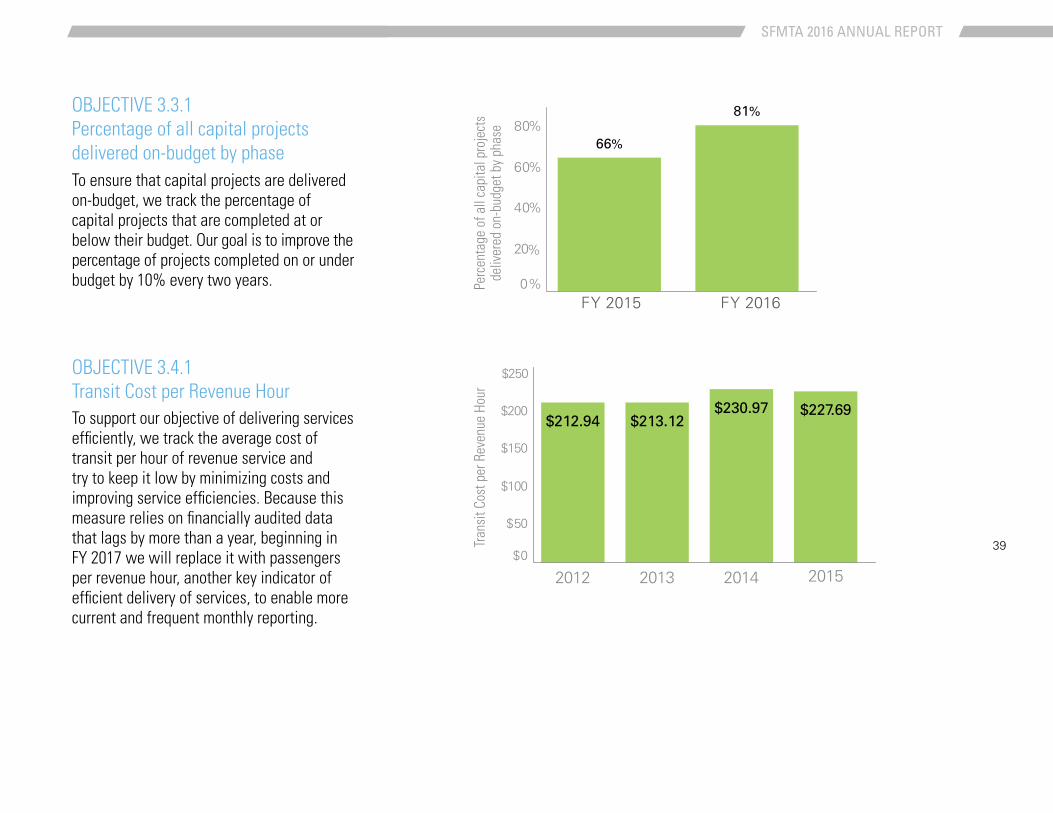
OBJECTIVE 3.3.1 Percentage of all capital projects delivered on-budget by phaseTo ensure that capital projects are delivered on-budget, we track the percentage of capital projects that are completed at or below their budget. Our goal is to improve the percentage of projects completed on or under budget by 10% every two years.
66%
FY 2015 FY 20160%
20%
40%
60%
80%81%
OBJECTIVE 3.4.1 Transit Cost per Revenue HourTo support our objective of delivering services efficiently, we track the average cost of transit per hour of revenue service and try to keep it low by minimizing costs and improving service efficiencies. Because this measure relies on financially audited data that lags by more than a year, beginning in FY 2017 we will replace it with passengers per revenue hour, another key indicator of efficient delivery of services, to enable more current and frequent monthly reporting.
$0
$50
$100
$150
$200
$250
$212.94 $213.12$230.97 $227.69
2012 2013 2014 2015
Perc
enta
ge o
f all
capi
tal p
roje
cts
deliv
ered
on-
budg
et b
y ph
ase
Tran
sit C
ost p
er R
even
ue H
our
40
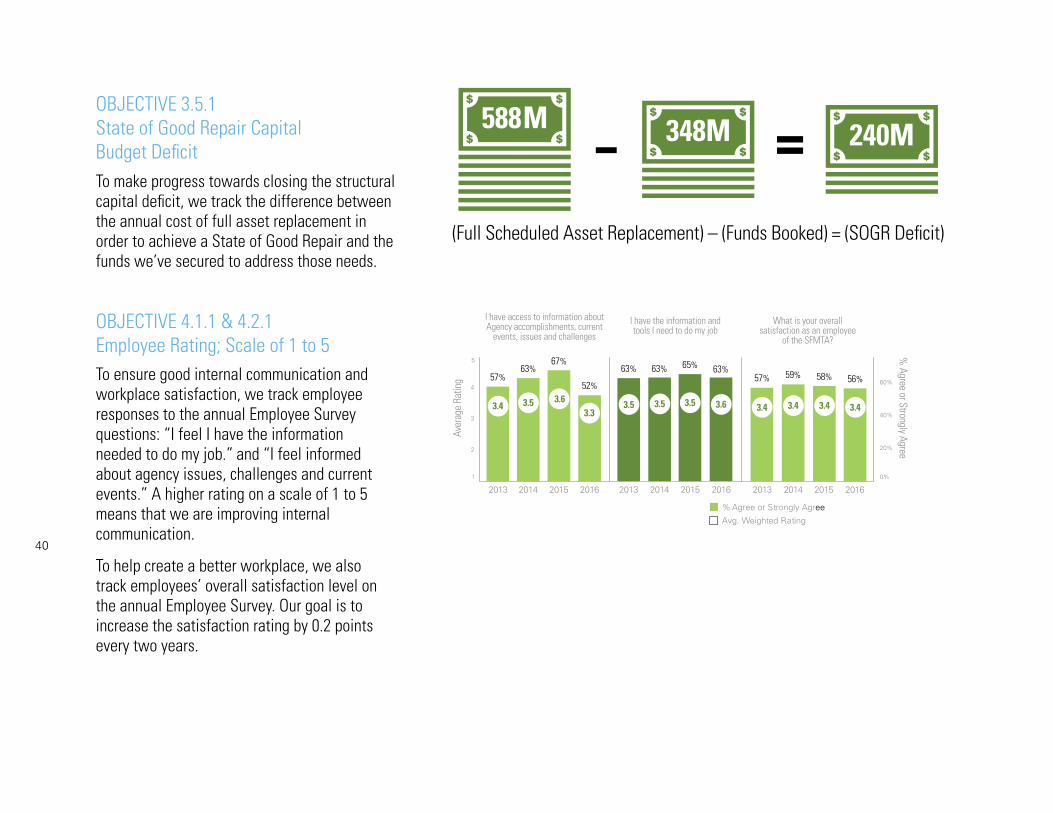
OBJECTIVE 4.1.1 & 4.2.1 Employee Rating; Scale of 1 to 5To ensure good internal communication and workplace satisfaction, we track employee responses to the annual Employee Survey questions: “I feel I have the information needed to do my job.” and “I feel informed about agency issues, challenges and current events.” A higher rating on a scale of 1 to 5 means that we are improving internal communication.
To help create a better workplace, we also track employees’ overall satisfaction level on the annual Employee Survey. Our goal is to increase the satisfaction rating by 0.2 points every two years.
OBJECTIVE 3.5.1 State of Good Repair Capital Budget DeficitTo make progress towards closing the structural capital deficit, we track the difference between the annual cost of full asset replacement in order to achieve a State of Good Repair and the funds we’ve secured to address those needs.
2013
1
2
3
4
5
0%
20%
40%
60%
% Agree or Strongly Agree
Avg. Weighted Rating
I have access to information about Agency accomplishments, current
events, issues and challenges
I have the information and tools I need to do my job
What is your overall satisfaction as an employee
of the SFMTA?
Aver
age
Ratin
g
% Agree or Strongly Agree
57%52%
63%67%
63% 63% 65%57% 59% 58%
3.43.3
3.5 3.6 3.5 3.5
63%
3.63.5 3.4
56%
3.43.4 3.4
2014 2015 2016 2013 2014 2015 2016 2013 2014 2015 2016
(Full Scheduled Asset Replacement) – (Funds Booked) = (SOGR Deficit)
588M 348M 240M=-
41
SFMTA 2016 ANNUAL REPORT
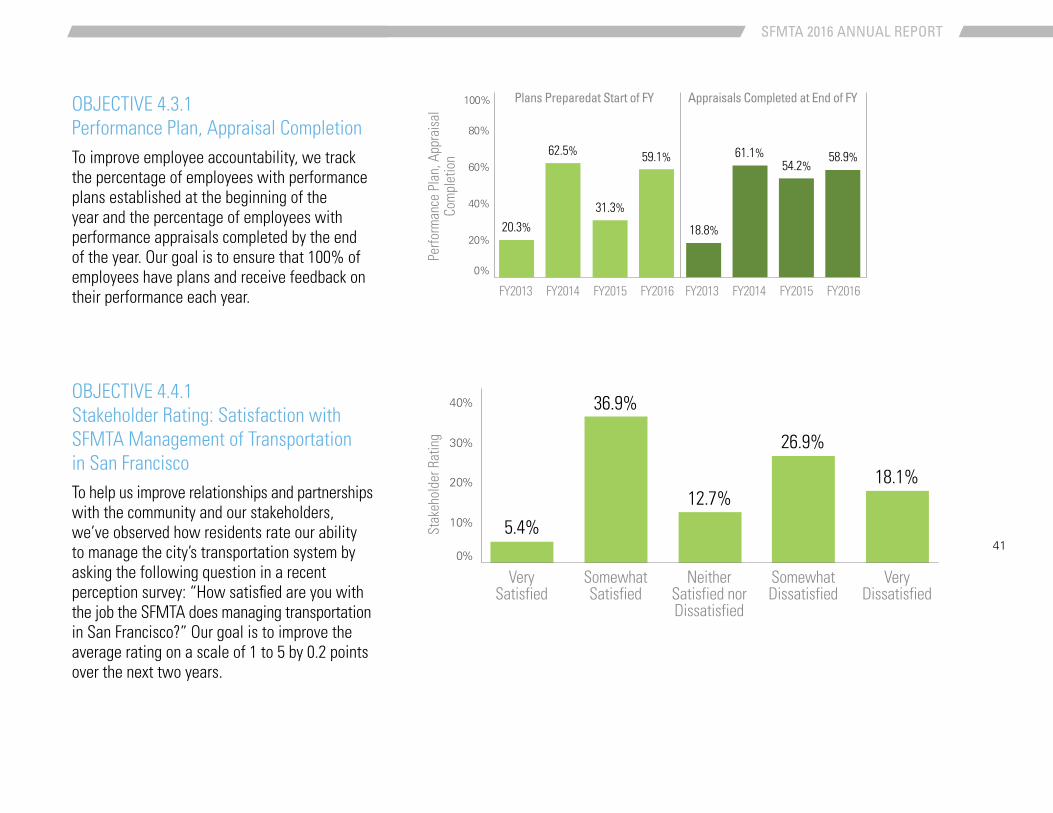
OBJECTIVE 4.3.1 Performance Plan, Appraisal Completion
OBJECTIVE 4.4.1 Stakeholder Rating: Satisfaction with SFMTA Management of Transportation in San Francisco
To improve employee accountability, we track the percentage of employees with performance plans established at the beginning of the year and the percentage of employees with performance appraisals completed by the end of the year. Our goal is to ensure that 100% of employees have plans and receive feedback on their performance each year.
To help us improve relationships and partnerships with the community and our stakeholders, we’ve observed how residents rate our ability to manage the city’s transportation system by asking the following question in a recent perception survey: “How satisfied are you with the job the SFMTA does managing transportation in San Francisco?” Our goal is to improve the average rating on a scale of 1 to 5 by 0.2 points over the next two years.
FY2013
0%
20%
40%
60%
80%
100% Plans Preparedat Start of FY Appraisals Completed at End of FY
20.3%
62.5%
31.3%
59.1%
18.8%
61.1%54.2%
58.9%
FY2014 FY2015 FY2016 FY2013 FY2014 FY2015 FY2016
0%
10%
20%
30%
40%
5.4%
36.9%
12.7%
26.9%
18.1%
Very Satisfied
Somewhat Satisfied
Neither Satisfied nor Dissatisfied
Somewhat Dissatisfied
Very Dissatisfied
Perfo
rman
ce P
lan,
App
rais
al
Com
plet
ion
Stak
ehol
der R
atin
g
42
Page Title
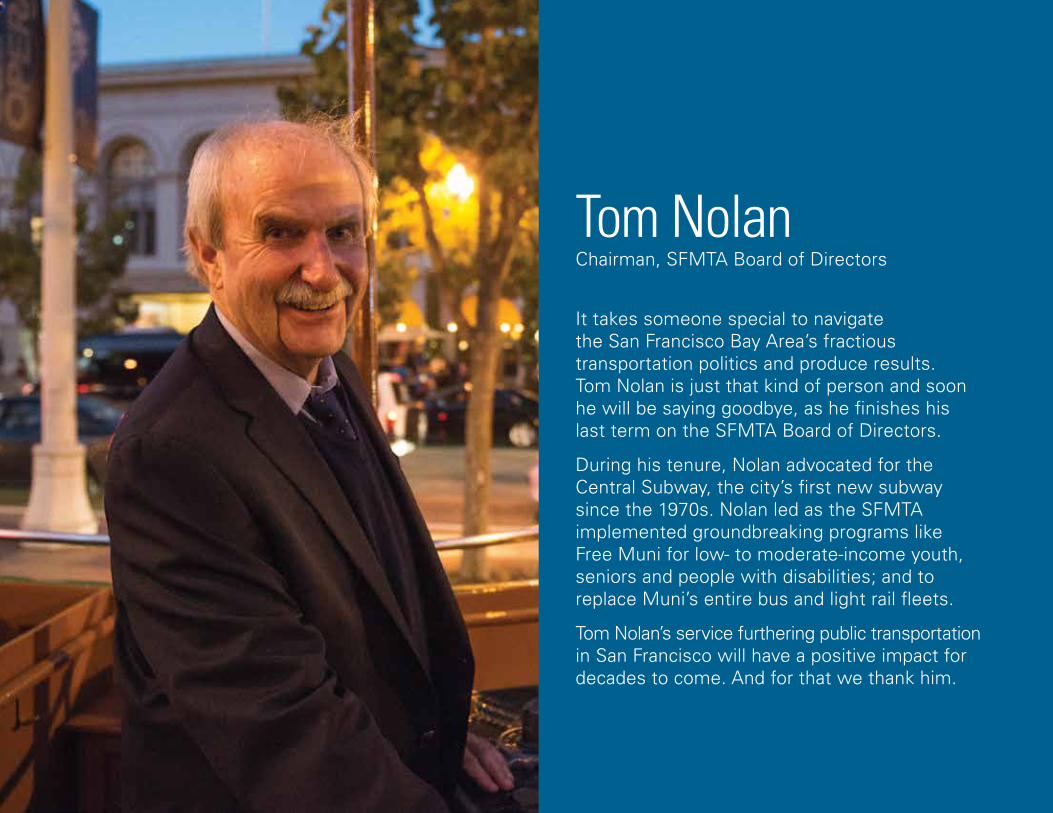
Tom Nolan
It takes someone special to navigate the San Francisco Bay Area’s fractious transportation politics and produce results. Tom Nolan is just that kind of person and soon he will be saying goodbye, as he finishes his last term on the SFMTA Board of Directors.
During his tenure, Nolan advocated for the Central Subway, the city’s first new subway since the 1970s. Nolan led as the SFMTA implemented groundbreaking programs like Free Muni for low- to moderate-income youth, seniors and people with disabilities; and to replace Muni’s entire bus and light rail fleets.
Tom Nolan’s service furthering public transportation in San Francisco will have a positive impact for decades to come. And for that we thank him.
Chairman, SFMTA Board of Directors
43
SFMTA 2016 ANNUAL REPORT
Mayor Edwin M. Lee
SF Board of SupervisorsEric Mar, District 1
Mark Farrell, District 2
Aaron Peskin, District 3
Katy Tang, District 4
London Breed, District 5
Jane Kim, District 6
Norman Yee, District 7
Scott Wiener, District 8
David Campos, District 9
Malia Cohen, District 10
John Avalos, District 11
Acknowledgments
SFMTA Board of DirectorsTom Nolan, Chair
Cheryl Brinkman, Vice Chair
Gwyneth Borden
Malcolm A. Heinicke
Lee Hsu
Joél Ramos
Cristina Rubke
SFMTA Executive TeamEdward D. Reiskin, Director of Transportation
Sonali Bose, Chief Financial Officer
Kate Breen, Director of Government Affairs
Donald Ellison, Director of Human Resources
John Haley, Director of Transit
Melvyn Henry, Director of System Safety
Tom Maguire, Director of Sustainable Streets
Candace Sue, Director of Communications & Marketing
Kate Toran, Director of Taxi & Accessible Services
Siew-Chin Yeong, Director of Capital Programs & Construction
Annual Report Development Team Amy Cook, Capital Programs and Construction
Keli Dailey, Marketing
Bradley Dunn, Strategic Communications
Alvino Garcia, System Safety
Rachel Hyden, Transit
Peter Kashtanoff, Taxi and Accessible Services
Chimmy Lee, Creative Services
Jeremy Menzies, Creative Services
Stephen Schmidt, Sustainable Streets
Julie Rosenberg, Finance Information Technology
44
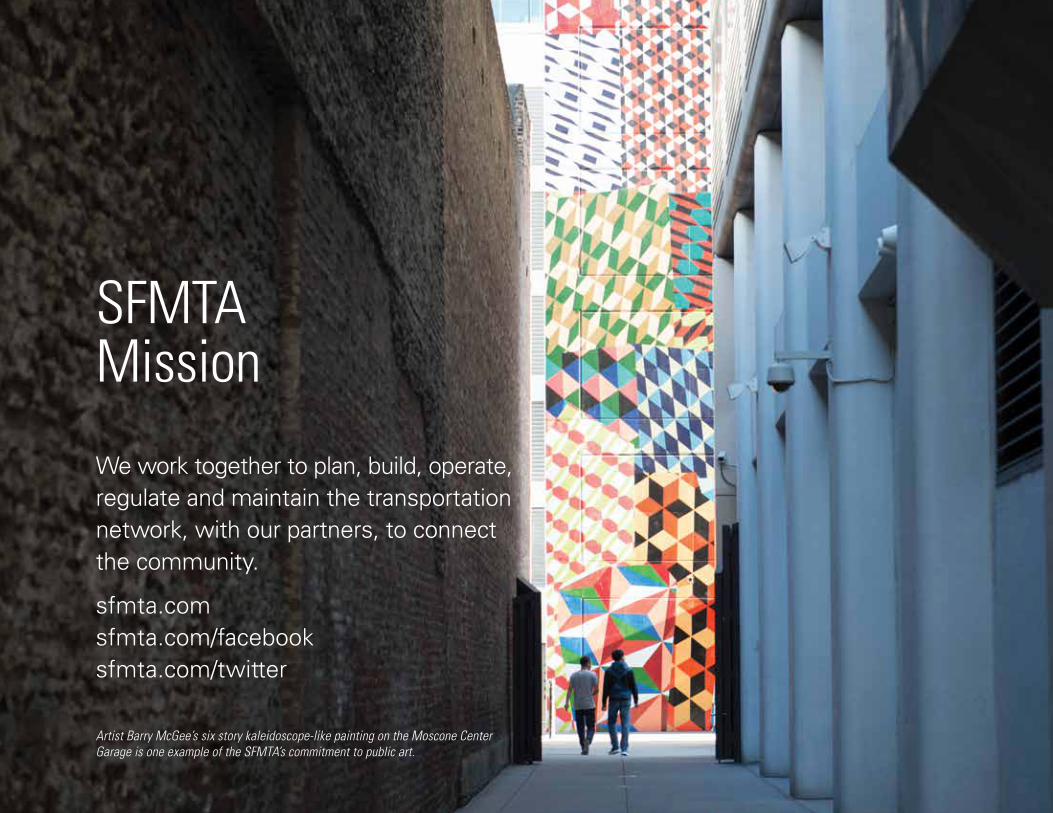
SFMTA Mission
We work together to plan, build, operate, regulate and maintain the transportation network, with our partners, to connect the community.
sfmta.com sfmta.com/facebook sfmta.com/twitter
Artist Barry McGee’s six story kaleidoscope-like painting on the Moscone Center Garage is one example of the SFMTA’s commitment to public art.