Embed Size (px)
Citation preview


DELIVERING ON THE PROMISEOF PRO-POOR GROWTH

DELIVERING ON THEPROMISE OF PRO-POOR
GROWTHInsights and Lessons from Country Experiences
Timothy Besley and Louise J. Cord, Editors
A copublication of Palgrave Macmillan and the World Bank
© 2007 The International Bank for Reconstruction and Development / The World Bank1818 H Street NWWashington DC 20433Telephone: 202-473-1000Internet: www.worldbank.orgE-mail: [email protected]
All rights reserved.
1 2 3 4 10 09 08 07
A copublication of The World Bank and Palgrave Macmillan.
Palgrave MacmillanHoundmills, Basingstoke, Hampshire RG21 6XS and175 Fifth Avenue, New York, NY 10010Companies and representatives throughout the world
Palgrave Macmillan is the global academic imprint of the Palgrave Macmillan division of St. Martin’sPress, LLC and of Palgrave Macmillan Ltd.
Macmillan® is a registered trademark in the United States, United Kingdom, and other countries. Pal-grave is a registered trademark in the European Union and other countries.
This volume is a product of the staff of the International Bank for Reconstruction and Development /The World Bank. The findings, interpretations, and conclusions expressed in this volume do notnecessarily reflect the views of the Executive Directors of The World Bank or the governments they represent.
The World Bank does not guarantee the accuracy of the data included in this work. The bound-aries, colors, denominations, and other information shown on any map in this work do not imply anyjudgement on the part of The World Bank concerning the legal status of any territory or the endorsementor acceptance of such boundaries.
Rights and Permissions
The material in this publication is copyrighted. Copying and/or transmitting portions or all of this workwithout permission may be a violation of applicable law. The International Bank for Reconstruction andDevelopment/The World Bank encourages dissemination of its work and will normally grant permissionto reproduce portions of the work promptly.
For permission to photocopy or reprint any part of this work, please send a request with completeinformation to the Copyright Clearance Center Inc., 222 Rosewood Drive, Danvers, MA 01923, USA;telephone: 978-750-8400; fax: 978-750-4470; Internet: www.copyright.com.
All other queries on rights and licenses, including subsidiary rights, should be addressed tothe Office of the Publisher, The World Bank, 1818 H Street NW, Washington, DC 20433, USA;fax: 202-522-2422; e-mail: [email protected].
ISBN-10: 0-8213-6515-0 (softcover)ISBN-10: 0-8213-6670-X (hardcover)ISBN-13: 978-0-8213-6515-1eISBN-10: 0-8213-6516-9eISBN-13: 978-0-8213-6516-8DOI: 10.1596/978-0-8213-6515-1
Library of Congress Cataloging-in-Publications Data has been applied for.Cover design: Paine Bluett Paine, Inc.
v
Contents
Acknowledgments ix
Abbreviations xi
1. Overview 1Louise J. Cord
2. How Indonesia Connected the Poor to RapidEconomic Growth 29C. Peter Timmer
3. The Policy Origins of Poverty and Growth in India 59Timothy Besley, Robin Burgess, and Berta Esteve-Volart
4. Explaining Pro-Poor Growth in Bangladesh: Puzzles, Evidence, and Implications 79Binayak Sen, Mustafa K. Mujeri, and Quazi Shahabuddin
5. Pro-Poor Growth in Vietnam: Miracle or Model? 119Rainer Klump
6. Ghana: The Challenge of Translating Sustained Growth into Poverty Reduction 147Ernest Aryeetey and Andrew McKay
7. Uganda’s Experience with Operationalizing Pro-Poor Growth, 1992 to 2003 169John A. Okidi, Sarah Ssewanyana, Lawrence Bategeka, and Fred Muhumuza
8. The Success of Pro-Poor Growth in Rural and Urban Tunisia 199Mohamed Hédi Lahouel
9. Human Capital, Inequality, and Pro-Poor Growth in Brazil 219Naércio Menezes-Filho and Lígia Vasconcellos
Index 245
TABLES
1.1 Initial Conditions in the Eight Countries Studied 31.2 Basic Poverty, Growth, and Inequality Trends in the Eight
Countries Studied 52.1 Income Distribution and the Share of the Poor in National Income,
1964/65–2002 372.2 Percentage of Employment by Major Sector, Urban and Rural Areas,
Formal and Informal Sectors, Indonesia, 1986–2004 382.3 Factors Affecting Changes in the Headcount Index of Poverty 432.4 Roads and Trucks in Indonesia, 1939–98 493.1 Poverty and Growth across Indian States 633.2 Classification of States according to Total Poverty Elasticity and
Growth Components 643.3 Rankings of Growth Elasticities of Poverty, Growth Rates, and
Policies of Indian States, 1958–2000 734.1 Trends in Foster-Greer-Thorbecke Measures of Poverty:
Consumption Expenditure Data 814.2 Social Development in Bangladesh: Predicted versus Actual Values 834.3 Average Annual Economic Growth in Bangladesh at Constant
1995/96 Prices 854.4 Trends in Inequality: Consumption Data (Tk/month/person) 864.5 Ordinary Growth and Pro-Poor Growth Rates in Bangladesh:
1990s versus 1980s 874.6 Ordinary Growth and Pro-Poor Growth Rates in Bangladesh:
Rural, Urban, and National, 1991/92–2000 884.7 Relative Performance of Macroeconomic Indicators, 1975–2000 894.8 Percentage Distribution of Public Expenditure in Agricultural and Rural
Development in Bangladesh: 1980–2001 914.9 Returns to Labor by Mode and Sector of Employment and by Poverty
Status in Rural Areas: 1999/2000 984.10 Percentage of Rural Labor Force in Nonfarm Sector, 1983–2000 994.11 Changes in Land Tenure: 1983/84–1996 1004.12 Rural Income Inequality and Its Sources, 1991–2000 1064.13 Urban Income Inequality and Its Sources, 1991–2000 1085.1 Vietnam’s Per Capita Income (Percentage) Relative to Important
Neighboring Countries, 1950–99 1215.2 Dimensions of Poverty in Vietnam, 1993–2004 1245.3 Indicators of Growth and Inequality in Vietnam during the 1990s 1245.4 Rates of Pro-Poor Growth, 1993–2002 1265.5 Growth Accounting for Vietnam, 1987–2002 1275.6 Net Enrollment Rates (%) in Vietnam, 1993–2002 1295.7 Ownership Structure of Total Investment in Vietnam, 1991–2000 1315.8 Growth and Structural Changes in the Vietnamese Economy,
1986–2001 1325.9 Sectoral Employment Elasticities and Labor Productivities, 1986–2001 1336.1 Changes in Poverty and Inequality at the National Level,
1991/92–1998/99 150
vi Contents
6.2 Trends in Poverty Incidence by Main Economic Activity of Household, 1991/92 and 1998/99 152
6.3 Poverty Reduction by Main Economic Activity, Decomposed into Intragroup and Migration Effects (Percentage Contributions), 1991/92–1998/99 153
6.4 Collins and Bosworth Growth Accounting-based Decomposition of Sources of Growth, Ghana versus Sub-Saharan Africa, 1960–97 153
7.1 Decomposing Poverty Trends in Uganda, 1992–2003 1727.2 Contribution of Growth and Inequality to Poverty Reduction by
Region and Category of Employment, 1992–2003 1757.3 Rates of Average Expenditure and Pro-Poor Growth, 1992–2003 1767.4 Growth Rates by Industry Group, 1992–2003 1778.1 Incidence of Poverty in Tunisia: Headcount Ratios for the Lower and
Upper Poverty Lines, 1980–2000 2018.2 Poverty Incidence in Tunisia: Regional Headcount Ratios for the Lower
Poverty Level, 1980–2000 2028.3 Growth Performance, 1962–2000 (Annual Averages) 2038.4 Growth Decomposition, 1962–2000 (in Percentage of Total GDP Growth) 2038.5 Trends in Income Inequality, 1980–2000 (Gini Coefficient) 2058.6 Pro-Poor Growth Rates, 1980–2000 2068.7 Population Growth and Poverty 2159.1 Inequality Decompositions in Brazil (%) 2209.2 Effect of Pensions on Extreme Poverty 2239.3 Growth and Inequality Poverty Decomposition, 1981–2001 2279.4 Distribution of Students in Public Schools
by Consumption Brackets (%) 2279.5 Growth Elasticity of Poverty by State and Area 2329.6 Determinants of Pro-Poor Growth 2369.7 Determinants of Growth 237
FIGURES
1.1 The Eight Countries 21.2 Urban Poverty Fell More Rapidly than Rural Poverty except
in Indonesia 61.3 Most Poverty Reduction Occurred in Rural Areas except in Brazil 61.4 Economic Growth Reduces Poverty 71.5 Consumption by the Poor Generally Grew Slower than Average
Consumption 81.6 National Averages in Ghana Mask Significant Regional Variation
in the Contributions of Growth and Inequality to Poverty Reduction 91.7 Changes in Growth and Inequality Are Related 101.8 Significant Poverty Reduction but Rising Inequality in
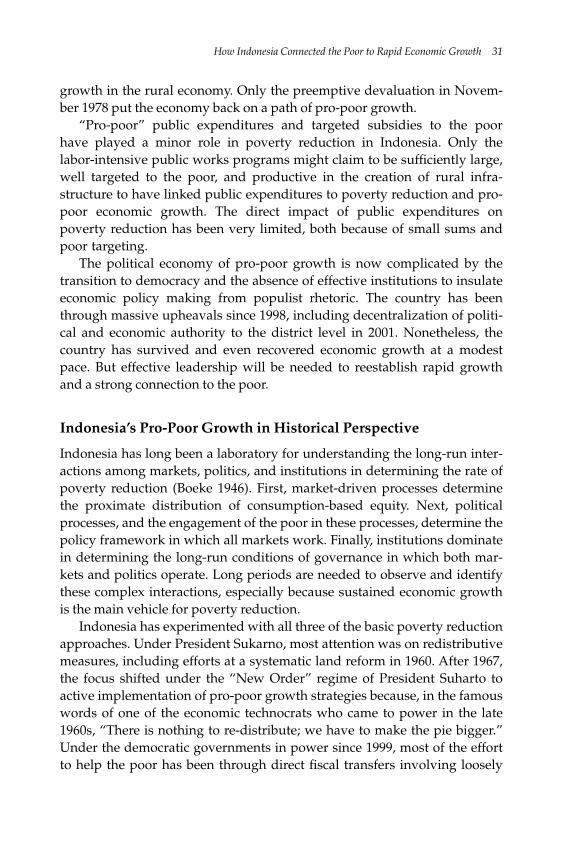
Bangladesh, Uganda, and Vietnam 101.9 Nonagricultural Growth Was almost Triple Agricultural Growth 162.1 Indonesia’s Growth Incidence Curve, 1996–2002 33
Contents vii
2.2 Income Growth for Bottom Quintile Plotted against Growth for Average Per Capita Incomes, Indonesia, 1967–2002 33
2.3 Road to Pro-Poor Growth 353.1 Changes in Total Real Income Per Capita, Total Official Poverty,
and Inequality, by Indian State, 1957–2000 614.1 Long-Term Trends in Infant Mortality 844.2 Bangladesh’s Growth Incidence Curves, 1991/92–2000 875.1 Vietnam’s Growth Incidence Curve, 1993–2002 1256.1 Ghana’s Growth Incidence Curve, 1991–98 1497.1 Prior to 2000 Growth Was Robust and Pro-Poor in Absolute Terms 1737.2 Structural Transformation Tapered Off, 1992–2003 1787.3 Ugandan Policy Makers Control Inflation to a Single Digit, 1991–2004 1837.4 Policy Liberalization Reverses Capital Flight and Attracts FDI to
Industry and Services 1847.5 After the Boom of the Mid-1990s, Coffee Prices Plummeted 1858.1 Tunisia’s Growth Incidence Curve, 1980–2000 2069.1 Poverty Reduction in the 1970s 2229.2 Brazil’s Growth Incidence Curve, 1981–2001 2269.3 Average Years of Schooling and Income by Brazilian State, 1981 2289.4 Years of Schooling and Inequality by State, 1981 2299.5 Average Education by Race and State 2309.6 Average Education by Gender and State 2309.7 Initial Share of Higher Education and the Growth Elasticity of
Poverty, 1981 2339.8 Previous Change in Higher Education and in the Growth Elasticity
of Poverty by State, 1981–93 2339.9 Change in Higher Education and Inequality by State, 1981–2001 2349.10 Change in Higher Education and Poverty Reduction by State,
1981–2001 235
viii Contents
Acknowledgments
This book was prepared under the auspices of the Operationalizing Pro-Poor Growth (OPPG) research program cosponsored by Agence Françaisede Développement (AFD), German Development Policy, the UK Depart-ment for International Development (DFID), and the World Bank. Themembers of the OPPG research program include Mandy Chatha, TomCrowards, Will Gargent, Manu Manthri, and Christian Rogg (DFID); JackyAmprou, Jean Marc Chataigner, Christian Flamant, and François Pacque-ment (AFD); Daniel Alker, Hartmut Janus, Annette Langhammer, UlrikeMaenner, Ute Möhring, Birgit Pickel, and Julius Spatz (German Develop-ment Policy); and Sabine Bernabè, Louise Cord, Ignacio Fiestas, andHumberto Lopez (World Bank).
The work was carried out under the direction of Adrian Wood (DFID),Luca Barbone, Danny Leipziger, and Sudhir Shetty (World Bank). The teamalso gratefully acknowledges Gobind Nankani and John Page (World Bank),who initiated this work.
The book reflects comments received during a workshop with theauthors in Frankfurt in June 2004 and during workshops with the authors,the core donor team, and World Bank and DFID staff in London in December2004 and in Washington in February 2005. These workshops also includedacademics, nongovernmental organization representatives, and representa-tives of other donor agencies. The book reflects valuable feedback receivedduring the World Bank’s 2005 Poverty Reduction and Economic Manage-ment Conference sessions, “Equity and Pro-Poor Growth” and “MakingGrowth Pro-Poor: Cases and Policies,” which were organized jointly withthe 2006 World Development Report team.
Many others provided helpful comments. They include Gary Fields(Cornell University); C. Peter Timmer (Center for Global Development);Alan Gelb, Indermit Gill, Daniela Gressani, Catherine Hull, TamarManuelyan Atinc, John Page, and Martin Ravallion (World Bank); LionelDemery (consultant); Max Everest-Phillips and Arjan de Haan (DFID); andMarc Raffinot (AFD-Development, Institutions, and Long-Term Analysis).
ix

The editors gratefully acknowledge production assistance provided byAliya Husain, Nelly Obias, and Jae Shin Yang. They also acknowledge thesupport of Stephen McGroarty, Dina Towbin, and Nora Ridolfi from theWorld Bank Office of the Publisher.
x Acknowledgments
Abbreviations
AFD Agence Francaise de Développement AGOA African Growth Opportunity ActBBS Bangladesh Bureau of StatisticsDFID UK Department for International DevelopmentDHS Demographic and Health SurveyFDI foreign direct investmentGDP gross domestic productGEP growth elasticity of povertyGIC growth incidence curve GLSS Ghana Living Standards SurveysHCMC Ho Chi Minh CityHCS Household Consumption SurveyHEPR National Program for Hunger Eradication and Poverty
ReductionHIES Household Income Expenditure SurveyHIPC Heavily Indebted Poor CountryIMR infant mortality rateNGO nongovernmental organizationNSS National Sample SurveyOPPG Operationalizing Pro-Poor Growth Research ProgramPNAD Pesquisa Nacional por Amostra de DomiciliosRMG ready-made garmentsSMEs small and medium-size enterprisesSOEs state-owned enterprisesSUSENAS national socioeconomic surveyTFP total factor productivityTFR total fertility rate
xi

1Overview
Louise Cord
Broad-based growth is critical to accelerating poverty reduction. The mostsuccessful East Asian countries in the 1970s and 1980s showed that rapidgrowth, combined with low initial inequality and pro-poor distributionalchange, could significantly reduce poverty (World Bank 1993). Analysis ofchanges in poverty levels across a sample of developing countries in the1980s and 1990s also highlights the importance of fast growth for povertyreduction (Dollar and Kraay 2002; Foster and Székely 2001; Kraay 2006;Ravallion and Chen 1997).
But income inequality also affects the pace at which growth is translatedinto poverty reduction. Growth is less efficient in lowering poverty levels incountries with high initial inequality or in which the distributional patternof growth favors the nonpoor (Bourguignon 2004; Ravallion 1997, 2004). Inthe late 1990s the term pro-poor growth became popular as economists recog-nized that accelerating poverty reduction required both more rapid growthand lower inequality.1
Despite the attention given to the relative roles of growth and inequalityin reducing poverty, we know little about how the microunderpinnings ofgrowth strategies affect the ability of poor households to participate in andbenefit from growth. This book contributes to the debate on how to acceleratepoverty reduction by providing insights from studies of eight countries thathave been relatively successful in delivering pro-poor growth: Bangladesh,Brazil, Ghana, India, Indonesia, Tunisia, Uganda, and Vietnam (figure 1.1).The studies analyze the distributional pattern of growth and the ways inwhich country policies and conditions affected it. They use an income-based
1
methodology built on Ravallion (2004) to analyze the distributional impactof growth. Because institutions and nonincome dimensions of poverty areconsidered highly relevant determinants of this, they are discussed whererelevant.
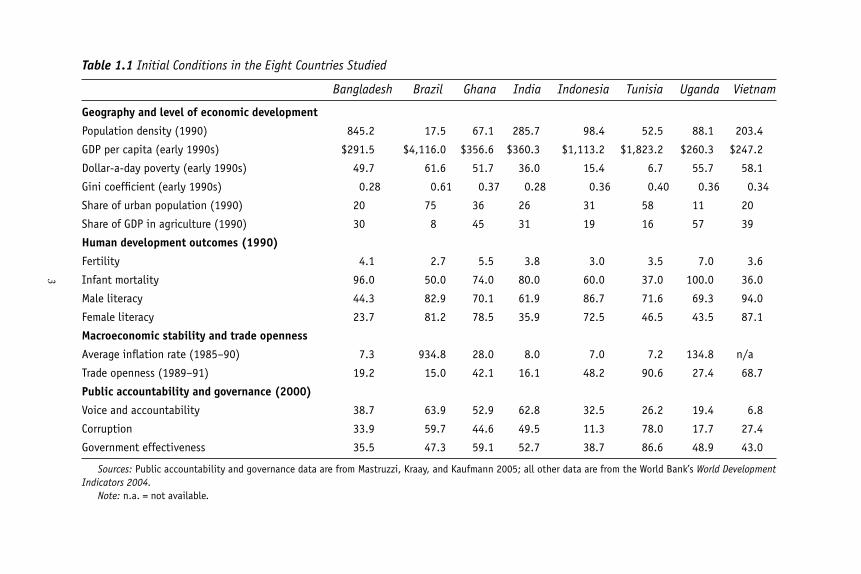
Table 1.1 shows conditions in the eight countries in the early 1990s. Thethree middle-income countries (where gross domestic product [GDP] percapita exceeded $1,000 in 1990) and India experienced sustained long-termpro-poor growth. The studies of Indonesia, India, and Tunisia start in the1950s and 1960s, while analysis of Brazil goes back to the 1980s. Growth hasebbed and flowed in these countries, reflecting exogenous forces andmacro- and structural policies, as well as political and financial events, butoverall these economies have shown a great deal of resiliency in deliveringdevelopment.
In India and the three middle-income countries (Brazil, Indonesia, andTunisia), governments have been able to promote public and private accu-mulation of physical and human capital across most households in theincome distribution. (The exception may be Brazil, where capital accumula-tion occurred disproportionately at the middle and top end of the incomedistribution.) Yet these governments differ widely with respect to institu-tional qualities: Indonesia has a high level of corruption, whereas Tunisia hasa low level. India has relatively strong democratic and federal traditions andstable public institutions, whereas Tunisia and Indonesia have largely cen-tralized and autocratic systems of governments that are relatively effectivebut associated with lower levels of voice (citizen input) and accountability.
2 Cord
Figure 1.1 The Eight Countries
3
Table 1.1 Initial Conditions in the Eight Countries Studied
Bangladesh Brazil Ghana India Indonesia Tunisia Uganda Vietnam
Geography and level of economic development
Population density (1990) 845.2 17.5 67.1 285.7 98.4 52.5 88.1 203.4
GDP per capita (early 1990s) $291.5 $4,116.0 $356.6 $360.3 $1,113.2 $1,823.2 $260.3 $247.2
Dollar-a-day poverty (early 1990s) 49.7 61.6 51.7 36.0 15.4 6.7 55.7 58.1
Gini coefficient (early 1990s) 0.28 0.61 0.37 0.28 0.36 0.40 0.36 0.34
Share of urban population (1990) 20 75 36 26 31 58 11 20
Share of GDP in agriculture (1990) 30 8 45 31 19 16 57 39
Human development outcomes (1990)
Fertility 4.1 2.7 5.5 3.8 3.0 3.5 7.0 3.6
Infant mortality 96.0 50.0 74.0 80.0 60.0 37.0 100.0 36.0
Male literacy 44.3 82.9 70.1 61.9 86.7 71.6 69.3 94.0
Female literacy 23.7 81.2 78.5 35.9 72.5 46.5 43.5 87.1
Macroeconomic stability and trade openness
Average inflation rate (1985–90) 7.3 934.8 28.0 8.0 7.0 7.2 134.8 n/a
Trade openness (1989–91) 19.2 15.0 42.1 16.1 48.2 90.6 27.4 68.7
Public accountability and governance (2000)
Voice and accountability 38.7 63.9 52.9 62.8 32.5 26.2 19.4 6.8
Corruption 33.9 59.7 44.6 49.5 11.3 78.0 17.7 27.4
Government effectiveness 35.5 47.3 59.1 52.7 38.7 86.6 48.9 43.0
Sources: Public accountability and governance data are from Mastruzzi, Kraay, and Kaufmann 2005; all other data are from the World Bank’s World DevelopmentIndicators 2004.
Note: n.a. = not available.
In the four low-income countries (Bangladesh, Ghana, Uganda, andVietnam) much of the progress toward poverty reduction has been spurredby peace dividends and one-off gains from macrostabilization along withstructural reforms. Attractive world market conditions and trade liberaliza-tion also allowed these countries to benefit from export growth in agricul-ture and manufacturing, albeit somewhat sporadically in Uganda andGhana. In addition, increased aid flows and public expenditures havehelped these countries to promote human capital accumulation with invest-ments in health and education and, to a lesser degree, to finance improve-ments in their infrastructure base.
Progress in delivering human and physical capital (particularly infra-structure) has been spotty in the more remote areas of these low-incomecountries. The difficulty of creating pro-growth environments in these morechallenging areas may particularly explain the rise in inequality that thesecountries experienced in the 1990s. Moreover, only Vietnam and Bangla-desh achieved any measure of structural transformation with growing agri-cultural productivity and the release of labor into dynamic industrial andservices sectors. In Ghana and Uganda, the gains from economic policyreforms appear to be shorter-lived; the bulk of the population and in partic-ular the poor remain in agricultural and low-return nonagricultural self-employment activities.
Poverty, Growth, and Inequality Trends in the 1990s and Early 2000s
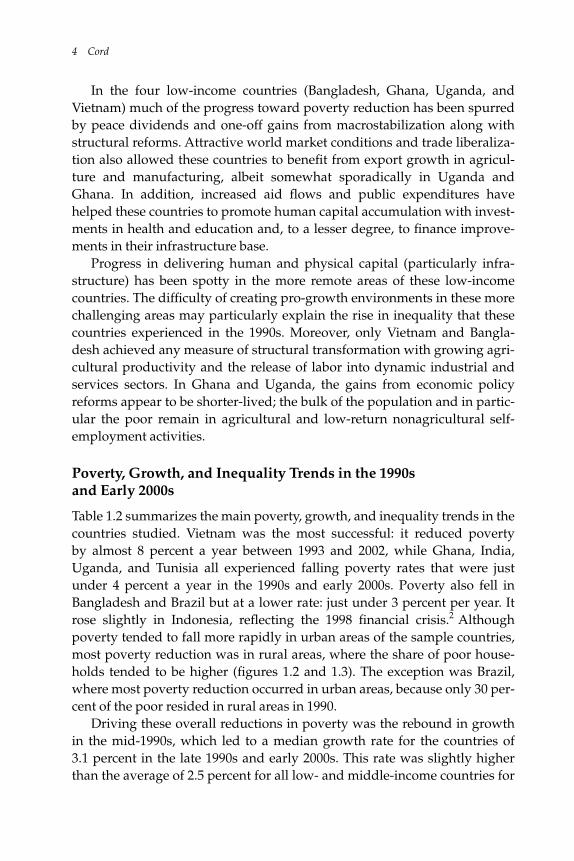
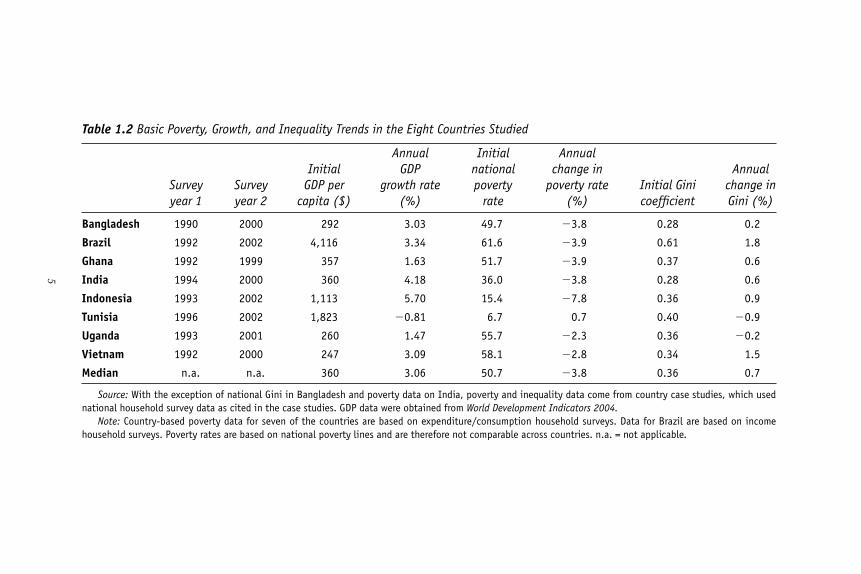
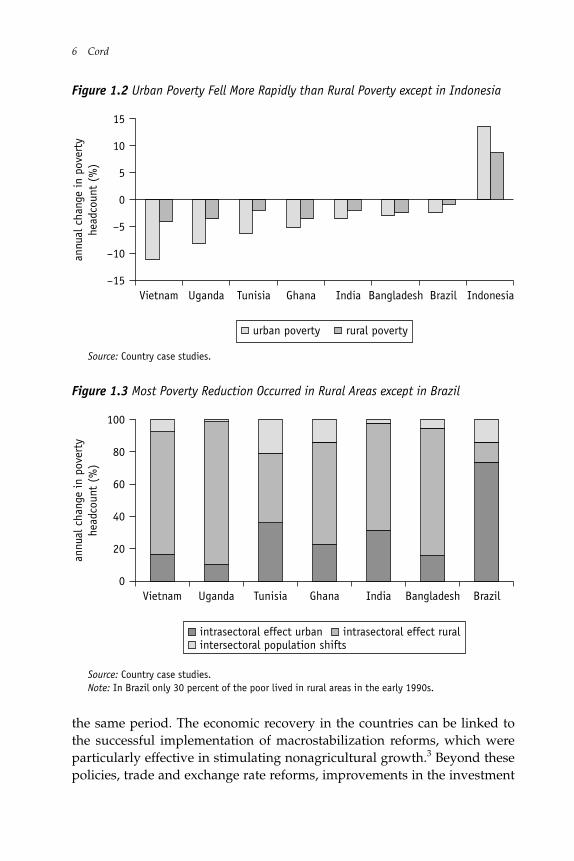
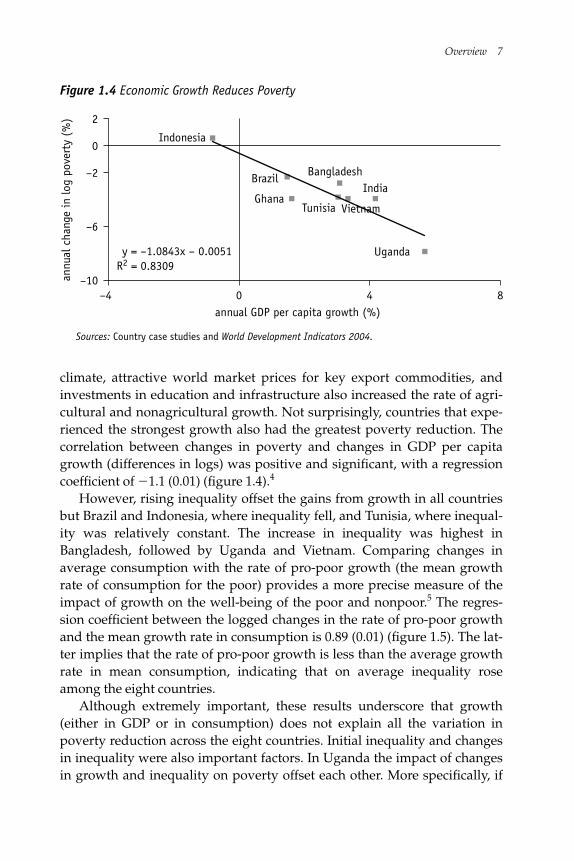
Table 1.2 summarizes the main poverty, growth, and inequality trends in thecountries studied. Vietnam was the most successful: it reduced povertyby almost 8 percent a year between 1993 and 2002, while Ghana, India,Uganda, and Tunisia all experienced falling poverty rates that were justunder 4 percent a year in the 1990s and early 2000s. Poverty also fell inBangladesh and Brazil but at a lower rate: just under 3 percent per year. Itrose slightly in Indonesia, reflecting the 1998 financial crisis.2 Althoughpoverty tended to fall more rapidly in urban areas of the sample countries,most poverty reduction was in rural areas, where the share of poor house-holds tended to be higher (figures 1.2 and 1.3). The exception was Brazil,where most poverty reduction occurred in urban areas, because only 30 per-cent of the poor resided in rural areas in 1990.
Driving these overall reductions in poverty was the rebound in growthin the mid-1990s, which led to a median growth rate for the countries of3.1 percent in the late 1990s and early 2000s. This rate was slightly higherthan the average of 2.5 percent for all low- and middle-income countries for
4 Cord
5
Table 1.2 Basic Poverty, Growth, and Inequality Trends in the Eight Countries Studied
Annual Initial Annual Initial GDP national change in Annual
Survey Survey GDP per growth rate poverty poverty rate Initial Gini change inyear 1 year 2 capita ($) (%) rate (%) coefficient Gini (%)
Bangladesh 1990 2000 292 3.03 49.7 �3.8 0.28 0.2
Brazil 1992 2002 4,116 3.34 61.6 �3.9 0.61 1.8
Ghana 1992 1999 357 1.63 51.7 �3.9 0.37 0.6
India 1994 2000 360 4.18 36.0 �3.8 0.28 0.6
Indonesia 1993 2002 1,113 5.70 15.4 �7.8 0.36 0.9
Tunisia 1996 2002 1,823 �0.81 6.7 0.7 0.40 �0.9
Uganda 1993 2001 260 1.47 55.7 �2.3 0.36 �0.2
Vietnam 1992 2000 247 3.09 58.1 �2.8 0.34 1.5
Median n.a. n.a. 360 3.06 50.7 �3.8 0.36 0.7
Source: With the exception of national Gini in Bangladesh and poverty data on India, poverty and inequality data come from country case studies, which usednational household survey data as cited in the case studies. GDP data were obtained from World Development Indicators 2004.
Note: Country-based poverty data for seven of the countries are based on expenditure/consumption household surveys. Data for Brazil are based on incomehousehold surveys. Poverty rates are based on national poverty lines and are therefore not comparable across countries. n.a. = not applicable.
the same period. The economic recovery in the countries can be linked tothe successful implementation of macrostabilization reforms, which wereparticularly effective in stimulating nonagricultural growth.3 Beyond thesepolicies, trade and exchange rate reforms, improvements in the investment
6 Cord
–15Indonesia
–10
–5
0
5
10
15
urban poverty rural poverty
annu
al c
hang
e in
pov
erty
head
coun
t (%
)
Vietnam Uganda Tunisia Ghana India Bangladesh Brazil
Figure 1.2 Urban Poverty Fell More Rapidly than Rural Poverty except in Indonesiaan
nual
cha
nge
in p
over
tyhe
adco
unt
(%)
Vietnam0
Uganda Tunisia Ghana India Bangladesh Brazil
20
40
60
80
100
intrasectoral effect urban intrasectoral effect ruralintersectoral population shifts
Figure 1.3 Most Poverty Reduction Occurred in Rural Areas except in Brazil
Source: Country case studies.Note: In Brazil only 30 percent of the poor lived in rural areas in the early 1990s.
Source: Country case studies.
Overview 7an
nual
cha
nge
in lo
g po
vert
y (%
)
–10
annual GDP per capita growth (%)
–6
–2
0
2
Uganda
8
y = –1.0843x – 0.0051R2 = 0.8309
40–4
VietnamTunisia
Indonesia
IndiaBangladesh
Ghana
Brazil
Figure 1.4 Economic Growth Reduces Poverty
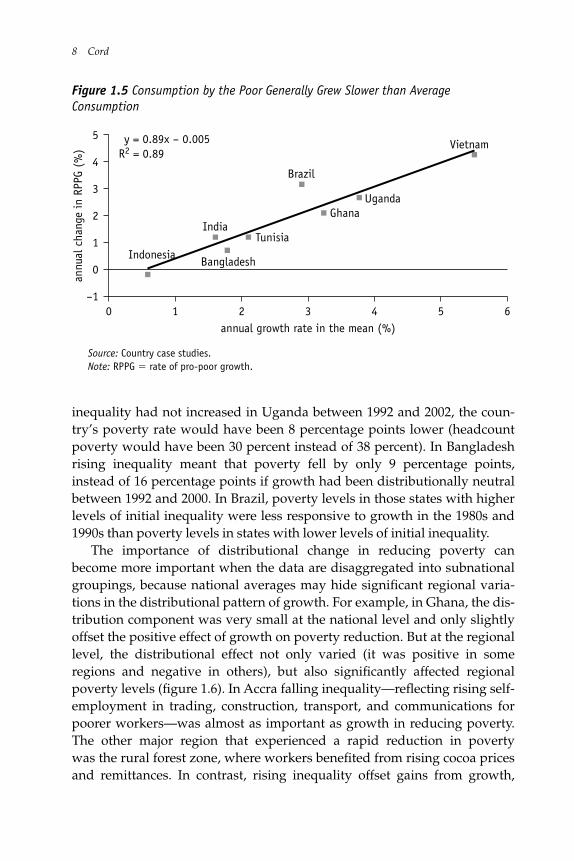
climate, attractive world market prices for key export commodities, andinvestments in education and infrastructure also increased the rate of agri-cultural and nonagricultural growth. Not surprisingly, countries that expe-rienced the strongest growth also had the greatest poverty reduction. Thecorrelation between changes in poverty and changes in GDP per capitagrowth (differences in logs) was positive and significant, with a regressioncoefficient of �1.1 (0.01) (figure 1.4).4
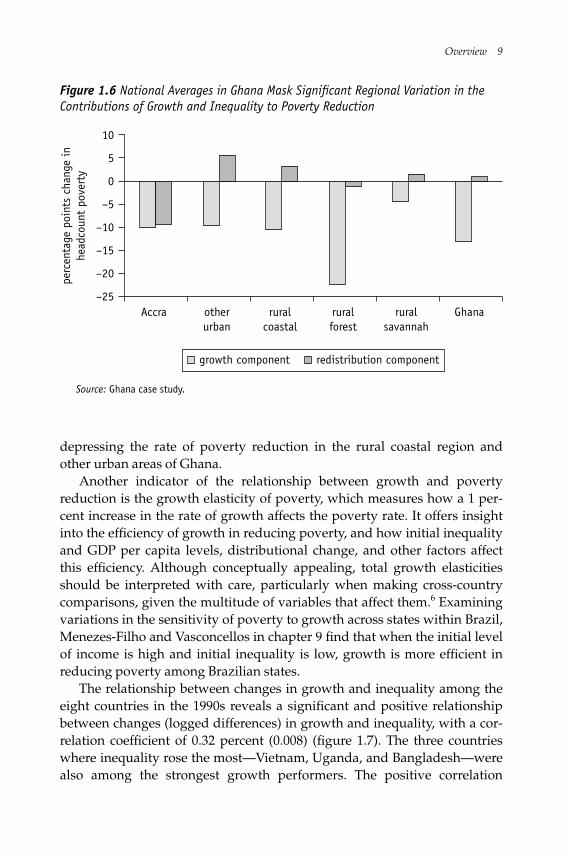
However, rising inequality offset the gains from growth in all countriesbut Brazil and Indonesia, where inequality fell, and Tunisia, where inequal-ity was relatively constant. The increase in inequality was highest inBangladesh, followed by Uganda and Vietnam. Comparing changes inaverage consumption with the rate of pro-poor growth (the mean growthrate of consumption for the poor) provides a more precise measure of theimpact of growth on the well-being of the poor and nonpoor.5 The regres-sion coefficient between the logged changes in the rate of pro-poor growthand the mean growth rate in consumption is 0.89 (0.01) (figure 1.5). The lat-ter implies that the rate of pro-poor growth is less than the average growthrate in mean consumption, indicating that on average inequality roseamong the eight countries.
Although extremely important, these results underscore that growth(either in GDP or in consumption) does not explain all the variation inpoverty reduction across the eight countries. Initial inequality and changesin inequality were also important factors. In Uganda the impact of changesin growth and inequality on poverty offset each other. More specifically, if
Sources: Country case studies and World Development Indicators 2004.
inequality had not increased in Uganda between 1992 and 2002, the coun-try’s poverty rate would have been 8 percentage points lower (headcountpoverty would have been 30 percent instead of 38 percent). In Bangladeshrising inequality meant that poverty fell by only 9 percentage points,instead of 16 percentage points if growth had been distributionally neutralbetween 1992 and 2000. In Brazil, poverty levels in those states with higherlevels of initial inequality were less responsive to growth in the 1980s and1990s than poverty levels in states with lower levels of initial inequality.
The importance of distributional change in reducing poverty canbecome more important when the data are disaggregated into subnationalgroupings, because national averages may hide significant regional varia-tions in the distributional pattern of growth. For example, in Ghana, the dis-tribution component was very small at the national level and only slightlyoffset the positive effect of growth on poverty reduction. But at the regionallevel, the distributional effect not only varied (it was positive in someregions and negative in others), but also significantly affected regionalpoverty levels (figure 1.6). In Accra falling inequality—reflecting rising self-employment in trading, construction, transport, and communications forpoorer workers—was almost as important as growth in reducing poverty.The other major region that experienced a rapid reduction in povertywas the rural forest zone, where workers benefited from rising cocoa pricesand remittances. In contrast, rising inequality offset gains from growth,
8 Cord
annu
al c
hang
e in
RPP
G (%
)
–1
annual growth rate in the mean (%)
0
2
1
3
4
5
64 53210
Bangladesh
Brazil
GhanaIndia
Tunisia
Uganda
Indonesia
Vietnam y = 0.89x – 0.005R2 = 0.89
Figure 1.5 Consumption by the Poor Generally Grew Slower than AverageConsumption
Source: Country case studies.Note: RPPG � rate of pro-poor growth.
depressing the rate of poverty reduction in the rural coastal region andother urban areas of Ghana.
Another indicator of the relationship between growth and povertyreduction is the growth elasticity of poverty, which measures how a 1 per-cent increase in the rate of growth affects the poverty rate. It offers insightinto the efficiency of growth in reducing poverty, and how initial inequalityand GDP per capita levels, distributional change, and other factors affectthis efficiency. Although conceptually appealing, total growth elasticitiesshould be interpreted with care, particularly when making cross-countrycomparisons, given the multitude of variables that affect them.6 Examiningvariations in the sensitivity of poverty to growth across states within Brazil,Menezes-Filho and Vasconcellos in chapter 9 find that when the initial levelof income is high and initial inequality is low, growth is more efficient inreducing poverty among Brazilian states.
The relationship between changes in growth and inequality among theeight countries in the 1990s reveals a significant and positive relationshipbetween changes (logged differences) in growth and inequality, with a cor-relation coefficient of 0.32 percent (0.008) (figure 1.7). The three countrieswhere inequality rose the most—Vietnam, Uganda, and Bangladesh—werealso among the strongest growth performers. The positive correlation
Overview 9pe
rcen
tage
poi
nts
chan
ge in
head
coun
t po
vert
y
–25
–15
–20
–5
–10
0
5
10
ruralsavannah
Ghanaruralforest
ruralcoastal
otherurban
Accra
growth component redistribution component
Figure 1.6 National Averages in Ghana Mask Significant Regional Variation in theContributions of Growth and Inequality to Poverty Reduction
Source: Ghana case study.
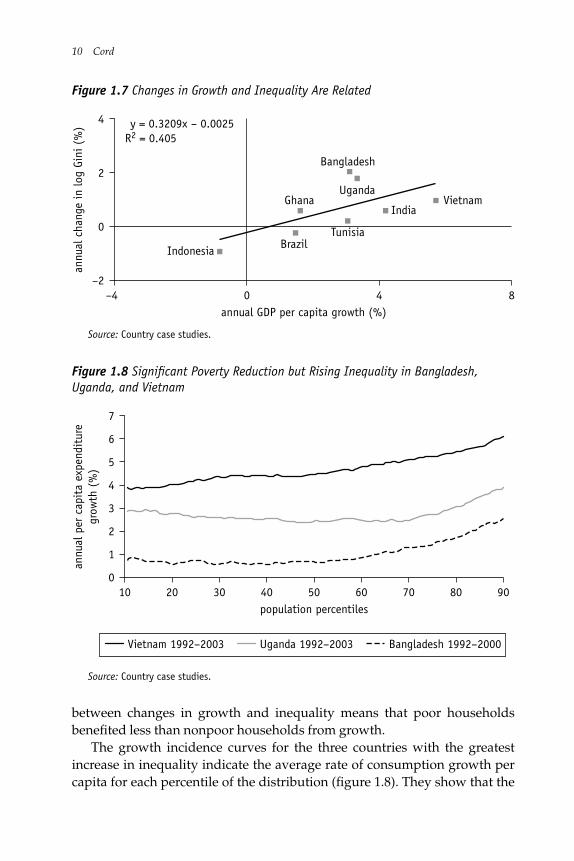
between changes in growth and inequality means that poor householdsbenefited less than nonpoor households from growth.
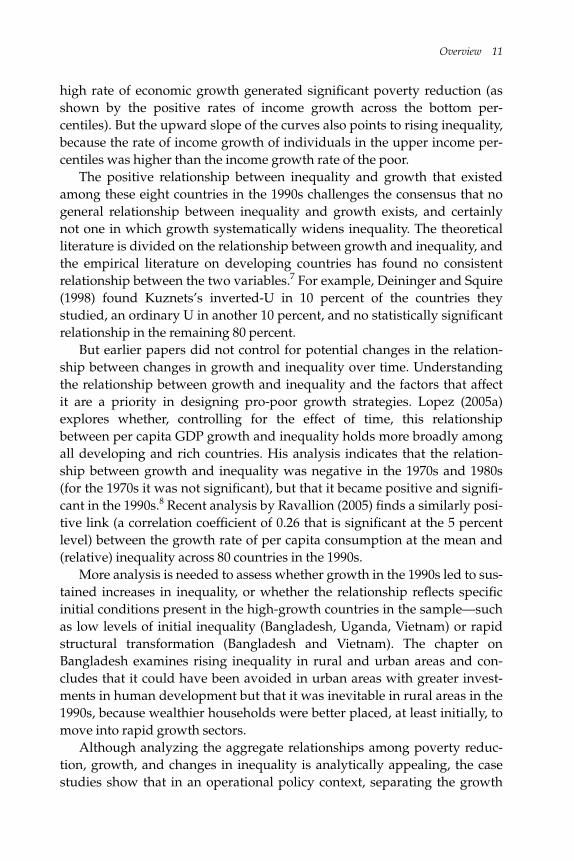
The growth incidence curves for the three countries with the greatestincrease in inequality indicate the average rate of consumption growth percapita for each percentile of the distribution (figure 1.8). They show that the
10 Cord
annu
al p
er c
apit
a ex
pend
itur
egr
owth
(%
)
0
population percentiles
3
6
2
5
1
4
7
907050 806030 402010
Vietnam 1992–2003 Uganda 1992–2003 Bangladesh 1992–2000
Figure 1.8 Significant Poverty Reduction but Rising Inequality in Bangladesh,Uganda, and Vietnam
annu
al c
hang
e in
log
Gini
(%
)
–2
annual GDP per capita growth (%)
0
2
4
8
y = 0.3209x – 0.0025R2 = 0.405
40–4
VietnamUganda
Bangladesh
India
Tunisia
Ghana
BrazilIndonesia
Figure 1.7 Changes in Growth and Inequality Are Related
Source: Country case studies.
Source: Country case studies.
Overview 11
high rate of economic growth generated significant poverty reduction (asshown by the positive rates of income growth across the bottom per-centiles). But the upward slope of the curves also points to rising inequality,because the rate of income growth of individuals in the upper income per-centiles was higher than the income growth rate of the poor.
The positive relationship between inequality and growth that existedamong these eight countries in the 1990s challenges the consensus that nogeneral relationship between inequality and growth exists, and certainlynot one in which growth systematically widens inequality. The theoreticalliterature is divided on the relationship between growth and inequality, andthe empirical literature on developing countries has found no consistentrelationship between the two variables.7 For example, Deininger and Squire(1998) found Kuznets’s inverted-U in 10 percent of the countries theystudied, an ordinary U in another 10 percent, and no statistically significantrelationship in the remaining 80 percent.
But earlier papers did not control for potential changes in the relation-ship between changes in growth and inequality over time. Understandingthe relationship between growth and inequality and the factors that affectit are a priority in designing pro-poor growth strategies. Lopez (2005a)explores whether, controlling for the effect of time, this relationshipbetween per capita GDP growth and inequality holds more broadly amongall developing and rich countries. His analysis indicates that the relation-ship between growth and inequality was negative in the 1970s and 1980s(for the 1970s it was not significant), but that it became positive and signifi-cant in the 1990s.8 Recent analysis by Ravallion (2005) finds a similarly posi-tive link (a correlation coefficient of 0.26 that is significant at the 5 percentlevel) between the growth rate of per capita consumption at the mean and(relative) inequality across 80 countries in the 1990s.
More analysis is needed to assess whether growth in the 1990s led to sus-tained increases in inequality, or whether the relationship reflects specificinitial conditions present in the high-growth countries in the sample—suchas low levels of initial inequality (Bangladesh, Uganda, Vietnam) or rapidstructural transformation (Bangladesh and Vietnam). The chapter onBangladesh examines rising inequality in rural and urban areas and con-cludes that it could have been avoided in urban areas with greater invest-ments in human development but that it was inevitable in rural areas in the1990s, because wealthier households were better placed, at least initially, tomove into rapid growth sectors.
Although analyzing the aggregate relationships among poverty reduc-tion, growth, and changes in inequality is analytically appealing, the casestudies show that in an operational policy context, separating the growth
and distributional impacts of policies on poverty reduction is often not pos-sible. Most policies have both a growth and a distributional impact. From apolicy perspective, the more relevant questions are how did poor house-holds participate in growth, and what were the main channels? What poli-cies and country conditions were effective in helping poorer householdstake advantage of and contribute to growth?
Increasing Poor Households’ Participation in Economic Growth
The case studies presented in this volume offer several policy lessons forpromoting broad-based growth.
Households can participate in economic growth through three mainchannels: employment, transfers (from public and private sources), andreturns on investment. We focus on employment, because the most success-ful experiences in pro-poor growth occurred when government policy, com-bined with favorable exogenous events, supported creation of attractivejobs accessible to poor households.
In addition, employment income is between two-thirds and three-quarters of total income, and this share tends to be even larger for poorhouseholds with little income from nonlabor-related sources. Countrieswith relatively low levels of GDP per capita tend to have most employmentconcentrated in agriculture, but as productivity in that sector rises andnonagricultural activities expand, the workforce shifts out of agricultureand into attractive informal and formal employment in industry and ser-vices. Income generated from other assets (rental income, interest income) isnot considered directly in the case studies, because the great majority ofpoor people have no assets aside from labor and land. Income transfersoffer another channel for connecting the poor to growth, and they grew inimportance in the 1990s. Nonetheless, they remain limited in scope, particu-larly in low-income countries.9
Making Agricultural Activities More Productive
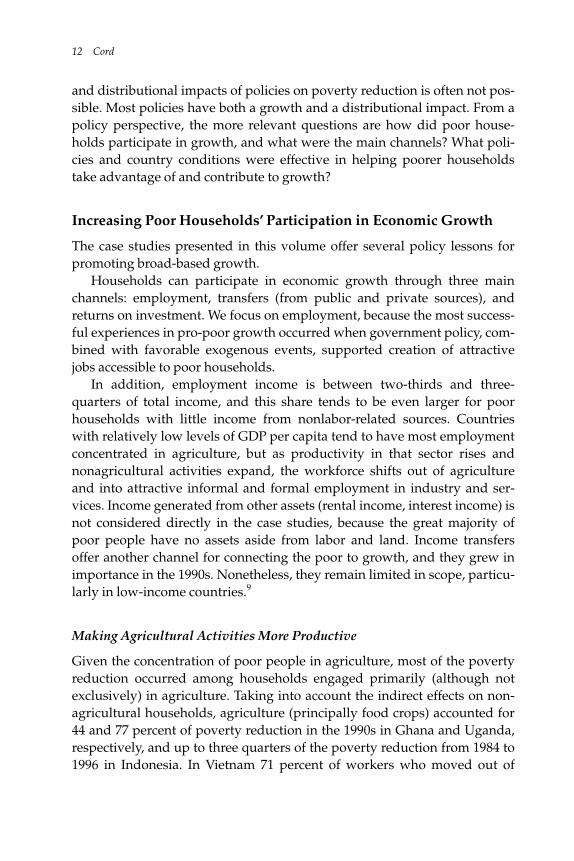
Given the concentration of poor people in agriculture, most of the povertyreduction occurred among households engaged primarily (although notexclusively) in agriculture. Taking into account the indirect effects on non-agricultural households, agriculture (principally food crops) accounted for44 and 77 percent of poverty reduction in the 1990s in Ghana and Uganda,respectively, and up to three quarters of the poverty reduction from 1984 to1996 in Indonesia. In Vietnam 71 percent of workers who moved out of
12 Cord
poverty between 1993 and 1997 either remained employed in agriculture ormoved into agricultural employment.
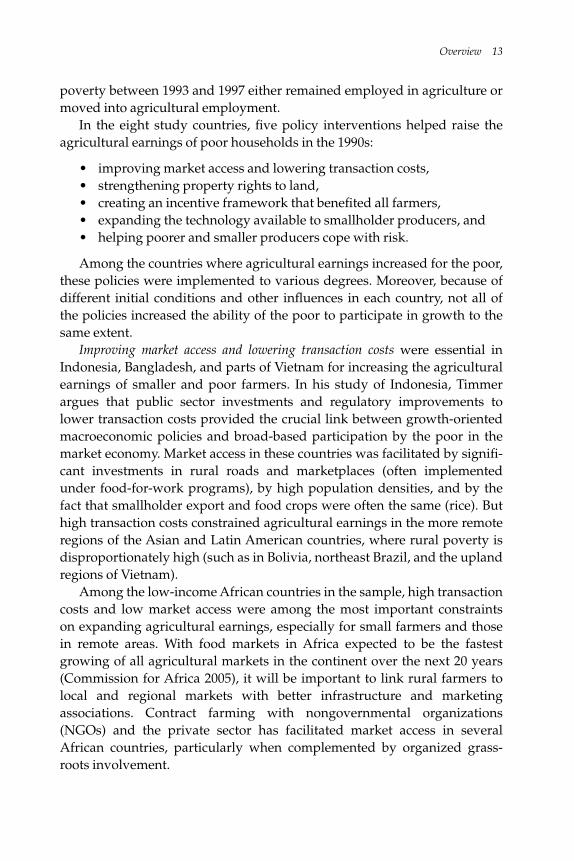
In the eight study countries, five policy interventions helped raise theagricultural earnings of poor households in the 1990s:
• improving market access and lowering transaction costs,• strengthening property rights to land,• creating an incentive framework that benefited all farmers,• expanding the technology available to smallholder producers, and• helping poorer and smaller producers cope with risk.
Among the countries where agricultural earnings increased for the poor,these policies were implemented to various degrees. Moreover, because ofdifferent initial conditions and other influences in each country, not all ofthe policies increased the ability of the poor to participate in growth to thesame extent.
Improving market access and lowering transaction costs were essential inIndonesia, Bangladesh, and parts of Vietnam for increasing the agriculturalearnings of smaller and poor farmers. In his study of Indonesia, Timmerargues that public sector investments and regulatory improvements tolower transaction costs provided the crucial link between growth-orientedmacroeconomic policies and broad-based participation by the poor in themarket economy. Market access in these countries was facilitated by signifi-cant investments in rural roads and marketplaces (often implementedunder food-for-work programs), by high population densities, and by thefact that smallholder export and food crops were often the same (rice). Buthigh transaction costs constrained agricultural earnings in the more remoteregions of the Asian and Latin American countries, where rural poverty isdisproportionately high (such as in Bolivia, northeast Brazil, and the uplandregions of Vietnam).
Among the low-income African countries in the sample, high transactioncosts and low market access were among the most important constraintson expanding agricultural earnings, especially for small farmers and thosein remote areas. With food markets in Africa expected to be the fastestgrowing of all agricultural markets in the continent over the next 20 years(Commission for Africa 2005), it will be important to link rural farmers tolocal and regional markets with better infrastructure and marketingassociations. Contract farming with nongovernmental organizations(NGOs) and the private sector has facilitated market access in severalAfrican countries, particularly when complemented by organized grass-roots involvement.
Overview 13
Strengthening land property rights improved incentives to increase pro-duction and diversify into higher-value crops in Vietnam. In 1988 land wasdecollectivized, and under the 1993 Land Law certificates of use wereissued to all rural households, stimulating the intensification and diversifi-cation of agricultural production into higher value-added crops. For thepoorer farmers in the African case studies, clear tenure and transparent landmarkets were important. Weak land market institutions—often reflectingthe partial implementation of land laws (Uganda) and rapidly changingland tenure conditions, along with uncertain land market institutions(Ghana)—were key constraints on the ability of all farmers to invest in theirland. Lack of secure tenure and of legally recognized ownership rights, par-ticularly for inheritance, negatively affected poor rural women in theAfrican countries. These women often are the primary producers of foodcrops. In Uganda, as in many African countries, improving security of landtenure for poorer farmers will require developing formal systems thatstrengthen and complement customary land practices.
In Brazil access to land is a major issue because of very unequal land dis-tributions. Large-scale land reform is not politically viable, but expandingthe access of smallholders and poorer farmers to long-term financing, and,in some cases, to grants for land purchases, has been successful. Similarly, inTunisia land access for the poor remains a critical issue as a partially imple-mented land reform has led to unequal access to both private and publicagricultural lands. In Bangladesh and India continuing restrictions on landrental markets to protect ownership rights make it difficult and costly forsmaller farmers (particularly women and the landless) to rent land. InIndonesia land rights, particularly to forests, remain fairly undefined at thelocal level. (Land records cover only 20 percent of all land in Indonesia.)Opaque and costly systems of land administration and allocation in ruralIndonesia are serious obstacles to expanding agricultural earnings, particu-larly for poorer farmers (Deininger and Zakout 2005).
Creating an incentive framework that benefited all farmers was an importantpart of the structural reforms by the African countries, Bangladesh, andVietnam. The impact has varied, depending on the size of productionunits, access to capital, technical assistance, and markets (or transactioncosts), and the crops grown. Trade liberalization, along with land reform,promoted Vietnam’s rapid emergence as a major world exporter of rice andcoffee in the 1990s, greatly benefiting smallholders. Trade liberalization inBangladesh facilitated imports of low-cost inputs, increasing their use bypoor farmers. Food crop farmers in Africa generally benefited less from trade
14 Cord
liberalization than export crop farmers, whose poverty rates fell sharply.With the exception of coffee producers in Uganda, export farmers tended tomake up a small share of the total and were mainly the better off. The privatesector often did not fill the void left by reforms in food crop marketing, leav-ing many poor producers in remote areas of Africa without market access.
Subsidies and protection in India, Indonesia, and Tunisia characterizedagricultural production, redirecting public resources and incentives fromhigher-value production toward less labor-intensive basic food grains. InIndonesia the tariff on rice imports raised prices for rice producers (many ofwhom are smallholders and poorer farmers) but hurt rice consumers andslowed poverty reduction. In India the reform of agricultural subsidies hasbeen difficult, in large part because of their political appeal and high visibil-ity (Keefer and Khemani 2003). Such reform must consider the transitioncosts to small farmers: they may receive only a small share of total subsidies,but these subsidies are a significant share of their total income. Implementa-tion of trade and price reforms more generally must reflect understandingof the reforms’ effects on different types of households. Moreover, poorerhouseholds will need roads, financial services, and marketing associationsso that they can take advantage of the new opportunities.
Expanding the technology available to smallholder producers helped theGreen Revolution raise agricultural earnings in Asia. In Indonesia GreenRevolution technology and massive investments in agriculture catalyzedhigh rates of pro-poor growth from the 1960s to the 1980s. In sub-SaharanAfrica the lack of adequate technologies for arid climates was a severe con-straint on producers, particularly those in food crops, where the poor areconcentrated. Increasing financial support to African research institutionsand improving the delivery of extension services to food crop farmers, inparticular women with private firms and NGOs, could lift agricultural earn-ings for poorer farmers.
Helping poorer and smaller producers cope with risk has stimulated adoptionof higher-yielding agricultural techniques. Investments in flood infrastruc-ture and flood season safety nets for poorer farmers (along with greateraccess to private irrigation) reduced risk and created incentives for diversifi-cation in Bangladesh. Information and communication technologies (suchas mobile phones in Uganda) can provide smallholders with market infor-mation. In general, expanding the use of targeted safety-net programs(where administrative capacity exists or can be reinforced) would helpfarmers avoid severe deprivation from output and price variations andencourage them to adopt riskier technologies that offer higher returns.
Overview 15
Taking Advantage of Nonagricultural and Urban EmploymentOpportunities
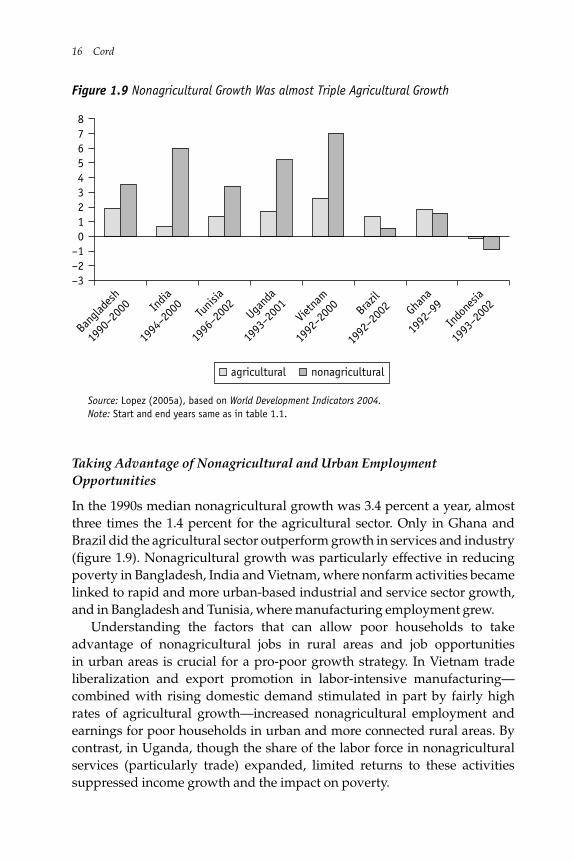
In the 1990s median nonagricultural growth was 3.4 percent a year, almostthree times the 1.4 percent for the agricultural sector. Only in Ghana andBrazil did the agricultural sector outperform growth in services and industry(figure 1.9). Nonagricultural growth was particularly effective in reducingpoverty in Bangladesh, India and Vietnam, where nonfarm activities becamelinked to rapid and more urban-based industrial and service sector growth,and in Bangladesh and Tunisia, where manufacturing employment grew.
Understanding the factors that can allow poor households to takeadvantage of nonagricultural jobs in rural areas and job opportunitiesin urban areas is crucial for a pro-poor growth strategy. In Vietnam tradeliberalization and export promotion in labor-intensive manufacturing—combined with rising domestic demand stimulated in part by fairly highrates of agricultural growth—increased nonagricultural employment andearnings for poor households in urban and more connected rural areas. Bycontrast, in Uganda, though the share of the labor force in nonagriculturalservices (particularly trade) expanded, limited returns to these activitiessuppressed income growth and the impact on poverty.
16 Cord
–3
2
65
10
4
–1–2
3
87
Bang
lades
h
1990
–200
0 India
1994
–200
0Tu
nisia
1996
–200
2Ug
anda
1993
–200
1Vie
tnam
1992
–200
0 Braz
il
1992
–200
2 Ghan
a
1992
–99
Indo
nesia
1993
–200
2
agricultural nonagricultural
Figure 1.9 Nonagricultural Growth Was almost Triple Agricultural Growth
Source: Lopez (2005a), based on World Development Indicators 2004.Note: Start and end years same as in table 1.1.
More generally, the country cases underscored four broad policy optionsto enhance access to nonagricultural earnings for poor households:
• improving the investment climate,• designing labor market regulations to create attractive employment
opportunities,• expanding access to secondary and girls’ education, and• increasing access to infrastructure.
As with policies to expand agricultural earnings for the poor, the relativepriorities and the appropriate design and scope of these policy options varyacross countries.
Improving the investment climate stimulated growth, influencing the sizeof the formal sector and the composition of formal employment. InBangladesh, Tunisia, and Vietnam investment climate improvements, tradeliberalization, and special incentives for manufacturing industries signifi-cantly increased unskilled manufacturing employment, particularly forwomen. By contrast, in Ghana, private investment remained low (under-mined in part by persistently high inflation and a poor investment climate),causing manufacturing employment to contract in the late 1990s.
Designing labor market regulations to create attractive formal employment forpoor workers helps expand their nonagricultural earnings, particularly incountries with fast growth. Labor market regulations, often designed toprotect the interests of workers, can restrict formal labor markets and themarket access of poor workers. In India states with “pro-worker” legislationrecorded lower growth rates and less efficiency in reducing poverty. By con-trast, Indonesia’s high degree of labor market flexibility during the Suhartoyears promoted formal employment and labor-intensive growth. But sincethe 1997 Asian financial crisis, minimum wage increases prompted by unionactivity have left almost all employment growth to the informal sector, atwages below those in the formal sector.
Three caveats: First, labor market regulations are only one of a set offactors that affect the investment climate and the willingness of a firm to for-malize. Other critical constraints include policy uncertainty, fiscal burdens,the cost of finance, corruption, and the quality of courts (World Bank 2005a).Second, loosening labor market regulations in some regions, particularlyAfrica, may have little impact on labor markets, especially if employment ismainly in agriculture (Uganda). Third, labor market regulations, thoughimperfect, constitute a form of social protection. The extent of labor marketregulation needs to reflect a balance between workers’ needs and employers’needs, a balance that hangs on a country’s labor market conditions and levelof development.
Overview 17
Expanding access to secondary and girls’ education is important for nonagri-cultural growth and for facilitating poor households’ participation in non-agricultural growth. In India and Brazil poor educational outcomes reducedgrowth among different states and the impact of that growth on povertyreduction. Female literacy, also important in reducing poverty, was the mostimportant determinant of interstate differences in the efficiency of nonfarmgrowth in reducing poverty in India (Ravallion and Datt 1996). In Brazil theimportance of education as a predictor of poverty has declined over time,given advances in educational levels that have occurred among the poor. Butstates that invested in college had more rapid growth, while states thatinvested in both secondary and tertiary education saw the greatest reductionsin inequality and the greatest increases in the growth elasticity of poverty.
Educational differences were associated with rising inequality inUganda: those with more education were better placed to take the moreattractive nonagricultural jobs. But access to secondary education by thepoor declined in Uganda throughout the 1990s and early 2000s, while itincreased for children in the top quintile. Because the impact of educationon household income growth is nondecreasing (Deininger and Okidi 2003),inequality in access to higher education will certainly perpetuate welfareinequality and remain a major constraint for the poor to exploit market-driven opportunities for participation in future growth.
Increasing access to infrastructure (especially the combination of roads andelectricity) and linking rural areas to small towns and urban centers, alongwith strong nonagricultural growth, contributed to rising informal sectoremployment in rural Bangladesh, India, Tunisia, and Vietnam. In contrast,the lack of infrastructure in Africa, along with low population density, con-strained access to attractive informal employment in rural areas and keptthe rural poor engaged in more traditional and lower-return nonfarm activi-ties linked to agriculture. Therefore, lifting infrastructure constraints toimprove market access, as well as increasing access to electricity and educa-tion in high-density rural areas and small towns, may raise nonagriculturalearnings for the poor. But improving access to infrastructure requires morethan expanding public investments—it also requires higher institutionalquality. Poor institutions in Uganda may have prevented improvements tothe power infrastructure (Keefer 2000).
Overarching Messages
The eight country studies provide insights on how to better integrate short-term and long-term policies to increase the impact of growth on poverty
18 Cord
reduction. Perhaps most important, policy makers who seek to accelerategrowth in the incomes of poor people and thus reduce overall poverty lev-els would be well advised to implement policies that enable their countriesto achieve a faster rate of overall growth. A successful pro-poor growthstrategy would thus need to have, at its core, measures for sustained andrapid economic growth. These measures include macroeconomic stability,well-defined property rights, trade openness, a good investment climate, anattractive incentive framework, well-functioning factor markets, and broadaccess to infrastructure and education. With the exception of Indonesia(whose 1998 financial crisis is not heavily covered in chapter 2 as it focuseson the Suharto period), the countries in this book were relatively successfulin generating growth in the 1990s. However, moving beyond the one-timegains from peace dividends, macro and trade reforms, and favorable inter-national markets to sustained productivity gains and structural shiftswithin the economy will be a challenge for some of the countries, particu-larly those in sub-Saharan Africa.
Because poverty reduction’s sensitivity to growth can vary significantlyacross countries and growth spells, more favorable outcomes are observedwhere policies have been implemented to enhance the capacity of poor peo-ple to participate in and contribute to growth. This task requires a consciousand sustained effort on the part of governments to provide the basic condi-tions necessary for broad-based growth in the regions and sectors wherethe poor live and work. This effort can mean ensuring that the incentiveframework for agriculture does not discriminate against the poor anddelivers efficient market signals; that the property rights of the poor and inparticular land rights are guaranteed and can be transacted; that basic levelsof physical and human capital are present in rural areas and urban slums tounleash private investment and facilitate access to labor, financial, andproduct markets; and that risk is maintained at acceptable levels throughinvestments in irrigation and flood infrastructure or the delivery of safetynets so as to protect basic incomes and support private investments inhigher-risk activities.
The specific strategies adopted by the eight countries differed, as did therole of exogenous forces in affecting growth and hence poverty reduction.However, some common threads emerge—in particular, the need for goodeconomic policies and political stability combined with public investmentsin physical and human capital. These ingredients—good policies, stability,and public goods—were essential in facilitating private initiatives andinvestments among the non-poor and especially the poor. Political regimesand the quality of institutions also affected outcomes, but drawing
Overview 19
conclusions about their impact on growth and poverty reduction is difficult,as many countries were innovative in overcoming their institutionalweaknesses.
The case studies suggest that pro-poor growth, even over sustained peri-ods of time, can occur in a variety of contexts, including very unfavorableinitial conditions. The experiences of Bangladesh, Indonesia, and Ugandatestify that countries can achieve high rates of growth and poverty reduc-tion even when faced with weak institutions, poor human developmentoutcomes, and weak trading links and infrastructure assets. Vietnam pro-vides an example of how a country with good initial conditions can lift itselfout of extreme poverty within two decades by adopting economic policiesthat allow exploitation of growth potential in urban and rural areas. Under-standing initial conditions and their effect on poor households’ ability tocontribute to growth requires careful examination of a country’s growthand its distributional impact and how they affect poverty.
A pro-poor growth lens involves analyzing the specific constraintsthat poor households in different countries face in participating ingrowth. Depending on country circumstances, it may be that priorityinvestments for electricity and secondary education should extend beyondthe capital city to the surrounding areas, as well as to rural areas and smalltowns. Or it may require strengthening basic property rights for poorhouseholds by helping deliver titles that build on customary tenure systemsin small towns and rural areas. Or it may require that governments facilitatenonagricultural growth through supportive infrastructure, lower transac-tions costs, and a better investment climate in both urban and rural areas.
Challenges for Further Analysis
The experience of the eight study countries in the 1990s underscores threechallenges for the countries as they seek to accelerate poverty reductionthrough broad-based growth. First, movement from agricultural to nonagri-cultural employment helped raise the incomes of poor households in manycountries, but the more educated and better-connected workers were moresuccessful in this regard. The effects of education and labor market policieson sectoral mobility and the role of limited mobility in poverty traps areimportant areas for further research.
Second, the impact of growth was uneven across regions within coun-tries. Public investment strategies that can address subregional growth andpoverty are another important area for further analysis. The findings maydiffer for low- and middle-income countries and could be particularly
20 Cord
important for countries with decentralized governments and for countriesthat face important regional disparities in growth and poverty reduction.
Third, political economy considerations often affect the distributionaloutcomes of structural and investment policies, at times at the expense ofpoor households. Public policies to enhance the ability of the poor to partici-pate in and influence government processes is another area for furtherexploration.
Structure of the Book
Chapter 2 explores how Indonesia under Suharto implemented a three-tiered strategy that combined rapid economic growth with investments andpolicies to ensure that growth would reach the poor. This strategy inte-grated the macroeconomy with the household economy by lowering thetransaction costs of operating in factor and product markets, which in turnfacilitated links between the macro and micro levels of the economy. Inaddition, public investments in human capital and flexible and well-integrated labor markets expanded poor households’ ability to contributeto growth.
Chapter 3 examines trends in growth and poverty reduction in postinde-pendence India, where states’ poverty performance depended on growthrates, policy regimes, and initial conditions. Because different states haveexperimented with different policies and have different initial conditions,India represents an ideal testing ground for use of micro and macro data toexamine the link between growth and poverty. The chapter highlightsthe importance of several institutional variables in delivering high ratesof pro-poor growth. States that had more accountable governments, more pro-business investment climates, and greater access to finance and humancapital and that extended property rights to the poor and included womenin economic growth have been more successful in reducing poverty.
Chapter 4 draws on macro and micro data to determine why growth hasbeen so effective in reducing poverty in Bangladesh at the same time thatincome inequality has risen and institutional capacity has evolved sounevenly there. Despite the bleak development prospects that characterizedBangladesh at the time of independence, poverty has fallen dramaticallysince the early 1970s. Sharply improving human development indicators,particularly in rural areas; rising participation in rural input and landmarkets; an enhanced capacity to cope with climatic instability due to invest-ments in rural infrastructure and safety nets; and rapid growth in nonagri-cultural exports explain the strong poverty reduction performance of the
Overview 21
1990s. The chapter also examines how the country was able to overcome itsgenerally weak institutional environment through ring-fencing policies andinstitutions and by drawing on nongovernmental institutions. It concludeswith an assessment of whether the rise in inequality was inevitable.
Chapter 5 explores why the growth process in Vietnam that began withthe doi moi reforms of the late 1980s has been so effective in promoting astructural transformation of the economy and shrinking poverty levels.Critical to the success of Vietnam has been the creation of attractive employ-ment opportunities accessible to low-income workers in both urban andrural areas. In the agriculture sector, workers benefited from land reformand trade liberalization and attractive world market conditions, as well asgrowing connections to urban areas. Economic and institutional reformsalso facilitated the emergence of a viable private sector that, along withrapid nonagricultural growth, generated significant formal and informalemployment in services and, more recently, industry. But despite the fall inaggregate poverty numbers, certain regions and groups continue to benefitless from economic development. Further development of a broad-baseddomestic private sector as well as public investments in improved infra-structure and a cautious strategy of local government reform are needed toaddress chronic poverty and to ensure continued broad-based growth.
The case study on Ghana in chapter 6 describes the impressive turn-around of an economy after more than 20 years of serious decline. Startingin 1984 improved policies and aid flows led to a more consistent economicframework and political stability, which along with remittances, helped cat-alyze steady growth and poverty reduction. However, strong spatial andsectoral policies influenced the distributional pattern of growth. Povertyreduction in the agriculture sector has been limited for those not engaged inexport crop production or in urban areas other than Accra. In addition,growth has been associated with limited creation of wage jobs and littledeepening of the formal sector, reflecting low private investment and a lackof basic structural change in the economy. More recently, the governmenthas shown a strong commitment to macrostability, agriculture, and privatesector development. However, making good on this commitment willrequire sustained political will as well as an effective decentralization policyto deliver critical services and goods for shared growth.
Chapter 7 examines the evolution of growth and poverty reduction inUganda since the early 1990s. Strong economic growth, induced by therestoration of political and economic stability, along with large aid flows,was effective in the early to mid-1990s in reducing both poverty andinequality. Since then, poverty levels have risen, because the incomes of
22 Cord
poor households have not responded to the continued (albeit slower)growth, leading to rising inequality. The chapter underlines several factorsthat contributed to the slower growth and rising inequality: the lack ofinvestment in and structural transformation of agriculture, low and declin-ing levels of secondary education among the poor, continued tensions innorthern Uganda (the poorest region), a nontransparent public–privatepartnership, along with a weak rural and urban investment climate. Over-all, Uganda’s experience shows that despite the existence of good policiesand programs, translation of policies into desired outcomes can be under-mined by political economy inconsistencies and institutional weaknesses,leading to economic slowdown and uneven participation in growth.
Chapter 8 explores how Tunisia achieved relatively high growth andsharply reduced poverty between 1960 and 2000 with limited initialresources and a poor natural resource endowment. Four sets of factorsplayed a particularly important role in affecting the capacity of the poor toparticipate in growth: macrostability and trade openness; integrated ruraldevelopment programs that provided the infrastructure to develop agricul-ture; promotion of labor-using industries and services, which providedattractive job opportunities and eased rural labor markets; and significantinvestment in human capital in rural and urban areas and among men andwomen. Since 2000 Tunisia has continued its strong growth and madeimprovements in social indicators. But some uncertainties related to theinstitutional environment and to future job creation (given the moderatelyhigh unemployment rate and changes in global trading arrangements) areon the horizon. These uncertainties will need to be addressed if Tunisia’spro-poor growth experience is to be sustained.
The final chapter is on Brazil, which among the countries featured in thisvolume has the highest GDP per capita and the highest income inequality.As a result of the latter, growth has not evenly benefited the poor and thenonpoor, leading to persistent high rates of poverty. The chapter exploresthe contribution of education to growth and inequality during the1980–2000 period. It concludes that investments in human capital were themost important drivers of poverty reduction, because they tended to makegrowth more pro-poor and increase the growth rate. Investments in highschool education appear to be important in increasing growth’s benefits tothe poor but do not alone improve growth prospects, whereas investmentsin college education are important determinants of growth but are less effec-tive in making growth more pro-poor. With respect to other policy vari-ables, infrastructure investments were also important for pro-poor growthand for growth itself. In recognition of the importance of education in
Overview 23
growth and reducing inequality, the government has expanded its efforts toencourage children from poorer households to attend school at the sec-ondary and tertiary levels and to improve the quality of primary education.Recent trends showing falling inequality suggest that these efforts may behaving some success.
Notes
The author gratefully acknowledges comments from Tim Besley and the Opera-tionalizing Pro-Poor Growth donor team.
1. In attempting to give analytical and operational relevance to the concept ofpro-poor growth, two broad definitions have emerged. The relative definition ofpro-poor growth requires that the income share of the poor increase (Kakwani andPernia 2000; White and Anderson 2001). This definition might favor interventionsthat reduce inequality regardless of their impact on growth. The absolute definitionof pro-poor growth focuses on accelerating the rate of income growth of the poorand thus the rate of poverty reduction (DFID 2004; Ravallion 2004; Ravallion andChen 2003). This approach would favor policies that accelerate growth and opportu-nities for the poor to participate in growth and is consistent with the broad definitionof equality of opportunity contained in World Development Report 2006: Equity andDevelopment (World Bank 2005b) and with the international community’s commit-ment to the first Millennium Development Goal of halving poverty by 2015.
2. The country studies track the evolution of poverty during the early 1990s andlate 1990s to early 2000s using national poverty lines, which do not permit cross-country comparisons of poverty levels.
3. Lopez (2005b) examines the impact of macro reforms on growth and variousmacro aggregates. He finds that the macrostability brought about by the reforms hadpayoffs in higher economic growth (particularly for the nonagricultural sector),reduced output volatility, and generally higher investment levels (including foreigndirect investment, remittances, and aid, particularly for countries initially underper-forming within their regions, such as Uganda and Ghana).
4. Numbers in parentheses provide standard errors.
5. There is significant noise in the measurement of both GDP and household con-sumption, and GDP trends also reflect other variables not necessarily captured byhousehold consumption data (investment, government spending, net exports).
6. The growth elasticity of poverty can also vary depending on how the popula-tion is clustered around the poverty line and as a result of country-specific measure-ment issues with the national accounts and with the consumption aggregate used tomeasure poverty trends. Consequently, comparing the overall efficiency of the growthprocess in reducing poverty across the eight countries was not possible.
7. Several theoretical papers conclude that inequality is detrimental to growth.They argue that redistributive policies, sociopolitical instability, and credit constraints
24 Cord
(particularly for poor households) are associated with high levels of inequality and arebad for growth (Aghion, Caroli, and Garcia-Peñalosa 1999; Alesina and Perotti 1996;Alesina and Rodrik 1994; Galor and Zeira 1993). Other models predict that inequality islikely to enhance growth by drawing on the greater ability and propensity of rich peo-ple to invest and the need for unequal wage structures to provide incentives for out-standing achievement (Mirrlees 1971). Although the empirical literature has found noconsistent relationship between changes in growth and income inequality, there issome evidence that asset inequality is detrimental to growth (Deininger and Olinto2000; Birdsall and Londoño 1997).
8. His sample included 23 countries in the 1970s, 42 in the 1980s, and 21 in the1990s.
9. Although safety nets and conditional cash transfers were effective in improv-ing the welfare of recipients in Bangladesh and Brazil, only in middle-income Brazilwas the scope of the transfers sufficiently large to make a dent on poverty andinequality levels. Remittances were associated with poverty reduction inBangladesh, Vietnam, and Tunisia. In Bangladesh and Ghana, but not Tunisia, theywere also associated with rising inequality.
References
Aghion, P., E. Caroli, and C. Garcia-Peñalosa. 1999. “Inequality and EconomicGrowth: The Perspective of the New Growth Theories.” Journal of EconomicLiterature 37 (4): 1615–60.
Alesina, A., and R. Perotti. 1996. “Income Distribution, Political Instability, andInvestment.” European Economic Review 40 (6): 1203–28.
Alesina, A., and D. Rodrik. 1994. “Distributive Politics and Economic Growth.”Quarterly Journal of Economics 109 (2): 465–90.
Birdsall, N., and J. L. Londoño. 1997. “Asset Inequality Matters: An Assessment ofthe World Bank’s Approach to Poverty Reduction.” American Economic ReviewPapers and Proceedings 87 (2): 32–37.
Bourguignon, F. 2004. “The Poverty-Growth-Inequality Triangle.” Paper presentedat the Indian Council for Research on International Economic Relations, NewDelhi, February 4.
Commission for Africa. 2005. Our Common Interest. Report of the Commission forAfrica. London: Penguin.
Deininger, K., and J. Okidi. 2003. “Growth and Poverty Reduction in Uganda,1992–2000: Panel Data Evidence.” Development Policy Review 21 (4): 481–509.
Deininger, K., and P. Olinto. 2000. “Asset Distribution, Inequality, and Growth.”Policy Research Working Paper 2375, World Bank, Washington, DC.
Deininger, K., and L. Squire. 1998. “New Ways of Looking at Old Issues: Inequalityand Growth.” Journal of Development Economics 57: 259–87.
Overview 25
Deininger, K., and W. Zakout. 2005. “Land Policy, Management, and Administra-tion.” Indonesia Policy Briefs, World Bank, Washington, DC.
DFID (U.K. Department for International Development). 2004. “What Is Pro-PoorGrowth and Why Do We Need to Know?” Pro-Poor Growth Briefing Note 1,Policy Division, DFID, London.
Dollar, D., and A. Kraay. 2002. “Growth Is Good for the Poor.” Journal of EconomicGrowth 7: 195–225.
Foster, J., and M. Székely. 2001. “Is Economic Growth Good for the Poor? TrackingLow Incomes Using General Means.” Research Department Working Paper 453,Inter-American Development Bank, Washington, DC.
Galor, O., and J. Zeira. 1993. “Income Distribution and Macroeconomics.” Review ofEconomic Studies 60 (1): 35–52.
Kakwani, N., and E. Pernia. 2000. “What Is Pro-Poor Growth?” Asian DevelopmentReview 18: 1–16.
Keefer, P. 2000. “Growth and Poverty Reduction in Uganda: The Role of InstitutionalReform.” Working paper, World Bank, Washington, DC.
Keefer, P., and S. Khemani. 2003. “Democracy, Public Expenditure, and the Poor.”Policy Research Working Paper 3164, World Bank, Washington, DC.
Kraay, A. 2006. “When Is Growth Pro-Poor? Evidence from a Panel of Countries.”Journal of Development Economics 80 (1): 198–227, June.
Lopez, H. 2005a. “Growth and Inequality: Are They Connected?” Working paper,World Bank, Washington, DC.
. 2005b. “Pro-Poor Growth: How Important Is Macroeconomic Stability?”Working paper, World Bank, Washington, DC.
Mastruzzi, M., A. Kraay, and D. Kaufmann. 2005. “Governance Matters: GovernanceIndicators for 1996–2000.” Policy Research Working Paper 3630, World Bank,Washington, DC.
Mirrlees, J. 1971. “An Exploration in the Theory of Optimum Income Taxation.”Review of Economic Studies 38: 175–208.
Ravallion, M. 1997. “Can High-Inequality Developing Countries Escape AbsolutePoverty?” Economics Letters 56: 51–57.
. 2004. “Pro-Poor Growth: A Primer.” Policy Research Working Paper 3242,World Bank, Washington, DC.
. 2005. “A Poverty-Inequality Trade-Off.” Journal of Economic Inequality 3 (2):169–81.
Ravallion, M., and S. Chen. 1997. “What Can New Survey Data Tell Us about RecentChanges in Distribution and Poverty?” World Bank Economic Review 11 (2):357–82.
26 Cord
. 2003. “Measuring Pro-Poor Growth.” Economics Letters 78 (1): 93–99.
Ravallion, M., and G. Datt. 1996. “How Important to India’s Poor Is the SectoralComposition of Economic Growth?” World Bank Economic Review 10: 1–26.
White, H., and A. Anderson. 2001. “Growth vs. Redistribution: Does the Pattern ofGrowth Matter?” Development Policy Review 19 (3): 167–289.
World Bank. 1993. The East Asian Miracle: Economic Growth and Public Policy. NewYork: Oxford University Press.
. 2004. World Development Indicators 2004. Washington, DC: World Bank.
. 2005a. A Better Investment Climate for Everyone. Washington, DC: WorldBank.
. 2005b. World Development Report 2006: Equity and Development. Washington,DC, and Oxford: World Bank and Oxford University Press.
Overview 27

2How Indonesia Connected the Poorto Rapid Economic Growth
C. Peter Timmer
Economic growth has been the main source of sustained poverty reductionin Indonesia. Income equality increased during some growth episodes anddecreased during others. Indonesia has experienced both “relative” and“absolute” pro-poor growth. The poor were never absolutely worse off dur-ing sustained periods of economic growth. During economic decline andcrises, the impact on the poor has been severe.
Indonesia’s pro-poor performance from the late 1960s to the mid-1990swas based on a conscious strategy that combined rapid economic growthwith investments and policies that ensured the growth would reach thepoor. This strategy integrated the macroeconomy with the household econ-omy by lowering the transaction costs of operating in the factor and productmarkets, which provide links between the two levels of the overall economy.This strategy was designed and implemented by highly skilled economicplanners (the “technocrats”) at the urging of President Suharto.
The success of the strategy depended partly on good luck, as highly pro-ductive new agricultural technology became available in the late 1960s, justas the country was implementing its economic strategy and rural invest-ments. In the 1980s foreign direct investment (FDI) arrived from northeastAsia, just as Indonesia needed to restructure its manufacturing sector to bemore labor intensive and export oriented.
Bad luck has also been important. The drought that struck the country in1997 was the worst in a century; the Asian financial crisis caught Indonesiaparticularly ill-equipped to fix rapidly its badly flawed system of corporate
29
governance; and the collapse of the Suharto regime in 1998 left no politicalinstitutions in place for efficient public governance. The transition todemocracy has been rapid, but economic growth has not returned to previ-ous high levels.
Long-term overall distribution of household expenditures in Indonesiahas changed relatively little; the average Gini coefficient is about 0.33 (com-pared with about 0.32 for India, 0.45 for the Philippines and Thailand, and0.50 for Malaysia). The Gini does change somewhat during short periods,reflecting changes in variables that affect how well the poor connect to eco-nomic growth. This short-run variance in the growth elasticity of poverty iscaused mostly by changes in real rice prices, but these changes are largelydriven by macroeconomic policy, especially control of inflation and man-agement of the real exchange rate, and by rice import policy. Over the longrun, the income growth of the poor has depended almost entirely on overallincome growth.
The interaction between macroeconomic policy and poverty reduction isespecially important in Indonesia because of the relatively smooth interfacebetween the tradable and nontradable sectors (and between the formal andinformal economies). Rapidly rising demand for the goods and servicesproduced by the nontradable, informal sector, especially in rural areas, hasbeen an important short-run mechanism for pulling people out of poverty.The close integration of rural and urban labor markets, facilitated by ruralfinancial market intermediation, especially on Java, has made economicgrowth pro-poor.
Investments in agricultural infrastructure have also had a major impact.When productivity-enhancing agricultural technology was available andprofitable—from the late 1960s through the mid-1980s—growth could be“strongly” pro-poor (rapid growth with improving income distribution).Much of the rural infrastructure was built using labor-intensive techniques.The jobs created were “self-targeted” to the poor because of the low wagespaid, a conscious government policy. Thus investments in rural infrastruc-ture were doubly pro-poor.
Financing for these projects came mostly from the central government,whose budget until the early 1980s depended heavily on two sources of rev-enue: donor funding in the early years (especially from the World Bank) andoil revenues after the mid-1970s. The 1970s saw the most massive ruralinvestments, and these provided the foundation for broadly based ruraldevelopment. But large oil revenues also caused “Dutch Disease” in themid-1970s, which in Indonesia’s case was especially anti-poor. At the time,the poor depended heavily on tradable agriculture as the driver of income
30 Timmer
How Indonesia Connected the Poor to Rapid Economic Growth 31
growth in the rural economy. Only the preemptive devaluation in Novem-ber 1978 put the economy back on a path of pro-poor growth.
“Pro-poor” public expenditures and targeted subsidies to the poorhave played a minor role in poverty reduction in Indonesia. Only thelabor-intensive public works programs might claim to be sufficiently large,well targeted to the poor, and productive in the creation of rural infra-structure to have linked public expenditures to poverty reduction and pro-poor economic growth. The direct impact of public expenditures onpoverty reduction has been very limited, both because of small sums andpoor targeting.
The political economy of pro-poor growth is now complicated by thetransition to democracy and the absence of effective institutions to insulateeconomic policy making from populist rhetoric. The country has beenthrough massive upheavals since 1998, including decentralization of politi-cal and economic authority to the district level in 2001. Nonetheless, thecountry has survived and even recovered economic growth at a modestpace. But effective leadership will be needed to reestablish rapid growthand a strong connection to the poor.
Indonesia’s Pro-Poor Growth in Historical Perspective
Indonesia has long been a laboratory for understanding the long-run inter-actions among markets, politics, and institutions in determining the rate ofpoverty reduction (Boeke 1946). First, market-driven processes determinethe proximate distribution of consumption-based equity. Next, politicalprocesses, and the engagement of the poor in these processes, determine thepolicy framework in which all markets work. Finally, institutions dominatein determining the long-run conditions of governance in which both mar-kets and politics operate. Long periods are needed to observe and identifythese complex interactions, especially because sustained economic growthis the main vehicle for poverty reduction.
Indonesia has experimented with all three of the basic poverty reductionapproaches. Under President Sukarno, most attention was on redistributivemeasures, including efforts at a systematic land reform in 1960. After 1967,the focus shifted under the “New Order” regime of President Suharto toactive implementation of pro-poor growth strategies because, in the famouswords of one of the economic technocrats who came to power in the late1960s, “There is nothing to re-distribute; we have to make the pie bigger.”Under the democratic governments in power since 1999, most of the effortto help the poor has been through direct fiscal transfers involving loosely
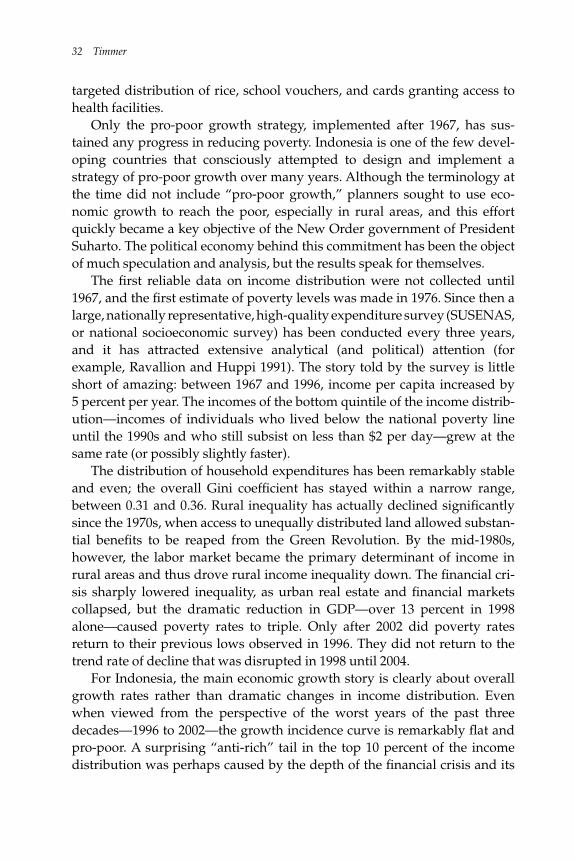
targeted distribution of rice, school vouchers, and cards granting access tohealth facilities.
Only the pro-poor growth strategy, implemented after 1967, has sus-tained any progress in reducing poverty. Indonesia is one of the few devel-oping countries that consciously attempted to design and implement astrategy of pro-poor growth over many years. Although the terminology atthe time did not include “pro-poor growth,” planners sought to use eco-nomic growth to reach the poor, especially in rural areas, and this effortquickly became a key objective of the New Order government of PresidentSuharto. The political economy behind this commitment has been the objectof much speculation and analysis, but the results speak for themselves.
The first reliable data on income distribution were not collected until1967, and the first estimate of poverty levels was made in 1976. Since then alarge, nationally representative, high-quality expenditure survey (SUSENAS,or national socioeconomic survey) has been conducted every three years,and it has attracted extensive analytical (and political) attention (forexample, Ravallion and Huppi 1991). The story told by the survey is littleshort of amazing: between 1967 and 1996, income per capita increased by5 percent per year. The incomes of the bottom quintile of the income distrib-ution—incomes of individuals who lived below the national poverty lineuntil the 1990s and who still subsist on less than $2 per day—grew at thesame rate (or possibly slightly faster).
The distribution of household expenditures has been remarkably stableand even; the overall Gini coefficient has stayed within a narrow range,between 0.31 and 0.36. Rural inequality has actually declined significantlysince the 1970s, when access to unequally distributed land allowed substan-tial benefits to be reaped from the Green Revolution. By the mid-1980s,however, the labor market became the primary determinant of income inrural areas and thus drove rural income inequality down. The financial cri-sis sharply lowered inequality, as urban real estate and financial marketscollapsed, but the dramatic reduction in GDP—over 13 percent in 1998alone—caused poverty rates to triple. Only after 2002 did poverty ratesreturn to their previous lows observed in 1996. They did not return to thetrend rate of decline that was disrupted in 1998 until 2004.
For Indonesia, the main economic growth story is clearly about overallgrowth rates rather than dramatic changes in income distribution. Evenwhen viewed from the perspective of the worst years of the past threedecades—1996 to 2002—the growth incidence curve is remarkably flat andpro-poor. A surprising “anti-rich” tail in the top 10 percent of the incomedistribution was perhaps caused by the depth of the financial crisis and its
32 Timmer
How Indonesia Connected the Poor to Rapid Economic Growth 33
lasting effect on the portfolios of the wealthy. But overall, even during thesedifficult years, the poor have done quite well in terms of protecting theirreal incomes (see figure 2.1).
But focusing analysis solely on growth would miss two important partsof the story. First, short-term episodes of significant income distributionchange have occurred (see figure 2.2). Second, the relatively stable long-run
annu
al p
er c
apit
a gr
owth
rat
e in
cons
umpt
ion
–2
–1
0
1
population percentiles
Figure 2.1 Indonesia’s Growth Incidence Curve, 1996–2002
Source: Alatas, Arulpragasam, and McCulloch 2004.Note: For further growth curves and calculations of pro-poor growth for subperiods, see annex 4 of
the full country study (Timmer 2005b).
annu
al g
row
th, in
com
e of
bot
tom
quin
tile
–0.05
annual growth, average income
0
0.05
0.10
0.10.050–0.05
1996–99
1967–76 1993–961981–84
1990–93 1984–87
1999–2002
1976–81
1987–90
Figure 2.2 Income Growth for Bottom Quintile Plotted against Growth for AveragePer Capita Incomes, Indonesia, 1967–2002
Source: Timmer 2004.
distributional outcome is arguably a result of conscious efforts by policymakers to correct for any tendencies of distribution to worsen significantly(Afiff 2004; Prawiro 1998). If so, the mechanisms that generate stability ofincome distribution are just as interesting for pro-poor growth strategies aswould be the mechanisms that lead to rapid changes in distribution.
Indonesia’s experience with pro-poor growth was very much the out-growth of conscious policy attention to achieving precisely such growth.The task was extraordinarily difficult, as it began in 1967 with a wreckedeconomy, hyperinflation, an absence of effective political or legal institu-tions, and a hostile regional environment dominated by the war in Vietnam:
. . . Indonesia’s record may have wider lessons. Most obviously, it shows what can beachieved despite unfavorable initial conditions, some weak institutions, and flawedmicroeconomic policies. Given that the country grew rapidly for three decades, so thatper capital GDP rose more than fourfold, it is clear that the necessary conditions forsuccessful economic development are not quite as demanding as often suggested.(Temple 2001)
The weak starting conditions significantly influenced how economic plan-ners approached the task of linking growth to the poor. In retrospect, itappears that they designed a three-tiered strategy for pro-poor growth thatlinked sound macroeconomic policy to market activities that were facili-tated by progressively lower transactions costs, which in turn were linkedto household decisions about labor supply, agricultural production, andinvestment in the nontradable economy (see figure 2.3). The rate of povertyreduction driven by this strategy then depended on the pace of growth inGDP, which was a function of macroeconomic policy (and the external envi-ronment), and on the extent to which poor households were connected tothis growth.
That connection depended on the array of assets controlled by the poor:their labor, human capital, social capital, and other forms of capital, includ-ing access to credit. Those dimensions could also be influenced by appropri-ate government policies, especially in health and education, which fosteredhuman capital investments by the poor. Thus the “road to pro-poor growth”started from desperately poor economic conditions, weak institutions, and adecade of political instability. It seemed that everything needed to be doneat once. The key was to focus on restarting and then sustaining rapid eco-nomic growth, empowering poor households to enter the market economy,and reducing the costs and risks of doing so by investments to lower trans-actions costs. If all this appears obvious now, it was not so at the time (IBRD1968; Prawiro 1998; Thee 2003). Perhaps more to the point, the issue was notwhat to do but how to do it. The historical record provides important guide-lines for implementing a pro-poor growth strategy.
34 Timmer
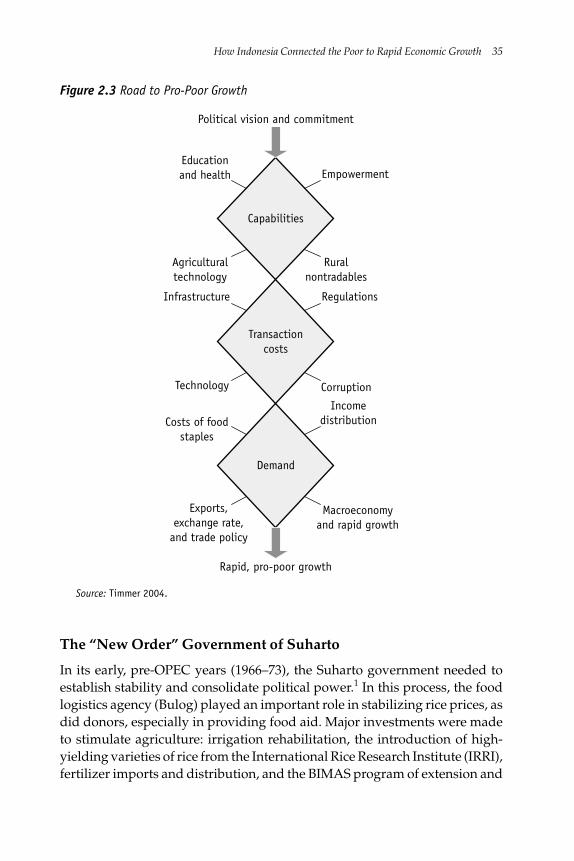
How Indonesia Connected the Poor to Rapid Economic Growth 35
Political vision and commitment
Educationand health Empowerment
Capabilities
Agriculturaltechnology
Ruralnontradables
Infrastructure Regulations
Transactioncosts
Technology Corruption
Costs of foodstaples
Incomedistribution
Demand
Exports,exchange rate,
and trade policy
Macroeconomyand rapid growth
Rapid, pro-poor growth
Figure 2.3 Road to Pro-Poor Growth
The “New Order” Government of Suharto
In its early, pre-OPEC years (1966–73), the Suharto government needed toestablish stability and consolidate political power.1 In this process, the foodlogistics agency (Bulog) played an important role in stabilizing rice prices, asdid donors, especially in providing food aid. Major investments were madeto stimulate agriculture: irrigation rehabilitation, the introduction of high-yielding varieties of rice from the International Rice Research Institute (IRRI),fertilizer imports and distribution, and the BIMAS program of extension and
Source: Timmer 2004.
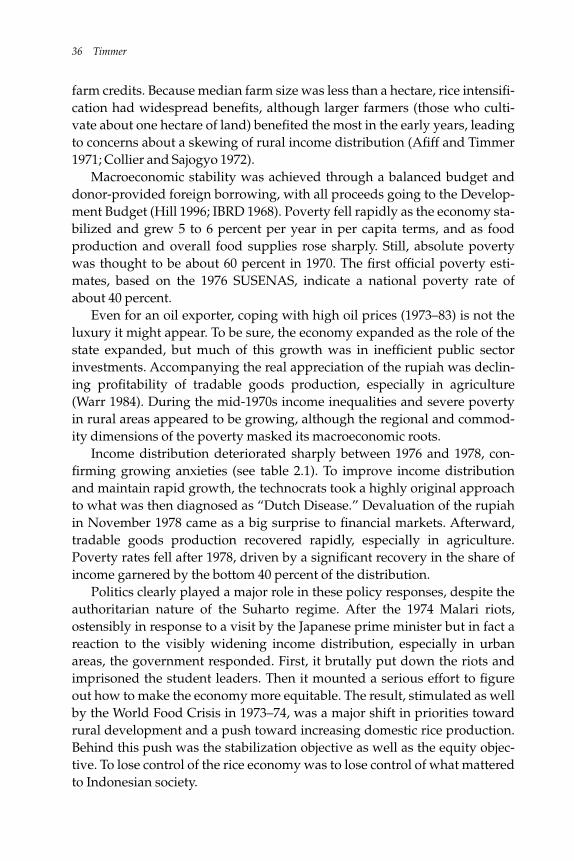
farm credits. Because median farm size was less than a hectare, rice intensifi-cation had widespread benefits, although larger farmers (those who culti-vate about one hectare of land) benefited the most in the early years, leadingto concerns about a skewing of rural income distribution (Afiff and Timmer1971; Collier and Sajogyo 1972).
Macroeconomic stability was achieved through a balanced budget anddonor-provided foreign borrowing, with all proceeds going to the Develop-ment Budget (Hill 1996; IBRD 1968). Poverty fell rapidly as the economy sta-bilized and grew 5 to 6 percent per year in per capita terms, and as foodproduction and overall food supplies rose sharply. Still, absolute povertywas thought to be about 60 percent in 1970. The first official poverty esti-mates, based on the 1976 SUSENAS, indicate a national poverty rate ofabout 40 percent.
Even for an oil exporter, coping with high oil prices (1973–83) is not theluxury it might appear. To be sure, the economy expanded as the role of thestate expanded, but much of this growth was in inefficient public sectorinvestments. Accompanying the real appreciation of the rupiah was declin-ing profitability of tradable goods production, especially in agriculture(Warr 1984). During the mid-1970s income inequalities and severe povertyin rural areas appeared to be growing, although the regional and commod-ity dimensions of the poverty masked its macroeconomic roots.
Income distribution deteriorated sharply between 1976 and 1978, con-firming growing anxieties (see table 2.1). To improve income distributionand maintain rapid growth, the technocrats took a highly original approachto what was then diagnosed as “Dutch Disease.” Devaluation of the rupiahin November 1978 came as a big surprise to financial markets. Afterward,tradable goods production recovered rapidly, especially in agriculture.Poverty rates fell after 1978, driven by a significant recovery in the share ofincome garnered by the bottom 40 percent of the distribution.
Politics clearly played a major role in these policy responses, despite theauthoritarian nature of the Suharto regime. After the 1974 Malari riots,ostensibly in response to a visit by the Japanese prime minister but in fact areaction to the visibly widening income distribution, especially in urbanareas, the government responded. First, it brutally put down the riots andimprisoned the student leaders. Then it mounted a serious effort to figureout how to make the economy more equitable. The result, stimulated as wellby the World Food Crisis in 1973–74, was a major shift in priorities towardrural development and a push toward increasing domestic rice production.Behind this push was the stabilization objective as well as the equity objec-tive. To lose control of the rice economy was to lose control of what matteredto Indonesian society.
36 Timmer
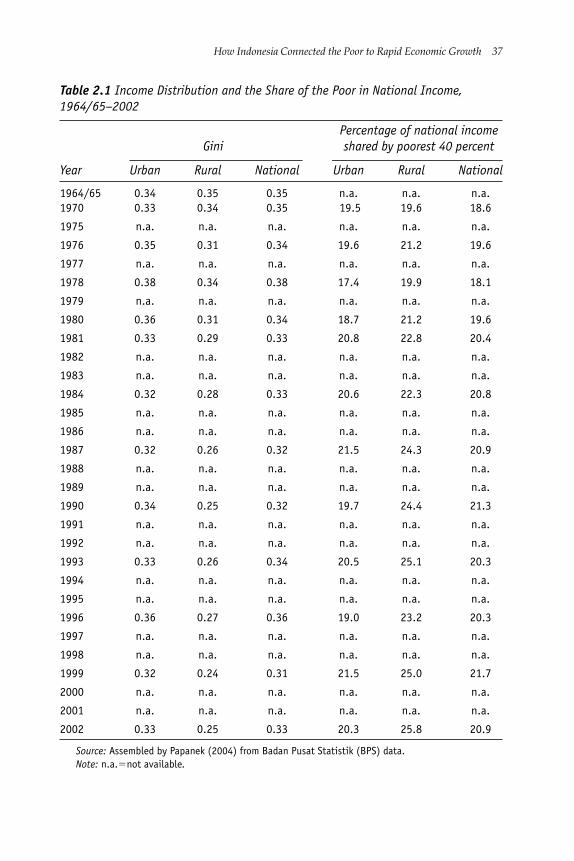
How Indonesia Connected the Poor to Rapid Economic Growth 37
Table 2.1 Income Distribution and the Share of the Poor in National Income,1964/65–2002
Percentage of national income Gini shared by poorest 40 percent
Year Urban Rural National Urban Rural National
1964/65 0.34 0.35 0.35 n.a. n.a. n.a.1970 0.33 0.34 0.35 19.5 19.6 18.6
1975 n.a. n.a. n.a. n.a. n.a. n.a.
1976 0.35 0.31 0.34 19.6 21.2 19.6
1977 n.a. n.a. n.a. n.a. n.a. n.a.
1978 0.38 0.34 0.38 17.4 19.9 18.1
1979 n.a. n.a. n.a. n.a. n.a. n.a.
1980 0.36 0.31 0.34 18.7 21.2 19.6
1981 0.33 0.29 0.33 20.8 22.8 20.4
1982 n.a. n.a. n.a. n.a. n.a. n.a.
1983 n.a. n.a. n.a. n.a. n.a. n.a.
1984 0.32 0.28 0.33 20.6 22.3 20.8
1985 n.a. n.a. n.a. n.a. n.a. n.a.
1986 n.a. n.a. n.a. n.a. n.a. n.a.
1987 0.32 0.26 0.32 21.5 24.3 20.9
1988 n.a. n.a. n.a. n.a. n.a. n.a.
1989 n.a. n.a. n.a. n.a. n.a. n.a.
1990 0.34 0.25 0.32 19.7 24.4 21.3
1991 n.a. n.a. n.a. n.a. n.a. n.a.
1992 n.a. n.a. n.a. n.a. n.a. n.a.
1993 0.33 0.26 0.34 20.5 25.1 20.3
1994 n.a. n.a. n.a. n.a. n.a. n.a.
1995 n.a. n.a. n.a. n.a. n.a. n.a.
1996 0.36 0.27 0.36 19.0 23.2 20.3
1997 n.a. n.a. n.a. n.a. n.a. n.a.
1998 n.a. n.a. n.a. n.a. n.a. n.a.
1999 0.32 0.24 0.31 21.5 25.0 21.7
2000 n.a. n.a. n.a. n.a. n.a. n.a.
2001 n.a. n.a. n.a. n.a. n.a. n.a.
2002 0.33 0.25 0.33 20.3 25.8 20.9
Source: Assembled by Papanek (2004) from Badan Pusat Statistik (BPS) data.Note: n.a.�not available.
The restructuring of Indonesia’s development approach after 1974, andespecially the preemptive devaluation of the rupiah in 1978, signaled thegovernment’s determination to include the poor in the developmentprocess. The stability of the Gini coefficient seen from the late 1960s to thepresent should not be taken as the result of market-driven forces in the faceof given technology, but rather as a conscious government effort, led fromthe macroeconomic arena by the technocrats but blessed by the president, tostimulate what is now called pro-poor growth (Timmer 2004).
By the early 1980s the oil boom was over. Restructuring of the economyin response to low commodity prices in world markets became necessaryfrom 1983 to 1993. Agriculture continued to grow, and rice prices were sta-ble (this stability amounted to protection against the low prices in worldmarkets). The government pursued aggressive exchange rate protectionthrough further rupiah devaluations in 1983 and 1986 (Hill 1996; Thorbecke
38 Timmer
Table 2.2 Percentage of Employment by Major Sector, Urban and Rural Areas, Formaland Informal Sectors, Indonesia, 1986–2004
Distribution Growth rates
1986/87–1996/97–1999/00–1986/87 1996/97 1999/00 2003/04 1996/97 1999/00 2003/04
All sectors
Agriculture 55 43 44 45 −0.4 2.3 1.5
Manufacturing 8 13 13 13 6.5 1.8 −0.7
Other 37 45 43 42 4.2 −0.3 1.2
Total 100 100 100 100 2.2 1.1 1.1
Nonagricultural
Urban 42 53 59 64 7.0 3.9 2.2
Rural: nonfarm 58 47 41 36 2.5 −4.6 −1.5
100 100 100 100 4.6 0.2 0.8
Wage 46 50 48 44 5.5 −1.0 −1.5
Nonwage 54 50 52 56 3.9 1.3 2.8
100 100 100 100 4.6 0.2 0.8
Total employment (000) 69.370 86.376 89.321 93.266
Source: Adapted from Alisjahbana and Manning forthcoming.
1995). Massive investments in rural infrastructure from earlier oil revenuesbegan to pay off in higher production and in lower transactions costs formarketed goods (and improved labor mobility). Industrial output, led bylabor-intensive manufactured exports, surged in the latter part of theperiod.
The manufacturing sector contributed 29.2 percent of the growth in GDPbetween 1987 and 1992, a radical increase from the 10 percent contributedduring the recovery from 1967 to 1973, and most of this increase camefrom labor-intensive subsectors such as shoes, garments, and electronicsassembly (Hill 1996). Large-scale and sustained economic deregulation ledto better incentives for exports, and these incentives were matched by incen-tives for FDI. Manufactured exports responded even faster than policy mak-ers had hoped and contributed almost half of all exports by 1992, updramatically from the 3 percent in 1980. The fortuitous “push” in FDI fromJapan and the “pull” from the attractive climate in Indonesia thus allowedmanufactured exports to play a significant role in employment generationby the end of the 1980s.
Importance of the Nontradable Economy
The nontradable economy, which is not directly reflected in national incomeaccounts, also experienced a boom. When the export economy was flourish-ing in the late 1980s and early 1990s, and overall GDP was growing bynearly 7 percent per year, roughly half of that growth was made up of non-tradable goods and services. According to the Mellor model of povertyreduction (Mellor 2000), production of nontradable goods and services,especially in rural areas, provides the economic link between higherincomes from both agriculture and manufacturing wages, and pulls peopleout of underemployment in rural areas—and out of poverty.
The Mellor model stresses the role of producing rural nontradables thatare locally consumed—processed foods, construction, trade, and small-scalemanufactures—as the “ladder” for underemployed workers in agricultureto begin the climb to modern jobs at higher wages. In most poor, ruraleconomies this nontradable sector is demand constrained. That is, expand-ing the sector, and the number of jobs it creates, does not depend on betteraccess to capital or to management skills, but on greater purchasing poweramong local consumers. Thus Mellor emphasizes rising profitability ofagriculture—through higher productivity, not higher prices. Higher pricesfor agricultural output, especially food, do not contribute much to addeddemand for nontradable goods and services because the higher prices
How Indonesia Connected the Poor to Rapid Economic Growth 39
choke off demand for nonfood items except from farmers with significantsurpluses to sell. The growing wages of workers in a rapidly expandingmanufacturing export sector also contribute to higher demand for the out-put from the nontradables sector (if the wages are not all spent on imports).
This Mellor model is basically a three-sector version of the standardLewis model of the dual economy. In Mellor’s version there are two“commercial” sectors—industry and agriculture. The latter has come to usemodern technology and is market driven, a departure from the traditionalrural economy envisioned by Lewis (1954). Relatively separate from thecommercial sectors is the “nontradable” sector, which is informal and mostlyrural. The two commercial sectors are the “engines of growth” because oftheir potential for rapid productivity gains. Connecting them to the “non-tradable” sector, however, is the key to a high “elasticity of connection”between overall economic growth and rapid poverty reduction. This sectoris the one in which most of the poor make a living (Timmer 1997, 2002).Unless demand from rising incomes in the commercial sectors spills over tothis nontradables sector, the poor tend to be left out of the growth process.
The combined boom in agriculture, manufacturing, and nontradablesmeant the period from the late 1970s to the mid-1990s was one of the most“pro-poor growth” episodes in modern economic history. This result is asurprise to many. The extensive economic restructuring that took place inthe 1980s was expected to create widespread unemployment and lead tolower wages for unskilled labor.2 Instead, agricultural growth continued,labor-intensive exports surged, and poverty continued to decline through-out the period of restructuring (Ravallion and Huppi 1991).3
End of the Run of Pro-Poor Growth
Corruption and increasing distortions in resource allocation from 1993 to1998 followed the interests of the Suharto family, especially the children(and grandchildren). These interests distorted trade policy and public sectorinvestments and had visible effects on competitiveness, which were partlymasked by the inflow of FDI (Cole and Slade 1996). As the economyboomed, deregulation lost steam, first in the Bulog commodities, then morebroadly. Productivity growth in the overall economy rapidly deteriorated.4
The three decades of superb economic results were over. The Asianfinancial crisis hit in late 1997. Investors started to lose confidence in theability of the Suharto government to cope, especially after the new cabinet,packed with Suharto cronies and relatives, was named in April 1998. Thecrisis caused a massive depreciation of the rupiah, which eventually led to
40 Timmer
chaos in the domestic rice market (Schydlowsky 2000). Spiraling rice priceslate in 1998 led to huge increases in poverty, which is estimated to havereached over 30 percent of the population by the peak in late 1998 or early1999. Thus began a dismal period for economic growth and poverty reduc-tion (see figure 2.2).
When the Asian financial crisis hit in 1997 and President Suharto wasforced to resign in 1998 in the face of widespread rioting, the country wasentirely unprepared in either political or institutional terms to cope with therapid changes needed in corporate and public governance. Four presidentslater, the country appears to be resolutely embarked on a democratic politi-cal path. In 2004 Indonesia held its first direct presidential election, whichresulted in the largest one-day voter turnout in world history. The currentpresident (Susilo Bambang Yudhoyono) was inaugurated in October 2004.
Representative democracy has brought a new political economy of eco-nomic policy. Populist voices ostensibly speak on behalf of the poor. Animportant test is under way to determine whether Indonesia’s pro-poorgrowth experience under a highly centralized and politically dominantregime put down sustainable, even irreversible, roots, or whether the veryfoundations of the strategy will come undone under political challenge(MacIntyre 2001).
Why Economic Growth in Indonesia Has Been So Pro-Poor
From a policy perspective, Indonesia’s pro-poor growth record after the late1960s presents two puzzles. First, what measures turned around the overallrate of growth after the Suharto regime took power? Second, in view of theinitial equitable distribution of income (almost inevitable because nearlyeveryone was desperately poor), how did policy makers ensure that thepoor were connected to this growth and that income distribution did notdeteriorate significantly?
Agriculture specifically, and the rural economy more broadly, play akey role in answering both questions. The availability of new seed technol-ogy from IRRI sharply raised the potential productivity of Indonesia’s mil-lions of small-scale rice farmers. The initial spurt of growth after 1967 wasled by agriculture. This growth was especially pro-poor, because food sup-plies increased significantly and with income growth widely distributed,food intake also rose sharply, raising millions above the poverty line(defined in terms of food energy intake) in just a few years. The rural econ-omy continued to play an equalizing role even when it was no longer themain source of growth, and massive investments in rural infrastructure
How Indonesia Connected the Poor to Rapid Economic Growth 41
both absorbed rural labor and stimulated further productivity gains(McCawley 2002). The key to rapid, pro-poor growth was constant attentionto keeping labor-intensive activities profitable. Until the 1980s, most of theseactivities were in the rural economy, so a focus on rural growth was also afocus on labor-intensive growth. After the mid-1980s, managing the laborintensity of economic growth became more complicated.
Growth Drivers and How They Changed over Time
Economic growth since the mid-1960s can be traced to three major sources:economic recovery and rehabilitation of the existing capital stock and infra-structure; rapid growth in agricultural productivity because of new technol-ogy and massive new investments in rural infrastructure; and, eventually,the emergence of a dominant manufacturing sector, stimulated by FDI andexports (Rock 2002).5
As standard growth theory would suggest, all three sources of growthdrew on the abundance of unskilled labor in Indonesia (Manning 1998). Ahigh labor intensity of output, on average and at the margin, characterizedthe most pro-poor episodes of Indonesia’s growth. When labor intensityslipped, and the capital-output ratio rose, poverty reduction slowed dra-matically, as was the case in the mid-1970s, during the oil boom. But fromthe late 1960s to the early 1990s, the “secret” of Indonesia’s pro-poor growthwas the labor intensity of its generally rapid growth. In the 25 yearsbetween 1967 and 1992, Indonesia’s population grew 2.1 percent per year,total GDP (in real rupiahs) grew by 6.7 percent per year, and employmentgrew by 3.0 percent per year. As best the data can say, poverty rates fell fromroughly two-thirds of the population to less than an eighth.
Since the early 1990s, and especially since the crisis in 1998, the story hasbeen quite different (Islam 2002). From 1990 to 1997, overall GDP continuedto grow rapidly, by 7.0 percent per year, but the Gini coefficient increasedfrom 0.32 in 1990 to 0.36 in 1996. The crisis in 1998 caused GDP to fall byover 13 percent, and growth averaged less than 4 percent per year from 1999until 2003.
One of the key stories of the crisis is the reversal of long-run structuraltrends in the Indonesian economy (see table 2.2). From 1990 to 1997,employment in the agriculture, forestry, and fisheries sector declined by2.3 percent per year, reflecting rapid growth during that period and a suc-cessful structural transformation in both the economy and labor force. Butemployment in agriculture surged 13.3 percent between 1997 and 1998, asmany workers in the urban economy returned to their rural families and
42 Timmer
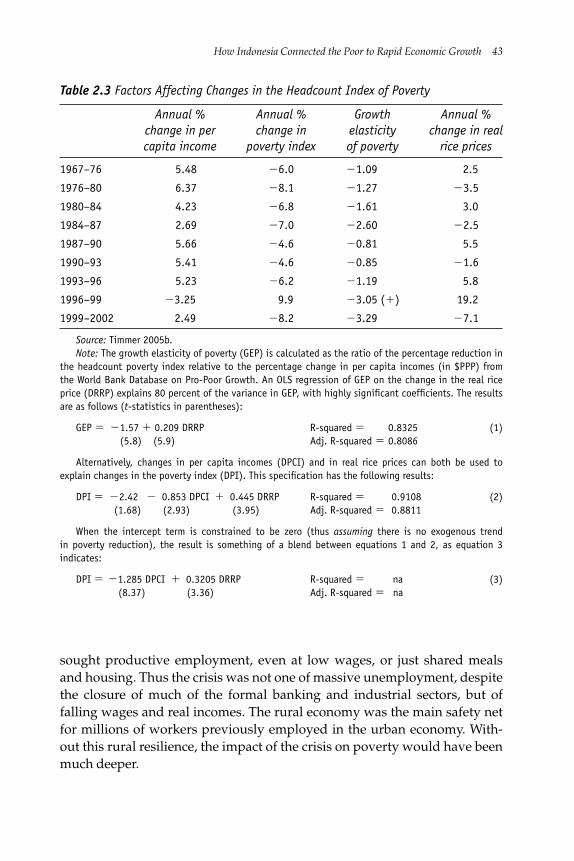
sought productive employment, even at low wages, or just shared mealsand housing. Thus the crisis was not one of massive unemployment, despitethe closure of much of the formal banking and industrial sectors, but offalling wages and real incomes. The rural economy was the main safety netfor millions of workers previously employed in the urban economy. With-out this rural resilience, the impact of the crisis on poverty would have beenmuch deeper.
How Indonesia Connected the Poor to Rapid Economic Growth 43
Table 2.3 Factors Affecting Changes in the Headcount Index of Poverty
Annual % Annual % Growth Annual %change in per change in elasticity change in realcapita income poverty index of poverty rice prices
1967–76 5.48 �6.0 �1.09 2.5
1976–80 6.37 �8.1 �1.27 �3.5
1980–84 4.23 �6.8 �1.61 3.0
1984–87 2.69 �7.0 �2.60 �2.5
1987–90 5.66 �4.6 �0.81 5.5
1990–93 5.41 �4.6 �0.85 �1.6
1993–96 5.23 �6.2 �1.19 5.8
1996–99 �3.25 9.9 �3.05 (�) 19.2
1999–2002 2.49 �8.2 �3.29 �7.1
Source: Timmer 2005b.Note: The growth elasticity of poverty (GEP) is calculated as the ratio of the percentage reduction in
the headcount poverty index relative to the percentage change in per capita incomes (in $PPP) fromthe World Bank Database on Pro-Poor Growth. An OLS regression of GEP on the change in the real riceprice (DRRP) explains 80 percent of the variance in GEP, with highly significant coefficients. The resultsare as follows (t-statistics in parentheses):
GEP � �1.57 � 0.209 DRRP R-squared � 0.8325 (1)(5.8) (5.9) Adj. R-squared � 0.8086
Alternatively, changes in per capita incomes (DPCI) and in real rice prices can both be used toexplain changes in the poverty index (DPI). This specification has the following results:
DPI � �2.42 � 0.853 DPCI � 0.445 DRRP R-squared � 0.9108 (2)(1.68) (2.93) (3.95) Adj. R-squared � 0.8811
When the intercept term is constrained to be zero (thus assuming there is no exogenous trendin poverty reduction), the result is something of a blend between equations 1 and 2, as equation 3indicates:
DPI � �1.285 DPCI � 0.3205 DRRP R-squared � na (3)(8.37) (3.36) Adj. R-squared � na
The second striking trend after the crisis is the growing divergencebetween the formal and informal economies (Islam 2002). Because mini-mum wage legislation had minimal impact during the Suharto regime, andmobility of labor was high geographically and across sectors, the formaland informal labor markets had been reasonably well integrated (Agrawal1995; Mason and Baptist 1996). After the crisis, and in the face of aggressivelabor activity and responses from newly democratic regional governments,increases in the minimum wage have led to a substantial divergencebetween trends in the formal and informal economy (see figure 2.5 in annex 2bin Timmer 2005b).6 Virtually all of the job growth since 1997, accordingly,has been in the informal sector (Aaron and others 2004; Manning 2000).Employment growth in the formal sector has been negative since 2000, asdocumented by Alisjahbana and Manning (forthcoming):
The first trend is the slow growth in non-agricultural jobs in general, including non-farm work, both in manufacturing and other sectors since the crisis (Table 2). This is incontrast with rapid employment growth of around 6 and 4 percent respectively duringthe pre-crisis period of 1986/87 to 1996/97. The bulk of employment growth since cri-sis has been in the agriculture sector which grew at 2.3 percent over the period of thecrisis, and absorbed many of those displaced from non-agricultural work. However,even after the initial recovery period, jobs in agriculture continued to grow almosttwice as fast as non-agricultural employment from 1999/2000 onwards (see last col-umn in Table 2).
Finally, the change since 1990 in the composition of manufacturedexports according to factor use has been striking. Natural–resource–intensive exports, such as wood and cork products, have declined from athird to a tenth of manufactured exports. Labor-intensive exports havealso declined as a share, but their total value has increased impressively,from $5 billion in 1990 to over $11 billion in 2002. Increases in human–capital–intensive and technology-intensive exports also have been substan-tial. Exports of telecommunications and electrical machinery showedespecially large increases. These export areas are directly competitive withChina’s growing capacity. Further growth will require serious attention toreducing costs and improving productivity, and both tasks have proven dif-ficult historically.
Growth Elasticity of Poverty
The strength of economic growth’s connection to the poor varies substan-tially in the short run. The impact of rice prices on short-run poverty levelsis dramatic, as might be expected for a commodity that still makes up half
44 Timmer
the average Indonesian’s food energy intake (see table 2.3). For each ofnine growth episodes from 1967 to 2002 (episodes for which reasonablycomparable SUSENAS data are available), the growth elasticity of poverty(GEP) is calculated as the annual percentage change in the headcountpoverty index relative to the annual change in real per capita incomes. Thesimple average of the absolute values of GEP for the nine periods is 1.75,well above the East Asia and Pacific average of 1.00 reported by Besley andBurgess (2003). By this measure, Indonesia’s post-1967 growth record hasbeen especially pro-poor (Kraay 2004).
The GEP also varies a great deal, as it ranges from a low of 0.81 in the1987–90 period, to a high of 3.29 from 1999 to 2002. Much of this variance isexplained by changes in domestic rice prices during each growth episode,as is shown in table 2.3. A simple regression that explains GEP as a func-tion of an intercept term (1.57) and changes in the real price of rice (coeffi-cient of �0.21, with a t-statistic of 5.9), explains over 80 percent of thevariance in GEP between 1967 and 2002 (see equation 1 in table 2.3). Evenif the observation for 1996 to 1999, during the worst of the financial crisis,is dropped, the regression explains over 40 percent of the (much-reduced)variance. These results indicate the pro-poor nature of economic growth inIndonesia but also the vulnerability of the poor to instability in theireconomic environment, particularly in incomes and the price of their majorfoodstuff.
Regional Incidence of Poverty
Disaggregating the incidence of poverty geographically is important,because much of Indonesia’s growth story is regional. Differences in agri-cultural potential and efficiency of market connections are the basic causesof geographical variance in poverty rates. One striking difference isbetween urban and rural areas. Four times as many poor people live in ruralareas as in urban areas, despite the rapid urbanization of the populationover the past four decades. Java, however, contains 75 percent of the urbanpoor and just 55 percent of the rural poor. Diverse job opportunities areavailable on densely settled Java that are not available to rural householdson the Outer Islands. The importance of good infrastructure to connect ruralhouseholds to nonfarm employment opportunities is reflected in thesenumbers. Provision of good infrastructure in areas with low populationdensities is equally important.
The dominance of Java in the total numbers of poor people, and of the East-ern Islands in poverty incidence, is readily apparent. Java has 59.9 percent
How Indonesia Connected the Poor to Rapid Economic Growth 45
of the poor and a poverty incidence of 15.3 percent. Eastern Indonesia(excluding Maluku and Papua) has 9 percent of the poor but a poverty inci-dence of 36.9 percent. Strategies for reducing poverty must cope with thisobvious bimodal distribution of the problem.7
The bimodality of poverty stems from the success of economic growthon Java compared with the lagging growth in eastern Indonesia. In the1960s and 1970s, poverty was concentrated on Java in both absolute termsand in incidence. In the mid-1960s, some districts in central Java wouldhave been among the most impoverished anywhere in the world (Timmer1975). Today, this region of Java is exporting handcrafted furniture todemanding markets in the West.
Sectoral Growth and Poverty Reduction
Early work by Ravallion and Huppi (covering the entire Indonesian econ-omy for the 1984 to 1987 period) and recent work at the provincial level forthe period from 1984 to 1996 by Sudarno Sumarto and Asep Suryhadi ofthe Social Monitoring and Early Response Unit highlight the powerfulimpact of growth in agricultural productivity on the reduction of poverty.Linking sectoral growth patterns to a long-run reduction in poverty is con-troversial, because mobile factors of production should make the overallgrowth rate the ultimate determinant.8 Formal analysis of the Indonesia-specific dimensions of the role of agriculture and the rural economy in thecountry’s generally successful record on poverty reduction date to Raval-lion and Huppi (1991), although much of the earlier work in the late 1960sand early 1970s, which the Agricultural Development Council sponsoredthrough the Agro-Economic Survey based at the Bogor Institute of Agricul-ture (Institut Pertanian Bogor), addressed this broad theme as well (Collierand Sajogyo 1972).
More recently, Timmer (1996b, 1997, 2002), Warr (2002), and Sumartoand Suryhadi (2003) have examined the contribution of growth in the agri-cultural sector to poverty reduction. Warr’s results, which explain aggregatepoverty rates in East Asia (Taiwan), Southeast Asia (Indonesia, Malaysia,the Philippines, and Thailand), and South Asia (India), revealed that thesoutheast Asian countries depend mostly on agricultural and servicesgrowth for poverty reduction. Growth had no significant impact on theindustrial sector.
Sumarto and Suryhadi (2003) pursued this sectoral disaggregation of thesources of poverty reduction. They used panel data at the provincial levelfrom 1984 to 1996 to examine the local poverty impact according to the
46 Timmer
sector of growth in the province. The results are startling: agriculturalgrowth accounts for most of the reduction in poverty. Roughly two-thirds ofthe reduction observed during the period of fastest growth in manufacturedexports was due to growth in agricultural output at the provincial level.This result is surprising. Most observers thought that agriculture’s key rolehad been played in the previous two decades and that the “engine ofgrowth and poverty alleviation” had passed to manufacturing (Papanek2004). The manufacturing export boom had a direct impact on only ahandful of provinces—all of them on Java. At the local level, the directimpact on poverty probably continued to come through the local agricul-tural economy.
Human Capital and Gender
As illustrated in figure 2.3, investments in human capital were a core com-ponent of raising the capabilities of the poor. Gross enrollment rates in pri-mary school increased from about 70 percent of the eligible age group in themid-1960s to 86 percent in the mid-1970s. Nearly all eligible students nowfinish primary school. Similarly, under-five child mortality declined from 91per 1,000 in 1990 to 41 per 1,000 in 2003. Naturally, the education and healthindicators have both a supply and a demand element. With the state makingmassive investments in rural schools and health clinics, local residents wereable to make their own investments in their children.
On the international stage, profiles of poverty by gender indicate thatimportant differences remain in several areas, including literacy. Genderand poverty is not the major issue in Indonesia that it is in Africa, the Mid-dle East, or parts of Asia. Net primary school enrollment rates reached gen-der parity in 2002, a significant improvement from the 78:67 ratio of malesto females in the 1970–75 period. Female life expectancy continues to out-distance that of males. The gap has grown from three years (53 versus 50) inthe 1970–75 period to four years (69 versus 65) in 2002. Important excep-tions to this good record include maternal mortality rates. The 373 maternaldeaths per 100,000 live births are high by regional standards and even bythe standard of Indonesia’s average income level.
Implementing a Strategy of Pro-Poor Growth
Because global inflation was high and the United States was deeplyengaged in Vietnam, the external environment was not particularly hos-pitable when the Suharto government started designing and implementing
How Indonesia Connected the Poor to Rapid Economic Growth 47
its economic policies in the late 1960s. But this environment permitted theIndonesian government to develop its own strategy for economic growth.Thus Indonesia had substantial “policy space” (Rodrik 2004). Because nei-ther Suharto nor the technocrats had any experience in policy making, theyhad to design the mechanisms of economic governance almost from scratchand to put in place a workable set of relationships and division of responsi-bilities. Despite a surprising “constitutionalism” in Suharto’s approach togoverning, the government made no serious effort to open economic gover-nance into a more democratic process (Liddle 1991, 1996).
In retrospect, the pro-poor strategy encompassed the three basic levelsshown in figure 2.3. Macroeconomic policy was directly in the hands of thetechnocrats and, as always, they sought to maximize the overall rate of eco-nomic growth. This rate was subject to maintaining stability, however, socontrolling inflation through fiscal and monetary discipline was also impor-tant. The exchange rate was an instrument of policy, not an objective exceptin the very short run. Policy makers managed the rate to maintain the prof-itability of producing tradable goods, especially in agriculture (Thorbecke1995). Active management of the exchange rate was especially important indealing with “Dutch Disease” (Warr 1984).
Such a growth-oriented macroeconomic policy should call forth invest-ments from the private sector that become the actual engine of economicgrowth, but the institutional foundations for rapid expansion of the privatesector in Indonesia were not in place until the reforms of the 1980s. A moreactive public role was deemed necessary to stimulate appropriate invest-ments. Apart from the mid-1970s, during the peak of the oil boom, the pub-lic role was not primarily investments in state enterprises but rather in thesupporting infrastructure, soft and hard, for private sector enterprises.
These investments in infrastructure lowered the costs of market connec-tions that generated jobs and raised the productivity of the poor. Indeed,public sector investments and regulatory improvements to lower transac-tion costs as an approach to market development are arguably the cruciallink between growth-oriented macroeconomic policy and widespread par-ticipation by poor households in the market economy. In Indonesia theseinvestments were in roads (especially farm-to-market roads), communica-tions networks, market infrastructure and ports, and irrigation and watersystems. Many of the projects were built as labor-intensive public works,making millions of jobs available to unskilled labor willing to work at localmarket wages (Papanek 2004).
Directly measuring transaction costs is difficult, especially because thecosts and risks of engaging in market exchanges are to a large degree
48 Timmer
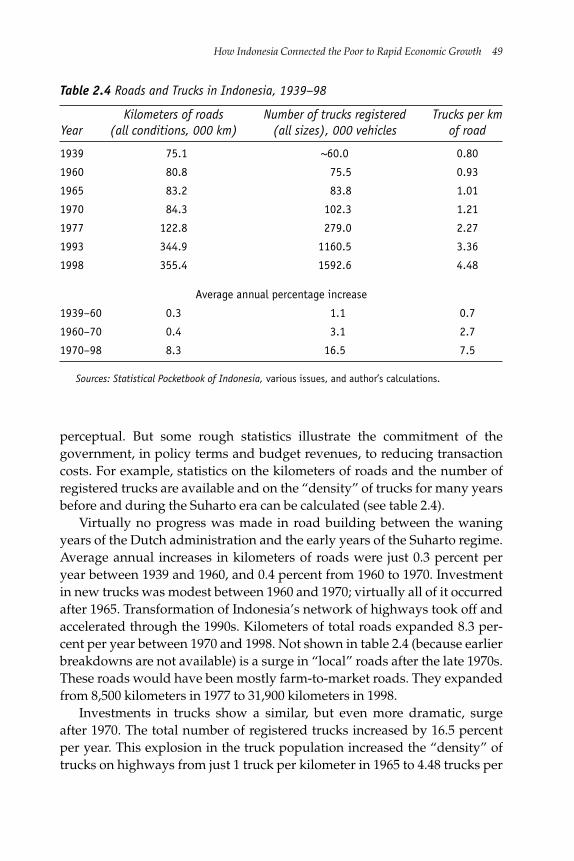
perceptual. But some rough statistics illustrate the commitment of thegovernment, in policy terms and budget revenues, to reducing transactioncosts. For example, statistics on the kilometers of roads and the number ofregistered trucks are available and on the “density” of trucks for many yearsbefore and during the Suharto era can be calculated (see table 2.4).
Virtually no progress was made in road building between the waningyears of the Dutch administration and the early years of the Suharto regime.Average annual increases in kilometers of roads were just 0.3 percent peryear between 1939 and 1960, and 0.4 percent from 1960 to 1970. Investmentin new trucks was modest between 1960 and 1970; virtually all of it occurredafter 1965. Transformation of Indonesia’s network of highways took off andaccelerated through the 1990s. Kilometers of total roads expanded 8.3 per-cent per year between 1970 and 1998. Not shown in table 2.4 (because earlierbreakdowns are not available) is a surge in “local” roads after the late 1970s.These roads would have been mostly farm-to-market roads. They expandedfrom 8,500 kilometers in 1977 to 31,900 kilometers in 1998.
Investments in trucks show a similar, but even more dramatic, surgeafter 1970. The total number of registered trucks increased by 16.5 percentper year. This explosion in the truck population increased the “density” oftrucks on highways from just 1 truck per kilometer in 1965 to 4.48 trucks per
How Indonesia Connected the Poor to Rapid Economic Growth 49
Table 2.4 Roads and Trucks in Indonesia, 1939–98
Kilometers of roads Number of trucks registered Trucks per kmYear (all conditions, 000 km) (all sizes), 000 vehicles of road
1939 75.1 ~60.0 0.80
1960 80.8 75.5 0.93
1965 83.2 83.8 1.01
1970 84.3 102.3 1.21
1977 122.8 279.0 2.27
1993 344.9 1160.5 3.36
1998 355.4 1592.6 4.48
Average annual percentage increase
1939–60 0.3 1.1 0.7
1960–70 0.4 3.1 2.7
1970–98 8.3 16.5 7.5
Sources: Statistical Pocketbook of Indonesia, various issues, and author’s calculations.
kilometer in 1998. The capacity to move goods around the country was radi-cally transformed in two decades, and that component of transaction costswas lowered.
A similar story can be told about communications costs. In 1990 nearly77 million domestic long-distance telephone calls were placed, an increaseof 13 percent per year from the 7.58 million calls placed in 1971. After arestructuring of calling services in 1989–90 that made most calls “local”instead of long distance, the number of local calls increased by more than25 percent per year through 1997; in that year it totaled 50 billion (or 250calls for every man, woman, and child in Indonesia). Through investment ina modern telecommunications system, Indonesia made the communicationscomponent of transactions easy and reliable.
The final component of transaction costs involves the risks of doing busi-ness. These risks range from normal market fluctuations that all businessesface, to the prospect of expropriation or demand for “special fees” when abusiness becomes visibly successful. Lack of transparency, highly corruptrule of law, and lucrative opportunities handed to Suharto’s children andcronies obviously raised the cost of doing business for legitimate firms. Onthis count, the Suharto regime appears to have raised transaction costs.
Market engagement raises another element of risk: whether price behav-ior is reasonably predictable and price margins are within normal businesscosts. Because of the Suharto regime’s emphasis on price stability, most day-to-day business activities became more predictable—hence less risky. Afarmer could sell rice during the harvest and be confident that, six monthslater, rice would be available for purchase in the market at a reasonableprice. A trader could buy and store rice and be pretty sure that price behav-ior would provide normal returns to storage. Urban consumers did nothave to hoard rice in anticipation of unexpected shortages. The rice marketin particular, and most commodity trading in general, became routine andoperated on relatively thin margins (Timmer 1996a). Lower transportationand communications costs contributed greatly to these lower transactioncosts, but so too did an environment of lower risks from normal marketactivities.
Lower transaction costs mean more market opportunities and faster eco-nomic growth, but they also mean easier access for the poor to markets andbetter connections to economic growth. To ensure that access translates intoparticipation, the capacity of poor households to enter the market economyneeds to be enhanced. Investments in human capital—education, publichealth clinics, and family planning centers—improve the “capabilities” ofthe poor to connect to rapid economic growth.
50 Timmer
There is little evidence that the incidence of public expenditures in thesesocial sectors was deliberately pro-poor. In the early years, the needs wereso great that simply building schools and clinics was the first priority. Notsurprisingly, the relatively better off took advantage of these facilities andreaped the benefits of the subsidies spent before the poor. But pioneeringresearch by the World Bank has shown that the poor have begun to benefitin very important ways (Lanjouw and others 2001). For both education andhealth expenditures, the marginal incidence of spending on the poor is sub-stantially higher than the average.
Political Economy and Governance
Why President Suharto’s government carried out the pro-poor strategy asaggressively as it did remains a mystery of modern political economy,although a personal concern for the welfare of farmers seems to be at leastpart of the explanation. This personal engagement may also have inhibitedmore flexible policies as the economy evolved and matured. Hull (2004)notes the continued tendency of the elite to think of peasants as illiterate,which matched President Suharto’s memories of growing up among peas-ants in rural Central Java. The president’s determination that civil servantsreceive rice in kind, as part of their salaries, extended far beyond the earlyand sensible justification for the program—local rice markets were thin andsubject to highly unstable prices. Thus the personal influence of the presi-dent clearly played a major role in the evolution of policy, and this rolebecame counterproductive as Indonesian society became more affluent andsophisticated and as the economy became more complex. Both farmers andcivil servants were well equipped to deal with new technologies and marketfluctuations, without heavy intervention by the state, by the 1990s.
Part of Suharto’s commitment to the rural economy appears to stemfrom the highly visible politics, and power, of food security. The drive forhigher agricultural productivity—a key ingredient in pro-poor growth—was fueled at least in part by the desire for households, and the country, tohave more reliable supplies of rice than historically had been available fromworld markets. When the world rice market quite literally disappeared forseveral months during the world food crisis in 1973, Indonesia’s depen-dence on imported rice to stabilize domestic prices highlighted its vulnera-bility to external markets beyond its control—the opposite of food securityin the minds of most Indonesians—and showed how important increasingrice production was (Timmer 2000, 2005a). A ratcheting up of policy atten-tion to agriculture and budget support for rural infrastructure followed the
How Indonesia Connected the Poor to Rapid Economic Growth 51
traumatic loss of control of rice prices in 1972–73. But here, too, the worldhas changed. A drive for rice self-sufficiency that made technical and eco-nomic sense in the late 1970s and early 1980s would be folly today.
What is next? The political appeal of the new strategy for dealing withpoverty—direct fiscal transfers to the poor—is obvious. In principle, thesetransfers have an immediate and visible impact on the recipients, and thepolitical “pitch” for the programs makes it sound as though the governmentis actively committed to poverty reduction. Although democracy has proba-bly increased the size and influence of the political coalition concernedabout poverty, it has greatly undermined the coalition supporting economicgrowth as the main mechanism for dealing with poverty. The problem, ofcourse, is not with democracy itself, but with the lack of democratic institu-tions that provide real accountability of government to constituents. Thedecentralization that was designed and implemented shortly after Suharto’sfall as a device to prevent another centralized political regime has delayeddevelopment of these institutions. At the same time, the decentralization isclearly broadening experimentation with different forms of political institu-tions and mechanisms for accountability.
It should be remembered that Indonesians coped with three massiveshocks in the span of just a year. If 1966, in the famous words of PresidentSukarno, was “the year of living dangerously,” what was 1998? The emerg-ing answer is “the year of transformation to a freer and fairer society.” Thistransformation is not the stuff of headlines. The headline grabbers are theBali and Marriott hotel bombings, judicial ineptitude and outright corrup-tion, human rights abuses by the military, the tsunami disaster in Aceh, andcontinuing games played by Jakarta’s political elite (McBeth 2003).
Little noticed is the steady progress that Indonesia is making. If occa-sional jabs at foreign companies by local courts still roil investors, the com-petence of the new constitutional court is unreported. The petty (and not sopetty) corruption of newly empowered local governments makes news andis troublesome. But the open competition to create good business environ-ments at the local level might have more long-run impact (Ramage 2004).
Amid the gloom and doom, the historical resilience and successes ofIndonesian society need to be appreciated and valued. From a long-termperspective, the Indonesian experience with pro-poor growth providesgenuine hope that desperately poor societies can escape from the worstmanifestations of their poverty in a generation, provided appropriate poli-cies are followed. This message is critically important for the Indonesia ofthe future, unsure as the country is over what path to follow during its
52 Timmer
democratic transition. In its broadest outlines, that path is clear. The three-tiered strategy of growth-oriented macroeconomic policy, linked to productand factor markets through progressively lower transaction costs, which inturn are linked to poor households whose capabilities are being increasedby public investments in human capital, is a general model accessible to allcountries, including the future Indonesia.
Notes
1. An excellent summary of experience with economic growth from the Suhartoera to the present is Hofman, Rodrick-Jones, and Wie (2004). For an “insider’s” viewof how the technocrats consciously managed both the growth process and its link topoverty reduction, see Afiff (2004). Papanek (2004) assesses the impact on the poorof economic policies under Sukarno and Suharto and the governments that followedthe New Order regime.
2. World Bank (1987) notes that “. . . Indonesia’s growth rate continues to beextremely low in relation to past performance and barely above the rate of popula-tion growth. With the added loss of purchasing power from lower oil prices, theimpact on personal incomes and employment was severe” (p. vii).
3. It should be noted that the rice sector in particular was protected from theworst pressures of low prices in world markets, and the substantial rupiah devalua-tions in 1983 and 1986 enhanced profitability for the rest of the tradable sector.
4. The full story of how the Suharto regime came apart has yet to be told, butStern (2003, 2004) provides details from the perspective of a long-term advisor to theMinistry of Finance. The regular “Survey of Recent Developments,” published ineach issue of the Bulletin of Indonesian Economic Studies, also provides a blow-by-blow account. Booth’s (2002a) comparison of the growth collapses in Indonesia inthe 1930s and 1990s provides important historical insights.
5. The best analysis of economic growth during the Suharto era is in Hill (2000).Hofman, Rodrick-Jones, and Wie (2004) describe institutional development and fail-ures over the same period. Because of the size of its lending program in Indonesia,the World Bank has been a close observer of and participant in economic policy mak-ing since 1968. The Indonesian CountryAssistance Strategy paper (World Bank 2003b)reflects this involvement.
6. The World Bank (2003a) report to the Consultative Group on Indonesiaincluded a table on regional minimum wages for the first time.
7. This problem was stressed as early as the HIID report on poverty for BAPPENAS in 1992 (Timmer, Falcon, Wiebe, and Mason 1992).
8. For an especially thoughtful and technically sophisticated review of this issueon a global scale, see Bravo-Ortega and Lederman (2004). Sarris (2001) and Booth(2002b) also provide useful insights.
How Indonesia Connected the Poor to Rapid Economic Growth 53
References
Aaron, Carl, Lloyd Kenward, Kelly Bird, Mehir Desai, Haryo Aswicahyono, ChatibM. Basri, and Choesni Tubagus. 2004. “Strategic Approaches to Job Creation andEmployment in Indonesia.” Report prepared for the U.S. Agency for Interna-tional Development, Jakarta, Indonesia.
Afiff, Saleh. 2004. “Scaling Up Poverty Reduction in Indonesia.” Paper presented at“Scaling Up Poverty Reduction,” Shanghai, China, May 27–29.
Afiff, Saleh, and C. Peter Timmer. 1971. “Rice Policy in Indonesia.” Food ResearchInstitute Studies in Agricultural Economics, Trade, and Development 10 (2): 131–59.
Agrawal, Nisha. 1995. “Indonesia: Labor Market Policies and International Competi-tiveness.” Policy Research Working Paper 1515, World Bank, Washington, DC.
Alatas, Vivi, Jehan Arulpragasam, and Neil McCulloch. 2004. “Poverty Rates andGrowth Incidence Curves for Indonesia, 1990–2002.” Working paper, WorldBank, Jakarta, Indonesia.
Alisjahbana, Armida, and Chris Manning. Forthcoming. “Employment, LabourStandards and Flexibility: Getting the Balance Right.”
Besley, Timothy, and Robin Burgess. 2003. “Halving Global Poverty.” Journal ofEconomic Perspectives 17 (3): 3–22.
Boeke, Jan H. 1946. The Evolution of the Netherlands Indies Economy. New York: Insti-tute of Pacific Relations.
_______. 2002a. “Growth Collapses in Indonesia: A Comparison of the 1930s and the1990s.” Working paper, School of African and Oriental Studies, University ofLondon, London.
Booth, Anne. 2002b. “Rethinking the Role of Agriculture in the ‘East Asian’ Model:Why Is Southeast Asia Different from Northeast Asia?” ASEAN Economic Bulletin19 (1): 40–51.
Bravo-Ortega, Claudio, and Daniel Lederman. 2004. “Agriculture and NationalWelfare around the World: Causality and International Heterogeneity since1960.” Draft paper for the Latin America and Caribbean Region Department,World Bank, Washington, DC.
Bulletin of Indonesian Economic Studies. “Survey of Recent Developments.” Variousissues.
Cole, David C., and Betty F. Slade. 1996. Building a Modern Financial System: TheIndonesian Experience. Melbourne: Cambridge University Press.
Collier, William L., and Sajogyo. 1972. “Employment Opportunities Created by theHigh Yielding Rice Varieties in Several Areas on Java.” Ekonomi dan KeuanganIndonesia [Economy and Finance in Indonesia] 20 (2): 105–32.
Hill, Hal. 1996. The Indonesian Economy since 1966. Cambridge: Cambridge Univer-sity Press.
_______. 2000. The Indonesian Economy since 1966. 2nd ed. Cambridge: CambridgeUniversity Press.
54 Timmer
Hofman, Bert, Ella Rodrick-Jones, and Thee Kian Wie. 2004. “Indonesia: RapidGrowth; Weak Institutions.” Paper prepared for “Scaling Up Poverty Reduc-tion,” Shanghai, May 27–29.
Hull, Terence H. 2004. “Indonesia’s Demographic Turning Point.” Working paper,Australian National University, Canberra, Australia.
IBRD (International Bank for Reconstruction and Development). 1968. “EconomicDevelopment in Indonesia: Volume I, Main Report.” AS-132a, IRBD,Washington, DC.
Islam, Iyanatul. 2002. “Poverty, Employment and Wages: An Indonesian Perspec-tive.” Paper prepared for ILO-JMHLW-Government of Indonesia Seminar onStrengthening Employment and Labour Market Policies for Poverty Alleviationand Economic Recovery in East and Southeast Asia, Jakarta, April 29–May 1.
Kraay, Aart. 2004. “When Is Growth Pro-Poor? Cross-Country Evidence.” PolicyResearch Working Paper 3225, World Bank, Washington, DC.
Lanjouw, Peter, Menno Pradhan, Fadia Saadah, Haneen Sayed, and Robert Sparrow.2001. “Poverty, Education, and Health in Indonesia: Who Benefits from PublicSpending?” Working paper, World Bank, Washington, DC.
Lewis, W. Arthur. 1954. “Economic Development with Unlimited Supplies ofLabor.” The Manchester School 22: 3–42.
Liddle, R. William. 1991. “The Relative Autonomy of the Third World Politician:Suharto and Indonesian Economic Development in Comparative Perspective.”International Studies Quarterly 35 (4): 403–27.
_______. 1996. Leadership and Culture in Indonesian Politics. Sydney: Allen and Unwin,in association with the Asian Studies Association of Australia.
MacIntyre, Andrew. 2001. “The Politics of Agricultural Policy-Making: The Impor-tance of Institutions.” In The Evolving Roles of State, Private, and Local Actors in AsianRural Development, ed. Ammar Siamwalla, 243–70. Hong Kong: Oxford UniversityPress.
Manning, Chris. 1998. Indonesian Labour in Transition: An East Asian Success Story?Cambridge: Cambridge University Press.
. 2000. “Labour Market Adjustments to Indonesia’s Economic Crisis: Con-text, Trends and Conclusions.” Bulletin of Indonesian Economic Studies 36 (1):105–36.
Mason, Andrew D., and Jacqueline Baptist. 1996. “How Important Are LaborMarkets to the Welfare of Indonesia’s Poor? Policy Research Working Paper 1665,World Bank, Washington, DC.
McBeth, John. 2003. “Leadership: The Betrayal of Indonesia.” Far Eastern EconomicReview 116 (25), June 26.
McCawley, Peter. 2002. “Economic Policy during the Suharto Era: A BalanceSheet.” In Ekonomi Indonesia di Era Politik Baru: 80 Tahun Mohammad Sadli [TheIndonesian Economy in the New Political Era: Mohammad Sadli’s 80 Years],ed. Mohamad Ikhsan, Chris Manning, and Hadi Soesastro, 259–70. Jakarta:Penerbit Buku Kompas.
How Indonesia Connected the Poor to Rapid Economic Growth 55
Mellor, John W. 2000. “Agricultural Growth, Rural Employment, and PovertyReduction: Nontradables, Public Expenditure, and Balanced Growth.” Preparedfor World Bank Rural Week 2000, March.
Papanek, Gustav. 2004. “The Poor during Economic Decline, Rapid Growth andCrisis: The Case of Indonesia.” Prepared for the USAID Project on Pro-PoorGrowth conducted by Development Alternatives, Inc., and BIDE, Bethesda, MD.
Prawiro, Radius. 1998. Indonesia’s Struggle for Economic Development: Pragmatism inAction. Kuala Lumpur: Oxford University Press.
Ramage, Douglas. 2004. “The Political Dynamics of Indonesia’s Elections.” Presenta-tion to Asia Society and U.S. Indonesian Association (USINDO), Washington DC,April 29.
Ravallion, Martin, and Monika Huppi. 1991. “Measuring Changes in Poverty: AMethodological Case Study of Indonesia during an Adjustment Period.” WorldBank Economic Review 5 (1): 57–82.
Rock, Michael T. 2002. “Exploring the Impact of Selective Interventions in Agricul-ture on the Growth of Manufactures in Indonesia, Malaysia, and Thailand.” Jour-nal of International Development 14 (4): 485–510.
Rodrik, Dani. 2004. “How to Make the Trade Regime Work for Development.”Harvard University. http://Aksghome.harvard.edu/~drodrik/How%20to%20Make%20Trade%20Work.pdf.
Sarris, Alexander H. 2001. “The Role of Agriculture in Economic Development andPoverty Reduction: An Empirical and Conceptual Foundation.” Prepared for theRural Development Department of the World Bank, Washington, DC.
Schydlowsky, Daniel M. 2000. “Misperceived Corporate Exchange Risk and Hyper-inflation in Indonesia 1998–99.” American University and Boston Institute ofDeveloping Economies, Ltd.
Stern, Joseph J. 2003. “The Rise and Fall of the Indonesian Economy.” Working Paper100, Center for International Development, Harvard University, Cambridge,MA.
_______. 2004. “The Impact of the Crisis—Decline and Recovery.” Working Paper103, Center for International Development, Harvard University, Cambridge,MA.
Sumarto, Sudarno, and Asep Suryhadi. 2003. “The Indonesian Experience on TradeReform, Economic Growth and Poverty Reduction.” Paper presented at theTrade, Growth and Poverty Conference, London, December 8–9.
Temple, Jonathan. 2001. “Growing into Trouble: Indonesia after 1966.” Workingpaper, Department of Economics, University of Bristol, Bristol.
Thee, Kian Wie, ed. 2003. Recollections: The Indonesian Economy, 1950s–1990s.Singapore and Canberra: Institute of Southeast Asian Studies and ResearchSchool of Pacific and Asian Studies, Australian National University.
Thorbecke, Erik. 1995. “The Political Economy of Development: Indonesia and thePhilippines.” The Frank H. Golay Memorial Lecture, Cornell Southeast AsiaProgram, Cornell University, Ithaca, NY.
56 Timmer
Timmer, C. Peter. 1975. “The Political Economy of Rice in Asia: Indonesia.” FoodResearch Institute Studies 14 (3): 197–231.
. 1996a. “Does BULOG Stabilise Rice Prices in Indonesia? Should It Try?”Bulletin of Indonesian Economic Studies 32 (2): 45–74.
. 1996b. “Economic Growth and Poverty Alleviation in Indonesia.” InResearch in Domestic and International Agribusiness Management, vol. 12, ed. Ray A.Goldberg, 205–34. Greenwich, CT: JAI Press.
. 1997. “How Well Do the Poor Connect to the Growth Process?” Paper pre-pared for U.S. Agency for International Development/CAER project, HarvardInstitute for International Development, Harvard University.
. 2000. “The Macro Dimensions of Food Security: Economic Growth, Equi-table Distribution, and Food Price Stability.” Food Policy 25: 283–95.
. 2002. “Agriculture and Economic Growth.” In The Handbook of AgriculturalEconomics, vol. 2, ed. Bruce Gardner and Gordon Rausser, 1487–546. Amsterdam:North-Holland.
. 2004. “The Road to Pro-Poor Growth: The Indonesian Experience inRegional Perspective.” Bulletin of Indonesian Economic Studies 40 (2): 173–203.
. 2005a. “Food Security and Economic Growth: An Asian Perspective.”Asian-Pacific Economic Literature 19 (1): 1–17.
_______. 2005b. “Operationalizing Pro-Poor Growth: A Country Case Study ofIndonesia,” PREM/World Bank, Washington, DC.
Timmer, C. Peter, Walter P. Falcon, Franck Wiebe, and Andrew D. Mason. 1992. “AnApproach to Poverty Alleviation in Indonesia: Overview.” In “Approaches toPoverty Alleviation in Indonesia,” Harvard Institute for International Develop-ment Report 136/92/255, Cambridge.
Warr, Peter G. 1984. “Exchange Rate Protection in Indonesia.” Bulletin of IndonesianEconomic Studies 20 (2): 53–89.
. 2002. “Poverty Reduction and Sectoral Growth: Evidence from SoutheastAsia” Draft, Economics Division, Research School of Pacific and Asian Studies,Australian National University, Canberra Australia.
_______. 2005. “Industrialization, Trade Policy, and Poverty Reduction: Evidencefrom Asia.” In Trade Policy Reforms and Development: Essays in Honour of PeterLloyd, vol. 2, ed. Sisira Jayasuriya. Cheltenham, U.K., and Northampton, MA:Edward Elgar.
World Bank. 1987. “Indonesia: Strategy for Economic Recovery.” Country Study,World Bank, Washington, DC.
_______. 2003a. “Indonesia: Beyond Macro-Economic Stability.” World Bank Brieffor the Consultative Group on Indonesia, Jakarta, December.
_______. 2003b. “Indonesia: Country Assistance Strategy, FY 2004–2007.” WorldBank, Jakarta.
How Indonesia Connected the Poor to Rapid Economic Growth 57

3The Policy Origins of Povertyand Growth in India
Timothy Besley, Robin Burgess, and Berta Esteve-Volart
India contains about one-third of the world’s population living on less thana dollar a day. Since India became a federal democracy in 1947, its stateshave experienced very different patterns of poverty reduction. The share ofthe population in poverty in Bihar, for example, remained stagnant at above60 percent from 1958 to 2000. In Kerala, by contrast, poverty fell fromabout 60 percent to 15 percent over the same period. Differences in growthrates have also been striking, in particular during the past two decades.
A recent body of research has exploited the heterogeneity of the Indianexperience to investigate how and why Indian states have or have notachieved growth and poverty reduction. This research is facilitated by thefact that Indian states retained responsibility for many policies in the Indianconstitution, which came into force in 1950, and by India’s establishment ofthe National Sample Survey (NSS), a database for analysis of socioeconomicissues. Through the NSS, India has collected poverty figures since 1958.1
This chapter analyzes links among poverty, growth, and policy in Indiaover the 1958–2000 period in 16 states in which more than 95 percent of theIndian population lives. These states are larger than many of the countriesthat appear in typical cross-country analyses. But because these states oper-ate under a single government, many of the unobserved factors that con-found these analyses can be controlled.
The present analysis considers human capital and access to finance—classic themes in studies of growth and poverty reduction. It also considers
59
voice and accountability, regulation, property rights, and gender—factorsthat are crucial to understanding the growth and poverty reduction experi-ences of Indian states. Thus the analysis emphasizes accumulation of physi-cal and human capital but also focuses on institutional reforms that expandopportunities for households (and individuals), improve the climate fordoing business, and increase the accountability of elected officials. Centralto the analysis is the institutional and political context in which policy andaccumulation decisions are made.
The analysis begins by relating poverty to growth. It then introduces theidea of a growth elasticity of poverty, applied state by state. On the basis ofcross-state evidence, the study identifies six policy and institutional factorsthat have affected poverty reduction and growth and the relationshipbetween them.
Poverty and Growth
Figure 3.1 depicts both the headcount measure of poverty—the standarddeviation of log income inequality measure—and the log of income percapita between 1958 and 2000 for each of the 16 states in the analysis.2 Thepoverty numbers show total (official) poverty and total adjusted (Sundaramand Tendulkar 2003c) poverty for 1994 and 2000.3 Though the pattern ofpoverty change is unclear in the early years, most states have experienced adecline in poverty from the early 1970s onward. By contrast, inequality asmeasured by the Gini shows no consistent patterns of change. The data alsoshow a slow but steady upward trend in income per capita from the 1970s inmost states.
The most striking feature of figure 3.1, however, is cross-state hetero-geneity in these patterns.4 As noted above, poverty fell precipitously inKerala but was impervious to change in Bihar. Economic performance alsovaries greatly from state to state. Growth rates divide the 16 main states ofIndia into two groups of equal size: in one group economic growth has beenlimited, but in the other it has been intensifying.5 Patterns of inequality varyacross states but not in a systematic fashion. Figure 3.1 reveals that the rela-tionship between income per capita and growth across states is heteroge-neous. A simple way to summarize the relationship between poverty andgrowth is to run regressions of the form:
pst � �s � �s yst � �st,
where s denotes an Indian state t and denotes a year, � is a state fixed effect,pst is the log of the poverty headcount ratio, and finally yst is the log of
60 Besley, Burgess, and Esteve-Volart
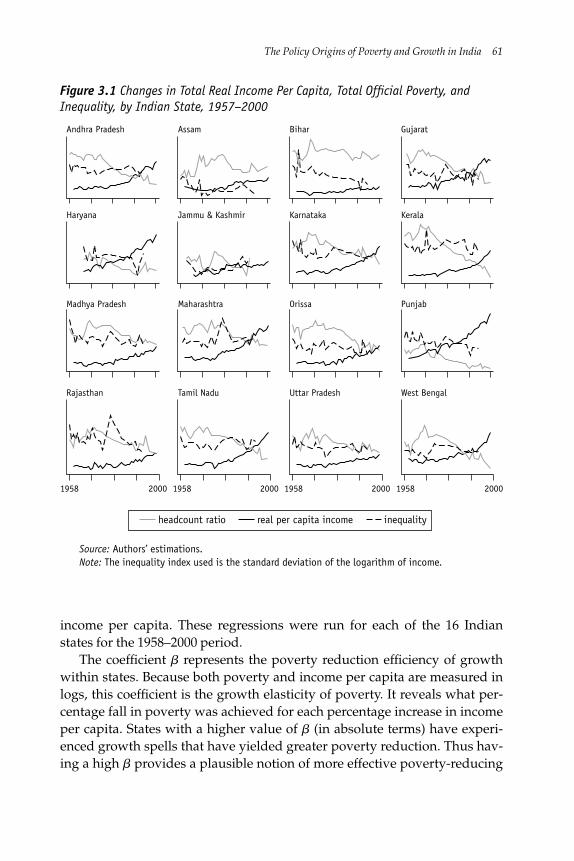
income per capita. These regressions were run for each of the 16 Indianstates for the 1958–2000 period.
The coefficient � represents the poverty reduction efficiency of growthwithin states. Because both poverty and income per capita are measured inlogs, this coefficient is the growth elasticity of poverty. It reveals what per-centage fall in poverty was achieved for each percentage increase in incomeper capita. States with a higher value of � (in absolute terms) have experi-enced growth spells that have yielded greater poverty reduction. Thus hav-ing a high � provides a plausible notion of more effective poverty-reducing
The Policy Origins of Poverty and Growth in India 61
Andhra Pradesh Assam Bihar Gujarat
Haryana Jammu & Kashmir Karnataka Kerala
Madhya Pradesh Maharashtra Orissa Punjab
Rajasthan
1958 2000
Tamil Nadu
1958 2000
Uttar Pradesh
2000
West Bengal
19581958 2000
headcount ratio real per capita income inequality
Figure 3.1 Changes in Total Real Income Per Capita, Total Official Poverty, andInequality, by Indian State, 1957–2000
Source: Authors’ estimations.Note: The inequality index used is the standard deviation of the logarithm of income.
growth. Understanding which economic, social, and political factors areassociated with high � provides a way of thinking about how to opera-tionalize poverty-reducing growth.
The explained component of poverty reduction between any two timeperiods in a given Indian state will be a function of both the state growthelasticity of poverty � and the state growth rate gs:
�∧pst � �s gs,
where the coefficient � represents the poverty efficiency reduction ofgrowth within states. This coefficient loosely summarizes how much growthwithin a state is poverty reducing.
Table 3.1 shows poverty elasticities with respect to growth for India’sstates. In every state the estimated elasticities are negative, confirming thatincreases in income per capita are associated with poverty reduction. Thisfinding is consistent with the findings of other studies (Besley and Burgess2003; Bourguignon 2002; Dollar and Kraay 2002; Ravallion 2004). Theestimated average elasticity for India is �0.65, with an average (robust)standard error of 0.08. The size of the coefficient means that an increase ingrowth of 1 percent is associated with a reduction in poverty of 0.65 percent.That is, growth reduces poverty less than proportionally. But an average isless interesting than determining whether some states are more efficientthan others in reducing poverty through growth. Table 3.1 shows that elas-ticities range from �0.30 for Bihar to �1.23 for Kerala.6 Therefore, withinthe same country Bihar would need four times as much economic growth asKerala to achieve the same level of poverty reduction. This finding is a goodindication that the poor in Bihar are less included in the growth processthan are the poor in Kerala.
Superior poverty reduction performance in an Indian state will comefrom either higher growth elasticity of poverty (for a given rate of growth)or higher economic growth (for a given growth elasticity of poverty).Table 3.1 divides overall poverty reduction in the 16 states into these twocomponents (see columns 3 and 4). As the table shows, state performance isquite heterogeneous.
Table 3.2 classifies each state according to growth performance andpoverty reduction for a given amount of growth. Some states, such asKerala, have achieved rapid poverty reduction by combining relatively higheconomic growth rates with a high growth elasticity of poverty. Others, suchas West Bengal, compensate for low growth with a high growth elasticity of
62 Besley, Burgess, and Esteve-Volart
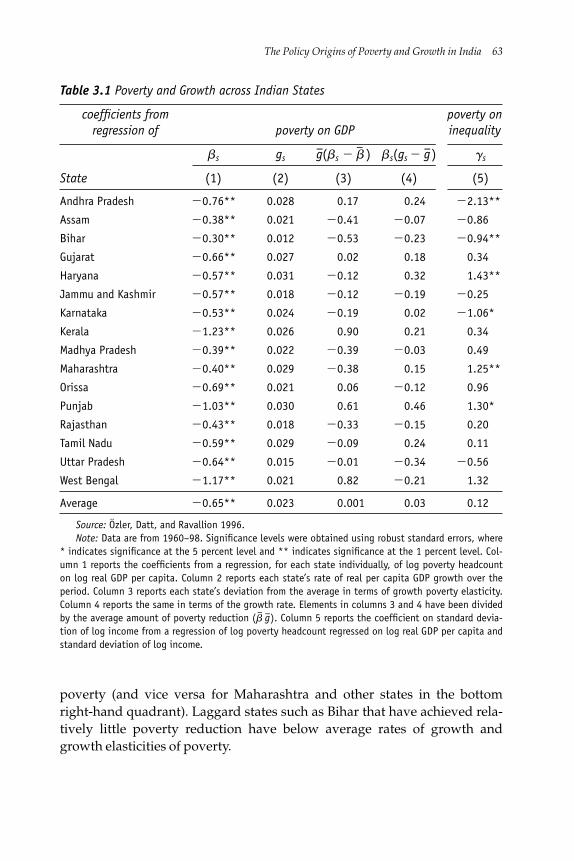
poverty (and vice versa for Maharashtra and other states in the bottomright-hand quadrant). Laggard states such as Bihar that have achieved rela-tively little poverty reduction have below average rates of growth andgrowth elasticities of poverty.
The Policy Origins of Poverty and Growth in India 63
Table 3.1 Poverty and Growth across Indian States
coefficients from poverty on regression of poverty on GDP inequality
�s gs–g(�s �
–�) �s(gs � –g) �s
State (1) (2) (3) (4) (5)
Andhra Pradesh �0.76** 0.028 0.17 0.24 �2.13**
Assam �0.38** 0.021 �0.41 �0.07 �0.86
Bihar �0.30** 0.012 �0.53 �0.23 �0.94**
Gujarat �0.66** 0.027 0.02 0.18 0.34
Haryana �0.57** 0.031 �0.12 0.32 1.43**
Jammu and Kashmir �0.57** 0.018 �0.12 �0.19 �0.25
Karnataka �0.53** 0.024 �0.19 0.02 �1.06*
Kerala �1.23** 0.026 0.90 0.21 0.34
Madhya Pradesh �0.39** 0.022 �0.39 �0.03 0.49
Maharashtra �0.40** 0.029 �0.38 0.15 1.25**
Orissa �0.69** 0.021 0.06 �0.12 0.96
Punjab �1.03** 0.030 0.61 0.46 1.30*
Rajasthan �0.43** 0.018 �0.33 �0.15 0.20
Tamil Nadu �0.59** 0.029 �0.09 0.24 0.11
Uttar Pradesh �0.64** 0.015 �0.01 �0.34 �0.56
West Bengal �1.17** 0.021 0.82 �0.21 1.32
Average �0.65** 0.023 0.001 0.03 0.12
Source: Özler, Datt, and Ravallion 1996.Note: Data are from 1960–98. Significance levels were obtained using robust standard errors, where
* indicates significance at the 5 percent level and ** indicates significance at the 1 percent level. Col-umn 1 reports the coefficients from a regression, for each state individually, of log poverty headcounton log real GDP per capita. Column 2 reports each state’s rate of real per capita GDP growth over theperiod. Column 3 reports each state’s deviation from the average in terms of growth poverty elasticity.Column 4 reports the same in terms of the growth rate. Elements in columns 3 and 4 have been dividedby the average amount of poverty reduction (–
� –g). Column 5 reports the coefficient on standard devia-tion of log income from a regression of log poverty headcount regressed on log real GDP per capita andstandard deviation of log income.
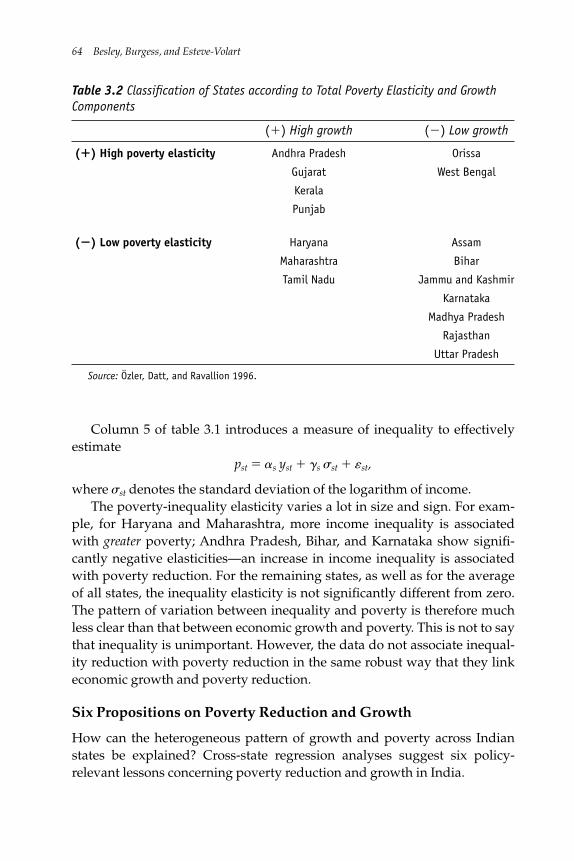
Column 5 of table 3.1 introduces a measure of inequality to effectivelyestimate
pst � �s yst � �s �st � �st,
where �st denotes the standard deviation of the logarithm of income.The poverty-inequality elasticity varies a lot in size and sign. For exam-
ple, for Haryana and Maharashtra, more income inequality is associatedwith greater poverty; Andhra Pradesh, Bihar, and Karnataka show signifi-cantly negative elasticities—an increase in income inequality is associatedwith poverty reduction. For the remaining states, as well as for the averageof all states, the inequality elasticity is not significantly different from zero.The pattern of variation between inequality and poverty is therefore muchless clear than that between economic growth and poverty. This is not to saythat inequality is unimportant. However, the data do not associate inequal-ity reduction with poverty reduction in the same robust way that they linkeconomic growth and poverty reduction.
Six Propositions on Poverty Reduction and Growth
How can the heterogeneous pattern of growth and poverty across Indianstates be explained? Cross-state regression analyses suggest six policy-relevant lessons concerning poverty reduction and growth in India.
64 Besley, Burgess, and Esteve-Volart
Table 3.2 Classification of States according to Total Poverty Elasticity and GrowthComponents
(�) High growth (�) Low growth
(�) High poverty elasticity Andhra Pradesh Orissa
Gujarat West Bengal
Kerala
Punjab
(�) Low poverty elasticity Haryana Assam
Maharashtra Bihar
Tamil Nadu Jammu and Kashmir
Karnataka
Madhya Pradesh
Rajasthan
Uttar Pradesh
Source: Özler, Datt, and Ravallion 1996.
The Policy Origins of Poverty and Growth in India 65
Voice and Accountability
How can government be encouraged to respond to the needs of the poorestcitizens? Besley and Burgess (2002) analyze this issue in the context of pub-lic food distribution and calamity relief in India and find that mass mediaand political competition are important in ensuring that the governmentresponds effectively to the needs of vulnerable citizens when they face nat-ural disasters.
They use 1958–92 panel data from India’s states to explore the role of themedia and political competition in mitigating political agency problems byproviding information to voters. They focus on the public food distributionand calamity relief systems in India, which were established, in part, to dealwith the threat posed by famine and natural calamities (such as droughts,floods, earthquakes, and cyclones). The public food distribution system,which involves large-scale procurement, storage, transportation, and distri-bution of food grains, is a key means of responding to drops in food produc-tion caused by droughts. Calamity relief expenditure covers a variety ofdirect relief measures, such as drinking water supply, medicine and health,clothing and food, veterinary care, and assistance for repair of damagedproperty and is a means for state governments to respond to crop damagecaused by floods.
Besley and Burgess (2002) pose two main questions. First, in the event ofa fall in food production caused by drought, does having greater newspapercirculation or stronger political competition imply that state governmentswill be more responsive in terms of distributing greater amounts of foodthrough the public food distribution system? Second, in the event that aflood damages crops, does having greater newspaper circulation or strongerpolitical competition imply that state governments will be more responsivein terms of spending more on calamity relief?
They find that when food production falls, states with higher per capitanewspaper circulation and more intense political competition are moreresponsive in terms of public food distribution. Similarly, when floods dam-age crops, the states with higher per capita newspaper circulation and moreintense political competition spend more on calamity relief.
In examining the role of the media in greater detail, Besley and Burgess(2002) find that regional newspapers appear to be associated with moreresponsive governments. These newspapers (printed in regional languages)report more localized events, and their readers tend to be people who relyon action by state governments for protection.
Another political economy issue with relevance to poverty reductionefforts is representation of disadvantaged groups. Scheduled castes and
scheduled tribes, which constitute lower classes, as recognized by theIndian constitution, represent roughly 16 and 8 percent of the Indian popu-lation, respectively. But the incidence of poverty in these two groups is oneand a half times that in the rest of the population. Hence, poverty reductioncould be affected more than proportionally by enhancing the groups’ politi-cal power.
Pande (2003) exploits the institutional features of political reservation—the setting aside of seats in state legislatures for scheduled castes and sched-uled tribes—as practiced in Indian states from 1960 to 1992, to examine therole of mandated political representation in giving disadvantaged groupsinfluence over policy making. Her study is of practical importance, becausea quarter of all legislators in India, at both the national and state level, comefrom reserved jurisdictions. She uses changes in the extent of political reser-vation, which are specific to a given state, to identify how changes in thegroup shares of minority legislators affect policy outcomes. Her main find-ing is that political reservation has increased redistribution of resources tothe groups that benefit from the reservation.
Pande (2003) finds that scheduled caste (SC) reservation increases jobquotas (in particular, a 1 percent rise in SC reservation increases job quotasby 0.6 percent), whereas scheduled tribe (ST) reservation increases spendingon ST programs (a 1 percent increase in ST reservation increases the sharedevoted to ST welfare programs by 0.8 percentage points). This finding isconsistent with the nature of the SC and ST groups: because SC individualsare more educated and geographically more dispersed than ST individuals,they have higher returns from individual-specific policies as job quotas; STindividuals, who are less dispersed, benefit more from geographically local-ized welfare programs. In sum, changes in legislator identity in India haveexerted a significant influence on state-level policies.
Regulation
Labor regulations are an important element of the investment climate inIndia (Sachs, Varshney, and Bajpai 1999; Stern 2001). Besley and Burgess(2004) examine whether labor can help explain differences in urban povertyand manufacturing performance across Indian states. Manufacturing hashistorically played a large role in the structural change accompanyingeconomic development and has been a key driver in reducing poverty.Between 1960 and 1995 the share of manufacturing in GDP increased three-fold in many East Asian countries (from 8 percent to 26 percent inMalaysia). These countries also experienced sharp reductions in poverty.
66 Besley, Burgess, and Esteve-Volart
However, manufacturing in India only increased from 13 percent to 18 per-cent in the same period. The manufacturing sector in India consists of twosubsectors: registered (formal, about 9 percent of GDP) and unregistered(informal, about 5 percent of GDP) manufacturing. Firms are required toregister if they employ more than 10 individuals and use electric power, or ifthey do not use electric power but employ more than 20 individuals.
The analysis of Besley and Burgess (2004) exploits two important facts:(1) labor regulations apply only to firms in the registered manufacturingsector, and (2) the Indian constitution empowers state governments toamend central legislation. The main piece of central legislation is the Indus-trial Disputes Act of 1947. State governments extensively amended this actduring the postindependence period. Besley and Burgess read the text ofeach amendment and coded each as pro-worker (�1), neutral (0), or pro-employer (�1).
Besley and Burgess then check whether regulatory changes affect urbanand rural poverty and manufacturing development in the registered andunregistered sectors. They find that regulating in a pro-worker direction isassociated with increases in urban poverty but does not affect rural poverty.This finding reflects the fact that the adverse effects of pro-worker labor reg-ulation are on the growth of registered manufacturing, which is mainlylocated in urban areas. These effects are large—for example, had WestBengal, a state with substantial pro-worker legislation, passed no amend-ments, its urban poverty would have been 11 percent lower in 1990. AndhraPradesh, in contrast, would have had 12 percent higher urban poverty hadit not moved in a pro-employer direction. These results suggest thatattempts to redress the balance of power between capital and labor can endup hurting the poor. They also show that states with more pro-worker laborregulations tend to have larger informal manufacturing sectors. This find-ing makes sense: workers can extract more of the rents from production inthe registered sector; capitalists prefer to remain in the unregistered sectorwhere labor has no power.
As Besley and Burgess (2004) show, the labor regulation choices of stategovernments in India have greatly affected manufacturing performance.Policies like labor regulation that are, in part, under the control of subna-tional governments have a strong bearing on whether or not manufacturingdevelops in areas under the governments’ jurisdiction. These policies affectthe ability of the poor to participate in manufacturing and to exit poverty.The institutional environment affects the investment and location decisionsthat entrepreneurs make and can have an important bearing on the patternof poverty reduction in a state. Countries or regions wishing to develop
The Policy Origins of Poverty and Growth in India 67
manufacturing and reduce poverty must pay attention to the policies thataffect the business climate. Ways in which these policies can be made moreinclusive and pro-poor are an important area for future research.
The Besley and Burgess findings are particularly resonant for the post-1991 liberalization period, during which the negative consequences ofa poor investment climate have been magnified. When manufacturingindustries were exposed to domestic and foreign competition through deli-censing and tariff reductions, Aghion and others (2005) found that theindustries located in pro-employer states performed significantly betterthan those located in pro-worker states.
Access to Finance
Access to finance can enable people to exit poverty by transforming theirproduction and employment activities. Understanding which factors drivestructural change by facilitating the emergence of small businesses andother nonagricultural activities is a major challenge in efforts to reducepoverty. Burgess and Pande (2005) took it on by evaluating whether themassive expansion of rural branch banks in India affected rural poverty andeconomic growth. In the 1961–2000 period over 30,000 new branches wereopened in rural areas. The rationale for the program was simple. The gov-ernment identified lack of access to finance as a significant reason for stag-nant growth and persistent poverty in rural areas. The failure of banks toenter rural areas was viewed as an impediment to entrepreneurship and theemergence of new production activities. To address this problem, the Indiancentral bank first nationalized commercial banks in 1969 and then imposeda license rule in 1977. The rule stated that for each branch opened in abanked (typically urban) location four more branches had to open in a loca-tion (typically rural) without a bank. This rule was removed in 1990, andbranch building in rural areas came to a halt. As a result of the imposition ofthe 1:4 rule, states that had fewer banks per capita before the program beganin 1961 received more bank branches between 1977 and 1990, leading toboth a reduction and an equalization in population per bank branch. Therural banks made lending to entrepreneurs, small businessmen, and agri-culturalists, as well as lower caste and tribal households, a priority.
To evaluate the program, Burgess and Pande (2005) use the 1977 and 1990trend breaks in the relationship between initial financial development andrural branch expansion attributable to license regime shifts as instrumentsfor the number of branches opened in the rural locations without banks.They show that rural branch expansion reduced rural poverty but had no
68 Besley, Burgess, and Esteve-Volart
The Policy Origins of Poverty and Growth in India 69
effect on urban poverty. They also find that the wages of agricultural labor-ers are positively affected by rural branch expansion, perhaps because a risein nonagricultural activities reduced the supply of labor to the agriculturesector, driving up the wages of the remaining agricultural laborers. Hence,these laborers, among the poorest in India and often having little access toland and nonagricultural employment activities, might benefit from ruralbranch expansion even if they do not transact directly with banks.
Burgess and Pande (2005) also find that rural branch expansion posi-tively affected economic growth across Indian states by driving up nonagri-cultural output. Agricultural output, in contrast, was unaffected. The (albeitforced) entry of banks into the rural areas of India is thought to havespurred entrepreneurship, structural change, and poverty reduction. Again,access to finance may be critical in enabling poor, rural residents to beginnew economic activities and thereby exit poverty.
Human Capital
Human capital is often viewed as a constraint on economic growth andpoverty reduction in India. Average literacy rates in India are low. Accord-ing to the 1991 Census of India, the literacy rate is 63 percent for males and36 percent for females. These rates are lower than those in many East andSoutheast Asian countries 40 years ago and are no higher than modern-dayrates in sub-Saharan Africa (Dreze and Sen 1995). Moreover, educationalachievements vary greatly across Indian states—male literacy rate rangesfrom 50 percent in Andhra Pradesh and Bihar to 93 percent in Kerala, andfemale literacy rates range from 17 percent in Rajasthan and 20 percent inUttar Pradesh to 84 percent in Kerala (Census of India 1991). Disparities inthe educational achievements of females and males, between rural andurban areas, and among castes are also large.
In the Indian constitution, education is mainly the responsibility ofstates. Therefore, the large differences in outcomes are due in part to the factthat efforts to expand education have varied enormously across states. Ini-tial conditions are also important. For example, in Kerala, the region withthe highest educational attainments in India, widespread literacy existedwell before British rule, and mass literacy since then has been achievedthrough a mass social movement to promote schooling (Dreze and Sen1997). By contrast, in Uttar Pradesh endemic teacher absenteeism and shirk-ing are linked to poor schooling outcomes (Dreze and Gazdar 1997).
Trivedi (2002) exploits this heterogeneity in educational outcomes acrossIndian states by building up a panel data set on male and female secondary
school enrollment rates for the period 1965 to 1992. He examines whetherthese rates are related to economic growth and finds a positive and signifi-cant relationship between both male and female enrollment rates and theannual rate of growth in per capita state income. Moreover, consistent withother evidence for India (for example, Esteve-Volart 2004), but in stark con-trast with results from cross-country studies,7 Trivedi (2002) finds thatfemale human capital has a larger impact on economic growth than malehuman capital.
These results suggest that investments in human capital may represent akey means of increasing economic growth in Indian states. How suchincreases in human capital will be achieved remains an open question thatcan be addressed only through microeconomic evaluation of specific inno-vations in the delivery of education in India. School governance andaccountability will need to be improved to tackle systemic failures such aswidespread teacher absenteeism. Promising initiatives include promotingparental and community involvement, changing incentives for teachers andstudents, and involving nonstate actors and nongovernmental organiza-tions in education provision. Duflo and Hanna (2005), for example, showthat when primary school teachers are required to photograph themselveswith a certain number of students each day, teacher attendance increases.Pedagogical innovations that improve the quality and relevance of educa-tion, in particular for poor and disadvantaged children, through curriculumreform, employment of female teachers for girl-friendly schools, hiring ofassistant teachers to deal with large classes, and new teaching methods andmaterials are also likely to be relevant (see Banerjee and others 2004).
Property Rights
Given that the majority of India’s poor reside in rural areas, rural develop-ment is key to India’s success in reducing poverty. Under the Indian consti-tution, states are empowered to enact and implement land reforms. Thesereforms fall into four categories: tenancy reform, abolition of intermediaries,imposition of ceilings on landholdings (to redistribute land to the landless),and consolidation of disparate landholdings.
Besley and Burgess (2000) assigned each land reform act passed in anIndian state to one of these categories and analyzed how the act affectedpoverty and growth using state-level data from 1958 to 1992. They foundthat land reform taken as a whole is associated with reductions in ruralpoverty and that tenancy reforms and the abolition of intermediariesaccount for this effect. These results suggest that more moderate reforms
70 Besley, Burgess, and Esteve-Volart
that improve the property rights and bargaining power of tenants (and mar-ginal farmers) may have had significant effects on rural poverty, whereasattempts to directly redistribute land had no effect, because powerfullanded elites tended to block or evade them. There appears to be a trade-offbetween tenancy reforms and growth of agricultural output. Though theyreduce poverty, tenancy reforms are negatively associated with the growthof real agricultural output per capita.
Other studies confirm the importance of secure property rights topoverty reduction. Links between property rights and economic perfor-mance have been proffered in the cross-country literature. Microeconomicstudies now complement this evidence. Some of these studies extendbeyond agricultural property rights—for example, to property rights overland in urban areas (see Field 2004). This area is ripe for future research onIndia.
The work by Besley and Burgess (2000) focuses on land reform after inde-pendence. But by 1950, interesting and important differences amonghistorical landholding institutions already existed, and these differencescould be important to subsequent performance. Landholding institutionsthat favored landlords dominated some states but not others, dependingon choices made by British administrators during the colonial period. Inlandlord-based areas, landlords collected land revenues, whereas in non-landlord areas British officials or a village community body collected them.Banerjee and Iyer (2002) constructed an index of landholding institutions onthe basis of the area in a state not under a landlord tenure system and showedthat districts with systems of land-revenue collection that remained inindigenous hands have tended to experience better public goods provision.
Gender
Gender inequality in literacy in India is among the highest in developingcountries. Heterogeneity in female literacy rates across India’s states is alsosignificant, as noted above. Northern states (most notably Rajasthan andBihar) are characterized by relatively low female literacy rates; southernstates have traditionally had higher female literacy rates. Indeed, northernregions tend to be more patriarchal and feudal (and have lower female-to-male sex ratios and therefore more “missing women” as calculated by Sen[1992]) than southern regions, where generally women have more freedomand a more prominent presence in society (Dreze and Sen 1995).
In India the participation of women in productive sectors is relativelylow. Female labor participation was lower in 1991 (20 percent) than in
The Policy Origins of Poverty and Growth in India 71
1901–51. As is the case with literacy and sex ratios, southeastern states tendto have larger rates of female labor force participation than northwesternstates. In general, women in the middle classes tend not to participate in thelabor force, whereas women from poorer households must engage in pro-ductive activity outside the home. That is, female labor participation inIndia is the result of the interaction between social norms (enforced bysocial stigma that obliges men to provide for their families) and economicconditions. The larger the family income, the more binding are the socialnorms.
Esteve-Volart (2004) uses state panel data for the period 1961 to 1991 toexamine the aggregate costs, in terms of development, of gender discrimi-nation in the labor market. She finds that these costs are substantial. Sheshows positive relationships between the ratios of female-to-male managersand female-to-male workers and per capita real output. She also shows thatfemale literacy is positively associated with development, whereas male lit-eracy is not statistically significant. She deals with endogeneity concerns byinstrumenting both the female-to-male managers and workers with theratio of prosecutions launched relative to complaints received by inspectorsunder the Maternity Benefits Act of 1961. Gender inequality in access tolabor markets impedes development, and the efficiency costs of suchinequality are large.
Summary of Findings
The Indian experience is specific in many ways. Moreover, the data are, bydefinition, backward looking. However, isolating the forces that shape thevariety of Indian experiences observable at the state level is tremendouslyvaluable. Identifying the policy origins of growth and poverty in India iskey to informing the current debate and to shaping future policy.
Table 3.3 connects the policy analysis above to the earlier discussion ofgrowth-poverty links. It ranks Indian states by their growth elasticity ofpoverty, growth rates, rates of poverty reduction, and performance in eachof the six areas of policy discussed above. The table thus allows an informallook at how policy performance is linked to the growth elasticity of povertyand growth and hence to a state’s overall record in reducing poverty. Thefirst three columns identify the states that have been most effective at reduc-ing poverty. These states have tended to have high growth elasticities ofpoverty and fast growth rates. Poverty reduction is greatest in states likeKerala, Punjab, and Andhra Pradesh, where higher-than-average growthelasticities of poverty have been combined with higher-than-average
72 Besley, Burgess, and Esteve-Volart
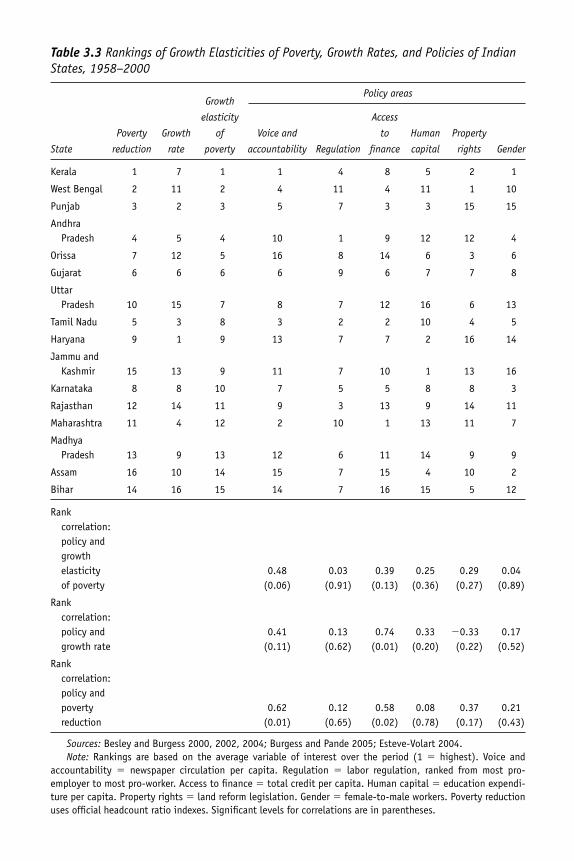
Table 3.3 Rankings of Growth Elasticities of Poverty, Growth Rates, and Policies of IndianStates, 1958–2000
GrowthPolicy areas
elasticity Access
Poverty Growth of Voice and to Human Property
State reduction rate poverty accountability Regulation finance capital rights Gender
Kerala 1 7 1 1 4 8 5 2 1
West Bengal 2 11 2 4 11 4 11 1 10
Punjab 3 2 3 5 7 3 3 15 15
Andhra Pradesh 4 5 4 10 1 9 12 12 4
Orissa 7 12 5 16 8 14 6 3 6
Gujarat 6 6 6 6 9 6 7 7 8
Uttar Pradesh 10 15 7 8 7 12 16 6 13
Tamil Nadu 5 3 8 3 2 2 10 4 5
Haryana 9 1 9 13 7 7 2 16 14
Jammu and Kashmir 15 13 9 11 7 10 1 13 16
Karnataka 8 8 10 7 5 5 8 8 3
Rajasthan 12 14 11 9 3 13 9 14 11
Maharashtra 11 4 12 2 10 1 13 11 7
Madhya Pradesh 13 9 13 12 6 11 14 9 9
Assam 16 10 14 15 7 15 4 10 2
Bihar 14 16 15 14 7 16 15 5 12
Rank correlation: policy and growth elasticity 0.48 0.03 0.39 0.25 0.29 0.04of poverty (0.06) (0.91) (0.13) (0.36) (0.27) (0.89)
Rank correlation: policy and 0.41 0.13 0.74 0.33 �0.33 0.17growth rate (0.11) (0.62) (0.01) (0.20) (0.22) (0.52)
Rank correlation: policy andpoverty 0.62 0.12 0.58 0.08 0.37 0.21reduction (0.01) (0.65) (0.02) (0.78) (0.17) (0.43)
Sources: Besley and Burgess 2000, 2002, 2004; Burgess and Pande 2005; Esteve-Volart 2004.Note: Rankings are based on the average variable of interest over the period (1 � highest). Voice and
accountability � newspaper circulation per capita. Regulation � labor regulation, ranked from most pro-employer to most pro-worker. Access to finance � total credit per capita. Human capital � education expendi-ture per capita. Property rights � land reform legislation. Gender � female-to-male workers. Poverty reductionuses official headcount ratio indexes. Significant levels for correlations are in parentheses.
growth. Poverty reduction is lowest in states like Bihar, Assam, and MadhyaPradesh, where both elasticities and growth rates are low.
The remaining columns correlate poverty elasticity, growth, and povertyreduction with policy indicators. These columns indicate how the stateexperience of pro-poor growth is linked to policy themes.
In the column on voice and accountability, a higher newspaper circula-tion per capita is associated with a higher growth elasticity of poverty, ahigher growth rate, and a higher overall reduction in poverty. In the columnon regulation, states are ranked from most pro-employer (Andhra Pradesh)to most pro-worker (West Bengal). More pro-worker regulation is associ-ated with lower growth elasticities of poverty, lower growth rates, and lesspoverty reduction. A similar pattern is found in the access to finance col-umn, where states are ranked by per capita credit extended by commercialbanks. States with greater access to finance have higher growth rates, higherelasticities of poverty to growth, and more rapid reductions in poverty. Thesame pattern of correlations is recorded for human capital as proxied bystate education expenditures per capita in the next column.
Property rights are proxied by the number of land reform acts passed ina state. The correlation of this variable with the growth elasticities ofpoverty is positive though that with growth rates is negative. In otherwords, states that have passed more land reforms are more efficient at con-verting growth into poverty, however a growth cost appears to be associ-ated with land reforms. The overall association between the passage of landreforms and poverty reduction is, however, positive, suggesting that thegrowth costs are not of sufficient magnitude to overturn the poverty-reducing effects of land reform.
Finally, in the column on gender, inclusion of females in the labor force,as proxied by the ratio of female-to-male workers, is positively correlatedwith a higher growth elasticity of poverty, higher growth rates, and morerapid poverty reduction.
Although not admitting a causal interpretation, this table indicates thedifferent policy origins of poverty reduction and growth in India.8 Broadlyspeaking, states with more accountable governments, more pro-businessinvestment climates, greater access to finance and human capital, greaterextension of property rights to the poor, and greater inclusion of women ineconomic growth have been more successful in reducing poverty. The posi-tive association between policy variables and growth elasticities of povertyand growth rates helps clarify the variables’ overall effect on poverty. Thepolicies we have identified may be poverty reducing because they posi-tively affect growth and enhance the poverty effect of growth. These policies
74 Besley, Burgess, and Esteve-Volart
are powerful because they enhance growth and include the poor in thegrowth process.
There are grounds for optimism about future poverty reduction in India.First, the Indian economy is growing at an unprecedented rate, and histori-cal experience suggests that this growth will lead to a widespread reductionin absolute poverty. Second, the building blocks of sustained economicgrowth and poverty reduction are known. The evidence from cross-statestudies is consistent with basic messages from modern growth theory.Physical and human capital must be accumulated, institutional reformsthat expand opportunities for households (and individuals) must be imple-mented, the business climate must be improved, and the accountability ofelected officials must be increased.
Notes
1. Estimates of poverty derived from the NSS data use the urban and ruralpoverty lines developed by India’s Planning Commission (Government of India1979). The most common measure of poverty is the headcount ratio, which estimatesthe proportion of the relevant population living in households with consumption orincome below the poverty line.
2. Measurement of poverty and inequality in India has particularly benefitedfrom the work of a World Bank team headed by Martin Ravallion, who usedtabulated NSS data to put together poverty and inequality series (Özler, Datt, andRavallion 1996).
3. Surveys up to 1993/94 (50th round) generate relatively uncontroversial esti-mates, but changes in the survey design and sampling have raised questions aboutthe comparability of the quinquennial 50th and 55th rounds of the Consumer Expen-diture Survey. As a consequence, the accuracy of official estimates reflecting a steepreduction in poverty in all but 2 of the 16 study states (Assam and Bihar) in the 1990sis unclear. Considerable debate has led to adjusted numbers (Deaton and Dreze2002; Lal, Mohan, and Natarajan 2001; Sundaram 2001; Sundaram and Tendulkar2003a, 2003b, 2003c).
4. For a more complete analysis, see Datt and Ravallion (1998, 2002).
5. The former group includes Assam, Bihar, Jammu and Kashmir, MadhyaPradesh, Orissa, Rajasthan, Uttar Pradesh, and West Bengal; the latter groupincludes Andhra Pradesh, Gujarat, Haryana, Karnataka, Kerala, Maharashtra,Punjab, and Tamil Nadu.
6. Compare these numbers with estimates for other countries and regions. Besleyand Burgess (2003) estimate the poverty elasticity with respect to income per capitato be �0.73 (with a robust standard error of 0.25) for a sample of 88 low- and middle-income countries. This elasticity is about the same as the estimated elasticity forAndhra Pradesh, for which the elasticity equals �0.76 (with a standard error of
The Policy Origins of Poverty and Growth in India 75
0.05), and is similar to that of Orissa and Gujarat. Indeed, the average estimatedelasticity for Indian states is �0.65, just slightly below the estimated global averageelasticity. Although India’s average elasticity is somewhat modest in internationalterms, the estimates by state show the variety across India’s states: in particular, Ker-ala and West Bengal exhibit remarkable larger-than-one elasticities, as large as theelasticity for East Asia and the Pacific. On the more negative side, some Indian states(namely, Bihar, Assam, Madhya Pradesh, Maharashtra, and Rajasthan) have elastici-ties as low as those of Sub-Saharan Africa. Hence, table 3.1 exhibits variation inpoverty-growth elasticities among India’s states that is approximately as big as thevariation at the global level.
7. For a review and results, see Krueger and Lindahl (2001).
8. To underline the illustrative nature of these results, observe that the correla-tions for gender, human capital, and pro-poor regulation reported in table 3.3 are notsignificantly different from zero.
References
Aghion, Philippe, Robin Burgess, Stephen Redding, and Fabrizio Zilibotti. 2005.“The Unequal Effects of Liberalization: Evidence from Dismantling the LicenseRaj in India.” Working paper, Institute for International Economic Studies,London School of Economics, University College, London.
Banerjee, Abhijit, Shawn Cole, Esther Duflo, and Leigh Lindon. 2004. “RemedyingEducation: Evidence from Two Randomized Experiments in India.” Workingpaper, Department of Economics, Massachusetts Institute of Technology,Cambridge, MA.
Banerjee, Abhijit, and Lakshmi Iyer. 2002. “History, Institutions, and EconomicPerformance: The Legacy of Colonial Land Tenure Systems in India.” Workingpaper, Department of Economics, Massachusetts Institute of Technology,Cambridge, MA.
Besley, Timothy, and Robin Burgess. 2000. “Land Reform, Poverty, and Growth:Evidence from India.” Quarterly Journal of Economics 115 (2): 389–430.
_______. 2002. “The Political Economy of Government Responsiveness: Theory andEvidence from India.” Quarterly Journal of Economics 117 (4): 1415–51.
_______. 2003. “Halving Global Poverty.” Journal of Economic Perspectives 17 (3): 3–22.
_______. 2004. “Can Labor Regulation Hinder Economic Performance? Evidencefrom India.” Quarterly Journal of Economics 119 (1): 91–134.
Bourguignon, François. 2002. “The Growth Elasticity of Poverty Reduction: Explain-ing Heterogeneity across Countries and Time Periods.” Working paper, Départe-ment et laboratoire d’Economie Théorique et Appliquée (DELTA), Paris, France.
Burgess, Robin, and Rohini Pande. 2005. “Do Rural Banks Matter? Evidence fromthe Indian Social Banking Experiment.” American Economic Review 95: 780–95.
76 Besley, Burgess, and Esteve-Volart
Census of India. 1991. Registrar General and Census Commissioner, government ofIndia.
Datt, Gaurav, and Martin Ravallion. 1998. “Why Have Some Indian States DoneBetter than Others at Reducing Rural Poverty?” Economica 65 (257): 17–38.
_______. 2002. “Is India’s Economic Growth Leaving the Poor Behind?” Journal ofEconomic Perspectives 16 (3): 89–108.
Deaton, Angus, and Jean Dreze. 2002. “Poverty and Inequality in India: ARe-Examination.” Economic and Political Weekly (September 7): 3729–48.
Dollar, David, and Aart Kraay. 2002. “Growth Is Good for the Poor.” Journal of Economic Growth 7 (3): 195–225.
Dreze, Jean, and Haris Gazdar. 1997. “Uttar Pradesh: The Burden of Inertia.” InIndian Development: Selected Regional Perspectives, ed. Jean Dreze and AmartyaSen. Oxford: Oxford University Press.
Dreze, Jean, and Amartya Sen. 1995. India: Economic Development and Social Opportu-nity. Delhi: Oxford University Press.
. eds. 1997. Indian Development: Selected Regional Perspectives. Delhi: OxfordUniversity Press.
Duflo, Esther, and Rema Hanna. 2005. “Monitoring Works: Getting Teachersto Come to School.” Working paper, Massachusetts Institute of Technology,Cambridge, MA.
Esteve-Volart, Berta. 2004. “Gender Discrimination and Growth: Theory andEvidence from India.” Development Discussion Paper 42, Suntory and ToyotaCentres for Economics and Related Disciplines, London School of Economics.
Field, Erica. 2004. “Entitled to Work: Urban Property Rights and Labor Supply inPeru.” Working paper, Harvard University, Cambridge MA.
Government of India. 1979. Report of the Task Force on Projections of Minimum Needsand Effective Consumption. New Delhi: Planning Commission.
Krueger, Alan, and Mikael Lindahl. 2001. “Education for Growth: Why and forWhom?” Journal of Economic Literature 39 (4): 1101–36.
Lal, Deepak, Rakesh Mohan, and I. Natarajan. 2001. “Economic Reforms andPoverty Alleviation: A Tale of Two Surveys.” Economic and Political Weekly 36(March 24): 1017–28.
Pande, Rohini. 2003. “Can Mandated Political Representation Increase Policy Influ-ence for Disadvantaged Minorities? Theory and Evidence from India.” AmericanEconomic Review 93 (4): 1132–51.
Özler, Berk, Gaurav Datt, and Martin Ravallion. 1996. “A Database on Poverty andGrowth in India.” World Bank, Washington, DC. http://web.worldbank.org/WBSITE/EXTERNAL/TOPICS/EXTPOVERTY/0,,contentMDK:20289079~menuPK:497971~pagePK:148956~piPK:216618~theSitePK:336992,00.html
The Policy Origins of Poverty and Growth in India 77
Ravallion, Martin. 2004. “Pro-Poor Growth: A Primer.” Policy Research WorkingPaper, No. 3242, World Bank, Washington, DC.
Sachs, Jeffrey, A. Varshney, and N. Bajpai, eds. 1999. India in the Era of EconomicReforms. Delhi: Oxford University Press.
Sen, Amartya. 1992. “Missing Women.” British Medical Journal 304 (6827): 587–88.
Stern, Nicholas. 2001. A Strategy for Development. Washington DC: World Bank.
Sundaram, K. 2001. “Employment and Poverty in the 1990s: Further Results fromNSS 55th Round Employment-Unemployment Survey, 1999–2000.” Economic andPolitical Weekly (August 11): 3039–49.
Sundaram, K., and Suresh D. Tendulkar. 2003a. “Poverty Has Declined in the 1990s:A Resolution of Comparability Problems in NSS Consumer Expenditure Data.”Economic and Political Weekly (January 25): 327–37.
_______. 2003b. “Poverty in India in the 1990s: An Analysis of Changes in 15 MajorStates.” Economic and Political Weekly (April 5): 1385–93.
_______. 2003c. “Poverty in India in the 1990s: Revised Results for All-India and 15Major States for 1993–94.” Economic and Political Weekly (November 15): 4865–72.
Trivedi, Kamakshya. 2002. “Educational Human Capital and Levels of Income:Evidence from States in India, 1965–92.” Working paper, Oxford University,Oxford, UK.
78 Besley, Burgess, and Esteve-Volart
4Explaining Pro-Poor Growth inBangladesh: Puzzles, Evidence,and Implications
Binayak Sen, Mustafa K. Mujeri, and Quazi Shahabuddin
Bangladesh is one of the most vulnerable economies in the world. It has anextremely high population density, a low resource base, a high incidence ofnatural disasters, and sociopolitical instability, especially since gainingindependence in 1971.1 During the 1970s, negative images of the countrywere fed by social upheavals, economic mismanagement, and the absenceof democratic governance. Observers considered the country to be locked ina below-poverty-level equilibrium trap impervious to any policy-basedsolution short of radical restructuring (see Alamgir 1978). Bleak develop-ment indicators of the period supported such a view. Analysts examineddiverse theoretical explanations for Bangladesh’s inability to make the tran-sition to modernity during the 1980s (see, for example, Abdullah and others1991; Sobhan 1991).
In recent years, Bangladesh has made that transition at a low level of percapita income (see Stern 2002) and in many respects is regarded as a leadperformer among the least developed countries. Improvements in humandevelopment have been particularly remarkable: by 2004 Bangladesh had a
79
The authors are grateful to comments and suggestions from Louise Cord, Adrian Wood, JohnToye, Christian Rogg, Shanta Devarajan, Christine Wallich, and Anthony Bottrill. The authorsare also thankful to Catherine Hull for editorial assistance and to Syed Rashed Al-Zayed Joshfor research support.
lower infant mortality rate than India and had eliminated the gender bias inprimary education (Drèze 2004). On the economic front, it has made signifi-cant gains in poverty reduction and per capita GDP growth. Moreover,it achieved a poverty-reducing pattern of growth despite endemic vulnera-bility to natural disasters. Underlying the aggregate growth statistics issignificant success in overcoming the threat of famine.2
This chapter considers how Bangladesh has overcome difficult initialconditions that constrained its options for growth and poverty reduction.Placing Bangladesh’s experience in a postindependence historical context,the chapter focuses its empirical analysis on the 1980s and 1990s, decades ofsignificant economic achievements. Progress has been achieved throughmacroeconomic stability and openness, which created fiscal space for sus-tained investments in rural infrastructure and social services. Improvedvulnerability management and a generally constructive relationshipbetween the government and civil society have allowed the country to over-come its challenging environment.
Bangladesh’s achievements should not be overplayed, however. Modestgains in GDP leave the country firmly within the bracket of least developedcountry (LDC) status. These gains not only need to be sustained butincreased. Rising inequality trends offer further cause for concern.Bangladesh’s institutional environment remains weak, increasing the riskthat policy mistakes, bad luck, or lack of political leadership may reverserecent gains.
Thus in considering the evidence on pro-poor growth in Bangladesh andhighlighting the remarkable gains made in income and nonincome indica-tors in the 1990s, the chapter notes worrisome inequality trends. It examineshow macroeconomic policy, public expenditures, and policy choices enabledBangladesh to achieve its respectable rates of pro-poor growth in spite of arelatively weak institutional environment. It also examines rising inequalityfrom both an urban and rural perspective and considers whether the trendwas inevitable in each context. Finally, it identifies lessons from Bangladesh’sexperience and outlines priority policies to sustain pro-poor growth.
Evidence on Pro-Poor Growth
Income and nonincome indicators of poverty, as well as improvements inGDP (both in terms of levels and decreasing volatility), provide evidenceof sustained poverty reduction in Bangladesh. However, increases ininequality in the 1990s hindered the extent to which growth benefited thepoor.
80 Sen, Mujeri, and Shahabuddin
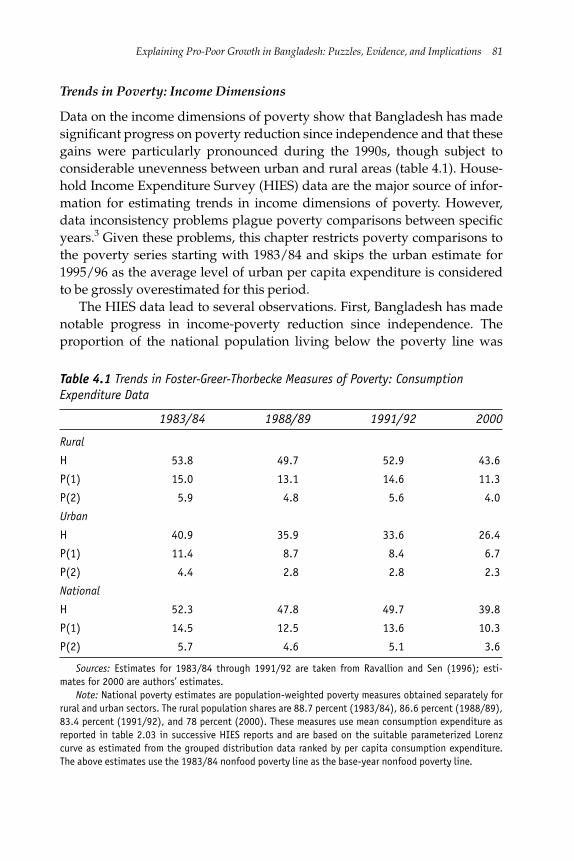
Explaining Pro-Poor Growth in Bangladesh: Puzzles, Evidence, and Implications 81
Trends in Poverty: Income Dimensions
Data on the income dimensions of poverty show that Bangladesh has madesignificant progress on poverty reduction since independence and that thesegains were particularly pronounced during the 1990s, though subject toconsiderable unevenness between urban and rural areas (table 4.1). House-hold Income Expenditure Survey (HIES) data are the major source of infor-mation for estimating trends in income dimensions of poverty. However,data inconsistency problems plague poverty comparisons between specificyears.3 Given these problems, this chapter restricts poverty comparisons tothe poverty series starting with 1983/84 and skips the urban estimate for1995/96 as the average level of urban per capita expenditure is consideredto be grossly overestimated for this period.
The HIES data lead to several observations. First, Bangladesh has madenotable progress in income-poverty reduction since independence. Theproportion of the national population living below the poverty line was
Table 4.1 Trends in Foster-Greer-Thorbecke Measures of Poverty: ConsumptionExpenditure Data
1983/84 1988/89 1991/92 2000
Rural
H 53.8 49.7 52.9 43.6
P(1) 15.0 13.1 14.6 11.3
P(2) 5.9 4.8 5.6 4.0
Urban
H 40.9 35.9 33.6 26.4
P(1) 11.4 8.7 8.4 6.7
P(2) 4.4 2.8 2.8 2.3
National
H 52.3 47.8 49.7 39.8
P(1) 14.5 12.5 13.6 10.3
P(2) 5.7 4.6 5.1 3.6
Sources: Estimates for 1983/84 through 1991/92 are taken from Ravallion and Sen (1996); esti-mates for 2000 are authors’ estimates.
Note: National poverty estimates are population-weighted poverty measures obtained separately forrural and urban sectors. The rural population shares are 88.7 percent (1983/84), 86.6 percent (1988/89),83.4 percent (1991/92), and 78 percent (2000). These measures use mean consumption expenditure asreported in table 2.03 in successive HIES reports and are based on the suitable parameterized Lorenzcurve as estimated from the grouped distribution data ranked by per capita consumption expenditure.The above estimates use the 1983/84 nonfood poverty line as the base-year nonfood poverty line.
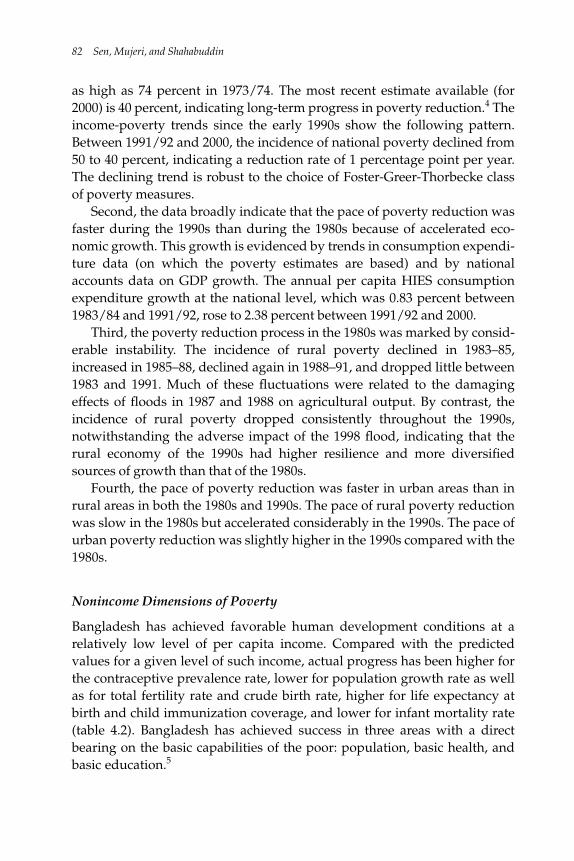
as high as 74 percent in 1973/74. The most recent estimate available (for2000) is 40 percent, indicating long-term progress in poverty reduction.4 Theincome-poverty trends since the early 1990s show the following pattern.Between 1991/92 and 2000, the incidence of national poverty declined from50 to 40 percent, indicating a reduction rate of 1 percentage point per year.The declining trend is robust to the choice of Foster-Greer-Thorbecke classof poverty measures.
Second, the data broadly indicate that the pace of poverty reduction wasfaster during the 1990s than during the 1980s because of accelerated eco-nomic growth. This growth is evidenced by trends in consumption expendi-ture data (on which the poverty estimates are based) and by nationalaccounts data on GDP growth. The annual per capita HIES consumptionexpenditure growth at the national level, which was 0.83 percent between1983/84 and 1991/92, rose to 2.38 percent between 1991/92 and 2000.
Third, the poverty reduction process in the 1980s was marked by consid-erable instability. The incidence of rural poverty declined in 1983–85,increased in 1985–88, declined again in 1988–91, and dropped little between1983 and 1991. Much of these fluctuations were related to the damagingeffects of floods in 1987 and 1988 on agricultural output. By contrast, theincidence of rural poverty dropped consistently throughout the 1990s,notwithstanding the adverse impact of the 1998 flood, indicating that therural economy of the 1990s had higher resilience and more diversifiedsources of growth than that of the 1980s.
Fourth, the pace of poverty reduction was faster in urban areas than inrural areas in both the 1980s and 1990s. The pace of rural poverty reductionwas slow in the 1980s but accelerated considerably in the 1990s. The pace ofurban poverty reduction was slightly higher in the 1990s compared with the1980s.
Nonincome Dimensions of Poverty
Bangladesh has achieved favorable human development conditions at arelatively low level of per capita income. Compared with the predictedvalues for a given level of such income, actual progress has been higher forthe contraceptive prevalence rate, lower for population growth rate as wellas for total fertility rate and crude birth rate, higher for life expectancy atbirth and child immunization coverage, and lower for infant mortality rate(table 4.2). Bangladesh has achieved success in three areas with a directbearing on the basic capabilities of the poor: population, basic health, andbasic education.5
82 Sen, Mujeri, and Shahabuddin
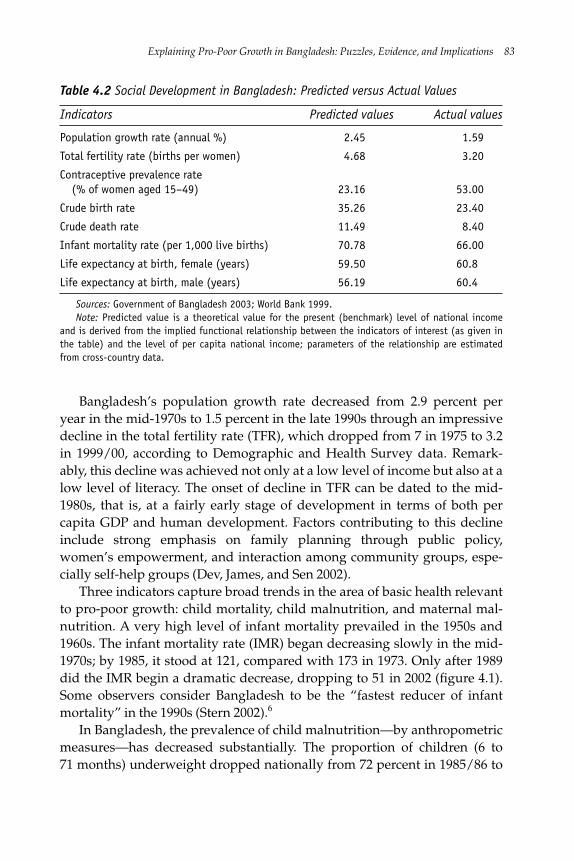
Explaining Pro-Poor Growth in Bangladesh: Puzzles, Evidence, and Implications 83
Table 4.2 Social Development in Bangladesh: Predicted versus Actual Values
Indicators Predicted values Actual values
Population growth rate (annual %) 2.45 1.59
Total fertility rate (births per women) 4.68 3.20
Contraceptive prevalence rate (% of women aged 15–49) 23.16 53.00
Crude birth rate 35.26 23.40
Crude death rate 11.49 8.40
Infant mortality rate (per 1,000 live births) 70.78 66.00
Life expectancy at birth, female (years) 59.50 60.8
Life expectancy at birth, male (years) 56.19 60.4
Sources: Government of Bangladesh 2003; World Bank 1999.Note: Predicted value is a theoretical value for the present (benchmark) level of national income
and is derived from the implied functional relationship between the indicators of interest (as given inthe table) and the level of per capita national income; parameters of the relationship are estimatedfrom cross-country data.
Bangladesh’s population growth rate decreased from 2.9 percent peryear in the mid-1970s to 1.5 percent in the late 1990s through an impressivedecline in the total fertility rate (TFR), which dropped from 7 in 1975 to 3.2in 1999/00, according to Demographic and Health Survey data. Remark-ably, this decline was achieved not only at a low level of income but also at alow level of literacy. The onset of decline in TFR can be dated to the mid-1980s, that is, at a fairly early stage of development in terms of both percapita GDP and human development. Factors contributing to this declineinclude strong emphasis on family planning through public policy,women’s empowerment, and interaction among community groups, espe-cially self-help groups (Dev, James, and Sen 2002).
Three indicators capture broad trends in the area of basic health relevantto pro-poor growth: child mortality, child malnutrition, and maternal mal-nutrition. A very high level of infant mortality prevailed in the 1950s and1960s. The infant mortality rate (IMR) began decreasing slowly in the mid-1970s; by 1985, it stood at 121, compared with 173 in 1973. Only after 1989did the IMR begin a dramatic decrease, dropping to 51 in 2002 (figure 4.1).Some observers consider Bangladesh to be the “fastest reducer of infantmortality” in the 1990s (Stern 2002).6
In Bangladesh, the prevalence of child malnutrition—by anthropometricmeasures—has decreased substantially. The proportion of children (6 to71 months) underweight dropped nationally from 72 percent in 1985/86 to
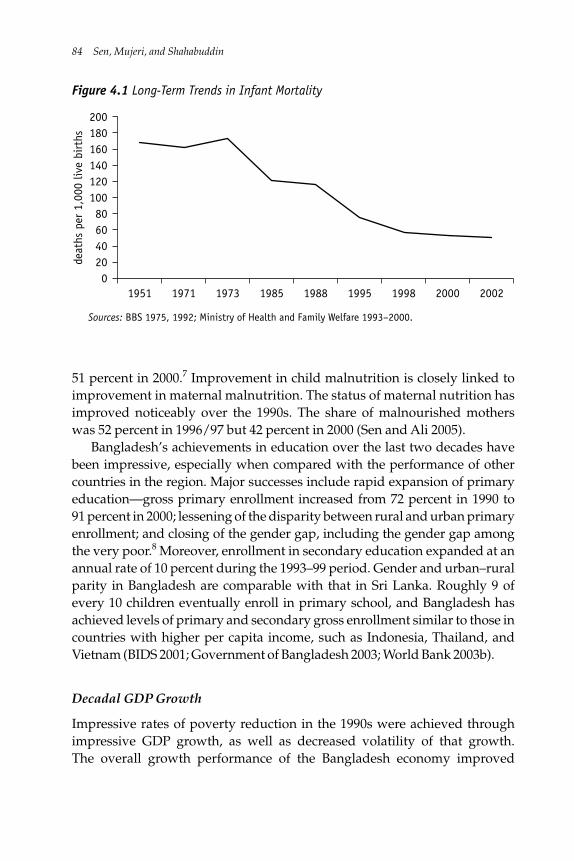
51 percent in 2000.7 Improvement in child malnutrition is closely linked toimprovement in maternal malnutrition. The status of maternal nutrition hasimproved noticeably over the 1990s. The share of malnourished motherswas 52 percent in 1996/97 but 42 percent in 2000 (Sen and Ali 2005).
Bangladesh’s achievements in education over the last two decades havebeen impressive, especially when compared with the performance of othercountries in the region. Major successes include rapid expansion of primaryeducation—gross primary enrollment increased from 72 percent in 1990 to91 percent in 2000; lessening of the disparity between rural and urban primaryenrollment; and closing of the gender gap, including the gender gap amongthe very poor.8 Moreover, enrollment in secondary education expanded at anannual rate of 10 percent during the 1993–99 period. Gender and urban–ruralparity in Bangladesh are comparable with that in Sri Lanka. Roughly 9 ofevery 10 children eventually enroll in primary school, and Bangladesh hasachieved levels of primary and secondary gross enrollment similar to those incountries with higher per capita income, such as Indonesia, Thailand, andVietnam (BIDS 2001; Government of Bangladesh 2003; World Bank 2003b).
Decadal GDP Growth
Impressive rates of poverty reduction in the 1990s were achieved throughimpressive GDP growth, as well as decreased volatility of that growth.The overall growth performance of the Bangladesh economy improved
84 Sen, Mujeri, and Shahabuddin
0
4020
80
120
160
60
100
140
180200
deat
hs p
er 1
,000
live
bir
ths
1951 1971 1973 1985 1988 1995 1998 2000 2002
Figure 4.1 Long-Term Trends in Infant Mortality
Sources: BBS 1975, 1992; Ministry of Health and Family Welfare 1993–2000.
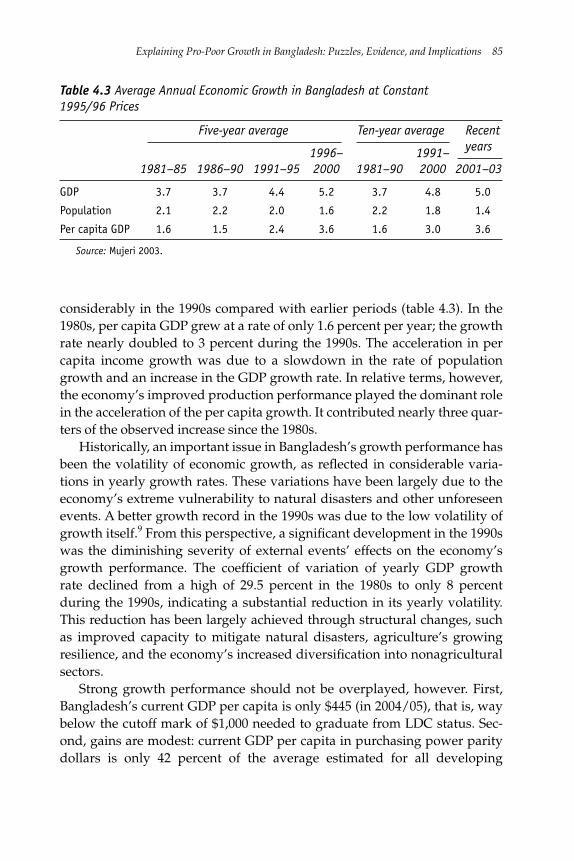
Explaining Pro-Poor Growth in Bangladesh: Puzzles, Evidence, and Implications 85
considerably in the 1990s compared with earlier periods (table 4.3). In the1980s, per capita GDP grew at a rate of only 1.6 percent per year; the growthrate nearly doubled to 3 percent during the 1990s. The acceleration in percapita income growth was due to a slowdown in the rate of populationgrowth and an increase in the GDP growth rate. In relative terms, however,the economy’s improved production performance played the dominant rolein the acceleration of the per capita growth. It contributed nearly three quar-ters of the observed increase since the 1980s.
Historically, an important issue in Bangladesh’s growth performance hasbeen the volatility of economic growth, as reflected in considerable varia-tions in yearly growth rates. These variations have been largely due to theeconomy’s extreme vulnerability to natural disasters and other unforeseenevents. A better growth record in the 1990s was due to the low volatility ofgrowth itself.9 From this perspective, a significant development in the 1990swas the diminishing severity of external events’ effects on the economy’sgrowth performance. The coefficient of variation of yearly GDP growthrate declined from a high of 29.5 percent in the 1980s to only 8 percentduring the 1990s, indicating a substantial reduction in its yearly volatility.This reduction has been largely achieved through structural changes, suchas improved capacity to mitigate natural disasters, agriculture’s growingresilience, and the economy’s increased diversification into nonagriculturalsectors.
Strong growth performance should not be overplayed, however. First,Bangladesh’s current GDP per capita is only $445 (in 2004/05), that is, waybelow the cutoff mark of $1,000 needed to graduate from LDC status. Sec-ond, gains are modest: current GDP per capita in purchasing power paritydollars is only 42 percent of the average estimated for all developing
Table 4.3 Average Annual Economic Growth in Bangladesh at Constant1995/96 Prices
Five-year average Ten-year average Recent
1996– 1991– years
1981–85 1986–90 1991–95 2000 1981–90 2000 2001–03
GDP 3.7 3.7 4.4 5.2 3.7 4.8 5.0
Population 2.1 2.2 2.0 1.6 2.2 1.8 1.4
Per capita GDP 1.6 1.5 2.4 3.6 1.6 3.0 3.6
Source: Mujeri 2003.
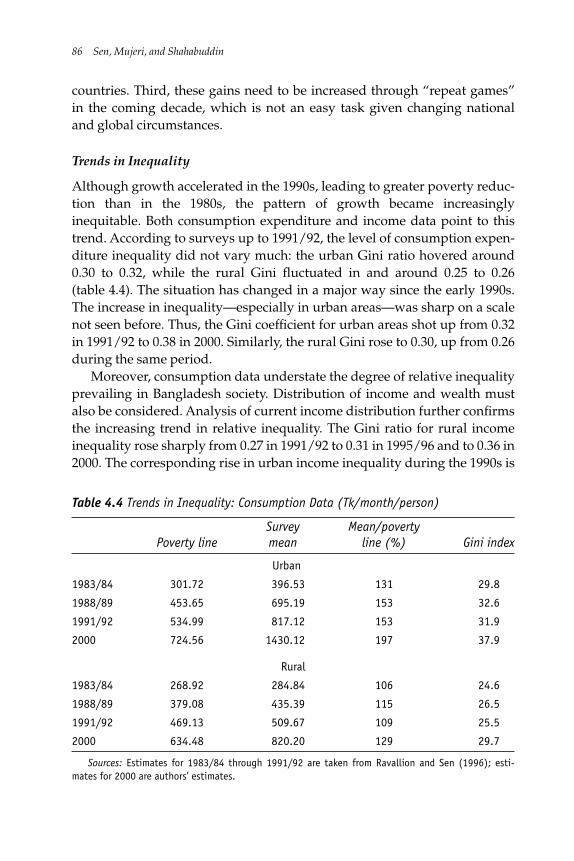
countries. Third, these gains need to be increased through “repeat games”in the coming decade, which is not an easy task given changing nationaland global circumstances.
Trends in Inequality
Although growth accelerated in the 1990s, leading to greater poverty reduc-tion than in the 1980s, the pattern of growth became increasinglyinequitable. Both consumption expenditure and income data point to thistrend. According to surveys up to 1991/92, the level of consumption expen-diture inequality did not vary much: the urban Gini ratio hovered around0.30 to 0.32, while the rural Gini fluctuated in and around 0.25 to 0.26(table 4.4). The situation has changed in a major way since the early 1990s.The increase in inequality—especially in urban areas—was sharp on a scalenot seen before. Thus, the Gini coefficient for urban areas shot up from 0.32in 1991/92 to 0.38 in 2000. Similarly, the rural Gini rose to 0.30, up from 0.26during the same period.
Moreover, consumption data understate the degree of relative inequalityprevailing in Bangladesh society. Distribution of income and wealth mustalso be considered. Analysis of current income distribution further confirmsthe increasing trend in relative inequality. The Gini ratio for rural incomeinequality rose sharply from 0.27 in 1991/92 to 0.31 in 1995/96 and to 0.36 in2000. The corresponding rise in urban income inequality during the 1990s is
86 Sen, Mujeri, and Shahabuddin
Table 4.4 Trends in Inequality: Consumption Data (Tk/month/person)
Survey Mean/povertyPoverty line mean line (%) Gini index
Urban
1983/84 301.72 396.53 131 29.8
1988/89 453.65 695.19 153 32.6
1991/92 534.99 817.12 153 31.9
2000 724.56 1430.12 197 37.9
Rural
1983/84 268.92 284.84 106 24.6
1988/89 379.08 435.39 115 26.5
1991/92 469.13 509.67 109 25.5
2000 634.48 820.20 129 29.7
Sources: Estimates for 1983/84 through 1991/92 are taken from Ravallion and Sen (1996); esti-mates for 2000 are authors’ estimates.
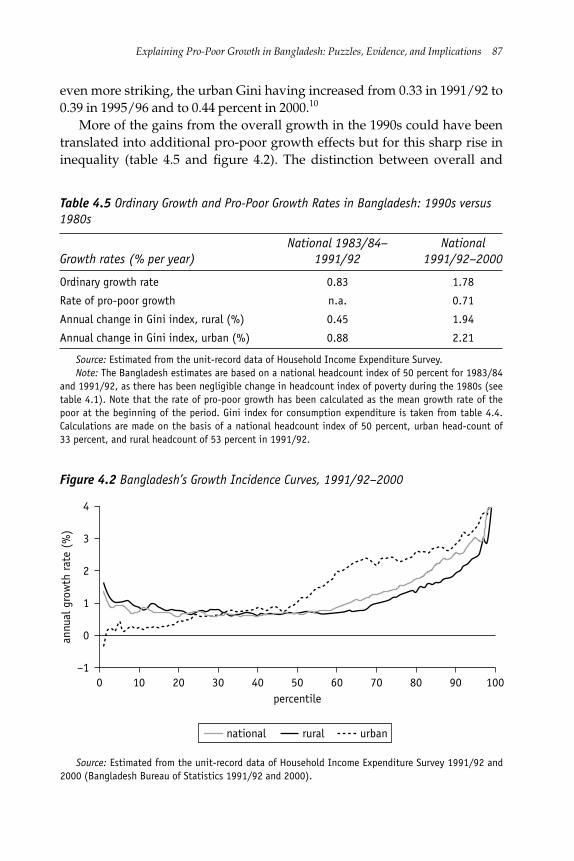
Explaining Pro-Poor Growth in Bangladesh: Puzzles, Evidence, and Implications 87
even more striking, the urban Gini having increased from 0.33 in 1991/92 to0.39 in 1995/96 and to 0.44 percent in 2000.10
More of the gains from the overall growth in the 1990s could have beentranslated into additional pro-poor growth effects but for this sharp rise ininequality (table 4.5 and figure 4.2). The distinction between overall and
Table 4.5 Ordinary Growth and Pro-Poor Growth Rates in Bangladesh: 1990s versus1980s
National 1983/84– National Growth rates (% per year) 1991/92 1991/92–2000
Ordinary growth rate 0.83 1.78
Rate of pro-poor growth n.a. 0.71
Annual change in Gini index, rural (%) 0.45 1.94
Annual change in Gini index, urban (%) 0.88 2.21
Source: Estimated from the unit-record data of Household Income Expenditure Survey.Note: The Bangladesh estimates are based on a national headcount index of 50 percent for 1983/84
and 1991/92, as there has been negligible change in headcount index of poverty during the 1980s (seetable 4.1). Note that the rate of pro-poor growth has been calculated as the mean growth rate of thepoor at the beginning of the period. Gini index for consumption expenditure is taken from table 4.4.Calculations are made on the basis of a national headcount index of 50 percent, urban head-count of33 percent, and rural headcount of 53 percent in 1991/92.
–1
1
0
3
2
4
annu
al g
row
th r
ate
(%)
0 10 20 30 40 50percentile
60 70 90 10080
national rural urban
Figure 4.2 Bangladesh’s Growth Incidence Curves, 1991/92–2000
Source: Estimated from the unit-record data of Household Income Expenditure Survey 1991/92 and2000 (Bangladesh Bureau of Statistics 1991/92 and 2000).
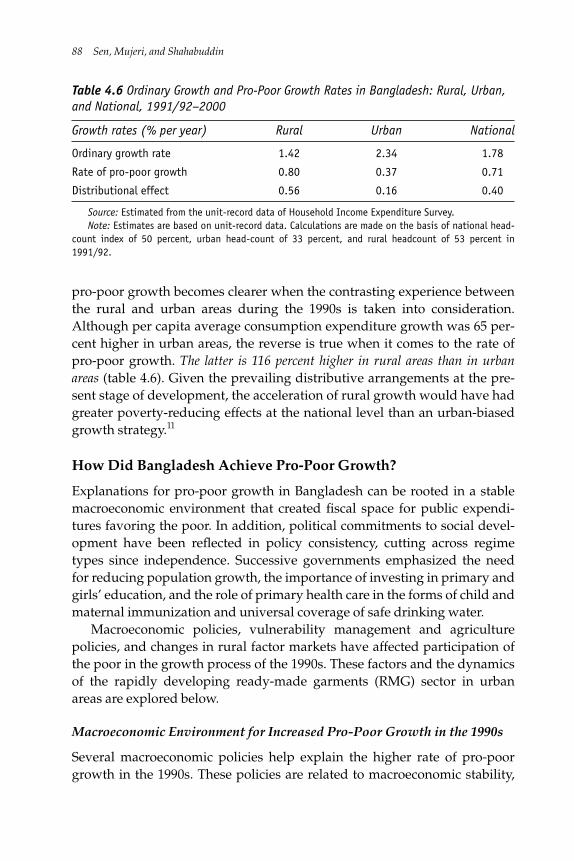
pro-poor growth becomes clearer when the contrasting experience betweenthe rural and urban areas during the 1990s is taken into consideration.Although per capita average consumption expenditure growth was 65 per-cent higher in urban areas, the reverse is true when it comes to the rate ofpro-poor growth. The latter is 116 percent higher in rural areas than in urbanareas (table 4.6). Given the prevailing distributive arrangements at the pre-sent stage of development, the acceleration of rural growth would have hadgreater poverty-reducing effects at the national level than an urban-biasedgrowth strategy.11
How Did Bangladesh Achieve Pro-Poor Growth?
Explanations for pro-poor growth in Bangladesh can be rooted in a stablemacroeconomic environment that created fiscal space for public expendi-tures favoring the poor. In addition, political commitments to social devel-opment have been reflected in policy consistency, cutting across regimetypes since independence. Successive governments emphasized the needfor reducing population growth, the importance of investing in primary andgirls’ education, and the role of primary health care in the forms of child andmaternal immunization and universal coverage of safe drinking water.
Macroeconomic policies, vulnerability management and agriculturepolicies, and changes in rural factor markets have affected participation ofthe poor in the growth process of the 1990s. These factors and the dynamicsof the rapidly developing ready-made garments (RMG) sector in urbanareas are explored below.
Macroeconomic Environment for Increased Pro-Poor Growth in the 1990s
Several macroeconomic policies help explain the higher rate of pro-poorgrowth in the 1990s. These policies are related to macroeconomic stability,
88 Sen, Mujeri, and Shahabuddin
Table 4.6 Ordinary Growth and Pro-Poor Growth Rates in Bangladesh: Rural, Urban,and National, 1991/92–2000
Growth rates (% per year) Rural Urban National
Ordinary growth rate 1.42 2.34 1.78
Rate of pro-poor growth 0.80 0.37 0.71
Distributional effect 0.56 0.16 0.40
Source: Estimated from the unit-record data of Household Income Expenditure Survey.Note: Estimates are based on unit-record data. Calculations are made on the basis of national head-
count index of 50 percent, urban head-count of 33 percent, and rural headcount of 53 percent in1991/92.
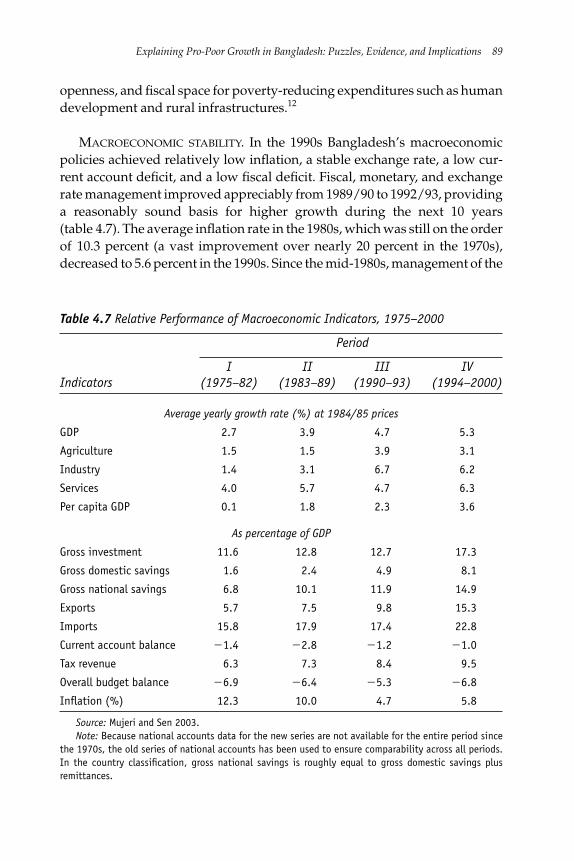
openness, and fiscal space for poverty-reducing expenditures such as humandevelopment and rural infrastructures.12
MACROECONOMIC STABILITY. In the 1990s Bangladesh’s macroeconomicpolicies achieved relatively low inflation, a stable exchange rate, a low cur-rent account deficit, and a low fiscal deficit. Fiscal, monetary, and exchangerate management improved appreciably from 1989/90 to 1992/93, providinga reasonably sound basis for higher growth during the next 10 years(table 4.7). The average inflation rate in the 1980s, which was still on the orderof 10.3 percent (a vast improvement over nearly 20 percent in the 1970s),decreased to 5.6 percent in the 1990s. Since the mid-1980s, management of the
Explaining Pro-Poor Growth in Bangladesh: Puzzles, Evidence, and Implications 89
Table 4.7 Relative Performance of Macroeconomic Indicators, 1975–2000
Period
I II III IVIndicators (1975–82) (1983–89) (1990–93) (1994–2000)
Average yearly growth rate (%) at 1984/85 prices
GDP 2.7 3.9 4.7 5.3
Agriculture 1.5 1.5 3.9 3.1
Industry 1.4 3.1 6.7 6.2
Services 4.0 5.7 4.7 6.3
Per capita GDP 0.1 1.8 2.3 3.6
As percentage of GDP
Gross investment 11.6 12.8 12.7 17.3
Gross domestic savings 1.6 2.4 4.9 8.1
Gross national savings 6.8 10.1 11.9 14.9
Exports 5.7 7.5 9.8 15.3
Imports 15.8 17.9 17.4 22.8
Current account balance �1.4 �2.8 �1.2 �1.0
Tax revenue 6.3 7.3 8.4 9.5
Overall budget balance �6.9 �6.4 �5.3 �6.8
Inflation (%) 12.3 10.0 4.7 5.8
Source: Mujeri and Sen 2003.Note: Because national accounts data for the new series are not available for the entire period since
the 1970s, the old series of national accounts has been used to ensure comparability across all periods.In the country classification, gross national savings is roughly equal to gross domestic savings plusremittances.
exchange rate has been characterized by a remarkable stability in the realexchange rate. Indeed, the real exchange rate has moved within a fairly smallband of about 10 percent around its trend. By avoiding significant realexchange rate appreciation, the country preserved the competitiveness of itsexport sector.13 Growth in exports (currently averaging 13 percent of GDPcompared with 5 percent in 1981/82), combined with increasing remittances(currently at 5 percent of GDP), more than offset the drop in aid flows (cur-rently averaging 2.5 percent of GDP compared with 10 percent in 1981/82and 5 percent in 1990/91) and was sufficient to balance increases in importsresulting from trade liberalization measures during the 1990s.14 As a result,the current account deficit, which averaged 2.6 percent in the 1980s, fell to anaverage of 0.8 percent in the second half of the 1990s.
OPENNESS. Outward orientation is an important instrument for sus-tained economic growth. In low-income labor-abundant countries such asBangladesh, the problem of economic growth is to gainfully employ unlim-ited labor supplies while raising their productivity, for which incentives forreproducible and human capital accumulation become necessary. Theseincentives are governed by the limited size of the domestic market—hencethe causal role of international trade in expanding the size of the market,especially in the early stage of development.15
Bangladesh’s inward orientation—restrictive trade and exchange ratepractices (an economic ideology common to most of South Asia)—createddistortions in product and factor markets. As a part of the reform process,the Bangladesh economy opened significantly during the 1990s. The exter-nal sector substantially liberalized in terms of external trade and foreignexchange regimes.16 A rapid increase in Bangladesh’s global economic inte-gration has also taken place. An open trade regime was, on the whole, bene-ficial to growth acceleration. Bangladesh’s exports grew at an average rateof 11 percent per year in the 1990s and generated substantial employment,especially in the RMG sector (World Bank 1999).17
Such rapid openness has created challenges and opportunities for theBangladesh economy. In particular, the interfaces of trade liberalizationand poverty have proven to be complex. These interfaces appear to havedepended much on the nature of the channels through which the liberaliza-tion effects have been transmitted to the economy and to different householdgroups (see, for example, Mujeri 2003). With differing mesoenvironments, netimpacts also varied for household groups. The ability of heterogeneous poorgroups to respond to the opportunities offered by liberalization depended ontheir access to markets and participation in socioeconomic transitions. In the
90 Sen, Mujeri, and Shahabuddin
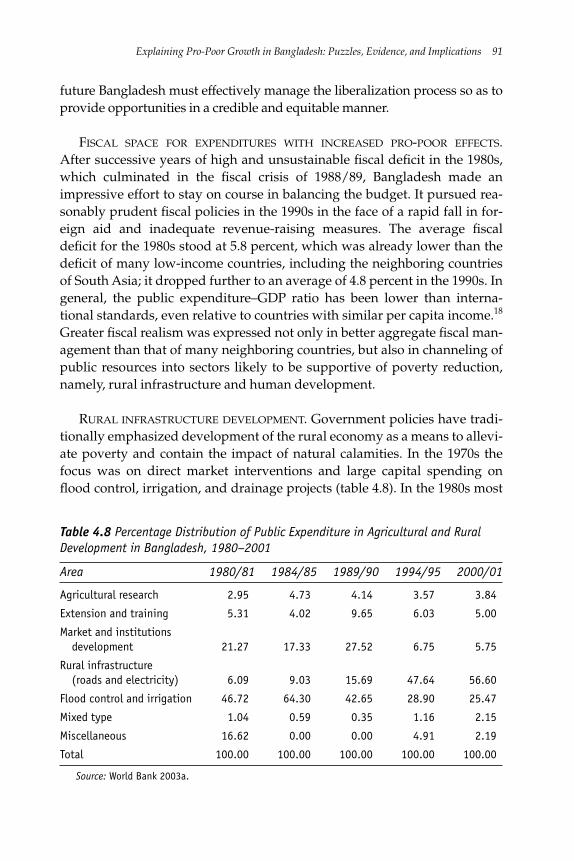
future Bangladesh must effectively manage the liberalization process so as toprovide opportunities in a credible and equitable manner.
FISCAL SPACE FOR EXPENDITURES WITH INCREASED PRO-POOR EFFECTS.After successive years of high and unsustainable fiscal deficit in the 1980s,which culminated in the fiscal crisis of 1988/89, Bangladesh made animpressive effort to stay on course in balancing the budget. It pursued rea-sonably prudent fiscal policies in the 1990s in the face of a rapid fall in for-eign aid and inadequate revenue-raising measures. The average fiscaldeficit for the 1980s stood at 5.8 percent, which was already lower than thedeficit of many low-income countries, including the neighboring countriesof South Asia; it dropped further to an average of 4.8 percent in the 1990s. Ingeneral, the public expenditure–GDP ratio has been lower than interna-tional standards, even relative to countries with similar per capita income.18
Greater fiscal realism was expressed not only in better aggregate fiscal man-agement than that of many neighboring countries, but also in channeling ofpublic resources into sectors likely to be supportive of poverty reduction,namely, rural infrastructure and human development.
RURAL INFRASTRUCTURE DEVELOPMENT. Government policies have tradi-tionally emphasized development of the rural economy as a means to allevi-ate poverty and contain the impact of natural calamities. In the 1970s thefocus was on direct market interventions and large capital spending onflood control, irrigation, and drainage projects (table 4.8). In the 1980s most
Explaining Pro-Poor Growth in Bangladesh: Puzzles, Evidence, and Implications 91
Table 4.8 Percentage Distribution of Public Expenditure in Agricultural and RuralDevelopment in Bangladesh, 1980–2001
Area 1980/81 1984/85 1989/90 1994/95 2000/01
Agricultural research 2.95 4.73 4.14 3.57 3.84
Extension and training 5.31 4.02 9.65 6.03 5.00
Market and institutionsdevelopment 21.27 17.33 27.52 6.75 5.75
Rural infrastructure(roads and electricity) 6.09 9.03 15.69 47.64 56.60
Flood control and irrigation 46.72 64.30 42.65 28.90 25.47
Mixed type 1.04 0.59 0.35 1.16 2.15
Miscellaneous 16.62 0.00 0.00 4.91 2.19
Total 100.00 100.00 100.00 100.00 100.00
Source: World Bank 2003a.
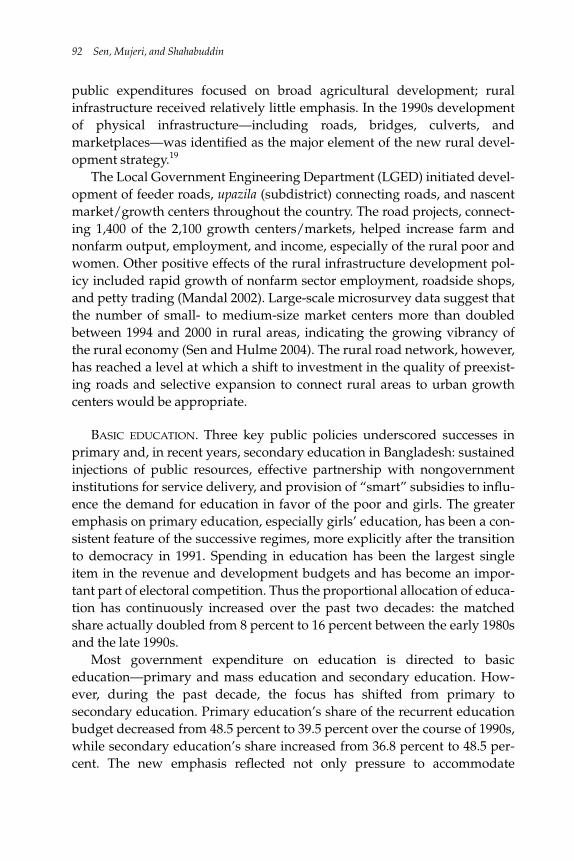
public expenditures focused on broad agricultural development; ruralinfrastructure received relatively little emphasis. In the 1990s developmentof physical infrastructure—including roads, bridges, culverts, andmarketplaces—was identified as the major element of the new rural devel-opment strategy.19
The Local Government Engineering Department (LGED) initiated devel-opment of feeder roads, upazila (subdistrict) connecting roads, and nascentmarket/growth centers throughout the country. The road projects, connect-ing 1,400 of the 2,100 growth centers/markets, helped increase farm andnonfarm output, employment, and income, especially of the rural poor andwomen. Other positive effects of the rural infrastructure development pol-icy included rapid growth of nonfarm sector employment, roadside shops,and petty trading (Mandal 2002). Large-scale microsurvey data suggest thatthe number of small- to medium-size market centers more than doubledbetween 1994 and 2000 in rural areas, indicating the growing vibrancy ofthe rural economy (Sen and Hulme 2004). The rural road network, however,has reached a level at which a shift to investment in the quality of preexist-ing roads and selective expansion to connect rural areas to urban growthcenters would be appropriate.
BASIC EDUCATION. Three key public policies underscored successes inprimary and, in recent years, secondary education in Bangladesh: sustainedinjections of public resources, effective partnership with nongovernmentinstitutions for service delivery, and provision of “smart” subsidies to influ-ence the demand for education in favor of the poor and girls. The greateremphasis on primary education, especially girls’ education, has been a con-sistent feature of the successive regimes, more explicitly after the transitionto democracy in 1991. Spending in education has been the largest singleitem in the revenue and development budgets and has become an impor-tant part of electoral competition. Thus the proportional allocation of educa-tion has continuously increased over the past two decades: the matchedshare actually doubled from 8 percent to 16 percent between the early 1980sand the late 1990s.
Most government expenditure on education is directed to basiceducation—primary and mass education and secondary education. How-ever, during the past decade, the focus has shifted from primary tosecondary education. Primary education’s share of the recurrent educationbudget decreased from 48.5 percent to 39.5 percent over the course of 1990s,while secondary education’s share increased from 36.8 percent to 48.5 per-cent. The new emphasis reflected not only pressure to accommodate
92 Sen, Mujeri, and Shahabuddin
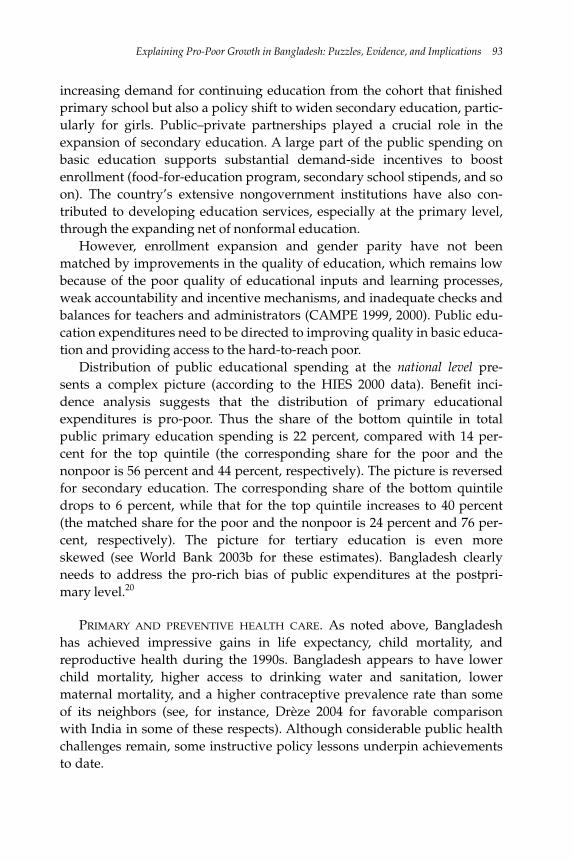
increasing demand for continuing education from the cohort that finishedprimary school but also a policy shift to widen secondary education, partic-ularly for girls. Public–private partnerships played a crucial role in theexpansion of secondary education. A large part of the public spending onbasic education supports substantial demand-side incentives to boostenrollment (food-for-education program, secondary school stipends, and soon). The country’s extensive nongovernment institutions have also con-tributed to developing education services, especially at the primary level,through the expanding net of nonformal education.
However, enrollment expansion and gender parity have not beenmatched by improvements in the quality of education, which remains lowbecause of the poor quality of educational inputs and learning processes,weak accountability and incentive mechanisms, and inadequate checks andbalances for teachers and administrators (CAMPE 1999, 2000). Public edu-cation expenditures need to be directed to improving quality in basic educa-tion and providing access to the hard-to-reach poor.
Distribution of public educational spending at the national level pre-sents a complex picture (according to the HIES 2000 data). Benefit inci-dence analysis suggests that the distribution of primary educationalexpenditures is pro-poor. Thus the share of the bottom quintile in totalpublic primary education spending is 22 percent, compared with 14 per-cent for the top quintile (the corresponding share for the poor and thenonpoor is 56 percent and 44 percent, respectively). The picture is reversedfor secondary education. The corresponding share of the bottom quintiledrops to 6 percent, while that for the top quintile increases to 40 percent(the matched share for the poor and the nonpoor is 24 percent and 76 per-cent, respectively). The picture for tertiary education is even moreskewed (see World Bank 2003b for these estimates). Bangladesh clearlyneeds to address the pro-rich bias of public expenditures at the postpri-mary level.20
PRIMARY AND PREVENTIVE HEALTH CARE. As noted above, Bangladeshhas achieved impressive gains in life expectancy, child mortality, andreproductive health during the 1990s. Bangladesh appears to have lowerchild mortality, higher access to drinking water and sanitation, lowermaternal mortality, and a higher contraceptive prevalence rate than someof its neighbors (see, for instance, Drèze 2004 for favorable comparisonwith India in some of these respects). Although considerable public healthchallenges remain, some instructive policy lessons underpin achievementsto date.
Explaining Pro-Poor Growth in Bangladesh: Puzzles, Evidence, and Implications 93
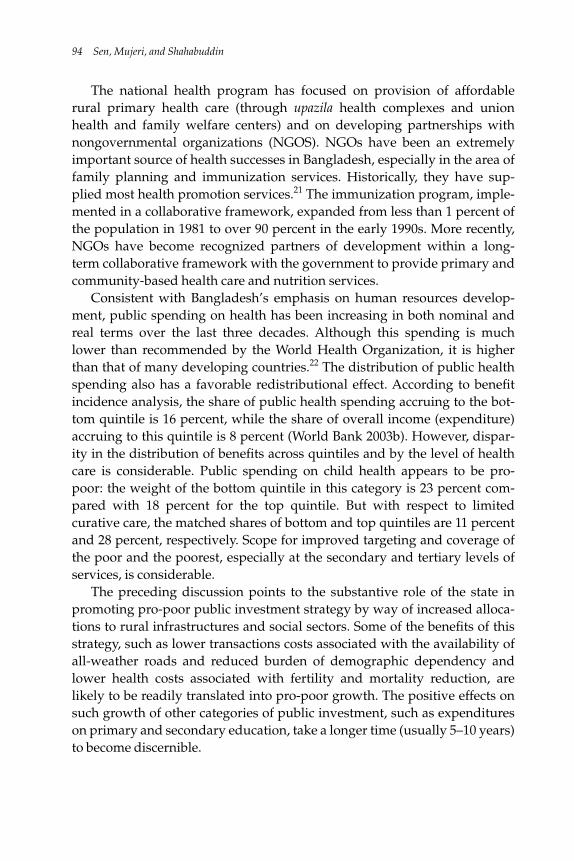
The national health program has focused on provision of affordablerural primary health care (through upazila health complexes and unionhealth and family welfare centers) and on developing partnerships withnongovernmental organizations (NGOS). NGOs have been an extremelyimportant source of health successes in Bangladesh, especially in the area offamily planning and immunization services. Historically, they have sup-plied most health promotion services.21 The immunization program, imple-mented in a collaborative framework, expanded from less than 1 percent ofthe population in 1981 to over 90 percent in the early 1990s. More recently,NGOs have become recognized partners of development within a long-term collaborative framework with the government to provide primary andcommunity-based health care and nutrition services.
Consistent with Bangladesh’s emphasis on human resources develop-ment, public spending on health has been increasing in both nominal andreal terms over the last three decades. Although this spending is muchlower than recommended by the World Health Organization, it is higherthan that of many developing countries.22 The distribution of public healthspending also has a favorable redistributional effect. According to benefitincidence analysis, the share of public health spending accruing to the bot-tom quintile is 16 percent, while the share of overall income (expenditure)accruing to this quintile is 8 percent (World Bank 2003b). However, dispar-ity in the distribution of benefits across quintiles and by the level of healthcare is considerable. Public spending on child health appears to be pro-poor: the weight of the bottom quintile in this category is 23 percent com-pared with 18 percent for the top quintile. But with respect to limitedcurative care, the matched shares of bottom and top quintiles are 11 percentand 28 percent, respectively. Scope for improved targeting and coverage ofthe poor and the poorest, especially at the secondary and tertiary levels ofservices, is considerable.
The preceding discussion points to the substantive role of the state inpromoting pro-poor public investment strategy by way of increased alloca-tions to rural infrastructures and social sectors. Some of the benefits of thisstrategy, such as lower transactions costs associated with the availability ofall-weather roads and reduced burden of demographic dependency andlower health costs associated with fertility and mortality reduction, arelikely to be readily translated into pro-poor growth. The positive effects onsuch growth of other categories of public investment, such as expenditureson primary and secondary education, take a longer time (usually 5–10 years)to become discernible.
94 Sen, Mujeri, and Shahabuddin
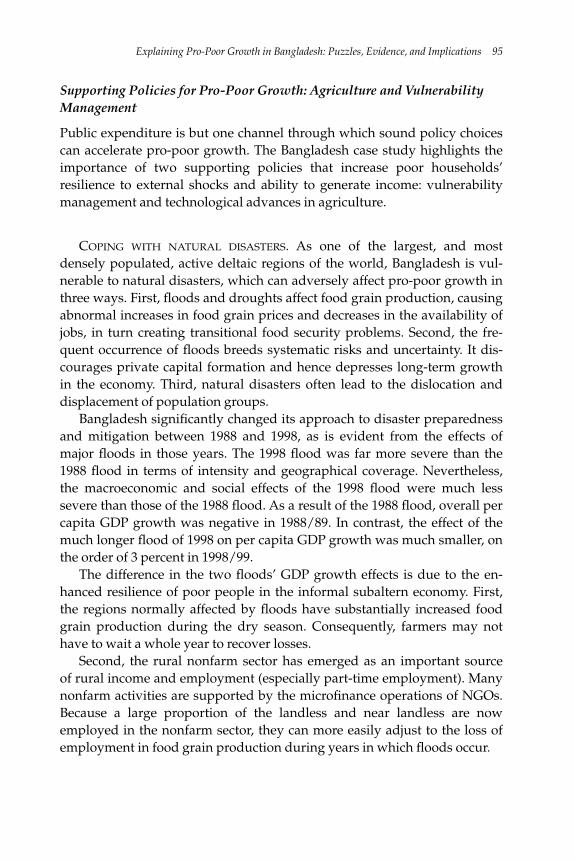
Supporting Policies for Pro-Poor Growth: Agriculture and VulnerabilityManagement
Public expenditure is but one channel through which sound policy choicescan accelerate pro-poor growth. The Bangladesh case study highlights theimportance of two supporting policies that increase poor households’resilience to external shocks and ability to generate income: vulnerabilitymanagement and technological advances in agriculture.
COPING WITH NATURAL DISASTERS. As one of the largest, and mostdensely populated, active deltaic regions of the world, Bangladesh is vul-nerable to natural disasters, which can adversely affect pro-poor growth inthree ways. First, floods and droughts affect food grain production, causingabnormal increases in food grain prices and decreases in the availability ofjobs, in turn creating transitional food security problems. Second, the fre-quent occurrence of floods breeds systematic risks and uncertainty. It dis-courages private capital formation and hence depresses long-term growthin the economy. Third, natural disasters often lead to the dislocation anddisplacement of population groups.
Bangladesh significantly changed its approach to disaster preparednessand mitigation between 1988 and 1998, as is evident from the effects ofmajor floods in those years. The 1998 flood was far more severe than the1988 flood in terms of intensity and geographical coverage. Nevertheless,the macroeconomic and social effects of the 1998 flood were much lesssevere than those of the 1988 flood. As a result of the 1988 flood, overall percapita GDP growth was negative in 1988/89. In contrast, the effect of themuch longer flood of 1998 on per capita GDP growth was much smaller, onthe order of 3 percent in 1998/99.
The difference in the two floods’ GDP growth effects is due to the en-hanced resilience of poor people in the informal subaltern economy. First,the regions normally affected by floods have substantially increased foodgrain production during the dry season. Consequently, farmers may nothave to wait a whole year to recover losses.
Second, the rural nonfarm sector has emerged as an important sourceof rural income and employment (especially part-time employment). Manynonfarm activities are supported by the microfinance operations of NGOs.Because a large proportion of the landless and near landless are nowemployed in the nonfarm sector, they can more easily adjust to the loss ofemployment in food grain production during years in which floods occur.
Explaining Pro-Poor Growth in Bangladesh: Puzzles, Evidence, and Implications 95
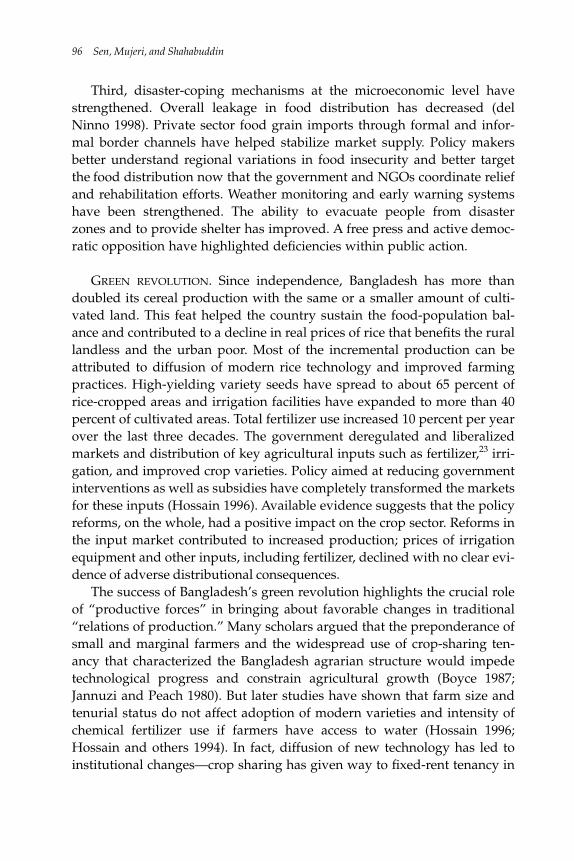
Third, disaster-coping mechanisms at the microeconomic level havestrengthened. Overall leakage in food distribution has decreased (delNinno 1998). Private sector food grain imports through formal and infor-mal border channels have helped stabilize market supply. Policy makersbetter understand regional variations in food insecurity and better targetthe food distribution now that the government and NGOs coordinate reliefand rehabilitation efforts. Weather monitoring and early warning systemshave been strengthened. The ability to evacuate people from disasterzones and to provide shelter has improved. A free press and active democ-ratic opposition have highlighted deficiencies within public action.
GREEN REVOLUTION. Since independence, Bangladesh has more thandoubled its cereal production with the same or a smaller amount of culti-vated land. This feat helped the country sustain the food-population bal-ance and contributed to a decline in real prices of rice that benefits the rurallandless and the urban poor. Most of the incremental production can beattributed to diffusion of modern rice technology and improved farmingpractices. High-yielding variety seeds have spread to about 65 percent ofrice-cropped areas and irrigation facilities have expanded to more than 40percent of cultivated areas. Total fertilizer use increased 10 percent per yearover the last three decades. The government deregulated and liberalizedmarkets and distribution of key agricultural inputs such as fertilizer,23 irri-gation, and improved crop varieties. Policy aimed at reducing governmentinterventions as well as subsidies have completely transformed the marketsfor these inputs (Hossain 1996). Available evidence suggests that the policyreforms, on the whole, had a positive impact on the crop sector. Reforms inthe input market contributed to increased production; prices of irrigationequipment and other inputs, including fertilizer, declined with no clear evi-dence of adverse distributional consequences.
The success of Bangladesh’s green revolution highlights the crucial roleof “productive forces” in bringing about favorable changes in traditional“relations of production.” Many scholars argued that the preponderance ofsmall and marginal farmers and the widespread use of crop-sharing ten-ancy that characterized the Bangladesh agrarian structure would impedetechnological progress and constrain agricultural growth (Boyce 1987;Jannuzi and Peach 1980). But later studies have shown that farm size andtenurial status do not affect adoption of modern varieties and intensity ofchemical fertilizer use if farmers have access to water (Hossain 1996;Hossain and others 1994). In fact, diffusion of new technology has led toinstitutional changes—crop sharing has given way to fixed-rent tenancy in
96 Sen, Mujeri, and Shahabuddin
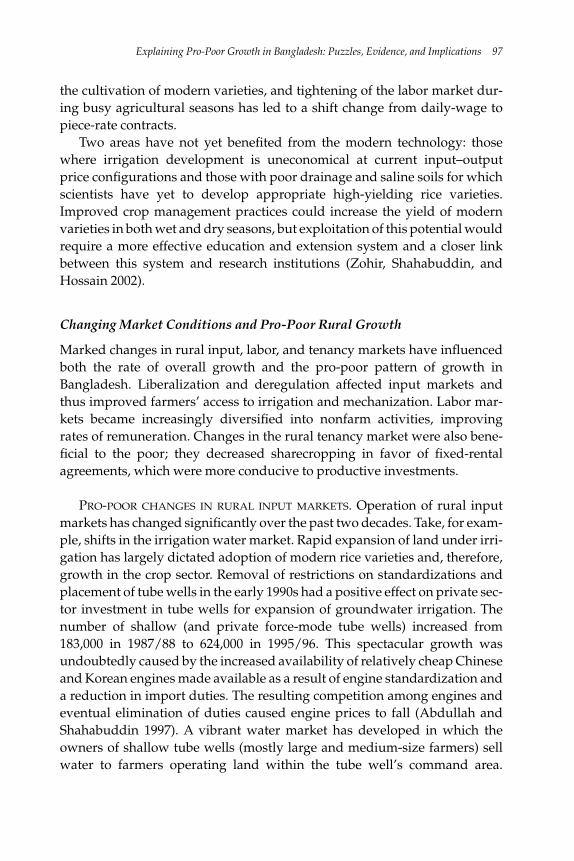
the cultivation of modern varieties, and tightening of the labor market dur-ing busy agricultural seasons has led to a shift change from daily-wage topiece-rate contracts.
Two areas have not yet benefited from the modern technology: thosewhere irrigation development is uneconomical at current input–outputprice configurations and those with poor drainage and saline soils for which scientists have yet to develop appropriate high-yielding rice varieties.Improved crop management practices could increase the yield of modernvarieties in both wet and dry seasons, but exploitation of this potential wouldrequire a more effective education and extension system and a closer linkbetween this system and research institutions (Zohir, Shahabuddin, andHossain 2002).
Changing Market Conditions and Pro-Poor Rural Growth
Marked changes in rural input, labor, and tenancy markets have influencedboth the rate of overall growth and the pro-poor pattern of growth inBangladesh. Liberalization and deregulation affected input markets andthus improved farmers’ access to irrigation and mechanization. Labor mar-kets became increasingly diversified into nonfarm activities, improvingrates of remuneration. Changes in the rural tenancy market were also bene-ficial to the poor; they decreased sharecropping in favor of fixed-rentalagreements, which were more conducive to productive investments.
PRO-POOR CHANGES IN RURAL INPUT MARKETS. Operation of rural inputmarkets has changed significantly over the past two decades. Take, for exam-ple, shifts in the irrigation water market. Rapid expansion of land under irri-gation has largely dictated adoption of modern rice varieties and, therefore,growth in the crop sector. Removal of restrictions on standardizations andplacement of tube wells in the early 1990s had a positive effect on private sec-tor investment in tube wells for expansion of groundwater irrigation. Thenumber of shallow (and private force-mode tube wells) increased from183,000 in 1987/88 to 624,000 in 1995/96. This spectacular growth wasundoubtedly caused by the increased availability of relatively cheap Chineseand Korean engines made available as a result of engine standardization anda reduction in import duties. The resulting competition among engines andeventual elimination of duties caused engine prices to fall (Abdullah andShahabuddin 1997). A vibrant water market has developed in which theowners of shallow tube wells (mostly large and medium-size farmers) sellwater to farmers operating land within the tube well’s command area.
Explaining Pro-Poor Growth in Bangladesh: Puzzles, Evidence, and Implications 97
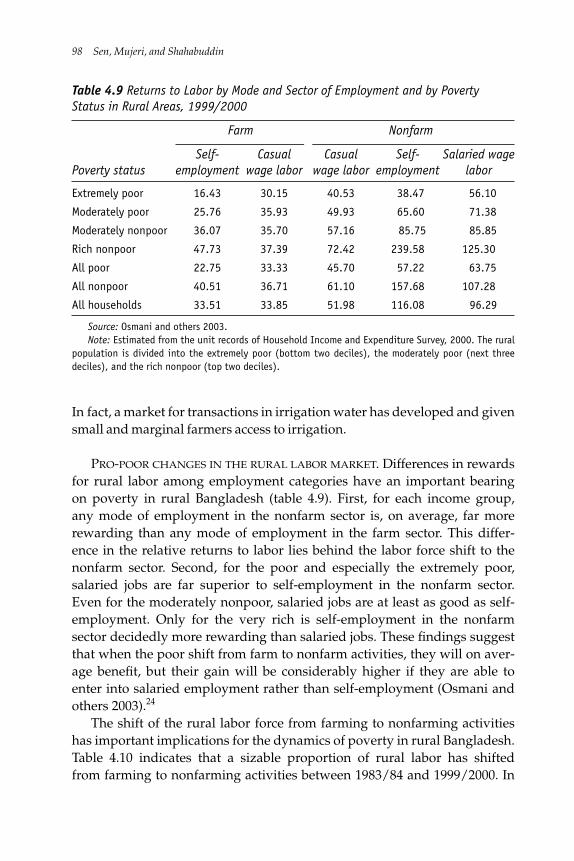
In fact, a market for transactions in irrigation water has developed and givensmall and marginal farmers access to irrigation.
PRO-POOR CHANGES IN THE RURAL LABOR MARKET. Differences in rewardsfor rural labor among employment categories have an important bearingon poverty in rural Bangladesh (table 4.9). First, for each income group,any mode of employment in the nonfarm sector is, on average, far morerewarding than any mode of employment in the farm sector. This differ-ence in the relative returns to labor lies behind the labor force shift to thenonfarm sector. Second, for the poor and especially the extremely poor,salaried jobs are far superior to self-employment in the nonfarm sector.Even for the moderately nonpoor, salaried jobs are at least as good as self-employment. Only for the very rich is self-employment in the nonfarmsector decidedly more rewarding than salaried jobs. These findings suggestthat when the poor shift from farm to nonfarm activities, they will on aver-age benefit, but their gain will be considerably higher if they are able toenter into salaried employment rather than self-employment (Osmani andothers 2003).24
The shift of the rural labor force from farming to nonfarming activitieshas important implications for the dynamics of poverty in rural Bangladesh.Table 4.10 indicates that a sizable proportion of rural labor has shiftedfrom farming to nonfarming activities between 1983/84 and 1999/2000. In
98 Sen, Mujeri, and Shahabuddin
Table 4.9 Returns to Labor by Mode and Sector of Employment and by PovertyStatus in Rural Areas, 1999/2000
Farm Nonfarm
Self- Casual Casual Self- Salaried wagePoverty status employment wage labor wage labor employment labor
Extremely poor 16.43 30.15 40.53 38.47 56.10
Moderately poor 25.76 35.93 49.93 65.60 71.38
Moderately nonpoor 36.07 35.70 57.16 85.75 85.85
Rich nonpoor 47.73 37.39 72.42 239.58 125.30
All poor 22.75 33.33 45.70 57.22 63.75
All nonpoor 40.51 36.71 61.10 157.68 107.28
All households 33.51 33.85 51.98 116.08 96.29
Source: Osmani and others 2003.Note: Estimated from the unit records of Household Income and Expenditure Survey, 2000. The rural
population is divided into the extremely poor (bottom two deciles), the moderately poor (next threedeciles), and the rich nonpoor (top two deciles).
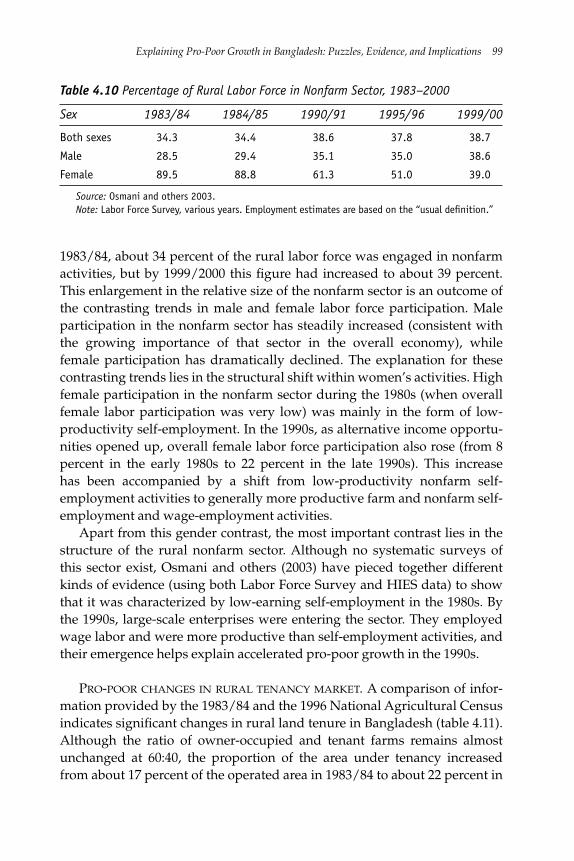
1983/84, about 34 percent of the rural labor force was engaged in nonfarmactivities, but by 1999/2000 this figure had increased to about 39 percent.This enlargement in the relative size of the nonfarm sector is an outcome ofthe contrasting trends in male and female labor force participation. Maleparticipation in the nonfarm sector has steadily increased (consistent withthe growing importance of that sector in the overall economy), whilefemale participation has dramatically declined. The explanation for thesecontrasting trends lies in the structural shift within women’s activities. Highfemale participation in the nonfarm sector during the 1980s (when overallfemale labor participation was very low) was mainly in the form of low-productivity self-employment. In the 1990s, as alternative income opportu-nities opened up, overall female labor force participation also rose (from 8percent in the early 1980s to 22 percent in the late 1990s). This increasehas been accompanied by a shift from low-productivity nonfarm self-employment activities to generally more productive farm and nonfarm self-employment and wage-employment activities.
Apart from this gender contrast, the most important contrast lies in thestructure of the rural nonfarm sector. Although no systematic surveys ofthis sector exist, Osmani and others (2003) have pieced together differentkinds of evidence (using both Labor Force Survey and HIES data) to showthat it was characterized by low-earning self-employment in the 1980s. Bythe 1990s, large-scale enterprises were entering the sector. They employedwage labor and were more productive than self-employment activities, andtheir emergence helps explain accelerated pro-poor growth in the 1990s.
PRO-POOR CHANGES IN RURAL TENANCY MARKET. A comparison of infor-mation provided by the 1983/84 and the 1996 National Agricultural Censusindicates significant changes in rural land tenure in Bangladesh (table 4.11).Although the ratio of owner-occupied and tenant farms remains almostunchanged at 60:40, the proportion of the area under tenancy increasedfrom about 17 percent of the operated area in 1983/84 to about 22 percent in
Explaining Pro-Poor Growth in Bangladesh: Puzzles, Evidence, and Implications 99
Table 4.10 Percentage of Rural Labor Force in Nonfarm Sector, 1983–2000
Sex 1983/84 1984/85 1990/91 1995/96 1999/00
Both sexes 34.3 34.4 38.6 37.8 38.7
Male 28.5 29.4 35.1 35.0 38.6
Female 89.5 88.8 61.3 51.0 39.0
Source: Osmani and others 2003.Note: Labor Force Survey, various years. Employment estimates are based on the “usual definition.”
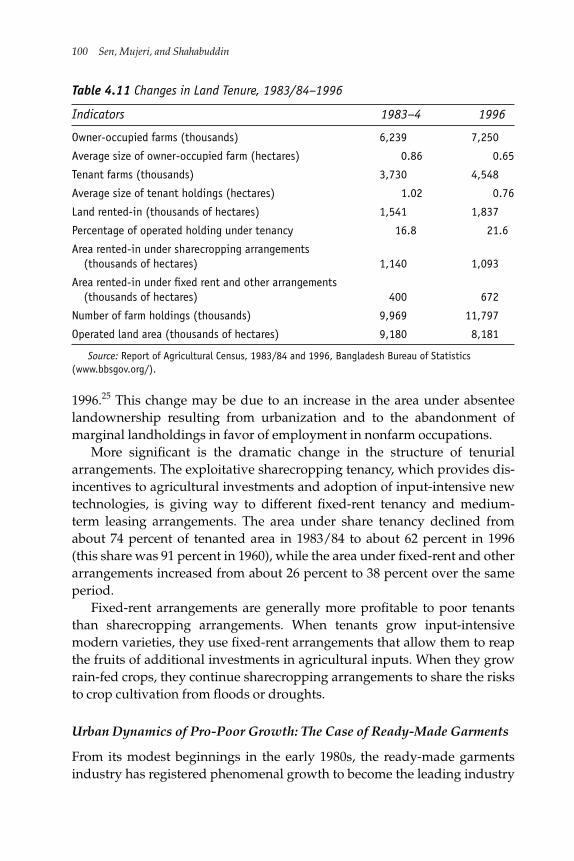
1996.25 This change may be due to an increase in the area under absenteelandownership resulting from urbanization and to the abandonment ofmarginal landholdings in favor of employment in nonfarm occupations.
More significant is the dramatic change in the structure of tenurialarrangements. The exploitative sharecropping tenancy, which provides dis-incentives to agricultural investments and adoption of input-intensive newtechnologies, is giving way to different fixed-rent tenancy and medium-term leasing arrangements. The area under share tenancy declined fromabout 74 percent of tenanted area in 1983/84 to about 62 percent in 1996(this share was 91 percent in 1960), while the area under fixed-rent and otherarrangements increased from about 26 percent to 38 percent over the sameperiod.
Fixed-rent arrangements are generally more profitable to poor tenantsthan sharecropping arrangements. When tenants grow input-intensivemodern varieties, they use fixed-rent arrangements that allow them to reapthe fruits of additional investments in agricultural inputs. When they growrain-fed crops, they continue sharecropping arrangements to share the risksto crop cultivation from floods or droughts.
Urban Dynamics of Pro-Poor Growth: The Case of Ready-Made Garments
From its modest beginnings in the early 1980s, the ready-made garmentsindustry has registered phenomenal growth to become the leading industry
100 Sen, Mujeri, and Shahabuddin
Table 4.11 Changes in Land Tenure, 1983/84–1996
Indicators 1983–4 1996
Owner-occupied farms (thousands) 6,239 7,250
Average size of owner-occupied farm (hectares) 0.86 0.65
Tenant farms (thousands) 3,730 4,548
Average size of tenant holdings (hectares) 1.02 0.76
Land rented-in (thousands of hectares) 1,541 1,837
Percentage of operated holding under tenancy 16.8 21.6
Area rented-in under sharecropping arrangements(thousands of hectares) 1,140 1,093
Area rented-in under fixed rent and other arrangements(thousands of hectares) 400 672
Number of farm holdings (thousands) 9,969 11,797
Operated land area (thousands of hectares) 9,180 8,181
Source: Report of Agricultural Census, 1983/84 and 1996, Bangladesh Bureau of Statistics(www.bbsgov.org/).
of Bangladesh. By the mid-1990s, it was contributing 20 to 25 percent of totalvalue added and employing 40 to 50 percent of the total workforce engagedin medium- and large-scale manufacturing. Its share in total exports wasbarely 4 percent in 1983/84 but 75 percent by the end of the 1990s. In1990/91, fewer than 1,000 RMG units were in operation, but by the end ofthe decade that number tripled. In 1988/89, its value added was less thanTk 10 billion, but by 1997/98 it had risen to Tk 35 billion. These figuressuggest that the additional income generated by RMG in the 1990s couldhave significantly boosted demand for services and other nontradables.Because garment workers are some of the poorest manufacturing workers,their spending must have been skewed toward the inferior-quality goodsand services produced in the informal nontradable sector than towardthose produced in the formal tradable sector or imported (Osmani andothers 2003).
Interactions between the RMG sector and small and medium-sizeenterprises (SMEs) demonstrate how fast growth in manufactured exportscan generate spillover effects in nontradables and boost demand for pro-duction of related materials and accessories. Summarizing the findings ofvarious studies, South Asia Enterprise Development Facility (2003) andBangladesh Enterprise Institute (2004) have identified important positivechanges taking place in SMEs in Bangladesh. First, SMEs have diversifiedtheir activities. Second, entry and exit into the sector have become easier.Third, the RMG industry has contributed significantly to SME developmentby providing orders for accessories and packaging materials.
How Could Bangladesh Achieve Pro-Poor Growth with WeakGovernance?
Bangladesh achieved relatively strong economic performance in the 1990sin spite of a generally poor institutional environment. Though ratings fordemocratic accountability were strong, institutional indicators in the areasof corruption and the rule of law remained poor and even worsenedbetween 1996 and 2004, according to the International Country Risk Guide(Political Risk Services Group 2005) and the World Bank Governance Mat-ters indicators (Kaufmann, Kraay, and Mastruzzi 2005). Since it first appearedin Transparency International’s Corruptions Perceptions Index in 2001,Bangladesh has consistently been ranked as the country with the most cor-rupt government (Barbone and others 2006).
Bangladesh’s corruption indicators are certainly relevant to its economicdevelopment. However, a focus on corruption indexes as a proxy for all
Explaining Pro-Poor Growth in Bangladesh: Puzzles, Evidence, and Implications 101
aspects of governance would belie the heterogeneity within Bangladesh’sinstitutional profile. Since 1984 Bangladesh has scored consistently muchbetter on investment climate than on corruption, according to PoliticalRisk Services Group (2005) and the World Bank (Kaufmann, Kraay, andMastruzzi 2005). The latest publication in the World Bank Doing Businessseries ranks Bangladesh well above India and above Sri Lanka for ease ofdoing business (World Bank 2005b).26 Moreover, conventional institutionalindicators, which focus on the urban environment, do not adequately cap-ture the institutional context of rural Bangladesh, which is very differentfrom the one currently associated with Bangladesh.
Creating Pockets of Excellence in a Poor Institutional Environment
The government has attempted to circumvent institutional weaknesseswhere they have impeded pro-poor growth. Three elements of the strategyare
• insulating strategic growth and human development areas from neg-ative influences from areas plagued by misgovernance (so-called ringfencing);
• reducing a “capacity deficit” by deploying nongovernmental re-sources; and
• tapping the resilience and self-improvement capacity of the poorthrough social learning, community interaction, and promotion ofpositive attitude changes.
RING FENCING. In Bangladesh, policies integral to the welfare of the poor,including family planning, disaster management, access to drinking water,and expansion of primary education (especially for girls) have taken on thecharacter of public goods. Successive governments, irrespective of theirpolitical leanings and degree of democracy, have shielded these policiesfrom budgetary and political pressures. Treatment of the green revolutionreflects this strategy.
After a devastating famine in 1974, the quest for self-sufficiency in riceproduction became a goal for successive governments. The goal was real-ized by the end of the 1990s through a multipronged approach: resourceswere given to research institutes to develop indigenous high-yield varieties;farmers were convinced to adopt these new varieties; and, as discussedabove, the government created space for the private sector to play a vitalrole in the “shallow tube well revolution.” A comparison of Bangladesh andWest Bengal with respect to food production illustrates how, in the case of
102 Sen, Mujeri, and Shahabuddin
the former, the ring-fencing policies offered a viable alternative to more rad-ical institutional reform. The trend of accelerated rice production was simi-lar in the two Bengals during the period 1981–2000, although in the case ofWest Bengal it required a Left-front government to carry out land reformmeasures, while in the case of Bangladesh self-sufficiency was achievedthrough the adoption of high-yield varieties and the liberalization of inputmarkets.
In addition to ring-fencing policies integral to pro-poor growth, the gov-ernment has invested resources in creating “islands of excellence” in other-wise weak institutional environments. Consider the creation of the LocalGovernment Engineering Department (a powerful body outside the directday-to-day scrutiny of the Ministry of Local Government) that overseesspeedy implementation of rural all-weather roads. The LGED should beviewed as a major institutional breakthrough, without which the rapiddevelopment of the countrywide rural road network would not have beenpossible.
Another island of excellence is the Palli Karma Sahayak Foundation(PKSF), an autonomous microcredit fund that is insulated from the weak-nesses of the public finance bureaucracy. The traditional microcredit marketin Bangladesh is highly concentrated (the four largest microfinance institu-tions control over 80 percent of the total credit disbursement) and tends notto reach the very poor. PKSF furnishes microfinance to medium-size andsmall NGOs, which in turn provide microcredit services to the poor, partic-ularly those usually excluded from microfinancing programs.
STRATEGIC PARTNERSHIPS FOR DEVELOPMENT. The government has createdcivil space for NGOs to compensate for “capacity deficits” in the area of ser-vice delivery. NGOs have featured prominently as providers of microfi-nance, health, and nonformal education to the poor, particularly poorwomen. The Grameen model of microfinance, originally developed inBangladesh during the mid-1970s, has inspired much of the self-help groupmovement in South Asia. The Bangladesh Rural Advancement Committee(BRAC), which also originated in the 1970s, has taken a multifacetedapproach to poverty reduction by providing, among other services, micro-credit, training, and nonformal primary education. Its successes in provid-ing rural education are well documented: 90 percent of graduates fromBRAC schools had moved on to formal schooling in 1995 (Mondal 2000).More than 400 NGOs are currently engaged in nonformal education pro-grams nationwide (World Bank 2005a). Civil society also plays an importantrole in the delivery of health services, particularly family planning.
Explaining Pro-Poor Growth in Bangladesh: Puzzles, Evidence, and Implications 103
By the 1990s, Bangladesh had become the leading example of the use ofNGOs as vehicles of development. Nearly 80 percent of villages are coveredby some NGO program or project (World Bank 2005a). Even if the capacityof government agencies has decreased, the combined capacity of publicagencies, NGOs, and the private sector has not.
ENCOURAGING COMMUNITY PARTICIPATION. The potential of communitiesto implement strategies that enhance their own welfare is enormous. Diffu-sion of new agricultural technologies and adoption of better health prac-tices, as well as changing norms regarding women’s education, health, andmobility, point to a dynamic independent of the contributions of govern-mental and nongovernmental initiatives. For example, levels of educationand income provide a less robust explanation for declining birth rates thanthe diffusion of birth control practices through a social framework. Thedecline in fertility in Bangladesh has been explained in terms of a uniqueculture, history, and language that facilitate social learning (Basu and Amin2000). Another important mechanism for diffusion is the role of self-helpgroups in which women are predominant. They encourage people to havesmaller families and educate their children (Dev, James, and Sen 2002).
In summary, Bangladesh demonstrates that a weak institutional environ-ment can be circumvented for a prolonged period to promote a pattern ofgrowth and poverty reduction. But the government’s reliance on NGOs asservice providers, while a pragmatic and effective second-best solution,raises problems of accountability. Particularly at the local level, a long-termreliance on NGOs can impede development of effective governance institu-tions and lock beneficiaries in a charitable, rather than rights-based, rela-tionship with service providers (Haque 2002; World Bank 2002). Moreover,weak accountability mechanisms can be linked with growing inequalitylevels: where the poor lack social and political capital they will be unable totip economic institutions in their favor. As illustrated below, growing levelsof inequality in urban areas might be redressed by a focus on institutionsthat enhance the urban poor’s access to assets. While Bangladesh has over-come institutional impediments to growth and poverty reduction for morethan a decade, the long-term sustainability of pro-poor growth will rest inpart on institutional reforms.
Is Rising Inequality a Concern for Pro-Poor Growth?
Inequality has increased in Bangladesh in recent years. Theoretically, a casecan always be made to show that distributionally neutral growth will yield
104 Sen, Mujeri, and Shahabuddin
higher poverty reduction, but the growth dynamics for a given country maynot render such a choice feasible.27
Did Bangladesh have alternative options in terms of higher povertyreduction with lower income inequality during the 1990s? The answer isdifferent for rural and urban areas. In both cases the sources of growth alsocontributed to deteriorations in the distribution of income. Although thegovernment has responded with an appropriate institutional framework toequip the rural poor with sufficient assets to benefit from these sources ofgrowth, the urban poor lack the necessary institutional mechanisms to simi-larly benefit.28
Was a Rise in Inequality Unavoidable in Rural Areas?
Table 4.12 presents information on the sources of income inequality in ruralBangladesh.29 It shows that the three most important sources of incomebehind the deterioration in rural income equality or distribution are activitiesthat are intensive in financial capital (such as trade and many nonfarm self-employment activities), income sources associated with human capital (suchas salaried wage employment), and migration to foreign countries (“remit-tances from abroad”). The table also shows that the disequalizing tendenciesof these three sources of rural income have magnified over the 1990s.
Could anything have been done to avert these developments in the1990s? The answer is no for two reasons. First, the main sectors of risingincome inequality in rural Bangladesh also represented the most growth-seeking sectors of the rural economy. Second, recognizing that gains fromthese sectors were not sufficiently benefiting the poor, the governmentdesigned an appropriate institutional response to enable the poor to partici-pate in sources of growth in the future.
The three main disequalizing forces in the rural economy—nonfarmself-employment income, salaried wage employment, and remittances—have also represented key sources of growth. Although income fromnonfarm self-employment was equalizing in the early 1990s, it had becomehighly disequalizing by the end of the decade: the concentration ratio rosefrom 0.22 to 0.48. At the same time, the share of nonfarm enterpriseincome in total rural income increased from 15 to 20 percent. As a result ofthe combined effect of these two tendencies, the contribution of this sourceof income to overall rural income inequality increased from 12 to 27 per-cent. Salaried wage employment and remittances from abroad have con-tributed 21 percent and 19 percent, respectively, to overall rural incomeinequality.
Explaining Pro-Poor Growth in Bangladesh: Puzzles, Evidence, and Implications 105
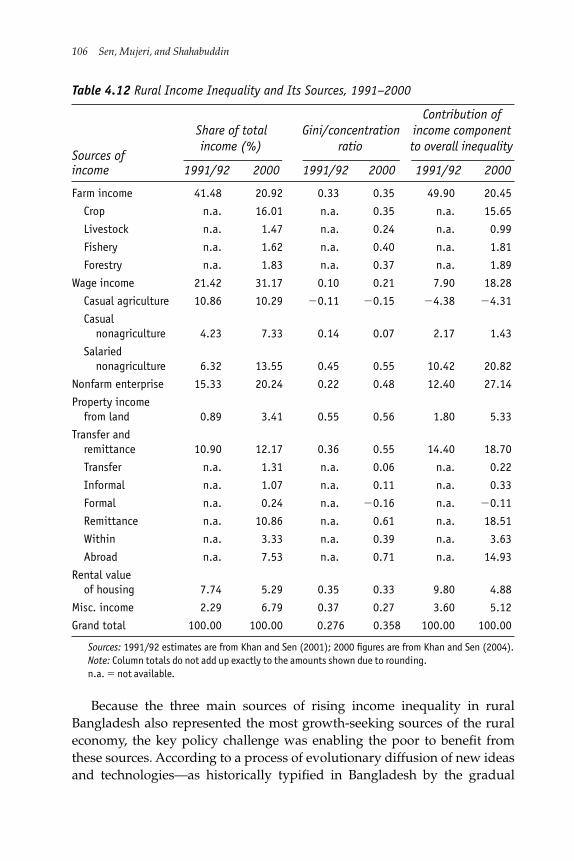
106 Sen, Mujeri, and Shahabuddin
Table 4.12 Rural Income Inequality and Its Sources, 1991–2000
Contribution ofShare of total Gini/concentration income component
Sources ofincome (%) ratio to overall inequality
income 1991/92 2000 1991/92 2000 1991/92 2000
Farm income 41.48 20.92 0.33 0.35 49.90 20.45
Crop n.a. 16.01 n.a. 0.35 n.a. 15.65
Livestock n.a. 1.47 n.a. 0.24 n.a. 0.99
Fishery n.a. 1.62 n.a. 0.40 n.a. 1.81
Forestry n.a. 1.83 n.a. 0.37 n.a. 1.89
Wage income 21.42 31.17 0.10 0.21 7.90 18.28
Casual agriculture 10.86 10.29 �0.11 �0.15 �4.38 �4.31
Casualnonagriculture 4.23 7.33 0.14 0.07 2.17 1.43
Salariednonagriculture 6.32 13.55 0.45 0.55 10.42 20.82
Nonfarm enterprise 15.33 20.24 0.22 0.48 12.40 27.14
Property incomefrom land 0.89 3.41 0.55 0.56 1.80 5.33
Transfer andremittance 10.90 12.17 0.36 0.55 14.40 18.70
Transfer n.a. 1.31 n.a. 0.06 n.a. 0.22
Informal n.a. 1.07 n.a. 0.11 n.a. 0.33
Formal n.a. 0.24 n.a. �0.16 n.a. �0.11
Remittance n.a. 10.86 n.a. 0.61 n.a. 18.51
Within n.a. 3.33 n.a. 0.39 n.a. 3.63
Abroad n.a. 7.53 n.a. 0.71 n.a. 14.93
Rental valueof housing 7.74 5.29 0.35 0.33 9.80 4.88
Misc. income 2.29 6.79 0.37 0.27 3.60 5.12
Grand total 100.00 100.00 0.276 0.358 100.00 100.00
Sources: 1991/92 estimates are from Khan and Sen (2001); 2000 figures are from Khan and Sen (2004).Note: Column totals do not add up exactly to the amounts shown due to rounding.n.a. � not available.
Because the three main sources of rising income inequality in ruralBangladesh also represented the most growth-seeking sources of the ruraleconomy, the key policy challenge was enabling the poor to benefit fromthese sources. According to a process of evolutionary diffusion of new ideasand technologies—as historically typified in Bangladesh by the gradual
Explaining Pro-Poor Growth in Bangladesh: Puzzles, Evidence, and Implications 107
“deepening” of the green revolution and population control—developmentopportunities are first accessed by the nonpoor, then percolate to themoderately poor and finally to the extremely poor.30 This pattern of diffu-sion is not inevitable: extending development opportunities to the ex-tremely poor is very difficult.
In the 1990s the nonpoor and, to a considerable extent, the moderatelypoor benefited most from new sources of rural growth, such as nonfarmself-enterprise income, salaried wage employment, and remittances. In con-trast, participation of the extremely poor in these activities was either verylimited or was restricted to the low-productivity end of these activities.31
Thus, the extremely poor are twice disadvantaged: they are unable to fullyaccess the activities that could raise them above the poverty line and, evenwhen they do gain access to such activities, they are unable to earn as muchas the moderately nonpoor. These disadvantages have a lot to do with therelative inability of the extremely poor to access salaried jobs in the nonfarmsector and to earn high rates of return from self-employment. The key factorin their relative backwardness is their comparatively limited access to capa-bility-enhancing assets such as human capital, physical assets (both per-sonal and collective), and support from social networks. The extremely poorare often excluded from the “progressive segment” of the market and facethe most conservative terms of conditions and most exploitative relations ofproduction.32
In the 1990s the government began providing institutional responses tothe limited access of the extremely poor to capability-enhancing assets.These responses include microcredit programs and stipend schemes forattracting students from poor families. However, the benefits from thesehuman capital development programs could not be readily translated intogrowth advantages, at least over the medium term. The positive effects ofthese programs are likely to show up in the next decade’s income distribu-tion dynamics.
In short, Bangladesh could not have avoided rising rural income inequal-ity in the 1990s, given the evolutionary nature of the growth path. The 1990swas largely the decade of escape from poverty for the moderately poor inrural areas. The government’s institutional responses to rural inequality arelikely to increase gains for the extremely poor in the coming years.
Was Higher Pro-Poor Growth Possible in Urban Areas?
Table 4.13 presents the sources of rising inequality in urban areas in the1990s. The role of nonfarm self-enterprise income, salaried wage employ-ment, and remittances is highlighted in the case of urban distribution
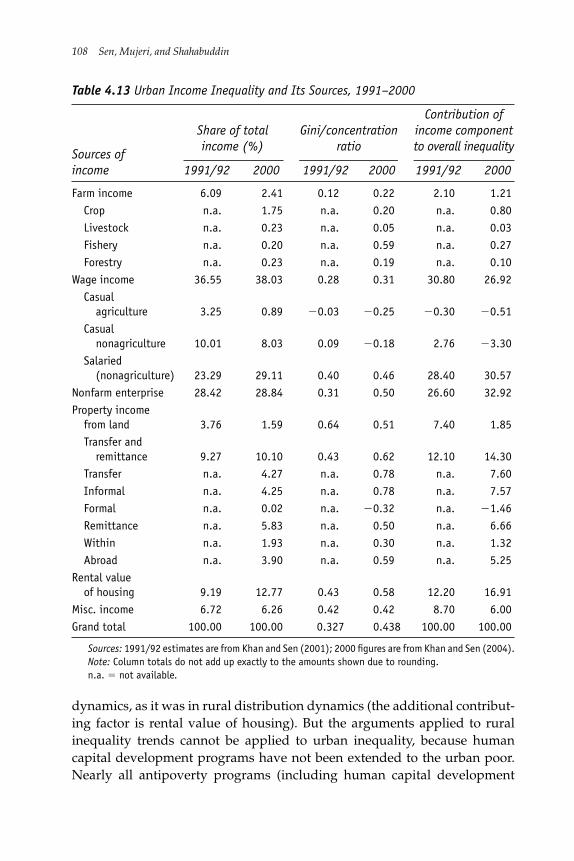
108 Sen, Mujeri, and Shahabuddin
Table 4.13 Urban Income Inequality and Its Sources, 1991–2000
Contribution ofShare of total Gini/concentration income component
Sources ofincome (%) ratio to overall inequality
income 1991/92 2000 1991/92 2000 1991/92 2000
Farm income 6.09 2.41 0.12 0.22 2.10 1.21Crop n.a. 1.75 n.a. 0.20 n.a. 0.80Livestock n.a. 0.23 n.a. 0.05 n.a. 0.03Fishery n.a. 0.20 n.a. 0.59 n.a. 0.27Forestry n.a. 0.23 n.a. 0.19 n.a. 0.10
Wage income 36.55 38.03 0.28 0.31 30.80 26.92Casual
agriculture 3.25 0.89 �0.03 �0.25 �0.30 �0.51Casual
nonagriculture 10.01 8.03 0.09 �0.18 2.76 �3.30Salaried
(nonagriculture) 23.29 29.11 0.40 0.46 28.40 30.57Nonfarm enterprise 28.42 28.84 0.31 0.50 26.60 32.92Property income
from land 3.76 1.59 0.64 0.51 7.40 1.85Transfer and
remittance 9.27 10.10 0.43 0.62 12.10 14.30Transfer n.a. 4.27 n.a. 0.78 n.a. 7.60Informal n.a. 4.25 n.a. 0.78 n.a. 7.57Formal n.a. 0.02 n.a. �0.32 n.a. �1.46Remittance n.a. 5.83 n.a. 0.50 n.a. 6.66Within n.a. 1.93 n.a. 0.30 n.a. 1.32Abroad n.a. 3.90 n.a. 0.59 n.a. 5.25
Rental value of housing 9.19 12.77 0.43 0.58 12.20 16.91
Misc. income 6.72 6.26 0.42 0.42 8.70 6.00Grand total 100.00 100.00 0.327 0.438 100.00 100.00
Sources: 1991/92 estimates are from Khan and Sen (2001); 2000 figures are from Khan and Sen (2004).Note: Column totals do not add up exactly to the amounts shown due to rounding.n.a. � not available.
dynamics, as it was in rural distribution dynamics (the additional contribut-ing factor is rental value of housing). But the arguments applied to ruralinequality trends cannot be applied to urban inequality, because humancapital development programs have not been extended to the urban poor.Nearly all antipoverty programs (including human capital development
programs such as stipend schemes and essential health service packages)have been targeted to rural areas only. As a result, initial disadvantages inthe capabilities of moderately poor and extremely poor urban householdshave persisted.
As table 4.13 shows, activities such as casual nonagricultural jobs, inwhich most of the urban poor work, have equalizing effects on urbanincome distribution but exhibit no substantial growth prospects: indeed,their contribution to urban income actually dropped during the 1990s.Moreover, many of these activities (such as rickshaw pulling, brick break-ing, or tannery) are not viable exit routes from urban poverty. They maypass as candidates for pro-poor growth because of their labor intensity, butthey often represent long-term risks because of adverse health externalities.
The continuing absence of an institutional framework to enable theurban poor to gain from sources of growth suggests that this population’sprospects for upward mobility will remain limited. The rapid rise, as mea-sured by the Gini index, in urban income inequality from a level of 0.33 to0.44 in a matter of a decade is a cause of concern in itself. This rise representsone of the fastest increases in inequality in the developing world and is asource of broader policy concern given the continued rise in urban popula-tion in Bangladesh—currently totaling 25 percent, up from just 12 percenttwo decades ago, and projected to reach 40 percent in 2018 (the metropolisof Dhaka will be the fourth largest city in the world in 2018). Clearly, morecan be done in the areas of human development, sustainable job creation,access to basic social services, and improved urban governance. In short, thescope for improving the relative position of the urban poor in the urbangrowth process—not just for moderating the sharply rising trends of urbaninequality, but also for accelerating the rate of rather modest pro-poorgrowth in urban areas—is considerable.
Conclusion
Bangladesh achieved impressive growth and poverty reduction in the 1990sthrough increased macroeconomic stability and trade openness, enhancedresilience to shocks and greater capacity for managing risks arising fromvulnerability to natural disasters, and investments in rural infrastructureand agriculture. This strong pro-poor growth performance also reflectedsustained political commitment to improving the welfare of the poor, as evi-denced by improvements in human development indicators and a steadydrop in fertility and population growth rates.
Future challenges relate to generating momentum for continued broad-based growth. Political attention must shift to ensuring that the gains from
Explaining Pro-Poor Growth in Bangladesh: Puzzles, Evidence, and Implications 109
trade liberalization and structural transformation reach the extremely poor.Mechanisms to circumvent or fill gaps left by weak public institutions are atleast in part responsible for a rise in urban inequality, which is particularlyworrisome in the context of internal migration and urbanization. Institu-tional responses need to enhance the urban poor’s access to capacity-enhancing assets.
A recent study has suggested that analysts need new cross-countrydatabases—measuring the property rights of the poor and transaction costsfor small-scale entrepreneurs, for instance—to better understand how insti-tutions affect the poor (Barbone and others 2006). Future research mightassess the extent to which current governance indicators accurately reflectelements of the institutional environment that are relevant to the poor inBangladesh.
Notes
1. The estimated population of Bangladesh was about 130 million in 2000. Thepopulation density is about 880 persons per square kilometer—the highest in theworld, excluding city states such as Singapore. The contrasting themes of “initialpessimism” and “subsequent success” of the 1990s reflect research on Bangladesh byMujeri and Sen (2003), Government of Bangladesh (2003), World Bank (2003b), andAhluwalia and Mahmud (2004).
2. Bangladesh is approaching self-sufficiency in production of rice, the staplefood, through adoption of modern technologies. Increased disaster preparednessand expanded capacity to implement lean-season wage employment and transferprograms help ensure minimum food entitlements for the poorest in times ofcrisis.
3. The primary source of incomparability is different methods of food expendi-ture recording: memory was mainly used in surveys up to 1981/82, but the morereliable diary-keeping method was used in the later surveys (see Ravallion 1990;Hossain and Sen 1992). Thus the survey data between 1973/74 and 1981/82 are com-parable, but not comparable to data from 1983/84 through 2000 (last year for whichHIES is presently available). Within the later series, comparison between urban dataof 1995/96 and 2000 is problematic: because of an overestimation of the averagelevel of urban per capita expenditure, results yield average negative growth in realurban expenditure between 1995/96 and 2000 (see Government of Bangladesh 2003).
4. Assessment of the poverty level will vary depending on the poverty line used.On the basis of the 1991/92 poverty line (derived by the so-called upper poverty linemethod), World Bank (2002) found the level of poverty in 2000 to be 50 percent; onthe basis of the 1983/84 poverty line (frequently used in the Bangladesh literature),it would be 40 percent. Although the level estimates vary between the two sources,the extent of poverty reduction is similar: about a 1 percentage point drop per yearduring the 1990s.
110 Sen, Mujeri, and Shahabuddin
5. Notwithstanding expansion of primary and secondary education in the 1990s,the adult literacy rate reflects Bangladesh’s enormous burden of illiteracy.
6. Demographic and Health Survey data confirm the trend with a different sur-vey methodology and estimation procedures: the IMR has dropped from 101 in1993/94 to 80 in 1999/00. DHS data also show considerable improvement in theunder-five mortality rate, as the matched figure dropped from 150 to 110 between1994 and 2000.
7. This refers to the child malnutrition data collected by the Bangladesh Bureauof Statistics. The DHS data also show that the proportion of children (0 to 59 months)underweight has dropped from 56 percent to 48 percent between 1996/97 and1999/00.
8. The level of net enrollment rate is lower but shows impressive progress aswell.
9. This low volatility of growth may be clearly seen within the framework ofcross-country growth regressions. Adding volatility to the standard Barro-typecross-country regressions increases significantly the predictive power of the model,which was used to predict the long-terms growth of GDP per capita in Bangladesh(see World Bank 2003b).
10. The 1991/92 and 1995/96 figures are from Khan and Sen (2001); the 2000estimates are from Khan and Sen (2004). The Bangladesh Bureau of Statistics (BSS)estimates differ from these estimates. Past BBS estimates of the income Gini indexwere based on the flawed “per household” income distribution rather than on thepreferred “per capita” income distribution. Moreover, the BBS definition of incomeincludes several kinds of nonincome revenues, which need to be reconsidered whilecomputing the Gini index for relative income inequality. These items relate to capitalreceipts from the sale of assets, increases in financial assets, and receipts arising outof the repayment of loans. Excluding these items, Khan and Sen (2001) recomputedthe Gini index for 1991/92 and 1995/96. The reworking gives lower figures for Giniin both rural and urban areas, though the underlying trend remains unaffected.
11. This is not to say that all the areas of urban growth have low poverty respon-siveness. Ready-made garments, small- and medium-size industries, construction,transport, and informal service activities are likely to be poverty reducing. But, inthe aggregate sectoral sense, urban growth in the 1990s emerged as a lesser povertyreducer than rural growth.
12. These policy factors also emerged as the key elements from the growth litera-ture on Bangladesh and South Asia: Mujeri and Sen (2003); Osmani and others(2003); Tendulkar and Sen (2003); World Bank (2003b).
13. The strength of the taka since 1997 is due in part to the rapid growth of RMGexports and remittances. But given Bangladesh’s narrow export base, appreciationof the real exchange rate during the 1990s was not a good outcome. This trend isbeing reversed, and Bangladesh adopted a flexible exchange rate regime in 2003.
14. From the perspective of pro-poor growth in rural areas, the relevance ofremittances is best revealed by their use: land and agricultural input purchases,
Explaining Pro-Poor Growth in Bangladesh: Puzzles, Evidence, and Implications 111
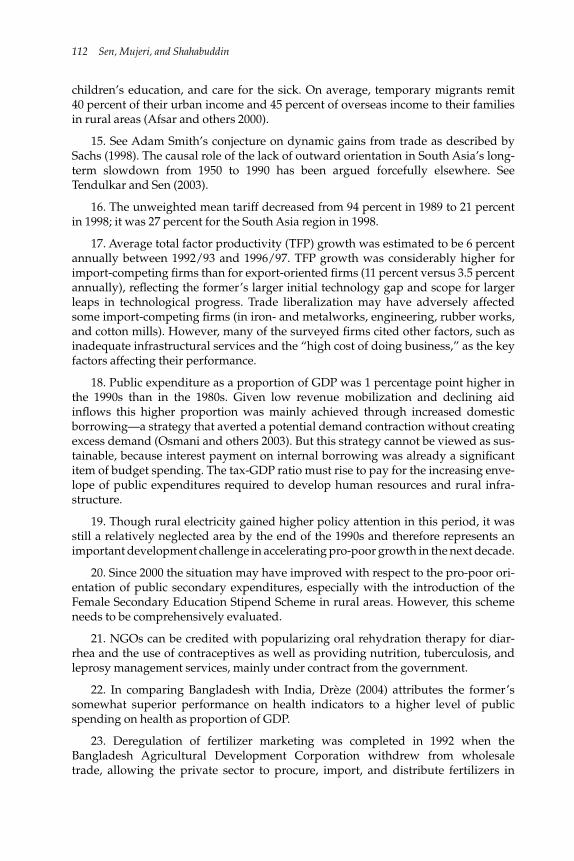
children’s education, and care for the sick. On average, temporary migrants remit40 percent of their urban income and 45 percent of overseas income to their familiesin rural areas (Afsar and others 2000).
15. See Adam Smith’s conjecture on dynamic gains from trade as described bySachs (1998). The causal role of the lack of outward orientation in South Asia’s long-term slowdown from 1950 to 1990 has been argued forcefully elsewhere. SeeTendulkar and Sen (2003).
16. The unweighted mean tariff decreased from 94 percent in 1989 to 21 percentin 1998; it was 27 percent for the South Asia region in 1998.
17. Average total factor productivity (TFP) growth was estimated to be 6 percentannually between 1992/93 and 1996/97. TFP growth was considerably higher forimport-competing firms than for export-oriented firms (11 percent versus 3.5 percentannually), reflecting the former’s larger initial technology gap and scope for largerleaps in technological progress. Trade liberalization may have adversely affectedsome import-competing firms (in iron- and metalworks, engineering, rubber works,and cotton mills). However, many of the surveyed firms cited other factors, such asinadequate infrastructural services and the “high cost of doing business,” as the keyfactors affecting their performance.
18. Public expenditure as a proportion of GDP was 1 percentage point higher inthe 1990s than in the 1980s. Given low revenue mobilization and declining aidinflows this higher proportion was mainly achieved through increased domesticborrowing—a strategy that averted a potential demand contraction without creatingexcess demand (Osmani and others 2003). But this strategy cannot be viewed as sus-tainable, because interest payment on internal borrowing was already a significantitem of budget spending. The tax-GDP ratio must rise to pay for the increasing enve-lope of public expenditures required to develop human resources and rural infra-structure.
19. Though rural electricity gained higher policy attention in this period, it wasstill a relatively neglected area by the end of the 1990s and therefore represents animportant development challenge in accelerating pro-poor growth in the next decade.
20. Since 2000 the situation may have improved with respect to the pro-poor ori-entation of public secondary expenditures, especially with the introduction of theFemale Secondary Education Stipend Scheme in rural areas. However, this schemeneeds to be comprehensively evaluated.
21. NGOs can be credited with popularizing oral rehydration therapy for diar-rhea and the use of contraceptives as well as providing nutrition, tuberculosis, andleprosy management services, mainly under contract from the government.
22. In comparing Bangladesh with India, Drèze (2004) attributes the former’ssomewhat superior performance on health indicators to a higher level of publicspending on health as proportion of GDP.
23. Deregulation of fertilizer marketing was completed in 1992 when theBangladesh Agricultural Development Corporation withdrew from wholesaletrade, allowing the private sector to procure, import, and distribute fertilizers in
112 Sen, Mujeri, and Shahabuddin
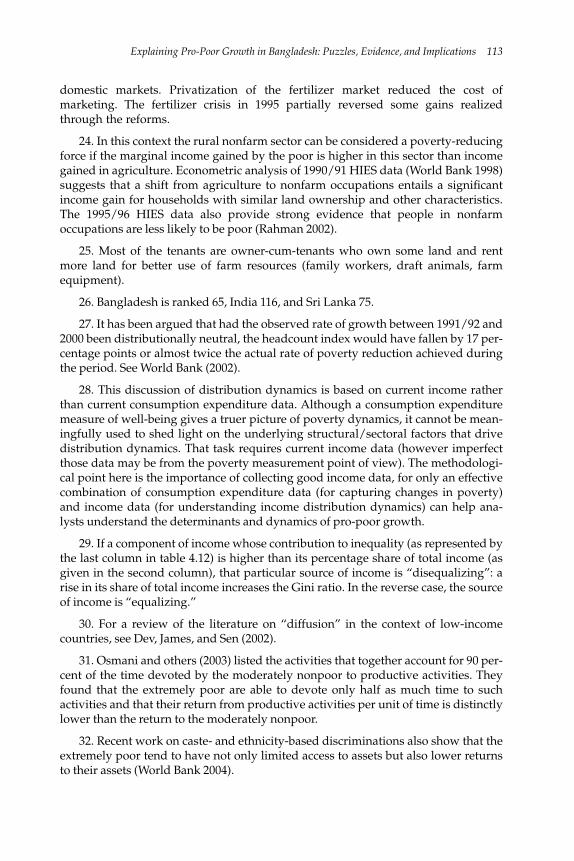
domestic markets. Privatization of the fertilizer market reduced the cost ofmarketing. The fertilizer crisis in 1995 partially reversed some gains realizedthrough the reforms.
24. In this context the rural nonfarm sector can be considered a poverty-reducingforce if the marginal income gained by the poor is higher in this sector than incomegained in agriculture. Econometric analysis of 1990/91 HIES data (World Bank 1998)suggests that a shift from agriculture to nonfarm occupations entails a significantincome gain for households with similar land ownership and other characteristics.The 1995/96 HIES data also provide strong evidence that people in nonfarmoccupations are less likely to be poor (Rahman 2002).
25. Most of the tenants are owner-cum-tenants who own some land and rentmore land for better use of farm resources (family workers, draft animals, farmequipment).
26. Bangladesh is ranked 65, India 116, and Sri Lanka 75.
27. It has been argued that had the observed rate of growth between 1991/92 and2000 been distributionally neutral, the headcount index would have fallen by 17 per-centage points or almost twice the actual rate of poverty reduction achieved duringthe period. See World Bank (2002).
28. This discussion of distribution dynamics is based on current income ratherthan current consumption expenditure data. Although a consumption expendituremeasure of well-being gives a truer picture of poverty dynamics, it cannot be mean-ingfully used to shed light on the underlying structural/sectoral factors that drivedistribution dynamics. That task requires current income data (however imperfectthose data may be from the poverty measurement point of view). The methodologi-cal point here is the importance of collecting good income data, for only an effectivecombination of consumption expenditure data (for capturing changes in poverty)and income data (for understanding income distribution dynamics) can help ana-lysts understand the determinants and dynamics of pro-poor growth.
29. If a component of income whose contribution to inequality (as represented bythe last column in table 4.12) is higher than its percentage share of total income (asgiven in the second column), that particular source of income is “disequalizing”: arise in its share of total income increases the Gini ratio. In the reverse case, the sourceof income is “equalizing.”
30. For a review of the literature on “diffusion” in the context of low-incomecountries, see Dev, James, and Sen (2002).
31. Osmani and others (2003) listed the activities that together account for 90 per-cent of the time devoted by the moderately nonpoor to productive activities. Theyfound that the extremely poor are able to devote only half as much time to suchactivities and that their return from productive activities per unit of time is distinctlylower than the return to the moderately nonpoor.
32. Recent work on caste- and ethnicity-based discriminations also show that theextremely poor tend to have not only limited access to assets but also lower returnsto their assets (World Bank 2004).
Explaining Pro-Poor Growth in Bangladesh: Puzzles, Evidence, and Implications 113
References
Abdullah, A., R. Afsar, A. Rahman, and B. Sen. 1991. Modernization at Bay: Structureand Change in Bangladesh. Dhaka, Bangladesh: University Press Ltd.
Abdullah, A., and Q. Shahabuddin. 1997. “Critical Issues in Agriculture: PolicyResponse and Unfinished Agenda.” In The Bangladesh Economy in Transition, ed.M. G. Quibria, 28–76. Dhaka, Bangladesh: University Press Ltd.
Afsar, R., M. Yunus, and ABMS Islam. 2000. Are Migrants Chasing after Perilous Illu-sion? A Study of Cost Benefit Analysis of Overseas Migration by the BangladeshLabour. Report prepared for the International Organization for Migration, Dhaka,Bangladesh.
Ahluwalia, I. J., and W. Mahmud, eds. 2004. “Bangladesh: Transformation andDevelopment.” Economic and Political Weekly 39 (36): September 4.
Alamgir, M. 1978. Bangladesh: A Case of Below Poverty Level Equilibrium Trap. Dhaka,Bangladesh: Bangladesh Institute of Development Studies.
BBS (Bangladesh Bureau of Statistics). 1975. Statistical Yearbook of Bangladesh, 1975.Dhaka, Bangladesh: Ministry of Planning, Government of the People’s Republicof Bangladesh.
_______. 1992. Vital Registration Survey 1986–92. Dhaka, Bangladesh: Ministry ofPlanning, Government of the People’s Republic of Bangladesh.
. 1991/92 and 2000. Household Income Expenditure Survey. Dhaka, Bangladesh:Ministry of Planning, Government of the People’s Republic of Bangladesh.
Bangladesh Enterprise Institute. 2004. “Taking Stock and Charting a Path for SMEsin Bangladesh.” Working paper, Dhaka, Bangladesh.
Barbone, L., L. Cord, C. Hull, and J. Sandefur. 2006. “Democracy, Institutions, andPoverty Reduction.” Working paper, World Bank, Washington, DC.
Basu, A., and S. Amin. 2000. “Some Preconditions for Fertility Decline in Bengal:History, Language Identity, and an Openness to Innovations.” Working Paper142, Policy Research Division, Population Council, New York.
_______. 2001. “Preliminary Report of Household Income and Expenditure Survey2000.” Bangladesh Bureau of Statistics, Dhaka, Bangladesh.
Boyce, J. K. 1987. Agrarian Impasse in Bengal: Institutional Constraints to TechnologicalChange. New York: Oxford University Press.
CAMPE (Campaign for Popular Education). 1999. Hope, Not Complacency: State of thePrimary Education in Bangladesh. Dhaka: University Press Ltd.
_______. 2000. “Education Watch Report 2000: Quality of Primary Education inBangladesh.” Draft. CAMPE, Dhaka.
del Ninno, C. 1998. “Efficiency of Targeted Food Programs: A Preliminary Investiga-tion of the VGD and the RD Programs.” Draft report, Food Management andResearch Support Project, International Food Policy Research Institute, Dhaka.
114 Sen, Mujeri, and Shahabuddin
Dev, S. M., K. S. James, and B. Sen. 2002. “Causes of Fertility Decline in India andBangladesh: The Role of Community.” Economic and Political Weekly 37 (43):4447–54.
Drèze, J. 2004. “Bangladesh Shows the Way.” The Hindu, September 17.
Government of Bangladesh. 2003. “A National Strategy for Economic Growth,Poverty Reduction, and Social Development.” Economic Relations Division,Ministry of Finance, Government of Bangladesh.
Haque, Shamsul. 2002. “The Changing Balance of Power between the Governmentand NGOs in Bangladesh.” International Political Science Review 23 (4): 411–35.
Hossain, M. 1996. “Agricultural Policies in Bangladesh: Evolution and Impact onCrop Production in State, Market and Development.” In Essays in Honour ofRehman Sobhan, ed. Abu Abdullah and Azizur Rahman Khan. Dhaka,Bangladesh: University Press Ltd.
Hossain, M., M. Quasem, M. Jabbar, and M. Akash. 1994. “Production Environ-ments, Modern Variety Adoption and Income Distribution in Bangladesh.” InModern Rice Technology and Income Distribution in Asia, ed. C. C. David and K.Otsuka. Boulder, CO, and London: Lynne Reinner Publishers.
Jannuzi, F. T., and J. T. Peach. 1980. The Agrarian Structure of Bangladesh: An Impedi-ment to Development. Boulder, CO: Westview Press.
Kaufmann, D., A. Kraay, and M. Mastruzzi. 2005. Governance Matters IV: GovernanceIndicators for 1996–2004. Washington, DC: World Bank.
Khan, A. A. 1996. Discovery of Bangladesh: Explorations into the Dynamics of a HiddenNation. Dhaka, Bangladesh: University Press Ltd.
Khan, A. R. and B. Sen. 2006. “The Structure and Distribution of Personal Incomeand Poverty Reduction: A Case Study in Bangladesh during the 1990s.” InHuman Development in the Era of Globalization. Essays in Honour of Keith Griffin, ed.,J. K. Boyce, Stephen Cullenberg, Prasanta K. Pattanaik, and Robert Pollin,79–118. Northampton, MA: Edward Elgar.
Mandal, S. 2002. “Rural Development Policy in Bangladesh.” In Hands Not Land:How Livelihoods Are Changing in Rural Bangladesh, ed. K. A. Toufique and C.Turton. Dhaka, Bangladesh: Bangladesh Institute of Development Studies.
Ministry of Health and Family Welfare. 1993–2000. Bangladesh Demographic and HealthSurvey, 1993–2000. Dhaka, Bangladesh: Government of the People’s Republic ofBangladesh.
Mondal, A. 2000. “Social Capital Formation: The Role of NGO Rural DevelopmentPrograms in Bangladesh.” Policy Sciences 33 (3–4): 459–75.
Mujeri, M. K. 2003. Economic Growth and Poverty Reduction in Bangladesh. Dhaka,Bangladesh: Asian Development Bank and Embassy of Japan.
Mujeri, M., and B. Sen. 2003. A Quiet Transition: Some Aspects of the History of EconomicGrowth in Bangladesh, 1970–2000. Country paper prepared for the Global GrowthProject, the Global Development Network, and Bangladesh Institute of Develop-ment Studies.
Explaining Pro-Poor Growth in Bangladesh: Puzzles, Evidence, and Implications 115
Osmani, S. R., W. Mahmud, H. Dagdeviren, and A. Seth. 2003. The Macroeconomics ofPoverty Reduction: The Case Study of Bangladesh. Asia-Pacific Regional Programmeon Macroeconomics of Poverty Reduction, United Nations DevelopmentProgramme, Kathmandu, Nepal/Dhaka, Bangladesh.
Political Risk Services Group. 2005. International Country Risk Guide. New York: Polit-ical Risk Services Group.
Rahman, R. I. 2002. “Rural Poverty: Pattern, Processes, and Policies.” In Hands NotLand: How Livelihoods Are Changing in Rural Bangladesh, ed. K. A. Toufique and C.Turton. Dhaka, Bangladesh: Bangladesh Institute of Development Studies.
Ravallion, M., and B. Sen. 1996. “When Method Matters: Monitoring Poverty inBangladesh.” Economic Development and Cultural Change 44 (4): 761–92.
Sachs, J. 1998. “International Economics: Unlocking the Mysteries of Globalization.”Foreign Policy 110 (Spring): 97–111.
Sen, B., and Z. Ali. 2005. “Spatial Inequality in Social Progress in Bangladesh.” Work-ing Paper 7, Program for the Research on Chronic Poverty in Bangladesh,Bangladesh Institute of Development Studies, Dhaka, Bangladesh.
Sen B., and D. Hulme. 2004. “Chronic Poverty in Bangladesh: Tales of Ascent,Descent, Marginality and Persistence.” Working paper, Bangladesh Institute ofDevelopment Studies, Chronic Poverty Research Center, Institute for Develop-ment Policy and Management, and University of Manchester.
Sobhan, R., ed. 1991. The Decade of Stagnation: The State of the Bangladesh Economy inthe 1980s, Dhaka, Bangladesh: University Press Ltd.
South Asia Enterprise Development Facility. 2003. “The SME Sector: Taking Stock ofthe Present Situation.” Working paper, South Asia Enterprise DevelopmentFacility, Dhaka, Bangladesh.
Stern, N. 2002. “The Investment Climate, Governance and Inclusion in Bangladesh.”Public lecture given at the Bangladesh Economic Association, Dhaka, Bangladesh,January 8.
Tendulkar, S., and B. Sen. 2003. “Markets and Long-Term Economic Growth in SouthAsia 1950–97.” In The South Asian Experience with Growth, ed. Isher JudgeAhluwalia and John Williamson, 146–218. New Delhi, India: Oxford UniversityPress.
Transparency International. “Corruptions Perceptions Index.” http://www.transparency.org.
World Bank. 1998. From Counting the Poor to Making the Poor Count. Washington, DC:World Bank.
_______. 1999. “Bangladesh: Trade Liberalization. Its Pace and Impacts.” Report1591-BD, World Bank, Washington, DC.
_______. 2002. Taming Leviathan: Reforming Governance in Bangladesh, An InstitutionalReview. Washington, DC: World Bank.
116 Sen, Mujeri, and Shahabuddin
_______. 2003a. “Bangladesh: Public Expenditure Review 2003.” World Bank, Washington, DC.
_______. 2003b. Poverty in Bangladesh: Building on Progress. Washington, DC: WorldBank.
_______. 2004. “Tamil Nadu Poverty Assessment.” Draft, World Bank, Washington,DC.
_______. 2005a. Bangladesh: Attaining the Millennium Development Goals in Bangladesh.Washington, DC: World Bank.
_______. 2005b. Doing Business in 2006: Creating Jobs. Washington, DC: World Bank.
Zohir, S., Q. Shahabuddin, and M. Hossain. 2002. “Determinants of Rice Supply andDemand in Bangladesh: Recent Trends and Projections.” In Developments in theAsian Rice Economy, ed. M. Sombilla, M. Hossain, and B. Hardy, 127–52. Manila,Philippines: International Rice Research Institute.
Explaining Pro-Poor Growth in Bangladesh: Puzzles, Evidence, and Implications 117

5Pro-Poor Growth in Vietnam:Miracle or Model?
Rainer Klump
In the 1990s Vietnam achieved rapid overall growth that proved remarkablyeffective in shrinking poverty without severely widening inequality. Aver-age annual rates of per capita growth (5.7 percent) and of poverty reduction(7.8 percent) outpaced those of most developing countries. The povertyheadcount—58.1 percent in the early 1990s and 28.9 percent 10 years later—dropped to under 25 percent by the end of 2004. If that rate of reduction ismaintained, some expect that “abject poverty will soon be limited to ethnicminorities in remote areas.”1
Vietnam’s performance in the 1990s starkly contrasts with its perfor-mance a decade earlier, when the country was still suffering the repercus-sions of wars, political and economic isolation, famines, and hyperinflation.Against this background the country’s remarkable successes of the 1990smight be regarded as a miracle in the form of beneficial external circum-stances or the result of effective internal policy measures that could beregarded as a model for channeling high-growth dividends to the poor. Aninvestigation of the successes suggests that the country made policy choicesto take advantage of beneficial initial conditions for generating growth andreducing poverty. These choices were necessary not only to realize but alsoto sustain broad-based growth.
This chapter examines the way Vietnam tied rapid, overall economicgrowth to strong, sustained poverty reduction through a mix of economic,sectoral, and regional policies.2 The country’s rapid growth and povertyreduction owe to exogenous factors and to three types of policies: policies
119
related to the quality and quantity of job creation, institutional and macro-economic policies that are particularly important for overall growth, andpolicies related to public expenditures that can provide public goods as wellas targeted transfers to specific groups of households.3
Three factors significantly affected the quality and quantity of job cre-ation in Vietnam. First, land reform, along with trade liberalization for cof-fee and rice and the boom in the world coffee market, benefited unskilledagricultural workers in rural areas. Second, the economy experienced astructural transformation as agriculture grew more productive and growthin nonagricultural sectors accelerated. By the end of the 1990s these sectorshad begun to absorb labor released from agriculture. Third, economic andinstitutional reforms, and in particular a new legal framework for privateenterprise, facilitated the emergence of a viable private sector and the move-ment of employment from informal to formal sector industry and services.Income growth and poverty reduction occurred in both urban and ruralareas, as the latter increasingly became linked to the growth dynamics ofurban centers.
The story of poverty-reducing growth in Vietnam is the story of theimpact that the doi moi (renovation) reform process begun in 1986 has hadon transforming the country’s economy and, in the process, raising theincomes of millions of Vietnamese. The policy choices that unlockedVietnam’s potential for high growth and rapid poverty reduction deservethe closest study. If its past successes offer lessons to others, Vietnam itselfmay well need to learn from some of its efforts as it attempts to find newavenues to economic and social progress.
War, Economic Decline, Sociogeographic Diversity:The Setting for Reform
Vietnam’s political, social, and economic conditions in 1986 appeared any-thing but conducive to economic growth and poverty reduction. Betweenindependence from France in 1954 until the end of a devastating civil war in1975, North and South Vietnam developed polar opposite economic andpolitical regimes. Reunification put the capitalist South—an American clientthat had developed a base of light industry and services and had integratedinto international markets—into a centrally planned state run on Commu-nist principles. In the North, farmers and handicrafts had been collectivizedand the private sector eliminated. Emphasizing heavy industry and largestate-owned enterprises (SOEs), the Hanoi authorities imposed their systemon the conquered South. Despite some misgivings even within the ruling
120 Klump
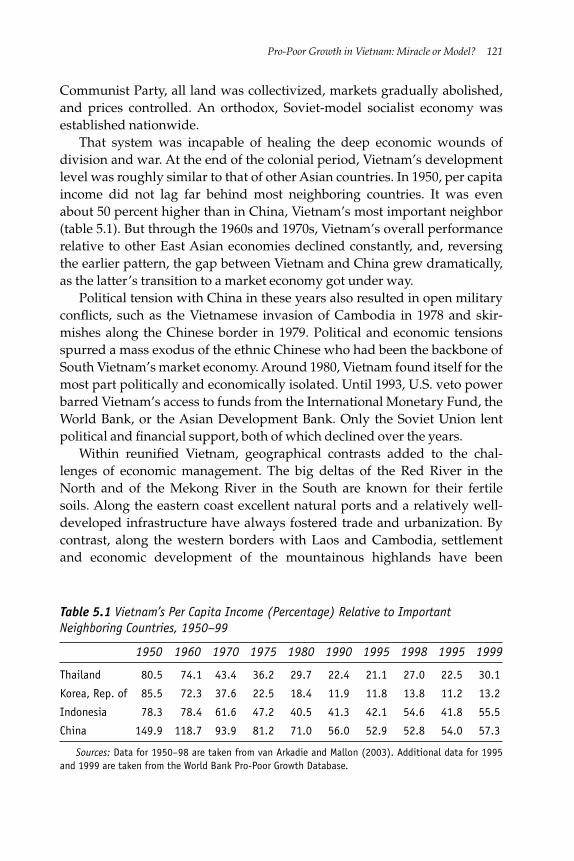
Pro-Poor Growth in Vietnam: Miracle or Model? 121
Communist Party, all land was collectivized, markets gradually abolished,and prices controlled. An orthodox, Soviet-model socialist economy wasestablished nationwide.
That system was incapable of healing the deep economic wounds ofdivision and war. At the end of the colonial period, Vietnam’s developmentlevel was roughly similar to that of other Asian countries. In 1950, per capitaincome did not lag far behind most neighboring countries. It was evenabout 50 percent higher than in China, Vietnam’s most important neighbor(table 5.1). But through the 1960s and 1970s, Vietnam’s overall performancerelative to other East Asian economies declined constantly, and, reversingthe earlier pattern, the gap between Vietnam and China grew dramatically,as the latter’s transition to a market economy got under way.
Political tension with China in these years also resulted in open militaryconflicts, such as the Vietnamese invasion of Cambodia in 1978 and skir-mishes along the Chinese border in 1979. Political and economic tensionsspurred a mass exodus of the ethnic Chinese who had been the backbone ofSouth Vietnam’s market economy. Around 1980, Vietnam found itself for themost part politically and economically isolated. Until 1993, U.S. veto powerbarred Vietnam’s access to funds from the International Monetary Fund, theWorld Bank, or the Asian Development Bank. Only the Soviet Union lentpolitical and financial support, both of which declined over the years.
Within reunified Vietnam, geographical contrasts added to the chal-lenges of economic management. The big deltas of the Red River in theNorth and of the Mekong River in the South are known for their fertilesoils. Along the eastern coast excellent natural ports and a relatively well-developed infrastructure have always fostered trade and urbanization. Bycontrast, along the western borders with Laos and Cambodia, settlementand economic development of the mountainous highlands have been
Table 5.1 Vietnam’s Per Capita Income (Percentage) Relative to ImportantNeighboring Countries, 1950–99
1950 1960 1970 1975 1980 1990 1995 1998 1995 1999
Thailand 80.5 74.1 43.4 36.2 29.7 22.4 21.1 27.0 22.5 30.1
Korea, Rep. of 85.5 72.3 37.6 22.5 18.4 11.9 11.8 13.8 11.2 13.2
Indonesia 78.3 78.4 61.6 47.2 40.5 41.3 42.1 54.6 41.8 55.5
China 149.9 118.7 93.9 81.2 71.0 56.0 52.9 52.8 54.0 57.3
Sources: Data for 1950–98 are taken from van Arkadie and Mallon (2003). Additional data for 1995and 1999 are taken from the World Bank Pro-Poor Growth Database.
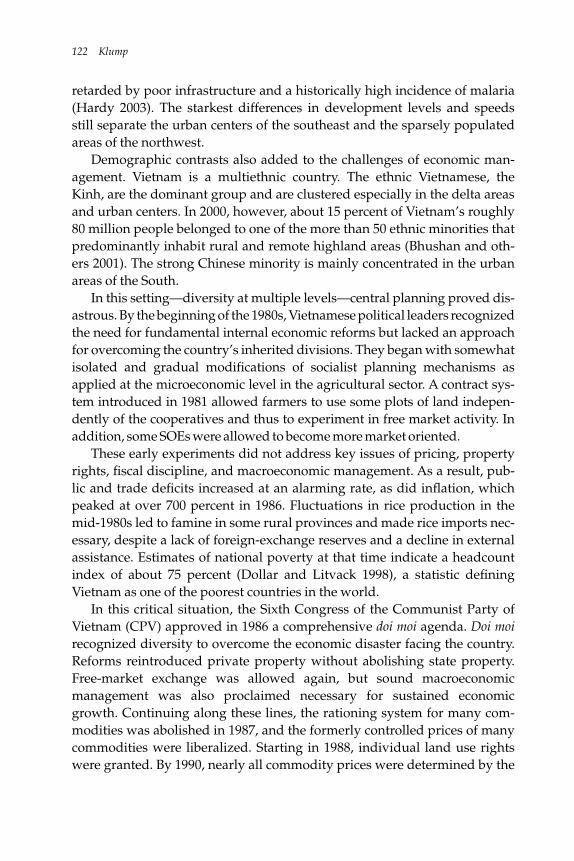
retarded by poor infrastructure and a historically high incidence of malaria(Hardy 2003). The starkest differences in development levels and speedsstill separate the urban centers of the southeast and the sparsely populatedareas of the northwest.
Demographic contrasts also added to the challenges of economic man-agement. Vietnam is a multiethnic country. The ethnic Vietnamese, theKinh, are the dominant group and are clustered especially in the delta areasand urban centers. In 2000, however, about 15 percent of Vietnam’s roughly80 million people belonged to one of the more than 50 ethnic minorities thatpredominantly inhabit rural and remote highland areas (Bhushan and oth-ers 2001). The strong Chinese minority is mainly concentrated in the urbanareas of the South.
In this setting—diversity at multiple levels—central planning proved dis-astrous. By the beginning of the 1980s, Vietnamese political leaders recognizedthe need for fundamental internal economic reforms but lacked an approachfor overcoming the country’s inherited divisions. They began with somewhatisolated and gradual modifications of socialist planning mechanisms asapplied at the microeconomic level in the agricultural sector. A contract sys-tem introduced in 1981 allowed farmers to use some plots of land indepen-dently of the cooperatives and thus to experiment in free market activity. Inaddition, some SOEs were allowed to become more market oriented.
These early experiments did not address key issues of pricing, propertyrights, fiscal discipline, and macroeconomic management. As a result, pub-lic and trade deficits increased at an alarming rate, as did inflation, whichpeaked at over 700 percent in 1986. Fluctuations in rice production in themid-1980s led to famine in some rural provinces and made rice imports nec-essary, despite a lack of foreign-exchange reserves and a decline in externalassistance. Estimates of national poverty at that time indicate a headcountindex of about 75 percent (Dollar and Litvack 1998), a statistic definingVietnam as one of the poorest countries in the world.
In this critical situation, the Sixth Congress of the Communist Party ofVietnam (CPV) approved in 1986 a comprehensive doi moi agenda. Doi moirecognized diversity to overcome the economic disaster facing the country.Reforms reintroduced private property without abolishing state property.Free-market exchange was allowed again, but sound macroeconomicmanagement was also proclaimed necessary for sustained economicgrowth. Continuing along these lines, the rationing system for many com-modities was abolished in 1987, and the formerly controlled prices of manycommodities were liberalized. Starting in 1988, individual land use rightswere granted. By 1990, nearly all commodity prices were determined by the
122 Klump
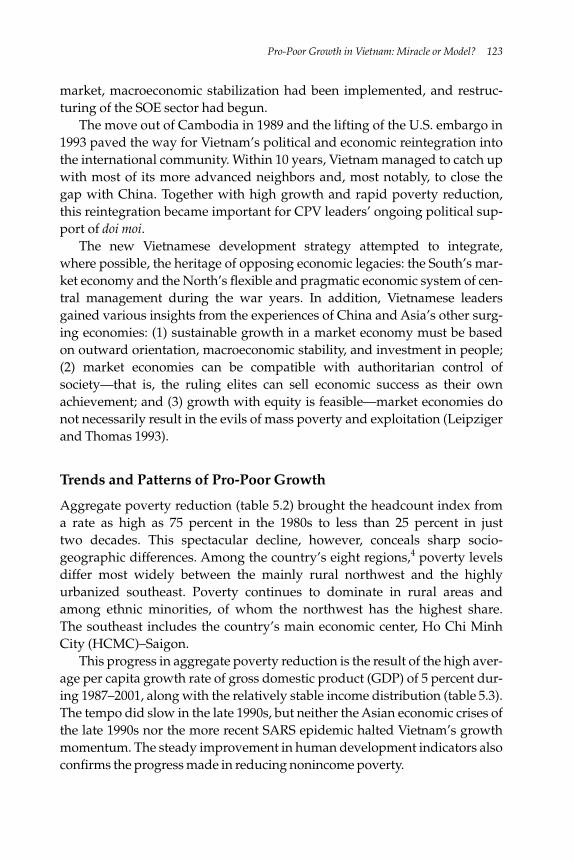
Pro-Poor Growth in Vietnam: Miracle or Model? 123
market, macroeconomic stabilization had been implemented, and restruc-turing of the SOE sector had begun.
The move out of Cambodia in 1989 and the lifting of the U.S. embargo in1993 paved the way for Vietnam’s political and economic reintegration intothe international community. Within 10 years, Vietnam managed to catch upwith most of its more advanced neighbors and, most notably, to close thegap with China. Together with high growth and rapid poverty reduction,this reintegration became important for CPV leaders’ ongoing political sup-port of doi moi.
The new Vietnamese development strategy attempted to integrate,where possible, the heritage of opposing economic legacies: the South’s mar-ket economy and the North’s flexible and pragmatic economic system of cen-tral management during the war years. In addition, Vietnamese leadersgained various insights from the experiences of China and Asia’s other surg-ing economies: (1) sustainable growth in a market economy must be basedon outward orientation, macroeconomic stability, and investment in people;(2) market economies can be compatible with authoritarian control ofsociety—that is, the ruling elites can sell economic success as their ownachievement; and (3) growth with equity is feasible—market economies donot necessarily result in the evils of mass poverty and exploitation (Leipzigerand Thomas 1993).
Trends and Patterns of Pro-Poor Growth
Aggregate poverty reduction (table 5.2) brought the headcount index froma rate as high as 75 percent in the 1980s to less than 25 percent in justtwo decades. This spectacular decline, however, conceals sharp socio-geographic differences. Among the country’s eight regions,4 poverty levelsdiffer most widely between the mainly rural northwest and the highlyurbanized southeast. Poverty continues to dominate in rural areas andamong ethnic minorities, of whom the northwest has the highest share.The southeast includes the country’s main economic center, Ho Chi MinhCity (HCMC)–Saigon.
This progress in aggregate poverty reduction is the result of the high aver-age per capita growth rate of gross domestic product (GDP) of 5 percent dur-ing 1987–2001, along with the relatively stable income distribution (table 5.3).The tempo did slow in the late 1990s, but neither the Asian economic crises ofthe late 1990s nor the more recent SARS epidemic halted Vietnam’s growthmomentum. The steady improvement in human development indicators alsoconfirms the progress made in reducing nonincome poverty.
124 Klump
Table 5.2 Dimensions of Poverty in Vietnam, 1993–2004
Poverty rates (headcount index, %) 1993 1998 2002 2004
National poverty rate 58.1 37.4 28.9 24.1
Regional dimensionNortheast 86.1 65.2 38.0 31.7
Northwest 81.0 73.4 68.7 54.4
Red River Delta 62.7 34.2 22.6 21.1
North Central Coast 74.5 52.3 44.4 41.4
South Central Coast 47.2 41.8 25.2 21.3
Central Highlands 70.0 52.4 51.8 32.7
Southeast 37.0 13.1 10.7 6.7
Mekong River Delta 47.1 41.9 23.2 19.5
Spatial dimensionUrban areas 25.1 9.2 6.6 10.8
Rural areas 66.4 45.5 35.6 27.5
Ethnic dimensionKinh and Chinese 53.9 31.1 23.1 n.a.
Ethnic minorities 86.4 75.2 69.3 n.a.Source: Socialist Republic of Vietnam 2005.n.a. � not available.
Table 5.3 Indicators of Growth and Inequality in Vietnam during the 1990s
Indicators of growthand development 1987–91 1992–97 1998–2001
GDP per capita growth (percent) 3.15 6.87 4.54
HDI (value) 0.603 (1990) 0.646 (1995) 0.688 (2000)
Income-based Ginicoefficients (GSO) 0.35 (1994) 0.39 (1999) 0.42 (2002)
Expenditure-based Ginicoefficients (WB/GSO) 0.34 (1993) 0.35 (1998) 0.37 (2002)
Ratio of richest/poorestexpenditure quintile (WB/GSO) 4.97 (1993) 5.49 (1998) 6.03 (2002)
Sources: GSO 2003, World Bank Pro-Poor Growth Database, World Bank 2003, and UNDP 2001.Note: HDI � Human Development Index.
As the growth incidence curve (figure 5.1) for 1993–2002 shows, all per-centiles experienced expenditure growth. As a result of slightly increasingaggregate inequality, the national rate of growth for percentiles belowthe poverty line—as pro-poor growth is defined—over the two decades was
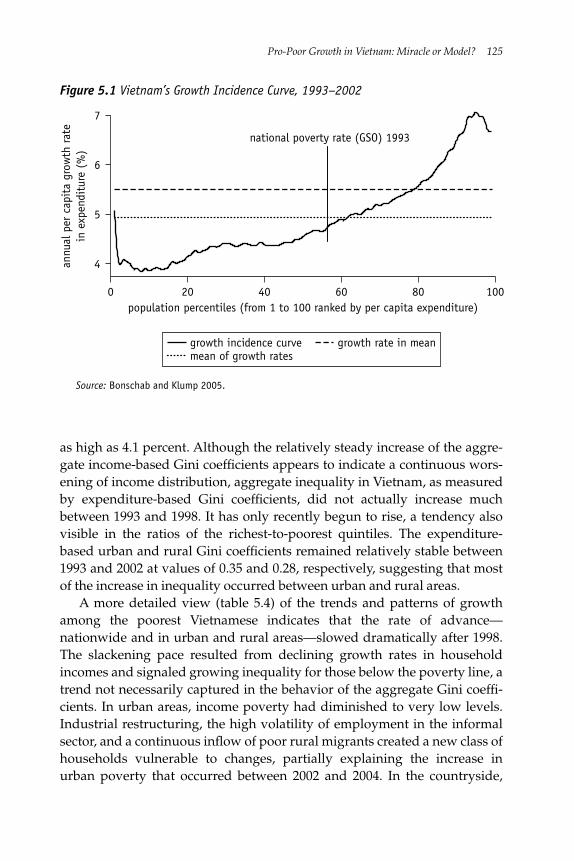
Pro-Poor Growth in Vietnam: Miracle or Model? 125
Figure 5.1 Vietnam’s Growth Incidence Curve, 1993–2002
as high as 4.1 percent. Although the relatively steady increase of the aggre-gate income-based Gini coefficients appears to indicate a continuous wors-ening of income distribution, aggregate inequality in Vietnam, as measuredby expenditure-based Gini coefficients, did not actually increase muchbetween 1993 and 1998. It has only recently begun to rise, a tendency alsovisible in the ratios of the richest-to-poorest quintiles. The expenditure-based urban and rural Gini coefficients remained relatively stable between1993 and 2002 at values of 0.35 and 0.28, respectively, suggesting that mostof the increase in inequality occurred between urban and rural areas.
A more detailed view (table 5.4) of the trends and patterns of growthamong the poorest Vietnamese indicates that the rate of advance—nationwide and in urban and rural areas—slowed dramatically after 1998.The slackening pace resulted from declining growth rates in householdincomes and signaled growing inequality for those below the poverty line, atrend not necessarily captured in the behavior of the aggregate Gini coeffi-cients. In urban areas, income poverty had diminished to very low levels.Industrial restructuring, the high volatility of employment in the informalsector, and a continuous inflow of poor rural migrants created a new class ofhouseholds vulnerable to changes, partially explaining the increase inurban poverty that occurred between 2002 and 2004. In the countryside,
Source: Bonschab and Klump 2005.
4
6
5
7
annu
al p
er c
apit
a gr
owth
rat
ein
exp
endi
ture
(%
)
0 20 40 60population percentiles (from 1 to 100 ranked by per capita expenditure)
10080
growth incidence curve growth rate in meanmean of growth rates
national poverty rate (GSO) 1993
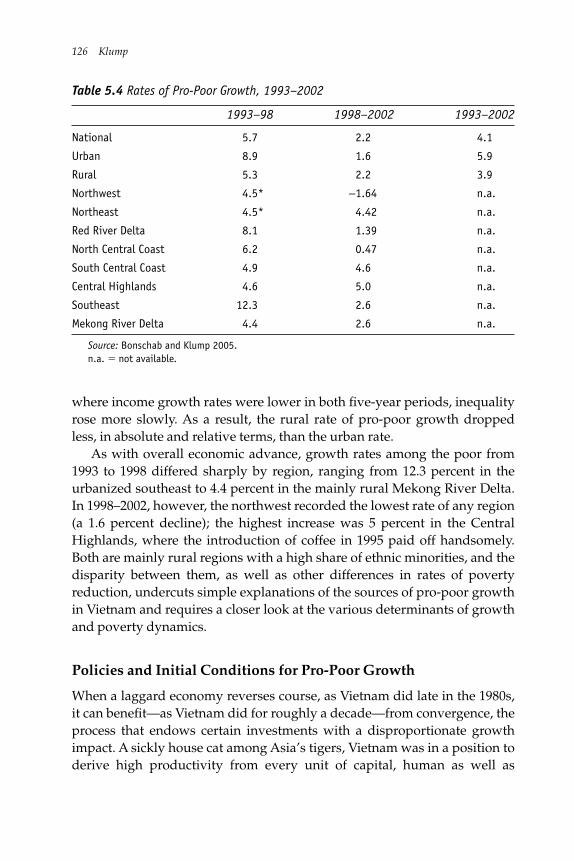
126 Klump
Table 5.4 Rates of Pro-Poor Growth, 1993–2002
1993–98 1998–2002 1993–2002
National 5.7 2.2 4.1
Urban 8.9 1.6 5.9
Rural 5.3 2.2 3.9
Northwest 4.5* −1.64 n.a.
Northeast 4.5* 4.42 n.a.
Red River Delta 8.1 1.39 n.a.
North Central Coast 6.2 0.47 n.a.
South Central Coast 4.9 4.6 n.a.
Central Highlands 4.6 5.0 n.a.
Southeast 12.3 2.6 n.a.
Mekong River Delta 4.4 2.6 n.a.
Source: Bonschab and Klump 2005.n.a. � not available.
where income growth rates were lower in both five-year periods, inequalityrose more slowly. As a result, the rural rate of pro-poor growth droppedless, in absolute and relative terms, than the urban rate.
As with overall economic advance, growth rates among the poor from1993 to 1998 differed sharply by region, ranging from 12.3 percent in theurbanized southeast to 4.4 percent in the mainly rural Mekong River Delta.In 1998–2002, however, the northwest recorded the lowest rate of any region(a 1.6 percent decline); the highest increase was 5 percent in the CentralHighlands, where the introduction of coffee in 1995 paid off handsomely.Both are mainly rural regions with a high share of ethnic minorities, and thedisparity between them, as well as other differences in rates of povertyreduction, undercuts simple explanations of the sources of pro-poor growthin Vietnam and requires a closer look at the various determinants of growthand poverty dynamics.
Policies and Initial Conditions for Pro-Poor Growth
When a laggard economy reverses course, as Vietnam did late in the 1980s,it can benefit—as Vietnam did for roughly a decade—from convergence, theprocess that endows certain investments with a disproportionate growthimpact. A sickly house cat among Asia’s tigers, Vietnam was in a position toderive high productivity from every unit of capital, human as well as
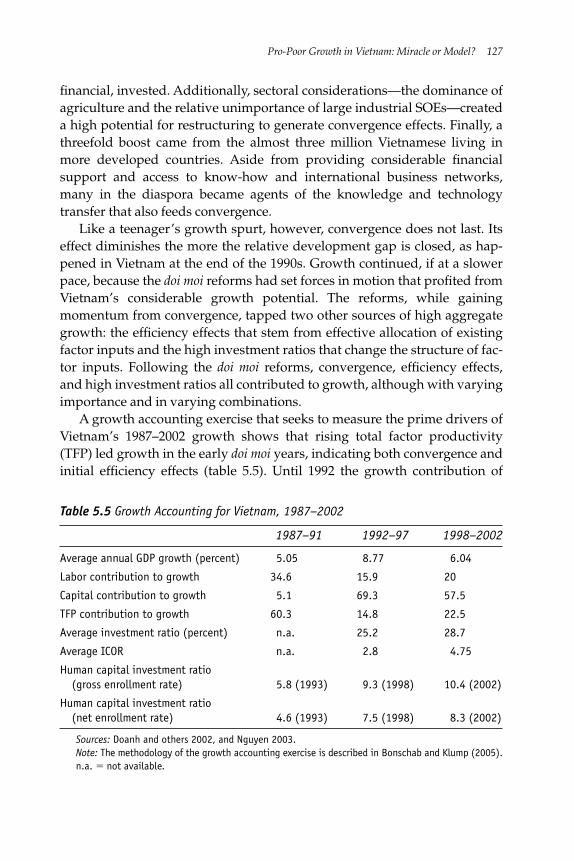
financial, invested. Additionally, sectoral considerations—the dominance ofagriculture and the relative unimportance of large industrial SOEs—createda high potential for restructuring to generate convergence effects. Finally, athreefold boost came from the almost three million Vietnamese living inmore developed countries. Aside from providing considerable financialsupport and access to know-how and international business networks,many in the diaspora became agents of the knowledge and technologytransfer that also feeds convergence.
Like a teenager’s growth spurt, however, convergence does not last. Itseffect diminishes the more the relative development gap is closed, as hap-pened in Vietnam at the end of the 1990s. Growth continued, if at a slowerpace, because the doi moi reforms had set forces in motion that profited fromVietnam’s considerable growth potential. The reforms, while gainingmomentum from convergence, tapped two other sources of high aggregategrowth: the efficiency effects that stem from effective allocation of existingfactor inputs and the high investment ratios that change the structure of fac-tor inputs. Following the doi moi reforms, convergence, efficiency effects,and high investment ratios all contributed to growth, although with varyingimportance and in varying combinations.
A growth accounting exercise that seeks to measure the prime drivers ofVietnam’s 1987–2002 growth shows that rising total factor productivity(TFP) led growth in the early doi moi years, indicating both convergence andinitial efficiency effects (table 5.5). Until 1992 the growth contribution of
Pro-Poor Growth in Vietnam: Miracle or Model? 127
Table 5.5 Growth Accounting for Vietnam, 1987–2002
1987–91 1992–97 1998–2002
Average annual GDP growth (percent) 5.05 8.77 6.04
Labor contribution to growth 34.6 15.9 20
Capital contribution to growth 5.1 69.3 57.5
TFP contribution to growth 60.3 14.8 22.5
Average investment ratio (percent) n.a. 25.2 28.7
Average ICOR n.a. 2.8 4.75
Human capital investment ratio(gross enrollment rate) 5.8 (1993) 9.3 (1998) 10.4 (2002)
Human capital investment ratio(net enrollment rate) 4.6 (1993) 7.5 (1998) 8.3 (2002)
Sources: Doanh and others 2002, and Nguyen 2003.Note: The methodology of the growth accounting exercise is described in Bonschab and Klump (2005).n.a. � not available.
labor is still higher than that of capital, but that relationship more thanreverses in the five years before the Asian crisis, and TFP’s contribution alsodrops sharply after 1992. This development reflects both the weakening ofthe convergence effect and growing investment ratios. The third phase(1998–2002) looks rather similar: growth contributions of capital and labortogether account for almost 80 percent of the economic momentum and TFPfor only about one-fifth. The increased investment ratio during this phasewas not sufficiently strong to prevent a slowdown in growth rates and,consequently, a sharp increase in the incremental capita-output ratio. Thefinal five-year period is also marked by an increased labor contribution tooverall growth, resulting largely to the growing importance of Vietnam’sskilled workforce.
Combining Factor Inputs to Shrink Poverty
The strategy that produced strong economic gains nationwide, significantlyraising the incomes of the poor, included an effort to change the rural eco-nomic landscape. The 1990s produced a strong rural rate of pro-poorgrowth (3.9 percent). The rural poverty headcount dropped from 66.4 per-cent in the early years of the decade to 27.5 percent 10 years later, an annualrate of reduction of more than 4 percent. Poverty reduction was thus accom-plished in those areas where the vast majority of poor Vietnamese live.
Vietnam mobilized both unskilled labor and farmland for vigorous pro-poor growth. Labor and land went naturally together, because throughoutthe 1990s more than 50 percent of the poor lived in rural areas anddepended primarily on employment in agriculture. Estimates of the exactshare of agricultural employment in total employment range between50 percent and 60 percent (Glewwe, Gragnolati, and Zaman 2002).
Decollectivization of farmland was a pivotal step in the movementtoward a market economy involving poverty-reducing growth. In 1988 landuse rights were granted to individual households. Ravallion and van deWalle (2001) show that the land distribution proceeded in a remarkablyegalitarian way. The 1993 Land Law instituted issuance of land use certifi-cates to all rural households, enabling them to inherit, transfer, exchange,lease, and mortgage their rights. By 2000, nearly 11 million land titles hadbeen issued, making Vietnam’s one of the largest and swiftest titling pro-grams in the developing world. The improvement of land-related propertyrights had strongly pro-poor effects, because it contributed to a higherdiversification of rural incomes. Estimates by Do and Iyer (2003) show thatin provinces where land use rights were most widely and effectively
128 Klump
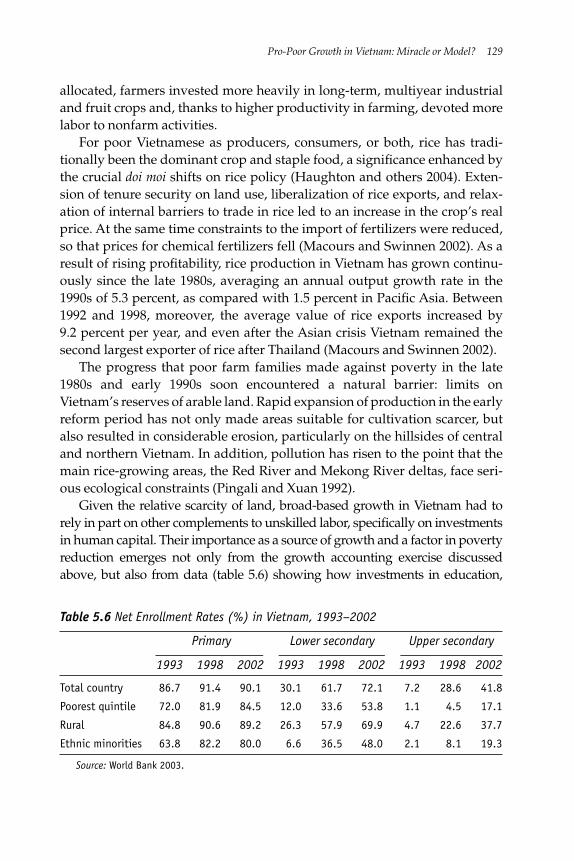
allocated, farmers invested more heavily in long-term, multiyear industrialand fruit crops and, thanks to higher productivity in farming, devoted morelabor to nonfarm activities.
For poor Vietnamese as producers, consumers, or both, rice has tradi-tionally been the dominant crop and staple food, a significance enhanced bythe crucial doi moi shifts on rice policy (Haughton and others 2004). Exten-sion of tenure security on land use, liberalization of rice exports, and relax-ation of internal barriers to trade in rice led to an increase in the crop’s realprice. At the same time constraints to the import of fertilizers were reduced,so that prices for chemical fertilizers fell (Macours and Swinnen 2002). As aresult of rising profitability, rice production in Vietnam has grown continu-ously since the late 1980s, averaging an annual output growth rate in the1990s of 5.3 percent, as compared with 1.5 percent in Pacific Asia. Between1992 and 1998, moreover, the average value of rice exports increased by9.2 percent per year, and even after the Asian crisis Vietnam remained thesecond largest exporter of rice after Thailand (Macours and Swinnen 2002).
The progress that poor farm families made against poverty in the late1980s and early 1990s soon encountered a natural barrier: limits onVietnam’s reserves of arable land. Rapid expansion of production in the earlyreform period has not only made areas suitable for cultivation scarcer, butalso resulted in considerable erosion, particularly on the hillsides of centraland northern Vietnam. In addition, pollution has risen to the point that themain rice-growing areas, the Red River and Mekong River deltas, face seri-ous ecological constraints (Pingali and Xuan 1992).
Given the relative scarcity of land, broad-based growth in Vietnam had torely in part on other complements to unskilled labor, specifically on investmentsin human capital. Their importance as a source of growth and a factor in povertyreduction emerges not only from the growth accounting exercise discussedabove, but also from data (table 5.6) showing how investments in education,
Pro-Poor Growth in Vietnam: Miracle or Model? 129
Table 5.6 Net Enrollment Rates (%) in Vietnam, 1993–2002
Primary Lower secondary Upper secondary
1993 1998 2002 1993 1998 2002 1993 1998 2002
Total country 86.7 91.4 90.1 30.1 61.7 72.1 7.2 28.6 41.8
Poorest quintile 72.0 81.9 84.5 12.0 33.6 53.8 1.1 4.5 17.1
Rural 84.8 90.6 89.2 26.3 57.9 69.9 4.7 22.6 37.7
Ethnic minorities 63.8 82.2 80.0 6.6 36.5 48.0 2.1 8.1 19.3
Source: World Bank 2003.
having aided growth, also paid high dividends for the poor. Vietnam inheritedfrom the socialist era a high literacy rate by international standards. But in thelowest quintile, in which more than 70 percent of adults can read, illiteracy per-sisted as the more affluent were better positioned to exploit new opportunitiesfor education. At the tertiary level, for example, very few students come fromthe poorest households, whereas enrollment of the upper quintiles increased(Bhushan and others 2001). Net enrollment rates at different levels of the schoolsystem, high by international standards, have steadily increased since the early1990s as growing wealth appears to have fueled demand for education (Glewweand Jacoby 2004).
Among the poor, who started from far behind, the advances in educationduring the 1990s are striking. Even though illiteracy actually increasedamong poor women, the poorest as a whole recorded a fourfold gain inlower-secondary school enrollment levels from 1993 to 2002. For ruralVietnamese the same levels rose about two and a half times and for ethnicminorities soared from 6.6 percent to 48 percent. Of course, the gains are rel-ative. Enrollment rates of the poorest quintile and of ethnic minoritiesstarted from such low values that even with high growth rates they have notreached the national average.
Alongside education, health has a powerful impact on the human capitalof the labor supply. One important component of Vietnam’s growth andpoverty reduction strategy was the decision to improve public health, anarea in which Vietnam generally performs better than other countries at asimilar development level.
From a poverty reduction standpoint, the most important early healthcare intervention was a family planning campaign that helped to decreasepopulation growth from a yearly average of 2.2 percent in the early 1980sto 1.5 percent in the late 1990s. Along with increased mobility and thehigher opportunity costs of having children as economic reforms tookhold, introduction of family planning measures brought a significant slow-down of fertility (White, Djamba, and Anh 2001). In 1988 the Vietnamesegovernment officially proclaimed the “two-child policy” and adopted acomprehensive family planning program (FPP), which financed special-ized health centers at the commune or district level. Total public expendi-ture for the FPP, as a percentage of total public health costs, increased from3.5 percent in 1992 to 10.2 percent in 1999. Despite these investments, largediscrepancies in the health status of rich and poor are already noticeable;the most striking differences appear in the health condition of children(Wagstaff and Nguyen 2004).
Capital formation has thus far had the smallest impact on pro-poorgrowth. As table 5.7 shows, gross investment ratios in Vietnam doubled
130 Klump
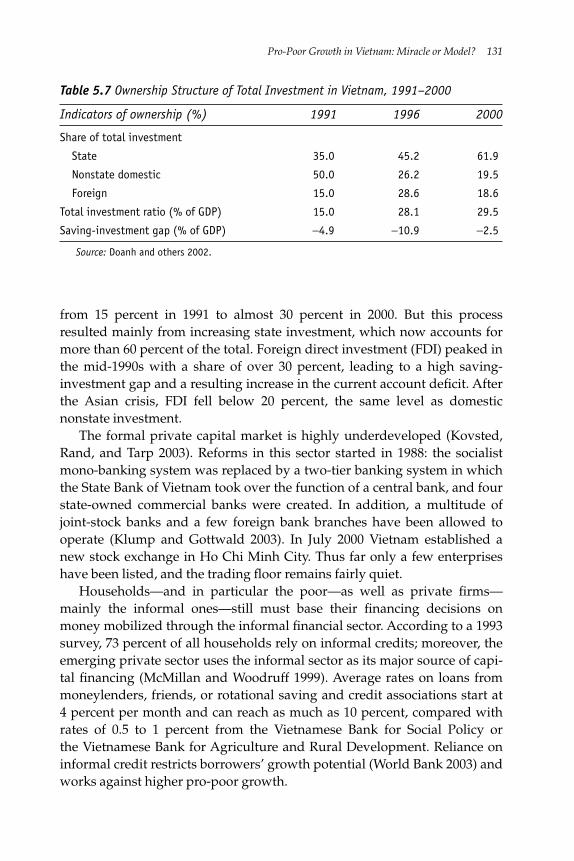
from 15 percent in 1991 to almost 30 percent in 2000. But this processresulted mainly from increasing state investment, which now accounts formore than 60 percent of the total. Foreign direct investment (FDI) peaked inthe mid-1990s with a share of over 30 percent, leading to a high saving-investment gap and a resulting increase in the current account deficit. Afterthe Asian crisis, FDI fell below 20 percent, the same level as domesticnonstate investment.
The formal private capital market is highly underdeveloped (Kovsted,Rand, and Tarp 2003). Reforms in this sector started in 1988: the socialistmono-banking system was replaced by a two-tier banking system in whichthe State Bank of Vietnam took over the function of a central bank, and fourstate-owned commercial banks were created. In addition, a multitude ofjoint-stock banks and a few foreign bank branches have been allowed tooperate (Klump and Gottwald 2003). In July 2000 Vietnam established anew stock exchange in Ho Chi Minh City. Thus far only a few enterpriseshave been listed, and the trading floor remains fairly quiet.
Households—and in particular the poor—as well as private firms—mainly the informal ones—still must base their financing decisions onmoney mobilized through the informal financial sector. According to a 1993survey, 73 percent of all households rely on informal credits; moreover, theemerging private sector uses the informal sector as its major source of capi-tal financing (McMillan and Woodruff 1999). Average rates on loans frommoneylenders, friends, or rotational saving and credit associations start at4 percent per month and can reach as much as 10 percent, compared withrates of 0.5 to 1 percent from the Vietnamese Bank for Social Policy orthe Vietnamese Bank for Agriculture and Rural Development. Reliance oninformal credit restricts borrowers’ growth potential (World Bank 2003) andworks against higher pro-poor growth.
Pro-Poor Growth in Vietnam: Miracle or Model? 131
Table 5.7 Ownership Structure of Total Investment in Vietnam, 1991–2000
Indicators of ownership (%) 1991 1996 2000
Share of total investment
State 35.0 45.2 61.9
Nonstate domestic 50.0 26.2 19.5
Foreign 15.0 28.6 18.6
Total investment ratio (% of GDP) 15.0 28.1 29.5
Saving-investment gap (% of GDP) −4.9 −10.9 −2.5
Source: Doanh and others 2002.
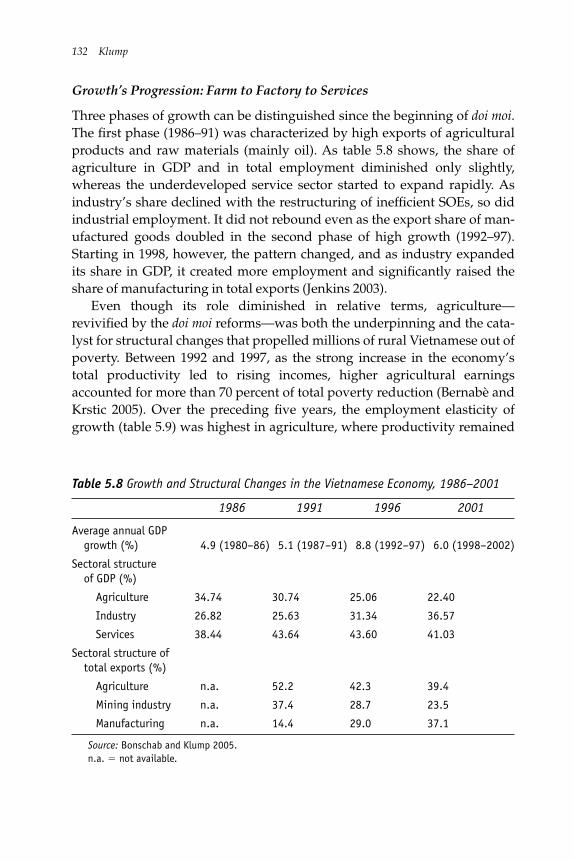
Growth’s Progression: Farm to Factory to Services
Three phases of growth can be distinguished since the beginning of doi moi.The first phase (1986–91) was characterized by high exports of agriculturalproducts and raw materials (mainly oil). As table 5.8 shows, the share ofagriculture in GDP and in total employment diminished only slightly,whereas the underdeveloped service sector started to expand rapidly. Asindustry’s share declined with the restructuring of inefficient SOEs, so didindustrial employment. It did not rebound even as the export share of man-ufactured goods doubled in the second phase of high growth (1992–97).Starting in 1998, however, the pattern changed, and as industry expandedits share in GDP, it created more employment and significantly raised theshare of manufacturing in total exports (Jenkins 2003).
Even though its role diminished in relative terms, agriculture—revivified by the doi moi reforms—was both the underpinning and the cata-lyst for structural changes that propelled millions of rural Vietnamese out ofpoverty. Between 1992 and 1997, as the strong increase in the economy’stotal productivity led to rising incomes, higher agricultural earningsaccounted for more than 70 percent of total poverty reduction (Bernabè andKrstic 2005). Over the preceding five years, the employment elasticity ofgrowth (table 5.9) was highest in agriculture, where productivity remained
132 Klump
Table 5.8 Growth and Structural Changes in the Vietnamese Economy, 1986–2001
1986 1991 1996 2001
Average annual GDPgrowth (%) 4.9 (1980–86) 5.1 (1987–91) 8.8 (1992–97) 6.0 (1998–2002)
Sectoral structureof GDP (%)
Agriculture 34.74 30.74 25.06 22.40
Industry 26.82 25.63 31.34 36.57
Services 38.44 43.64 43.60 41.03
Sectoral structure oftotal exports (%)
Agriculture n.a. 52.2 42.3 39.4
Mining industry n.a. 37.4 28.7 23.5
Manufacturing n.a. 14.4 29.0 37.1
Source: Bonschab and Klump 2005.n.a. � not available.
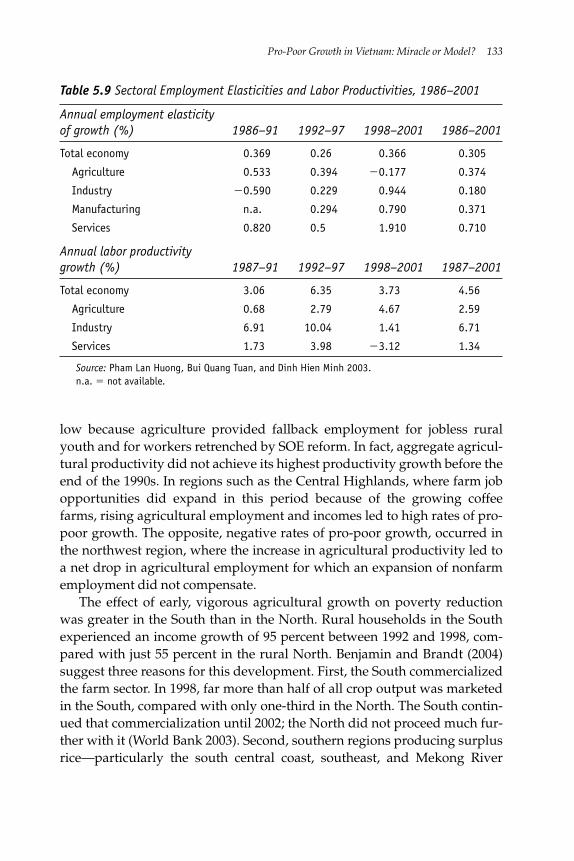
low because agriculture provided fallback employment for jobless ruralyouth and for workers retrenched by SOE reform. In fact, aggregate agricul-tural productivity did not achieve its highest productivity growth before theend of the 1990s. In regions such as the Central Highlands, where farm jobopportunities did expand in this period because of the growing coffeefarms, rising agricultural employment and incomes led to high rates of pro-poor growth. The opposite, negative rates of pro-poor growth, occurred inthe northwest region, where the increase in agricultural productivity led toa net drop in agricultural employment for which an expansion of nonfarmemployment did not compensate.
The effect of early, vigorous agricultural growth on poverty reductionwas greater in the South than in the North. Rural households in the Southexperienced an income growth of 95 percent between 1992 and 1998, com-pared with just 55 percent in the rural North. Benjamin and Brandt (2004)suggest three reasons for this development. First, the South commercializedthe farm sector. In 1998, far more than half of all crop output was marketedin the South, compared with only one-third in the North. The South contin-ued that commercialization until 2002; the North did not proceed much fur-ther with it (World Bank 2003). Second, southern regions producing surplusrice—particularly the south central coast, southeast, and Mekong River
Pro-Poor Growth in Vietnam: Miracle or Model? 133
Table 5.9 Sectoral Employment Elasticities and Labor Productivities, 1986–2001
Annual employment elasticityof growth (%) 1986–91 1992–97 1998–2001 1986–2001
Total economy 0.369 0.26 0.366 0.305
Agriculture 0.533 0.394 �0.177 0.374
Industry �0.590 0.229 0.944 0.180
Manufacturing n.a. 0.294 0.790 0.371
Services 0.820 0.5 1.910 0.710
Annual labor productivitygrowth (%) 1987–91 1992–97 1998–2001 1987–2001
Total economy 3.06 6.35 3.73 4.56
Agriculture 0.68 2.79 4.67 2.59
Industry 6.91 10.04 1.41 6.71
Services 1.73 3.98 �3.12 1.34
Source: Pham Lan Huong, Bui Quang Tuan, and Dinh Hien Minh 2003.n.a. � not available.
Delta—tend to benefit from higher prices while rice-deficit regions lose.Third, higher rice prices had ambiguous effects on the poor: they raisedincome for producers while increasing the cost of the main food consumedby the poor. Net benefits were higher for the many households in the Souththat specialized in rice growing.
Even after many years of reform efforts, SOEs play an important rolein Vietnam’s industrial development. Restructuring of the more than12,000 SOEs existing in 1991 sought to make these enterprises more efficientand competitive and, through mergers or liquidation, nearly halved theirnumber to roughly 6,000 by mid-1994. Ten years later the total was roughly4,700 (CIEM 2004). Especially in the early years, the downsizing of the pub-lic sector led to massive layoffs; by 1992 almost one-third of the 1988 SOElabor force, some 800,000 workers, had lost their jobs (Dollar and Litvack1998). A distinct gender bias characterized these early layoffs: about 70 per-cent of the redundancies hit the female working population (Rama 2002).However, this gender disparity diminished over time, and further downsiz-ing of SOEs is unlikely to hit women harder than men. In fact, female workersalready dominate the sectors in which Vietnam’s SOEs are comparativelycompetitive and receive the highest wages, such as footwear, leather, textile,and garments.
Industrial productivity increases brought only moderate job growth,because important subsectors were capital intensive, state owned, or importsubstituting. After the Asian crisis, private sector development began toincrease employment in industry and services; the latter sector—thoughstill small—absorbed some of the retrenched SOE workers. A massiveincrease in the informalization of employment in both industry and servicescontributed to high aggregate rates of pro-poor growth in the 1990s(Bernabè and Krstic 2005). In rural areas, nonfarm, informal wage employ-ment created a safety net for both agricultural and former SOE workers. In1998 almost 90 percent of manufacturing employment, supported by strongexternal demand for Vietnamese manufactured products, was informal. Butgrowing wage differentials between informal and formal sectors led to arise in inequality.
The most recent phase of growth has been marked by a dynamic privateformal sector. After the first enterprise law was passed in 1991, new firmssteadily appeared, at a rate of around 5,600 registrations per year. Signifi-cantly amended in 2000, a new enterprise law simplified registrationprocesses and licensing rules. The result was striking; average yearlyregistrations tripled to nearly 19,000 between 2000 and 2002, an increase thatled to a shift in the employment structure (Klump 2003). Private domestic
134 Klump
firms created only 4 to 5 percent of jobs from 1995 to 1999 but 15 to 30 per-cent from 1999 to 2001. This growth appears to have shifted job creationaway from household enterprises but to have little affected overall labormarkets. Employment in private domestic enterprises currently amounts toonly 2.8 percent of the total, and jobs are concentrated in a few industriesand services, such as trade and retail. With productivity growth limited bylow capital investment, the domestic private nonfarm sector has yet tobecome a major force for broad-based growth.
Regional Growth Poles and Migration
Industrial growth and private sector development in Vietnam have bene-fited from policy measures encouraging concentration of economic enter-prise in three areas that serve as regional growth poles. The areas aroundHanoi, Da Nang, and Ho Chi Minh City5 have become central to Vietnam’srecent development successes. Their share in GDP rose from 42.5 percent in1990 to 46.6 percent in 1995 and 54 percent in 2002. Responsible for 60 per-cent of GDP growth in that year, they contributed 72 and 59 percent, respec-tively, to the growth of industrial production and the service sector.Moreover, 88.5 percent of domestic investment and 96 percent of FDI isconcentrated in the three areas, which are also responsible for 80 percentof Vietnam’s exports and 67 percent of its state income (Doanh 2004). Thesouthern pole is responsible for the lion’s share (33 percent) of GDP; thenorthern pole claims 23 percent and the central pole only 2.5 percent of totalGDP. The government plans to increase these shares to 35 percent, 23.5 per-cent, and 4.6 percent, respectively, by 2010, which would mean almost adoubling of the importance of the central pole.
Hanoi and Ho Chi Minh City are natural candidates for growth magnets;they make up 25 percent of the wage labor market and allow for a wage pre-mium of up to 80 percent over rural areas (Gallup 2004). But their role,along with that of Da Nang (historically one of Vietnam’s most importantports), has been magnified by several directives issued since 1997. Thesedirectives call for the three growth poles to produce above-average eco-nomic growth and lead the entire economy in the processes of industrializa-tion and modernization. In the northern zone the government invested inhigh-tech industrial parks around Hanoi’s Noi Bai Airport and in modern-ization of the deepwater port of Cai Lan. In the poorer provinces of the cen-tral coast, the government expanded industrial development. In the centralzone the government decided to establish Vietnam’s only oil refinery inDung Quat, south of Da Nang, at a yearly cost of some $130 million, and to
Pro-Poor Growth in Vietnam: Miracle or Model? 135
upgrade and enlarge the road infrastructure, for which $250 million was setaside to build the longest road tunnel in Southeast Asia for Highway 1through the Hai Van Pass, which separates the provinces of Da Nang andHue (the city of Hue was capital of the Vietnamese empire for more than acentury). Opened in 2006, the tunnel improves links between the coast andthe hinterland and could make Da Nang the best natural port for Laos,northern Cambodia, northern Thailand, and even Myanmar.
The pace of poverty reduction provides one encouraging measure of thereturn on these public and private investments. The south central coastregion around Da Nang recorded an average rate of pro-poor growth of4.6 percent in the late 1990s. This rate was even higher than the regionalgrowth rate of mean income (3.5 percent) in that period and higher than therates of pro-poor growth on the national level (2.2 percent), in the Red RiverDelta (1.4 percent), and in the southeast (2.6 percent).
The power of the regional growth magnets, however, is proving limited.The magnets’ growth does not appear to spread easily to poor rural areas inthe form of significant investment flows that could capitalize on the differ-ences in effective relative returns to capital.6 The major obstacle to suchdevelopment is the lack of infrastructure, including roads and telecommu-nication, and the underdevelopment of financial and other business-relatedservices in poorer provinces. Informal finance alone has been unable tochannel additional capital to poor areas. Moreover, differences in the waypublic administrations in rural provinces implemented the Land Law after1993 and the new Enterprise Law since 2000 are pronounced (Malesky2002). Finally, public investment in education increasingly differs fromprovince to province. Provinces that handled the registration procedures forland titles or new firms most efficiently and that invested in their humancapital—for example, through education—more easily attracted additionalcapital.
A strong, steady flow of internal migration is the main link between thethree growth poles and the high-poverty rural areas. According to data col-lected by the 1999 Population and Housing Census (CCSC 2000), 4.5 millionpeople—6.5 percent of the total 1999 population aged five years and older—moved residence between 1994 and 1999. The true numbers would presum-ably be much higher if nonregistered and temporary migrants had beentaken into account.
Most migration in the 1990s was spontaneous, and some of it was madeeasier by reforms that enabled households to sell farmland and buy urbanproperty. The movement came in response to gaps in employment opportu-nities and income levels; the majority of internal migrants were the young
136 Klump
and the more highly educated. More than half (52 percent) of all migrantswere under 25, and only 10.5 percent were older than 45, compared with 48percent and 20 percent, respectively, for the nonmigrant population. Notsurprisingly, ethnic minorities tend to migrate less and account for only 4percent of all the recorded movement. The overwhelming majority, around60 percent of the migrants, start to work in the private sector.
Migration generally helps widen preexisting spatial growth gaps by fun-neling cheap labor into the growth zones. But movement in the oppositedirection has also occurred: the coffee boom of the late 1990s drew manymigrants to Vietnam’s rural Central Highlands region (Hardy 2003) andgenerated the highest regional rates of pro-poor growth in those years.
The tide of migrants has created new faces of poverty in urban areas.HCMC and Hanoi have been swamped by the large flow of migrants forwhom the cities have been unable to provide sufficient infrastructure andother services (ILO, UNDP, and UNFPA 2003; World Bank 2003). Local gov-ernments’ efforts to discourage additional migration by denying permanentregistration or imposing other administrative barriers have encouragedmore and more migrants to live and work in the informal sector where theynot only are confined to unskilled, low-paid, and low-security jobs, but alsoare ineligible for public services and exemption from school fees, and lackaccess to housing with water and sanitation infrastructure (Anh, Tacoli, andThanh; Oxfam 2003).
Nevertheless, strong positive effects on poverty reduction in poor ruralareas stem from the remittances. Survey data for 1998 reveal that those pay-ments constituted 60 to 70 percent of the total cash income of rural house-holds (IOS 1998). Remittances often serve as the most important source ofpoor rural families’ cash income and significantly reduce such families’ vul-nerability. The funds are usually used for consumption, like buying basicfood, rather than for investment. From this perspective the flow of remit-tances can be understood as a highly pro-poor redistribution mechanismthat builds on Vietnam’s strong family ties and migrants’ acceptance ofhardships in crowded cities in return for improving the well-being of thoseleft in rural villages (Oxfam 2003).
Remittances from abroad provide no such compensating balance. Countingonly money moved through official channels, remittances from the roughlythree million Vietnamese overseas—most of them in the United States, Canada,Australia, and France—increased from some $2.7 billion in 2002 and 2003 tobetween $3.2 billion and $3.5 billion in 2004, according to a forecast by the StateBank of Vietnam. Five percent of all Vietnamese households receive such remit-tances (Haughton 2004), but the great bulk of the funds flows into Vietnam’s
Pro-Poor Growth in Vietnam: Miracle or Model? 137
commercial centers—around 60 percent into HCMC alone—thus further con-tributing to the inequality between growth magnets and poor rural areas.
Macroeconomic and Administrative Reforms
Together with liberalization of markets and the reintroduction of privateproperty rights, recognition that Vietnam needed to put its macroeconomichouse in order was the foundation of the doi moi reforms. The comprehen-sive stabilization program adopted in 1989 included almost complete priceliberalization, devaluation of the Vietnamese dong, reduction of SOE subsi-dies, harder budget constraints, restructuring of the tax base, and financialsector reform. The results were immediate. The inflation rate dropped tosome 35 percent, and the growth rate climbed to 8 percent in the same year.Throughout the 1990s, inflation rates remained at 3.7 percent annually, andtoward the end of the decade, inflation more or less ceased to be a problem(Hung 1999). The devaluation restored Vietnam’s price competitiveness inworld markets. About one-half of the rice export boom in the early 1990scan be attributed to this particular effect (Macours and Swinnen 2002). Theoverall growth-enhancing effects of macroeconomic stabilization aided thepoor, but lower inflation rates, in particular, decreased the volatility of riceprices by one-fifth, reducing economic risks for producers and consumers(Goletti and Minot 2000).
In the late 1980s trade liberalization, which gained momentum after theend of the U.S. embargo in 1993, followed macroeconomic reforms to becomea cornerstone of export-led growth. Over the years Vietnam became a mem-ber of the Association of Southeast Asian Nations Free Trade Agreement, andAsia-Pacific Economic Cooperation and signed various bilateral trade agree-ments. The country is currently negotiating accession to the World TradeOrganization.
Vietnam’s controlled integration into world markets has had far-reachingeffects. First, it helped to increase the production not only of rice, but also ofnonrice crops and other agricultural products between 1993 and 1998(Niimi, Dutta, and Winters 2002). The largest production increases werethose of coffee (almost 200 percent), annual industrial crops, and fruit crops.The 1995 introduction of coffee, in particular, was a deliberate response to aboom in the world price of coffee and the realization that Vietnam had acomparative advantage as a grower. Coffee exports grew at an annual rate ofalmost 60 percent between 1993 and 1998. In those years, according to ananalysis of the dynamic effects of rice production and farm diversification(Litchfield and Justino 2002), rice-producing and coffee-growing rural
138 Klump
households had a higher probability of moving out of poverty and a lowerrisk of falling back than other rural households. Second, trade liberalizationsuccessfully supported sectoral restructuring from agriculture to manufac-turing (Jenkins 2003). Third, that liberalization is increasing returns, in par-ticular to investment in human capital (World Bank 2003) that will beessential for future growth. Finally, the emphasis on exporting has inducedcomprehensive public sector institutional reforms aimed at meeting variousregulations and standards of the international trading community.
Thorough administrative changes—in particular, efforts to decentralizethe state administration—have also proved key to the success of the doi moireforms. The public administration reform program (PAR), launched in1995, aims at transferring some administrative, fiscal, and political responsi-bilities to local authorities so as to facilitate local implementation of theambitious targets of Vietnam’s poverty reduction programs. In 2002 thegovernment introduced the Comprehensive Poverty Reduction and GrowthStrategy and stressed that it be “rolled out to the provinces” (World Bank2003).
Decentralization became a key element in Vietnam’s public sectorreform throughout the 1990s (Vasavakul 2002). Composed of fiscal, admin-istrative, and political measures (Fforde 2003; Fritzen 2002), the broad pol-icy change has emerged as Vietnam’s most important strategic weapon forovercoming bureaucratic barriers and overcentralization under highlydiverse natural, economic, and ethnic conditions. Fiscal decentralizationdeals with the reorganization of fiscal responsibilities and allows subna-tional levels to raise or share or to raise and share increasing amounts ofstate budget funds, whereas administrative decentralization involves thetransfer of responsibilities to lower administrative levels. Under the termsof political decentralization, legally constituted local governments such aspeople’s councils gain autonomous decision-making authority.
Fiscal decentralization is already comparatively advanced in Vietnam.Covering roughly 40 percent of all government expenditure and about55 percent of social sector outlays, the share of the economy controlled by thecentral government is not exceptionally high and is in line with other fairlydecentralized countries such as the United States (39 percent) and India (52percent). Provincial governments, which gained more fiscal autonomy andmore stable transfers from the central government under the 1996 BudgetLaw, acquired further power with the 2002 Budget Law. It extends provincialautonomy by (1) increasing the authority and jurisdiction of the NationalAssembly and people’s councils, (2) allowing provinces a greater say inthe allocation of budgets to districts and communes, (3) providing local
Pro-Poor Growth in Vietnam: Miracle or Model? 139
government incentives for balanced household budgets, (4) granting localgovernment units more discretionary power, and (5) calling for the localimplementation of PAR (Fforde 2003).
Targeted Aid to the Poor
Recognizing that even strong poverty-reducing growth cannot assist thepoorest citizens, Vietnam has long had policies to reach particular pocketsof destitution. Such pro-poor policies include the Public Investment Pro-gramme (PIP), the special National Program for Hunger Eradication andPoverty Reduction (HEPR), Program 135 for commune-level investments,and special programs for ethnic minorities administered by the Commis-sion for Ethnic Minorities and Mountain Areas (CEMMA).
The growth and poverty effects of Vietnam’s Public Investment Pro-gramme between 1996 and 2000—more than 200 large-scale investmentprojects with a cumulative value calculated at $7 billion—have been notablefor their added impact in Vietnam’s poorer provinces. According to esti-mates, spending an additional 1 percent of GDP in public investment hasbeen associated with a proportionate reduction in poverty on the order of0.5 percent. But Larsen, Lan, and Rama (2004) found that the poverty-reducing impact of $50 million in PIP investments in the poorest one-fourthof the provinces ran 2.5 times as high as the impact in the richest fourth.Given the higher returns of PIP programs among the poor, a reallocation ofpublic investment to the poorer provinces could help to reduce poverty.
Despite the provision of special funds for areas with a high share of eth-nic minorities, the poverty rate among most of them remains high. For some,the rate is growing. Standard growth strategies do not appear to meet theparticular needs of these groups of Vietnam’s poorest. Special funds thatCEMMA channels to minorities often do not reach the minorities but goinstead to Kinh households living in the same area. As van de Walle andGunewardena (2001) found, poor ethnic minorities and the Kinh majoritywork with fundamentally different models of income generation. If speciallydesigned programs fail to take these differences into account, their effective-ness will remain weak. The problem is particularly acute in the northwest,where rates of pro-poor growth were negative during the 1998–2002 period.
In 1998 the National Program for Hunger Eradication and PovertyReduction began to coordinate and integrate various social initiatives of thecentral government (MPI and MOLISA 2001). Some of these initiatives aretargeted to poor households directly; others are targeted to poor communes.Examples of the first kind are provision of “poor household certificates”
140 Klump
and “health insurance cards,” both of which entitle recipients to free med-ical treatment in public hospitals. Other programs within HEPR providepartial or full exemption from school fees or access to subsidized loans fromthe Bank of the Poor, since renamed the Social Policy Bank.
The education-fee exemption program within HEPR has a particularlyhigh coverage rate. It reaches almost one-seventh of all poor and one-fifth ofthe food-poor (World Bank 2003) and it has a statistically significant effecton school enrollment among the children of the beneficiaries. Communerepresentatives and village chiefs select the poor households, a highlydecentralized arrangement that leads to a high degree of participation andsocial control.
Also dating to 1998, Program 135 is a national socioeconomic develop-ment program to assist poor communes technically and financially, espe-cially in remote and mountainous areas. Its resources, used for irrigation,schools, construction of commune centers, and so on in settlements where15 percent of the country’s households live, reflect Vietnam’s efforts atdecentralization, particularly in rural public investment programs. Fundedon an annual basis with resources transferred directly to the communes anddistricts, Program 135 grants finance small-scale infrastructure investmentsin poor and remote communes. Although it seems to have achieved pro-nounced coverage among the poor, problems with participation and controlhave led to reports of misuse.
Despite efforts at better targeting and coordination, a recent analysis ofthe static and dynamic incidence of pro-poor spending in Vietnam comes toa sceptical conclusion (van de Walle 2004). Given that relative developmentlevels often dictate the availability of funds at the local level, social transfersdo too little to enable poorer areas to catch up. More is spent in relative andabsolute terms on the poor in the better-off communes. At the same time,the existing system of social transfers is ineffective in protecting householdsvulnerable to falling living standards. To make social transfers more effi-cient in reducing poverty would require not only better monitoring at thelocal level but also a higher level of risk pooling at the national level andredistribution through the central state budget.
Conclusion
Although it offers no simple model, Vietnam’s spectacular success inachieving pro-poor growth over the 1990s provides some important lessons.It demonstrates that a poor country can be lifted out of extreme povertywithin only two decades, if a strategy of internal and external liberalization
Pro-Poor Growth in Vietnam: Miracle or Model? 141
successfully exploits the enormous growth potential of a latecomer. It alsoshows that the transition from a socialist to a market economy need not nec-essarily lead to a severe drop in growth rates and an increase in poverty.Finally, it underlines that a long-term sustainable strategy of pro-poorgrowth has to be based on high investment in human capital and publicinfrastructure.
Behind the aggregate numbers, however, lies a high diversity of resultsthat recommends a considerable degree of caution to those who would tryto teach (or transfer) the Vietnamese experience to other countries. Vietnamhas taken advantage of its natural resources such as fertile soils in the twodelta regions and the cheap and highly flexible labor force. But so far,despite ambitious pro-poor policies, it has not effectively fought the highand persistent poverty among some of its ethnic minorities. Inequalitybetween the North and the South, between urban and rural areas, andbetween some particular growth poles and the rest of the country is alsorising. Because strong political support for a comprehensive pro-poorgrowth strategy has been so remarkable in Vietnam since the doi moireforms, widening gaps could, in the long run, put political obstacles in thepath of further growth.
Further development of the domestic private sector is the key to keepingVietnam on a pro-poor growth track. The private sector provides the mostpowerful potential for further employment creation, not only in the magnetzones but also in the poorer regions and provinces, which have thus far notbeen the main beneficiaries of Vietnam’s extraordinary growth perfor-mance. Enforcement of the new Enterprise Law in 2000 constitutes a crucialstep toward more private sector growth. In the years since the law’s enact-ment, the number of average annual firm registrations has nearly tripled,and already a small shift in the employment structure can be observed.However, compared with the private sectors of other transition countries,the private sector in Vietnam is young and vulnerable. It not only encoun-ters discrimination from local authorities and SOEs but also suffers fromhighly restricted access to sources of new capital.
Growth in the private sector could contribute to a more regionally bal-anced overall growth process and could work against the increasing gapbetween rural and urban income opportunities. New employment opportu-nities in small and medium-size enterprises emerging in rural areas couldalso serve to decrease the growing migration into large cities, where newfacets of poverty have developed. Stronger political efforts will be requiredto encourage private sector growth throughout the country. Public invest-ments in improved infrastructure and a cautious strategy of administrative
142 Klump
decentralization that lends impetus to local government reform alreadypoint the way toward a new emphasis on private enterprise as an agent ofsustained growth.
Notes
1. “Changing Gear,” Economist, November 26, 2005, 49.
2. This chapter builds on the study by Bonschab and Klump (2005), which waspart of the Operationalizing Pro-Poor Growth project.
3. See the conceptual framework for pro-poor growth analysis developed inBonschab and Klump (2005) and refined in Klump and Miralles (2006).
4. Administratively, Vietnam is divided into 64 provinces and cities in eightregions: northeast, northwest, Red River Delta (including the capital city Hanoi andone of the major port cities Hai Phong), north central coast, south central coast(including the other major port city Da Nang), Central Highlands, southeast (includ-ing the main economic center, Ho Chi Minh City–Saigon), and Mekong River Delta.
5. The regional growth poles include the provinces around Hanoi in the RedRiver Delta (the “triangle” formed by Hanoi, Haiphong, and Quang Ninh, as well asHung Yen, Hai Duong, Bac Ninh, Vinh Phuc, and Ha Tay), around Da Nang (ThuaThien Hue, Da Nang, Quang Nam, Quang Ngai), and around Ho Chi Minh City inthe southeast (the “quadrangle” consisting of HCMC, Binh Duong, Baria-Vung Tau,and Dong Nai).
6. See the results of a study of interprovincial income convergence in Vietnamduring the late 1990s by Klump and Nguyen Thi Tue Anh (2006).
References
Anh, D., C. Tacoli, and H. Thanh. 2003. “Migration in Vietnam: A Review of Informa-tion on Current Trends and Patterns and Their Policy Implications.” Intergovern-mental Panel on Forests, Hanoi, Vietnam.
Benjamin, D., and L. Brandt. 2004. “Agriculture and Income Distribution in RuralVietnam under Economic Reforms: A Tale of Two Regions” In Economic Growth,Poverty, and Household Welfare in Vietnam, ed. P. Glewwe, D. Dollar, and N.Agrawal, 133–85. Washington, DC: World Bank.
Bernabè, S., and G. Krstic. 2005. “Labor Productivity and Market Access Matter forPro-Poor Growth: The 1990s in Burkina Faso and Vietnam.” Working draft.
Bhushan, I., E. Bloom, Ngyuen Hai Huu, and Nguyen Minh Thang. 2001. “HumanCapital of the Poor in Vietnam.” Asian Development Bank, Manila, thePhilippines.
Bonschab, T., and R. Klump. 2005. “Operationalizing Pro-Poor Growth: CountryCase Study Vietnam.” Working paper, Deutsche Gesellschaft für TechnischeZusammenarbeit, Eschborn, Germany.
Pro-Poor Growth in Vietnam: Miracle or Model? 143
CCSC (Central Census Steering Committee). 2000. “Population and Housing CensusVietnam, 1999.” Sample Results. Hanoi, Vietnam.
CIEM (Central Institute for Economic Management). 2002. “Firm Level Survey.”CIEM, Hanoi, Vietnam.
_______. 2004. Vietnam’s Economy in 2003, A Reference Book. Hanoi, Vietnam: CIEM.
Do, Q. T., and L. Iyer. 2003. “Land Rights and Economic Development: Evidence fromVietnam.” Policy Research Working Paper 3120, World Bank, Washington, DC.
Doanh, L. 2004. “Vietnam auf dem Weg der Wirtschaftlichen Reform und der Inter-nationalen Integration.” Draft, Hanoi, Vietnam.
Doanh, L., V. Thanh, T. Pham, H. Dinh, and N. Thang. 2002. “Explaining Growthin Vietnam.” Global Development Network/Central Institute for EconomicManagement, Hanoi, Vietnam.
Dollar, D., and J. Litvack. 1998. “Vietnam’s Renovation: A Unique Growth Path.”World Bank, Washington, DC.
Fforde, Adam. 2003. “Decentralization in Vietnam: Working Effectively at Provincialand Local Government Level: A Comparative Analysis of Long An and QuangNgai Provinces.” Report prepared for the Australian Agency of InternationalDevelopment, Canberra, Australia.
Fritzen, S. 2002. “The ‘Foundation of Public Administration’: Decentralization andIts Discontents in Transitional Vietnam.” Paper presented at the Asia Conferenceon Governance in Asia, City University of Hong Kong.
Gallup, J. L. 2004. “The Wage Labor Market and Inequality in Vietnam in 1990s.” InEconomic Growth, Poverty, and Household Welfare in Vietnam, ed. P. Glewwe, D.Dollar, and N. Agrawal, 53–94. Washington, DC: World Bank.
GSO (General Statistical Office). 2003. Statistical Yearbook. Washington, DC: GSO.
Glewwe, P., M. Gragnolati, and H. Zaman. 2002. “Who Gained from Vietnam’sBoom in the 1990s.” Economic Development and Cultural Change 50 (2002): 773–92.
Glewwe, P., and H. G. Jacoby. 2004. “Economic Growth and the Demand for Educa-tion: Is There a Wealth Effect?” Journal of Development Economics 74 (1): 33–51.
Goletti, F., and N. Minot. 2000. “Rice Market Liberalization and Poverty in Vietnam.”International Food Policy Research Institute, Washington, DC.
Hardy, A. 2003. “Red Hills: Migrants and the State in the Highlands of Vietnam.”Nordic Institute of Asian Studies, Copenhagen, Denmark.
Haughton, J. 2004. “Money Transfer.” Vietnam Business Journal. http://www.fox.rollins.edu/~tlairson/intro/VIETNAM1.HTML.
Haughton, J., L. Duc, N. Binh, and J. Fetzer. 2004. “The Effects of Rice Policy on FoodSelf-Sufficiency and on Income Distribution in Vietnam.” Draft, http://www.mail.beaconhill.org/~j_haughton/RiceArt3.pdf.
Hung, N. 1999. “The Inflation of Vietnam in Transition.” Discussion Paper 22, Centrefor ASEAN Studies, Ho Chi Minh City.
144 Klump
ILO, UNDP, UNFPA (International Labour Organization, United Nations Develop-ment Programme, United Nations Population Fund). 2003. “Internal Migration:Opportunities and Challenges for Development in Vietnam.” Discussion paper,Hanoi, Vietnam.
IOS (Institute of Sociology). 1998. “Migration and Health Survey Vietnam 1997:Survey Report.” IOS, Hanoi, Vietnam.
Jenkins, R. 2003. “Vietnam in the Global Economy: Trade, Employment andPoverty.” Journal of International Development 16: 13–28.
Klump, R. 2003. “Was Growth Pro-Poor in Vietnam? Assessments and Policy Recom-mendations.” Deutsche Gesellschaft für Technische Zusammenarbeit, Eschborn,Germany.
Klump, R., and K. Gottwald. 2003. “Financial Sector Reform in Vietnam.” In TheInternational Handbook on Financial Reform, ed. M. J. B. Hall. Cheltenham, UK:Edward Elgar.
Klump, R., and C. Miralles. 2006. “Pro-Poor Growth: Theory, Measurement andPolicy Instruments.” In Pro-Poor Growth: Issues, Policies and Evidence, ed. L.Menkhoff. Berlin: Duncker and Humblot.
Klump, R., and Nguyen Thi Tue Anh. 2006. “Patterns of Provincial Growth inVietnam, 1995–2000: Empirical Analysis and Policy Recommendations.” InWirtschaftliche Entwicklung und struktureller Wandel, ed. T. Pfahler and P. Thuy,69–79. Bern: Haupt.
Kovsted, J., J. Rand, and F. Tarp. 2003. “Financial Sector Reforms in Vietnam:Selected Issues and Problems.” Discussion Paper 0301, Central Institute forEconomic Management and Nordic Institute of Asian Studies, Hanoi, Vietnam.
Larsen, T., H. Lan, and M. Rama. 2004. “Vietnam’s Public Investment Program andIts Impact on Poverty Reduction.” Draft, World Bank, Washington, DC.
Leipziger, D., and V. Thomas. 1993. The Lessons of East Asia: An Overview of CountryExperiences. Washington, DC: World Bank.
Litchfield, J., and P. Justino. 2002. “Poverty Reduction in Vietnam: What Do theNumbers Tell Us?” PRUS Working Paper 8, University of Sussex, Brighton, UK.
Macours, K., and J. Swinnen. 2002. “Patterns of Agrarian Transition.” EconomicDevelopment and Cultural Change 50: 265–94.
Malesky, E. 2002. “At Provincial Gates: The Impact of FDI on Economic Transition.”PhD diss., Duke University, Durham, NC.
McMillan, J., and G. Woodruff. 1999. “Interfirm Relationship and Informal Credit inVietnam.” Quarterly Journal of Economics 114 (4): 1285–1320.
MPI and MOLISA (Ministry of Planning and Investment and Ministry of Labour,Invalids, and Social Affairs). 2001. “National Target Programs.” Hanoi.
Nguyen, Thi Tue Anh. 2003. “Wachstumspolitik und Sozialpolitik in der Transfor-mation zur Martkwirtschaft am Beispiel Vietnam.” PhD diss., University of Ulm.
Pro-Poor Growth in Vietnam: Miracle or Model? 145
Niimi, Y., P. Dutta, and A. Winters. 2002. “Trade Liberalisation and Poverty Dynam-ics in Vietnam.” Working Paper 17, Poverty Research Unit, University of Sussex,Brighton, UK.
Oxfam. 2003. “Migration: A Viable Livelihoods Strategy of the Poor Men andWomen in Rural Areas.” Draft report, Oxfam, Hanoi, Vietnam.
Pham Lan Huong, Bui Quang Tuan, and Dinh Hien Minh. 2003. “EmploymentPoverty Linkages and Policies for Pro-Poor Growth in Vietnam.” Issues inEmployment and Poverty Discussion Paper, International Labour Organization,Geneva, Switzerland.
Pingali, P. L., and Vo-Tong Xuan. 1992. “Vietnam: Decollectivization and RiceProductivity Growth.” Economic Development and Cultural Change 40 (4): 697–718.
Rama, M. 2002. “The Gender Implications of Public Sector Downsizing: The ReformProgram of Vietnam.” World Bank Research Observer 17 (2): 167–89.
Ravallion, M., and D. van de Walle. 2001. “Breaking up the Collective Farm: WelfareOutcomes of Vietnam’s Massive Land Privatization.” Policy Research WorkingPaper 2710, World Bank, Washington, DC.
Socialist Republic of Vietnam. 2005. “Viet Nam Achieving the Millennium Develop-ment Goals.” Hanoi, Vietnam.
UNDP (United Nations Development Programme). 2001. “Human DevelopmentReport 2001: Making Technologies Work for Human Development.” UNDP,New York.
van Arkadie, B., and R. Mallon. 2003. Vietnam: A Transition Tiger? Canberra: AsiaPacific Press.
van de Walle, D. 2004. “The Static and Dynamic Incidence of Vietnam’s Public SafetyNet.” In Economic Growth, Poverty, and Household Welfare in Vietnam, ed. P.Glewwe, D. Dollar, and N. Agrawal, 189–228. Washington, DC: World Bank.
van de Walle, D., and D. Gunewardena. 2001. “Sources of Ethnic Inequality in VietNam.” Journal of Development Economics 65: 177–207.
Vasavakul, T. 2002. “Rebuilding Authority Relations: Public Administration Reformin the Era of Doi Moi.” Asian Development Bank, Hanoi, Vietnam.
Wagstaff, A., and Nga Nguyet Nguyen. 2004. “Poverty and Survival Prospects ofVietnamese Children under Doi Moi.” In Economic Growth, Poverty, and HouseholdWelfare in Vietnam, ed. P. Glewwe, D. Dollar, and N. Agrawal, 313–50. Washington,DC: World Bank.
White, M. J., Y. K. Djamba, and Dang Nyguyen Anh. 2001. “Implications of Eco-nomic Reform and Spatial Mobility for Fertility in Vietnam.” Population Researchand Policy Review 20 (3): 207–28.
World Bank. 2003. “Vietnam Development Report 2004: Attacking Poverty.” WorldBank, Washington, DC.
146 Klump
6Ghana: The Challenge of TranslatingSustained Growth into PovertyReduction
Ernest Aryeetey and Andrew McKay
Pro-poor growth is a particularly urgent issue in sub-Saharan Africa, giventhe lack of both growth and poverty reduction in the region over the past25 years. Therefore analyzing the experience of the few countries in theregion that have achieved growth and reduced poverty is critical. Ghana isone of these countries.
Though regarded as “the shining star” of the African continent on theeve of independence in 1957, Ghana’s economic fortunes were marked bydecline and volatility between 1965 and 1984. Weak economic performanceover this period can be attributed to poor-quality economic policies andseveral policy reversals, which were exacerbated by frequent changes inpower between predominantly military regimes. Decline was particularlysevere in the late 1970s and early 1980s, when the country experiencedwidespread shortages.
In 1983 the government launched an economic reform program, with thesupport of the World Bank and International Monetary Fund (IMF), fol-lowed by a structural adjustment program from 1986 to 1991. Ghana hassince become a recipient of significant international aid.
The country has achieved sustained economic growth (4.5 percent peryear or 2 percent per capita) in the two decades since 1985. This growth was
147
The authors gratefully acknowledge comments by Gary Fields and volume editors Tim Besleyand Louise Cord, as well as the editorial assistance of Catherine Hull.
accompanied by significant poverty reduction over the 1990s (the mostrecent period for which comprehensive information is available), and someevidence tentatively suggests that this trend may have continued in subse-quent years. However, the pattern of growth has been highly uneven acrosseconomic sectors and population groups.
This chapter considers the factors driving growth in Ghana since themid-1980s. It argues that growth over the last two decades has reflectedimportant policy changes (including import liberalization), a relatively sta-ble political environment, the rehabilitation of Ghana’s traditional exportsectors, and investment in human capital and infrastructure, along withincreased aid inflows and falling fertility rates. But structural transforma-tion of the economy has been limited, private sector investment has beenminimal, little formal sector employment has been created, and growth inagriculture outside of export-oriented sectors has been slow. These trendshave affected the pattern of poverty reduction: workers in (or able to moveinto) fast-growing sectors have benefited from increased income opportuni-ties, while those in other sectors have experienced much slower povertyreduction. At the same time, increased levels of public spending have facili-tated improvements in some geographically broad nonincome dimensionsof poverty.
Growth, Inequality, and Poverty Reduction in Ghana
Moderate growth in the 1990s led to significant income poverty reduction,yet geographical and sectoral variations in the pace of growth contributedto rising inequality. In terms of nonincome dimensions of poverty, accessto education increased, while data of health indicated less progress and insome cases deterioration.
Income Dimensions of Poverty Reduction
Poverty reduction in Ghana has been driven by steady growth, which hasmore than compensated for growing levels of inequality. Analysis of thedistributional pattern of growth in Ghana, as well as of accompanyingchanges in poverty and inequality, is based on household consumptionmeasures derived from household surveys (the Ghana Living StandardsSurveys or GLSS) conducted in 1991/92 and 1998/99. These surveysprovide the most recent such data. Over this period, the householdconsumption–based welfare measure1 grew at an average annualized
148 Aryeetey and McKay
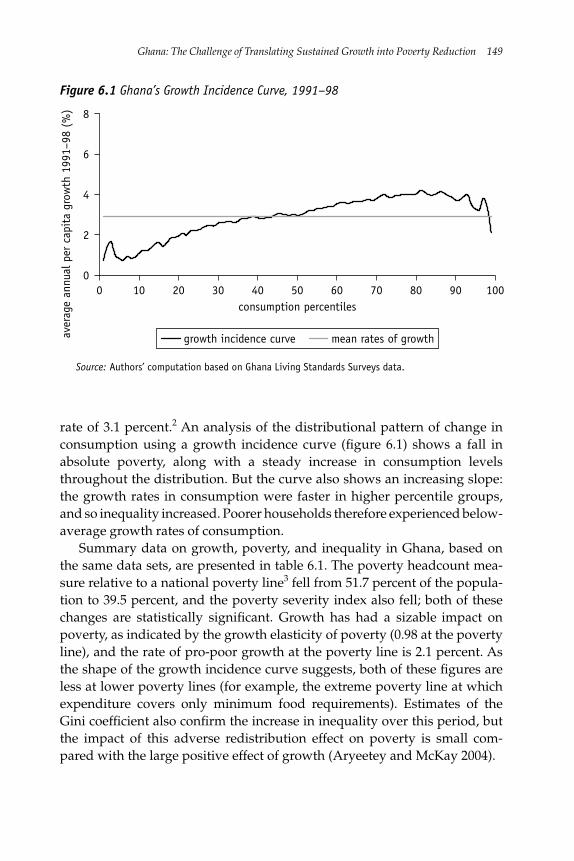
rate of 3.1 percent.2 An analysis of the distributional pattern of change inconsumption using a growth incidence curve (figure 6.1) shows a fall inabsolute poverty, along with a steady increase in consumption levelsthroughout the distribution. But the curve also shows an increasing slope:the growth rates in consumption were faster in higher percentile groups,and so inequality increased. Poorer households therefore experienced below-average growth rates of consumption.
Summary data on growth, poverty, and inequality in Ghana, based onthe same data sets, are presented in table 6.1. The poverty headcount mea-sure relative to a national poverty line3 fell from 51.7 percent of the popula-tion to 39.5 percent, and the poverty severity index also fell; both of thesechanges are statistically significant. Growth has had a sizable impact onpoverty, as indicated by the growth elasticity of poverty (0.98 at the povertyline), and the rate of pro-poor growth at the poverty line is 2.1 percent. Asthe shape of the growth incidence curve suggests, both of these figures areless at lower poverty lines (for example, the extreme poverty line at whichexpenditure covers only minimum food requirements). Estimates of theGini coefficient also confirm the increase in inequality over this period, butthe impact of this adverse redistribution effect on poverty is small com-pared with the large positive effect of growth (Aryeetey and McKay 2004).
Ghana: The Challenge of Translating Sustained Growth into Poverty Reduction 149
0
4
2
6
8
aver
age
annu
al p
er c
apit
a gr
owth
199
1–98
(%
)
0 10 20 30 40 50consumption percentiles
60 70 90 10080
growth incidence curve mean rates of growth
Figure 6.1 Ghana’s Growth Incidence Curve, 1991–98
Source: Authors’ computation based on Ghana Living Standards Surveys data.
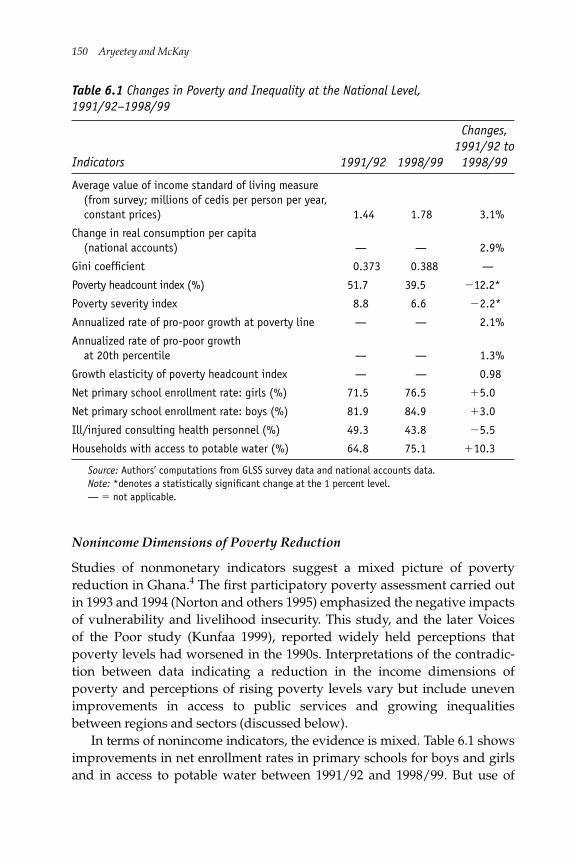
Nonincome Dimensions of Poverty Reduction
Studies of nonmonetary indicators suggest a mixed picture of povertyreduction in Ghana.4 The first participatory poverty assessment carried outin 1993 and 1994 (Norton and others 1995) emphasized the negative impactsof vulnerability and livelihood insecurity. This study, and the later Voicesof the Poor study (Kunfaa 1999), reported widely held perceptions thatpoverty levels had worsened in the 1990s. Interpretations of the contradic-tion between data indicating a reduction in the income dimensions ofpoverty and perceptions of rising poverty levels vary but include unevenimprovements in access to public services and growing inequalitiesbetween regions and sectors (discussed below).
In terms of nonincome indicators, the evidence is mixed. Table 6.1 showsimprovements in net enrollment rates in primary schools for boys and girlsand in access to potable water between 1991/92 and 1998/99. But use of
150 Aryeetey and McKay
Table 6.1 Changes in Poverty and Inequality at the National Level,1991/92–1998/99
Changes,1991/92 to
Indicators 1991/92 1998/99 1998/99
Average value of income standard of living measure(from survey; millions of cedis per person per year,constant prices) 1.44 1.78 3.1%
Change in real consumption per capita(national accounts) — — 2.9%
Gini coefficient 0.373 0.388 —
Poverty headcount index (%) 51.7 39.5 �12.2*
Poverty severity index 8.8 6.6 �2.2*
Annualized rate of pro-poor growth at poverty line — — 2.1%
Annualized rate of pro-poor growth at 20th percentile — — 1.3%
Growth elasticity of poverty headcount index — — 0.98
Net primary school enrollment rate: girls (%) 71.5 76.5 �5.0
Net primary school enrollment rate: boys (%) 81.9 84.9 �3.0
Ill/injured consulting health personnel (%) 49.3 43.8 �5.5
Households with access to potable water (%) 64.8 75.1 �10.3
Source: Authors’ computations from GLSS survey data and national accounts data.Note: *denotes a statistically significant change at the 1 percent level.— � not applicable.
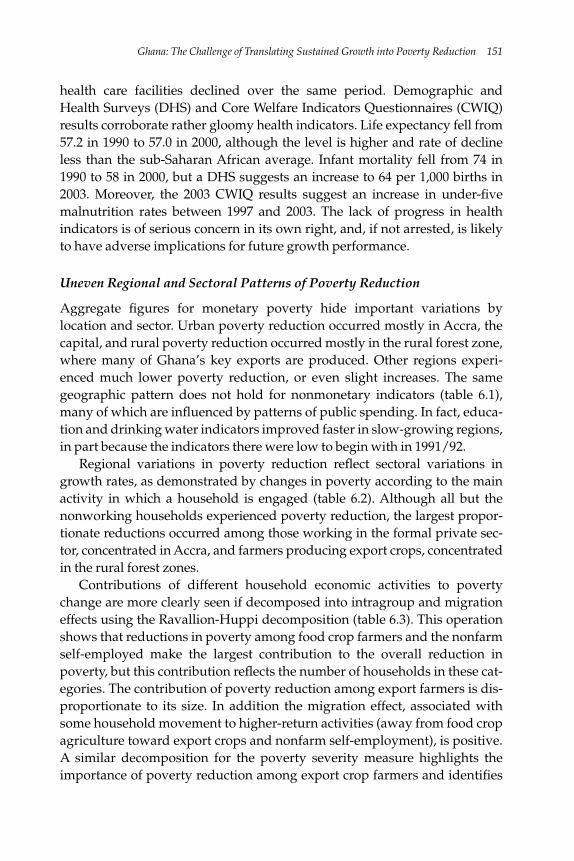
health care facilities declined over the same period. Demographic andHealth Surveys (DHS) and Core Welfare Indicators Questionnaires (CWIQ)results corroborate rather gloomy health indicators. Life expectancy fell from57.2 in 1990 to 57.0 in 2000, although the level is higher and rate of declineless than the sub-Saharan African average. Infant mortality fell from 74 in1990 to 58 in 2000, but a DHS suggests an increase to 64 per 1,000 births in2003. Moreover, the 2003 CWIQ results suggest an increase in under-fivemalnutrition rates between 1997 and 2003. The lack of progress in healthindicators is of serious concern in its own right, and, if not arrested, is likelyto have adverse implications for future growth performance.
Uneven Regional and Sectoral Patterns of Poverty Reduction
Aggregate figures for monetary poverty hide important variations bylocation and sector. Urban poverty reduction occurred mostly in Accra, thecapital, and rural poverty reduction occurred mostly in the rural forest zone,where many of Ghana’s key exports are produced. Other regions experi-enced much lower poverty reduction, or even slight increases. The samegeographic pattern does not hold for nonmonetary indicators (table 6.1),many of which are influenced by patterns of public spending. In fact, educa-tion and drinking water indicators improved faster in slow-growing regions,in part because the indicators there were low to begin with in 1991/92.
Regional variations in poverty reduction reflect sectoral variations ingrowth rates, as demonstrated by changes in poverty according to the mainactivity in which a household is engaged (table 6.2). Although all but thenonworking households experienced poverty reduction, the largest propor-tionate reductions occurred among those working in the formal private sec-tor, concentrated in Accra, and farmers producing export crops, concentratedin the rural forest zones.
Contributions of different household economic activities to povertychange are more clearly seen if decomposed into intragroup and migrationeffects using the Ravallion-Huppi decomposition (table 6.3). This operationshows that reductions in poverty among food crop farmers and the nonfarmself-employed make the largest contribution to the overall reduction inpoverty, but this contribution reflects the number of households in these cat-egories. The contribution of poverty reduction among export farmers is dis-proportionate to its size. In addition the migration effect, associated withsome household movement to higher-return activities (away from food cropagriculture toward export crops and nonfarm self-employment), is positive.A similar decomposition for the poverty severity measure highlights theimportance of poverty reduction among export crop farmers and identifies
Ghana: The Challenge of Translating Sustained Growth into Poverty Reduction 151
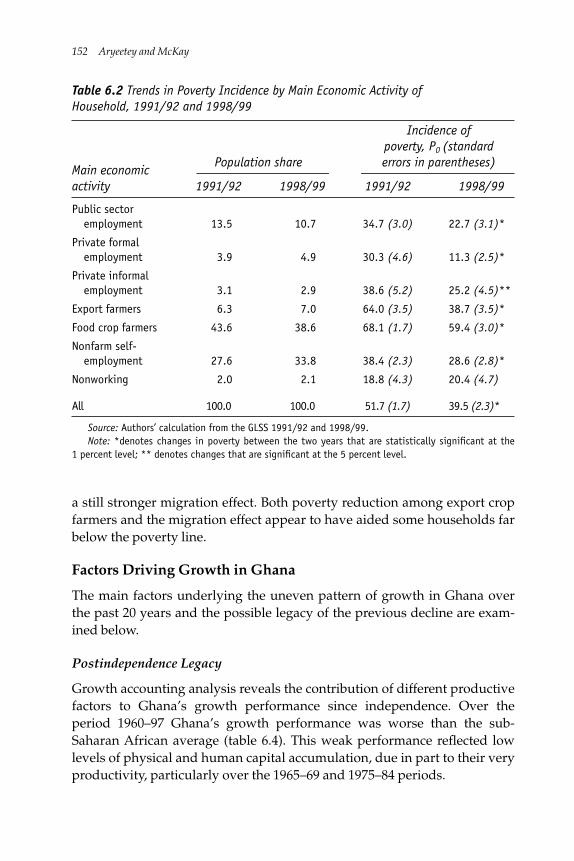
152 Aryeetey and McKay
Table 6.2 Trends in Poverty Incidence by Main Economic Activity of Household, 1991/92 and 1998/99
Incidence of poverty, P0 (standard
Main economicPopulation share errors in parentheses)
activity 1991/92 1998/99 1991/92 1998/99
Public sectoremployment 13.5 10.7 34.7 (3.0) 22.7 (3.1)*
Private formalemployment 3.9 4.9 30.3 (4.6) 11.3 (2.5)*
Private informalemployment 3.1 2.9 38.6 (5.2) 25.2 (4.5)**
Export farmers 6.3 7.0 64.0 (3.5) 38.7 (3.5)*
Food crop farmers 43.6 38.6 68.1 (1.7) 59.4 (3.0)*
Nonfarm self-employment 27.6 33.8 38.4 (2.3) 28.6 (2.8)*
Nonworking 2.0 2.1 18.8 (4.3) 20.4 (4.7)
All 100.0 100.0 51.7 (1.7) 39.5 (2.3)*
Source: Authors’ calculation from the GLSS 1991/92 and 1998/99.Note: *denotes changes in poverty between the two years that are statistically significant at the
1 percent level; ** denotes changes that are significant at the 5 percent level.
a still stronger migration effect. Both poverty reduction among export cropfarmers and the migration effect appear to have aided some households farbelow the poverty line.
Factors Driving Growth in Ghana
The main factors underlying the uneven pattern of growth in Ghana overthe past 20 years and the possible legacy of the previous decline are exam-ined below.
Postindependence Legacy
Growth accounting analysis reveals the contribution of different productivefactors to Ghana’s growth performance since independence. Over theperiod 1960–97 Ghana’s growth performance was worse than the sub-Saharan African average (table 6.4). This weak performance reflected lowlevels of physical and human capital accumulation, due in part to their veryproductivity, particularly over the 1965–69 and 1975–84 periods.
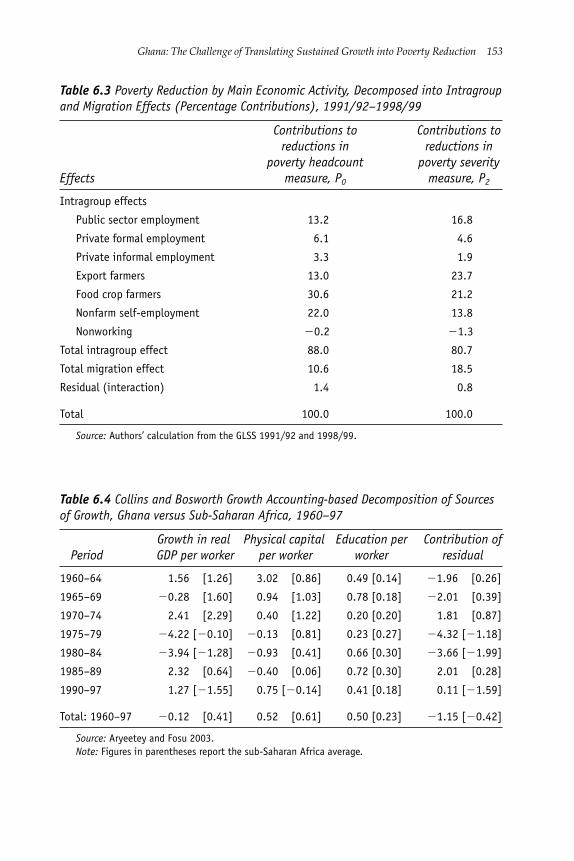
Ghana: The Challenge of Translating Sustained Growth into Poverty Reduction 153
Table 6.3 Poverty Reduction by Main Economic Activity, Decomposed into Intragroupand Migration Effects (Percentage Contributions), 1991/92–1998/99
Contributions to Contributions to reductions in reductions in
poverty headcount poverty severityEffects measure, P0 measure, P2
Intragroup effects
Public sector employment 13.2 16.8
Private formal employment 6.1 4.6
Private informal employment 3.3 1.9
Export farmers 13.0 23.7
Food crop farmers 30.6 21.2
Nonfarm self-employment 22.0 13.8
Nonworking �0.2 �1.3
Total intragroup effect 88.0 80.7
Total migration effect 10.6 18.5
Residual (interaction) 1.4 0.8
Total 100.0 100.0
Source: Authors’ calculation from the GLSS 1991/92 and 1998/99.
Table 6.4 Collins and Bosworth Growth Accounting-based Decomposition of Sourcesof Growth, Ghana versus Sub-Saharan Africa, 1960–97
Growth in real Physical capital Education per Contribution of Period GDP per worker per worker worker residual
1960–64 1.56 [1.26] 3.02 [0.86] 0.49 [0.14] �1.96 [0.26]
1965–69 �0.28 [1.60] 0.94 [1.03] 0.78 [0.18] �2.01 [0.39]
1970–74 2.41 [2.29] 0.40 [1.22] 0.20 [0.20] 1.81 [0.87]
1975–79 �4.22 [�0.10] �0.13 [0.81] 0.23 [0.27] �4.32 [�1.18]
1980–84 �3.94 [�1.28] �0.93 [0.41] 0.66 [0.30] �3.66 [�1.99]
1985–89 2.32 [0.64] �0.40 [0.06] 0.72 [0.30] 2.01 [0.28]
1990–97 1.27 [�1.55] 0.75 [�0.14] 0.41 [0.18] 0.11 [�1.59]
Total: 1960–97 �0.12 [0.41] 0.52 [0.61] 0.50 [0.23] �1.15 [�0.42]
Source: Aryeetey and Fosu 2003.Note: Figures in parentheses report the sub-Saharan Africa average.
Low growth rates between 1965 and 1984 can be attributed to poor andinconsistent policies, political instability, and institutional weaknesses. Thestate sought to play a key role in the economy over most of this period(especially the 1970s) by pursuing an import substitution industrializationstrategy (while seeking to increase manufacturing exports). But a strongantiexport bias in policy (including high taxes on cocoa, one of Ghana’s keytraditional exports), plus a highly overvalued exchange rate, decreasedexports, especially cocoa exports, and led to major disinvestment in cocoa(Frimpong-Ansah 1991); many farmers switched to alternative crops oractivities.
Government ambivalence and hostility toward the private sector,dating back to the immediate postindependence government of KwameNkrumah, also discouraged investment. On ideological grounds and topreserve his political power, Nkruma actively opposed development of anentrepreneurial class in Ghana. As a consequence the state played a majorrole in industrialization (to be funded in part by cocoa taxation), took mea-sures to limit the size of private business, and preferred foreign capital overdomestic private investment (Acemoglu, Johnson, and Robinson 2005;Frimpong-Ansah 1991; Killick 1978). Several subsequent governments,including the Acheampong regime in the 1970s, pursued similar policies.These policies were largely unsuccessful at promoting industrialization, notleast because of their internal inconsistency, but they did lead to majoradverse impacts on the cocoa sector and the maintenance of a large andcomplex public sector.
The state’s stance on economic development before 1984 helps explainthe factors driving growth and those constraining growth in more recentdecades. Although the adverse impacts of the above-noted policies onexports have since been reversed, the ambivalent attitude to the private sec-tor and the size and complexity of the state sector appear to have left anenduring legacy.
Factors Driving Growth
In the early 1980s the downward spiral caused by economic mismanage-ment and neglect of the private sector, as well as a major drought, promptedintroduction of an economic reform program, with substantial support fromthe IMF and World Bank. Starting in 1986, a structural adjustment programwas geared toward correcting structural imbalances in order to engenderhealthy economic growth. The economy responded positively to these lib-eral reform programs: in 1983 the growth rate was negative, but the nextyear it was 8 percent (Aryeetey and Kanbur forthcoming).
154 Aryeetey and McKay
Improved policies and political stability have played a key role in therecovery of growth since 1984, though levels of factor accumulation remainlow (table 6.4). Thus growth recovery, including increased total factor pro-ductivity, partly reflects a process of making up lost ground. But the factthat economic and political reforms came with substantial aid inflows (byfar exceeding previously received sums; Hutchful 2002) makes individualcontributions to Ghana’s growth performance difficult to isolate.Christiansen, Demery, and Paternostro (2003) identify improved macroeco-nomic policy as a key factor in the recovery of growth between 1975–84 and1985–97 in their cross-country analysis drawing on the African growthmodel of O’Connell and Ndulu (2000). In the analysis, they decomposechanges in predicted per capita GDP as a function of country characteristics,institutional factors, climatic shocks, and macroeconomic policy variables.
Of the key macroeconomic variables, Christiansen, Demery, andPaternostro (2003) identify the reduced parallel exchange rate as of particu-lar importance to Ghana’s growth. Exchange rate devaluation—alongsidereform of the marketing system—improved access to inputs, and gradualimprovement in prices represented a conscious effort to stimulate exports,particularly in the cocoa sector. Significant numbers of poor farmers havebenefited by growing (or replanting) some cocoa. Investment in miningores—another key export—also increased since the mid-1980s. Nontradi-tional exports—mostly agricultural or processed agricultural products,including pineapples, yams, wood products, cocoa products, canned tuna,and oil palm products—have also contributed to a growing share of trade.5
Trade as a proportion of GDP increased from 33.2 percent in 1991 to81.0 percent in 1998 and has continued to increase with rehabilitation ofcocoa and gold production and growth of nontraditional exports. However,trade reforms have resulted in faster growth in imports compared withexports; many imports are consumer goods or food products. The fastergrowth of imports has adversely affected some local production, for exam-ple, rice growing, chicken rearing, and manufacturing. But import liberal-ization has also been an important stimulus to growth in wholesale andretail sectors.
Sharply increased aid inflows (Ghana received little aid during the 1970sand early 1980s) represent another key factor behind growth. Associatedincreased levels of demand have stimulated economic activity in the infor-mal sector (especially wholesale and retail trade) and in construction; thiseffect is particularly evident in Accra (an observation confirmed by GLSSdata; Coulombe and McKay 2003). Increased spending on public services,especially education and physical infrastructure (roads, electricity, water)has also had growth benefits. Some of these benefits, such as increased
Ghana: The Challenge of Translating Sustained Growth into Poverty Reduction 155
education spending (heavily supported by donors), have had positiveimpacts throughout the country. However, infrastructure investments, suchas improved roads and electricity, have been more concentrated in export-producing or better-connected areas.
Finally, an increasing flow of international remittances, chiefly from theGhanaian diaspora in Europe and North America, appears to be an impor-tant contributor to growth. The precise magnitude of this flow is unknown,because much of it may not go through the formal financial sector. Nonethe-less, recorded inflows of remittances increased from around $15 million toover $30 million between 1991 and 1998; survey-based evidence suggestssomewhat higher figures. Formal evidence of the uses of remittances isscanty, but the proportion financing physical capital accumulation (otherthan construction of dwellings) is believed to be quite low; on the otherhand, significant amounts are used as payment for education.6 However,evidence that international remittances frequently do not flow to poorerhouseholds suggests that their poverty-reducing impact may be limited.
This brief consideration of the sources of poverty reduction in Ghanaalso provides the key to understanding limits to pro-poor growth. Aryeeteyand Tarp (2000) argue that external sources of cash through aid inflows haveenabled increased use of capital without significant improvements in totalfactor productivity. Moreover, macroeconomic stability, though muchimproved relative to the 1965–84 period, remained precarious throughoutthe 1990s. Various factors, including fiscal profligacy, undermined the finan-cial sector, inhibiting private sector growth. Perhaps most important, thelack of an overarching vision of development in support of a coherent pro-gram of structural transformation and reform threatens the sustainability ofpro-poor growth to date (Aryeetey and Kanbur forthcoming).
Factors Constraining Participation of the Poor in Growth
Three major factors have influenced the ability of the poor to participate ingrowth in Ghana: agricultural performance; the operation of labor markets,in particular limits to employment creation; and the composition, effective-ness, and distributional pattern of public spending. Constraints to growthin these three areas stem from the absence of fundamental structuralchanges since colonial times: the domestic economy continues to dependlargely on agriculture (which accounts for nearly 40 percent of GDP and50 percent of all employment), and the industrial and manufacturing sectorsremain underdeveloped. The examples below highlight the underlying pol-icy environment, institutional framework, and considerations of political
156 Aryeetey and McKay
economy that have precluded structural reforms that would have furtherbenefited the poor and led to a more diversified economy.
Agriculture
The importance of agriculture for poverty reduction in Ghana can be under-stood by even the briefest consideration of the evidence: while 66.8 percentof the population lived in rural areas in 1998/99, nearly 84 percent of thepoor were rural dwellers; the latter proportion increases even more once thedepth of poverty is taken into account or a lower poverty line is used. Agri-culture is the main economic activity for the majority of the rural poor, andeven for those primarily engaged in a nonfarm activities (who tend to beless poor on average), agriculture is often an important secondary activity.
The persistence of poverty in the agricultural sector is due to a basic lackof structural change in Ghana since colonial times. With the exception ofcocoa, the key agricultural cash crop, the sector has remained largelyuntransformed; input use is limited (for example, only 16 percent of house-holds engaged in agriculture in 1998 reported having purchased fertilizer).Thus, although the area under cultivation has increased, production pro-cesses have not become more intensive, and yields have largely stagnatedbelow achievable levels (Nyanteng and Seini 2000). As a result, sectoralgrowth rates lagged behind other areas of the economy in most of thereform years (Aryeetey and Kanbur forthcoming).
Large export crop operations receive greater policy attention and infra-structure investments than small food crop operations. As described above,poverty reduction among households has depended heavily on the subsec-tor of engagement (tables 6.2 and 6.3); poverty declined faster among theminority of export crop farmers than among food crop farmers. Many poorhouseholds in the forest area of the country do produce cocoa and havebeen able to benefit from export growth.7 Smallholder households not pro-ducing export crops have experienced lower rates of participation ingrowth. Poverty reduction among this group has often been due to factorsoutside agriculture (receipts of remittances, greater engagement in nonfarmactivities).
Though trade liberalization has benefited those producing export goods,the reduction of import protection has adversely affected local producers ofproducts, such as rice, cotton, chicken, and tomato concentrate. Limitedaccess to key inputs represents another major constraint on growth in foodcrops (especially since the removal of subsidies on inputs) and has kept lev-els of fertilization and mechanization low. Paltry budgetary allocations to
Ghana: The Challenge of Translating Sustained Growth into Poverty Reduction 157
irrigation over the past decade have exacerbated smallholders’ vulnerabil-ity and limited their engagement in product markets. Access to credit, aswell as extension services and other inputs, is especially difficult for womenfarmers, who make up the majority of the labor force in the food crop sectorbecause they are less likely to grow crops that are marketed. Associated pro-cessing activities that are disproportionately undertaken by women sufferthe same constraints. Moreover, poor roads and other infrastructure havelimited the ability of food crop farmers to distribute their produce.
Complex and uncertain tenurial relations appear to hinder privateinvestments in agriculture. Besley (1995) finds that the relationship betweenthese investments and land rights is complex in Ghana. Further, judging theextent to which land rights issues affect the poor specifically is difficult. Astudy of the impact of land rights on investment and productivity in agri-culture in Akwapim in eastern Ghana by Goldstein and Udry (2005) foundthat farmers who lacked local political power were not confident in main-taining their land rights over a long fallow period. As a consequence, theyfallowed the land for much shorter durations and achieved lower outputlevels than politically powerful farmers. But this finding is not necessarilygeneralizable. First, land tenure arrangements vary widely across Ghana.Second, work at the Institute of Statistical, Social and Economic Researchsuggests that land tenure arrangements are undergoing considerablechange, driven by new interests (including those of migrants/tenants) andmarket forces. Many conflicts and litigations arise from the way differentgroups perceive the changes. These conflicts and perceptions of futureaccess (which may have little to do with local political power) are importantto understanding productivity. The challenge for policy makers remainshow to organize the imminent changes and ensure that they occur in astructured manner within a sound institutional framework.
The Medium-Term Agricultural Development Programme in 1990 tookaim at food crop challenges that could be addressed more quickly:enhanced productivity through market liberalization, improved extensionservices, and additional support programs. The impact of these measureshas been limited, and many other core issues such as infrastructure have notbeen addressed. Reform of land tenure systems governed by traditionalpower structures also represents a delicate issue and long-term challengefor government. As an area where substantial numbers of Ghanaiansremain trapped in poverty, food crop agriculture calls for significant policyattention. The lack of policy focus on agriculture raises the question of theextent to which urban bias continues to affect policy making in Ghana.
158 Aryeetey and McKay
The Labor Market and Generation of Private Sector Opportunities
The labor market should be a key channel through which the poor areable to participate in growth, assuming individuals can move into higher-return activities. In Ghana, households’ net pattern of movement was fromlower-return activities (such as food crop farming) to higher-return activi-ties (such as export farming or nonfarm self-employment), and this move-ment has contributed to a net reduction in poverty (table 6.3). However, thebenefits to be gained from such movement have been limited by the absenceof substantial opportunities in the formal sector. Poor private sector devel-opment stems in part from the legacy of governmental hostility toward theprivate sector’s role in the economy. Underdevelopment of the financial sec-tor, itself partly caused by continued weaknesses in macroeconomic policy,remains the main factor discouraging private investment, even if macroeco-nomic stability has improved in the last few years.
Rather than being closely linked to open unemployment, poverty inGhana is more readily associated with underemployment, work in agricul-ture, and, to some extent, in the informal sector. Participation rates in theGhanaian labor market are high for both women and men, and open unem-ployment rates (with the exception of youth unemployment in urban areas)are still relatively low. According to the GLSS, more than three-quarters ofGhanaian households are self-employed in either agriculture or a variety ofnonfarm activities.8 Between 1992 and 1998, participation in nonfarm self-employment activities increased sharply, caused in part by a movementout of agriculture. Urban self-employment has been a significant channelthrough which many of the poor have escaped poverty: in Accra GLSS datasuggest that returns to such activities increased significantly between1991/92 and 1998/99. However, growth in the sector is limited by internalconstraints, such as poor economies of scale and lack of access to technologyor credit. Very few self-employment activities develop into more establishedcompanies that hire significant numbers of employees.
Wage employment, whether formal or informal, represents the primaryeconomic activity in only about one-fifth of households, and this proportiondeclined marginally over the 1990s, mainly because of public sectorretrenchment. Contraction of wage employment opportunities in Ghanaover the period has deprived the poor of a potentially powerful mechanismfor escaping poverty, as evidenced by economic development in East andSoutheast Asia, where pro-poor growth was associated with an expansionof wage employment opportunities, especially for unskilled labor. InGhana, neither the urban informal sector nor the rural economy has createdsubstantial opportunities for employing hired labor. As a result, unskilled
Ghana: The Challenge of Translating Sustained Growth into Poverty Reduction 159
employees are relatively few. However, those that have obtained andretained jobs in the formal sector have generally experienced significantincreases in their income levels.
One aspect of the paucity of wage employment opportunities in Ghanawas low productivity in the manufacturing sector in the 1990s. Economicreforms’ initial benefits to the manufacturing sector—the easing of supplyconstraints and price liberalization—were short-lived. Restructuring in theindustrial sector in the following years was hampered by devaluation, ero-sion of liquidity, high interest rates, a lack of access to long-term credit, andincreased competition from imported consumer goods as a result of tradeliberalization. As a result, small firms and low capital-labor ratios dominatethe private sector. Low productivity levels, hence high costs internationally,are associated with poor export performance (Teal 1999), thereby limitingthe scope for growth.
Recovery of the manufacturing sector is an important priority for futureemployment creation and growth in Ghana, not least because of manufac-turing’s links to other sectors, including agriculture. However, the failure ofemployment creation has been an issue across all sectors, and this failure isintimately linked to low levels of private investment. The proportion ofgross domestic investment in GDP increased from a low of 3.7 percent in1983 to 16 percent in 1990, but largely as a result of increases in publicinvestment. Private investment has remained consistently low. In turn, theweakness of the financial sector is a major constraint on private sectorinvestment. Financial institutions, few in number, have preferred to holdtreasury bills rather than lend to the private sector and reportedly have thehighest interest rate margins in Africa (World Bank 2004).
Although financial sector reform, including improved supervision andregulation, is a sine qua non of private sector development, investor confi-dence is also highly contingent on macroeconomic stability. The continuinginstability of the macroeconomic environment (even if much improvedsince 1983) has been a major factor accounting for lack of investment. Con-sequences include high and variable rates of inflation and persistent largefiscal deficits, in part the result of election-cycle spending patterns follow-ing the transition to democracy in 1992. Inconsistencies between monetaryand fiscal policies reached their peak in 1997 with the government’s deci-sion to adopt a nominal exchange rate anchor without a prerequisite levelof fiscal restraint. The result was a speculative assault and a real deprecia-tion of 106 percent (174 percent nominal), which forced Ghana to seek reliefunder the Heavily Indebted Poor Country (HIPC) Initiative (Youngbloodand Franklin 2005).
160 Aryeetey and McKay
Since 2000 the new government has sought to create a “golden age” forbusiness and has increased macroeconomic stability, while avoiding thelarge preelectoral spending boom that characterized the 1990s. But this per-formance has not yet led to a significant increase in investment. Generationof poverty reduction opportunities will be dependent on boosting wageemployment in manufacturing through enhanced private sector invest-ment. Labor market opportunities are hence closely linked to key policychoices of government, including the consistent pursuit of macroeconomicstability and financial sector reform.
Public Spending and Poverty Reduction
Public spending potentially plays a critical role in relation to the poor,notably through provision of key services, such as education and health, andinvestment in infrastructure, including roads, markets, and electricity, andextension services. In Ghana, the public sector has always been a highly sig-nificant employer. Although public spending has had poverty-reducingimpacts in Ghana, it has benefited the poorest of the poor less than othersbecause of its composition and distributional pattern.
A significant proportion of public spending is interest payments on debt,especially domestic debt, the legacy of past high fiscal deficits. In 2001interest payments on debt were at 7.8 percent of GDP or 40 percent of totaloperational expenditures (World Bank 2004). Apart from these payments,spending on education and health has dominated the budget; these min-istries account for nearly 70 percent of government employment in 2003(World Bank 2004). Allocation to the social sectors, clearly important from apoverty perspective, has fallen as a share of total expenditures from 40 per-cent in the first reform decade to 28 percent in the second decade, but it hasremained steady as a share of GDP in both the prereform and reform yearsat about 6 percent of GDP. Capital expenditures moved from being only3.3 percent of GDP in the decade before the adoption of economic reforms to5.1 percent in the first decade of reforms and then to an average of 12 per-cent in the second decade. Investment in infrastructure, particularly roads,has gained remarkably in importance since 1992. By contrast, expenditureon agriculture today accounts for less than 1.3 percent of expenditure (com-pared with 8.4 percent in 1991).
The extent to which the poor have benefited from public spendingdepends on the effectiveness of this spending. Public expenditure patternsappear to be driven largely by revenue flows and political expediencyand reflect no particular commitments to policies and expected growth
Ghana: The Challenge of Translating Sustained Growth into Poverty Reduction 161
outcomes. Wetzel (2000) has questioned the effectiveness of public expendi-tures, basing her comments on public expenditure reviews undertaken inthe 1990s that suggested a proliferation of relatively small-scale projectswith a lack of clear prioritization. Projects have often been linked to the elec-toral cycle—as evidenced by the abandonment of rural development pro-jects after the 1992 elections (Barbone and others 2005)—and have been ofquestionable effectiveness (ISSER 2004). For instance, all district capitals arenow connected to the national electricity grid, but economic activity in themhas increased little, and very few households try to get connected. Despitethe construction of, on average, 50 new schools in each district over the pastfour years, DHS results show declining pupil performance, which is attrib-uted to the lack of teachers in schools (ISSER and UNDP 2005). Ye andCanagarajah (2002) report that the efficiency of the health system in the1990s was below the sub-Saharan African average and that the overall levelof public expenditure on health was low by West African standards overthat decade.
At the heart of the issue of the effectiveness of public spending is the sizeand character of the public sector. Most postindependence governments inGhana, dating back to Nkrumah, were committed to a state-led strategy ofindustrialization, which involved the public sector in many spheres of eco-nomic activity that generated little economic return. The size and complex-ity of the Ghanaian public sector remains an issue despite reform measuressince 1984, including some attempts at retrenchment. Booth and others(2004) characterize the Ghanaian state as having a neopatrimonial characterthat has deep historical roots, where “public resources tend to be capturedand ‘owned’ by networks controlled by dominant patrons” (Booth and oth-ers 2004). The legacy of this character, they argue, helps explain why succes-sive donor-supported attempts at public sector reform have had limitedsuccess. Moreover, the effect of democratization on public sector reforms hasbeen mixed. The advent of multiparty elections in the early 1990s coincidedwith a perceived increase in patron-based politics. For instance, the 1990ssaw significant levels of public spending in electoral cycles. In the run-upto the 1992 elections, the ruling National Democratic Congress Partyannounced an 80 percent increase in civil servant wages, reversing its earlierattempts to trim the public sector (Barbone and others 2005).
Continued public sector weaknesses are related to the effectiveness ofpublic expenditure management; actual spending often deviates substan-tially from public spending. Killick (2004) has estimated that the deviationsbetween budget estimates and actual expenditure in the education andhealth sectors are in the region of plus or minus 42 percent and plus or minus
162 Aryeetey and McKay
68 percent, respectively. Furthermore, funds released from the center areoften smaller on arrival at the point of service delivery (Killick 2004).
Spending on education illustrates how the distributional pattern of pub-lic spending affects the poor. A high proportion of the budget is spent oneducation (and of that 70 percent goes into basic education). Benefit inci-dence analysis suggests that the provision of primary education and basichealth care is progressive in the sense that the poorest quintile benefits morethan in proportion to its income share (Demery, Chao, Bernier, and Mehra1995; World Bank 1995; Ye and Canagarajah 2002). Richer groups still get agreater share than poorer groups, however, because they make more use ofthese facilities (and typically have fewer children). Furthermore, the distrib-utional impact of spending is likely to be less progressive once the quality ofeducation is taken into account, as lower teacher to pupil ratios and the lackof basic classroom materials reflect poorer quality of education in ruralareas (Ye and Canagarajah 2002). Although primary school enrollment, evenin poorer areas, has increased significantly since 1990, enrollment at the sec-ondary level has changed little (even if rates are high by regional stan-dards), especially among poorer groups. Benefit incidence analysis confirmsthat spending at this level is much less progressive. The distribution ofhealth care spending reflects a similar bias in distribution toward higher-level facilities, urban areas, and more affluent groups.
These concerns about the effectiveness and distributional pattern of pub-lic spending mean that the poor, and especially those in more remote ordeprived regions, find it difficult to accumulate a key asset, human capital,severely limiting their opportunities to participate in growth. These prob-lems in relation to education are compounded by limited access to healthcare, which impedes the ability of the poor to protect themselves effectivelyagainst health shocks.
Patterns of public spending by region pose another important, andpolitically sensitive, distributional issue. They are believed to be highlyunequal, but no data are available to clarify the situation. The lack of geo-graphically disaggregated public expenditure data in Ghana is significantin itself. Decentralization of some public spending was enshrined in the1992 constitution and the subsequent Law on Local Government, whichdevolved development planning and administration to district assembliesand gave them control over a substantial portion of their revenues. Since2000 HIPC relief funds have enabled district assemblies to finance manydevelopment projects in specific areas—education, health, water and sani-tation, production, and gainful employment—all of which can contributeto poverty reduction. Although decentralization could in principle provide
Ghana: The Challenge of Translating Sustained Growth into Poverty Reduction 163
opportunities for public spending to become more effective across regions,obstacles remain at the national and local levels. As already noted, the gov-ernment’s intended expenditure in any particular region or district may befar different from what is actually spent, and political economy forces atthe local level may act against a pro-poor allocation of funds (Bardhan andMookherjee 2000).
Conclusions
Ghana managed an impressive economic turnaround after more than20 years of serious decline. A combination of large external inflows and pol-icy change from 1984 onward resulted in adoption of more consistent poli-cies and helped achieve political stability. Ghana attained a sustained levelof growth that is impressive by West African standards and that representsone of few growth success stories in sub-Saharan Africa. Moreover, thisgrowth has been associated with significant progress in poverty reduction,both in income and nonincome terms.
Success has reflected political stability, abandonment of poor policies,greater openness of the economy, increased public spending (and concomi-tant improvements in educational outcomes), and large inflows of aid andremittances. However, poor households’ participation in growth has variedaccording to geographic area and economic sector. Poverty reduction overthe 1990s has been fastest in the export-producing rural forest region and inAccra, and inequality has increased. Poverty reduction among thoseengaged in the agricultural sector but not in production of key export cropshas been limited, reflecting a lack of policy concern with agriculture,as demonstrated by a very low budget for the sector. In addition, growthhas been associated with little creation of wage jobs and little growth in theproductive formal sector; low-order self-employment activities have only alimited capacity to generate growth. This lack of employment creationreflects low levels of private investment (domestic or foreign) despite 20years of growth. Even though macroeconomic management has muchimproved since 1984, continuing macroeconomic instability, along with theassociated underdevelopment of the financial sector, appears to be a con-straint to such investment.
A lack of basic structural change in the economy, limited employmentcreation, reliance on external inflows, continued low levels of total factorproductivity, and increases in spatial inequality raise questions about thesustainability of Ghana’s growth. Prolonging growth and expanding its
164 Aryeetey and McKay
benefits to the poorest households and those in more remote locations willrequire fundamental policy and institutional reforms.
Increasing productivity in the agricultural sector outside of traditionalexport crops is a priority. It will require dry-season cultivation, production ofa greater range of crops (including nontraditional export crops), increasedinput use, and market participation. Increased agricultural productivityposes the long-term challenge of appropriate tenurial arrangements.Improvements in intersectoral links, including the provision of infrastruc-ture to remote areas, could promote agroprocessing activities as a reliablesource of demand for agriculture. Unexploited scope for Ghana to become atrading hub in the region is considerable but would require infrastructureinvestment.
The absence of fundamental structural change has been attributed to alack of concerted effort (Aryeetey and McKay 2004) or political commit-ment (Killick 2000, 2004). But such change is on the horizon. The currentgovernment has articulated not only a strong commitment to macroeco-nomic stability but also the goal of implementing structural change throughimproved agricultural productivity and private sector development. Spe-cific policy focuses include improvement of market access through betterroad networks, support for agro-industry, strengthened supervision andregulation of the financial sector, and privatization of state-owned banks(Government of Ghana 2003). To increase pro-poor growth, these policymeasures must pay explicit attention to the needs of currently laggingregions with growth potential, as well to current growth poles.
Perhaps the greatest challenge for future pro-poor growth in Ghana is thefull reversal of historical legacies, which have created sectoral and regionalbiases and led to an inflated, and often distorting, role for the state. Decen-tralization represents a potentially powerful mechanism for human develop-ment, but its success depends in part on tracking of expenditures to ensurethat they reach their target and generate expected outputs. Ghana demon-strates that the relationship between democracy and economic governance isby no means straightforward, but there is hope that as democratic practicesbecome institutionalized, mechanisms of transparency and accountabilityand the rule of law will facilitate the state’s role in development.
Notes
1. This measure was computed as total household consumption expenditure peradult equivalent, adjusted for price differences over time and space. For furtherdetails see GSS (2000) or Coulombe and McKay (2003).
Ghana: The Challenge of Translating Sustained Growth into Poverty Reduction 165
2. This figure is very similar to the national accounts estimate of the growth ratein real consumption per capita (2.9 percent per year).
3. For further details on the computation of the poverty line, see GSS (2000) andCoulombe and McKay (2003). This computation followed standard internationalprocedures, as discussed by Ravallion and Bidani (1994).
4. Surveys include qualitative studies—for example, Norton and others (1995)and Kunfaa (1999)—and quantitative assessments—for example, Demographic andHealth Surveys 1993, 1998, and 2003 and Core Welfare Indicators Questionnaires1997 and 2003.
5. From 1989 to 1996 earnings from nontraditional exports increased from$23.8 million to $276.2 million. This trend has continued, and in 2003 the subsectorbrought in $588.9 million.
6. Although education is notionally free up to the junior secondary level, inpractice payments are frequently required; moreover, an increasing number ofGhanaians are sending their children to private schools, even at primary level(Ye and Canagarajah 2002).
7. The extent to which the poor have benefited from the growth of nontraditionalexports is not well understood, in part because this development is relatively recent.Some nontraditional export crops, such as yams, are already produced in significantquantities compared with horticultural products and other export crops requiringgreater input use.
8. These summary figures do not take account of the diversity of livelihoods inwhich households are engaged (Coulombe and McKay 2003, tables 6.2 to 6.4), thus agreater proportion of households are engaged in informal labor markets as asecondary activity.
References
Acemoglu, Daron, Simon Johnson, and James Robinson. 2005. “Institutions as theFundamental Cause of Long-Run Growth.” In Handbook of Economic Growth, ed.Philippe Aghion and Steve Durlauf, 385–475. Amsterdam: Elsevier.
Aryeetey, Ernest, and Augustin Fosu. 2003. “Economic Growth in Ghana:1960–2000.” Draft, African Economic Research Consortium, Nairobi, Kenya.
Aryeetey, Ernest, and Ravi Kanbur. Forthcoming. “Ghana’s Economy at Half Cen-tury: An Overview of Stability, Growth and Poverty.” In The Economy of Ghana:Analytical Perspectives on Stability, Growth and Poverty, ed. E. Aryeetey and R. Kanbur. Oxford: James Currey.
Aryeetey, Ernest, and Andrew McKay. 2004. “Operationalising Pro-Poor Growth:Ghana Case Study.” Available at http://www.dfid.gov.uk/pubs/files/oppgghana.pdf.
Aryeetey, Ernest, and Finn Tarp. 2000. “Structural Adjustment and After:Which Way Forward?” In Economic Reforms in Ghana: The Miracle and Mirage,
166 Aryeetey and McKay
ed. E. Aryeetey, J. J. Harrigan, and M. Nissanke, 345–65. Oxford: James Curreyand Accra, Ghana: Woeli Publishers.
Barbone, Luca, L. Cord, C. Hull, and J. Sandefur. 2005. “Democracy, Institutions, andPoverty Reduction.” Draft, World Bank, Washington, DC.
Bardhan, P., and D. Mookherjee. 2000. “Capture and Governance at Local andNational Levels.” American Economic Review 90 (2): 135–39.
Besley, T. 1995. “Property Rights and Investment Incentives: Theory and Evidencefrom Ghana.” Journal of Political Economy 103 (5): 903–37.
Booth, David, Richard Crook, E. Gyimah-Boadi, Tony Killick, and Robin Luckham,with Nana Boateng. 2004. “Drivers of Change in Ghana: Overview Report.”Final draft, Overseas Development Institute, London, and Centre for DemocraticDevelopment, Accra, Ghana.
Christiansen, Luc, Lionel Demery, and Stefano Paternostro. 2003. “Macro and MicroPerspectives of Growth and Poverty in Africa.” World Bank Economic Review17 (3): 317–47.
Coulombe, Harold, and Andrew McKay. 2003. “Selective Poverty Reduction in aSlow Growth Environment: Ghana in the 1990s.” Paper presented at ISSER-Cornell International Conference on Ghana at the Half Century, Accra, Ghana,July.
Demery, L., S. Chao, R. Bernier, and K. Mehra. 1995. “The Incidence of Social Spend-ing in Ghana.” Discussion Paper 82, Poverty and Social Policy Department,World Bank, Washington, DC.
Frimpong-Ansah, Jonathan. 1991. The Vampire State in Africa: The Political Economy ofDecline in Ghana. London: James Currey.
Goldstein, Markus, and Christopher Udry. 2005. “The Profits of Power: Land Rightsand Agricultural Investment in Ghana.” Working Paper 929, Economic GrowthCenter, Yale University, New Haven, CT.
Government of Ghana. 2003. Ghana Poverty Reduction Strategy, 2003–2005: An Agendafor Growth and Prosperity, vol. 1. Accra, Ghana: Ghana Publishing Corporation,Assembly Press.
GSS (Ghana Statistical Service). 2000. Poverty Trends in Ghana in the 1990s. Accra,Ghana: GSS.
Hutchful, Eboe. 2002. Ghana’s Adjustment Experience: The Paradox of Reform. Oxford:James Currey, Accra: Woeli Publishers, and Portsmouth, NH: Heinemann for theUnited Nations Research Institute for Social Development.
ISSER (Institute of Statistical, Social and Economic Research). 2004. State of theGhanaian Economy Report, 2003. Legon, Ghana: University of Ghana.
ISSER and UNDP (United Nations Development Programme). 2005. Ghana HumanDevelopment Report 2004. Accra, Ghana: ISSER, UNDP, and United Nations Popu-lation Fund.
Ghana: The Challenge of Translating Sustained Growth into Poverty Reduction 167
Killick, Tony. 1978. Development Economics in Action: A Study of Economic Policies inGhana. London: Heinemann.
_______. 2000. “Fragile Still: The Structure of Ghana’s Economy 1960–1994.” InEconomic Reforms in Ghana: The Miracle and Mirage, ed. E Aryeetey, J. J. Harrigan,and M. Nissanke. Oxford: James Currey, and Accra, Ghana: Woeli Publishers.
_______. 2004. “What Drives Change in Ghana? A Political-Economy View ofEconomic Prospects.” Draft, Institute of Statistical, Social and EconomicResearch, University of Ghana, Legon, Ghana.
Kunfaa, E. Y. 1999. “Consultations with the Poor: Ghana Country Synthesis Report.”Centre for the Development of People, Kumasi.
Norton, Andrew, Ellen Bortei-Doku Aryeetey, David Korboe, and D. K. Tony Dogbe.1995. “Poverty Assessment in Ghana Using Qualitative and ParticipatoryResearch Methods.” Discussion Paper 83, Poverty and Social Policy Department,World Bank, Washington, DC.
Nyanteng, V., and A. W. Seini. 2000. “Agricultural Policy and the Impact on Growthand Productivity 1970–95.” In Economic Reforms in Ghana: The Miracle and theMirage, ed. E. Aryeetey, J. J. Harrigan, and M. Nissanke. Oxford: James Currey,and Accra, Ghana: Woeli Publishers.
O’Connell, S., and B. Ndulu. 2000. “Africa’s Growth Experience: A Focus on theSources of Growth.” Draft, African Economic Research Consortium, Nairobi,Kenya.
Ravallion, Martin, and B. Bidani. 1994. “How Robust Is a Poverty Profile?” WorldBank Economic Review 8 (1): 75–102.
Teal, Francis. 1999. “Why Can Mauritius Export Manufactures and Ghana Not?” TheWorld Economy 22 (7): 981–93.
Wetzel, D. 2000. “Promises and Pitfalls in Public Expenditure.” In Economic Reformsin Ghana: The Miracle and the Mirage, ed. E. Aryeetey, J. J. Harrigan, andM. Nisanke. Oxford: James Currey, and Accra, Ghana: Woeli Publishers.
World Bank. 1995. “Ghana: Poverty Past, Present, and Future.” Report 14504-GH,World Bank, Washington, DC.
_______. 2004. “Ghana: Public Policy, Growth, and Poverty: A Country EconomicMemorandum.” Report 27656-GH, World Bank, Washington, DC.
Ye, Xiao, and Sudharshan Canagarajah. 2002. “Public Health and Education Spendingin Ghana in 1992–98: Issues of Equity and Efficiency.” Policy Research WorkingPaper 2579, World Bank, Washington, DC.
Youngblood, Charles E., and David I. Franklin. 2005. “Persistent Public SectorDeficits and Macroeconomic Instability in Ghana.” In The Economy of Ghana: Ana-lytical Perspectives on Stability, Growth and Poverty, ed. E. Aryeetey and R. Kanbur.Oxford: James Currey.
168 Aryeetey and McKay
7Uganda’s Experience with Operationalizing Pro-Poor Growth,1992 to 2003
John A. Okidi, Sarah Ssewanyana, Lawrence Bategeka, and Fred Muhumuza
The development literature is rich with analytical results that demonstratethe critical role of growth in poverty reduction. But because different groupsof countries manifest different poverty and distributional outcomes,country-specific poverty reduction strategies should be informed by in-depth investigations of the key drivers of poverty-reducing growth. Thisanalysis of poverty-reducing growth in Uganda between 1992 and 2003focuses on the factors that drove the growth process and influenced the dis-tributional outcomes of growth.
The poverty, growth, and inequality outcomes of Uganda’s developmentefforts between 1992 and 2003 can be divided into three periods. The 1992 to1997 period was characterized by high annual macroeconomic growth ratesthat peaked at above 10 percent in 1994/95. The high rates of growth in thisperiod were accompanied by significant poverty reduction and decliningincome inequality. During the 1997 to 2000 period, growth slowed to anaverage of about 5 percent per year. Although the growth generated wassufficient to maintain a downward trend in poverty, the distribution of thebenefits of growth during this period were so skewed that income inequal-ity rose significantly. From 2000 to 2003 growth tapered off. The continuedslowdown in growth, coupled with a worsening of the skewed distributionof the benefits of growth, reversed the downward trend in poverty.
169
170 Okidi, Ssewanyana, Bategeka, and Muhumuza
These poverty, growth, and inequality patterns are interesting manifesta-tions of pro-poor growth, both in the absolute and relative sense. Theunderpinnings of these development outcomes are explored below in refer-ence to several questions. What were the sources of growth in the initialperiod of Uganda’s reforms? What institutional and economic factorsexplain the failure of the initial growth surge to spur sustainable opportuni-ties for future growth and poverty reduction? In particular, how did house-holds respond to the policy of liberalization and private sector–led growthstrategy? In that policy context, what happened to the main tradable com-modities (coffee and cotton) that traditionally formed the cash base of house-holds? What was the contribution of factor market access for broad-basedprivate sector participation in the growth process? By attempting to answerthese questions in the light of faltering poverty reduction in the early 2000s,this chapter investigates the extent to which fundamental building blocks forsustainable poverty-reducing growth were established and institutionalizedduring the 1990s.
Before the 1990s, Uganda suffered political, social, and economic disorder.The economy contracted significantly due to destruction, the absence of sav-ing, physical and human capital flight, and reduced productivity throughdisruption and diversion of public expenditure (Collier and Reinikka 2001).GDP declined by 40 percent from 1971 to 1986, which Collier and Reinikkaestimate to have translated into a 1 percent annual decline of the economy.Annual inflation rose to three digits mainly because the governmentfinanced fiscal deficits through domestic borrowing. Restoration of relativepolitical calm in the second half of the 1980s and the credible signaling ofcommitment to reforms paved the way for an economic recovery that largelytook effect in the early 1990s. The government then pronounced a privatesector–led and export-driven economic growth policy. It stipulated that therole of the state would be limited to guaranteeing macroeconomic stabilityand providing legal and institutional frameworks that would support a liber-alized market economy.
Uganda’s history of economic recovery through commitment to soundeconomic policies, with country-owned initiatives for poverty reduction,provides useful lessons for economies in transition from conflict and from acontrolled economic system to a stable and liberalized policy environment.Uganda’s more recent experience with the challenge of sustaining recovery-based and growth-led poverty reduction provides equally important lessonsfor other countries.
Trends in and patterns of Uganda’s poverty, growth, and inequalityfrom 1992 to 2003 are examined below to illustrate the extent to which thecountry’s growth-led strategies were pro-poor. The chapter also examines
Uganda’s Experience with Operationalizing Pro-Poor Growth, 1992 to 2003 171
the role of traditional and nontraditional growth drivers in enhancing theparticipation of poor people in the growth process.
Growth, Poverty, and Inequality Trends, 1992 to 2003
By the beginning of the 1990s, Uganda had restored relative political calm anddemonstrated commitment to massive reform as a prerequisite for economicrecovery. Consequently, the country attracted substantial donor support foreconomic reforms that aimed to correct macroeconomic imbalances, removeinefficiencies in production and distribution of goods and services, and spurprivate sector–led and export-oriented growth. An important aspect of thereform strategy was trade liberalization through extensive reduction ofnontariff barriers, competitive tendering for government purchasing, and aswitch from export taxation to import taxation (Collier and Reinikka 2001).
Although good policies (along with favorable external conditions) werenecessary for jump-starting the economy in the early to mid-1990s, theywere insufficient for deepening the poverty reduction and growth outcomesof the recovery. Market liberalization in the early 1990s coincided withfavorable external factors that led to rapid poverty reduction and growth.However, once the external environment was no longer so favorable, goodmacroeconomic policies needed to be accompanied by improvements insectoral policies, institutions for economic governance, and the provision ofsafety net mechanisms if the broad-based growth of the first part of thedecade was to be sustained.
Poverty Outcomes of Uganda’s Recovery and Policy Strategies
Analysis of consumption expenditures from national household surveydata shows that the recovery and policy strategies of the 1990s yielded sig-nificant poverty reduction, although it was uneven across sectors andregions (Appleton and others 1999; Appleton and Ssewanyana 2003).Income-poverty headcount declined from 56 percent in 1992 to 34 percent in2000, after which it rose to 38 percent in 2003 (table 7.1).1 However, povertyin Uganda remains a rural phenomenon and most pronounced among cropfarmers. The disproportionate contribution of rural areas to nationalpoverty has remained unchanged at about 96 percent. Regional imbalances,especially between the north and the rest of the country, have persisted.Overall, poverty declined faster in the central and western regions, whichalready had the lowest rates of poverty in 1992. The northern region has thehighest level of poverty and experienced the smallest decline in the 1990s,although between 2000 and 2003 poverty headcount in this region remainedabout the same, while it rose in all other regions.
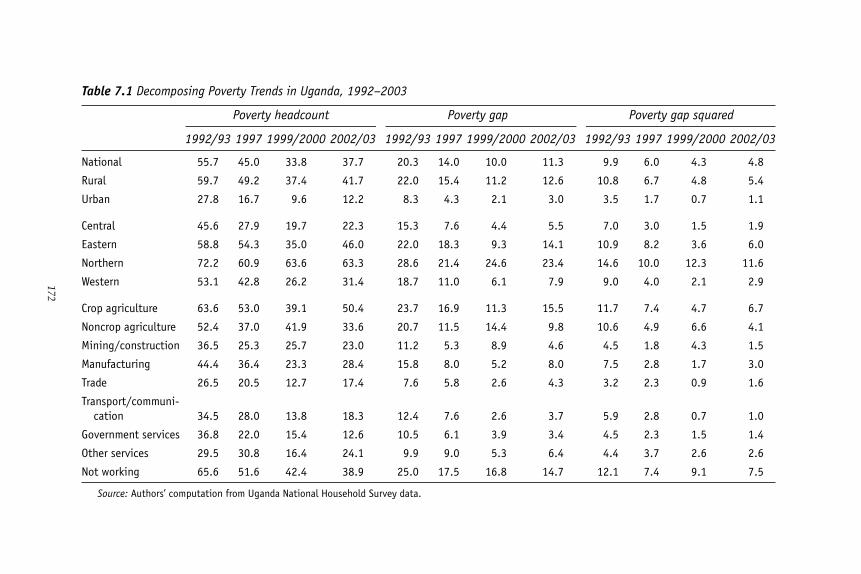
Table 7.1 Decomposing Poverty Trends in Uganda, 1992–2003
Poverty headcount Poverty gap Poverty gap squared
1992/93 1997 1999/2000 2002/03 1992/93 1997 1999/2000 2002/03 1992/93 1997 1999/2000 2002/03
National 55.7 45.0 33.8 37.7 20.3 14.0 10.0 11.3 9.9 6.0 4.3 4.8
Rural 59.7 49.2 37.4 41.7 22.0 15.4 11.2 12.6 10.8 6.7 4.8 5.4
Urban 27.8 16.7 9.6 12.2 8.3 4.3 2.1 3.0 3.5 1.7 0.7 1.1
Central 45.6 27.9 19.7 22.3 15.3 7.6 4.4 5.5 7.0 3.0 1.5 1.9
Eastern 58.8 54.3 35.0 46.0 22.0 18.3 9.3 14.1 10.9 8.2 3.6 6.0
Northern 72.2 60.9 63.6 63.3 28.6 21.4 24.6 23.4 14.6 10.0 12.3 11.6
Western 53.1 42.8 26.2 31.4 18.7 11.0 6.1 7.9 9.0 4.0 2.1 2.9
Crop agriculture 63.6 53.0 39.1 50.4 23.7 16.9 11.3 15.5 11.7 7.4 4.7 6.7
Noncrop agriculture 52.4 37.0 41.9 33.6 20.7 11.5 14.4 9.8 10.6 4.9 6.6 4.1
Mining/construction 36.5 25.3 25.7 23.0 11.2 5.3 8.9 4.6 4.5 1.8 4.3 1.5
Manufacturing 44.4 36.4 23.3 28.4 15.8 8.0 5.2 8.0 7.5 2.8 1.7 3.0
Trade 26.5 20.5 12.7 17.4 7.6 5.8 2.6 4.3 3.2 2.3 0.9 1.6
Transport/communi-cation 34.5 28.0 13.8 18.3 12.4 7.6 2.6 3.7 5.9 2.8 0.7 1.0
Government services 36.8 22.0 15.4 12.6 10.5 6.1 3.9 3.4 4.5 2.3 1.5 1.4
Other services 29.5 30.8 16.4 24.1 9.9 9.0 5.3 6.4 4.4 3.7 2.6 2.6
Not working 65.6 51.6 42.4 38.9 25.0 17.5 16.8 14.7 12.1 7.4 9.1 7.5
Source: Authors’ computation from Uganda National Household Survey data.
172
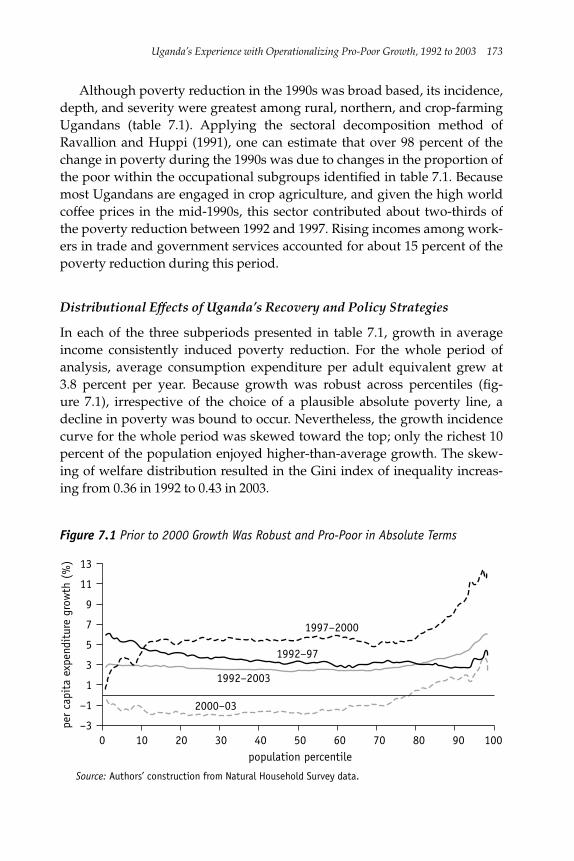
Although poverty reduction in the 1990s was broad based, its incidence,depth, and severity were greatest among rural, northern, and crop-farmingUgandans (table 7.1). Applying the sectoral decomposition method ofRavallion and Huppi (1991), one can estimate that over 98 percent of thechange in poverty during the 1990s was due to changes in the proportion ofthe poor within the occupational subgroups identified in table 7.1. Becausemost Ugandans are engaged in crop agriculture, and given the high worldcoffee prices in the mid-1990s, this sector contributed about two-thirds ofthe poverty reduction between 1992 and 1997. Rising incomes among work-ers in trade and government services accounted for about 15 percent of thepoverty reduction during this period.
Distributional Effects of Uganda’s Recovery and Policy Strategies
In each of the three subperiods presented in table 7.1, growth in averageincome consistently induced poverty reduction. For the whole period ofanalysis, average consumption expenditure per adult equivalent grew at3.8 percent per year. Because growth was robust across percentiles (fig-ure 7.1), irrespective of the choice of a plausible absolute poverty line, adecline in poverty was bound to occur. Nevertheless, the growth incidencecurve for the whole period was skewed toward the top; only the richest 10percent of the population enjoyed higher-than-average growth. The skew-ing of welfare distribution resulted in the Gini index of inequality increas-ing from 0.36 in 1992 to 0.43 in 2003.
Uganda’s Experience with Operationalizing Pro-Poor Growth, 1992 to 2003 173
–1
3
7
–3
1
5
9
13
11
per
capi
ta e
xpen
ditu
re g
row
th (
%)
100 20 30 40 50 60 70 80 90 100population percentile
1997–2000
1992–97
1992–2003
2000–03
Figure 7.1 Prior to 2000 Growth Was Robust and Pro-Poor in Absolute Terms
Source: Authors’ construction from Natural Household Survey data.
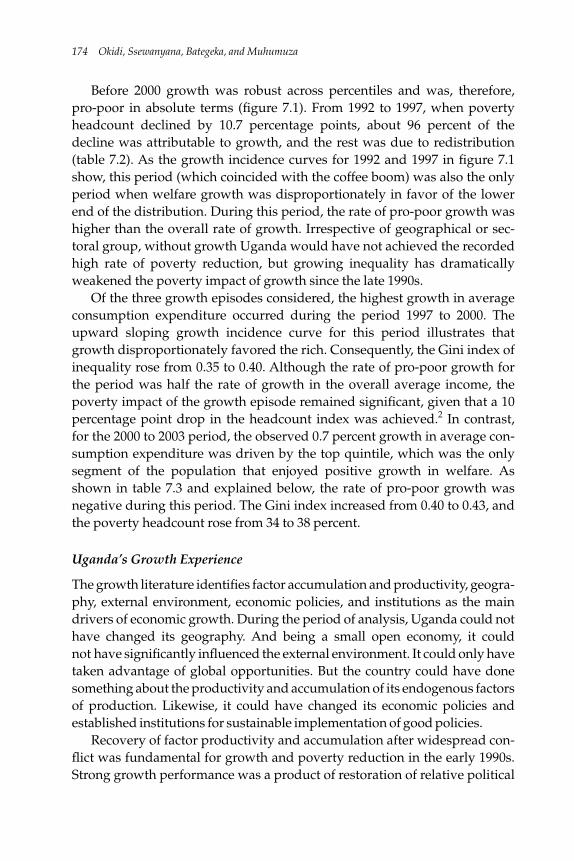
Before 2000 growth was robust across percentiles and was, therefore,pro-poor in absolute terms (figure 7.1). From 1992 to 1997, when povertyheadcount declined by 10.7 percentage points, about 96 percent of thedecline was attributable to growth, and the rest was due to redistribution(table 7.2). As the growth incidence curves for 1992 and 1997 in figure 7.1show, this period (which coincided with the coffee boom) was also the onlyperiod when welfare growth was disproportionately in favor of the lowerend of the distribution. During this period, the rate of pro-poor growth washigher than the overall rate of growth. Irrespective of geographical or sec-toral group, without growth Uganda would have not achieved the recordedhigh rate of poverty reduction, but growing inequality has dramaticallyweakened the poverty impact of growth since the late 1990s.
Of the three growth episodes considered, the highest growth in averageconsumption expenditure occurred during the period 1997 to 2000. Theupward sloping growth incidence curve for this period illustrates thatgrowth disproportionately favored the rich. Consequently, the Gini index ofinequality rose from 0.35 to 0.40. Although the rate of pro-poor growth forthe period was half the rate of growth in the overall average income, thepoverty impact of the growth episode remained significant, given that a 10percentage point drop in the headcount index was achieved.2 In contrast,for the 2000 to 2003 period, the observed 0.7 percent growth in average con-sumption expenditure was driven by the top quintile, which was the onlysegment of the population that enjoyed positive growth in welfare. Asshown in table 7.3 and explained below, the rate of pro-poor growth wasnegative during this period. The Gini index increased from 0.40 to 0.43, andthe poverty headcount rose from 34 to 38 percent.
Uganda’s Growth Experience
The growth literature identifies factor accumulation and productivity, geogra-phy, external environment, economic policies, and institutions as the maindrivers of economic growth. During the period of analysis, Uganda could nothave changed its geography. And being a small open economy, it couldnot have significantly influenced the external environment. It could only havetaken advantage of global opportunities. But the country could have donesomething about the productivity and accumulation of its endogenous factorsof production. Likewise, it could have changed its economic policies andestablished institutions for sustainable implementation of good policies.
Recovery of factor productivity and accumulation after widespread con-flict was fundamental for growth and poverty reduction in the early 1990s.Strong growth performance was a product of restoration of relative political
174 Okidi, Ssewanyana, Bategeka, and Muhumuza
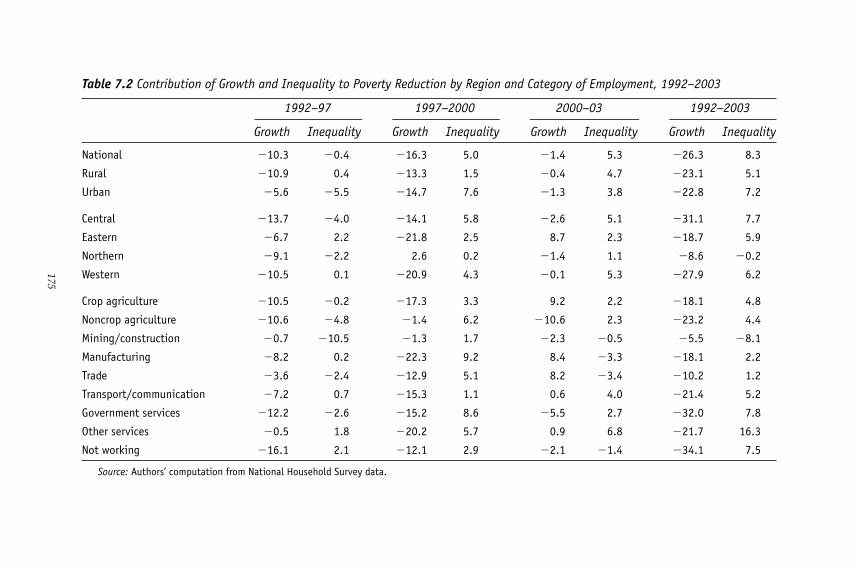
175
Table 7.2 Contribution of Growth and Inequality to Poverty Reduction by Region and Category of Employment, 1992–2003
1992–97 1997–2000 2000–03 1992–2003
Growth Inequality Growth Inequality Growth Inequality Growth Inequality
National �10.3 �0.4 �16.3 5.0 �1.4 5.3 �26.3 8.3
Rural �10.9 0.4 �13.3 1.5 �0.4 4.7 �23.1 5.1
Urban �5.6 �5.5 �14.7 7.6 �1.3 3.8 �22.8 7.2
Central �13.7 �4.0 �14.1 5.8 �2.6 5.1 �31.1 7.7
Eastern �6.7 2.2 �21.8 2.5 8.7 2.3 �18.7 5.9
Northern �9.1 �2.2 2.6 0.2 �1.4 1.1 �8.6 �0.2
Western �10.5 0.1 �20.9 4.3 �0.1 5.3 �27.9 6.2
Crop agriculture �10.5 �0.2 �17.3 3.3 9.2 2.2 �18.1 4.8
Noncrop agriculture �10.6 �4.8 �1.4 6.2 �10.6 2.3 �23.2 4.4
Mining/construction �0.7 �10.5 �1.3 1.7 �2.3 �0.5 �5.5 �8.1
Manufacturing �8.2 0.2 �22.3 9.2 8.4 �3.3 �18.1 2.2
Trade �3.6 �2.4 �12.9 5.1 8.2 �3.4 �10.2 1.2
Transport/communication �7.2 0.7 �15.3 1.1 0.6 4.0 �21.4 5.2
Government services �12.2 �2.6 �15.2 8.6 �5.5 2.7 �32.0 7.8
Other services �0.5 1.8 �20.2 5.7 0.9 6.8 �21.7 16.3
Not working �16.1 2.1 �12.1 2.9 �2.1 �1.4 �34.1 7.5
Source: Authors’ computation from National Household Survey data.
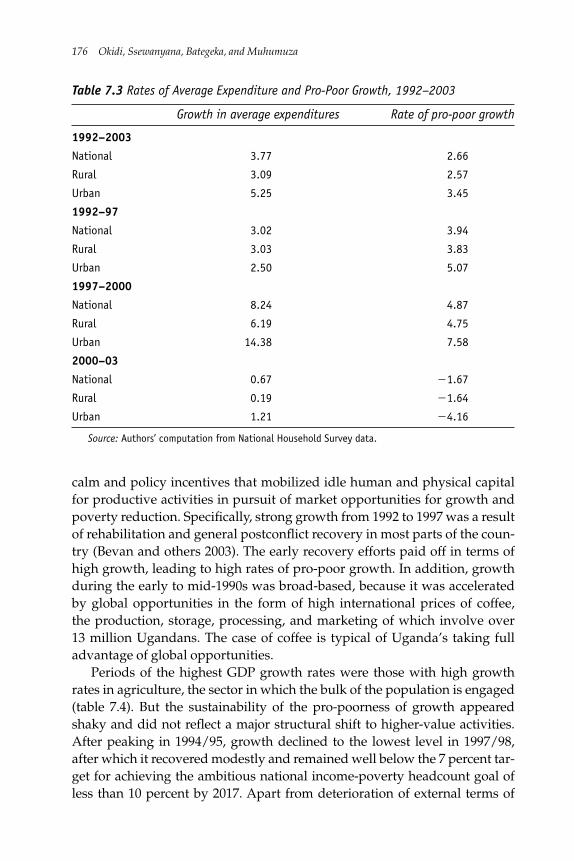
calm and policy incentives that mobilized idle human and physical capitalfor productive activities in pursuit of market opportunities for growth andpoverty reduction. Specifically, strong growth from 1992 to 1997 was a resultof rehabilitation and general postconflict recovery in most parts of the coun-try (Bevan and others 2003). The early recovery efforts paid off in terms ofhigh growth, leading to high rates of pro-poor growth. In addition, growthduring the early to mid-1990s was broad-based, because it was acceleratedby global opportunities in the form of high international prices of coffee,the production, storage, processing, and marketing of which involve over13 million Ugandans. The case of coffee is typical of Uganda’s taking fulladvantage of global opportunities.
Periods of the highest GDP growth rates were those with high growthrates in agriculture, the sector in which the bulk of the population is engaged(table 7.4). But the sustainability of the pro-poorness of growth appearedshaky and did not reflect a major structural shift to higher-value activities.After peaking in 1994/95, growth declined to the lowest level in 1997/98,after which it recovered modestly and remained well below the 7 percent tar-get for achieving the ambitious national income-poverty headcount goal ofless than 10 percent by 2017. Apart from deterioration of external terms of
176 Okidi, Ssewanyana, Bategeka, and Muhumuza
Table 7.3 Rates of Average Expenditure and Pro-Poor Growth, 1992–2003
Growth in average expenditures Rate of pro-poor growth
1992–2003
National 3.77 2.66
Rural 3.09 2.57
Urban 5.25 3.45
1992–97
National 3.02 3.94
Rural 3.03 3.83
Urban 2.50 5.07
1997–2000
National 8.24 4.87
Rural 6.19 4.75
Urban 14.38 7.58
2000–03
National 0.67 �1.67
Rural 0.19 �1.64
Urban 1.21 �4.16
Source: Authors’ computation from National Household Survey data.
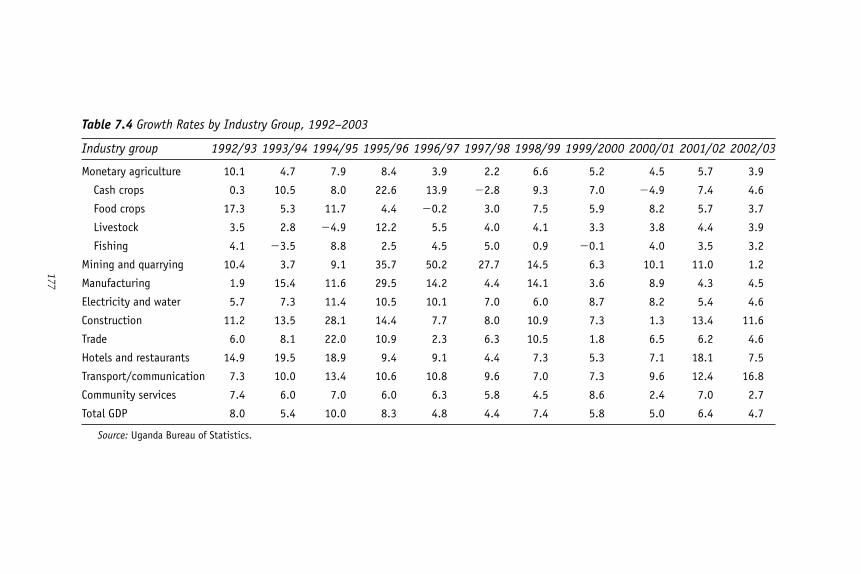
Table 7.4 Growth Rates by Industry Group, 1992–2003
Industry group 1992/93 1993/94 1994/95 1995/96 1996/97 1997/98 1998/99 1999/2000 2000/01 2001/02 2002/03
Monetary agriculture 10.1 4.7 7.9 8.4 3.9 2.2 6.6 5.2 4.5 5.7 3.9
Cash crops 0.3 10.5 8.0 22.6 13.9 �2.8 9.3 7.0 �4.9 7.4 4.6
Food crops 17.3 5.3 11.7 4.4 �0.2 3.0 7.5 5.9 8.2 5.7 3.7
Livestock 3.5 2.8 �4.9 12.2 5.5 4.0 4.1 3.3 3.8 4.4 3.9
Fishing 4.1 �3.5 8.8 2.5 4.5 5.0 0.9 �0.1 4.0 3.5 3.2
Mining and quarrying 10.4 3.7 9.1 35.7 50.2 27.7 14.5 6.3 10.1 11.0 1.2
Manufacturing 1.9 15.4 11.6 29.5 14.2 4.4 14.1 3.6 8.9 4.3 4.5
Electricity and water 5.7 7.3 11.4 10.5 10.1 7.0 6.0 8.7 8.2 5.4 4.6
Construction 11.2 13.5 28.1 14.4 7.7 8.0 10.9 7.3 1.3 13.4 11.6
Trade 6.0 8.1 22.0 10.9 2.3 6.3 10.5 1.8 6.5 6.2 4.6
Hotels and restaurants 14.9 19.5 18.9 9.4 9.1 4.4 7.3 5.3 7.1 18.1 7.5
Transport/communication 7.3 10.0 13.4 10.6 10.8 9.6 7.0 7.3 9.6 12.4 16.8
Community services 7.4 6.0 7.0 6.0 6.3 5.8 4.5 8.6 2.4 7.0 2.7
Total GDP 8.0 5.4 10.0 8.3 4.8 4.4 7.4 5.8 5.0 6.4 4.7
Source: Uganda Bureau of Statistics.
177
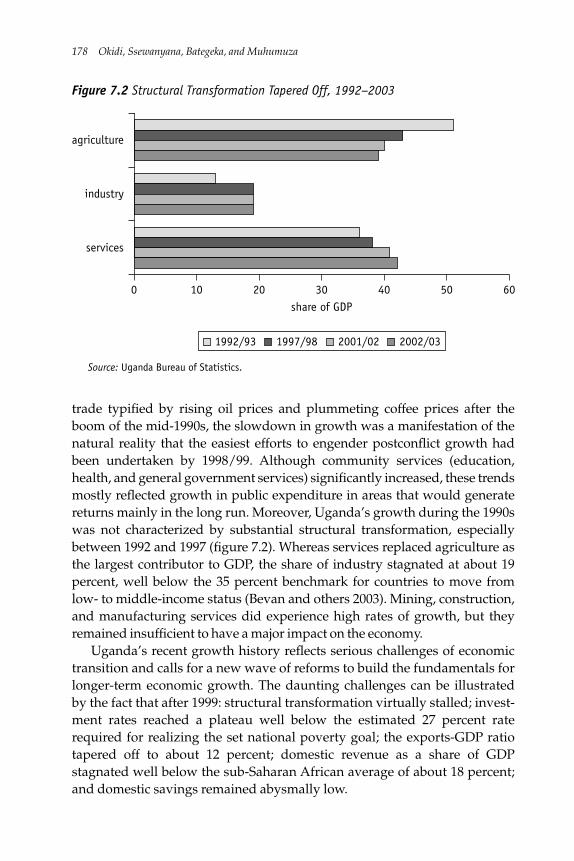
trade typified by rising oil prices and plummeting coffee prices after theboom of the mid-1990s, the slowdown in growth was a manifestation of thenatural reality that the easiest efforts to engender postconflict growth hadbeen undertaken by 1998/99. Although community services (education,health, and general government services) significantly increased, these trendsmostly reflected growth in public expenditure in areas that would generatereturns mainly in the long run. Moreover, Uganda’s growth during the 1990swas not characterized by substantial structural transformation, especiallybetween 1992 and 1997 (figure 7.2). Whereas services replaced agriculture asthe largest contributor to GDP, the share of industry stagnated at about 19percent, well below the 35 percent benchmark for countries to move fromlow- to middle-income status (Bevan and others 2003). Mining, construction,and manufacturing services did experience high rates of growth, but theyremained insufficient to have a major impact on the economy.
Uganda’s recent growth history reflects serious challenges of economictransition and calls for a new wave of reforms to build the fundamentals forlonger-term economic growth. The daunting challenges can be illustratedby the fact that after 1999: structural transformation virtually stalled; invest-ment rates reached a plateau well below the estimated 27 percent raterequired for realizing the set national poverty goal; the exports-GDP ratiotapered off to about 12 percent; domestic revenue as a share of GDPstagnated well below the sub-Saharan African average of about 18 percent;and domestic savings remained abysmally low.
178 Okidi, Ssewanyana, Bategeka, and Muhumuza
services
industry
agriculture
1992/93 1997/98 2001/02 2002/03
0 10 20 30 40 50 60share of GDP
Figure 7.2 Structural Transformation Tapered Off, 1992–2003
Source: Uganda Bureau of Statistics.
Explaining the Poverty Outcomes of Uganda’s Growth Experience
Growth (rather than redistribution) has driven Uganda’s poverty reductionprocess. During the 1990s policy stability, donor commitment, and externalmarket environment were critical for broad-based access to the benefits ofgrowth. But these favorable conditions were insufficient to sustain thedownward trend of poverty. Inadequate institutions and a weak fiscalcommitment to agriculture—the economic mainstay of the majority ofUgandans—reduced the impact of overall average growth on the incomesof the poor. The result was deepening welfare inequality.
The reforms of the early 1990s that corrected macroeconomic imbalancesand removed distortions and inefficiencies in the economy through policyliberalization benefited households tremendously. Some of the greatestimpacts of reforms occurred in the coffee sector following abolition of the cof-fee export tax and liberalization of coffee marketing in 1991/92. In particular,these developments resulted in a sharp increase in the share of farm-gate cof-fee prices in border prices from 30 percent to more than 80 percent (Collierand Reinikka 2001). Coupled with high international coffee prices in the mid-1990s and increased availability of high-yielding varieties, the coffee sectorreform resulted in substantial income growth for the large number of Ugan-dans who participated in coffee production, processing, and marketing.
The massive inflows of foreign aid (at an average of 12 percent of GDP)that funded social sector and infrastructure development increased incomegrowth opportunities and strengthened the government’s capacity todeliver traditional pro-poor growth services. In addition, relative peace,respect for property rights, market liberalization, privatization, incentivesfor private sector–led growth, and the economic opportunities offered byhigh returns to investments in a politically unstable region attracted foreigndirect investment and private remittances from Ugandans in the diaspora.This investment and remittances boosted physical and human capital accu-mulation and enhanced technology transfer that contributed to broad-basedeconomic growth.
But the dividend from the recovery and the initial removal of distortionsand improved economic efficiency was exhausted by 1999. Sustaining highrecovery-related growth became a challenge, as illustrated by the structuralstagnation of the economy. Because growth had been vital to poverty reduc-tion in the 1990s, the slowdown in growth around the turn of the centurynegatively affected poverty reduction. Although growth was still positivefrom 2000 to 2003, the continuous rise in inequality since 1997 eventuallyoutweighed the impact of growth on poverty. Had inequality not increased,poverty would have decreased an additional 8 percentage points for thewhole period of analysis.
Uganda’s Experience with Operationalizing Pro-Poor Growth, 1992 to 2003 179
The reversal of the poverty trend after 1999 can also be explained bysome sectoral patterns in the growth trend. Table 7.4 shows that the sectorsthat experienced the highest average growth rates are those from which rel-atively small proportions of the population earned a living. In general, theseare industrial and service sectors, which were also the main destinations forforeign direct investment and official development assistance. Given thatthese sectors employ people with certain levels of human capital, mostUgandans could not have participated in their growth, because the averagehousehold was headed by someone with only four years of schooling at thebeginning of the growth period.
As noted earlier, table 7.4 shows that periods of high overall growth coin-cided with strong growth performance in agriculture, the sector in which thebulk of the labor force is employed. But on the whole, growth performanceof the agricultural sector has been lower than average. The share of agricul-ture in the national budget has also consistently been below 4 percent.3
Inadequate direct funding of the agricultural sector has inhibited implemen-tation of the Plan for Modernization of Agriculture, an innovative institu-tional framework for addressing supply-and-demand constraints facing thesector. One of the main supply-side challenges in agriculture is crop yielddecrease due to declining soil fertility, low utilization of productivity-enhancing technologies, and poor land management practices (Nkonya andothers 2004; Obwona and Ssewanyana 2004; Pender and others 2004). Foodcrop production may not have kept pace with population growth between1999 and 2003,4 given that consumption of home-produced food (in a largelysubsistence society) fell by around 20 percent per capita (Appleton andSsewanyana 2003).
On the cash crop side, the price of the main agricultural tradable, coffee,fell significantly after the boom of the mid-1990s, indicating that in theabsence of diversification, good policies alone are not sufficient for predom-inantly agricultural households to ward off vulnerability to external shocks.The poor performance of the coffee sector in the second half of the 1990sprompted the government to promote other commodities such as fish, flow-ers, and vanilla for export. Although the fish and flower sectors have per-formed well and compensated foreign exchange losses due to plummetingcoffee prices, they employ only a small fraction of the population, and thustheir success has small direct poverty effects. In the case of vanilla, theinternational price dropped so drastically that during the 2000s farmersbegan neglecting the crop after having invested significantly in it.
In general, the poor performance of the agricultural sector between 1999and 2003 is vividly reflected in the internal terms of trade between the sector
180 Okidi, Ssewanyana, Bategeka, and Muhumuza
on the one hand and industry and services on the other, which deterioratedagainst the former by 20 percent, severely affecting the purchasing power ofthe vast majority of Ugandans. This performance gap prompted a signifi-cant intersectoral shift, especially away from crop agriculture; householdsreporting it as their main economic activity decreased from 68 to 52 percentbetween 1999 and 2003. The shift was facilitated by improvements in infra-structure and market information, especially through mobile telephones.Most of the intersectoral shifts were into self-employment in trade and man-ufacturing, which do not appear to have offered opportunities for escapingpoverty (see table 7.1).
The movement from agricultural to nonagricultural self-employmentnot only reflects low returns in agriculture but also indicates the failure ofthe wage employment sector to absorb the labor released from agriculture(Appleton and Ssewanyana 2003). Whatever labor was absorbed by thewage employment sector might have contributed to depressing wage rates,given that between 1999 and 2003 private sector real wages fell by aboutone-fifth. By contrast, government sector employment, which contractedduring the 1990s, enjoyed a rise in real wages by about one-fifth, contribut-ing to a decrease in the poverty headcount in the sector from 15 to 13 per-cent between 1999 and 2003. Because most of the poor are not employed ingovernment but are self-employed or work in the private sector, the abovehighlighted wage declines and differentials must have contributed to theobserved deepening of inequality and slippage into poverty between 1999and 2003.
Poverty reduction in the 1990s occurred without major progress in jobcreation. The finding that the fastest-growing type of employment duringthis period was nonagricultural self-employment corroborates this argu-ment; government sector employment (the largest sector in wage employ-ment) dwindled over time (World Bank 2005). The limited job creation thataccompanied Uganda’s growth and poverty reduction is also evident in theobservation that although about 45 percent of households are engaged innonagricultural enterprises, only 15 percent of those owning such enter-prises employ any labor at all because family labor is sufficient for theirscale of operation (Deininger and Okidi 2003).
Other factors that have weakened the sustainability of poverty reductioninclude the accumulated effects of insecurity in northern Uganda and inac-cessibility to credit financing. The disproportionate incidence of poverty innorthern Uganda is largely attributed to the 20-year-old civil war, the costof which has been estimated at 3 percent of GDP. Regarding credit, a regula-tory framework has been established for development of financial
Uganda’s Experience with Operationalizing Pro-Poor Growth, 1992 to 2003 181
institutions, but the cost of credit has remained high, at about 30 percent peryear, undermining households’ entrepreneurial efforts to diversify incomesources. The high credit cost is a major problem in Uganda, where no risk-edging mechanisms are available to ward off the devastating welfareimpacts of shocks such as those due to plummeting coffee prices in the1990s and the sharp fall in the price of vanilla in the early 2000s.
Increasing the Participation of Poor People in Growth
Participation of the poor in the growth process can be examined from threeperspectives: traditional drivers of economic growth, political economy andinstitutional factors that influenced growth and poverty reduction, andstate actions aimed at enhancing participation of the poor in the growthprocess. Regarding traditional drivers of growth, the role of policy, factoraccumulation and productivity, and external environment for pro-poorgrowth are important to consider. The discussion below links policy andexternal environments with accumulation and productive deployment ofhousehold assets such as land, labor, and human and physical capital. Italso explores the impact of political economy and institutions on participa-tion of the poor in the growth process. In particular, it analyzes barriers toparticipation arising from political and social relations, rules, regulations,and procedures.
During the 1990s, when Uganda’s economy maintained relatively highaverage growth rates, growth momentum was generated from restorationof political and economic order. Participation in the growth processdepended on households’ capacity to take advantage of the stable macro-economic environment. Government action programs intended to facilitateprivate human and physical capital accumulation and productivity affectedthis capacity. The extent of participation and the benefit of growth variedsignificantly across economic sectors and geographical areas according toability to adjust to or capitalize on the new political economy and institu-tional structures of the 1990s. Because of the variability in participation inthe growth process and the shortcomings of market-driven catch-up mecha-nisms, welfare inequality deepened.
Drivers of Growth and Participation of the Poor in Growth
As noted above, Uganda implemented far-reaching reforms that saw theeconomy grow at impressive average rates during the 1990s into the 2000s.The reforms were characterized by the “Washington Consensus” policy
182 Okidi, Ssewanyana, Bategeka, and Muhumuza
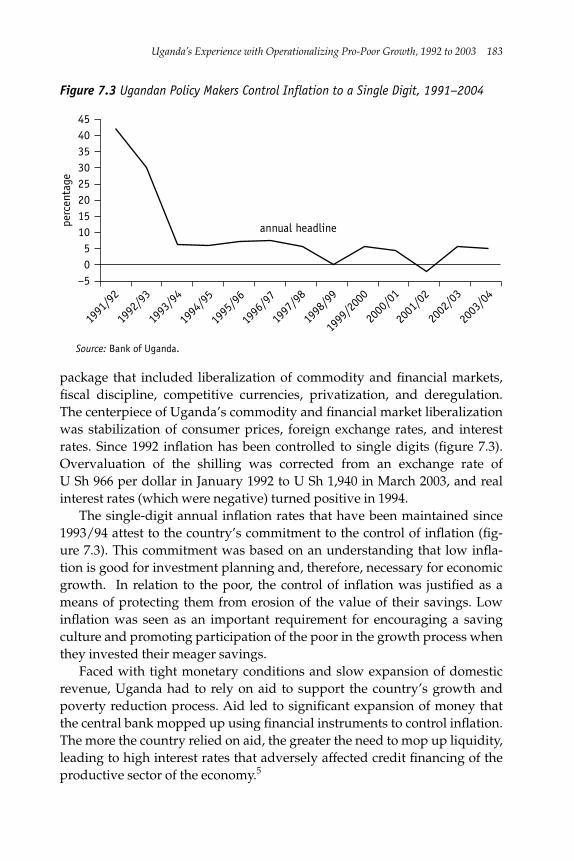
package that included liberalization of commodity and financial markets,fiscal discipline, competitive currencies, privatization, and deregulation.The centerpiece of Uganda’s commodity and financial market liberalizationwas stabilization of consumer prices, foreign exchange rates, and interestrates. Since 1992 inflation has been controlled to single digits (figure 7.3).Overvaluation of the shilling was corrected from an exchange rate of U Sh 966 per dollar in January 1992 to U Sh 1,940 in March 2003, and realinterest rates (which were negative) turned positive in 1994.
The single-digit annual inflation rates that have been maintained since1993/94 attest to the country’s commitment to the control of inflation (fig-ure 7.3). This commitment was based on an understanding that low infla-tion is good for investment planning and, therefore, necessary for economicgrowth. In relation to the poor, the control of inflation was justified as ameans of protecting them from erosion of the value of their savings. Lowinflation was seen as an important requirement for encouraging a savingculture and promoting participation of the poor in the growth process whenthey invested their meager savings.
Faced with tight monetary conditions and slow expansion of domesticrevenue, Uganda had to rely on aid to support the country’s growth andpoverty reduction process. Aid led to significant expansion of money thatthe central bank mopped up using financial instruments to control inflation.The more the country relied on aid, the greater the need to mop up liquidity,leading to high interest rates that adversely affected credit financing of theproductive sector of the economy.5
Uganda’s Experience with Operationalizing Pro-Poor Growth, 1992 to 2003 183
0
20
30
–5
15105
25
35
4540
perc
enta
ge
1991
/92
1992
/93
1993
/94
1994
/95
1995
/96
1996
/97
1997
/98
1998
/99
1999
/200
0
2000
/01
2001
/02
2002
/03
2003
/04
annual headline
Figure 7.3 Ugandan Policy Makers Control Inflation to a Single Digit, 1991–2004
Source: Bank of Uganda.
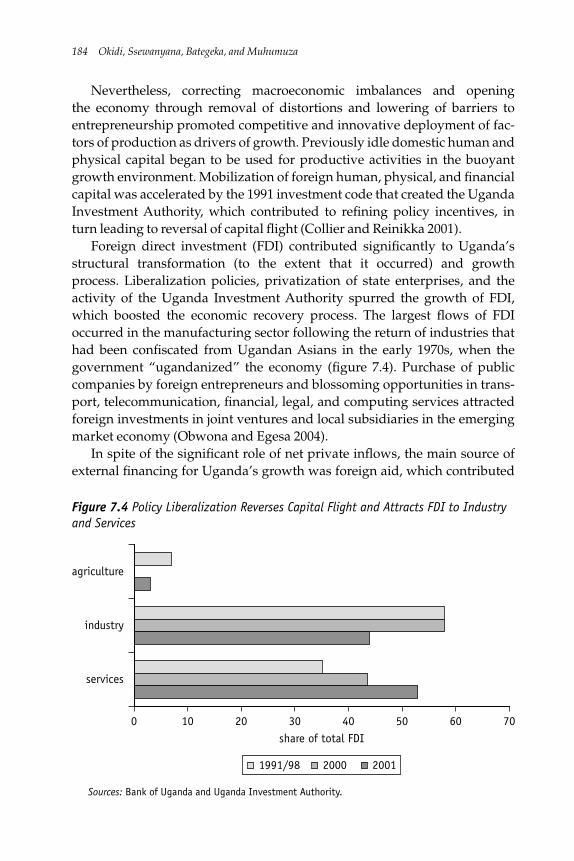
Nevertheless, correcting macroeconomic imbalances and openingthe economy through removal of distortions and lowering of barriers toentrepreneurship promoted competitive and innovative deployment of fac-tors of production as drivers of growth. Previously idle domestic human andphysical capital began to be used for productive activities in the buoyantgrowth environment. Mobilization of foreign human, physical, and financialcapital was accelerated by the 1991 investment code that created the UgandaInvestment Authority, which contributed to refining policy incentives, inturn leading to reversal of capital flight (Collier and Reinikka 2001).
Foreign direct investment (FDI) contributed significantly to Uganda’sstructural transformation (to the extent that it occurred) and growthprocess. Liberalization policies, privatization of state enterprises, and theactivity of the Uganda Investment Authority spurred the growth of FDI,which boosted the economic recovery process. The largest flows of FDIoccurred in the manufacturing sector following the return of industries thathad been confiscated from Ugandan Asians in the early 1970s, when thegovernment “ugandanized” the economy (figure 7.4). Purchase of publiccompanies by foreign entrepreneurs and blossoming opportunities in trans-port, telecommunication, financial, legal, and computing services attractedforeign investments in joint ventures and local subsidiaries in the emergingmarket economy (Obwona and Egesa 2004).
In spite of the significant role of net private inflows, the main source ofexternal financing for Uganda’s growth was foreign aid, which contributed
184 Okidi, Ssewanyana, Bategeka, and Muhumuza
services
industry
agriculture
1991/98 2000 2001
0 10 20 30 40 50 7060share of total FDI
Figure 7.4 Policy Liberalization Reverses Capital Flight and Attracts FDI to Industryand Services
Sources: Bank of Uganda and Uganda Investment Authority.
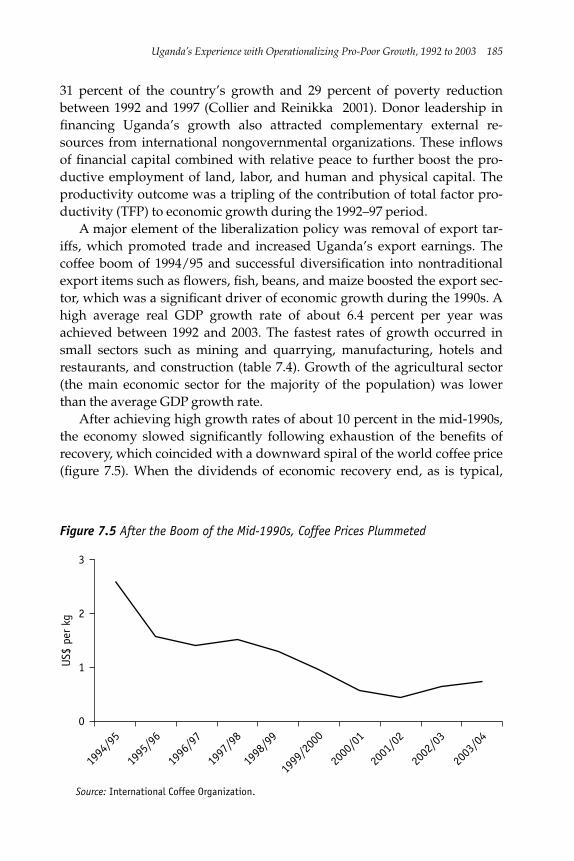
31 percent of the country’s growth and 29 percent of poverty reductionbetween 1992 and 1997 (Collier and Reinikka 2001). Donor leadership infinancing Uganda’s growth also attracted complementary external re-sources from international nongovernmental organizations. These inflowsof financial capital combined with relative peace to further boost the pro-ductive employment of land, labor, and human and physical capital. Theproductivity outcome was a tripling of the contribution of total factor pro-ductivity (TFP) to economic growth during the 1992–97 period.
A major element of the liberalization policy was removal of export tar-iffs, which promoted trade and increased Uganda’s export earnings. Thecoffee boom of 1994/95 and successful diversification into nontraditionalexport items such as flowers, fish, beans, and maize boosted the export sec-tor, which was a significant driver of economic growth during the 1990s. Ahigh average real GDP growth rate of about 6.4 percent per year wasachieved between 1992 and 2003. The fastest rates of growth occurred insmall sectors such as mining and quarrying, manufacturing, hotels andrestaurants, and construction (table 7.4). Growth of the agricultural sector(the main economic sector for the majority of the population) was lowerthan the average GDP growth rate.
After achieving high growth rates of about 10 percent in the mid-1990s,the economy slowed significantly following exhaustion of the benefits ofrecovery, which coincided with a downward spiral of the world coffee price(figure 7.5). When the dividends of economic recovery end, as is typical,
Uganda’s Experience with Operationalizing Pro-Poor Growth, 1992 to 2003 185
Source: International Coffee Organization.
2
0
1
3
US$
per
kg
1994
/95
1995
/96
1996
/97
1997
/98
1998
/99
1999
/200
0
2000
/01
2001
/02
2002
/03
2003
/04
Figure 7.5 After the Boom of the Mid-1990s, Coffee Prices Plummeted
countries must meet the challenge of sustaining normal growth throughincreased investment rates and continued export growth and diversification,which ought to be underpinned by increased efficiency in the employmentof private and public capital (Bevan and others 2003; Collier and Reinikka2001). In the long run, growth can be sustained if the return to capital doesnot diminish as economies develop (Lucas 1988; Rebelo 1991; Romer 1986).Maintaining positive returns to capital requires the economy to undergostructural transformation and to remain dynamic so that capital flows fromlow- to high-return activities.
The rate of growth of Uganda’s agricultural sector has been slower thanoverall average growth, raising concern about the lack of political commit-ment to agriculture as the starting point for long-term development. With-out this commitment, the sector may not serve as an engine for long-termstructural transformation. Although GDP shares of monetary and nonmon-etary agriculture declined during the 1990s, they did so not as a result ofimproved agricultural earnings’ financing diversification into other sectorswith higher returns to labor and human capital. The shares declinedbecause of (1) structural transformation that saw the retreat of the state fromactive participation in the sector without corresponding advance of the pri-vate sector, (2) falling productivity caused by declining soil fertility, (3) lim-ited use of fertilizers, and (4) lack of effective agricultural advisory services.
The agricultural sector’s sluggish performance suggests that had politicaland fiscal commitment to agriculture been at the level given to social servicesduring the 1990s, growth would have been higher and poverty reductionmuch greater. In brief, if policies and incentive structures do not cause fastgrowth in sectors that provide livelihoods to the majority of the people, over-all growth is unlikely to have a sustained poverty-reducing impact, in whichcase its pro-poorness (both in absolute and relative terms) diminishes.
Because the majority of the population is engaged in agriculture, andmost poor people hold their assets in the form of land (Deininger and Okidi2003), security of land rights is fundamentally important for growing out ofpoverty. Although the poor have access to land, most of them hardly ownthe land they use. When they have a claim on land, they invariably have noregistered interest in the land.
Uganda has a complex history of land tenure that features periodic dis-ruptions in land market development. At independence, the colonial powergave both occupied and unoccupied land to a few notables, especially in thecentral and southern parts of the country (which came to be known as mailoland). Occupants of mailo land became squatters with use rights thatdepended primarily on the tenant-landlord relationship.
186 Okidi, Ssewanyana, Bategeka, and Muhumuza
The 1998 Land Act (the prevailing land law) seeks to protect and enshrinerights of squatters, de facto tenants, refugees, absentee landowners, andwomen in the land law. The act gives bona fide tenancy rights to currentoccupants, making it easy for them to register the land in their names, hencemaking the land candidate collateral for bank loans. However, the act alsorequires that any transactions involving family land must have the consentof the spouse (or the rest of the communal members in the case of land regis-tered under customary tenure). The transaction costs of enforcing thisrequirement has made land a less attractive form of collateral for loans.
The 1998 Land Act also creates land regulatory bodies such as districtland boards, district land tribunals, and parish land committees. Butbecause the Land Act in general has been viewed as too expensive to befully operationalized, not all these bodies have been instituted. At the sametime, existing mechanisms for land conflict resolution, such as courts ofelders and village councils, were rendered illegal by the new law. Conse-quently, conflicts and complexities in land access and ownership have in-creased, counteracting the key objectives of the law to strengthen land rights,minimize conflicts, and increase land access for productive activities.
Regarding human capital, significant growth was registered. Between1992 and 2003, the proportion of poor household heads and nonpoor house-hold heads with no formal education declined from 34 to 27 percent andfrom 21 to 12 percent, respectively. The Universal Primary Education pro-gram, in place since 1997, is expected to maintain this trend. Nevertheless,the program has not achieved some objectives such as delivery of qualityeducation for all and equity in access to public education resources. Theshortfall in performance is due to problems with curriculum design, inade-quate funding, insufficient supervision and inspection of schools, and ineffi-ciency in the management of school grants.
Although the proportion of household heads without formal educationcontinues to decline, about 55 percent of these individuals have not attainededucation above the primary level. Because human capital accumulation iscritical for participation in long-run growth, its slow pace among thepoor will, in turn, slow down the participation of the poor in future human-capital intensive growth opportunities. Notably, access to secondaryeducation by the poor was on the decline throughout the 1990s and early2000s. Because the impact of education on household income growth isnondecreasing (Deininger and Okidi 2003), inequality in access to highereducation will certainly perpetuate welfare inequality and remain a majorconstraint to poor households’ exploitation of market-driven opportunitiesfor participation in future growth. Okidi and McKay (2003) illustrate this
Uganda’s Experience with Operationalizing Pro-Poor Growth, 1992 to 2003 187
reality with evidence of poor households’ intergenerational transmission ofpoverty through perpetually low levels of education.
As in the case of access to primary education, Uganda has removed userfees from government health units to improve poor people’s health so thatthey can work and diversify their incomes. But the Uganda ParticipatoryPoverty Assessment reveals that communities have noted a deterioration inquality. Household survey data show that the health status of Ugandanswas quite poor during the period of analysis. Deininger and Okidi (2003)find that the number of days lost to illness in a month by the average house-hold increased from 8 to 12 between 1992 and 2000 and that 23 percent ofhouseholds lost a family member in the 15-to-45 age group during the1990s. The infant mortality rate increased from 81 to 88 per 1,000 live birthsbetween 1992 and 2000.
Although Uganda has decreased the spread of HIV/AIDS, it cannotboast of a similar level of progress with respect to malaria, which accountedfor about 80 percent of all illnesses reported during the 1990s. The impor-tance of good health for participation in growth has been illustrated byDeininger and Okidi (2003), who estimate that the average income of ahousehold affected by health problems in 1992 grew 1.8 percentage pointsless than the income of a household without such problems.
Even if access to basic education and health services is improved, theabsence of financial resources may keep the poor from increasing the pro-ductivity of their most abundant factors of production, land and labor. Thegovernment implemented financial sector reforms with the objectives ofstrengthening the country’s financial system and realizing substantial finan-cial depth. The reform regulations resulted in privatization of five banksand the main commercial bank owned by the government. The consequencewas concentration of strong financial institutions in urban areas; rural areaswere left grossly underbanked.
Microfinance institutions mushroomed in rural areas to fill the void infinancial service delivery. But these institutions charge exorbitant lendinginterest rates because they do not take deposits and therefore have to bor-row money from the established commercial banks (at about a 16 percentrate of interest) for lending to their clients. The costs of transacting smallcredits to small and largely informal household enterprises and the risksassociated with it dictate that microfinance institutions have to charge veryhigh interest rates, at about 30 to 36 percent per year. Lack of credit financ-ing and the current structure of microfinance institutions have hindered thepoor in seizing market opportunities for income growth.
Another factor constraining the participation of poor Ugandans ingrowth is lack of electricity. The disparity between rural and urban areas in
188 Okidi, Ssewanyana, Bategeka, and Muhumuza
access to electricity is stark: in 2003 more than 90 percent of urban house-holds but only 13 percent of rural households lived in communities withelectricity. How important is electricity to households’ economic growth?During the 1990s, households with access to electricity experienced incomegrowth 3.5 percentage points higher than that of households without suchaccess (Deininger and Okidi 2003). Although the supply of educated work-ers is expanding, limited availability of electricity could severely constraingeneration of better-paying jobs.
Irrespective of the availability of land, labor, and physical and humancapital, participation in growth will be stifled unless people are guaranteedsecurity of life and property. Panel data show that in the early 1990s civilstrife in northern Uganda significantly curtailed income growth in subse-quent periods by about 5 percentage points (Deininger and Okidi 2003). Toaddress economic imbalances associated with the cost of the war, the gov-ernment created a social fund for the region. But insurgency has under-mined the fund’s objective of enhancing the participation of the victims ofwar in the growth process. The most inhibiting factor in this regard has beenthe government’s program to move people from their land to camps withthe intention of reducing their vulnerability to rebel attacks. The displacedpeasants cannot participate in the growth process, because they cannotaccess their most valuable resource, land.
Political Economy, Institutions, and Barriers to Participation
When the National Resistance Movement ascended to power through anarms struggle, its leadership shunned market liberalization and pronounceda mixed economic system as the new policy direction of Uganda. Bartertrade arrangements were made, mainly with formerly Eastern Bloc countriesto address foreign exchange shortages. But because the economy remainedin the doldrums, the government eventually abandoned the socialist strat-egy in favor of programs supported by Bretton Woods institutions.
At the beginning of the 1990s, government institutions for formulationand implementation of the numerous policy reforms necessary for recoveryprograms were very weak. Priority was given to strengthening the Ministryof Finance, Planning and Economic Development because of its importancein designing, implementing, monitoring, and evaluating the recovery pro-cess. After capacity was built in the finance ministry, sectoral plans orprograms necessary for implementing and sustaining various facets of eco-nomic reform programs could not be delegated to the respective line min-istries, because they were considered weak. This situation led to creation ofparallel program secretariats within the finance ministry—in some cases, at
Uganda’s Experience with Operationalizing Pro-Poor Growth, 1992 to 2003 189
the displeasure of the line ministries that would traditionally discharge theresponsibilities of the secretariat.
Concentration of key policy initiatives in the finance ministry appearedto facilitate coordination, monitoring, and evaluation in a sectorwidedevelopment context, but the concerns of other line ministries about theownership of such program initiatives did not help the initiatives’ coun-trywide implementation. The inability of the finance ministry to step in,outside of its traditional area of competence, compounded the challengeof implementing well-conceived policy programs in a sustainable fashion.The main policy programs housed in the finance ministry are the Plan forModernization of Agriculture, which is aimed at transforming the peasantfarming system into a commercially oriented system; the Medium-TermCompetitiveness Strategy, which is aimed at identifying and alleviatingconstraints to private sector leadership in Uganda’s growth; and theStrategic Exports Interventions Program, which originally identifiedspecific traditional export commodities for aggressive promotion forvalue addition.
An institutional reform for facilitating broad-based policy programimplementation was governance decentralization, which was primarily ini-tiated to improve the efficiency and quality of social services delivery.Enactment of the Local Government Act in 1997 marked the beginning ofdevolution of political power to local governments and, with it, the powerto manage the development process, including public finance at the localgovernment level. But because of local governments’ limited capacities toplan, implement, and monitor programs, decentralization fell short ofexpectations. Indeed, inefficiencies were decentralized and, therefore, repli-cated. Furthermore, decentralization and creation of new political districtsdid not bring services closer to people but became a means for job creation.From the mid-1990s to 2003 the number of districts grew from 35 to 56,tremendously increasing public administration costs and limiting the avail-ability of resources for development activities.
To complement government’s capacities and to pursue privatesector–led development, the country embraced the principle ofprivate–public partnership. But by the mid-1990s, it became apparent thatthe emerging private–public partnerships did not honor segregation of pri-vate actors and public actors. Government officials were the key domesticactors in the private sector. In the late 1990s various revelations of corrup-tion at all levels of government started to surface. Nontraditional determi-nants of private sector growth, such as personal interest, personal favors,unfair regulations, and various forms of corruption, began to adversely
190 Okidi, Ssewanyana, Bategeka, and Muhumuza
affect implementation of policy programs, resulting in marginalization inthe growth process and deepening of inequality.
Government interference with the free-market mechanism in determin-ing allocation of opportunities and participation in the growth process hasoccurred in several forms, including the choosing of winners. A good exam-ple is the addition of the garment industry under the U.S. government ini-tiative to promote trade with Africa: the African Growth Opportunity Act(AGOA). Because the garment industry was not part of Uganda’s originalexports interventions program, it had to be brought into the medium-termexpenditure framework through ex post budget reallocation (Bevan andothers 2003). Most important, the intervention was firm-specific to supportthe participation of a particular investor in the AGOA initiative. Such pri-vate bilateral arrangements are likely to induce or exacerbate a lobbyingand rent-seeking culture, displacing or delaying emergence of a properprofit-seeking entrepreneurial culture (Bevan and others 2003). In brief, atransparent and systematic institutional mechanism and incentive structurefor participation in growth opportunities, such as those introduced by theAGOA initiatives, are lacking. Where they exist, they are subject to individ-ual or firm-specific policy reversal.
In the agricultural sector, aside from the government’s investment inareas that support agriculture, the main agency for private-public partner-ship was National Agricultural Advisory Services. Under this program, pri-vate provision of extension services operates alongside related governmentservices. In additional to limited budgetary provision for implementation,the program faces the challenge of inducing farmers’ demand for advisoryservices. The assumption of government is that a communal spirit moti-vates farmers to form groups that demand certain services (from privateproviders) for government financing.
With regard to the traditional tradable crops, coffee and cotton,private–public partnerships had mixed results in translating policy liberal-ization into benefits to producers. The results were positive in the case ofcoffee. Coffee trees were largely in place and simply needed additional labortime to respond to revamped market opportunities. Most important, the cof-fee sector’s liberalization coincided with the international price increases ofthe mid-1990s. Farmers were able to reap an increased fraction of the worldmarket price of coffee, and rising international prices motivated middlemen.The private–public partnership enhanced the participation of coffee farmersin the growth surge of the 1990s.
In the case of cotton, a sufficient response to incentives for increasing cot-ton production would have necessitated reallocation of land away from
Uganda’s Experience with Operationalizing Pro-Poor Growth, 1992 to 2003 191
some nontraditional cash crops that had replaced cotton. On the interna-tional market, the price of cotton was steady during the 1990s, meaning thatfarmers could be attracted by the extra farm-gate price margin due to liber-alization but that middlemen had no global market surge of which to takeadvantage. Furthermore, the cotton sector generally did not respond well topolicy reforms because of low incentives for private sector agents to supplyseeds and to invest in revamping cotton-ginning facilities. The governmentnot only withdrew from cotton input supply and produce marketing butalso dismantled farmers’ cooperatives that had functioned well during the1960s and early 1970s. The cotton sector experience is a classic case of statewithdrawal from productive activities without sufficient private sectoradvance into the activities.
In brief, liberalization increased farm-gate prices of commodities, butremoval of subsidies and other forms of state support to agriculture and thecollapse of cooperatives raised input prices and marketing costs. In a nut-shell, the agricultural sector has not successfully adjusted to liberalization-related institutional restructuring. Incentives to invest in the sector have,therefore, remained low.
Lessons from Uganda’s Pro-Poor Growth Experience
Uganda’s pro-poor growth experience began with a period of high rates ofpro-poor growth resulting from high average growth rates and decliningincome inequality. This was followed by a period of accelerated pro-poorgrowth rates and high average growth rates accompanied by risinginequality. Lastly, there was a period of significantly slowed average growthand large increases in inequality, leading to negative rates of pro-poor growth.
In a stable macroeconomic environment, accelerated pro-poor growthcould result from (1) consistently and patiently investing in people andphysical infrastructure, (2) strengthening institutions to increase the effi-ciency and effectiveness of public expenditure, (3) pursuing policies thatensure efficient links to international markets for commodities produced bythe poor, (4) increasing access to key factors of production such as credit,and (5) investing in safeguarding the poor from the adverse effects of mar-ket liberalization.
Uganda’s experience shows that despite the existence of good policies andprograms, translation of these policies into desired outcomes can be under-mined by practical political economy inconsistencies and institutional weak-nesses, leading to economic slowdown. When this phenomenon occurred,welfare inequality deteriorated, and poverty eventually began to increase.
192 Okidi, Ssewanyana, Bategeka, and Muhumuza
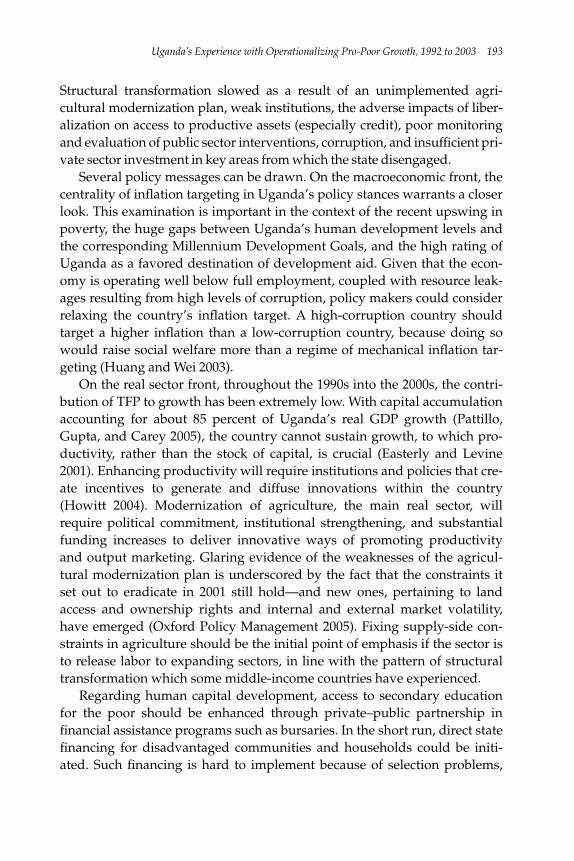
Structural transformation slowed as a result of an unimplemented agri-cultural modernization plan, weak institutions, the adverse impacts of liber-alization on access to productive assets (especially credit), poor monitoringand evaluation of public sector interventions, corruption, and insufficient pri-vate sector investment in key areas from which the state disengaged.
Several policy messages can be drawn. On the macroeconomic front, thecentrality of inflation targeting in Uganda’s policy stances warrants a closerlook. This examination is important in the context of the recent upswing inpoverty, the huge gaps between Uganda’s human development levels andthe corresponding Millennium Development Goals, and the high rating ofUganda as a favored destination of development aid. Given that the econ-omy is operating well below full employment, coupled with resource leak-ages resulting from high levels of corruption, policy makers could considerrelaxing the country’s inflation target. A high-corruption country shouldtarget a higher inflation than a low-corruption country, because doing sowould raise social welfare more than a regime of mechanical inflation tar-geting (Huang and Wei 2003).
On the real sector front, throughout the 1990s into the 2000s, the contri-bution of TFP to growth has been extremely low. With capital accumulationaccounting for about 85 percent of Uganda’s real GDP growth (Pattillo,Gupta, and Carey 2005), the country cannot sustain growth, to which pro-ductivity, rather than the stock of capital, is crucial (Easterly and Levine2001). Enhancing productivity will require institutions and policies that cre-ate incentives to generate and diffuse innovations within the country(Howitt 2004). Modernization of agriculture, the main real sector, willrequire political commitment, institutional strengthening, and substantialfunding increases to deliver innovative ways of promoting productivityand output marketing. Glaring evidence of the weaknesses of the agricul-tural modernization plan is underscored by the fact that the constraints itset out to eradicate in 2001 still hold—and new ones, pertaining to landaccess and ownership rights and internal and external market volatility,have emerged (Oxford Policy Management 2005). Fixing supply-side con-straints in agriculture should be the initial point of emphasis if the sector isto release labor to expanding sectors, in line with the pattern of structuraltransformation which some middle-income countries have experienced.
Regarding human capital development, access to secondary educationfor the poor should be enhanced through private–public partnership infinancial assistance programs such as bursaries. In the short run, direct statefinancing for disadvantaged communities and households could be initi-ated. Such financing is hard to implement because of selection problems,
Uganda’s Experience with Operationalizing Pro-Poor Growth, 1992 to 2003 193
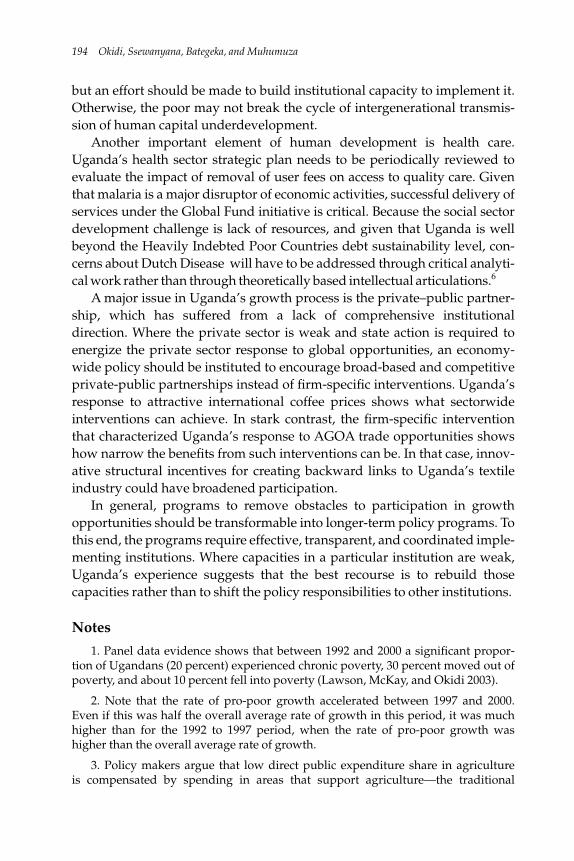
but an effort should be made to build institutional capacity to implement it.Otherwise, the poor may not break the cycle of intergenerational transmis-sion of human capital underdevelopment.
Another important element of human development is health care.Uganda’s health sector strategic plan needs to be periodically reviewed toevaluate the impact of removal of user fees on access to quality care. Giventhat malaria is a major disruptor of economic activities, successful delivery ofservices under the Global Fund initiative is critical. Because the social sectordevelopment challenge is lack of resources, and given that Uganda is wellbeyond the Heavily Indebted Poor Countries debt sustainability level, con-cerns about Dutch Disease will have to be addressed through critical analyti-cal work rather than through theoretically based intellectual articulations.6
A major issue in Uganda’s growth process is the private–public partner-ship, which has suffered from a lack of comprehensive institutionaldirection. Where the private sector is weak and state action is required toenergize the private sector response to global opportunities, an economy-wide policy should be instituted to encourage broad-based and competitiveprivate-public partnerships instead of firm-specific interventions. Uganda’sresponse to attractive international coffee prices shows what sectorwideinterventions can achieve. In stark contrast, the firm-specific interventionthat characterized Uganda’s response to AGOA trade opportunities showshow narrow the benefits from such interventions can be. In that case, innov-ative structural incentives for creating backward links to Uganda’s textileindustry could have broadened participation.
In general, programs to remove obstacles to participation in growthopportunities should be transformable into longer-term policy programs. Tothis end, the programs require effective, transparent, and coordinated imple-menting institutions. Where capacities in a particular institution are weak,Uganda’s experience suggests that the best recourse is to rebuild thosecapacities rather than to shift the policy responsibilities to other institutions.
Notes
1. Panel data evidence shows that between 1992 and 2000 a significant propor-tion of Ugandans (20 percent) experienced chronic poverty, 30 percent moved out ofpoverty, and about 10 percent fell into poverty (Lawson, McKay, and Okidi 2003).
2. Note that the rate of pro-poor growth accelerated between 1997 and 2000.Even if this was half the overall average rate of growth in this period, it was muchhigher than for the 1992 to 1997 period, when the rate of pro-poor growth washigher than the overall average rate of growth.
3. Policy makers argue that low direct public expenditure share in agricultureis compensated by spending in areas that support agriculture—the traditional
194 Okidi, Ssewanyana, Bategeka, and Muhumuza
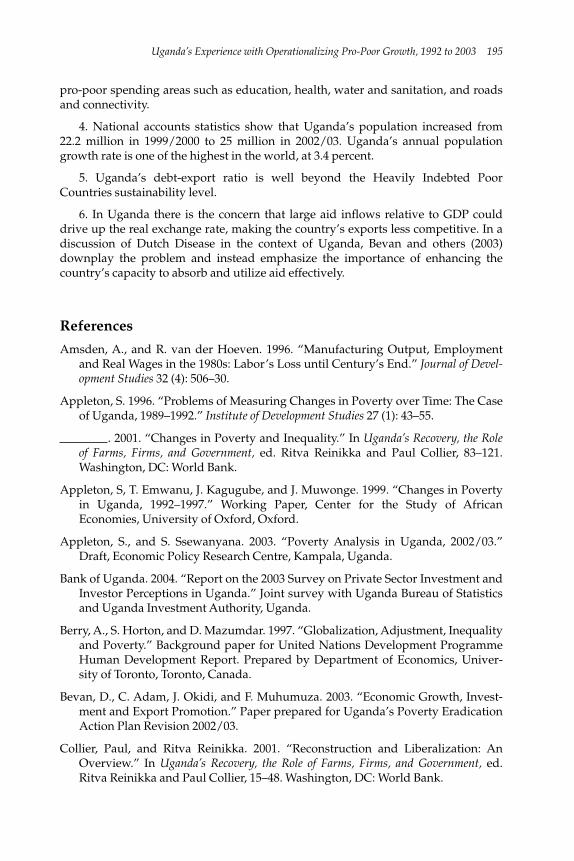
pro-poor spending areas such as education, health, water and sanitation, and roadsand connectivity.
4. National accounts statistics show that Uganda’s population increased from22.2 million in 1999/2000 to 25 million in 2002/03. Uganda’s annual populationgrowth rate is one of the highest in the world, at 3.4 percent.
5. Uganda’s debt-export ratio is well beyond the Heavily Indebted PoorCountries sustainability level.
6. In Uganda there is the concern that large aid inflows relative to GDP coulddrive up the real exchange rate, making the country’s exports less competitive. In adiscussion of Dutch Disease in the context of Uganda, Bevan and others (2003)downplay the problem and instead emphasize the importance of enhancing thecountry’s capacity to absorb and utilize aid effectively.
References
Amsden, A., and R. van der Hoeven. 1996. “Manufacturing Output, Employmentand Real Wages in the 1980s: Labor’s Loss until Century’s End.” Journal of Devel-opment Studies 32 (4): 506–30.
Appleton, S. 1996. “Problems of Measuring Changes in Poverty over Time: The Caseof Uganda, 1989–1992.” Institute of Development Studies 27 (1): 43–55.
. 2001. “Changes in Poverty and Inequality.” In Uganda’s Recovery, the Roleof Farms, Firms, and Government, ed. Ritva Reinikka and Paul Collier, 83–121.Washington, DC: World Bank.
Appleton, S, T. Emwanu, J. Kagugube, and J. Muwonge. 1999. “Changes in Povertyin Uganda, 1992–1997.” Working Paper, Center for the Study of AfricanEconomies, University of Oxford, Oxford.
Appleton, S., and S. Ssewanyana. 2003. “Poverty Analysis in Uganda, 2002/03.”Draft, Economic Policy Research Centre, Kampala, Uganda.
Bank of Uganda. 2004. “Report on the 2003 Survey on Private Sector Investment andInvestor Perceptions in Uganda.” Joint survey with Uganda Bureau of Statisticsand Uganda Investment Authority, Uganda.
Berry, A., S. Horton, and D. Mazumdar. 1997. “Globalization, Adjustment, Inequalityand Poverty.” Background paper for United Nations Development ProgrammeHuman Development Report. Prepared by Department of Economics, Univer-sity of Toronto, Toronto, Canada.
Bevan, D., C. Adam, J. Okidi, and F. Muhumuza. 2003. “Economic Growth, Invest-ment and Export Promotion.” Paper prepared for Uganda’s Poverty EradicationAction Plan Revision 2002/03.
Collier, Paul, and Ritva Reinikka. 2001. “Reconstruction and Liberalization: AnOverview.” In Uganda’s Recovery, the Role of Farms, Firms, and Government, ed.Ritva Reinikka and Paul Collier, 15–48. Washington, DC: World Bank.
Uganda’s Experience with Operationalizing Pro-Poor Growth, 1992 to 2003 195
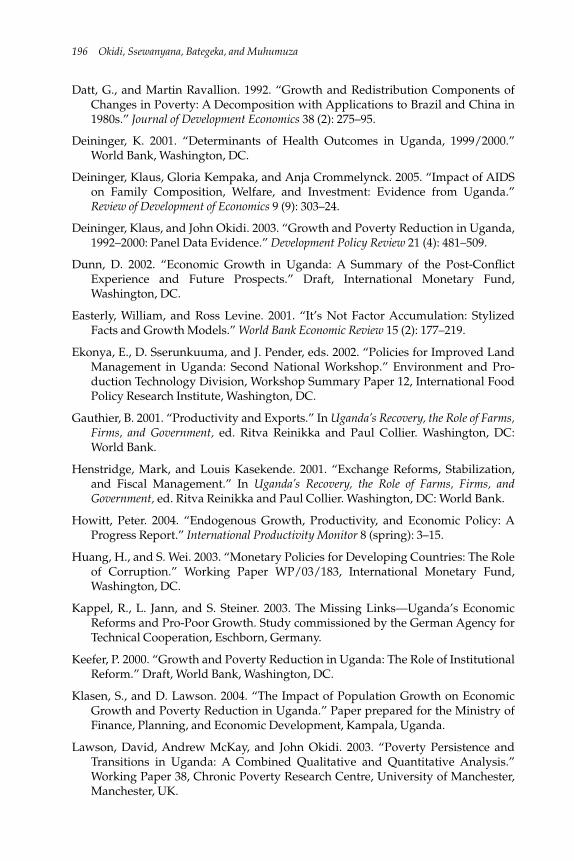
Datt, G., and Martin Ravallion. 1992. “Growth and Redistribution Components ofChanges in Poverty: A Decomposition with Applications to Brazil and China in1980s.” Journal of Development Economics 38 (2): 275–95.
Deininger, K. 2001. “Determinants of Health Outcomes in Uganda, 1999/2000.”World Bank, Washington, DC.
Deininger, Klaus, Gloria Kempaka, and Anja Crommelynck. 2005. “Impact of AIDSon Family Composition, Welfare, and Investment: Evidence from Uganda.”Review of Development of Economics 9 (9): 303–24.
Deininger, Klaus, and John Okidi. 2003. “Growth and Poverty Reduction in Uganda,1992–2000: Panel Data Evidence.” Development Policy Review 21 (4): 481–509.
Dunn, D. 2002. “Economic Growth in Uganda: A Summary of the Post-ConflictExperience and Future Prospects.” Draft, International Monetary Fund,Washington, DC.
Easterly, William, and Ross Levine. 2001. “It’s Not Factor Accumulation: StylizedFacts and Growth Models.” World Bank Economic Review 15 (2): 177–219.
Ekonya, E., D. Sserunkuuma, and J. Pender, eds. 2002. “Policies for Improved LandManagement in Uganda: Second National Workshop.” Environment and Pro-duction Technology Division, Workshop Summary Paper 12, International FoodPolicy Research Institute, Washington, DC.
Gauthier, B. 2001. “Productivity and Exports.” In Uganda’s Recovery, the Role of Farms,Firms, and Government, ed. Ritva Reinikka and Paul Collier. Washington, DC:World Bank.
Henstridge, Mark, and Louis Kasekende. 2001. “Exchange Reforms, Stabilization,and Fiscal Management.” In Uganda’s Recovery, the Role of Farms, Firms, andGovernment, ed. Ritva Reinikka and Paul Collier. Washington, DC: World Bank.
Howitt, Peter. 2004. “Endogenous Growth, Productivity, and Economic Policy: AProgress Report.” International Productivity Monitor 8 (spring): 3–15.
Huang, H., and S. Wei. 2003. “Monetary Policies for Developing Countries: The Roleof Corruption.” Working Paper WP/03/183, International Monetary Fund,Washington, DC.
Kappel, R., L. Jann, and S. Steiner. 2003. The Missing Links—Uganda’s EconomicReforms and Pro-Poor Growth. Study commissioned by the German Agency forTechnical Cooperation, Eschborn, Germany.
Keefer, P. 2000. “Growth and Poverty Reduction in Uganda: The Role of InstitutionalReform.” Draft, World Bank, Washington, DC.
Klasen, S., and D. Lawson. 2004. “The Impact of Population Growth on EconomicGrowth and Poverty Reduction in Uganda.” Paper prepared for the Ministry ofFinance, Planning, and Economic Development, Kampala, Uganda.
Lawson, David, Andrew McKay, and John Okidi. 2003. “Poverty Persistence andTransitions in Uganda: A Combined Qualitative and Quantitative Analysis.”Working Paper 38, Chronic Poverty Research Centre, University of Manchester,Manchester, UK.
196 Okidi, Ssewanyana, Bategeka, and Muhumuza
Lopez, Humberto. 2004. “Pro-Growth, Pro-Poor: Is There a Trade-Off?” Draft, WorldBank, Washington, DC.
Lucas, R. E. 1988. “On the Mechanism of Economic Development.” Journal ofMonetary Economics 22 (1): 3–42.
Mackinnon, John, and Ritva Reinikka. 2002. “How Research Can Assist Policy: TheCase of Economic Reforms in Uganda.” World Bank Researcher Observer 17 (2):267–92.
Mijumbi, B. Peter. 2001. “Uganda’s External Debt and the HIPC Initiative.” CanadianJournal of Development Studies 22 (2): 494–523.
MoFPED (Ministry of Finance, Planning and Economic Development). 1996. “TheRepublic of Uganda, National Food Strategy: A Response to Overcome theChallenge of Poverty and Growth.” Export Policy Analysis Unit, Kampala,Uganda.
_______. 2002. “Participatory Poverty Assessment Process: Deepening the Under-standing of Poverty.” Kampala, Uganda.
Nkonya, E., J. Pender, P. Jagger, D. Sserunkuuma, C. Kaizzi, and H. Ssali. 2004.“Strategies for Sustainable Land Management and Poverty Reduction inUganda.” Research Report 133, International Food Policy Research Institute,Washington, DC.
Obwona, M., and K. Egesa. 2004. “Foreign Direct Investment Flows to Sub-SaharanAfrica: Uganda Case Study.” Occasional Paper No. 25, Economic Policy ResearchCentre, Kampala.
Obwona, M., and S. Ssewanyana. 2004. “Rural Infrastructural Services and Agricul-tural Marketing and Food Security in Uganda.” Draft.
Okidi, John. 2004. “Trends in Ugandan Household Assets during the 1990s.” Draft,Economic Policy Research Centre, Kampala, Uganda.
Okidi, John, and Andrew McKay. 2003. “Poverty Dynamics in Uganda: 1992 to2000.” Working Paper 27, Chronic Poverty Research Centre, University ofManchester, Manchester.
OPPG (Operationalizing Pro-Poor Growth Research Program). 2005. “Pro-PoorGrowth in the 1990s: Lessons and Insights from 14 Countries.” World Bank.Washington, DC.
Owens, T., and A. Wood. 1997. “Export-Oriented Industrialization through PrimaryProcessing.” World Development 25 (May–September): 1453–70.
Oxford Policy Management. 2005. “Evaluation Report: The Plan for Modernizationof Agriculture—Main Report.” Prepared for the Plan for Modernization of Agri-culture Secretariat, Kampala, Uganda.
Pattillo, C., S. Gupta, and K. Carey. 2005. “Sustaining Growth Acceleration and Pro-Poor Growth in Africa.” Working Paper WP/05/195, International MonetaryFund, Washington, DC.
Pender, J., S. Ssewanyana, E. Nkonya, and K. Edward. 2004. “Linkages betweenPoverty and Land Management in Rural Uganda: Evidence from the Uganda
Uganda’s Experience with Operationalizing Pro-Poor Growth, 1992 to 2003 197
National Household Survey, 1999/00.” Discussion Paper 122, International FoodPolicy Research Institute, Washington, DC.
Pieper, U. 1998. “Openness and Structural Dynamics of Productivity and Employ-ment in Developing Countries: A Case of De-Industrialization.” Employmentand Training Papers 8, International Labour Organization, Geneva.
Ravallion, M. 2004. “Pro-Poor Growth: A Primer.” Draft, World Bank, Washington,DC.
Ravallion, M., and S. Chen. 2003a. “Measuring Pro-Poor Growth.” Economics Letters78 (2003): 93–99.
_______. 2003b. “What Can New Survey Data Tell Us about Recent Changes inDistribution and Poverty?” World Bank Economic Review 11 (2): 357–82.
Ravallion, Martin, and Monica Huppi. 1991. “Measuring Changes in Poverty: AMethodological Case Study of Indonesia during an Adjustment Period.” WorldBank Economic Review 5 (1): 57–82.
Rebelo, Sergio. 1991. “Long-Run Policy Analysis and Long-Run Growth.” Journal ofPolitical Economy 99 (3): 500–21.
Republic of Uganda. 2003. “Background to the Budget Financial Year 2003/04.” MoFPED, Kampala.
_______. 2004. “Background to the Budget, Financial Year 2004/05.” MoFPED,Kampala, Uganda.
_______. 2005. “National Budget Framework Paper for Financial Years 2005/06–2007/08.” MoFPED, Kampala, Uganda.
Romer, Paul M. 1986. “Increasing Returns and Long-Run Growth.” Journal of PoliticalEconomy 94 (October): 1002–37.
Solow, Robert M. 1956. “A Contribution to the Theory of Economic Growth.” Quar-terly Journal of Economics 70 (February): 65–94.
Svensson, J., and R. Reinikka. 1999. “How Inadequate Provision of Public Infrastruc-ture and Services Affects Private Investment.” Policy Research Paper No. 2262,World Bank, Washington, DC.
UBOS (Uganda Bureau of Statistics). 2003. “2003 Statistical Abstract.” UBOS,Kampala, Uganda.
UNDP (United Nations Development Programme). 1997. “Human DevelopmentReport.” UNDP, New York.
World Bank. 2003. World Development Report 2003: Sustainable Development in aDynamic World. Washington, DC: World Bank.
_______. 2005. “Republic of Uganda: Poverty Assessment Report.” World Bank,Poverty Reduction Economic Management Unit Africa Region, Washington, DC.
198 Okidi, Ssewanyana, Bategeka, and Muhumuza
8The Success of Pro-Poor Growth inRural and Urban Tunisia
Mohamed Hédi Lahouel
Tunisia has achieved relatively high growth and a sharp reduction in theincidence of poverty over more than four decades. Although povertyremains highly concentrated in rural areas and in some specific regions, par-ticularly the center-west, growth has been consistently pro-poor, leading tosteadily falling poverty rates. A favorable growth strategy, together withcomplementary social policies, has helped the poor contribute to and bene-fit from growth through asset accumulation and high labor market partici-pation rates. This positive outcome can be explained by a growth strategybased essentially on the development of labor-intensive and export-oriented manufacturing without neglect of agriculture, active femaleparticipation in the labor market, and pro-poor social policies.
Underlying pro-poor growth has been strong political commitment.Fighting poverty has been one of the main objectives targeted by theregime in power since the early 1960s. The political leadership that ledthe struggle for independence came from the petite bourgeoisie and was freefrom the strong influence of local landlords or private industrialists. Itdeveloped deep roots in small towns and villages, which may explain whyit prioritized, from the start, social and economic progress in villages andrural areas. Such political commitment makes a difference for povertyreduction: several other countries have equaled or outperformed Tunisia’s
199
The author thanks the Agence Française de Développement for support; Ayadi Mohamed,Boulila Ghazi, and Montigny Philippe for their input on a draft report; Louise Cord for com-ments on this chapter; and Claudia Reitmaier for editorial assistance.
200 Lahouel
growth performance and yet have a much higher poverty incidence thanTunisia has today.
Because initial incomes were very low, any redistribution withoutgrowth would have made no dent in poverty reduction. Growth has beenessential in providing job opportunities and higher incomes for the poorand the state, along with the resources needed to finance social spending. Inaddition to rural development, promotion of export-oriented labor-inten-sive light manufacturing and services, particularly tourism in coastalregions, has played an important role in accelerating growth and increasingthe employment of low- to medium-skilled, mainly female, workers, manyof whom migrated from neighboring rural areas. External migration alsohelped reduce poverty through two channels: remittances and loweredpressure on the local job market, in which the remaining active population,including the poor, could exploit employment opportunities.
This chapter assesses the extent to which poverty reduction in Tunisiahas resulted from growth and reviews the drivers of growth with a focus onimplications for poverty. In addition, the chapter identifies the channelsthrough which low-income households were enabled to participate in andbenefit from growth. Given the importance of social services, the role ofsocial spending is explored.
Poverty, Growth, and Inequality Trends
At independence in 1956, Tunisia was a low-income country with wide-spread poverty and illiteracy. The political leadership that led the struggleagainst the French occupation had developed deep popular roots over morethan two decades and drew wide support from the rural areas and villages.This historical background had a strong influence on the new politicalagenda, which stressed the importance of both economic and socialdevelopment.
At the beginning of the 1960s, the Tunisian population was basically illit-erate and had a very low standard of living. Average schooling was lessthan one year in 1960, which was very low even when compared with sev-eral developing countries. The lag was so huge that even 10 years later morethan 72 percent of all adults and 85 percent of the female population werestill illiterate. Poverty incidence was also high—33 percent in 1966/67,according to the first national Household Consumption Survey (HCS) con-ducted after independence—and had been much higher in previous years.
Agriculture was the dominant activity, but most of the fertile land was inthe hands of French farmers until 1964. There was very little industry, and
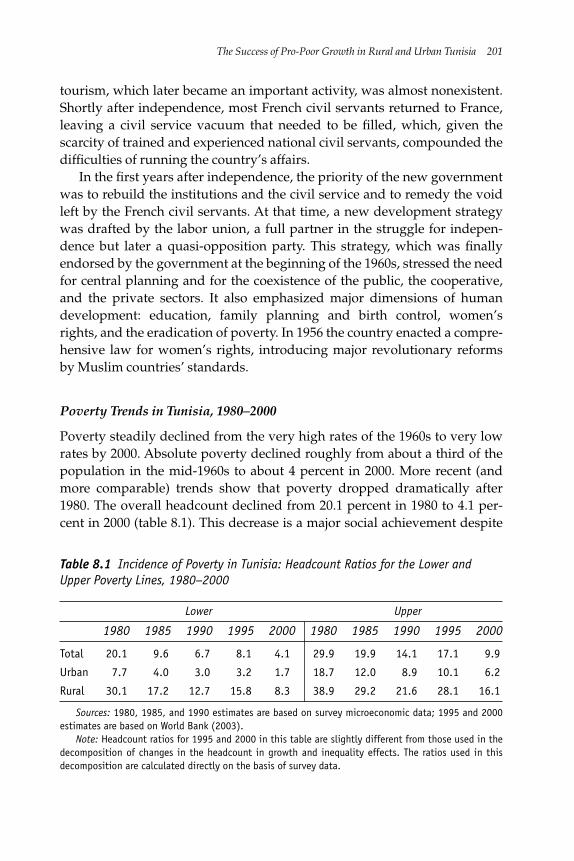
The Success of Pro-Poor Growth in Rural and Urban Tunisia 201
tourism, which later became an important activity, was almost nonexistent.Shortly after independence, most French civil servants returned to France,leaving a civil service vacuum that needed to be filled, which, given thescarcity of trained and experienced national civil servants, compounded thedifficulties of running the country’s affairs.
In the first years after independence, the priority of the new governmentwas to rebuild the institutions and the civil service and to remedy the voidleft by the French civil servants. At that time, a new development strategywas drafted by the labor union, a full partner in the struggle for indepen-dence but later a quasi-opposition party. This strategy, which was finallyendorsed by the government at the beginning of the 1960s, stressed the needfor central planning and for the coexistence of the public, the cooperative,and the private sectors. It also emphasized major dimensions of humandevelopment: education, family planning and birth control, women’srights, and the eradication of poverty. In 1956 the country enacted a compre-hensive law for women’s rights, introducing major revolutionary reformsby Muslim countries’ standards.
Poverty Trends in Tunisia, 1980–2000
Poverty steadily declined from the very high rates of the 1960s to very lowrates by 2000. Absolute poverty declined roughly from about a third of thepopulation in the mid-1960s to about 4 percent in 2000. More recent (andmore comparable) trends show that poverty dropped dramatically after1980. The overall headcount declined from 20.1 percent in 1980 to 4.1 per-cent in 2000 (table 8.1). This decrease is a major social achievement despite
Table 8.1 Incidence of Poverty in Tunisia: Headcount Ratios for the Lower andUpper Poverty Lines, 1980–2000
Lower Upper
1980 1985 1990 1995 2000 1980 1985 1990 1995 2000
Total 20.1 9.6 6.7 8.1 4.1 29.9 19.9 14.1 17.1 9.9
Urban 7.7 4.0 3.0 3.2 1.7 18.7 12.0 8.9 10.1 6.2
Rural 30.1 17.2 12.7 15.8 8.3 38.9 29.2 21.6 28.1 16.1
Sources: 1980, 1985, and 1990 estimates are based on survey microeconomic data; 1995 and 2000estimates are based on World Bank (2003).
Note: Headcount ratios for 1995 and 2000 in this table are slightly different from those used in thedecomposition of changes in the headcount in growth and inequality effects. The ratios used in thisdecomposition are calculated directly on the basis of survey data.
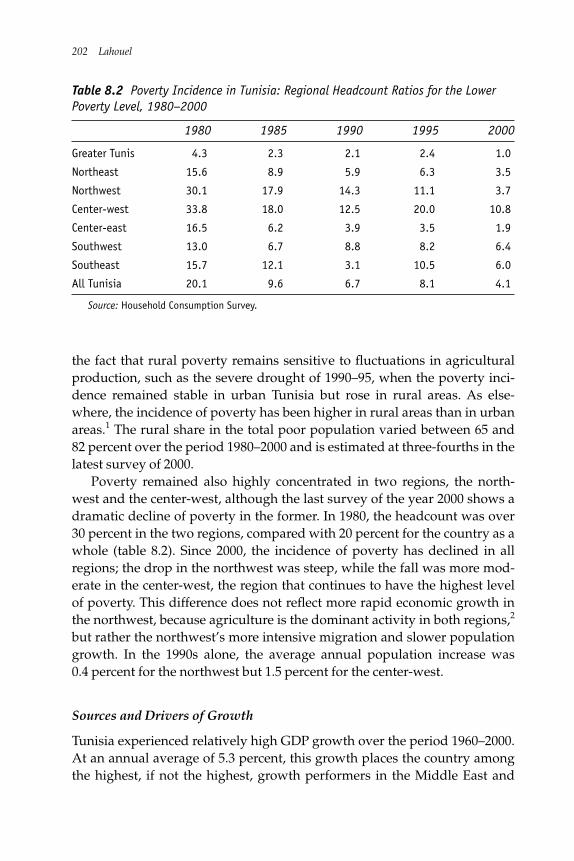
202 Lahouel
the fact that rural poverty remains sensitive to fluctuations in agriculturalproduction, such as the severe drought of 1990–95, when the poverty inci-dence remained stable in urban Tunisia but rose in rural areas. As else-where, the incidence of poverty has been higher in rural areas than in urbanareas.1 The rural share in the total poor population varied between 65 and82 percent over the period 1980–2000 and is estimated at three-fourths in thelatest survey of 2000.
Poverty remained also highly concentrated in two regions, the north-west and the center-west, although the last survey of the year 2000 shows adramatic decline of poverty in the former. In 1980, the headcount was over30 percent in the two regions, compared with 20 percent for the country as awhole (table 8.2). Since 2000, the incidence of poverty has declined in allregions; the drop in the northwest was steep, while the fall was more mod-erate in the center-west, the region that continues to have the highest levelof poverty. This difference does not reflect more rapid economic growth inthe northwest, because agriculture is the dominant activity in both regions,2
but rather the northwest’s more intensive migration and slower populationgrowth. In the 1990s alone, the average annual population increase was0.4 percent for the northwest but 1.5 percent for the center-west.
Sources and Drivers of Growth
Tunisia experienced relatively high GDP growth over the period 1960–2000.At an annual average of 5.3 percent, this growth places the country amongthe highest, if not the highest, growth performers in the Middle East and
Table 8.2 Poverty Incidence in Tunisia: Regional Headcount Ratios for the LowerPoverty Level, 1980–2000
1980 1985 1990 1995 2000
Greater Tunis 4.3 2.3 2.1 2.4 1.0
Northeast 15.6 8.9 5.9 6.3 3.5
Northwest 30.1 17.9 14.3 11.1 3.7
Center-west 33.8 18.0 12.5 20.0 10.8
Center-east 16.5 6.2 3.9 3.5 1.9
Southwest 13.0 6.7 8.8 8.2 6.4
Southeast 15.7 12.1 3.1 10.5 6.0
All Tunisia 20.1 9.6 6.7 8.1 4.1
Source: Household Consumption Survey.
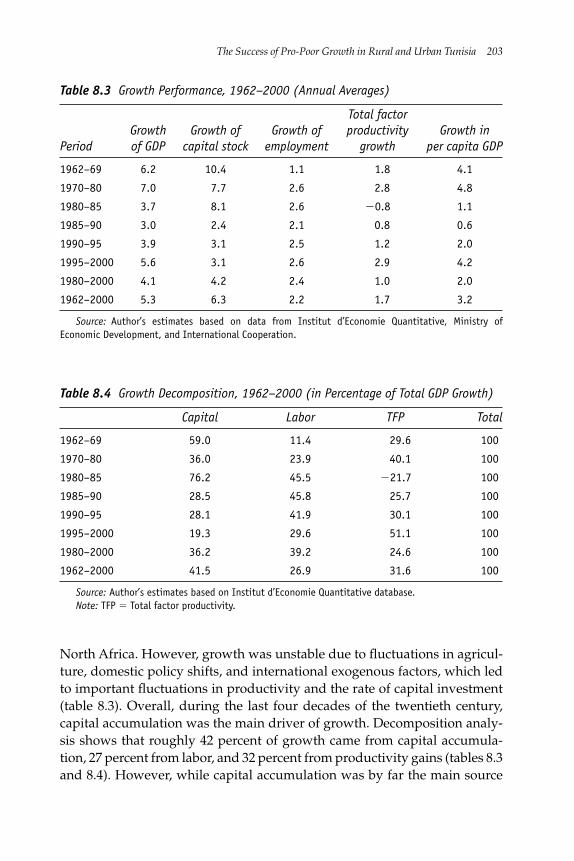
North Africa. However, growth was unstable due to fluctuations in agricul-ture, domestic policy shifts, and international exogenous factors, which ledto important fluctuations in productivity and the rate of capital investment(table 8.3). Overall, during the last four decades of the twentieth century,capital accumulation was the main driver of growth. Decomposition analy-sis shows that roughly 42 percent of growth came from capital accumula-tion, 27 percent from labor, and 32 percent from productivity gains (tables 8.3and 8.4). However, while capital accumulation was by far the main source
The Success of Pro-Poor Growth in Rural and Urban Tunisia 203
Table 8.3 Growth Performance, 1962–2000 (Annual Averages)
Total factor Growth Growth of Growth of productivity Growth in
Period of GDP capital stock employment growth per capita GDP
1962–69 6.2 10.4 1.1 1.8 4.1
1970–80 7.0 7.7 2.6 2.8 4.8
1980–85 3.7 8.1 2.6 �0.8 1.1
1985–90 3.0 2.4 2.1 0.8 0.6
1990–95 3.9 3.1 2.5 1.2 2.0
1995–2000 5.6 3.1 2.6 2.9 4.2
1980–2000 4.1 4.2 2.4 1.0 2.0
1962–2000 5.3 6.3 2.2 1.7 3.2
Source: Author’s estimates based on data from Institut d’Economie Quantitative, Ministry ofEconomic Development, and International Cooperation.
Table 8.4 Growth Decomposition, 1962–2000 (in Percentage of Total GDP Growth)
Capital Labor TFP Total
1962–69 59.0 11.4 29.6 100
1970–80 36.0 23.9 40.1 100
1980–85 76.2 45.5 �21.7 100
1985–90 28.5 45.8 25.7 100
1990–95 28.1 41.9 30.1 100
1995–2000 19.3 29.6 51.1 100
1980–2000 36.2 39.2 24.6 100
1962–2000 41.5 26.9 31.6 100
Source: Author’s estimates based on Institut d’Economie Quantitative database.Note: TFP � Total factor productivity.
of growth in the 1960s (almost 60 percent), the contribution of capitalsteadily declined in later periods. Labor and productivity gains becamemore significant sources of growth in the 1980s and 1990s. These gainsreflect structural reforms: streamlining of the public sector, trade and finan-cial liberalization, realignment of the exchange rate, and fiscal discipline.
In the 1960s employment expanded at a very low rate, averaging 1.1 per-cent per year. Capital creation was relatively high during this period, butmost of the investment went into capital-intensive public projects, such as asteel mill, an oil refinery, a paper plant, a couple of large textile factories,and an automobile assembly plant. Such projects absorbed a large share ofinvestment resources but created few jobs. Even though the governmenthad to be credited with a public policy favorable to education and to thedevelopment of infrastructure during this period, it did little to encourageprivate initiative. On the contrary, by imposing the cooperative system onagriculture and even on domestic commerce, it created uncertainty thatdiscouraged private investment and job creation.
The government that came to power in 1970 abandoned the socialist pol-icy of the 1960s and reversed the collectivization decisions hastily taken in1968/69. While continuing to develop the public sector, it declared its inten-tion to foster expansion of the private sector and to attract foreign directinvestment. Industrial policy was reoriented toward light industries, andthe private sector developed an increasing number of exports. The govern-ment developed finance mechanisms that facilitated the creation andgrowth of small- to medium-size enterprises, particularly in manufacturing,which grew by more than 10 percent annually. For exports, it established anoffshore regime of generous fiscal incentives, easy access to European mar-kets, and relatively light administrative burdens. This regime played animportant role in the development of offshore clothing activity: imports byoffshore firms were and still are duty free, and these firms have enjoyedexemptions from value-added tax and income taxes. These advantages notonly directly raised returns to investment in offshore firms but also helpedthe firms avoid the heavy transaction costs faced by onshore firms.
As a result, starting in the 1970s, the private sector became the mostimportant driver of growth and poverty reduction. Job creation in manufac-turing was particularly impressive, growing by 5.6 percent per year on aver-age throughout the 1970s. This growth was facilitated by tourism andwindfalls from the two oil shocks of that decade, which the government usedto build infrastructure and invest in human capital.
The economic situation changed in the early 1980s, as growth sloweddespite large investments. The Tunisian economy experienced its lowest
204 Lahouel
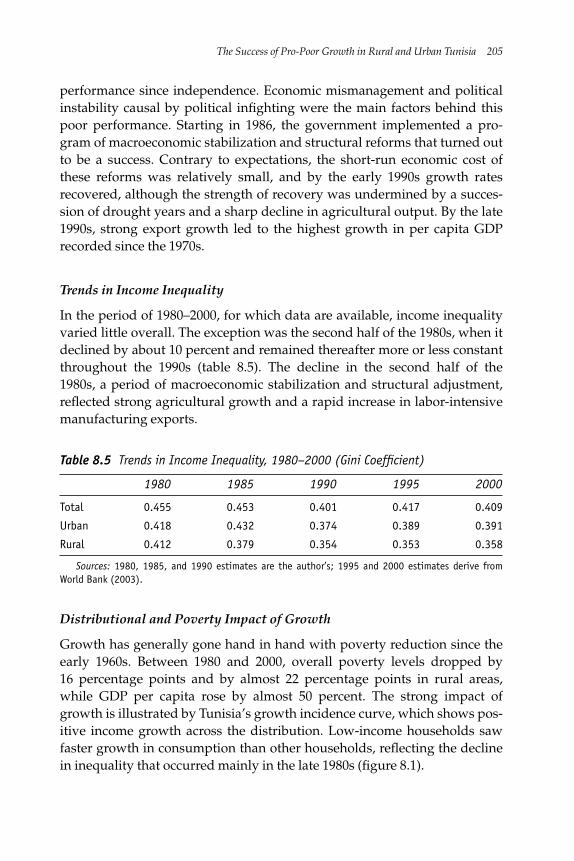
performance since independence. Economic mismanagement and politicalinstability causal by political infighting were the main factors behind thispoor performance. Starting in 1986, the government implemented a pro-gram of macroeconomic stabilization and structural reforms that turned outto be a success. Contrary to expectations, the short-run economic cost ofthese reforms was relatively small, and by the early 1990s growth ratesrecovered, although the strength of recovery was undermined by a succes-sion of drought years and a sharp decline in agricultural output. By the late1990s, strong export growth led to the highest growth in per capita GDPrecorded since the 1970s.
Trends in Income Inequality
In the period of 1980–2000, for which data are available, income inequalityvaried little overall. The exception was the second half of the 1980s, when itdeclined by about 10 percent and remained thereafter more or less constantthroughout the 1990s (table 8.5). The decline in the second half of the1980s, a period of macroeconomic stabilization and structural adjustment,reflected strong agricultural growth and a rapid increase in labor-intensivemanufacturing exports.
The Success of Pro-Poor Growth in Rural and Urban Tunisia 205
Table 8.5 Trends in Income Inequality, 1980–2000 (Gini Coefficient)
1980 1985 1990 1995 2000
Total 0.455 0.453 0.401 0.417 0.409
Urban 0.418 0.432 0.374 0.389 0.391
Rural 0.412 0.379 0.354 0.353 0.358
Sources: 1980, 1985, and 1990 estimates are the author’s; 1995 and 2000 estimates derive fromWorld Bank (2003).
Distributional and Poverty Impact of Growth
Growth has generally gone hand in hand with poverty reduction since theearly 1960s. Between 1980 and 2000, overall poverty levels dropped by16 percentage points and by almost 22 percentage points in rural areas,while GDP per capita rose by almost 50 percent. The strong impact ofgrowth is illustrated by Tunisia’s growth incidence curve, which shows pos-itive income growth across the distribution. Low-income households sawfaster growth in consumption than other households, reflecting the declinein inequality that occurred mainly in the late 1980s (figure 8.1).
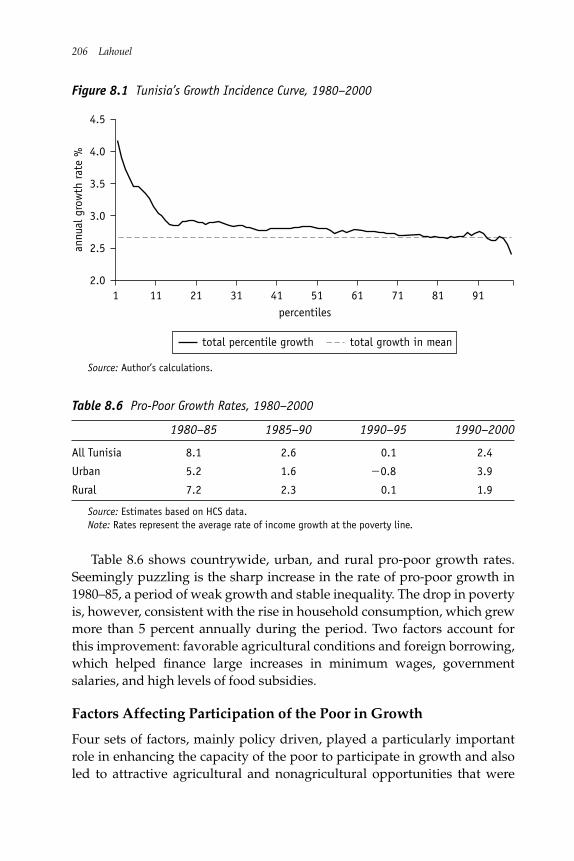
Table 8.6 shows countrywide, urban, and rural pro-poor growth rates.Seemingly puzzling is the sharp increase in the rate of pro-poor growth in1980–85, a period of weak growth and stable inequality. The drop in povertyis, however, consistent with the rise in household consumption, which grewmore than 5 percent annually during the period. Two factors account forthis improvement: favorable agricultural conditions and foreign borrowing,which helped finance large increases in minimum wages, governmentsalaries, and high levels of food subsidies.
Factors Affecting Participation of the Poor in Growth
Four sets of factors, mainly policy driven, played a particularly importantrole in enhancing the capacity of the poor to participate in growth and alsoled to attractive agricultural and nonagricultural opportunities that were
206 Lahouel
annu
al g
row
th r
ate
%
percentiles
4.5
4.0
3.5
3.0
2.0911 11 21 31 41 51 61 71 81
2.5
total growth in meantotal percentile growth
Figure 8.1 Tunisia’s Growth Incidence Curve, 1980–2000
Source: Author’s calculations.
Table 8.6 Pro-Poor Growth Rates, 1980–2000
1980–85 1985–90 1990–95 1990–2000
All Tunisia 8.1 2.6 0.1 2.4
Urban 5.2 1.6 �0.8 3.9
Rural 7.2 2.3 0.1 1.9
Source: Estimates based on HCS data. Note: Rates represent the average rate of income growth at the poverty line.
generally accessible to low-income households. These four factors aremacroeconomic stability and trade, agricultural policies, labor markets andmigration, and public expenditures for social development.
Macroeconomic Stability and Trade Policies
The Tunisian government has been relatively successful in creating a stablemacroeconomic environment conducive to growth and low levels of infla-tion. Macroeconomic stability is important for the poor, because theirincome, compared with that of nonpoor households, tends not to beadjusted for inflation and is less asset based and therefore less protectedfrom the erosion of purchasing power (Easterly and Fischer 2001). Manage-ment of monetary and fiscal policy improved significantly after implemen-tation of the stabilization and structural adjustment program in 1986–93. Asa result, the budget deficit decreased from almost 5 percent in terms of GDPin the 1980s to 3.3 percent in the 1990s. In the early 1980s, large publicinvestments and increases in salaries and food subsidies resulted in a sharprise in inflation, a record budget deficit (exceeding 8 percent of GDP) in1983, and a current account deficit close to 7 percent of GDP. As notedabove, poverty dropped during that period of low growth but at the cost ofa major macroeconomic disequilibria that had to be corrected. As the fiscalstance improved, inflation fell under 5 percent on average in the 1990s anddecelerated to less than 4 percent during 1995–2000.
Trade policy strongly discouraged imports throughout the 1980s and thefirst half of the 1990s, but an active export policy helped to create jobs acces-sible to low-income households and contributed to macroeconomicstability. Since 1996, the government has gradually liberalized trade in man-ufacturing with the view of establishing a free trade agreement with theEuropean Union. The offshore export sector has benefited since the 1970sfrom generous government incentives, particularly a special duty-freeregime on imported inputs as well as a permanent corporate income taxholiday. Although protection of domestic industries may have hurt the poorby shielding capital-intensive activities from competition, export incentiveshave largely corrected this bias and fostered development of labor-intensivelight manufacturing, a major source of growth and poverty reduction.Despite liberalization of the trading regime, the current account deficitdecreased to less than 3 percent in terms of GDP during the second half ofthe 1990s, reflecting the strength of the export sector. Pursuit of an activeexchange rate policy since 1986, which helped Tunisia avoid the real appre-ciation of domestic currency and quickly adjust any misalignments, has also
The Success of Pro-Poor Growth in Rural and Urban Tunisia 207
contributed to the rapid growth of manufactured product exports andtourism services, as well as to macroeconomic stability.
Asset Holdings in Rural Areas and Agriculture
Poverty reduction in Tunisia is highly sensitive to agricultural growth,because most of the poor are concentrated in the rural sector. On the whole,this sector performed relatively well in spite of the predominance of rain-fed cropping. When it performed poorly, as in the first half of the 1990s,rural poverty increased, even if growth was positive elsewhere. Moreover,lack of access to land, uncertain title arrangements, and lack of irrigationequipment undermined the ability of poor households to raise their agricul-tural incomes and made them even more vulnerable to the frequentdroughts of the 1990s. All these factors have made it difficult for poorerfarmers to invest and achieve productivity gains. Nevertheless, agriculturalprice liberalization since the late 1980s and government incentives for live-stock production have benefited the poor.
No major land redistribution has been implemented to benefit the poor,and land distribution remains highly unequal. Under the French protec-torate, the most fertile land of the north of the country was in the hands ofFrench landowners; Tunisian farmers were pushed onto marginal land. In1964 the Tunisian government nationalized French farms. This land reformwas supposed to be based on the cooperative system but in practice turnedinto collectivization. The failure of this reform has stymied any land reformsince.
In 1991 more than two-thirds of the farmers owned about 10 percent oftotal land, while the 1.2 percent richest farmers held more than 22 percent.The state still holds large farms expropriated from the French. Some of thesefarms have been leased to private farmers on a long-term basis, but the poorhave been excluded. Of the 400,000 hectares owned by the state, about halfhave been leased to private farmers. In addition to having little land, poorfarmers generally have ill-defined property titles and therefore, difficultyaccessing credit. Given these conditions, the sharp decline in rural povertyin Tunisia cannot be attributed to better access to land by or to increasedinvestment opportunities for low-income rural households.
Climate conditions exacerbate income fluctuations and risk levels inrural Tunisia. Given the high volatility of farm production resulting fromhighly unstable rainfall, low-income rural households cannot rely exclu-sively on income from cultivating their own or others’ land. In low-rainfallyears, which are frequent and sometimes consecutive, production is so low
208 Lahouel
that it cannot procure the minimum income required to avoid poverty. Irri-gation has expanded over the past 20 years, but most low-income farmersdo not have access to irrigation because they lacked capital and access tocredit. They therefore seek additional income outside agriculture to secure aminimum income and to stabilize their consumption.
Removal of the antiagriculture bias of price policy at the beginning of the1980s may have contributed to higher incomes for small farmers as well asto moderate increases in rural real wages. In the 1970s, the governmentmaintained low prices for basic commodities, particularly for cereal-basedproducts, to prevent wages from rising in the manufacturing sector. Thispolicy was reversed in the early 1980s with sharp increases in the producerprices of cereals and later on with the granting of subsidies for dairy prod-ucts. These incentives have benefited large- and medium-size farms morethan small farms, but the latter have also been favorably affected by thisshift in policy. Given the poor soil and climate conditions, small farmswould probably not survive if trade in agriculture were liberalized and thedomestic prices of field crops were aligned with international prices.
One of the most important activities from which the low-income ruralpopulation has benefited is livestock. Production of meat and milk hasincreased at more than 7 percent per year on average since the late 1980sbecause of a policy of self-sufficiency. This policy included high importduties, exceeding 100 percent on meat and dairy products, subsidies onmilk collection from farmers, and creation of many milk collection centers.Development of the livestock sector, and particularly of the dairy subsector,also benefited from heavy government investments in the rural roadnetwork.
Labor Markets and Migration
Extensive job creation in manufacturing has led to structural transformationof Tunisia’s economy, creating employment opportunities mainly for low-skilled workers. Migration (to urban areas and to other countries) hasbrought in remittances, boosting incomes in poor areas.
RURAL LABOR MARKET. The poor connect to growth significantly throughthe labor market. Rural labor productivity has increased, leading to veryslow growth in agricultural employment and significant out-migration.Driven by the development of irrigation, more intensive use of fertilizersand other chemicals, and increased mechanization, agricultural labor pro-ductivity increased at more than 4 percent a year between 1960 and 2000.
The Success of Pro-Poor Growth in Rural and Urban Tunisia 209
This rising productivity spurred agricultural growth and released labor thatwas absorbed in the expanding manufacturing and construction sectors. Asa result, agriculture has created an increase in jobs of no more than 5 percentover four decades.
The rise in agricultural labor productivity did not lead to significantlyhigher rural wages over the 1980–2000 period as a whole. The daily mini-mum real wage in agriculture increased at an annual average rate of 0.5 per-cent in 1980–2000, or roughly 10 percent over the whole period, which mayaccount for only part of the decline in poverty. In 1980–83 real minimumwages in agriculture increased by 25 percent, which contributed to the sharpdecline in the incidence of poverty during the first half of the 1980s. In con-trast, in the first half of the 1990s rural wages declined at a time when theincidence of poverty increased in rural areas. In spite of competition for laborby other sectors in both rural and urban areas, the significant increase inmechanization, which was driven by important financial incentives, reducedthe demand for labor in agriculture and prevented upward pressure onreal wages.
Rural-urban migration and remittances alleviated pressure on the rurallabor market, helped maintain rural wages at relatively high rates, andincreased rural income through transfers from urban Tunisia and fromabroad. Some internal migration between urban and rural areas has swungbetween work in the construction sector and tourism in urban areas andfarming or unemployment in rural areas.
Remittances from abroad have been an important source of revenue,accounting for 4.2 percent of GDP over the period 1980–2000, which isequivalent to 70 percent of the total value added of the textile, clothing, andleather sector. In 1999 the Tunisian population living abroad, estimated at550,000, accounted for about 7 percent of the population.
Remittances have benefited all regions, accounting for 8.5 percent oftotal expenditures nationwide, 8 percent in the northwest, and over 7 per-cent in the center-west. Solidarity between emigrants and relatives stayingin Tunisia appears to be strong.
URBAN LABOR MARKET. Changes in the sectoral composition of employ-ment in the last four decades of the twentieth century underscore the struc-tural transformation experienced by Tunisia during that period. The shareof agriculture decreased from almost 46 percent of total employment in the1960s to 23 percent in the second half of the 1990s. Meanwhile, the share ofmanufacturing rose from about 14 to 24 percent. Currently, textiles, cloth-ing, and leather account for about half of total manufacturing employment.
210 Lahouel
Most of the 300,000 workers employed by that sector are low-skilled womenof low-income households. Within nongovernment services, tourism hasbeen an important activity, not only as a source of foreign exchange but alsoincreasingly as an employment generator. Its share rose from an insignifi-cant level in the 1960s to almost 3 percent of total employment in the secondhalf of the 1990s. In the same period, the nonmanufacturing industry, ofwhich construction accounts for about 80 percent of employment, lost aboutone percentage point in total employment, from about 11 to 10 percent.
Underlying the structural transformation and the growth of nonagricul-tural sectors have been a well-focused manufacturing export strategy andpreferential access to European markets. The industrial strategy establishedin the early 1970s has provided export-based incentives, mainly fiscal, thatboosted manufacturing exports and employment. At the same time, theEuropean Economic Community granted Tunisia duty-free access to itsmarket for textile and clothing on the basis of quotas that were rarely bind-ing. The fiscal incentives on the Tunisian side and the duty-free access onthe European side attracted European foreign direct investment and laternational investment to this sector.
As noted above, textile and clothing account for almost half of manufac-turing employment. The growth of manufacturing was supported by theincreasing presence of women in the workforce in the 1980s and 1990s.Manufacturing employs low-skilled, little-educated, and mainly youngfemale workers. In the 1990s about 72 percent of the textile and clothinglabor force, compared with 63 percent of the entire labor force, had no oronly primary education. In 2000, women made up three-quarters of the tex-tile labor force, compared with only one-third of the private sector laborforce and one-quarter of the government sector labor force. Development ofthe textile and clothing sector had a significant impact on poverty, becausethe sector’s workers came generally from low-income households, andmany were migrants from rural areas. Salaries in this sector have thereforebeen an important additional source of income for these households.
Although construction and manufacturing were the main contributorsto growth in nonagricultural employment between 1980 and 2000, theircapacity to sustain job creation, particularly if growth slows in other sectors,is of concern. Because the textile and clothing sector is labor-intensive, witha capital-labor ratio estimated in 2000 at only 30 percent of the averagecapital-labor ratio in the whole economy, it has created many jobs with littlecapital, mainly foreign. The drawback of such investment is that it tendsto be less stable than investments in other sectors and more sensitive tochanges in location incentives, such as those resulting from dismantling of
The Success of Pro-Poor Growth in Rural and Urban Tunisia 211
the Multi-Fiber Agreement (MFA). In that respect, Tunisia is expected to beone of the losers from liberalization of trade in textile and clothing; manylow-income households could be hurt.
Many of the poor work in construction, where job stability is lackingthough daily wages are about the same as minimum wages. Expansion ofthis sector, which has accompanied the good growth performance of theTunisian economy, has helped improve living conditions of low-incomehouseholds and contributed to poverty alleviation. Nonetheless, high flexi-bility in the construction labor market and lack of social protection forworkers in this sector are such that any slowdown in construction may havesevere adverse effects on workers’ income and therefore on poverty.
Extensive job creation in manufacturing in general and in the garmentindustry in particular has occurred without forgoing labor rights.3 Laborlegislation is still too protective in Tunisia, considering its level of develop-ment, and may have contributed to the relatively high unemployment rateof around 15 percent of the active labor force over the past 20 years. Laborrelations are regulated by a labor code that in the 1990s introduced greaterflexibility in hiring and set limits on severance compensation. But layoffs foreconomic reasons remain highly regulated, and the labor law providesgreater protection for Tunisian workers compared with workers in severalother developing countries. Social security charges are also relatively high,amounting to 24 percent of the wage bill, distributed between employers(16 percent) and workers (8 percent). Firms pay an additional 12 percent onthe wage bill for various other social charges.
Pro-Poor Public Spending
High rates of economic growth and a strong implicit social contract to helpshare the gains of growth through greater access to social services have ledto significant public expenditures in education, infrastructure, a variety ofsafety nets, and food subsidies. Spending levels on these programsincreased significantly in the 1990s and, with the exception of the food sub-sidies and to a lesser extent education (especially secondary and beyond),have been targeted to poorer households.
EDUCATION AND THE POOR. The government has been committed to freepublic education since independence. Private education has not been veryimportant at any level, although it has developed in recent years at the pri-mary level and to some extent in higher education for those students whocannot make it to public universities. Given the strong commitment of the
212 Lahouel
government to education and the marginal role played by the private sector,education accounts for a large share of the state budget, exceeding 30 per-cent on the average.
Access to primary and secondary education for both girls and boys isfairly widespread across regions, although rural areas continue to be disad-vantaged compared with urban areas. By 1990, gross primary enrollmentrates exceeded 100 percent for both girls and boys.4 Between 1990 and 2000,access to secondary school increased dramatically; gross enrollment ratesrose from 50 to 76 percent for boys and from 40 to 80 percent for girls.Although school achievement is greater in the coastal regions, the improve-ments are widely shared among the population, including in the center-west, where poverty is concentrated. The rise in enrollment in rural areashas been significant for the 6 to 18 age bracket, rising from 60 percent in1990, to almost 70 percent in 2000, with households in the first decile catch-ing up with the rest of the rural population.
Secondary, rather than primary, education appears to have made themost difference for poverty reduction. A level of learning higher than pri-mary education is needed to increase one’s income comfortably above thepoverty level. Not surprisingly, children from poorer households tend tohave less access to secondary education than nonpoor children. In 2000, pri-mary enrollment rates were almost the same for the first decile as for thewhole population; by contrast, the difference in secondary education isfourfold. In private sector employment, the return on incomplete primaryeducation is almost zero and reaches a moderate 9 percent on completedprimary schooling. In contrast, the return on secondary education exceeds26 percent. In the textile and clothing sector, which employs many low-skilled workers, the return to primary education is estimated at 2 percent,compared with 15 percent to secondary education (World Bank 2004).5
SOCIAL PROTECTION PROGRAMS. The main social assistance program isthe National Program of Assistance to Needy Families, which was estab-lished in 1986 as a safety net accompanying structural adjustment. Eligiblehouseholds are those falling below the poverty line with no other support.The main beneficiaries are the elderly poor, poor widows, and the handi-capped. In 2001 this program covered about 114,000 households, asignificantly large portion of poor households, and spent about $43 million,which corresponds to an average of $375 per beneficiary. On the basis of3.7 persons per household, this transfer represents about 40 percent ofthe poverty line, which probably has helped many beneficiaries escapeor nearly escape poverty. The allocation of this fund clearly favors regions
The Success of Pro-Poor Growth in Rural and Urban Tunisia 213
with a high poverty concentration, particularly the center-west and thenorthwest.
Employment creation and productive capacity-building objectives areembodied in the government’s assistance strategy. This strategy focuses onemployment in public works, which has recently accounted for about44 percent of program expenditures; assistance to productive employmentand self-employment, accounting for almost 50 percent of expenditures;and training within firms for first-time job seekers. The total amount spenton the three categories rose from less than $80 million in 1993 to an averageof $190 million in the years 2000–02 (UNDP 2004). This increase is due to thecreation of a new employment mechanism in 2000 that provides assistanceto the self-employed. In 1997 the state created a microcredit bank, the Soli-darity Bank, targeting low-income households and unemployed youth, forwhich the banking system has remained inaccessible. The volume of loanshas increased at a rapid pace, but the bank has encountered serious reim-bursement problems.
INFRASTRUCTURE SPENDING. Government programs have sought toimprove living conditions in poor areas with investments in housing andinfrastructure. The poor benefit from the general state budget, but specificinstruments focus on the poor. From 1993 to 2003 the National SolidarityFund has benefited 220,000 households or close to 1 million inhabitants byspending about $575 million, mainly on infrastructure. Roads account for30 percent of the outlays, followed by housing (21 percent), electrification(20 percent), and potable water (14 percent). Rural roads have played a par-ticularly important role in helping the rural poor connect to urban goodsand labor markets and to urban services, to cut their transaction costs, andto improve their living conditions. Returns to this infrastructure have notbeen estimated but are presumed to be high. The housing component of thefund has not only improved the living conditions of the poor but also freedup income and savings that would have been spent on housing.
FOOD SUBSIDIES. Food subsidies are controversial and can entail signifi-cant opportunity costs when they are not targeted, but in Tunisia they havemost likely had very positive effects on poverty alleviation, particularlyamong low-income urban households. In the early 1980s, the subsidiesreached alarming proportions, accounting for close to 4 percent of GDP insome years. They took more government resources than any other socialspending program, with the exception of education (Tuck and Lindert1996). In 1990 food subsidies to the first quintile accounted for almost
214 Lahouel
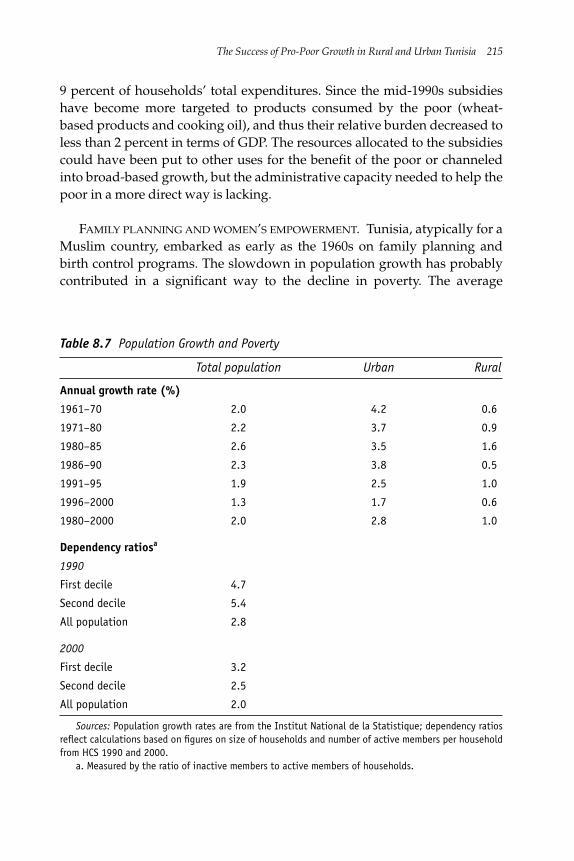
9 percent of households’ total expenditures. Since the mid-1990s subsidieshave become more targeted to products consumed by the poor (wheat-based products and cooking oil), and thus their relative burden decreased toless than 2 percent in terms of GDP. The resources allocated to the subsidiescould have been put to other uses for the benefit of the poor or channeledinto broad-based growth, but the administrative capacity needed to help thepoor in a more direct way is lacking.
FAMILY PLANNING AND WOMEN’S EMPOWERMENT. Tunisia, atypically for aMuslim country, embarked as early as the 1960s on family planning andbirth control programs. The slowdown in population growth has probablycontributed in a significant way to the decline in poverty. The average
The Success of Pro-Poor Growth in Rural and Urban Tunisia 215
Table 8.7 Population Growth and Poverty
Total population Urban Rural
Annual growth rate (%)
1961–70 2.0 4.2 0.6
1971–80 2.2 3.7 0.9
1980–85 2.6 3.5 1.6
1986–90 2.3 3.8 0.5
1991–95 1.9 2.5 1.0
1996–2000 1.3 1.7 0.6
1980–2000 2.0 2.8 1.0
Dependency ratiosa
1990
First decile 4.7
Second decile 5.4
All population 2.8
2000
First decile 3.2
Second decile 2.5
All population 2.0
Sources: Population growth rates are from the Institut National de la Statistique; dependency ratiosreflect calculations based on figures on size of households and number of active members per householdfrom HCS 1990 and 2000.
a. Measured by the ratio of inactive members to active members of households.
population growth rate of 2.3 percent annually in the second half of the1980s dropped to 1.3 percent in the second half of the 1990s (table 8.7), mak-ing Tunisia the country with the lowest population growth in the MiddleEast and North Africa. Growth of the urban population, which depends onnatural growth, expansion of urbanization, and inflows of rural immi-grants, outpaced that of the rural population, which has remained very lowin recent decades. The main forces that have affected recent populationtrends are the rise in living standards, modernization of Tunisian society,high rates of urbanization, promotion of women’s rights, introduction ofbirth control and family planning, and expansion of education, particularlyamong women.
The slowdown in population growth and the reduction in householdsize were associated with a decline in the incidence of poverty. The effectof falling fertility rates on poverty can be inferred from changes in depen-dency ratios across consumption deciles (table 8.7). Dependency ratiosdeclined between 1990 and 2000 for all deciles, but the decrease wasparticularly marked for households in the second decile. Dependencyratios dropped by more than 50 percent in this decile, compared withabout 30 percent for all households, and were a contributing factor to highpoverty reduction rates in this decile. Indeed, households in the seconddecile were most likely to experience movement out of poverty between1990 and 2000.
Conclusion
Tunisia’s development strategy shows that good growth performance andsignificant poverty reduction can be achieved and maintained with limitedinitial resources and poor natural endowments. By providing jobs andresources for the public treasury to spend on lagging regions and poorhouseholds, growth has sharply reduced poverty.
Tunisia’s growth strategy, not just the pace of growth, was crucial forreducing poverty. The government invested heavily in education, health,and birth control programs that increased the quality of human capital inrural and urban areas. Rising educational levels, falling fertility rates, andincreased female participation in labor markets facilitated the contribution ofwomen to growth and poverty reduction. The government implementeddevelopment programs that gave rural areas the infrastructure they neededto develop agriculture and to interact with urban areas. A strategy based oncomparative advantage and the intensive use of labor also made a difference.The government stimulated development of labor-using industries and
216 Lahouel
services, providing the poor with attractive job opportunities and incomeand easing pressure on the rural labor market.
Tunisia continues to experience strong growth and improvements insocial indicators, along with increased infrastructure access. But someuncertainties raise questions about the future sustainability of Tunisia’s pro-poor growth experience. These uncertainties are underscored by decliningprivate investment.
Three of the most important challenges that Tunisia will need to addressto sustain its strong pro-poor growth record include redressing high unem-ployment rates, improving the quality of the institutional environment, andadapting to changes in the world trading environment, particularly at theEuropean Union (EU). High unemployment (15 percent) persists despiterelatively high growth. Low poverty cannot be maintained unless jobcreation, particularly for youth just reaching the job market, is accelerated.The quality of public institutions in Tunisia has declined since the late 1990s:Tunisia’s ranking on regulatory quality declined from the 67th percentile in1998 to 44th percentile in 2004, and the country’s voice and accountabilityindicators continue to remain significantly below those of other lower-middle-income countries.6 Changes in the international trading environ-ment offer both opportunities and challenges for growth and povertyreduction in Tunisia. Tunisia has benefited from geographical proximity tolarge developed countries, such as the EU countries, through access to theirlabor markets and remittances. Deeper integration with the EuropeanUnion through liberalization of services and internal reforms could lead tofaster growth and poverty alleviation.
Major challenges lie ahead. Because Tunisia’s manufacturing is largelyconcentrated in textiles and garments, the dismantling of the MFA presentsa big challenge in terms of both growth and poverty alleviation. In addition,liberalization of trade in agriculture may hurt poor farmers and shouldtherefore be accompanied by compensatory measures and appropriate poli-cies to facilitate the ensuing redeployment of productive resources.
Notes
1. The extent of poverty and its regional concentration depend on the definitionof the poverty line for rural and urban areas. The Tunisian national statistical office(INS) estimates the urban poverty line to be almost twice as high as the rural line.Consequently, three-fourths of the country’s poor appear to be in urban areas. WorldBank experts (World Bank 1995) think that the INS has largely overestimated the dif-ference between the two poverty lines and that removal of the bias will show thatpoverty is largely a rural phenomenon. The present analysis adopts the World Bankapproach mainly for the reason that it assesses the unit value of food consumption
The Success of Pro-Poor Growth in Rural and Urban Tunisia 217
by reference to a household group with a level of expenditures around the povertyline rather than to the whole first quintile, which is the INS approach.
2. This conclusion is based on data from the Tunisian Institut d’Economie Quan-titative. On the basis of employment surveys, a World Bank report (2004) argues thatagriculture accounts for a large share of job creation in the 1997–2001 period. Thesurveys show that about one-quarter of new jobs were created in agriculture in thatperiod, even though production decreased due to drought.
3. One additional feature of the Tunisian labor market, which has helped estab-lish stable relations between employers and employees in the organized sector since1990, is a system of collective bargaining through which wages are negotiated onceevery three years. This system, which can work only when inflation remains low andpredictable, has probably reduced work disruptions and negotiation costs comparedwith a system of annual collective bargaining. Such costs would have been borne, atleast partly, by workers in general and by low-skilled workers in particular.
4. Because enrollment data include out-of-age-group children, this rate mayexceed 100 percent.
5. These estimates are derived from an econometric wage equation based on the2001 Employment Survey of over 26,000 individuals.
6. See http://info.worldbank.org/governance/kkz2004/sc_chart.asp.
References
Easterly, W., and S. Fischer. 2001. “Inflation and the Poor.” Journal of Money, Creditand Banking 33 (2): 160–78.
Institut National de la Statistique (Republic of Tunisia). Various years. “Enquêtenationale sur le budget et la consommation des ménages.” Tunisia.
UNDP (United Nations Development Programme). 2004. “Stratégie de réduction dela pauvreté, Etude du phénomène de la pauvreté en Tunisie.” UNDP, Tunis.
Tuck, L., and K. Lindert. 1996. “From Universal Food Subsidies to a Self-TargetedProgram: A Case Study in Tunisian Reform.” World Bank Discussion PaperNo. 351, World Bank, Washington, DC.
World Bank. 1995. “Poverty Alleviation: Preserving Progress while Preparing for theFuture.” Report 13 993-TUN, Middle East and North Africa Region, World Bank,Washington, DC.
_______. 2003. “Republic of Tunisia: Poverty Update.” Middle East and North AfricaRegion, World Bank, Washington, DC.
_______. 2004. “Republic of Tunisia: Employment Strategy.” Middle East and NorthAfrica Region, Human Development Sector, World Bank, Washington, DC.
218 Lahouel
9Human Capital, Inequality, and Pro-Poor Growth in Brazil
Naércio Menezes-Filho and Lígia Vasconcellos1
How does growth affect poverty reduction in environments with extremeincome inequality? What are the main factors driving the relationshipamong growth, inequality, and poverty reduction? To answer these ques-tions, this chapter examines the case of pro-poor growth in Brazil, one of thelargest and least equitable economies in the developing world.
Understanding inequality and the role it plays in affecting the impact ofgrowth on poverty and other social outcomes is key to understandingBrazil’s relatively high rate of poverty. Inequality in Brazil is high relative toother countries and has been persistent. As a result, despite having a rela-tively high GDP per capita, poverty rates in Brazil are quite high comparedwith those of other countries in the same stage of development. Calcula-tions based on household surveys reveal that the top 1 percent of the popu-lation appropriates about 15 percent of all income generated in Brazil, andthe top 10 percent earn about half of all income. This pattern of highinequality persisted from the late 1970s through the late 1990s, contributingto the view that the stability of inequality in Brazil is “unacceptable”(Barros, Mendoça, and Henriques 2000).
What are the main determinants of inequality in Brazil? Ferreira, Leite,and Litchfield (2005) found that education accounted for more than one-third of total income inequality from 1981 to 2004 (table 9.1). Differences inmean wages across education groups accounted for 38 percent of totalinequality (measured by the Theil-L index) in 1981, 34 percent in 1993, and35 percent in 2004. By contrast, race, family type (stage in life cycle), region,
219
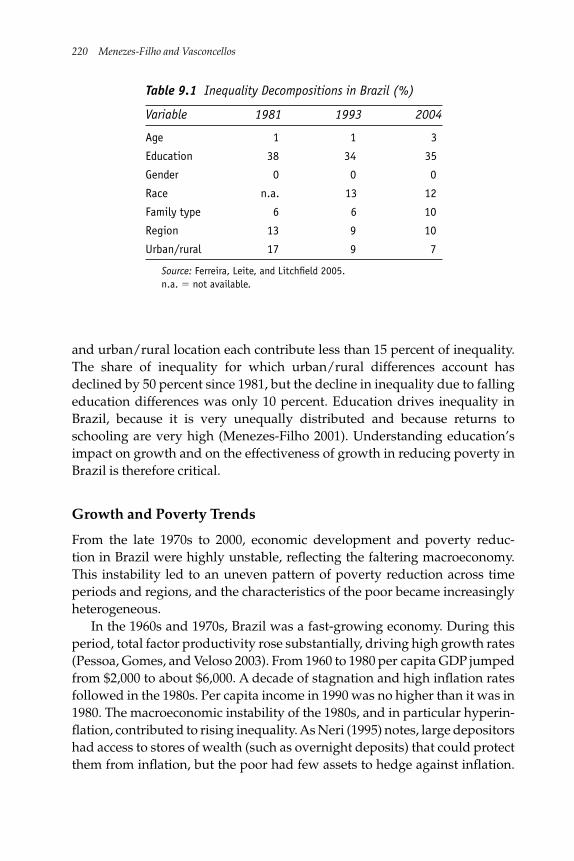
220 Menezes-Filho and Vasconcellos
and urban/rural location each contribute less than 15 percent of inequality.The share of inequality for which urban/rural differences account hasdeclined by 50 percent since 1981, but the decline in inequality due to fallingeducation differences was only 10 percent. Education drives inequality inBrazil, because it is very unequally distributed and because returns toschooling are very high (Menezes-Filho 2001). Understanding education’simpact on growth and on the effectiveness of growth in reducing poverty inBrazil is therefore critical.
Growth and Poverty Trends
From the late 1970s to 2000, economic development and poverty reduc-tion in Brazil were highly unstable, reflecting the faltering macroeconomy.This instability led to an uneven pattern of poverty reduction across timeperiods and regions, and the characteristics of the poor became increasinglyheterogeneous.
In the 1960s and 1970s, Brazil was a fast-growing economy. During thisperiod, total factor productivity rose substantially, driving high growth rates(Pessoa, Gomes, and Veloso 2003). From 1960 to 1980 per capita GDP jumpedfrom $2,000 to about $6,000. A decade of stagnation and high inflation ratesfollowed in the 1980s. Per capita income in 1990 was no higher than it was in1980. The macroeconomic instability of the 1980s, and in particular hyperin-flation, contributed to rising inequality. As Neri (1995) notes, large depositorshad access to stores of wealth (such as overnight deposits) that could protectthem from inflation, but the poor had few assets to hedge against inflation.
Table 9.1 Inequality Decompositions in Brazil (%)
Variable 1981 1993 2004
Age 1 1 3
Education 38 34 35
Gender 0 0 0
Race n.a. 13 12
Family type 6 6 10
Region 13 9 10
Urban/rural 17 9 7
Source: Ferreira, Leite, and Litchfield 2005.n.a. � not available.
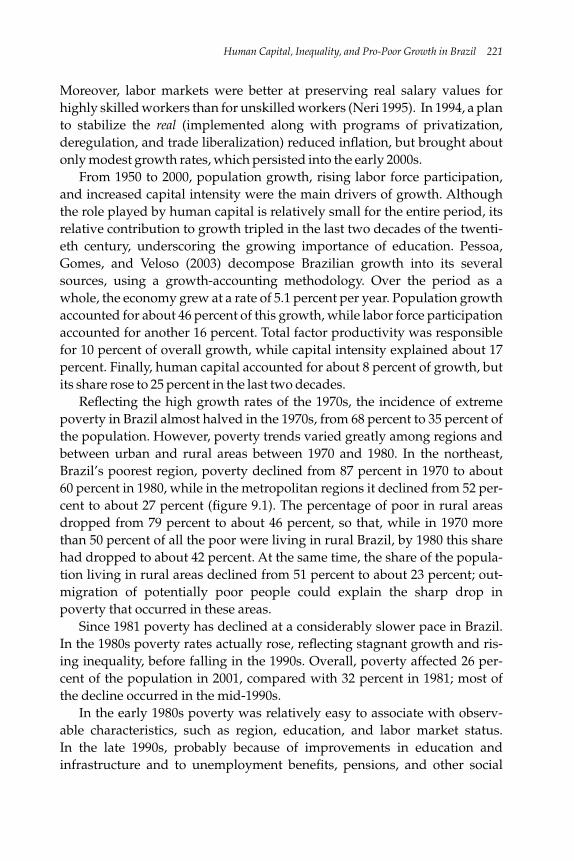
Human Capital, Inequality, and Pro-Poor Growth in Brazil 221
Moreover, labor markets were better at preserving real salary values forhighly skilled workers than for unskilled workers (Neri 1995). In 1994, a planto stabilize the real (implemented along with programs of privatization,deregulation, and trade liberalization) reduced inflation, but brought aboutonly modest growth rates, which persisted into the early 2000s.
From 1950 to 2000, population growth, rising labor force participation,and increased capital intensity were the main drivers of growth. Althoughthe role played by human capital is relatively small for the entire period, itsrelative contribution to growth tripled in the last two decades of the twenti-eth century, underscoring the growing importance of education. Pessoa,Gomes, and Veloso (2003) decompose Brazilian growth into its severalsources, using a growth-accounting methodology. Over the period as awhole, the economy grew at a rate of 5.1 percent per year. Population growthaccounted for about 46 percent of this growth, while labor force participationaccounted for another 16 percent. Total factor productivity was responsiblefor 10 percent of overall growth, while capital intensity explained about 17percent. Finally, human capital accounted for about 8 percent of growth, butits share rose to 25 percent in the last two decades.
Reflecting the high growth rates of the 1970s, the incidence of extremepoverty in Brazil almost halved in the 1970s, from 68 percent to 35 percent ofthe population. However, poverty trends varied greatly among regions andbetween urban and rural areas between 1970 and 1980. In the northeast,Brazil’s poorest region, poverty declined from 87 percent in 1970 to about60 percent in 1980, while in the metropolitan regions it declined from 52 per-cent to about 27 percent (figure 9.1). The percentage of poor in rural areasdropped from 79 percent to about 46 percent, so that, while in 1970 morethan 50 percent of all the poor were living in rural Brazil, by 1980 this sharehad dropped to about 42 percent. At the same time, the share of the popula-tion living in rural areas declined from 51 percent to about 23 percent; out-migration of potentially poor people could explain the sharp drop inpoverty that occurred in these areas.
Since 1981 poverty has declined at a considerably slower pace in Brazil.In the 1980s poverty rates actually rose, reflecting stagnant growth and ris-ing inequality, before falling in the 1990s. Overall, poverty affected 26 per-cent of the population in 2001, compared with 32 percent in 1981; most ofthe decline occurred in the mid-1990s.
In the early 1980s poverty was relatively easy to associate with observ-able characteristics, such as region, education, and labor market status.In the late 1990s, probably because of improvements in education andinfrastructure and to unemployment benefits, pensions, and other social
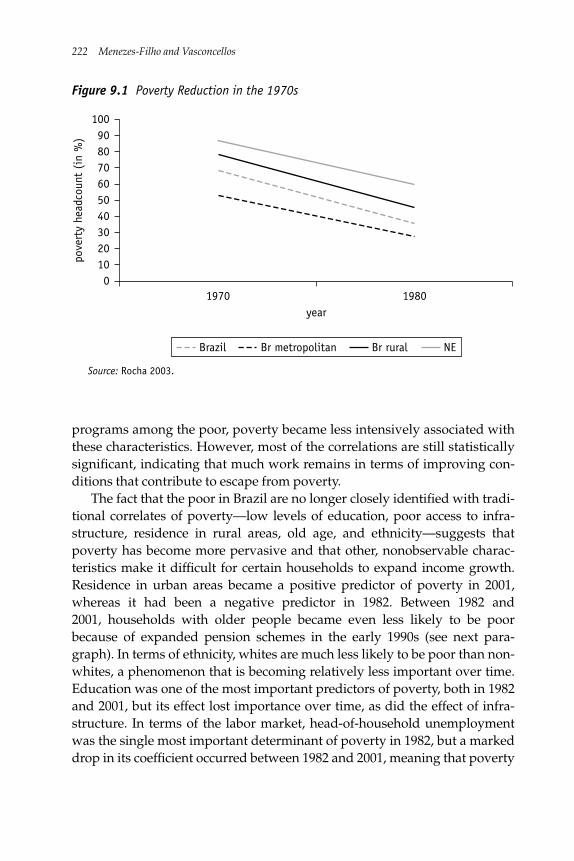
222 Menezes-Filho and Vasconcellos
programs among the poor, poverty became less intensively associated withthese characteristics. However, most of the correlations are still statisticallysignificant, indicating that much work remains in terms of improving con-ditions that contribute to escape from poverty.
The fact that the poor in Brazil are no longer closely identified with tradi-tional correlates of poverty—low levels of education, poor access to infra-structure, residence in rural areas, old age, and ethnicity—suggests thatpoverty has become more pervasive and that other, nonobservable charac-teristics make it difficult for certain households to expand income growth.Residence in urban areas became a positive predictor of poverty in 2001,whereas it had been a negative predictor in 1982. Between 1982 and2001, households with older people became even less likely to be poorbecause of expanded pension schemes in the early 1990s (see next para-graph). In terms of ethnicity, whites are much less likely to be poor than non-whites, a phenomenon that is becoming relatively less important over time.Education was one of the most important predictors of poverty, both in 1982and 2001, but its effect lost importance over time, as did the effect of infra-structure. In terms of the labor market, head-of-household unemploymentwas the single most important determinant of poverty in 1982, but a markeddrop in its coefficient occurred between 1982 and 2001, meaning that poverty
100
3020
50
10090
70
40
80
60
pove
rty
head
coun
t (i
n %
)
1970 1980year
Brazil NEBr metropolitan Br rural
Figure 9.1 Poverty Reduction in the 1970s
Source: Rocha 2003.
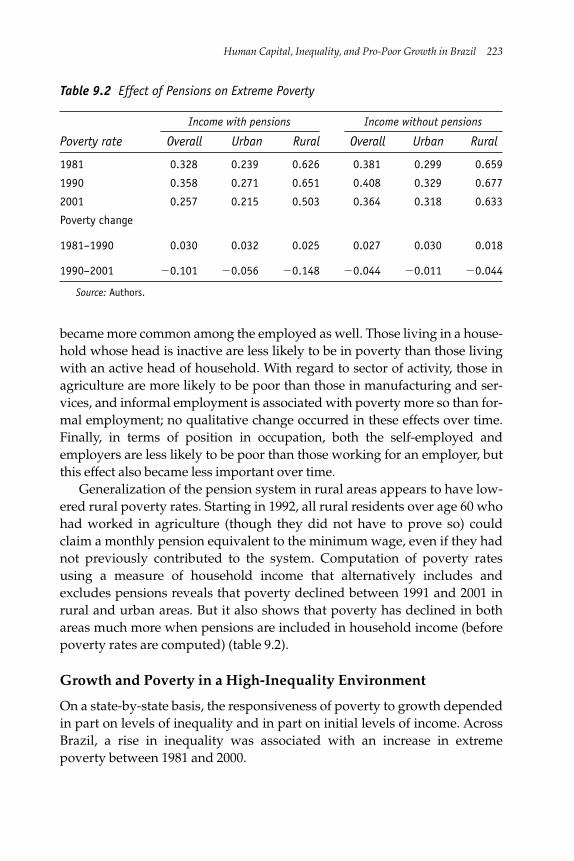
became more common among the employed as well. Those living in a house-hold whose head is inactive are less likely to be in poverty than those livingwith an active head of household. With regard to sector of activity, those inagriculture are more likely to be poor than those in manufacturing and ser-vices, and informal employment is associated with poverty more so than for-mal employment; no qualitative change occurred in these effects over time.Finally, in terms of position in occupation, both the self-employed andemployers are less likely to be poor than those working for an employer, butthis effect also became less important over time.
Generalization of the pension system in rural areas appears to have low-ered rural poverty rates. Starting in 1992, all rural residents over age 60 whohad worked in agriculture (though they did not have to prove so) couldclaim a monthly pension equivalent to the minimum wage, even if they hadnot previously contributed to the system. Computation of poverty ratesusing a measure of household income that alternatively includes andexcludes pensions reveals that poverty declined between 1991 and 2001 inrural and urban areas. But it also shows that poverty has declined in bothareas much more when pensions are included in household income (beforepoverty rates are computed) (table 9.2).
Growth and Poverty in a High-Inequality Environment
On a state-by-state basis, the responsiveness of poverty to growth dependedin part on levels of inequality and in part on initial levels of income. AcrossBrazil, a rise in inequality was associated with an increase in extremepoverty between 1981 and 2000.
Human Capital, Inequality, and Pro-Poor Growth in Brazil 223
Table 9.2 Effect of Pensions on Extreme Poverty
Income with pensions Income without pensions
Poverty rate Overall Urban Rural Overall Urban Rural
1981 0.328 0.239 0.626 0.381 0.299 0.659
1990 0.358 0.271 0.651 0.408 0.329 0.677
2001 0.257 0.215 0.503 0.364 0.318 0.633
Poverty change
1981–1990 0.030 0.032 0.025 0.027 0.030 0.018
1990–2001 �0.101 �0.056 �0.148 �0.044 �0.011 �0.044
Source: Authors.
Decomposing the Growth Elasticity of Poverty
What is the role of economic growth with respect to poverty reduction?Growth is clearly the major force behind poverty reduction, althoughinequality influences poverty levels’ sensitivity to the growth rate. The totalgrowth elasticity of poverty is defined as the relative change in the povertyheadcount between two periods for a 1 percent increase in mean income(assuming that the poverty line remains constant in real terms).
Brazil comprises 26 states in five regions. The growth elasticity ofpoverty in 19 of these states was calculated on the basis of data from Brazil’sannual national household survey (Pesquisa Nacional por Amostra de Domi-cilíos, or PNAD). Because PNAD does not cover much of the country’snorthern region (seven states), that region is not included in the followinganalysis, which covers five four-year intervals (1981–85, 1985–89, 1989–93,1993–97, 1997–2001).2
The analysis reveals that growth is more effective in reducing extremepoverty than moderate poverty. The growth elasticity of extreme povertyusing the headcount measure [FGT(0)] in Brazil is �0.89, while theelasticity of moderate poverty is �0.52. The elasticities obtained when thepoverty gap [FGT(1)] and the squared poverty gap [FGT(2)] are used aspoverty measures are all higher—in the range of �1 for extreme poverty—indicating that growth affects the intensity of poverty more strongly thanthe number of poor in Brazil.
To what extent does the responsiveness of poverty to growth vary acrossstates in Brazil? Bourguignon (2003) points out that the reduction of povertyin a given population is analytically linked to the growth of mean incomeand the change in the distribution of relative incomes. More precisely, thegrowth elasticity of poverty is an increasing function of the level of develop-ment and a decreasing function of the degree of initial income inequality.3
When the actual poverty reduction (over the whole period) is plottedagainst the change predicted by this model, it appears that growth does agood job in predicting poverty reduction for some states. But in other states(like Santa Catarina), poverty is reduced by much more than predicted byits income growth, and in still others (like Piauí) poverty is reduced muchless than predicted.
How much does distributional change affect the total growth elasticityof poverty? By making the change in the Gini coefficient an additional con-trol, which attracts a positive and highly significant coefficient, the growthelasticity of poverty becomes �1. But the introduction of change in inequal-ity in the model still does not help predict the behavior of poverty reductionin states where growth alone was not a good predictor.
224 Menezes-Filho and Vasconcellos
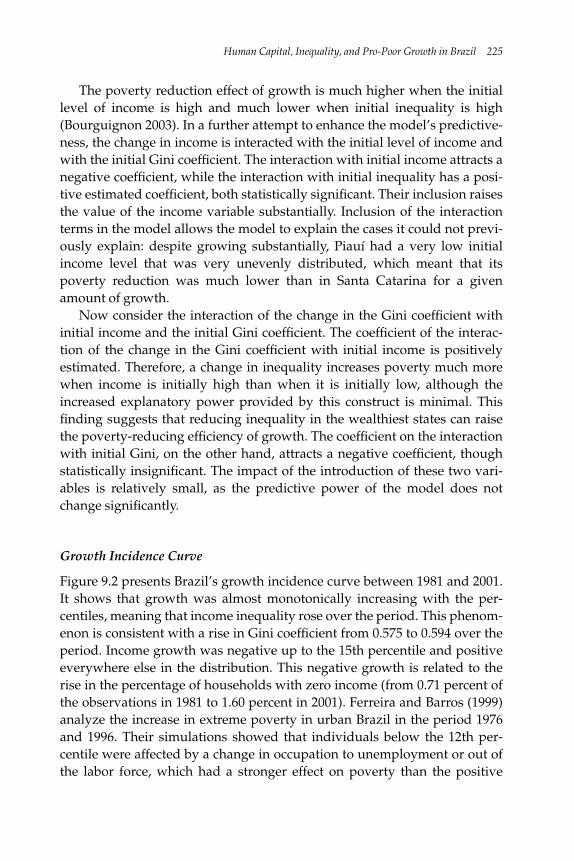
The poverty reduction effect of growth is much higher when the initiallevel of income is high and much lower when initial inequality is high(Bourguignon 2003). In a further attempt to enhance the model’s predictive-ness, the change in income is interacted with the initial level of income andwith the initial Gini coefficient. The interaction with initial income attracts anegative coefficient, while the interaction with initial inequality has a posi-tive estimated coefficient, both statistically significant. Their inclusion raisesthe value of the income variable substantially. Inclusion of the interactionterms in the model allows the model to explain the cases it could not previ-ously explain: despite growing substantially, Piauí had a very low initialincome level that was very unevenly distributed, which meant that itspoverty reduction was much lower than in Santa Catarina for a givenamount of growth.
Now consider the interaction of the change in the Gini coefficient withinitial income and the initial Gini coefficient. The coefficient of the interac-tion of the change in the Gini coefficient with initial income is positivelyestimated. Therefore, a change in inequality increases poverty much morewhen income is initially high than when it is initially low, although theincreased explanatory power provided by this construct is minimal. Thisfinding suggests that reducing inequality in the wealthiest states can raisethe poverty-reducing efficiency of growth. The coefficient on the interactionwith initial Gini, on the other hand, attracts a negative coefficient, thoughstatistically insignificant. The impact of the introduction of these two vari-ables is relatively small, as the predictive power of the model does notchange significantly.
Growth Incidence Curve
Figure 9.2 presents Brazil’s growth incidence curve between 1981 and 2001.It shows that growth was almost monotonically increasing with the per-centiles, meaning that income inequality rose over the period. This phenom-enon is consistent with a rise in Gini coefficient from 0.575 to 0.594 over theperiod. Income growth was negative up to the 15th percentile and positiveeverywhere else in the distribution. This negative growth is related to therise in the percentage of households with zero income (from 0.71 percent ofthe observations in 1981 to 1.60 percent in 2001). Ferreira and Barros (1999)analyze the increase in extreme poverty in urban Brazil in the period 1976and 1996. Their simulations showed that individuals below the 12th per-centile were affected by a change in occupation to unemployment or out ofthe labor force, which had a stronger effect on poverty than the positive
Human Capital, Inequality, and Pro-Poor Growth in Brazil 225
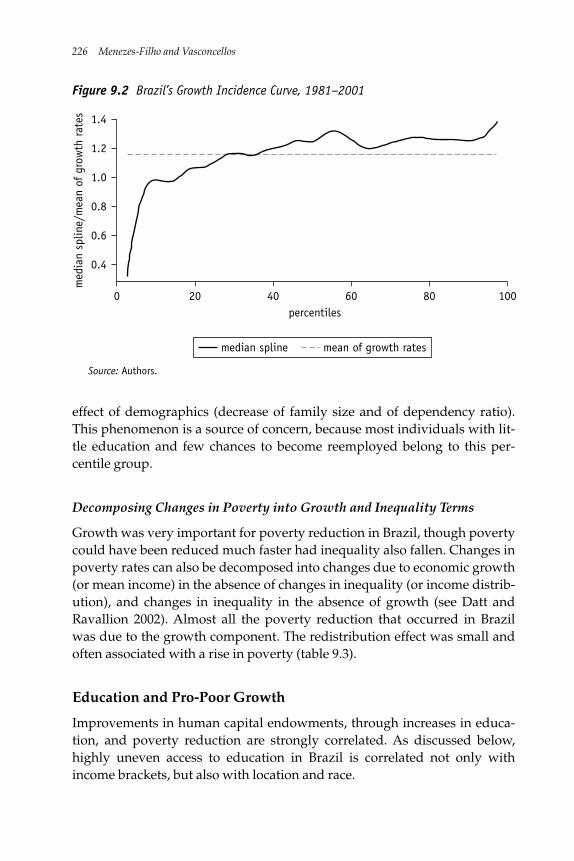
effect of demographics (decrease of family size and of dependency ratio).This phenomenon is a source of concern, because most individuals with lit-tle education and few chances to become reemployed belong to this per-centile group.
Decomposing Changes in Poverty into Growth and Inequality Terms
Growth was very important for poverty reduction in Brazil, though povertycould have been reduced much faster had inequality also fallen. Changes inpoverty rates can also be decomposed into changes due to economic growth(or mean income) in the absence of changes in inequality (or income distrib-ution), and changes in inequality in the absence of growth (see Datt andRavallion 2002). Almost all the poverty reduction that occurred in Brazilwas due to the growth component. The redistribution effect was small andoften associated with a rise in poverty (table 9.3).
Education and Pro-Poor Growth
Improvements in human capital endowments, through increases in educa-tion, and poverty reduction are strongly correlated. As discussed below,highly uneven access to education in Brazil is correlated not only withincome brackets, but also with location and race.
226 Menezes-Filho and Vasconcellos
0.4
0.6
0.8
1.4
1.2
1.0
med
ian
splin
e/m
ean
of g
row
th r
ates
0 20 40 60 80 100percentiles
median spline mean of growth rates
Figure 9.2 Brazil’s Growth Incidence Curve, 1981–2001
Source: Authors.
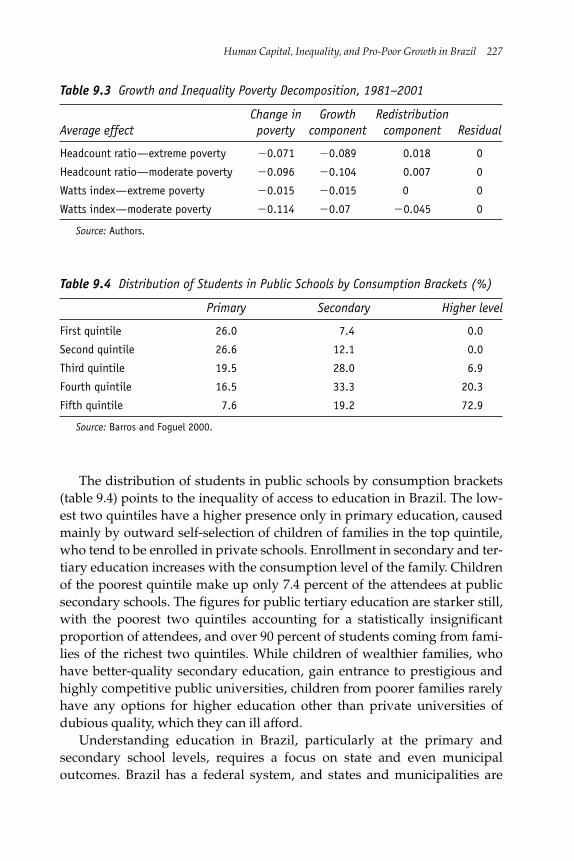
The distribution of students in public schools by consumption brackets(table 9.4) points to the inequality of access to education in Brazil. The low-est two quintiles have a higher presence only in primary education, causedmainly by outward self-selection of children of families in the top quintile,who tend to be enrolled in private schools. Enrollment in secondary and ter-tiary education increases with the consumption level of the family. Childrenof the poorest quintile make up only 7.4 percent of the attendees at publicsecondary schools. The figures for public tertiary education are starker still,with the poorest two quintiles accounting for a statistically insignificantproportion of attendees, and over 90 percent of students coming from fami-lies of the richest two quintiles. While children of wealthier families, whohave better-quality secondary education, gain entrance to prestigious andhighly competitive public universities, children from poorer families rarelyhave any options for higher education other than private universities ofdubious quality, which they can ill afford.
Understanding education in Brazil, particularly at the primary andsecondary school levels, requires a focus on state and even municipaloutcomes. Brazil has a federal system, and states and municipalities are
Human Capital, Inequality, and Pro-Poor Growth in Brazil 227
Table 9.3 Growth and Inequality Poverty Decomposition, 1981–2001
Change in Growth Redistribution Average effect poverty component component Residual
Headcount ratio—extreme poverty �0.071 �0.089 0.018 0
Headcount ratio—moderate poverty �0.096 �0.104 0.007 0
Watts index—extreme poverty �0.015 �0.015 0 0
Watts index—moderate poverty �0.114 �0.07 �0.045 0
Source: Authors.
Table 9.4 Distribution of Students in Public Schools by Consumption Brackets (%)
Primary Secondary Higher level
First quintile 26.0 7.4 0.0
Second quintile 26.6 12.1 0.0
Third quintile 19.5 28.0 6.9
Fourth quintile 16.5 33.3 20.3
Fifth quintile 7.6 19.2 72.9
Source: Barros and Foguel 2000.
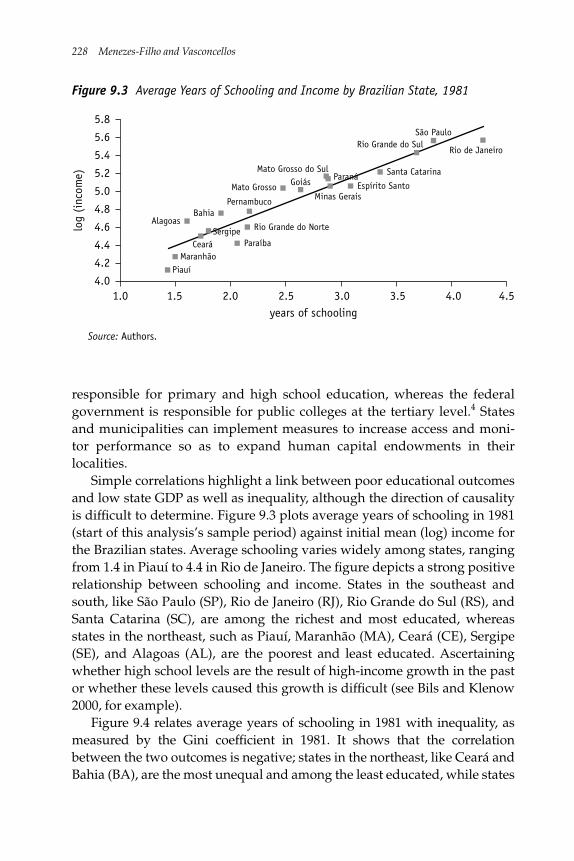
responsible for primary and high school education, whereas the federalgovernment is responsible for public colleges at the tertiary level.4 Statesand municipalities can implement measures to increase access and moni-tor performance so as to expand human capital endowments in theirlocalities.
Simple correlations highlight a link between poor educational outcomesand low state GDP as well as inequality, although the direction of causalityis difficult to determine. Figure 9.3 plots average years of schooling in 1981(start of this analysis’s sample period) against initial mean (log) income forthe Brazilian states. Average schooling varies widely among states, rangingfrom 1.4 in Piauí to 4.4 in Rio de Janeiro. The figure depicts a strong positiverelationship between schooling and income. States in the southeast andsouth, like São Paulo (SP), Rio de Janeiro (RJ), Rio Grande do Sul (RS), andSanta Catarina (SC), are among the richest and most educated, whereasstates in the northeast, such as Piauí, Maranhão (MA), Ceará (CE), Sergipe(SE), and Alagoas (AL), are the poorest and least educated. Ascertainingwhether high school levels are the result of high-income growth in the pastor whether these levels caused this growth is difficult (see Bils and Klenow2000, for example).
Figure 9.4 relates average years of schooling in 1981 with inequality, asmeasured by the Gini coefficient in 1981. It shows that the correlationbetween the two outcomes is negative; states in the northeast, like Ceará andBahia (BA), are the most unequal and among the least educated, while states
228 Menezes-Filho and Vasconcellos
log
(inc
ome)
years of schooling
5.8
5.6
5.4
5.2
5.0
4.8
4.6
4.4
4.2
4.04.51.0 1.5 2.0 2.5 3.0 3.5 4.0
Alagoas
MaranhãoParaíbaCeará
Sergipe
BahiaPernambuco
Mato Grosso GoiásMato Grosso do Sul
Paraná
Minas GeraisEspírito Santo
Santa Catarina
Rio Grande do SulSão Paulo
Rio de Janeiro
Rio Grande do Norte
Piauí
Figure 9.3 Average Years of Schooling and Income by Brazilian State, 1981
Source: Authors.
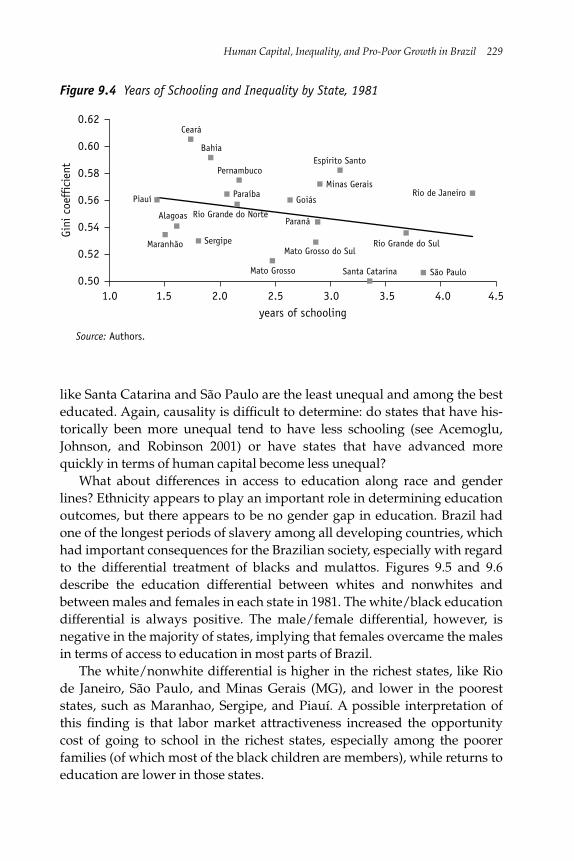
like Santa Catarina and São Paulo are the least unequal and among the besteducated. Again, causality is difficult to determine: do states that have his-torically been more unequal tend to have less schooling (see Acemoglu,Johnson, and Robinson 2001) or have states that have advanced morequickly in terms of human capital become less unequal?
What about differences in access to education along race and genderlines? Ethnicity appears to play an important role in determining educationoutcomes, but there appears to be no gender gap in education. Brazil hadone of the longest periods of slavery among all developing countries, whichhad important consequences for the Brazilian society, especially with regardto the differential treatment of blacks and mulattos. Figures 9.5 and 9.6describe the education differential between whites and nonwhites andbetween males and females in each state in 1981. The white/black educationdifferential is always positive. The male/female differential, however, isnegative in the majority of states, implying that females overcame the malesin terms of access to education in most parts of Brazil.
The white/nonwhite differential is higher in the richest states, like Riode Janeiro, São Paulo, and Minas Gerais (MG), and lower in the pooreststates, such as Maranhao, Sergipe, and Piauí. A possible interpretation ofthis finding is that labor market attractiveness increased the opportunitycost of going to school in the richest states, especially among the poorerfamilies (of which most of the black children are members), while returns toeducation are lower in those states.
Human Capital, Inequality, and Pro-Poor Growth in Brazil 229Gi
ni c
oeff
icie
nt
years of schooling
0.62
0.60
0.58
0.56
0.54
0.52
0.504.51.0 1.5 2.0 2.5 3.0 3.5 4.0
Ceará
Bahia
Pernambuco
Paraíba
Rio Grande do Norte
Goiás
Minas Gerais
Espírito Santo
Paraná
Mato Grosso do Sul
Mato Grosso
SergipeMaranhão
Alagoas
Piauí
Santa Catarina São Paulo
Rio Grande do Sul
Rio de Janeiro
Figure 9.4 Years of Schooling and Inequality by State, 1981
Source: Authors.
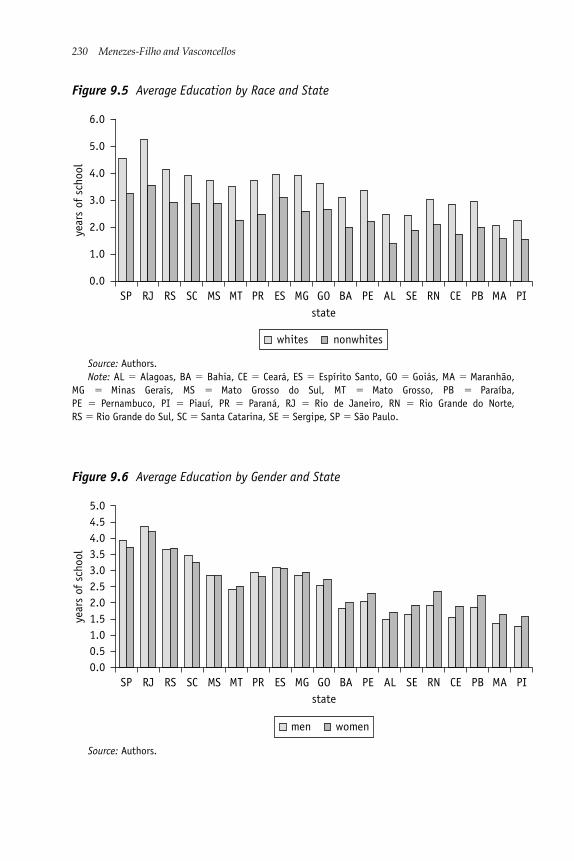
230 Menezes-Filho and Vasconcellos
0.0
1.0
2.0
3.0
4.0
5.0
6.0
whites nonwhites
SP RJ RS SC MS MT PR ES MG GO BA PE AL SE RN CE PB MA PI
year
s of
sch
ool
state
Figure 9.5 Average Education by Race and State
Source: Authors.Note: AL � Alagoas, BA � Bahia, CE � Ceará, ES � Espírito Santo, GO � Goiás, MA � Maranhão,
MG � Minas Gerais, MS � Mato Grosso do Sul, MT � Mato Grosso, PB � Paraíba, PE � Pernambuco, PI � Piauí, PR � Paraná, RJ � Rio de Janeiro, RN � Rio Grande do Norte, RS � Rio Grande do Sul, SC � Santa Catarina, SE � Sergipe, SP � São Paulo.
Source: Authors.
0.0
1.01.5
0.5
2.02.53.03.5
4.54.0
5.0
men women
SP RJ RS SC MS MT PR ES MG GO BA PE AL SE RN CE PB MA PI
year
s of
sch
ool
state
Figure 9.6 Average Education by Gender and State
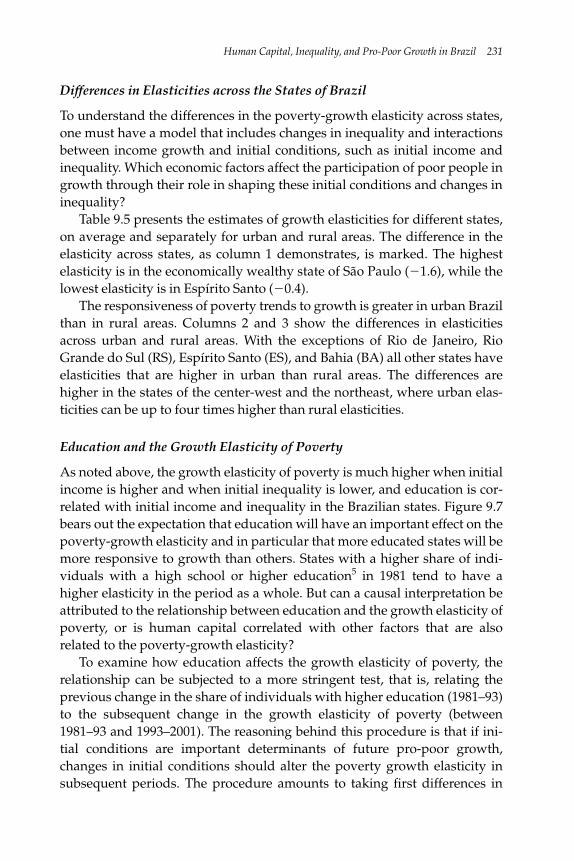
Differences in Elasticities across the States of Brazil
To understand the differences in the poverty-growth elasticity across states,one must have a model that includes changes in inequality and interactionsbetween income growth and initial conditions, such as initial income andinequality. Which economic factors affect the participation of poor people ingrowth through their role in shaping these initial conditions and changes ininequality?
Table 9.5 presents the estimates of growth elasticities for different states,on average and separately for urban and rural areas. The difference in theelasticity across states, as column 1 demonstrates, is marked. The highestelasticity is in the economically wealthy state of São Paulo (�1.6), while thelowest elasticity is in Espírito Santo (�0.4).
The responsiveness of poverty trends to growth is greater in urban Brazilthan in rural areas. Columns 2 and 3 show the differences in elasticitiesacross urban and rural areas. With the exceptions of Rio de Janeiro, RioGrande do Sul (RS), Espírito Santo (ES), and Bahia (BA) all other states haveelasticities that are higher in urban than rural areas. The differences arehigher in the states of the center-west and the northeast, where urban elas-ticities can be up to four times higher than rural elasticities.
Education and the Growth Elasticity of Poverty
As noted above, the growth elasticity of poverty is much higher when initialincome is higher and when initial inequality is lower, and education is cor-related with initial income and inequality in the Brazilian states. Figure 9.7bears out the expectation that education will have an important effect on thepoverty-growth elasticity and in particular that more educated states will bemore responsive to growth than others. States with a higher share of indi-viduals with a high school or higher education5 in 1981 tend to have ahigher elasticity in the period as a whole. But can a causal interpretation beattributed to the relationship between education and the growth elasticity ofpoverty, or is human capital correlated with other factors that are alsorelated to the poverty-growth elasticity?
To examine how education affects the growth elasticity of poverty, therelationship can be subjected to a more stringent test, that is, relating theprevious change in the share of individuals with higher education (1981–93)to the subsequent change in the growth elasticity of poverty (between1981–93 and 1993–2001). The reasoning behind this procedure is that if ini-tial conditions are important determinants of future pro-poor growth,changes in initial conditions should alter the poverty growth elasticity insubsequent periods. The procedure amounts to taking first differences in
Human Capital, Inequality, and Pro-Poor Growth in Brazil 231
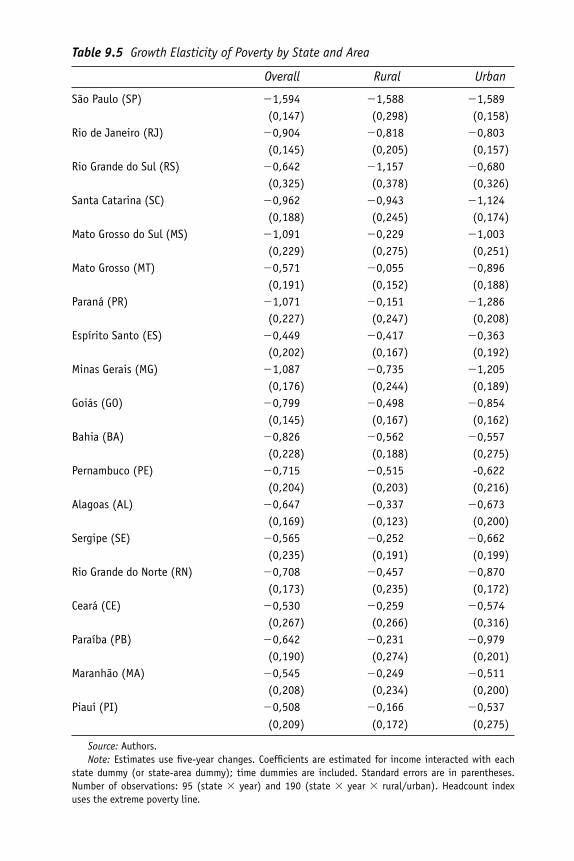
Table 9.5 Growth Elasticity of Poverty by State and Area
Overall Rural Urban
São Paulo (SP) �1,594 �1,588 �1,589(0,147) (0,298) (0,158)
Rio de Janeiro (RJ) �0,904 �0,818 �0,803(0,145) (0,205) (0,157)
Rio Grande do Sul (RS) �0,642 �1,157 �0,680(0,325) (0,378) (0,326)
Santa Catarina (SC) �0,962 �0,943 �1,124(0,188) (0,245) (0,174)
Mato Grosso do Sul (MS) �1,091 �0,229 �1,003(0,229) (0,275) (0,251)
Mato Grosso (MT) �0,571 �0,055 �0,896(0,191) (0,152) (0,188)
Paraná (PR) �1,071 �0,151 �1,286(0,227) (0,247) (0,208)
Espírito Santo (ES) �0,449 �0,417 �0,363(0,202) (0,167) (0,192)
Minas Gerais (MG) �1,087 �0,735 �1,205(0,176) (0,244) (0,189)
Goiás (GO) �0,799 �0,498 �0,854(0,145) (0,167) (0,162)
Bahia (BA) �0,826 �0,562 �0,557(0,228) (0,188) (0,275)
Pernambuco (PE) �0,715 �0,515 -0,622(0,204) (0,203) (0,216)
Alagoas (AL) �0,647 �0,337 �0,673(0,169) (0,123) (0,200)
Sergipe (SE) �0,565 �0,252 �0,662(0,235) (0,191) (0,199)
Rio Grande do Norte (RN) �0,708 �0,457 �0,870(0,173) (0,235) (0,172)
Ceará (CE) �0,530 �0,259 �0,574(0,267) (0,266) (0,316)
Paraíba (PB) �0,642 �0,231 �0,979(0,190) (0,274) (0,201)
Maranhão (MA) �0,545 �0,249 �0,511(0,208) (0,234) (0,200)
Piauí (PI) �0,508 �0,166 �0,537(0,209) (0,172) (0,275)
Source: Authors.Note: Estimates use five-year changes. Coefficients are estimated for income interacted with each
state dummy (or state-area dummy); time dummies are included. Standard errors are in parentheses.Number of observations: 95 (state � year) and 190 (state � year � rural/urban). Headcount indexuses the extreme poverty line.
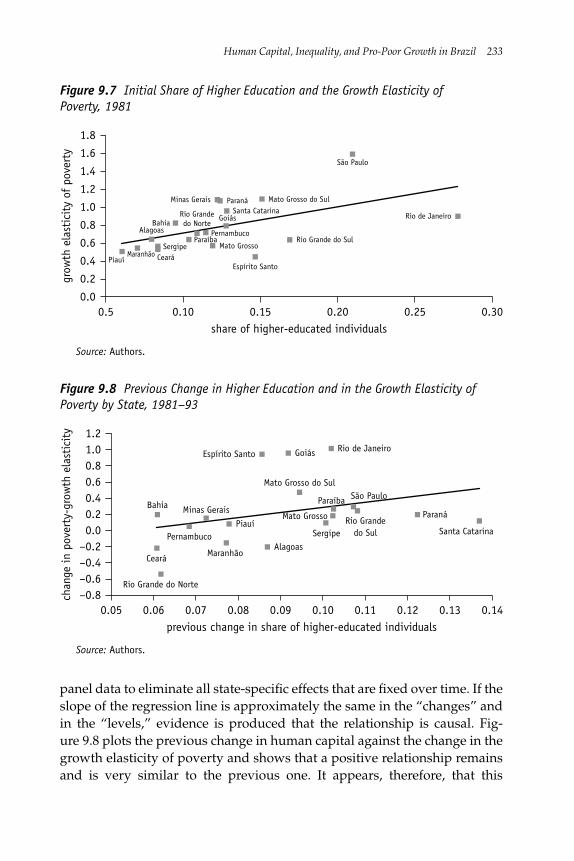
panel data to eliminate all state-specific effects that are fixed over time. If theslope of the regression line is approximately the same in the “changes” andin the “levels,” evidence is produced that the relationship is causal. Fig-ure 9.8 plots the previous change in human capital against the change in thegrowth elasticity of poverty and shows that a positive relationship remainsand is very similar to the previous one. It appears, therefore, that this
Human Capital, Inequality, and Pro-Poor Growth in Brazil 233gr
owth
ela
stic
ity
of p
over
ty
share of higher-educated individuals
1.8
1.6
1.4
1.2
1.0
0.8
0.6
0.4
0.2
0.00.5 0.10 0.15 0.20 0.25 0.30
PiauíMaranhão
Alagoas
Ceará
Paraíba
BahiaRio Grandedo Norte
Pernambuco
Mato Grosso
GoiásSanta Catarina
Paraná Mato Grosso do Sul
Rio Grande do Sul
São Paulo
Rio de Janeiro
Espírito Santo
Minas Gerais
Sergipe
Figure 9.7 Initial Share of Higher Education and the Growth Elasticity ofPoverty, 1981
Source: Authors.
chan
ge in
pov
erty
-gro
wth
ela
stic
ity
previous change in share of higher-educated individuals
1.21.00.80.60.40.20.0
–0.2–0.4
–0.8–0.6
0.05 0.06 0.07 0.08 0.09 0.140.10 0.11 0.12 0.13
Ceará
Rio Grande do Norte
Bahia
Pernambuco
Minas Gerais
Piauí
MaranhãoAlagoas
Mato Grosso do Sul
Sergipe
Mato Grosso
Paraíba
Rio Grandedo Sul
São Paulo
Paraná
Santa Catarina
Rio de JaneiroGoiásEspírito Santo
Figure 9.8 Previous Change in Higher Education and in the Growth Elasticity ofPoverty by State, 1981–93
Source: Authors.
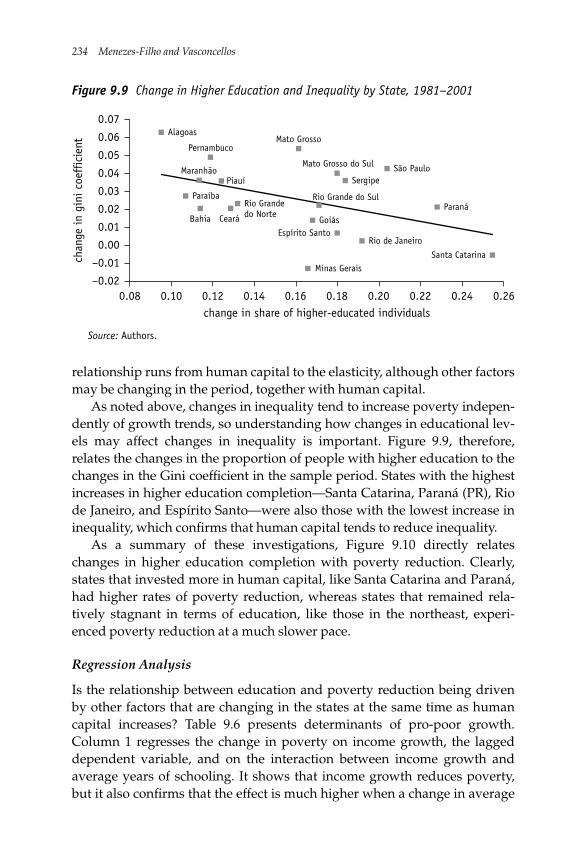
relationship runs from human capital to the elasticity, although other factorsmay be changing in the period, together with human capital.
As noted above, changes in inequality tend to increase poverty indepen-dently of growth trends, so understanding how changes in educational lev-els may affect changes in inequality is important. Figure 9.9, therefore,relates the changes in the proportion of people with higher education to thechanges in the Gini coefficient in the sample period. States with the highestincreases in higher education completion—Santa Catarina, Paraná (PR), Riode Janeiro, and Espírito Santo—were also those with the lowest increase ininequality, which confirms that human capital tends to reduce inequality.
As a summary of these investigations, Figure 9.10 directly relateschanges in higher education completion with poverty reduction. Clearly,states that invested more in human capital, like Santa Catarina and Paraná,had higher rates of poverty reduction, whereas states that remained rela-tively stagnant in terms of education, like those in the northeast, experi-enced poverty reduction at a much slower pace.
Regression Analysis
Is the relationship between education and poverty reduction being drivenby other factors that are changing in the states at the same time as humancapital increases? Table 9.6 presents determinants of pro-poor growth.Column 1 regresses the change in poverty on income growth, the laggeddependent variable, and on the interaction between income growth andaverage years of schooling. It shows that income growth reduces poverty,but it also confirms that the effect is much higher when a change in average
234 Menezes-Filho and Vasconcellos
chan
ge in
gin
i coe
ffic
ient
change in share of higher-educated individuals
0.01
0.02
0.03
0.04
0.05
0.06
0.07
0.00
–0.02
–0.01
0.08 0.10 0.12 0.14 0.16 0.18 0.20 0.22 0.24 0.26
Bahia
Paraíba
MaranhãoPiauí
PernambucoMato Grosso
Mato Grosso do Sul
SergipeSão Paulo
Paraná
Santa Catarina
Rio de Janeiro
Minas Gerais
Espírito SantoGoiás
Rio Grande do SulRio Grandedo NorteCeará
Alagoas
Figure 9.9 Change in Higher Education and Inequality by State, 1981–2001
Source: Authors.
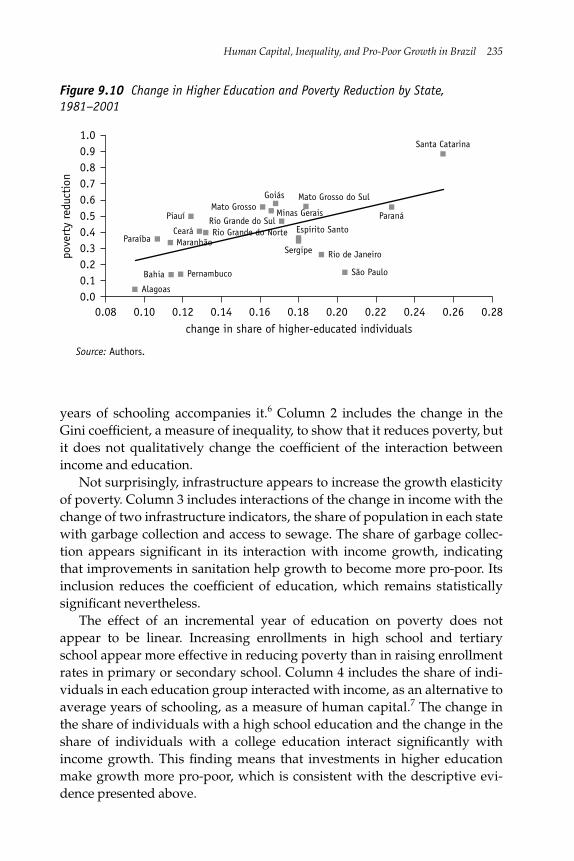
Human Capital, Inequality, and Pro-Poor Growth in Brazil 235po
vert
y re
duct
ion
change in share of higher-educated individuals
1.00.90.80.70.60.50.40.30.2
0.00.1
Bahia Pernambuco
Alagoas
MaranhãoParaíba
Piauí
Ceará Rio Grande do Norte
Mato GrossoGoiás
Minas GeraisRio Grande do Sul
Espírito Santo
Sergipe Rio de Janeiro
São Paulo
Paraná
Santa Catarina
Mato Grosso do Sul
0.08 0.10 0.12 0.14 0.16 0.18 0.20 0.22 0.24 0.280.26
Figure 9.10 Change in Higher Education and Poverty Reduction by State,1981–2001
Source: Authors.
years of schooling accompanies it.6 Column 2 includes the change in theGini coefficient, a measure of inequality, to show that it reduces poverty, butit does not qualitatively change the coefficient of the interaction betweenincome and education.
Not surprisingly, infrastructure appears to increase the growth elasticityof poverty. Column 3 includes interactions of the change in income with thechange of two infrastructure indicators, the share of population in each statewith garbage collection and access to sewage. The share of garbage collec-tion appears significant in its interaction with income growth, indicatingthat improvements in sanitation help growth to become more pro-poor. Itsinclusion reduces the coefficient of education, which remains statisticallysignificant nevertheless.
The effect of an incremental year of education on poverty does notappear to be linear. Increasing enrollments in high school and tertiaryschool appear more effective in reducing poverty than in raising enrollmentrates in primary or secondary school. Column 4 includes the share of indi-viduals in each education group interacted with income, as an alternative toaverage years of schooling, as a measure of human capital.7 The change inthe share of individuals with a high school education and the change in theshare of individuals with a college education interact significantly withincome growth. This finding means that investments in higher educationmake growth more pro-poor, which is consistent with the descriptive evi-dence presented above.
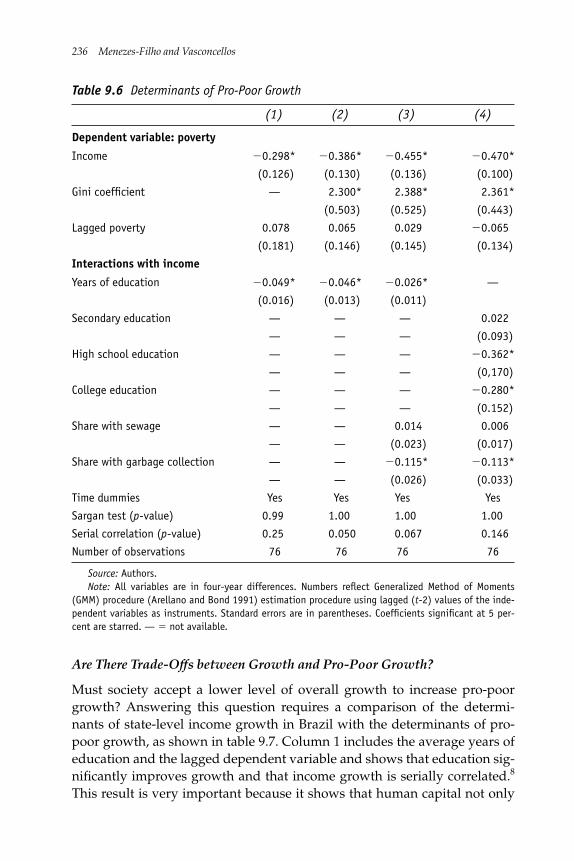
Are There Trade-Offs between Growth and Pro-Poor Growth?
Must society accept a lower level of overall growth to increase pro-poorgrowth? Answering this question requires a comparison of the determi-nants of state-level income growth in Brazil with the determinants of pro-poor growth, as shown in table 9.7. Column 1 includes the average years ofeducation and the lagged dependent variable and shows that education sig-nificantly improves growth and that income growth is serially correlated.8
This result is very important because it shows that human capital not only
236 Menezes-Filho and Vasconcellos
Table 9.6 Determinants of Pro-Poor Growth
(1) (2) (3) (4)
Dependent variable: poverty
Income �0.298* �0.386* �0.455* �0.470*
(0.126) (0.130) (0.136) (0.100)
Gini coefficient — 2.300* 2.388* 2.361*
(0.503) (0.525) (0.443)
Lagged poverty 0.078 0.065 0.029 �0.065
(0.181) (0.146) (0.145) (0.134)
Interactions with income
Years of education �0.049* �0.046* �0.026* —
(0.016) (0.013) (0.011)
Secondary education — — — 0.022
— — — (0.093)
High school education — — — �0.362*
— — — (0,170)
College education — — — �0.280*
— — — (0.152)
Share with sewage — — 0.014 0.006
— — (0.023) (0.017)
Share with garbage collection — — �0.115* �0.113*
— — (0.026) (0.033)
Time dummies Yes Yes Yes Yes
Sargan test (p-value) 0.99 1.00 1.00 1.00
Serial correlation (p-value) 0.25 0.050 0.067 0.146
Number of observations 76 76 76 76
Source: Authors.Note: All variables are in four-year differences. Numbers reflect Generalized Method of Moments
(GMM) procedure (Arellano and Bond 1991) estimation procedure using lagged (t-2) values of the inde-pendent variables as instruments. Standard errors are in parentheses. Coefficients significant at 5 per-cent are starred. — � not available.
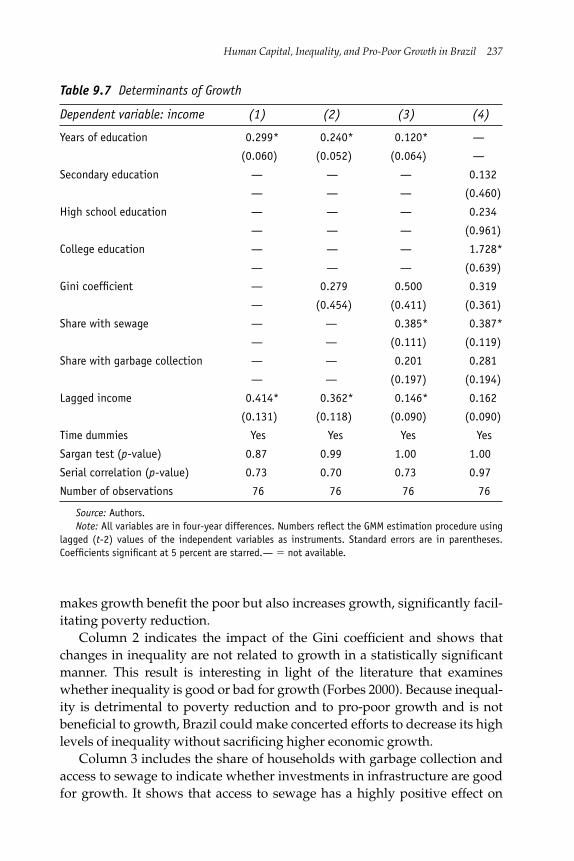
makes growth benefit the poor but also increases growth, significantly facil-itating poverty reduction.
Column 2 indicates the impact of the Gini coefficient and shows thatchanges in inequality are not related to growth in a statistically significantmanner. This result is interesting in light of the literature that examineswhether inequality is good or bad for growth (Forbes 2000). Because inequal-ity is detrimental to poverty reduction and to pro-poor growth and is notbeneficial to growth, Brazil could make concerted efforts to decrease its highlevels of inequality without sacrificing higher economic growth.
Column 3 includes the share of households with garbage collection andaccess to sewage to indicate whether investments in infrastructure are goodfor growth. It shows that access to sewage has a highly positive effect on
Human Capital, Inequality, and Pro-Poor Growth in Brazil 237
Table 9.7 Determinants of Growth
Dependent variable: income (1) (2) (3) (4)
Years of education 0.299* 0.240* 0.120* —
(0.060) (0.052) (0.064) —
Secondary education — — — 0.132
— — — (0.460)
High school education — — — 0.234
— — — (0.961)
College education — — — 1.728*
— — — (0.639)
Gini coefficient — 0.279 0.500 0.319
— (0.454) (0.411) (0.361)
Share with sewage — — 0.385* 0.387*
— — (0.111) (0.119)
Share with garbage collection — — 0.201 0.281
— — (0.197) (0.194)
Lagged income 0.414* 0.362* 0.146* 0.162
(0.131) (0.118) (0.090) (0.090)
Time dummies Yes Yes Yes Yes
Sargan test (p-value) 0.87 0.99 1.00 1.00
Serial correlation (p-value) 0.73 0.70 0.73 0.97
Number of observations 76 76 76 76
Source: Authors.Note: All variables are in four-year differences. Numbers reflect the GMM estimation procedure using
lagged (t-2) values of the independent variables as instruments. Standard errors are in parentheses.Coefficients significant at 5 percent are starred.— � not available.
growth. Its inclusion reduces the coefficient of the schooling variable byhalf, meaning that investments in infrastructure and in human capital arepositively correlated. In spite of that, the schooling variable remains statisti-cally significant.
Which stage of human capital achievement is more important togrowth? Column 4 includes the change in the share of the population withsecondary, high school, and college education in each state in the growthregression. The share of college-educated individuals is the variable thatattracts the highest coefficient and the only one that is statistically signifi-cant. The inequality coefficient remains insignificantly different from zero,and the share of households with access to sewage remains an importantdeterminant of income growth.
It appears, therefore, that both high school and college education areimportant determinants of pro-poor growth. But only college education isan important determinant of growth. These results suggest that althougheducation is important for growth and pro-poor growth, there maybe trade-offs associated with returns to investments in each education level: invest-ments in high school appear to be more important than investments incollege education in making growth beneficial to the poor but investmentsin high school alone do not improve growth prospects, whereas invest-ments in college education are an important determinant of growth but areless effective in making growth pro-poor.
Recent Trends: Possible Explanations for Falling Inequality
Though inequality in Brazil has been memorably described as “unacceptablystable” (Barros, Mendoça, and Henriques 2000), the most recent trends aremore promising. The Gini coefficient has declined steadily, though not dra-matically, since 1993. Recent research has recognized changing patterns inthe composition of inequality and offered several tentative, and quite prelim-inary, explanations for the overall decline in inequality (Ferreira, Leite, andLitchfield 2005). One possible explanation is educational improvements.However, much more research must be done to establish precise causalmechanisms, not least for the sake of informing policy makers about whichreforms might positively affect equity and development in Brazil.
Trade Liberalization and Spatial Inequality
Static decompositions reveal a decreasing importance in the spatial compo-sition of poverty, as captured in table 9.1. Regional differences accountedfor 9 percent of inequality in 1993, a drop of 4 percent from 1981. The declin-ing importance of urban/rural difference is even more striking: the
238 Menezes-Filho and Vasconcellos
urban/rural divide accounted for 17 percent of inequality in 1981, 9 percentin 1993, and 7 percent in 2004. Although these static decompositions revealevidence of spatial convergence, they of course say nothing about the causalmechanisms behind this convergence. More research needs to be done onthe effects of trade liberalization on agricultural growth, for instance, as thisliberalization could quite plausibly be linked to a narrowing of urban/ruralincome differences (Ferreira, Leite, and Litchfield 2005).
Increasing and Progressive Social Spending
Although total social security incomes remained regressive in the post-1993period, resulting from the continued dominance of public pension spend-ing, increases in the volume and improved targeting of social assistancetransfers may have contributed to a decline in inequality. An ability to assessthe precise impact of social assistance transfers is hampered by theconflation of these programs with capital and rental incomes in the PNADhousehold survey category “other incomes.” In other words, though thesurvey data reveal that the population share receiving income from thissource has almost doubled, from 16 to 30 percent, this result could conceiv-ably reflect changes in the distribution or reporting of capital and rentalincomes. Given the government’s attention to improved targeting of cashtransfer programs in recent years (through programs such as the Bolsa Escolaand the new Bolsa Família discussed below), declining levels of inequality arelikely to reflect, at least in part, the expansion of cash-based social assistanceprograms. However, only a more disaggregated analysis of the incidence ofthese transfers would allow a confident assessment of their precise role in theoverall decline of inequality after 1993 (Ferreira, Leite, and Litchfield 2005).
Increased Educational Access
Dynamic decompositions reveal that a decline in inequality among educa-tion subgroups was driven by declining returns to formal schooling—that is,a lowering of the skills premium identified as one of the causal determinantsof inequality in Brazil. Ferreira, Leite, and Litchfield (2005) are hesitant toassign these declining returns either to a shift in supply of skills, whichreflects the success of education policy, or to shrinking demand, which sug-gests a failure to produce and adopt skill-intensive technologies across theeconomy. There is, however, evidence to suggest some success of the govern-ment’s more recent attempts to improve the attainment and quality of edu-cation at all levels. The most obvious mark of success has been a dramaticincrease in enrollment rates. Enrollment in secondary education increasedby more than 60 percent between 1996 and 2004. Enrollment in basic
Human Capital, Inequality, and Pro-Poor Growth in Brazil 239
240 Menezes-Filho and Vasconcellos
education in the poorer regions of the north and northeast increased by 18.5percent and 9.7 percent, respectively. In addition, school-grade promotionrates have increased significantly, partially overcoming the disproportion-ately negative effects of school repetition on the poor. An expansion ofeducation could in theory reduce underlying inequality of humancapital endowments and therefore reduce wage differentials by skills (WorldBank 2003).
Recent reforms in education have increased incentives for access to, per-formance of, and attendance at government schools. The 1996 NationalEducation Law took steps toward improving accountability and quality bydefining the responsibilities of the three levels of government with respectto provision of education services and by clarifying minimum operationalstandards for every public school. Primary attendance has been boosted byincreased investments under FUNDEF—the joint federal-state-municipalEducation Maintenance and Development Fund—which links localresources to student enrollment rates, thereby giving governments incen-tives to expand coverage. FUNDEB, if approved, will expand the incentivesof FUNDEF into preschool and upper secondary education. The Fundescola(School Empowerment) program, set up in 1998 with World Bank support,has provided technical assistance and educational packages to schools inthe disadvantaged northeast, north, and center-west regions. Inequalities atthe higher education level have begun to be addressed by the Pro-Uniprogram, which provides federal loans for poor children to attend privateuniversities.
Perhaps the most notable successes in government educational policyhave been achieved through demand-side targeting. The Bolsa Escola(School Grant) scheme created in 2001 provided a means-tested cash trans-fer to poor households, on the condition that children in those householdsattend school. Various transfer programs were unified under the BolsaFamilia (Family Grant) program in 2003, thus conditioning cash transfers ona range of human-capital enhancing behaviors such as school attendance,vaccination, and prenatal care. The program appears to have increasedschool attendance among poor children, but its contribution to recent reduc-tions in inequality should be the subject of further research.
Conclusions
The growth elasticity of poverty is positively related to initial level ofincome, which means that initially poorer states have to grow more toachieve the rate of poverty reduction achieved by initially richer states.Therefore, if all states grow at basically the same rate, regional poverty
differences will increase. Special efforts must be made to raise growth invery poor states.
In terms of inequality, growth elasticity of poverty is negatively relatedto initial inequality and increases in inequality further increase povertyincidence. Therefore, to make growth more pro-poor, both statically anddynamically, growth must be achieved with a decline in income inequality,particularly in the higher-income and higher-inequality states.
The factors conducive to pro-poor growth are those that improve thelevel of income and decrease income inequality. Investments in human capi-tal are the most important of these factors, as they tend to make growthmore pro-poor and also increase the growth rate, increasing poverty reduc-tion. Because education also tends to reduce inequality, and inequality isunrelated to growth in Brazil, there are no trade-offs involved in invest-ments in human capital, considered as a whole.
The question for policy makers is which level of education should begiven the highest priority. Investments in high school appear to be mostimportant to make growth beneficial to the poor, but they do not improvegrowth prospects by themselves, whereas investments in college educationare important determinants of growth but are less effective in makinggrowth pro-poor. Future research should identify the policies that increasedaccess to higher education in the different Brazilian states. With respect toother policy variables, the econometric exercises clearly showed that invest-ments in certain infrastructure are also important for pro-poor growth andfor growth itself. These investments also ought to be the focus of economicpolicies and research.
The recent focus on improving educational attainment and qualityreflects the national government’s awareness of the links between humancapital expansion and poverty reduction. In spite of improvements, mostnotably in secondary school enrollment rates, major challenges remain. Atan average of 6.6 years, overall educational attainment is low by interna-tional standards. Moreover, educational inequalities continue to correlatewith race and residence. Inequality of educational services by arearemains a pervasive problem; the worst schools are located in the poorestareas of municipalities. Rural areas suffer from lower net enrollment rates,reflecting biases in national policy, which stipulates that small schoolsshould exist only where there are no other options. This policy has led tothe closure of schools, forcing children in remote, and often very poor,areas to travel long distances to school. Further attention to policy reformand targeting across geographic and income groups will be required toeliminate the deep inadequacies and discrepancies in human capital assetsin Brazil.
Human Capital, Inequality, and Pro-Poor Growth in Brazil 241
Notes
1. The authors thank Catherine Hull for her editorial assistance.
2. The rural area of the north region is not surveyed. There is no survey for thecensus years 1980, 1991, and 2000, and there was no survey in 1994. Each PNADquestionnaire requests information about households (regional location, demo-graphic composition, quality of dwelling, ownership of durable goods) and individ-ual household members (age, gender, race, educational attainment, labor forcestatus, and sector of activity, as well as income as of a particular week in Septemberand including monthly earnings from all jobs, pensions, and other sources, includ-ing interest gains, donations, and rents). PNAD’s stratified sample design makesit representative at the state level and for metropolitan/nonmetropolitan andurban/rural areas. The survey has some shortcomings (see Ferreira, Lanjouw, andNeri 1998). In particular, its income measure does not accurately reflect home pro-duction and nonmarket income (important in rural areas). However, it providescomparable data across time.
3. Bourguignon (2003) uses the poverty line divided by mean income as a mea-sure of development, but because the poverty line is the same for all states of Braziland over time, only mean income is used as a proxy here.
4. There are exceptions to these rules: the federal government runs some highschools, and some states run their own universities, such as the University of SãoPaulo.
5. This measure of human capital has the highest impact on all economic indica-tors (see the regressions below).
6. The tests of overidentifying restrictions (Sargan) and second-order serial corre-lation do not reject the null hypothesis.
7. The omitted variable is the share of people with primary or less education.
8. The tests of overidentifying restrictions (Sargan) and second-order serial corre-lation do not reject the null hypothesis.
References
Acemoglu, D., S. Johnson, and J. Robinson. 2001. “The Colonial Origins of Compara-tive Development: An Empirical Investigation.” American Economic Review 91 (5):1369–1401.
Arellano, M., and S. R. Bond. 1991. “Some Tests of Specification for Panel Data:Monte Carlo Evidence and an Application to Employment Equations.” Review ofEconomic Studies 58 (2): 277–97.
Barros, R., and M. Foguel. 2000. “Focalização dos gastos públicos sociais e erradi-cação da pobreza no Brasil.” In Desigualdades e Pobreza no Brasil, ed. R. Henrique.Rio de Janeiro: Institute for Applied Economics.
Barros, R. P., R. Mendoça, and R. Henriques. 2000. “Desigualdade e pobreza noBrasil: retrato de uma estabilidade inaceitável.” Revista Brasileira de Ciências Soci-ais 15 (42): 123–42.
242 Menezes-Filho and Vasconcellos
Bils, M., and P. Klenow. 2000. “Does Schooling Cause Growth?” American EconomicReview 90: 1160–82.
Bourguignon, F. 2003. “The Growth Elasticity of Poverty Reduction: Explaining Het-erogeneity across Countries and Time Periods.” In Growth and Inequality, ed. T.Eichler and S. Turnovsky. Cambridge, Massachusetts: MIT Press.
Datt, G., and M. Ravallion. 1992. “Growth and Redistribution Components ofChanges in Poverty Measures: A Decomposition with Application to Brazil andIndia.” Journal of Development Economics 38 (2): 275–95.
Ferreira, F., P. Lanjouw, and M. Neri. 2003. “A Robust Poverty Profile for BrazilUsing Multiple Data Sources.” Revista Brasileira de Economia 57 (1): 59–92.
Ferreira, F., and R. Barros. 1999. “The Slippery Slope: Explaining the Increase inExtreme Poverty in Urban Brazil, 1976–1996.” Brazilian Review of Econometrics19 (2): 211–96.
Ferreira, F., P. Leite, J. Litchfield. 2005. “The Rise and Fall of Brazilian Inequality.”Mimeo, World Bank, Washington, DC.
Forbes, K. 2000. “A Reassessment of the Relationship between Inequality andGrowth.” American Economic Review 90 (4): 869–87.
Menezes-Filho, N. 2001. “Educação e Desigualdade.” In Microeconomia e sociedade noBrasil, ed. M. Lisboa, and N. Menezes-Filho. Rio de Janeiro: Contra Capa Livraria.
Neri, M. 1995. “Sobre A Mensuração do Poder Aquisitivo dos Salários Em AltaInflação.” Pesquisa e Planejamento Econômico 25 (3): 497–525.
Pessoa, S., V. Gomes, and F. Veloso. 2003. “Evolução da Produtividade Total dosFatores na Economia Brasileira: Uma Análise Comparativa.” Pesquisa e Planeja-mento Econômico 33 (3): 389–434.
Rocha, S. 2003. Pobreza no Brazil—afinal, de que se trata? Rio de Janeiro: FundaçãoGetulio Vargas.
World Bank. 2003. “Brazil: Inequality and Economic Development.” Working paper,World Bank, Washington, DC.
Human Capital, Inequality, and Pro-Poor Growth in Brazil 243

AAcheampong regime, Ghana, 154African Growth Opportunity Act (AGOA),
U.S., 191, 194agriculture. See also land property rights;
rural economyBangladesh, 96–97, 102–3Brazil, 223Ghana, 157–58, 165Green Revolution
in Bangladesh, 96–97, 102in Indonesia, 29, 32
Indonesia, 30, 32, 35–36, 41, 42–43, 46–47irrigation market in Bangladesh,
97–98, 102market access for producers, 13movement to nonagricultural
employment from, 20policies for pro-poor growth in, 12–15risk reduction and control programs, 15safety-net programs, 15subsidies, 15technology access for producers, 15trade liberalization and agricultural
producers, 14–15transaction costs for producers, 13Tunisia, 200, 202, 208–9, 217Uganda, 171–73, 180–81, 185–87, 185f,
191–92Vietnam, 132–33t, 132–34, 138–39
aid. See foreign aid inflowsAIDS/HIV in Uganda, 188Asian financial crisis (1998), 4, 29, 40–44
BBangladesh, 21–22, 79–117
agriculture, 96–97, 102–3community participation, 104education, 80, 84, 92–93evidence of pro-poor growth in, 80explanations of pro-poor growth in, 88food subsidies, 110n2foreign aid inflows, 90, 91, 112n18foreign exchange rate, 89, 90, 111n13garment industry, 100–101GDP (gross domestic product) growth
in, 84–86, 85tgender issues, 80, 84, 93, 99Green Revolution in, 96–97, 102growth incidence curve, 87fhealth care, 93–94income dimensions of poverty in,
81–82, 81tincome inequality in, 86–88, 86–88t, 87f,
104–9, 106tinfant mortality rates, 83t, 84finfrastructure development, 91–92, 91tirrigation market, 97–98, 102labor market, nonagricultural, 95land property rights and rural tenancy
market, 99–100, 100tmacroeconomic policy, 80, 88–95, 89t, 109microcredit market, 103natural disaster management, 95–96NGO partnerships, 103–4nonincome dimensions of poverty in,
82–84, 83t, 84f
INDEX
245
Boxes, figures, notes, and tables are indicated by b, f, n, and t, respectively.
Bangladesh (continued)political economy and governance,
100–104prudent fiscal policies and balanced
budget, 91redistributive effects of public health
spending in, 94remittances, 90, 105–7, 111n13–14ring-fencing, 102–3rural economy
income inequality, 105–7, 106tinfrastructure development, 91–92, 91tinput markets, 97–98labor market, 98–99tnonfarm employment, 95tenancy market, 99–100, 100t
TFP (total factor productivity) growth,112n17
trade liberalization, 90–91urban economy
garment industry in, 100–101income inequality, 107–9, 108tpoverty reduction and urban growth,
88, 111n11Besley, Timothy, 67–68, 70–71, 158Brazil, 23–24, 219–43
agriculture, 223convergence, 239education, 226–38, 227f
ethnic/racial and gender inequalities,229, 230f
growth elasticity of poverty and,231–34, 233f, 235f
income inequality and, 219–20,220t, 227f
increased access to, 239–40poverty and, 222regional inequalities, 227–29,
228–29f, 235fregression analysis, 234–35, 236ttrade-offs between growth and
pro-poor growth, 236–38, 237tethnic/racial inequalities in education,
229, 230fforeign exchange rate, 204, 207gender inequalities in education, 229, 230fgrowth elasticity of poverty, 224–25
education and, 231–34, 233f, 235fregional inequalities, 231, 232t
growth incidence curve, 225–26, 226fhuman capital, 221, 238income inequality, 219–20, 223–26
education and, 219–20, 220t, 227f
prevalence of, 219–20, 220trecent decline, explanations for, 238–40trade-offs between growth and
pro-poor growth, 236–38, 237tinformal employment, 223labor market, 222–23manufacturing and services, 223pension system, 222–23, 223f, 239public spending, 222–23, 223f, 239redistributive measures, 226, 227tregional inequalities
in education, 227–29, 228–29f, 235fin growth elasticity of poverty,
231, 232ttrade liberalization affecting, 238–39
rural economy, 238–39trade liberalization, 238–39trade-offs between growth and
pro-poor growth, 236–38, 237ttransfers, 239trends in growth and poverty in,
220–23, 222furban economy, 238–39
Burgess, Robin, 59–70, 67–68, 70–71
CCambodia, 121, 122cash transfers. See transfersChina, Vietnam compared to, 121t, 123Christiansen, Luc, 155clothing. See garment industrycollective bargaining in Tunisia, 218n3communications infrastructure.
See infrastructurecommunity participation in
Bangladesh, 104conditional cash transfers. See transfersconstruction industry in Tunisia, 210,
211–12convergence
Brazil, 239Vietnam, 126–27
credit access. See finance, access to
Ddebt burden
Ghana, 161Uganda, 194
decentralizationGhana, 163–64Vietnam, 139–40
Demery, Lionel, 155disasters. See natural disasters
246 Index
donors. See foreign aid inflowsDutch Disease
in Indonesia, 30, 48in Uganda, 194
Eeconomic growth leading to poverty
reduction. See pro-poor growtheconomic policies
Bangladesh, 91Ghana, public expenditure on debt
interest in, 161Indonesia, 38–39
education, 18, 20Bangladesh, 80, 84, 92–93Brazil. See BrazilGhana, 156, 161, 163, 166n6of girls, 18
Bangladesh, 80, 84, 93Brazil, 229, 230fIndia, 70, 71–72Indonesia, 47Tunisia, 213
India, 69–70Indonesia, 47Tunisia, 212–13Uganda, 187–88, 193–94Vietnam, 129–30, 129t
electrical infrastructure. Seeinfrastructure
emergencies. See natural disastersemployment. See entries at labor marketEsteve-Volart, Berta, 72ethnicity/race
Brazilian education, 229, 230fVietnam, multiethnicity of, 122
European Union (EU), 217exchange rate. See foreign exchange rate
Ffamily planning
Tunisia, 215–16, 215tVietnam, 130
farms and farming. See agricultureFDI. See foreign direct investmentFerreira, F., 219finance, access to
Bangladesh microcredit market, 103India, 68–69, 74Uganda, 181–82, 188Vietnam, 131
fiscal policiesBangladesh, 91
Ghana, public expenditure on debtinterest in, 161
Indonesia, 38–39fiscal transfers. See transfersfood subsidies
Bangladesh, 110n2India’s public food distribution and
calamity relief systems, 66Tunisia, 214–15
foreign aid inflows, 4Bangladesh, 90, 91, 112n18Ghana, 148, 155, 156Indonesia, 35Uganda, 179, 183, 184–85, 195n6
foreign direct investment (FDI)Indonesia, 29Uganda, 184
foreign exchange rate, 6Bangladesh, 89, 90, 111n13Brazil, 204, 207Indonesia, 30, 38, 48Uganda, 183, 195n6
Foster-Greer-Thorbecke class of povertymeasures, in Bangladesh, 81t, 82
Ggarment industry
Bangladesh, 100–101MFA (Multi-Fiber Agreement), 212, 217Tunisia, 210, 211–12, 217Uganda, 191
gender issuesBangladesh, 80, 84, 93, 99in education. See under educationIndia, 70, 71–72, 74Indonesia, 47Tunisia, 201, 213, 215–16
Ghana, 22, 147–68agriculture, 157–58, 165debt interest, public expenditure on, 161decentralization, 163–64education, 156, 161, 163, 166n6factors constraining growth, 156–64factors driving growth in, 154–56foreign aid inflows, 148, 155, 156foreign exchange rate, 154, 155, 160growth accounting analysis, 152, 153tgrowth incidence curve, 149fhealth care, 161income dimensions of poverty reduction
in, 148–49, 149f, 150tinfrastructure, 155–56, 161, 162investment climate, improving, 160
Index 247
Ghana (continued)labor market, 159–61land property rights, 158macroeconomic policy, 155, 156, 159–61,
164, 165manufacturing and industrial sector,
160–61migration effect in, 151–52nonincome dimensions of poverty
reduction in, 150–51policies for pro-poor growth, 147,
154–55, 164political economy and governance, 154,
164, 165postindependence legacy in, 147, 152–54public spending, 161–64remittances, 156, 157, 164structural change in economy, lack of,
164–65subnational groupings, need to
disaggregate data into, 8–9, 9ftrade liberalization, 155uneven regional and sectoral patterns,
150t, 151–52, 152t, 153t, 163, 165Goldstein, Markus, 158Gomes, V., 221government. See political economy
and governanceGreen Revolution
in Bangladesh, 96–97, 102in Indonesia, 29, 32
growth accounting analysisGhana, 152, 153tVietnam, 127–28, 127t
growth elasticity of poverty, 9, 24n6Brazil, 224–25
education and, 231–34, 233f, 235fregional inequalities, 231, 232t
India, 62–64, 63t, 73t, 74Indonesia, 30, 44–45
growth incidence curves, 10fBangladesh, 87fBrazil, 225–26, 226fGhana, 149fIndonesia, 32, 33fTunisia, 205, 206fUganda, 173–74Vietnam, 124, 125f
Hhealth care
Bangladesh, 93–94
Ghana, 161Uganda, 188, 194Vietnam, 130
HIV/AIDS in Uganda, 188Household Income Expenditure Survey
(HIES) data, in Bangladesh, 81–82human capital. See also education;
health careBrazil, 221, 238India, 69–70Indonesia, 42, 47Uganda, 180, 193–94
Huppi, Monica, 46, 151
Iimmigration. See labor market mobility;
remittancesincome-based methodology, 2–3income distribution and inequality
Bangladesh, 86–88, 86–88t, 87f,104–9, 106t
Brazil. See BrazilIndonesia, 32–34, 33f, 36, 37t, 41–42link between economic growth and,
9–11, 10f, 24–25n7pace of economic growth and poverty
reduction affected by, 1, 7–8subnational groupings, need to
disaggregate data into, 8–9, 9fTunisia, 205tUganda, 173–78, 175t, 179–80
income redistribution. See redistributivemeasures
income transfers. See transfersindebtedness
Ghana, 161Uganda, 194
India, 21, 59–78average household expenditures in
Indonesia compared, 30education, 69–70, 71–72finance, access to, 68–69, 74gender issues, 70, 71–72, 74growth elasticity of poverty, 62–64, 63t,
73t, 74human capital, 69–70labor market regulations, 66–68, 72, 74land property rights, 70–71, 74media attention, role of, 65, 74patterns of poverty reduction and
economic growth in, 60–64, 61f, 63t
248 Index
policy, poverty, and pro-poor growth,72–75, 73t
political agency of disadvantagedgroups in, 65–66, 74
public food distribution and calamityrelief systems, 66
redistributive measures, 66, 70, 71Indonesia, 21, 29–57
agricultural activities, 30, 32, 35–36, 41,42–43, 46–47
Asian financial crisis (1998), 29, 40–44
conscious pro-poor growth strategy in,29, 32, 34
democracy, transition to, 31, 41, 52Dutch Disease in, 30, 48education, 47FDI in, 29foreign aid inflows, 35foreign exchange rate, 30, 38, 48gender issues, 47growth drivers, changes in, 42–44, 43tgrowth elasticity of poverty, 30, 44–45growth incidence curve, 32, 33fhuman capital, 42, 47implementing pro-poor growth
strategies in, 47–51income distribution in, 32–34, 33f, 36, 37t,
41–42informal economy, 44infrastructure investments, 48–50, 49tlabor market, nonagricultural, 32as laboratory for poverty reduction,
31–34macroeconomic policy, 29, 30, 34, 36, 38,
48, 53manufacturing sector in, 39, 44“New Order” regime of Suharto, 29, 30,
31, 32, 35–41, 47–48, 51nontradable economy, 39–40oil revenues, effects of, 30–31, 35–39percentage of employment by major
sector, 38tpolitical economy and governance, 51–53public expenditures and targeted
subsidies, 31regional variations, 44–46restructuring of economy and
development approach, 38–39rural economy, equalizing role of, 41–43,
46–47sectoral growth patterns, 46–47
strategy for pro-poor growth in, 31,34, 35f
Sukarno regime, redistributive effortsunder, 31
transaction costs, 50transfers, 31–32Vietnam compared, 121t
industrial sector. See manufacturing andservices
inflation control in Uganda, 170, 183tinformal economy
Brazil, 223Indonesia, 44
infrastructure, 18, 20Bangladesh, 91–92, 91tGhana, 155–56, 161, 162Indonesia, 48–50, 49tTunisia, 214Uganda, 188–89
investment climate, improving, 17Ghana, 160Vietnam, 130–31, 131t
irrigation market in Bangladesh, 97–98, 102
KKorea, Republic of, Vietnam
compared, 121t
Llabor market
Bangladesh, 95, 98–99tBrazil, 222–23Ghana, 159–61Indonesia, 32movement from agricultural activities to
nonagricultural employment, 20participation in economic growth
via, 12policies for pro-poor growth in,
15–18, 15fTunisia, 204, 209–12, 217, 218n3Uganda, 181
labor market mobility, 20Ghana, 151–52Tunisia, 210Vietnam, 135–38
labor market regulations, 17India, 66–68, 72, 74Tunisia, 218n3
land property rights, 14Bangladesh, 99–100, 100tGhana, 158
Index 249
land property rights (continued)India, 70–71, 74Tunisia, 208–9Uganda, 186–87
Laos, 121Leite, P., 219liberalization of trade. See trade
liberalizationLitchfield, J., 219literacy. See educationLopez, H., 11
Mmacroeconomic policy, 13, 19
Bangladesh, 80, 88–95, 89t, 109Ghana, 155, 156, 159–61, 164, 165Indonesia, 29, 30, 34, 36, 38, 48, 53Tunisia, 205, 207–8Uganda, 169, 170, 171, 179, 182, 184,
192–93Vietnam, 120, 122–23, 138
malariaUganda, 188, 194Vietnam, 122
Malaysia, Indonesia compared to, 30manufacturing and services
Bangladesh garment industry, 100–101Brazil, 223Ghana, 160–61Indonesia, 39, 44Tunisia, 204, 210–12Vietnam, 132–33t, 134–35
market access for agriculturalproducers, 13
media attention, role of, in India, 65, 74Mellor model of poverty reduction,
39–40MFA. See Multi-Fiber Agreementmicrofinance
Bangladesh microcredit market, 103Uganda, 188
migration. See labor market mobility;remittances
mobility in labor market. See labor marketmobility; remittances
Multi-Fiber Agreement (MFA), 212, 217
Nnatural disasters
Bangladesh, vulnerability managementin, 95–96
India, public food distribution andcalamity relief systems, 66
risk reduction and control programs foragricultural producers, 15
Ndulu, B., 155Neri, M., 220NGOs. See nongovernment organizationsNkrumah, Kwame, 154, 162nongovernment organizations (NGOs),
partnerships in Bangladesh with,103–4
nontradable economy in Indonesia, 39–40
OO’Connell, S., 155openness. See trade liberalization
PPande, Rohini, 66, 69–70partnerships
Bangladesh, NGO partnerships in, 103–4
Uganda’s need for public–privatepartnerships, 194
Paternostro, Stefano, 155pension system in Brazil, 222–23, 223fPessoa, S., 221Philippines, Indonesia compared to, 30policies for pro-poor growth, 11–20. See also
economic policies; macroeconomicpolicy
agricultural activities, 12–15challenges faced in, 20–21Ghana, 147, 154–55, 164India, 72–75, 73tIndonesia, conscious pro-poor growth
strategy in, 29, 32, 34labor market, nonagricultural,
15–18, 15fTunisia, 201, 204–5, 207–8Uganda, 171, 179, 182–84, 184t, 192–93Vietnam, doi moi reform in, 122–23, 127,
129, 138political economy and governance, 21
Bangladesh, 100–104Ghana, 154, 164, 165India, political agency of disadvantaged
groups in, 65–66, 74Indonesia, 51–53Uganda, 189–92
poverty reduction, economic growthleading to. See pro-poor growth
pro-poor growth, 1–27. See also morespecific topics, e.g., policies for pro-poor growth
250 Index
case studies in eight countries, 1, 2f.See also Bangladesh, Brazil, Ghana,India, Indonesia, Tunisia,Uganda, Vietnam
initial conditions, 3tprogress of process in, 2–4
challenges faced in, 20–21defined, 24n1trends in poverty, growth, and inequality,
1990s and early 2000s, 4–12, 5t,6–10f
urban vs. rural poverty, 4, 6fpublic–private partnerships, Uganda’s
need for, 194public spending. See also transfers
Brazil, 222–23, 223f, 239Ghana, 161–64India, food distribution and calamity
relief systems in, 66Indonesia, public expenditures and
targeted subsidies in, 31Tunisia, 212–16
Rrace/ethnicity
Brazilian education, 229, 230fVietnam, multiethnicity of, 122
Ravallion, M., 2, 11, 46, 151real property rights. See land property
rightsredistributive measures, 24–25n7
Brazil, 226, 227tIndia, 66, 70, 71Indonesia under Sukarno, 31public health spending in Bangladesh,
redistributive effects of, 94remittances as form of, 137Tunisia, 200, 208Uganda, 174, 179Vietnam, 137, 141
regional (subnational) variationsBrazil
education, 227–29, 228–29f, 235fgrowth elasticity of poverty, 231, 232ttrade liberalization, effect of, 238–39
Ghana, 150t, 151–52, 152t, 153t, 163, 165impact on growth, 20–21in income distribution, 8–9, 9fIndonesia, 44–46Tunisia, 202Uganda, 171–73, 172tVietnam, regional growth poles in,
135–38
remittances, 8, 22, 25n9Bangladesh, 90, 105–7, 111n13–14Ghana, 156, 157, 164as redistributive measure, 137Tunisia, 200, 209, 210, 217Uganda, 179Vietnam, 137
Republic of Korea, Vietnam compared, 121tring-fencing in Bangladesh, 102–3risk reduction and control programs for
agricultural producers, 15rural economy, 4, 6f. See also agriculture
Bangladesh. See BangladeshBrazil, 238–39Indonesia, equalizing role in, 41–43,
46–47Tunisia, 202, 208–10Vietnam, 128–29
Ssafety-net programs for agricultural
producers, 15sectoral growth patterns in Indonesia,
46–47services sector. See manufacturing
and servicesshallow tube wells in Bangladesh,
97–98, 102Smith, Adam, 112n15social assistance. See transfersSOEs. See state-owned enterprisesSouth Korea, Vietnam compared, 121tstate-owned enterprises (SOEs) in Vietnam,
120, 122, 123, 127, 132, 134structural changes in economy
Ghana’s lack of, 164–65Indonesia, restructuring of economy and
development approach in, 38–39Uganda’s lack of, 178fVietnam, 132–33t, 132–35
subnational regions. See regional(subnational) variations
subsidiesfor agricultural producers, 15food subsidies
Bangladesh, 110n2India’s public food distribution and
calamity relief systems, 66Tunisia, 214–15
Indonesia, 31Suharto’s “New Order” regime in
Indonesia, 29, 30, 31, 32, 35–41,47–48, 51
Index 251
Sukarno regime in Indonesia, 31Sumarto, Sudarno, 46Suryhadi, Asep, 46
Ttechnology access for agricultural
producers, 15Temple, Jonathan, 34textiles. See garment industryTFP. See total factor productivity (TFP)
growthThailand
average household expenditures inIndonesia compared, 30
Vietnam compared, 121ttotal factor productivity (TFP) growth
Bangladesh, 112n17Tunisia, 203tUganda, 185, 193Vietnam, 127, 128
trade liberalizationagricultural producers, 14–15Bangladesh, 90–91Brazil, 238–39Ghana, 155Tunisia, 204, 207–8, 217Uganda, 171, 184t, 185, 191–92Vietnam, 138–39
transaction costsfor agricultural producers, 13Indonesia, 50
transfers, 12, 25n9Brazil, 239India, public food distribution and
calamity relief systems in, 66Indonesia, 31–32Tunisia
food subsidies, 214–15social assistance programs, 213–14
Vietnam, targeted aid programs, 140–41transportation infrastructure.
See infrastructureTrivedi, Kamakshya, 69–70Tunisia, 23, 199–218
agriculture, 200, 202, 208–9, 217construction industry, 210, 211–12education, 212–13family planning, 215–16, 215tgarment industry, 210, 211–12, 217gender issues, 201, 213, 215–16growth incidence curve, 205, 206fincome inequality in, 205tindependence, effects of, 200–201
infrastructure development, 214labor market, 204, 209–12, 217, 218n3land property rights, 208–9macroeconomic policy, 205, 207–8manufacturing and industrial sector, 204,
210–12policies for pro-poor growth, 201, 204–5,
207–8public spending, 212–16redistributive measures, 200, 208regional variations, 202remittances, 200, 209, 210, 217rural economy, 202, 208–10TFP growth, 203ttrade liberalization, 204, 207–8, 217transfers
food subsidies, 214–15social assistance programs, 213–14
trends in poverty, growth, and incomedistribution, 200–206t, 206f
urban economy, 210–12
UUdry, Christopher, 158Uganda, 22–23, 169–98
agriculture, 171–73, 180–81, 185–87, 185f,191–92
AIDS/HIV in, 188debt burden, 194Dutch Disease in, 194education, 187–88, 193–94electrical infrastructure, paucity of,
188–89factor productivity and accumulation,
174–76FDI in, 184finance, access to, 181–82, 188foreign aid inflows, 179, 183, 184–85,
195n6foreign exchange rate, 183, 195n6garment industry, 191growth incidence curve, 173–74health care, 188, 194human capital, 180, 193–94income distribution in, 173–78, 175t,
179–80inflation control, 170, 183tinstability and disorder, effects of, 170,
181, 189labor market, 181land property rights, 186–87macroeconomic policy, 169, 170, 171, 179,
182, 184, 192–93
252 Index
policies for pro-poor growth, 171, 179,182–84, 184t, 192–93
political economy and governance,189–92
public–private partnerships, needfor, 194
redistributive measures, 174, 179regional variations, 171–73, 172tremittances, 179reversal of poverty reduction trend in,
169, 178, 179–80, 185–86structural transformation, lack of, 178fTFP growth, 185, 193trade liberalization, 171, 184t, 185, 191–92trends in growth, poverty, and income
inequality, 1992 to 2003, 171, 173–78,173f, 175–77t
uneven sectoral growth, 180urban economy, 4, 6f
Bangladeshgarment industry in, 100–101income inequality, 107–9, 108tpoverty reduction and urban growth,
88, 111n11Brazil, 238–39Tunisia, 210–12Vietnam, 135–38
U.S. African Growth Opportunity Act(AGOA), 191, 194
VVeloso, F., 221Vietnam, 22, 119–46
agriculture, 132–33t, 132–34, 138–39convergence in, 126–27decentralization, 139–40doi moi reform in, 122–23, 127, 129, 138education, 129–30, 129tfinance, access to, 131
growth accounting analysis, 127–28, 127tgrowth incidence curve, 124, 125fhealth care and family planning, 130historical background and context,
120–23investment climate, improving,
130–31, 131tlabor market mobility, 135–38land property rights, 122macroeconomic policy, 120, 122–23, 138manufacturing and industrial sector,
132–33t, 134–35multiethnicity of, 122per capita income compared to
neighboring countries, 1950-99, 121t
redistributive measures, 137, 141regional growth poles in, 135–38remittances, 137rural economy, 128–29SOEs (state-owned enterprises), 120, 122,
123, 127, 132, 134structural changes in economy, 132–33t,
132–35targeted aid programs, 140–41TFP growth, 127–28trade liberalization, 138–39trends and patterns of pro-poor growth
in, 123–26, 124t, 125f, 126turban economy, 135–38
Vietnam War, 34, 120
WWashington Consensus, 182–83welfare payments. See transfersWest Bengal, Bangladesh compared to,
102–3Wetzel, D., 162women. See gender issues
Index 253

The World Bank is committed to preserving
endangered forests and natural resources. The
Office of the Publisher has chosen to print Deliv-
ering on the Promise of Pro-Poor Growth on
recycled paper with 30 percent post-consumer
content in accordance with the recommended
standards for paper usage set by the Green Press
Initiative, a nonprofit program supporting pub-
lishers in using fiber that is not sourced from
endangered forests. For more information, visit
www.greenpressinitiative.org.
E C O - A U D I TEnvironmental Benefits Statement
Saved:
• 14 trees
• 10 million BTUs of total
energy
• 1,214 lbs of net greenhouse
gases
• 5,040 gallons of waste water
• 647 lbs of solid waste

ISBN 0-8213-6515-0
Broad-based growth is critical for accelerating poverty reduction. But
income inequality also affects the pace at which growth translates
into gains for the poor. Despite the attention researchers have given
to the relative roles of growth and inequality in reducing poverty, little is
known about how the microunderpinnings of growth strategies affect poor
households’ ability to participate in and profit from growth.
Delivering on the Promise of Pro-Poor Growth contributes to the debate
on how to accelerate poverty reduction by providing insights from eight
countries that have been relatively successful in delivering pro-poor
growth: Bangladesh, Brazil, Ghana, India, Indonesia, Tunisia, Uganda, and
Vietnam. It integrates growth analytics with the microanalysis of household
data to determine how country policies and conditions interact to reduce
poverty and to spread the benefits of growth across different income
groups. Delivering on the Promise of Pro-Poor Growth is a useful resource
for policy makers, donor agencies, academics, think tanks, and government
officials seeking a practical framework to improve country-level diagnostics
of growth–poverty linkages.
“Delivering on the Promise of Pro-Poor Growth provides insights into the numerous channels by which growth can lead to poverty reduction. It also examines the role of country conditions and policies in increasing the impact of growth on poverty reduction. The study provides useful lessons about the successful and the less-than-successful policies in eight countries.”
—Ravi Kanbur, T. H. Lee Professor of World Affairs and EconomicsCornell University, Ithaca, New York
"These country studies demonstrate that, while short-run poverty reduction may result from lucky circumstances, sustained pro-poor growth requires careful economic planning and difficult policy choices."
—Gary Fields, Professor, Department of Labor EconomicsCornell University, Ithaca, New York