Embed Size (px)
Citation preview
Delivering LocalDevelopment
NEW GROWTH AND INVESTMENT STRATEGIES

This work is published on the responsibility of the Secretary-General of the OECD. The
opinions expressed and arguments employed herein do not necessarily reflect the official
views of the Organisation or of the governments of its member countries.
This document and any map included herein are without prejudice to the status of or
sovereignty over any territory, to the delimitation of international frontiers and boundaries
and to the name of any territory, city or area.
The statistical data for Israel are supplied by and under the responsibility of the relevant Israeli authorities. The useof such data by the OECD is without prejudice to the status of the Golan Heights, East Jerusalem and Israelisettlements in the West Bank under the terms of international law.
Photo credits: Cover ©Marketing Manchester.
© OECD 2013
You can copy, download or print OECD content for your own use, and you can include excerpts from OECD publications, databases and
multimedia products in your own documents, presentations, blogs, websites and teaching materials, provided that suitable
acknowledgment of the source and copyright owner is given. All requests for public or commercial use and translation rights should be
submitted to [email protected]. Requests for permission to photocopy portions of this material for public or commercial use shall be
addressed directly to the Copyright Clearance Center (CCC) at [email protected] or the Centre français d'exploitation du droit de copie
(CFC) at [email protected].

3
Foreword
What next?

4
smörgåsbord
ACKNOWLEDGEMENTS – 5
DELIVERING LOCAL DEVELOPMENT: NEW GROWTH AND INVESTMENT STRATEGIES © OECD 2013
Acknowledgements
This report was prepared under the authority of the OECD LEED (Local Economic and Employment Programme) and its’ Directing Committee. This work was undertaken as part of the LEED Programme’s Delivering Local Development activity led by Debra Mountford and is supported by the European Commission. The report case studies cover 11 countries: Australia, China, France, Germany, the Netherlands, Norway, Spain, South Africa, Switzerland, the United Kingdom and the United States. Sincere thanks are expressed to Amsterdam, Barcelona, Hamburg and Manchester for inviting the LEED Programme to carry out this analysis.
We are grateful to Greg Clark, Chair of the OECD LEED Forum on Development Agencies and Investment Strategies who was the lead author and Tim Moonen who led the case study research. We are also grateful to Mike Emmerich and Baron Frankal, New Economy Manchester and Rachel Combie, Marketing Manchester; Arthur van Dijk, Amsterdam Airport Area; Michel van Wijk, Schiphol Area Development Company and Martijn van Vliet Department of Economic Affairs, City of Amsterdam; Jordi Sacristan, Barcelona Activa; and Melanie Parr, HafenCity. Other participating cities are duly thanked for their collaboration and support of the project.
Lottie Tempest Mountford edited the 12 case studies. Richard Grange, Marketing Manchester and François Iglesias, OECD LEED designed the cover. Jennifer Allain prepared the report for publication.


7
Table of contents
Part I Delivering Local Development: New Growth and Investment Strategies
Part II Case studies
Tables

8
Figures

9
Part I
Delivering Local Development: New Growth and Investment Strategies:
Main Findings


11
Introduction: New growth and investment strategies
Delivering Local Development
12
Adjusting local strategy to new economic realities
Recession, Recovery and Reinvestment: The Role of Local Economic Leadership.

13
A challenging context for local development
14
Five cities in the EU and seven cities outside the EU
Middleweight cities
The review
15
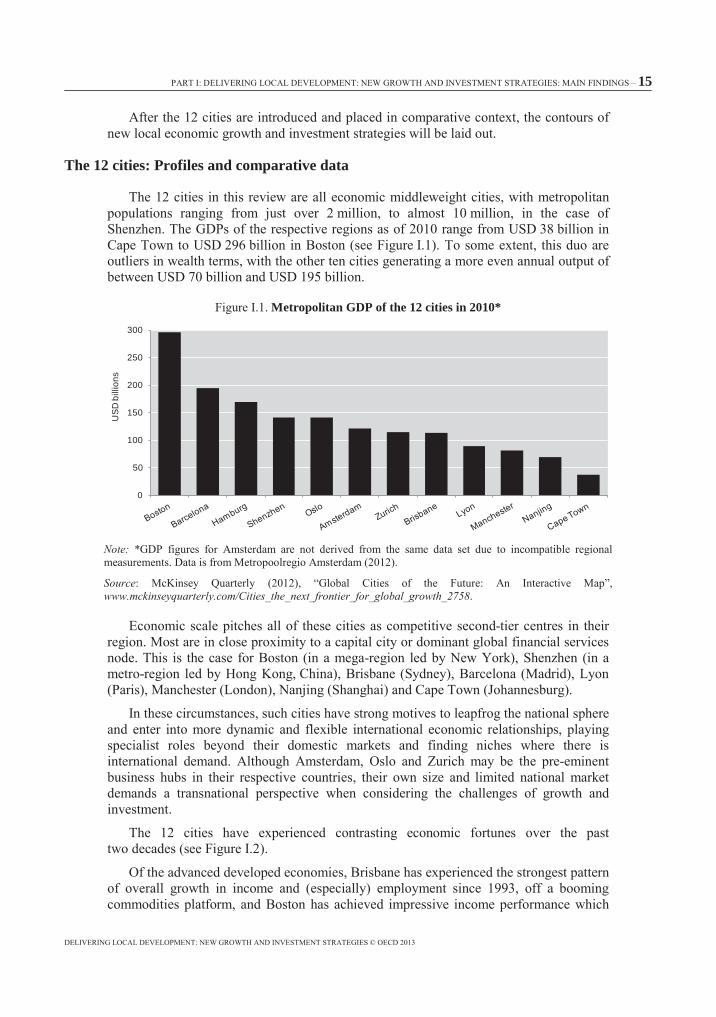
The 12 cities: Profiles and comparative data
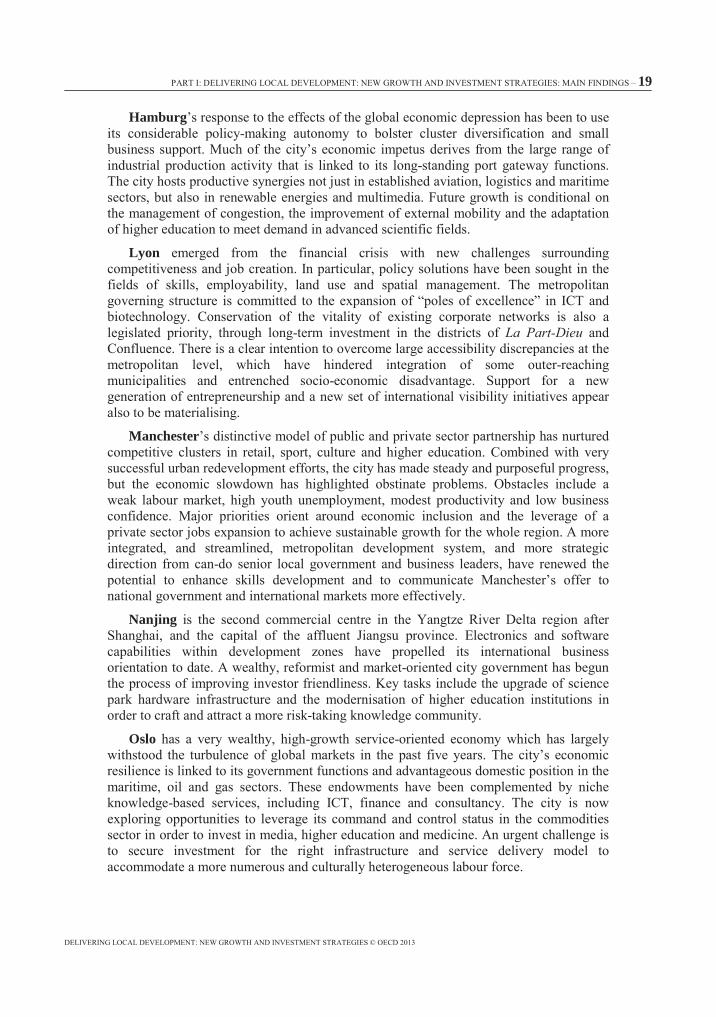
Metropolitan GDP of the 12 cities in 2010*
Note:
Sourcewww.mckinseyquarterly.com/Cities_the_next_frontier_for_global_growth_2758
0
50
100
150
200
250
300
USD
bill
ions

16
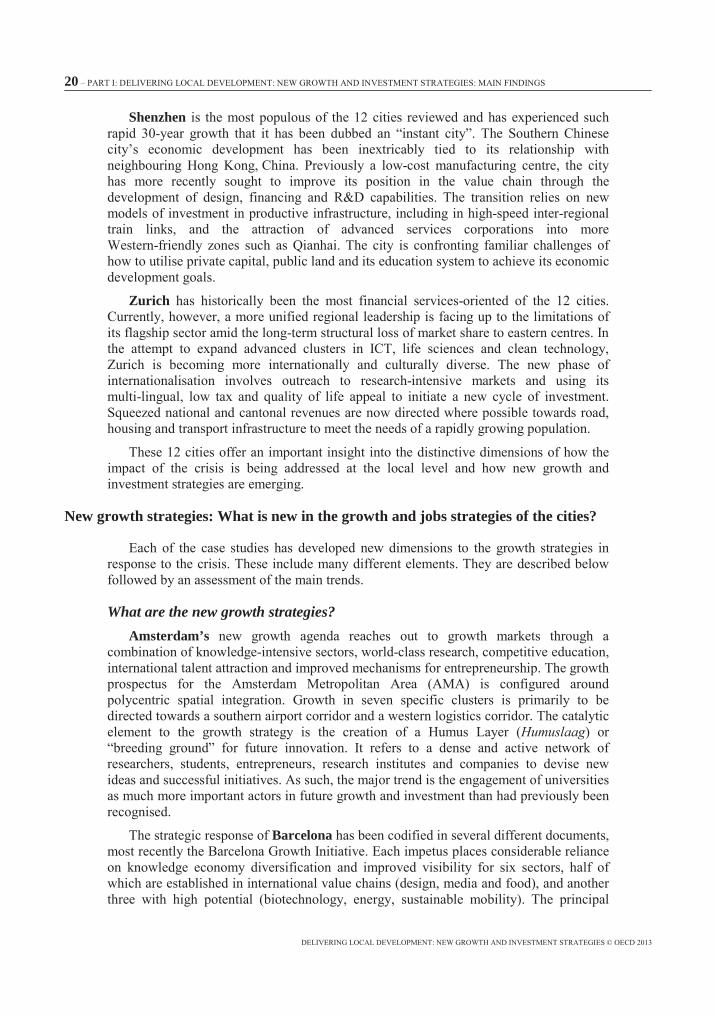
Income and employment growth of the 12 cities (1993-2011)
Source: www.brookings.edu/research/interactives/global-metro-monitor

17
The 12 local economies Amsterdam
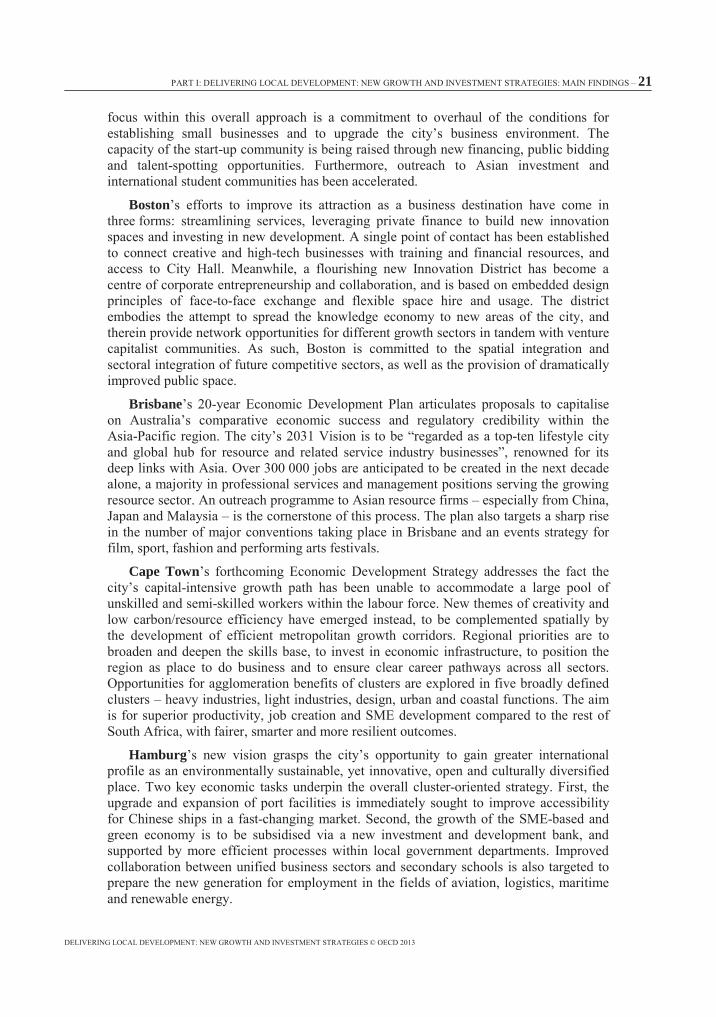
Total number of passengers at the 12 cities’ principal airports (2011)
Sourcewww.caac.gov.cn/I1/K3/201203/P020120321570053265625.xls
www.caa.co.uk/default.aspx?catid=80&pagetype=88&pageid=3&sglid=3www.massport.com/logan-airport/about-
logan/Pages/LoganStatistics.aspx www.adv.aero/verkehrszahlen/archiv/statistiken-ivf-2011 www.acsa.co.za/home.asp?pid=137
Barcelona
0 5 10 15 20 25 30 35 40 45 50
Amsterdam
Barcelona
Boston
Shenzhen
Zurich
Oslo
Brisbane
Manchester
Hamburg
Nanjing
Lyon
Cape Town

18
Boston
Brisbane’s
Cape Town
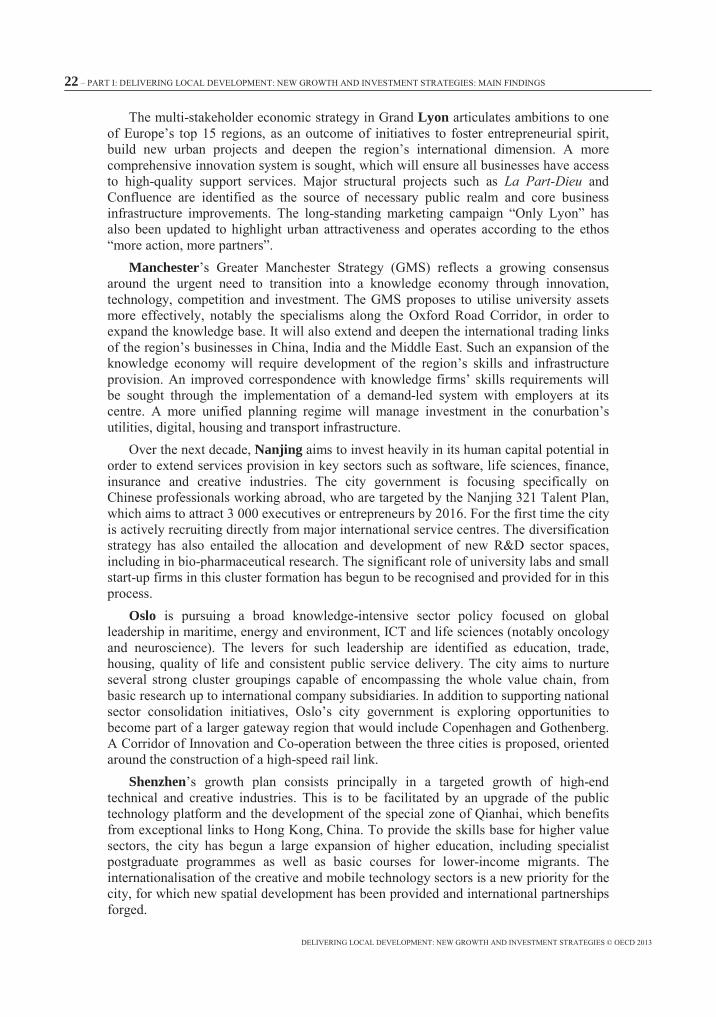
Percentage of metropolitan economy comprised of financial and business services (2011)
Note:
Source: www.brookings.edu/research/interactives/global-metro-monitor
0
5
10
15
20
25
30
35
40
45%
19
Hamburg
Lyon
La Part-Dieu
Manchester
Nanjing
Oslo
20
Shenzhen
Zurich
New growth strategies: What is new in the growth and jobs strategies of the cities?
What are the new growth strategies? Amsterdam’s
Humuslaag
Barcelona
21
Boston
Brisbane
Cape Town
Hamburg
22
Lyon
La Part-Dieu
Manchester
Nanjing
Oslo
Shenzhen
23
Zurich
Review of the growth strategies
Employment in new sectors
Specialised financial and professional services.

24
Life sciences.
Creative industries and media.
Software.
Tourism and business conferences.
Agriculture and gastronomy.
25
Clean technology.
Nautical.
Sustainable mobility.
Growth markets

26
Gro
wth
stra
tegy
ass
ets a
nd in
itiat
ive
Statu
s of s
trateg
yAs
sets
lever
aged
Key i
nitiat
ives
Amste
rdam
Seve
n sec
tor st
rateg
y cre
ated i
n 201
1 in
tande
m wi
th the
Ams
terda
m Ec
onom
ic Bo
ard
– Log
istics
expe
rienc
e ats
eapo
rt, gr
eenp
ort a
nd ai
rpor
t– N
ew ac
tor co
alitio
ns to
co-o
rdina
te an
d coll
ect fi
nanc
es fo
r key
pr
ojects
– Res
earch
insti
tute a
nd un
iversi
ty co
mmun
ities
–Inte
grati
on al
ong t
wo de
velop
ment
corri
dors:
the s
outhe
rn ai
rpor
t co
rrido
r and
a we
stern
logis
tics c
orrid
or th
at co
nnec
ts the
gree
npor
t– “
Hum
uslaa
g” –
dens
ificati
on of
rese
arch
netw
orks
to pr
ompt
innov
ation
– Five
new
secto
r-spe
cific
scien
ce pa
rks– C
onve
rt off
ice sp
ace t
o alte
rnati
ve us
ages
unde
r “ka
ntore
nlood
s” sc
heme
Barce
lona
Barce
lona C
reixe
men
t(Gr
owth)
30-p
oint
initia
tive,
comp
lemen
ts 20
11/12
EUR
1.4 bi
llion M
etrop
olitan
Acti
on P
lan
–Dive
rse sp
ecial
isms i
n des
ign, m
edia,
food
, biot
echn
ology
, en
ergy
and s
ustai
nable
mob
ility
– Gate
way p
ositio
n to t
he M
edite
rrane
an– C
limate
, qua
lity of
life
–Mec
hanis
ms to
foste
r a st
art-u
p cult
ure –
emplo
ymen
t mar
kets,
fin
ancin
g, sp
aces
, spr
ead o
f pos
itive e
ntrep
rene
urial
value
s– C
hina a
nd M
edite
rrane
an ou
treac
h stra
tegy r
ound
-table
– Lea
dersh
ip in
smar
t urb
anism
thro
ugh M
obile
Wor
ld Ca
pital
Bosto
nSe
t of in
itiativ
es le
d by t
he ci
ty of
Bosto
n an
d Bos
ton R
edev
elopm
ent A
uthor
ity
since
2010
–High
ly div
ersif
ied ec
onom
y– Y
outhf
ul an
d ver
y high
-skille
d wor
king p
opula
tion
–Ven
ture c
apita
l com
munit
y
– Inn
ovati
on D
istric
t– C
reate
Bos
ton, s
ingle
PoC
for se
ctor b
usine
sses
Brisb
ane
2031
Eco
nomi
c Dev
elopm
ent P
lan– M
ining
and e
nerg
y res
ource
s– P
roxim
ity to
Asia
-Pac
ific
–Attr
actio
n of b
usine
ss vi
sitor
s thr
ough
conv
entio
ns an
d cult
ural
even
ts– O
utrea
ch pr
ogra
mme t
o Chin
ese,
Japa
nese
and M
alays
ian re
sour
ce
firms
–Digi
tal ec
onom
y inv
estm
ent a
nd le
ader
ship
Cape
Tow
nEc
onom
ic De
velop
ment
Stra
tegy a
t city
lev
el. O
ne C
ape 2
040 i
ntegr
ates
prov
ince a
nd ce
ntral
city s
trateg
ies
–Afflu
ent c
onsu
mer b
ase
– Exp
erien
ce of
fore
ign m
arke
ts –M
aturity
of IC
T/ag
ribus
iness
secto
rs
– Metr
opoli
tan pu
blic t
rans
port
corri
dors
– Rad
ically
impr
ove t
he sk
ills ba
se
Hamb
urg
Visio
n Ham
burg
-Res
pons
ible G
rowt
h–S
ustai
nabil
ity ad
vanta
ges
– Enla
rged
cultu
ral d
iversi
ty–D
eep t
alent
base
–Clus
ter st
rateg
y in a
viatio
n, log
istics
, mar
itime,
rene
wable
ener
gy– U
pgra
de of
port
facilit
ies–S
ubsid
ised g
rowt
h of S
ME ec
onom
y
Manc
heste
rGr
eater
Man
ches
ter S
trateg
y, be
ing
revis
ed in
late
2012
– Univ
ersit
y exp
ertis
e in b
io-me
dical,
phar
ma, o
ncolo
gy– A
dvan
tageo
us su
pply
chain
posit
ion– M
ore u
nified
plan
ning r
egim
e
–Exp
and t
rade
links
–Ch
ina, In
dia, M
iddle
East
– Gro
w Ox
ford R
oad s
cienc
e cor
ridor
– E
mploy
er-le
d skil
ls pr
ogra
mmes
– Upg
rade
of ut
ilities
, digi
tal in
frastr
uctur
e and
hous
ing
Lyon
Devis
ed w
ith th
e Cha
mber
of C
omme
rce,
the U
niver
sity o
f Lyo
n and
othe
r bu
sines
s gro
ups
– You
ng te
chno
logica
lly gi
fted p
opula
tion
– Exp
erien
ced f
irms i
n key
secto
rs
–La P
art-D
ieuan
d Con
fluen
ce di
strict
s inv
estm
ent a
nd re
gene
ratio
n– B
IOAS
TER
institu
te of
techn
ologic
al re
sear
ch
– Ove
rhau
l of S
ME bu
sines
s sup
port
– Bus
iness
amba
ssad
ors t
o imp
rove
proje
ctive
powe
r of “
Only
Lyon
” ca
mpaig
n
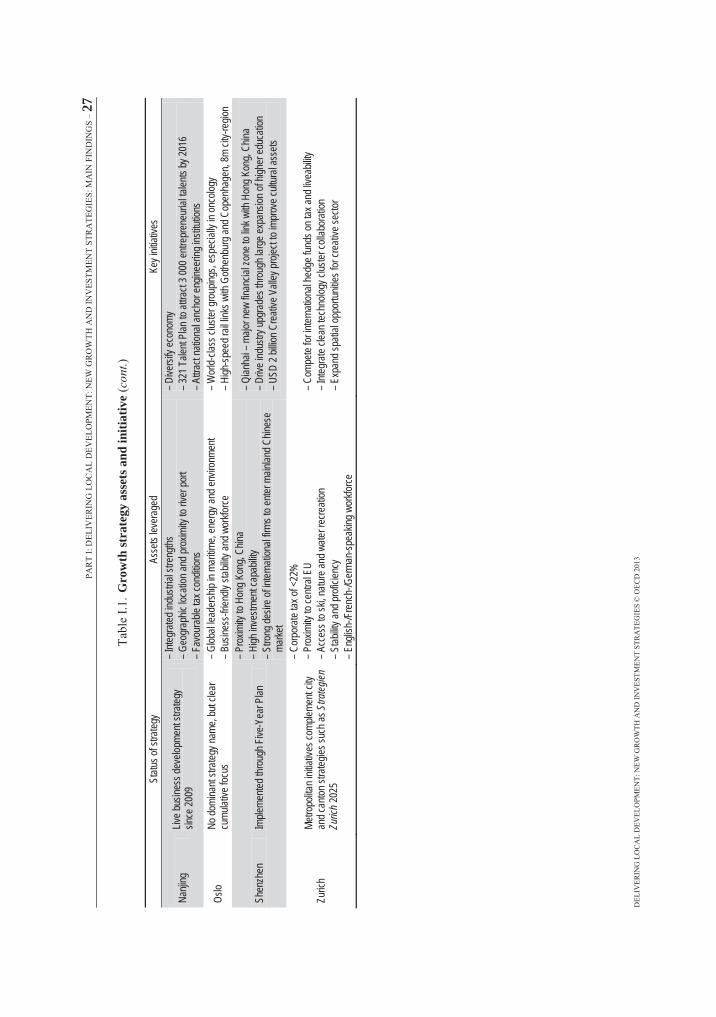
27
Gro
wth
stra
tegy
ass
ets a
nd in
itiat
ive
cont
.
Statu
s of s
trateg
yAs
sets
lever
aged
Key i
nitiat
ives
Nanji
ngLiv
e bus
iness
deve
lopme
nt str
ategy
sin
ce 20
09
–Inte
grate
d ind
ustria
l stre
ngths
– Geo
grap
hic lo
catio
n and
prox
imity
to riv
er po
rt –F
avou
rable
tax c
ondit
ions
–Dive
rsify
econ
omy
– 321
Tale
nt Pl
an to
attra
ct 30
00 en
trepr
eneu
rial ta
lents
by 20
16–A
ttrac
t nati
onal
anch
or en
ginee
ring i
nstitu
tions
Oslo
No do
mina
nt str
ategy
name
, but
clear
cu
mulat
ive fo
cus
–Glob
al lea
dersh
ip in
mariti
me, e
nerg
y and
envir
onme
nt–B
usine
ss-fr
iendly
stab
ility a
nd w
orkfo
rce–W
orld-
class
clus
ter gr
oupin
gs, e
spec
ially
in on
colog
y–H
igh-sp
eed r
ail lin
ks w
ith G
othen
burg
and C
open
hage
n, 8m
city-
regio
n
Shen
zhen
Imple
mente
d thr
ough
Five
-Yea
r Plan
–Pro
ximity
to H
ong K
ong,
China
– High
inve
stmen
t cap
abilit
y– S
trong
desir
e of in
terna
tiona
l firm
s to e
nter m
ainlan
d Chin
ese
marke
t
– Qian
hai –
majo
r new
finan
cial z
one t
o link
with
Hon
g Kon
g,Ch
ina– D
rive i
ndus
try up
grad
es th
roug
h lar
ge ex
pans
ion of
high
er ed
ucati
on– U
SD 2
billio
n Cre
ative
Vall
ey pr
oject
to im
prov
e cult
ural
asse
ts
Zuric
hMe
tropo
litan i
nitiat
ives c
omple
ment
city
and c
anton
stra
tegies
such
as S
trateg
ienZu
rich2
025
–Cor
pora
te tax
of<2
2%– P
roxim
ity to
centr
al EU
– A
cces
s to s
ki, na
ture a
nd w
ater r
ecre
ation
– Stab
ility a
nd pr
oficie
ncy
– Eng
lish-
/Fre
nch-
/Ger
man-
spea
king w
orkfo
rce
– Com
pete
for in
terna
tiona
l hed
ge fu
nds o
n tax
and l
iveab
ility
– Inte
grate
clea
n tec
hnolo
gy cl
uster
colla
bora
tion
– Exp
and s
patia
l opp
ortun
ities f
or cr
eativ
e sec
tor
28
China.
Middle East.
Asia.
Knowledge regions.
Local growth sources.
Latin American
Russian
Turkish

29
New investment
Capital investment and corporate investment
Investment challenges
New public investment tools
30
New private investment tools

31
Inve
stm
ent t
ools
Publi
c inv
estm
ent to
olsPr
ivate
inves
tmen
t tools
and f
lows
Key k
nock
-on b
enefi
ts
Amste
rdam
–No m
ajor n
ew to
ols, fi
nanc
e of c
ore p
rojec
ts us
ing cr
eated
(mos
tly
natio
nal) r
eser
ves
– Priv
ate sm
art te
chno
logy r
esea
rch in
stitut
e to b
e bac
ked b
y EU
R 50
millio
n of p
ublic
mon
ey– E
UR 6
millio
nSch
olarsh
ip Fu
nd, 5
0% lo
cal g
over
nmen
t, to a
ttrac
t Ph
D-lev
el tal
ent
– EUR
10-1
5 milli
onLif
e Scie
nces
Fun
d to s
upply
inv
estm
ent c
apita
l to ea
rly-st
age b
iomed
ical fi
rms.
Back
ed by
majo
r ban
ks –
ABN
AMRO
, ING,
Rab
oban
k
– Imp
rove
d mob
ility w
ithin
south
ern c
orrid
or an
d betw
een
city c
entre
– Imp
rove
d tec
hnolo
gy tr
ansfe
r
Barce
lona
– Pla
Empe
nta –
city r
edire
cts E
UR 80
milli
onof
local
publi
c fun
ds
from
inves
tmen
t bud
get u
p to 2
016 i
n hou
sing s
pace
, to at
tract
EUR
300 m
illion
in pr
ivate
inves
tmen
t
–Bar
celon
a City
Pro
tocol
–cer
tifica
tion s
ystem
to
meas
ure u
rban
effic
iency
and q
uality
in pr
ivatel
y de
signe
d pub
lic se
rvice
s– T
ax-fr
ee zo
ne fo
r mob
ile te
chno
logy s
tart-u
ps in
22@
dis
trict
– Rea
ctiva
tion o
f hou
sing a
nd co
mmer
cial re
al es
tate
cons
tructi
on– I
mpro
ved d
elive
ry of
publi
c ser
vices
and s
mart
urba
nism
crede
ntials
Bosto
n– L
imite
d flex
ibility
to ra
ise fu
nds,
relie
s on s
tate g
over
nmen
t for
capit
al gr
ant fu
nding
for li
fe sc
ience
and t
rans
port
proje
cts
–Up t
o 20%
tax c
uts fo
r inve
stmen
ts int
o Inn
ovati
on
Distr
ict– M
assC
halle
nge U
SD 1
millio
nentr
epre
neur
co
mpeti
tion
–USD
1500
00loa
ns to
crea
tive s
tart-u
ps
– Inc
ubate
wor
ld-lea
ding b
usine
ss id
eas
– Inc
reas
e tax
reve
nue f
rom
corp
orate
occu
patio
n
Brisb
ane
– Acc
elera
ted sh
ared
city-
state-
feder
al fun
ding f
or ro
ad tu
nnels
, re
surfa
cing
–40-
45%
R&D
tax o
ffset
for m
ining
secto
r– T
hree
-year
mor
atoriu
m on
infra
struc
ture c
harg
es fo
r ho
tel de
velop
ers
– Inc
reas
e pre
senc
e of C
hines
e mini
ng R
&D fir
ms– S
olve s
horta
ge of
4/5 s
tar ho
tels
Cape
Tow
n– P
ool re
sour
ces a
t pro
vincia
l and
city
level
–Fro
m Re
d Tap
e to R
ed C
arpe
t – B
uildin
g upg
rade
cost
offse
t in ur
ban d
evelo
pmen
t zo
nes
– Ear
ly sta
ge su
ppor
t for s
mall b
usine
sses
– F
ast r
ejuve
natio
n of d
ereli
ct ar
eas
Hamb
urg
– City
’s ow
n ven
ture c
apita
lcom
pany
for S
MEs,
BTG
Hamb
urg,
supp
orts
comp
anies
’ equ
ity ba
se
–Emp
loyee
Qua
lifica
tion P
rogr
amme
, fund
s up t
o EU
R 3 0
00of
traini
ng pe
r emp
loyee
to pr
otect
at-ris
k job
s– P
ROFI
R&D
proje
ct su
ppor
t up t
o EUR
1 mi
llion
– Ham
burg
Inno
vatio
n Tru
st De
velop
men
t Pro
gram
me
supp
orts
high-
risk S
ME te
chno
logy p
rodu
cts
– Sup
port
for fr
agile
SME
jobs
in IC
T, lif
e scie
nces
and
trade
secto
rs
Manc
heste
r
–“Ci
ty De
al”to
earn
back
up to
GBP
30mi
llion a
year
natio
nal ta
x re
venu
es ge
nera
ted by
metr
opoli
tan in
frastr
uctur
e inv
estm
ent
– GBP
300 m
illion
Ever
gree
n Fun
dusin
g pen
sion f
und i
nves
tmen
ts– R
egion
al Gr
owth
Fund
attra
cts pu
blic-p
rivate
bid c
o-op
erati
on– G
BP1.2
billio
n metr
opoli
tan T
rans
port
Fund
borro
ws ag
ainst
futur
e inc
ome a
nd us
es te
mpor
ary i
ncre
ase i
n cou
ncil t
ax
– High
-tech
Ente
rpris
e Zon
e aro
und t
he ai
rpor
t, offe
ring
five-
year
busin
ess r
ate di
scou
nts an
d sim
plifie
d setu
p
– Imp
rove
d co-
oper
ation
with
centr
al go
vern
ment
over
tra
nspo
rt de
liver
y and
hous
ing– H
elp ar
eas t
rans
ition f
rom
publi
c sec
tor in
vestm
ent
depe
nden
ce– R
esur
rect
deve
lopme
nt su
rroun
ding t
he ai
rpor
t

32
Inve
stm
ent t
ools
con
t.
Publi
c inv
estm
ent to
olsPr
ivate
inves
tmen
t tools
and f
lows
Key k
nock
-on b
enefi
ts
Lyon
– City
chief
finan
cer o
f City
of E
ntrep
rene
ursh
ip Pr
ogra
mme a
nd
mento
r sup
port
netw
ork
– Com
petiti
on fo
r EUR
35 bi
llion n
ation
al sc
heme
“Futu
re
Inves
tmen
ts” fo
r fun
ds in
educ
ation
, tech
nolog
y tra
nsfer
, digi
tal
indus
tries
–Boo
stInL
yon s
tart-u
p acc
elera
tor,s
uppo
rts 10
-12 w
eb
and c
reati
ve st
art-u
ps a
year
– E
UR 90
milli
onof
publi
c and
priva
te inv
estm
ent in
BI
OAST
ER m
icrob
iolog
y ins
titute.
70%
priva
te pa
rtner
-fund
ed– 6
5% pr
ivate
inves
tmen
t in Ly
on C
onflu
ence
de
velop
ment
– Elim
inate
barri
ers t
o entr
epre
neur
ship,
grow
netw
orks
– U
pdate
of fir
ms’ te
chno
logica
l cap
abilit
y
Nanji
ng– R
e-or
ganis
ation
of st
ate-o
wned
enter
prise
s to i
mpro
ve ef
ficien
cy
oflar
ge-sc
ale ho
using
and t
rans
port
proje
cts
–50:5
0 pub
lic-p
rivate
Isra
eli pa
rtner
ship
EUR
25mi
llion
joint
healt
hcar
e tec
hnolo
gy fu
nd
– Scie
nce a
nd te
chno
logy E
ntrep
rene
ursh
ip Zo
ne fo
r 3 0
00 ta
lents
– Per
sona
l fina
ncial
ince
ntive
s of E
UR 12
0000
– 50%
loan
inter
est o
ffset
for sm
all fir
m inc
ubati
on an
d tes
t pha
sing
– Entr
epre
neur
ialise
centr
alise
d sec
tors
– Ide
as an
d inn
ovati
on im
petus
to m
ake p
rogr
ess i
n em
ergin
g ind
ustrie
s
Oslo
–Oslo
Pac
kage
3 –t
oll fa
re in
creas
e whic
h will
fund r
oad t
unne
l mo
dern
isatio
n, me
tro re
newa
l and
light-
rail t
ermi
nals
– Pro
pose
d EUR
100 m
illion
state
fund f
or in
vestm
ents
in en
trepr
eneu
rship,
healt
hcar
e and
life s
cienc
e star
t-ups
–Kno
wled
ge P
artne
rship
fundin
g sup
port
for m
embe
r ins
titutio
ns– N
ation
al R&
D tax
cred
it pro
gram
me S
katte
FUNN
,high
ly re
distrib
utive
– Sup
ports
over
all in
frastr
uctur
e and
clus
ter pr
ioritie
s
Shen
zhen
– Loc
al go
vern
ment
finan
cing v
ehicl
e for
publi
c wor
ks. C
ompa
nies
raise
capit
al by
lend
ing an
d iss
uing b
onds
. City
trea
sury
injec
ts ad
dition
al fun
ds/co
llater
al as
need
ed.
– 3-5
year
bond
tran
ches
as a
chec
k on l
ocal
gove
rnme
nt de
bt
–Cre
ation
of co
astal
deve
lopme
nt zo
nes,
with
simpli
fied
tax sy
stem,
matu
re su
pervi
sion.
Infra
struc
ture f
unde
d by
bank
loan
s and
reve
nue f
rom
land-
use r
ights.
– R
eloca
tion s
ubsid
ies fo
r IT
firms,
and i
ncen
tives
for I
T en
trepr
eneu
rs
– Dim
inish
ed ris
k for
tran
spor
t infra
struc
ture p
rojec
ts– A
ttrac
tion o
f Hon
g Kon
g, Ch
inaba
nks,
telec
om an
d he
althc
are f
irms t
o set
up in
Qian
hai
– Inc
reas
ed co
ntribu
tion o
f ICT
to GD
P
Zuric
h
–Rail
Infra
struc
ture F
und t
o inte
grate
fund
ing go
vern
ance
and w
aive
inter
est o
n the
debt
finan
cing u
p to 2
030,
to ra
ise up
to
CHF
2.5 bi
llion
– New
agre
emen
ts to
shar
e can
ton in
vestm
ent in
bus,
rail a
nd
cycli
ng
–Can
tonal
Lotte
ry Fu
nd fo
r cult
ural
proje
cts an
d stud
ent h
ousin
g
– Cor
pora
te tax
of 21
% (Z
urich
), 18
% (Z
ug) a
nd 12
%
(Pfäf
fikon
)– W
ealth
tax <
1%– 5
0% ta
x red
uctio
n for
some
entre
pren
eurs
– Main
tenan
ce of
stro
ng fr
amew
ork c
ondit
ions f
or
corp
orati
ons t
o inv
est
– Imp
rove
d art,
perfo
rman
ce an
d con
venti
on
infra
struc
ture
33
New leadership approaches and better local development systems
Organising Local Economic Development: The Role of Development Agencies and Companies
How are cities and business organising differently?

34

35
Local developments systems
New development system bodies Key developments/impact
Amsterdam
– New Amsterdam Metropolitan Area 27-authority partnership
– Private sector-led Amsterdam Economic Board offers holistic strategic direction
– Schiphol region development agencies
– Unified voice that can speak to national government over investment issues
– More focused understanding of opportunities and investment needs in key sectors
– Improved international marketing of airport region’s potential
Barcelona– Establishment of Barcelona Metropolitan Area
in 2011, with responsibilities over economic promotion and planning
– Working groups have come together to develop concrete initiatives
– Enhanced support for entrepreneurs from Barcelona Actica
– English-language adaptation
Boston – Boston Business Hub– Boston World Partnerships
– Regularised business leadership– Overhaul in treatment of small businesses
Brisbane – Strengthening role for Brisbane Marketing – Improved Brisbane-Queensland collaboration
Cape Town – Economic Development Partnership with122 regional organisation members
– New spaces created for dialogue, experimentation, prototyping and innovation
Hamburg – HMG consolidates public marketing, tourism and business development bodies under one aegis
– Unified metropolitan expression on sector development– Greater cluster management engagement with
business community
Manchester– New Greater Manchester Combined Authority
(GCMA) since 2011– Local Enterprise Partnership (LEP)
– GCMA has scope over unified labour market– Institutionalised business leadership input into skills
and innovation strategy– Streamlined agencies with more ambition in new
sectors and markets
Lyon
– Incorporation of St. Etienne and Vienne into metropolitan governance orbit
– 18 higher education institutions brought under “Université de Lyon” banner, resulting in Lyon Cité Campus project
– More purposeful innovation clustering and metropolitan transport planning
– Re-arrangement of HEIs, research bodies, businesses and private institutions in close mutual proximity
Nanjing – First regional planning strategy among seven cities in 2012
– Reduction of regional duplication and destructive competition
Oslo
– Oslo Teknopol development agency, leads collaboration between business and higher education
– Knowledge Oslo
– More self-conscious research and higher education agenda and leadership
Shenzhen– Public-private Shenzhen Science Innovation
Commission to co-ordinate strategies in software, green technology, cloud computing and medical equipment
– More networked and collaborative governance to improve skills and find new customers internationally
– Stronger mechanisms to gauge business sentiment and implement fast-track policy solutions to reassure the business community
Zurich
– Metropolitan Area Association since 2009, involves eight cantons and municipalities
– Biannual Metropolitan Conference brings together key stakeholders
– New regional responsibilities for innovation economy, traffic, social cohesion
– Address fragmented decision making – platform for networking and information exchange to create regional mindset
36
How is leadership expressing itself on these agendas?
Can-do pragmatism
modus operandi
Communication of the values of openness and population attraction
Sincere engagement with, and learning from, the private sector

37
Vigorous commitment to sound fiscal platform
Long-term, multi-cycle approach
Summary and recommendations
National and inter-governmental roles
What is needed?

38
Nat
iona
l/sup
rana
tiona
l inv
estm
ents
and
impa
cts
Main
natio
nal/s
upra
-nati
onal
level
inves
tmen
tsW
hat h
as ch
ange
d sinc
e the
crisi
s?Ec
onom
ic an
d gro
wth b
enefi
ts
Amste
rdam
–EUR
1.4bil
lion u
pgra
de of
Zuid
as bu
sines
s dist
rict tr
ansp
ort c
onne
ctivit
y, 70
%
natio
nally
fund
ed– E
urop
ean I
nves
tmen
t Ban
k ong
oing l
oans
for S
chiph
ol up
grad
es
– Com
mitm
ent to
core
proje
cts, e
spec
ially
logist
ics an
d tra
nspo
rt-re
lated
– Mor
e bala
nced
polyc
entric
regio
n with
rene
wed
grow
th alo
ng de
signa
ted co
rrido
rs
Barce
lona
– Help
edde
velop
a tax
-free
zone
for e
ntrep
rene
urs i
n the
mob
ile te
chno
logies
secto
r in
the 22
@ In
nova
tion D
istric
t–E
merg
ency
debt-
relie
f fina
ncing
supp
ort, a
t the
expe
nse o
f cult
ural
amen
ities a
nd
infra
struc
ture p
rojec
ts– I
mpro
ved e
cono
mic s
tabilit
y
Bosto
n–U
SD20
0milli
onca
pital
gran
t stat
e-lev
el fun
ding f
or ke
y roa
d wor
ks ar
ound
Inn
ovati
on D
istric
t–H
ealth
secto
r/hos
pital
rese
arch
fund
ing
– Gro
wing
amou
nt of
state
aid fr
om
Mass
achu
setts
– Mor
e coh
esive
life s
cienc
es cl
uster
Brisb
ane
– Sha
red f
undin
g for
road
infra
struc
ture a
nd A
UD60
0 milli
onSu
prem
e Cou
rt bu
ilding
–Stat
e gov
ernm
ent m
ore a
ttune
d to c
ity ne
eds
– Inc
reme
ntal d
evolu
tion o
f plan
ning a
nd
touris
m po
wers
– Gre
ater c
apac
ity to
man
age u
rban
spra
wl
Cape
Tow
n– T
rans
port
infra
struc
ture g
rant
of EU
R30
0 milli
onto
cove
r 75%
of M
yCiTi
rapid
bus
trans
it pro
ject
– Wor
ld Ba
nk in
vestm
ent in
wind
and p
hotov
oltaic
secto
r
–Dele
gatio
n of g
reate
r tra
nspo
rt an
d hou
sing
powe
rs– S
harin
g 23%
natio
nal fu
el tax
with
loca
l go
vern
ment
to re
place
coun
cil le
vies
– Alig
nmen
t with
city’
s job
crea
tion a
gend
a– M
ore r
espo
nsive
ness
arou
nd se
ctor a
nd
comp
etitiv
enes
s iss
ues
Hamb
urg
–Key
bene
ficiar
y of F
eder
al Ec
onom
ic St
imulu
s Pac
kage
, for e
-mob
ility a
nd
unive
rsitie
s– E
UR 67
2 milli
onof
Euro
pean
Inve
stmen
t Ban
kloa
ns fr
om 20
07-2
011,
includ
ing in
SM
E fin
ancin
g– E
UR 40
milli
onof
feder
al fun
ds fo
r avia
tion c
luster
from
the M
inistr
y of E
duca
tion
and R
esea
rch
– Rec
ognit
ion of
clus
ter co
mpeti
tiven
ess t
o co
mplem
ent in
frastr
uctur
e sup
port
– Mor
e inte
grate
d aca
demi
c-ind
ustry
links
– Imp
rove
d high
-tech
nolog
y infr
astru
cture
Manc
heste
r
–GBP
560m
illion
North
ern H
ub ra
il inv
estm
ent
– Sup
port
for G
BP13
0milli
onra
il link
s with
Nor
thEn
gland
– GBP
32.5
millio
nfor
susta
inable
trav
el pr
ojects
– GBP
25 m
illion
Grow
ing P
laces
Fun
d allo
catio
n for
key h
ousin
g and
Ente
rpris
e Zon
e inf
rastr
uctur
e– N
omina
ted a
supe
r-con
necte
d city
, awa
rded
up to
GBP
12 m
illion
from
Urba
n Br
oadb
and F
und
– Mor
e com
petiti
on fo
r fun
ding b
ased
on
econ
omic
case
. City
begin
ning t
o be m
ore
succ
essfu
l in bi
ds.
– Imp
rove
d com
muter
acce
ssibi
lity, lo
wer
cong
estio
n cos
ts, ta
lent p
ool e
xpan
sion
Lyon
–Gap
fund
ing fo
r key
deve
lopme
nt pr
ojects
–su
ch as
new
footba
ll stad
ium an
d Tur
in ra
il link
–Sup
port
for Ly
on bi
otech
nolog
y clus
ter
– Mor
e tar
geted
fund
ing fo
r a ha
ndful
of gr
owth
secto
rs– W
orld-
class
rese
arch
facil
ities
– Mor
e job
s link
s with
Italia
n firm
s
Nanji
ng–R
MB68
billio
n (US
D10
.7bil
lion)
inve
sted i
n urb
an co
nstru
ction
in 20
12–M
ore n
ation
al su
ppor
t for s
oftwa
re am
bition
s–S
trong
inve
stmen
t auto
nomy

39
Nat
iona
l/sup
rana
tiona
l inv
estm
ents
and
impa
cts
cont
.
Main
natio
nal/s
upra
-nati
onal
level
inves
tmen
tsW
hat h
as ch
ange
d sinc
e the
crisi
s?Ec
onom
ic an
d gro
wth b
enefi
ts
Oslo
–Dev
elopm
ent o
f Inno
vatio
n Nor
way,
which
co-o
pera
tes w
ith th
e priv
ate ca
pital
marke
t to
facilit
ate in
nova
tion
–Pre
para
tion o
f SME
s for
inter
natio
nal
comp
etitio
n–M
ore s
uppo
rtive a
gend
a aro
und e
xpor
ts an
d glo
bal g
rowt
h
Shen
zhen
– Infr
astru
cture
stim
ulus p
acka
ge in
cludin
g metr
o, hig
h-sp
eed r
ail an
dairp
ort
inves
tmen
t
–Rec
ognit
ion of
func
tiona
l eco
nomi
c reg
ion
size o
f Gua
ngdo
ng pr
ovinc
e– P
ermi
tted c
reati
on of
joint
ventu
res
– Reg
ulator
y rela
xatio
n in Q
ianha
i Zon
e
– Imp
rove
d ind
epen
dent
inves
tmen
t cap
abilit
y, ab
ility t
o brid
ge ga
p on l
arge
publi
c wor
ks
proje
cts
Zuric
h
–Fed
eral
Institu
te of
Tech
nolog
y’s H
öngg
erbe
rg “S
cienc
e City
” cam
pus –
EUR
330 m
illion
over
ten y
ears
– Sup
port
for si
x kilo
metre
sund
ergr
ound
cros
s-city
link,
Durch
mes
serlin
ie. In
tand
em
with
canto
n– D
elays
to B
rütte
ner T
unne
l and
the Z
imme
rber
g Bas
e Tun
nel b
ecau
se of
a lac
k of
feder
al go
vern
ment
funds
– Dea
dlock
over
fund
ing ch
anne
ls an
d ar
rang
emen
ts for
key i
nfras
tructu
re pr
ojects
– Imp
ortan
t cro
ss-b
orde
r mob
ility
enha
ncem
ents
– e.g.
Limm
at Va
lley

40
Local business climate and stable framework conditions
Rationalisation of complex policies and programmes into simple-to-pursue frameworks.
National level transport infrastructure investment
Initial investment in niche higher education facilities
Recognition of practical economic geographies
Facilitating the expansion of the private rented housing sector
The development of an evidence-based and trend-based rather than politicised approach to local economies

41
much greater capacity for autonomous decision making
Future priorities
Priority project, initiative and outlook needsAmsterdam – Facilitate a big expansion of the private rented sector
Barcelona – Incremental delegation of tax management powers to manage infrastructure and innovation – Visa regime conducive to large international student economy
Boston – Improve climate for international students to arrive and be retained upon graduation
Brisbane – Upgraded tax incentives for resource sector– International student regulation
Cape Town– More focused national policy leadership and vision for R&D, especially vis-à-vis the clean technology sector
(e.g. REFIT pricing regulation)– Business climate signals and assurances – e.g. macroeconomic policy, transparency
Hamburg – National infrastructure funding support for waterways, railways and motorways– Improved wind sector incentives
Manchester – Investment in high-speed broadband across the whole region, and improved mobile infrastructure along key transport corridors
Lyon – Funding and prompt finalisation of the Lyon-Turin tunnel rail linkNanjing – Provide more distinctive message about Nanjing’s higher education offer and entrepreneurial potential
Oslo– High-speed rail commitment to link with Stavanger and Berge– Infrastructure to match spatial cluster needs– Less political volatility at national level over investment
Shenzhen – Swift completion of high-speed rail projects in the Greater Pearl River Delta – to Guangzhou/Macau – and also to Beijing and Shanghai
Zurich– Gap funding for major rail and road tunnel projects – e.g. Zurich northern ring– Long-term financing for training programmes in cardiology and other medical skills– More favourable federal investments into quality of life and regional efficiency
tax incentives in emerging sectors with job creation potential

42
How is private sector getting involved as investor, employer, innovator?
New investment in infrastructure and real estate
Strategic partnership and local business leadership
Boston World Partnerships

43
The West Cape Economic Development Partnership
The Amsterdam Economic Board

44
Good practice at gradually improving mechanisms for private sector involvement in economic developments
Priority project, initiative and outlook needs
Amsterdam
– American investment leads in ICT, creative industries and finance
– Twice as many Chinese companies investing since 2007
– Strong, growing Japanese logistics presence around airport
Barcelona
– France, Netherlands and United States are key sources
– Multinational investment in software, chemicals, imaging, ICT, automotive, mobile applications, agrifood
– Substantial EUR 500 million Hong Kong, China investment in port expansion
– Grasp of Barcelona’s potential as a gateway to Mediterranean markets, because of its port
Boston
– Very large developer investment in Innovation District real estate
– Influx of European life science firm investment, alongside beneficial distribution of federal health funds
– Investment in Harvard Business School from Tata Group
– Funding more school tuition in tandem with public sector
– Investment in summer internship scheme to improve post-school skills
Brisbane
– Foreign and institutional investment mostly active in quality central property assets
– Institutional investors engaged in PPPs for toll road projects
– Firms seeking direct exposure to the thriving Queensland economy
Cape Town
– Banks leading funders and guide central city overhaul– Expansion of business district and regeneration
of keynote areas– Convention Centre precinct EUR 500 million,
private-led
– Surge of investment in wind/photovoltaic sectors– Small but growing interest from Saudi Arabia
and Singapore– Growing role of banking industry
Hamburg
– Logistics and industrial firms traditional big investors– High volumes of office take-up and new office building
projects – Open-ended real estate funds very active
– Increase in private house-building– More Korean and Japanese investment in
advanced energy and shipping industries
Manchester
– Reliance on expanding US firms, also German and Italian. Most investment in ICT, life sciences, advanced manufacturing
– Abu Dhabi Investment Authority
– Recognition that Manchester is a cheaper and viable location for national and European headquarters
Lyon– French biotechnology firms heavily active– Fast growing SME setup in online
business/e-commerce
– Established technology firms show more support for SME and start-up community
Nanjing – Most foreign investment through economic and technology development zone
– Investment higher up the value chain in software and service outsourcing
Oslo – Investment in cultural flagship projects– Surrounding niche financial services
– Large real estate investment influx due to stability and low debt
Shenzhen
– Japanese investment in retail, electronics– Large interest from multinational in fully-furnished
business-equipped office centres– Hong Kong, China and global financial firm interest
in Qianhai
– Boom in foreign investment in real estate, vehicles and infrastructure
– Recognition from finance and business services firms of Qianhai zone’s likely regulatory advantages
Zurich
– Swisscom CHF 300 million investment in fibre-optic network
– Local investment from headquarter institutions – e.g. FIFA
– More partnered investment in cultural institutions
45
What is needed?

46

47
References
www.acsa.co.za/home.asp?pid=137. www.adv.aero/verkehrszahlen/archiv/statistiken-ivf-
2011. www.brookings.edu/research/inter
actives/global-metro-monitor
www.caac.gov.cn/I1/K3/201203/P020120321570053265625.xls.Recession, Recovery and Reinvestment: The Role of Local Economic
Leadership in a Global Crisis
The Recession and Beyond: Local and Regional Responses to the Downturn
Organising Local Economic Development: The Role of Development Agencies and Companies
10.1787/9789264083530-en
Subnational Public Finance in the European Unionwww.ccre.org/en/communiques/view/338
Fiscal Monitor: October 2012www.imf.org/external/pubs/ft/fm/2012/02/pdf/fm1202.pdf.
www.slideshare.net/ashish_tandon/boston-as-a-preffered-investment-destination
www.massport.com/logan-airport/about-logan/Pages/LoganStatistics.aspx.
www.mckinsey.com/insights/mgi/research/urbanization/urban_world.
www.mckinseyquarterly.com/Cities_the_next_frontier_for_global_growth_2758.Economische Verkenningen 2011
www.metropoolregioamsterdam.nl/files/Economische%20verkenningen%20MRA%202011.pdf
www.caa.co.uk/default.aspx?catid=80&pagetype=88&pageid=3&sglid=3.Prospectus: Lead. Co-ordinate. Drive http://fileshare.wwc.co.za/docs/5
00/final-edp-prospectus-lo-res-web.pdf


49
Part II
Case studies


51
Amsterdam Metropolitan Area
Statistical comparison Metro population
(millions)Metro size
(thousands km²) Metro GDP total(billions USD)
Income growth 1993-2011 (1993=100)
Employment growth 1993-2011 (1993=100)
2.1 1.8 90 143* (high) 124* (medium)
Note:
Source: www.brookings.edu/research/interactives/global-metro-monitor
Economic history and economic change: Investment and strategy implications
Current economic governance
52
Current investment flows
53
Impact of crisis

54
Growth strategy
Humuslaag
Investment strategy and tools

55
Implementation arrangements
kantorenloods
56
57
Role of national and inter-governmental bodies
58
Sources
www.brookings.edu/research/interactives/global-metro-monitor
www.amsterdam.nl/@535376/pagin
www.amsterdam.nl/@526769/pagina.
Economische Verkenningen Metropoolregio Amsterdam 2011 www.os.amsterdam.nl/pdf/2011_economische_verkenningen_mra.pdf
Economische Verkenningen Metropoolregio Amsterdam 2012 www.os.amsterdam.nl/pdf/2012_economische_verkenningen_mra.pdf.
www.iamsterdam.com/en-GB/Business/Setting-up-your-business/Who-is-here
www.iamsterdam.com/en-GB/press-room/city-of-amsterdam-press-room/2012-Press-Releases/2012%20Press%20Room/Transformation%20of%20empty%20offices
www.iamsterdam.com/The%20Netherlands%20top%20recipient%20of%20US%20foreign%20direct%20investment%20in%202011
www.iamsterdam.com/zuidasdok%20expansion.
www.iamsterdam.com/en-GB/press-room/city-of-amsterdam-press-room/2012-Press-Releases/2012%20Press%20Room/Ijburg_new_island
www.iamsterdam.com/Quality%20of%20life%20important%20for%20companies
International Planning Studieswww.lsfamsterdam.nl/index.html
www.nrc.nl/nieuws/2012/04/19/amsterdam-streeft-naar-oprichting-derde-universiteit
www.schiphol.nl/SchipholGroup/NewsMedia/PressreleaseItem/EIBToProvideEUR350mForSchipholsInnovativeBaggageSystemProgramme.htm.
Aerlines Magazine www.aerlines.nl/index.php/2008/development-of-airport-regions-varieties-of-institutions-in-schiphol-and-frankfurt

59
Barcelona
Statistical comparison
Metro population (millions)
Metro size(thousands km²)
Metro GDP total(billions USD)
Income growth 1993-2011 (1993=100)
Employment growth 1993-2011 (1993=100)
5.4 1.8 162 133 (medium) 141 (high)
Source: www.brookings.edu/research/interactives/global-metro-monitor
Economic history and economic change: Investment and strategy implications
60
Current economic governance

61
Barcelona Creixement
Turismo de la Barcelona
Current investment flows

62
Distribution of foreign companies in Catalonia in 2010 and change since 2006, by country of origin
Source:www.barcelonaeconomictriangle.cat/b/wp-content/uploads/2012/05/foreign-investment-BCN_EN.pdf
L’Hospitalet de Llobregat
-200 -100 0 100 200 300 400 500 600 700
Sweden
Japan
Switzerland
Belgium and Luxembourg
United Kingdom
Netherlands
Italy
United States
Germany
France
Number of companies
Total companies in 2010 Change (+/-) between 2006 and 2010
63
a new
Impact of crisis

64
Growth strategy
Barcelona Creixement

65
66
Investment strategy and tools
Support for SMEs and entrepreneurs
Office of Attention to Enterprises (OAE).
New tax-free zone.
Investment forums.
Deepened co-operation with the private sector over urban services and development

67
Attracting and retaining investment through promotion
Implementation arrangements
Professionalisation of public services and private sector competence
68
Building inter-urban ties and an international business brand
Acceleration of housing development and core infrastructure upgrades

69
Pla Empenta
Passeig de Gràcia
Role of national and inter-governmental bodies
vis-a-vis

70
Sources
www.acc10.cat/offices/shanghai/en/news/news_detail.jsp?id=tcm:213-143308&int=true&title=Invest+in+Catalonia+secured+27+new+investment+projects+in+the+first+half+of+2012
www.acc10.cat/offices/shanghai/en/news/news_detail.jsp?id=tcm:213-143287&int=true&title=A3+Software+to+invest+%E2%82%AC40m+in+Barcelona+based+European+project+
www.acc10.cat/offices/berlin/en/news/news_detail.jsp?id=tcm:213-96221&int=true&title=Duscholux+chooses+Barcelona+as+launch+pad+for+Latin+American+expansion+
www.acc10.cat/offices/newyork/en/news/news_detail.jsp?id=tcm:213-141712&int=true&title=Ricoh+puts+%E2%82%AC2+million+into+Barcelona+service+centre+.
www.acc10.cat/offices/siliconvalley/en/news/news_detail.jsp?id=tcm:213-138457&int=true&title=US+multinational+Tech+Data+gets+Barcelona+operations+base+underway+with+400+new+workers+
w42.bcn.cat/web/en/noticies-i-premsa/noticies/actives/Entrepreneurial-activity-in-Barcelona-grew-in-2011-and-marked-a-turning-point-with-respect-to-previous-years.jsp
w3.bcn.cat/fitxers/premsa/exporta.143.pdf.
www.barcelonaeconomictriangle.cat/b/wp-content/uploads/2012/05/foreign-investment-BCN_EN.pdf
w3.bcn.cat/V01/Serveis/Noticies/V01NoticiesLlistatNoticiesCtl/0,2138,1653_1802_3_1811883712,00.html?accio=detall&home=HomeBCN
w3.bcn.es/V01/Serveis/Noticies/V01NoticiesLlistatNoticiesCtl/0,2138,1653_35144087_3_1825101379,00.html?accio=detall&home=HomeBCN&nomtipusMCM=Noticia
71
w42.bcn.cat/web/en/noticies-i-premsa/noticies/actives/Barcelona-will-be-the-world-capital-of-the-electric-vehicle-in-2013.jsp
w3.bcn.cat/V01/Serveis/Noticies/V01NoticiesLlistatNoticiesCtl/0,2138,1653_1802_3_1809836865,00.html?accio=detall&home=HomeBCN
w3.bcn.es/V01/Serveis/Noticies/V01NoticiesLlistatNoticiesCtl/0,2138,1653_35144087_3_1861763627,00.html?accio=detall&home=HomeBCN&nomtipusMCM=Noticia.
www.gsma.com/connectedliving/wp-content/uploads/2012/05/8-Juanma-Barrionuevo-MWCB-Setting-up-a-new-generation-mobile-smart-city.pdf.
www.brookings.edu/research/interactives/global-metro-monitor
www.businesscitymagazine.com/interview-with-xavier-trias-mayor-of-barcelona
www.catalannewsagency.com/news/business/fujitsu-invests-%E2%82%AC12-million-its-european-sales-centre-based-barcelona
http://newsroom.mastercard.com/wp-content/uploads/2012/06/MasterCard_Global_Destination_Cities_Index_2012.pdf
www.interempresas.net/Offices/Articles/52322-BZ-Barcelona-area-innovation-the-new-scientific-and-technological-park-of-Barcelona.html
www.iccaworld.com
www2.lse.ac.uk/europeanInstitute/research/catalanObservatory/documents/pdf/Crisi-and-Local-Gvt/Presentacio-LSE---JLlimona.pdf
www.catalannewsagency.com/news/business/xavier-trias-completes-successful-visit-china-promote-investment-barcelona
http://mobileworldcapital.com/the-taiwan-firm-toro-chooses-the-mobile-world-capital-to-set-up-its-european-headquarters
http://uk.reuters.com/article/2012/07/27/idUKWLA107320120727


73
Boston
Statistical comparison
Metro population (millions)
Metro size(thousands km²)
Metro GDP total(billions USD)
Income growth 1993-2011 (1993=100)
Employment growth 1993-2011 (1993=100)
4.6 12.1 296 158 (high) 116 (low)
Source: www.brookings.edu/research/interactives/global-metro-monitorwww.mckinseyquarterly.com/Cities_the_next_frontier_for_global_growth_2758
Economic history and economic change: Investment and strategy implications
74
Current economic governance
75
Current investment flows
76
Impact of crisis
Growth strategy

77
Create Boston
Innovation District
Investment strategy and tools
78

79
Implementation arrangements

80

81
Role of national and inter-governmental bodies

82
Sources
www.bostonpublicschools.org/news/school-committee-approves-superintendent%E2%80%99s-budget-plan-next-school-year
Insightwww.bostonredevelopmentauthority.org/PDF/ResearchPublications//IS-06-2.pdf
www.bostonredevelopmentauthority.org/pdf/documents/CITY%20OF%20BOSTON-Boston%20Invests.pdf
The Boston Economy in 2010.
www.bostonredevelopmentauthority.org/pdf/documents/Budgets%20for%20BRA%202010.pdf
www.bostonredevelopmentauthoritynews.org/2012/07/19/mayor-menino-celebrates-fan-pier-topping
www.bostonredevelopmentauthority.org/EconDev/LifeSciences.asp
www.bostonredevelopmentauthoritynews.org/2012/07/24/mayor-menino-announces-over-13-million-in-infrastructure-investments-to-downtown-boston
www.bostonredevelopmentauthoritynews.org/2012/04/12/mayor-menino-announces-new-projects-moving-forward-2
Boston Globe www.bostonglobe.com/business/2012/01/30/survey-finds-boston-lags-behind-new-york-internet-based-business/aMHGc4ROrKtl6dePR7FxYP/story.html
www.brookings.edu/research/interactives/global-metro-monitor
http://aei.org/outlook/education/k-12/accountability/pieces-of-the-puzzle-factors-in-improving-achievement-of-urban-school-districts
www.cityofboston.gov/news/default.aspx?id=5684
www.cityofboston.gov/business

83
www.cityofboston.gov/news/default.aspx?id=5671
www.cityofboston.gov/dnd/obd/Boston_Invests_in_Growth.asp
www.createboston.com
The Atlantic Cities www.theatlanticcities.com/jobs-and-economy/2012/08/americas-leading-high-tech-venture-capital-centers/3058
Boston Globewww.bostonglobe.com/business/2012/04/24/johnson-family-wins-chamber-honor/hNK24ZvJwmYb87AgI5K4mI/story.html.
Boston Globewww.boston.com/business/technology/innoeco/2010/07/new_funding_for_boston_world_p.html
www.mckinseyquarterly.com/Cities_the_next_frontier_for_global_growth_2758
Boston Globehttp://articles.boston.com/2012-03-06/opinion/31124338_1_middle-class-neighborhood-government-center
Boston: A Leader in NIH Awards for 17 Consecutive Years www.bostonredevelopmentauthority.org/PDF/ResearchPublications//NIH2012FinalReport.pdf
Huffington Post www.huffingtonpost.com/thomas-m-menino/boston-innovation_b_1624226.html
Boston Globe www.bostonglobe.com/metro/2012/07/10/true-cost-big-dig-exceeds-billion-with-interest-officials-determine/oH6CxRERYmWYMzIMs12Z8J/story.html
Boston Globewww.boston.com/business/globe/articles/2007/03/03/mayor_crafts_effort_to
_bring_jobs_to_boston
Boston Globehttp://articles.boston.com/2012-06-14/metro/32216019_1_science-center-life-sciences-harvard-officials
Boston Globewww.bostonglobe.com/business/2011/11/17/another-wave-apartment-
construction-hit-boston/j3SB0e6bY0dFFiybYweHIL/story.html
Boston Globewww.bostonglobe.com/business/2011/11/05/islands-economic-growth/pWasB2pro8TSnXveZoVULM/story.html
84
Boston Globe www.bostonglobe.com/business/2012/06/11/state-street-corp-get-tax-break-for-waterfront-building/Ukt5GfxFnQhzvjaxliRepN/story.html
Boston Globehttp://articles.boston.com/2012-03-27/business/31240561_1_companies-office-buildings-office-space
Boston Globewww.boston.com/news/local/massachusetts/articles/2011/03/28/census_figures_show_slow_population_growth_in_boston_metro_area
http://articles.boston.com/2012-05-29/technology/31885301_1_promising-start-ups-finalists-funding
Boston Globewww.bostonglobe.com/business/2012/06/16/europe-biotech-firms-flocking-bay-state/OvE3RfwCgMvMsU47Ae6fiI/story.html
Boston Globe www.bostonglobe.com/metro/2012/06/13/massachusetts-life-sciences-initiative-brings-fewer-jobs-than-expected/GLERSTY8ZpoKStz1aivLDJ/story.html
Boston Globehttp://articles.boston.com/2012-02-08/metro/31034257_1_arts-education-
wallace-foundation-city-schools
85
Brisbane
Statistical comparison
Metro population (millions)
Metro size(thousands km²)
Metro GDP total(billions USD)
Income growth 1993-2011 (1993=100)
Employment growth 1993-2011 (1993=100)
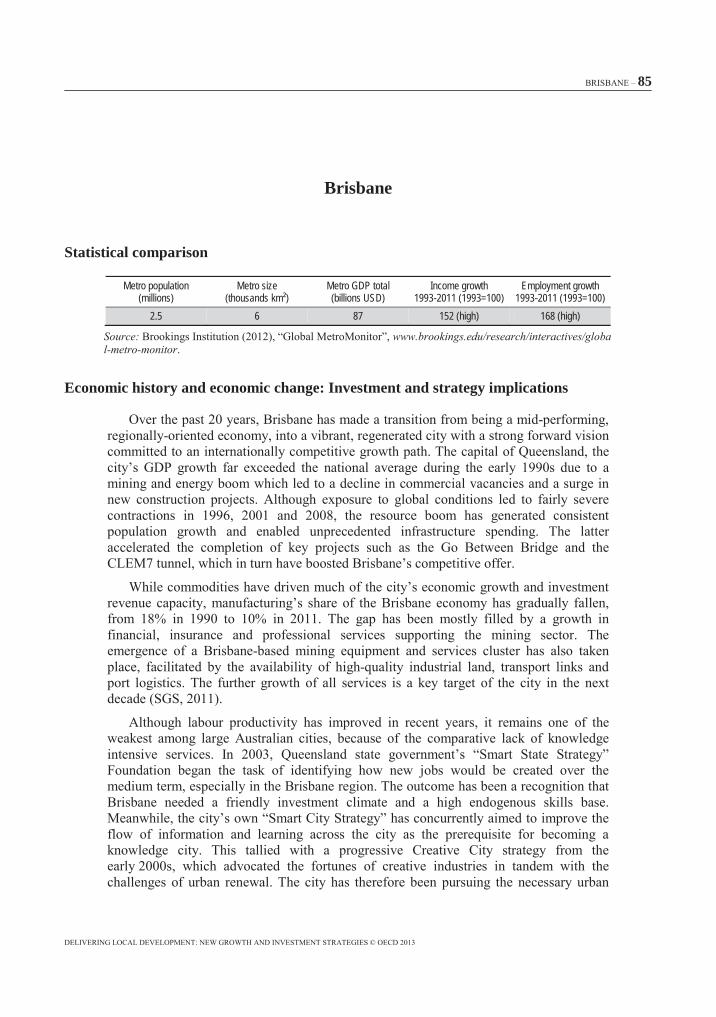
2.5 6 87 152 (high) 168 (high)
Source: www.brookings.edu/research/interactives/global-metro-monitor
Economic history and economic change: Investment and strategy implications
86
Current economic governance
87
Current investment flows

88
Impact of crisis
Growth strategy
Economic Development Plan
become a world city
The attraction of more business visitors.
The expansion of firms from the international resource industry.
89
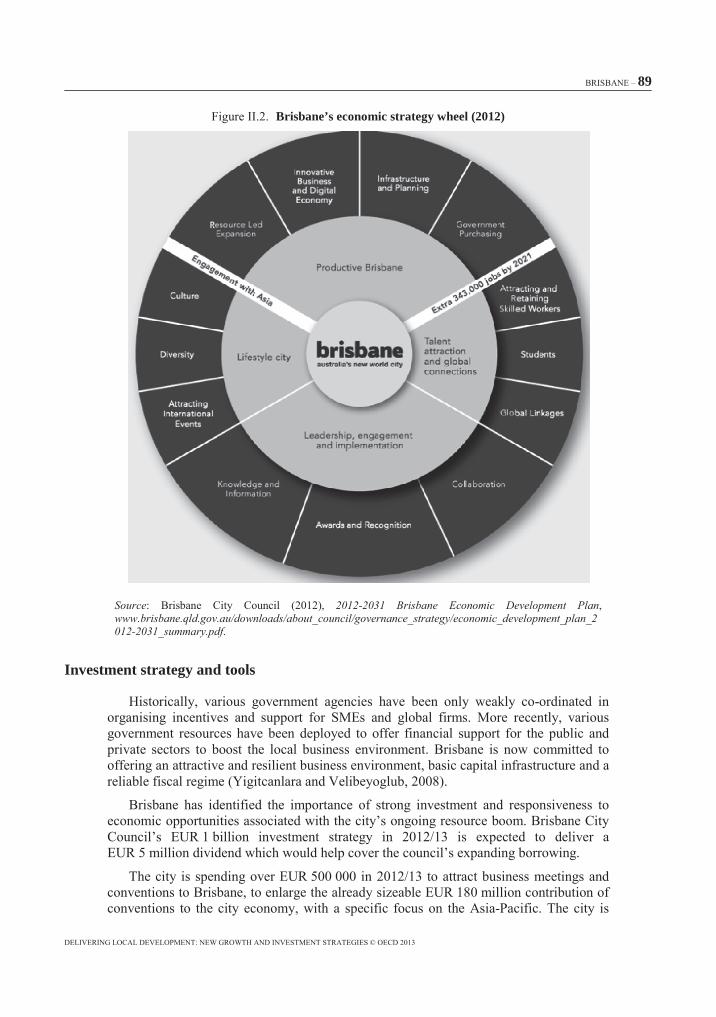
Brisbane’s economic strategy wheel (2012)
Source 2012-2031 Brisbane Economic Development Planwww.brisbane.qld.gov.au/downloads/about_council/governance_strategy/economic_development_plan_2012-2031_summary.pdf
Investment strategy and tools

90
Implementation arrangements
Attracting talent, especially from the Asia-Pacific region.

91
Greater national and international air connectivity.
Preservation of affordability.
A new EUR 40 million branding strategy.
Road infrastructure improvements.
Appointment of a Chief Digital Officer.

92
Role of national and inter-governmental bodies

93
Sources
International Journal of Urban and Regional Research
The Australianwww.theaustralian.com.au/national-affairs/state-politics/city-debt-soars-on-road-plans/story-e6frgczx-1226403576108
www.brisbane.qld.gov.au/2010%20Library/2009%20PDF%20and%20Docs/2.%20Planning%20and%20Building/2.7%20After%20development%20approval/infrastructure_charges_moratorium_2012.pdf
Lord Mayor’s Brisbane Economic Snapshotwww.brisbane.qld.gov.au/downloads/about_council/governance_strategy/economic_development_snapshot_july_2012.pdf
2012-2031 Brisbane Economic Development Planwww.brisbane.qld.gov.au/downloads/about_council/governance_strategy/economic_development_plan_2012-2031_summary.pdf
The Lord Mayor’s Budget Speech,www.brisbane.qld.gov.au/downloads/about_council/council_information_rates/news_publications/budget_lm_speech_2012-13.pdf
www.investbrisbane.com.au/Corporate/Media/News/2012/6/R,-a-,D%20Tax%20Incentive%20-%20Impact%20on%20the%20Mining%20Sector
Who We Are – What We Dowww.brisbanemarketing.com.au/Resources/~/media/Corporate/Documents/Common/Corp_Vision.ashx
www.investbrisbane.com.au/pages/Industry%20sectors/~/media/Corporate/Documents/Invest/Invest%20Fact%20Sheets/Infrastructure-Fact-Sheet.ashx
www.brisbanetimes.com.au/business/mining-and-resources/bhp-warns-of-job-cuts-at-coal-mines-20120816-24a8k.html#ixzz25uMe4mv5
www.brookings.edu/research/interactives/global-metro-monitor
www.colliers.com.au/General/institutionalsales/Capital_Transactions_Reports/Brisbane.aspx
www.colliers.com.au/Services/Capital_Markets/~/media/Files/Corporate/Research/International%20Property%20Reports/Colliers%20International%20Global%20Capital%20Investment%20-%202H%202012.ashx
94
Brisbane Times www.brisbanetimes.com.au/queensland/council-backs-maroons-in-new-marketing-strategy-20120625-20xt9.html.
Brisbane Timeswww.brisbanetimes.com.au/queensland/brisbane-rates-to-rise-a-dollar-a-week-20120620-20n1y.html
Urban Policy and Research
www.btp.net.au/243/section.aspx/category/9/catalog/72/page/1998
www.couriermail.com.au/questnews/central/plan-to-take-advantage-of-global-expansion/story-fn8m0qb4-1226270592523
Australian Cities Accounts: 2010-11 Estimateswww.sgsep.com.au/files/GDP_by_Major_Capital_City.pdf

95
Cape Town
Statistical comparison
Metro population (millions)
Metro size(thousands km²)
Metro GDP total(billions USD)
Income growth 1993-2011 (1993=100)
Employment growth 1993-2011 (1993=100)
3.6 2.5 30 112 (low) 118 (low)
Source: www.brookings.edu/research/interactives/global-metro-monitor
Economic history and economic change: Investment and strategy implications

96
Current economic governance

97
Economic Development Partnership
Model for organising economic co-operation enacted through Cape Town’sEconomic Development Partnership
Sourcewww.capetownpartnership.co.za/economic-development-partnership-edp-launched-
in-cape-town
98
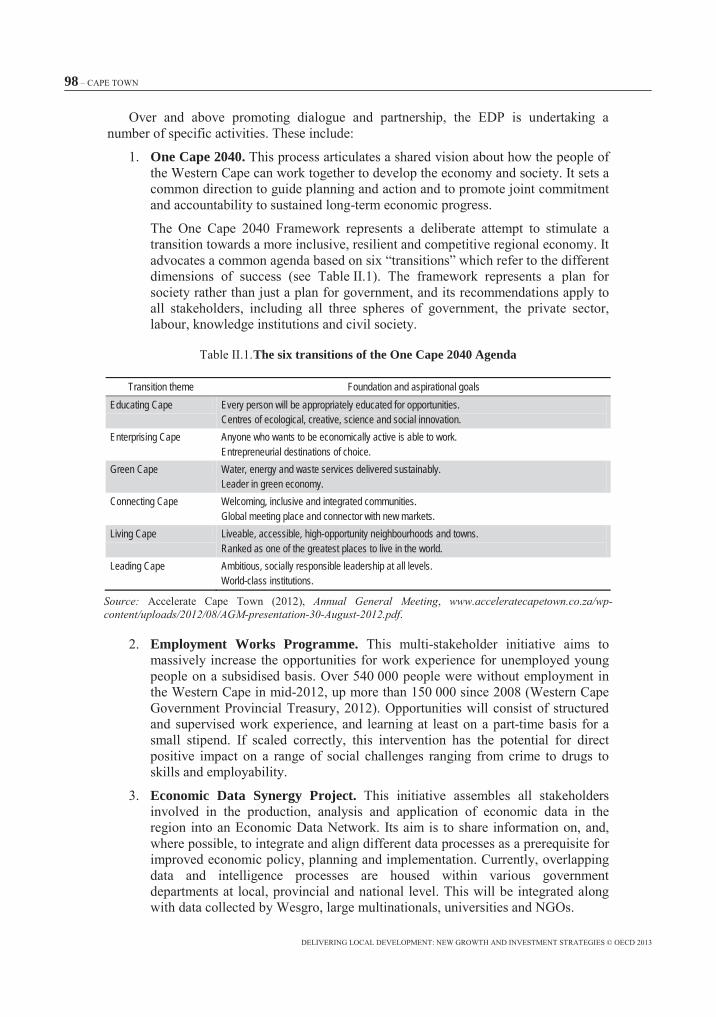
One Cape 2040.
The six transitions of the One Cape 2040 Agenda
Transition theme Foundation and aspirational goalsEducating Cape Every person will be appropriately educated for opportunities.
Centres of ecological, creative, science and social innovation. Enterprising Cape Anyone who wants to be economically active is able to work.
Entrepreneurial destinations of choice. Green Cape Water, energy and waste services delivered sustainably.
Leader in green economy. Connecting Cape Welcoming, inclusive and integrated communities.
Global meeting place and connector with new markets. Living Cape Liveable, accessible, high-opportunity neighbourhoods and towns.
Ranked as one of the greatest places to live in the world. Leading Cape Ambitious, socially responsible leadership at all levels.
World-class institutions.
Source: Annual General Meeting www.acceleratecapetown.co.za/wp-content/uploads/2012/08/AGM-presentation-30-August-2012.pdf
Employment Works Programme.
Economic Data Synergy Project.
99
Provincial Competitiveness Index.
Regional Innovation System.
Leadership and Partnership Programme.
Current investment flows

100
FDI investment and projects in Western Cape by sector (January 2009-December 2010)
Source:
Impact of crisis
0% 10% 20% 30% 40% 50%
Renewable energy
Communications
Hotels and tourism
Warehousing and storage
Healthcare
Software and IT services
Business services
Financial services
Consumer products
Food and tobacco
Electronic components
Pharmaceuticals
% Capex % projects

101
Growth strategy
Heavy industries.
Light industries.
Design.
Urban.
Coastal.
102
Investment strategy and tools
103
Implementation arrangements
Efficient allocation of infrastructure.
A fair and efficient regulatory environment to nurture small businesses.

104
Role of national and inter-governmental bodies

105

106
Sources
Annual General Meetingwww.acceleratecapetown.co.za/wp-content/uploads/2012/08/AGM-presentation-30-August-2012.pdf
www.andrewboraine.com/2011/08/going-up-cape-towns-tallest-building-since-1993-represents-more-than-a-property-development
www.andrewboraine.com/2011/06/look-east-for-innovation-thats-cape-towns-east-city
www.capetownpartnership.co.za/economic-development-partnership-edp-launched-in-cape-town.
www.brookings.edu/research/interactives/global-metro-monitor
www.westerncape.gov.za/text/2012/7/WCER-2012Q2.pdf
http://capetownchamber.com/the-cape-chamber-of-commerce-african-commercial-dispute-settlement-centre
Discussion Paper http://capetownpartnership.co.za/wp-content/uploads/2012/02/Future-Cape-Context-Report-Feb-2012-FOR-DISTRIBUTION.pdf
www.capetownpartnership.co.za/cape-town-creating-opportunity-through-entrepreneurship
www.capetownpartnership.co.za/the-economic-development-partnership-is-hiring
www.capetownpartnership.co.za/cape-town-one-step-closer-to-becoming-an-entrepreneurial-capital
www.capetownpartnership.co.za/city-centre-gets-r580m-upgrade
Five Year Plan Cape Town 2012-2017: Integrated Development Plan (IDP) 2012/13 Review www.capetown.gov.za/en/IDP/Documents/T4IB03575_A4_IDP12_final.pdf

107
State of the Nation: South Africa 2008
Antipode
www.joburg.org.za/gds2040/pdfs/phil_harrisons_slides.pdf
www.iolproperty.co.za/roller/news/entry/de_lille_declares_war_on
www.springerlink.com/content/c42634l683263363/fulltext.html
www.thenewage.co.za/mobi/Detail.aspx?NewsID=10849&CatID=1007
E-newsletter www.wesgro.co.za
http://wesgro.co.za/corporate/press-releases/on-the-road-to-recovery-western-cape-economy-attracts-zar871bn-in-2011
www.wcedp.co.za/news/future-cape-overcoming-structural-challenges-and-investing-in-liveable-communities
Provincial Economic Review and Outlook 2012


109
Hamburg
Statistical comparison
Metro population (millions)
Metro size(thousands km²)
Metro GDP total(billions USD)
Income growth 1993-2011 (1993=100)
Employment growth 1993-2011 (1993=100)
4.9 26.1 223 115 (low) 113 (low)
Source: www.brookings.edu/research/interactives/global-metro-monitorwww.mckinseyquarterly.com/Cities_the_next_frontier_for_global_growth_2758
Economic history and economic change: Investment and strategy implications
Länder

110
Current economic governance
Hamburgische Gesellschaft für Wirtschaftsförderung mbH
Mittelstand

111
Current investment flows
Impact of crisis
Global Metro Monitor

112
Growth strategy
Vision Hamburg – Responsible Growth
The upgrade of port facilities.
Subsidise growth of the SME-based economy.

113
Investment strategy and tools
European Cities and Regions of the Future
FörderassistentenMittelstandsförderinstitut
Innovationsstiftung Hamburg
Programme to promote highly qualified employees in new jobs.
114
Programme to promote Innovation – PROFI
Hamburg Innovation Trust Development Programme.
Implementation arrangements
Central location.
Hub infrastructure.

115
Recreation and well-being.
Education and innovation.
entrepôt
Mümmelmannsberg

116
Role of national and inter-governmental bodies
117
Sources
www.brookings.edu/research/interactives/global-metro-monitor
http://investing.businessweek.com/research/stocks/private/snapshot.asp?privcapId=157402
www.hamburg.de/immobilienreport-hamburg-2011
www.hamburg.de/immobilienreport-fehmarnbelt-querung
www.colliers.com/~/media/Files/EMEA/emea/research/investment/2011Q2-germany-colliers-office-and-investment-market-report.ashx
Statistical Report: 2011www.eib.org/attachments/general/reports/st2011en.pdf
http://ec.europa.eu/eures/main.jsp?lang=en&acro=lmi&catId=360&countryId=DE®ionId=DE6&langChanged=true
www.hafencity.com/print.php?type=artikel&language=en&id=26.
www.iba-hamburg.de/en/service/pressebereich/pressemitteilung-detailansicht/presseartikel/mayor-olaf-scholz-lays-the-cornerstone-for-the-gateway-to-the-world-educational-centre-1.html
www.mckinseyquarterly.com/Cities_the_next_frontier_for_global_growth_2758
New York Times www.nytimes.com/2011/11/18/business/global/a-bold-plan-long-thought-out-to-remake-hamburg.html
Hamburg Welcome Days: Internationality of Metropolitan Life and Economicshttp://welcome.hamburg.de/contentblob/3177424/data/hwd-review-ppt-inter-eco.pdf
Investing in Hamburg’s Future: Information on the Construction of the Moorburg Hard Coal-fired Power Plant www.vattenfall.de/de/moorburg/file/Investing_in_Hamburg_s_future-EN.pdf_21123502.pdf


119
Lyon
Statistical comparison
Metro population (millions)
Metro size(thousands km²)
Metro GDP total(billions USD)
Income growth 1993-2011 (1993=100)
Employment growth 1993-2011 (1993=100)
1.7 3.3 75 128 (medium) 124 (medium)
Source: www.brookings.edu/research/interactives/global-metro-monitor
Economic history and economic change: Investment and strategy implications
La Part-Dieu
Projet d’agglomération

120
Millénaire 3
La Part-Dieu
Current economic governance

121
Current investment flows
ldlc.com
122
Impact of crisis
Growth strategy
La Part-Dieu
Investment strategy and tools
EUR 35 billion national scheme allocates projects in five priority sectors:
123
Ville de l’Entrepreneuriat
Implementation arrangements

124
La Part-Dieu
La Part-Dieu
125
La Part-Dieu Carré de Soie
Tête d’Or
Role of national and inter-governmental bodies
126
Sources
www.aderly.com/publications/585.pdf
www.aderly.com/lyon-economic-news/lyon-biopole-pole-centre-recherche-scientifique-news-BIOASTER-UNE-REPONSE-DEDIEE-DANS-LES-DOMAINES-DE-L-INFECTIOLOGIE-ET-LA-MICROBIOLOGIE,n,6744,FR.jsp
www.aderly.com/lyon-economic-news/-news-HELP-FOR-STARTUPS-FROM-BOOSTINLYON,n,6774,EN.jsp
www.aderly.com/implanter-une-entreprise/agences-de-developpement-economique,p,68,FR.jsp
Lyon Capitale www.lyoncapitale.fr/Journal/univers/Actualite/OL-Land/Le-stade-des-Lumieres-entre-dans-sa-phase-operationnelle
www.brookings.edu/research/interactives/global-metro-monitor
Economy and Society in Europe : A Relationship in Crisis
www.business.greaterlyon.com/city-business-support-lyon-entrepreneurship-system.85.0.html?&L=1
www.grandlyon.com/Info.1164+M57012b59c03.0.html
www.grandlyon.com/Info.1164+M5a172ac22ad.0.html
www.grandlyon.com/Info.1164+M54f5cce50ec.0.html.
www.grandlyon.com/Info.1164+M5dc6bf9919c.0.html.
www.grandlyon.com/Info.1164+M51f22e49713.0.html.
BBC Onlinewww.bbc.co.uk/news/business-13206733.
Making Strategic Spatial Plans:Innovation in Europe

127
www.espon.eu/export/sites/default/Documents/Projects/TargetedAnalyses/CAEE/CAEE_Lyon_Case_Study_Appendix_C5_FINAL.pdf
Thinking Creatively in Turbulent Times


129
Manchester
Statistical comparison
Metro population (millions)
Metro size(thousands km²)
Metro GDP total(billions USD)
Income growth 1993-2011 (1993=100)
Employment growth 1993-2011 (1993=100)
2.6 1.3 90 137 (medium) 108 (low)
Source: www.brookings.edu/research/interactives/global-metro-monitor
Economic history and economic change: Investment and strategy implications

130
Current economic governance

131
Current investment flows

132
Impact of crisis
Growth strategy
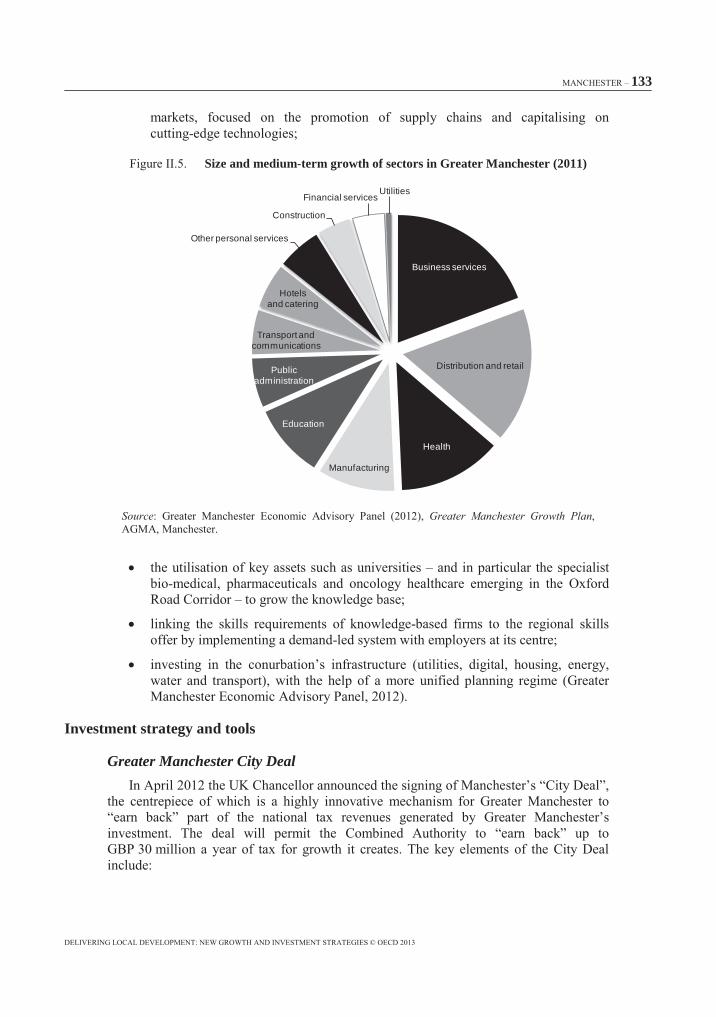
133
Size and medium-term growth of sectors in Greater Manchester (2011)
Source Greater Manchester Growth Plan
Investment strategy and tools
Greater Manchester City Deal
Business services
Distribution and retail
Health
Manufacturing
Education
Transport and communications
Public administration
Hotels and catering
Other personal services
Construction
Financial servicesUtilities
134
JESSICA/Evergreen
135
Regional Growth Fund
Airport City Enterprise Zone
136
Implementation arrangements
A focus on key growth sectors
Investing in transport infrastructure
Investing in digital infrastructure

137
Focusing on growth markets

138
Role of national and inter-governmental bodies
The private sector

139
Sources
Financial Timeswww.ft.com/cms/s/0/75efe33c-832d-11e1-9f9a-
00144feab49a.html#axzz25SKngrS2
www.brookings.edu/research/interactives/global-metro-monitor
Greater Manchester Business Week
Greater Manchester Growth Plan
European Regional Development Fund: Second Report of Session 2012-13
www.investinmanchester.com/wp-content/uploads/2010/05/MIDAS-BUSINESS-PLAN-2010-11.pdf
www.investinmanchester.com/why-manchester/business-activities/headquarters
Financial Times www.ft.com/cms/s/0/3efaddca-dd67-11e1-8fdc-00144feab49a.html#axzz25SKngrS2
http://menmedia.co.uk/manchestereveningnews/news/business/s/1463547_business-leaders-welcome-200m-boost-from-regional-growth-fund
http://menmedia.co.uk/manchestereveningnews/news/transport/public_transport/s/1580869_all-change-for-commuters-as-greater-manchester-secures-12bn-for-public-transport
www.manchester-review.org.uk
http://menmedia.co.uk/manchestereveningnews/news/business/s/1506436_us-leads-competition-to-invest-in-manchester
http://menmedia.co.uk/manchestereveningnews/news/business/enterprise/s/1472770_greater-manchester-local-enterprise-partnership-lands-25m-regeneration-fund
http://menmedia.co.uk/manchestereveningnews/news/b
140
usiness/sme/s/1472943_european-regional-development-fund-programme-provides-20m-for-business-start-ups
http://menmedia.co.uk/manchestereveningnews/news/business/s/1586275_greater-manchester-faces-economic-long-haul-despite-unemployment-fall-say-experts-
http://neweconomymanchester.com/stories/1617
Greater Manchester Forecasting Model: 2011 Report Updatehttp://neweconomymanchester.com/downloads/1337-2011-GMFM-ANNUAL-REPORT-ppt
City of Revolution: Restructuring Manchester
www.placenorthwest.co.uk/news/archive/11340-airport-relief-road-to-open-within-five-years.html
International Journal of Urban and Regional Research
City of Revolution: Restructuring Manchester
New Economy Working Papers http://works.bepress.com/cgi/viewcontent.cgi?filename=0&article=1046&context=pshapira&type=additional&referer=http%3A%2F%2Fworks.bepress.com%2Fpshapira%2F40%2F
www.economist.com/node/154692
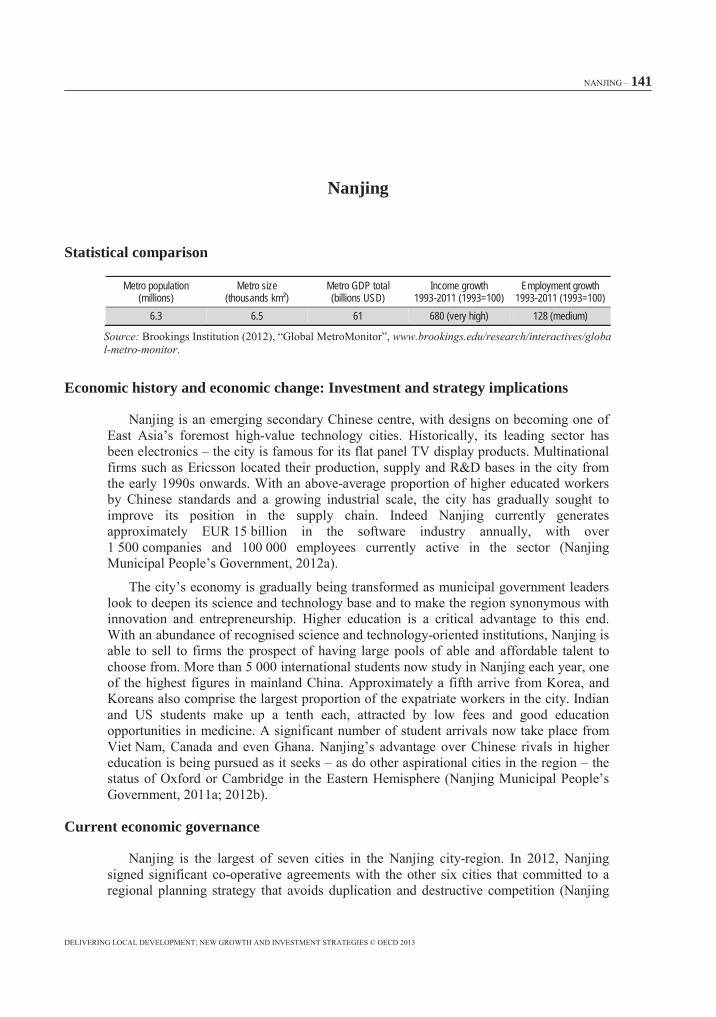
141
Nanjing
Statistical comparison
Metro population (millions)
Metro size(thousands km²)
Metro GDP total(billions USD)
Income growth 1993-2011 (1993=100)
Employment growth 1993-2011 (1993=100)
6.3 6.5 61 680 (very high) 128 (medium)
Source: www.brookings.edu/research/interactives/global-metro-monitor
Economic history and economic change: Investment and strategy implications
Current economic governance
142
Current investment flows
Impact of crisis
Growth strategy
software, service outsourcing, finance and insurance, cultural and creative industries
321 Talent Plan
143
Investment strategy and tools
Incentives to attract high-value talent
Attraction of domestic and foreign institutional R&D investment

144
loan interest offset
Improvement of overall business and infrastructural environment
145
Implementation arrangements
Mechanisms to attract human capital
Infrastructure and liveability enhancements

146
Local skills development

147
Sources
www.allianceboots.com/nanjing-ab-form-strategic-alliance.aspx
www.brookings.edu/research/interactives/global-metro-monitor
www.chinadaily.com.cn/china/2009-11/30/content_9073709.htm
www.chinatoday.com.cn/ctenglish/se/txt/2009-08/20/content_212832_3.htm
www.chinatoday.com.cn/ctenglish/se/txt/2009-08/20/content_212832_2.htm
www.globaltimes.cn/NEWS/tabid/99/ID/701544/Some-see-Nanjings-urban-rush-prior-to-youth-games-as-overambitious.aspx
http://english.jschina.com.cn/TodayJiangsu/201202/t965300.shtml
Nanjing 321 Planwww.321.gov.cn
http://english.nanjing.gov.cn/zx/szyw/201201/t20120112_350108.htm
http://english.nanjing.gov.cn/zx/szyw/201202/t20120220_353229.htm
http://english.nanjing.gov.cn/zx/szyw/201205/t20120503_359870.htm
http://english.nanjing.gov.cn/zx/szyw/201201/t20120130_351561.htm
http://english.nanjing.gov.cn/zx/szyw/201206/t20120620_363626.htm
http://english.nanjing.gov.cn/zx/szyw/201206/t20120611_362846.htm
http://english.nanjing.gov.cn/zx/szyw/201206/t20120620_363636.htm
http://english.nanjing.gov.cn/zx/szyw/201205/t20120514_360685.htm

148
http://english.nanjing.gov.cn/zx/szyw/201205/t20120528_361744.htm
http://english.nanjing.gov.cn/zx/szyw/201206/t20120620_363600.htm
http://english.nanjing.gov.cn/zx/szyw/201203/t20120322_356166.htm
http://english.nanjing.gov.cn/zx/szyw/201205/t20120528_361754.htm
http://english.nanjing.gov.cn/zx/szyw/201111/t20111108_343968.htm
http://english.nanjing.gov.cn/zx/szyw/201112/t20111215_347451.htm
http://english.nanjing.gov.cn/zx/szyw/201112/t20111206_346605.htm
http://english.nanjing.gov.cn/zx/szyw/201111/t20111125_345652.htm
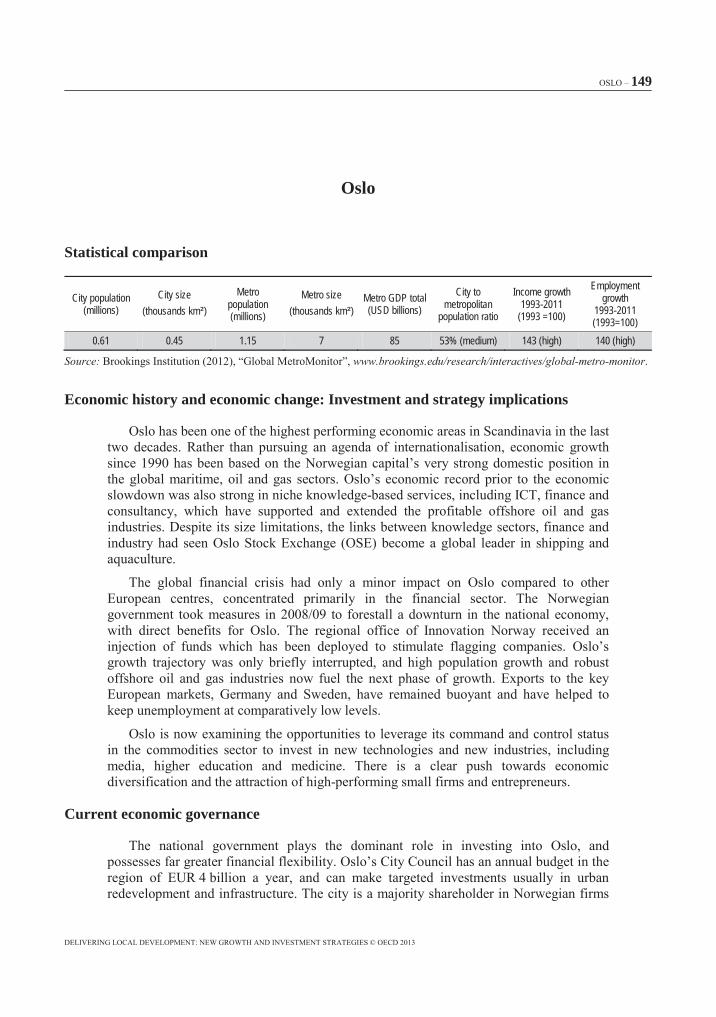
149
Oslo
Statistical comparison
City population (millions)
City size(thousands km²)
Metro population(millions)
Metro size(thousands km²)
Metro GDP total(USD billions)
City to metropolitan
population ratio
Income growth 1993-2011
(1993 =100)
Employment growth
1993-2011 (1993=100)
0.61 0.45 1.15 7 85 53% (medium) 143 (high) 140 (high)
Source: www.brookings.edu/research/interactives/global-metro-monitor
Economic history and economic change: Investment and strategy implications
Current economic governance
150
Kunnskap Oslo
Indikator
Current investment flows

151
Impact of crisis
Growth strategy
152
Investment strategy and tools
Oslo Package 3
tax credit programme SkatteFUNN

153
Implementation arrangements
tight and complete cluster
establish international links
Specialist infrastructural environments
Oslo Innovation Centre
154
Role of national and inter-governmental bodies

155
Sources
Promoting Innovation by Tax Incentiveswww.yicstatus.com/Documents/Tax_incentives_for_RD_YIC_project_report.pdf
www.newsinenglish.no/2012/08/27/norways-oil-attracts-the-world
www.newsinenglish.no/2012/03/14/immigration-drives-oslos-growth.
www.brookings.edu/research/interactives/global-metro-monitor
The Fjord City – The Plans for Urban Development of the Waterfront www.mcrit.com/plalitoral/SIGlitoral/altresplans/oslowaterfront.pdf
www.8millioncity.com/press/pressemelding-eu-st%C3%B8tter-h%C3%B8yhastighetstog-mellom-oslo-og-k%C3%B8benhavn
Oslo: Norway http://documents.rec.org/publications/CuracaoFactOslo_Apr2009_ENG.pdf
www.kunnskap.oslo.kommune.no/getfile.php/byr%C3%A5dsavdeling%20for%20finans%20%28FIN%29/Internett%20%28FIN%29/Dokumenter/Kriterier%20for%20premieordning%202010-2012.pdf
http://eu-openscreen.eu/fileadmin/user_upload/LoI/January_2012/Yrvum__OCC.pdf
www.oslo.kommune.no/getfile.php/oslo%20kommune%20(OSLO)/Intranett%20(OSLO)/Dokumenter/kursdokumenter/MIPIM_innstikk_original.pdf
www.oslo.teknopol.no/MainMenu/news2/News/Money-in-Oslos-pockets
www.oslo.teknopol.no/MainMenu/news2/News/Fjord-City-Expo-comes-home-to-Oslo
www.oslo.teknopol.no/MainMenu/news2/News/Want-state-seed-fund-for-biotech
www.oslo.teknopol.no/MainMenu/news2/News/Maritime-Teamwork--the-Solution
www.oslo.teknopol.no/MainMenu/news2/News/Networks-for-oil-and-gas
Naturally Inspired: Life Sciences Norwaywww.oslo.teknopol.no/upload/Bilder/Publikasjonsbilder/NaturallyInspired.pdf

156
www.oslo.teknopol.no/MainMenu/news2/News/Oslo-Innovation-Week--Europes-biggest-Innovation-convention
www.oslo.teknopol.no/MainMenu/news2/News/Entrepreneur-community-opened
www.oslo.teknopol.no/MainMenu/news2/News/From-nil-to-four-in-one-summer
www.unife.org/uploads/Towards_a_single_railway_area.pdf
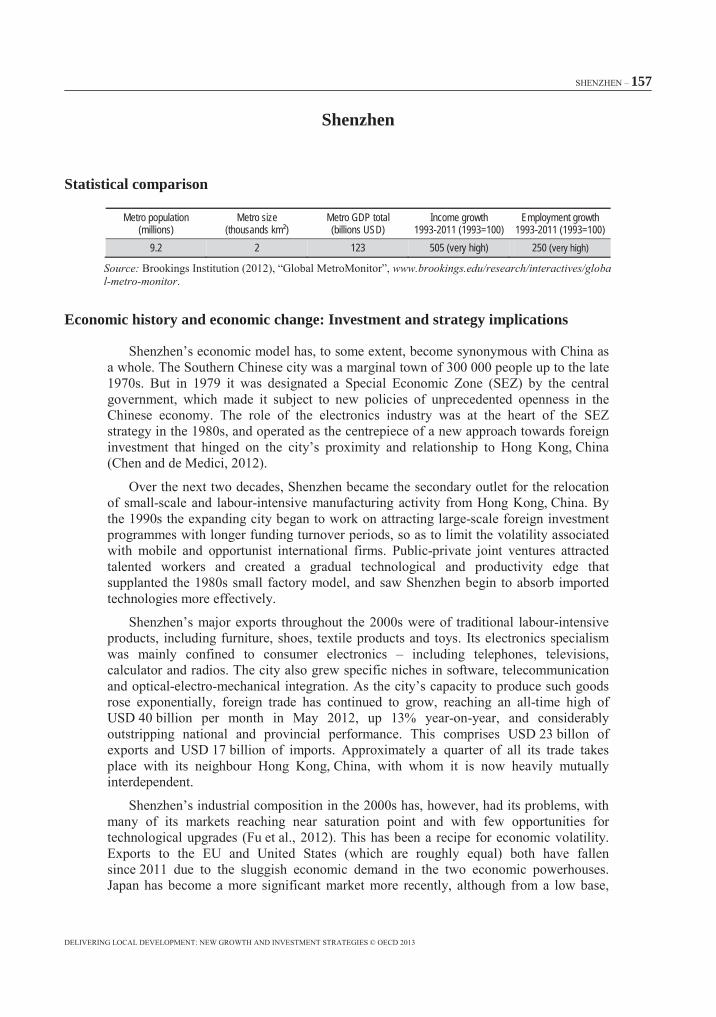
157
Shenzhen
Statistical comparison
Metro population (millions)
Metro size(thousands km²)
Metro GDP total(billions USD)
Income growth 1993-2011 (1993=100)
Employment growth 1993-2011 (1993=100)
9.2 2 123 505 (very high) 250 (very high)
Source: www.brookings.edu/research/interactives/global-metro-monitor
Economic history and economic change: Investment and strategy implications

158
Current economic governance

159
Current investment flows
Public investment
Private investment

160
Impact of crisis
161
Growth strategy
Regional co-operation.
Expansion of higher education.
162
Globalisation of creative industries.
Coastal eco-tourism development.
Investment strategy and tools

163
Development of mainland Southern China’s leading creative industries district.
generate taxes of about EUR 500 million annually
A cross-border yuan-loaning service.
Over-the-counter stock exchange.

164
Public-private partnerships (PPPs)
array of tax incentives
New incentives

165
Main preferential pilot policies introduced in Qianhai Zone in 2012
Sector Incentive policyFinancial services – Incentives for Hong Kong, China banks to grant yuan-denominated loans to Qianhai SMEs and
projects– Support for Qianhai-registered firms in issuing yuan-denominated bonds in Hong Kong– Creation of an equity investment parent fund in Qianhai
HR – Freedom for Hong Kong, China professionals to work in Qianhai– Permits for Hong Kong, China qualified accountants to become partners of Mainland accounting
firmsLegal services Hong Kong, China arbitration institutions allowed to establish Qianhai branchesEducation and medicine Hong Kong, China businesses can set up fully-owned international schools or hospitals in QianhaiTelecommunication – Joint ventures encouraged between Hong Kong, China/Macao firms and Chinese counterparts
– Support for local telecom firms in offering preferential tariff schemes
Source: China Alert www.kpmg.com/CN/en/IssuesAndInsights/ArticlesPublications/Newsletters/ChinaAlerts/Documents/china-alert-1208-18.pdf.
Large relocation incentives for IT firms
Property tax on luxury housing
166
Implementation arrangements
More thorough integration with Hong Kong, China and with the rest of the Pearl River Delta.
An improvement of business skills at all levels.
Foreign talent attraction.
167
Improvement of English language usage.
Commitment to supporting small businesses.
Improving the city’s intellectual property regime
Enhanced trade with emerging markets
Investment in the public transport network.

168
Upgrade of logistics.
A new eco city industrial park.
Role of national and inter-governmental bodies
New tools to strengthen infrastructure investment capability and improve the city’s agility in creating land-use solutions.
More haste of reform that frees mainland markets from government control.

169
Recognise the functional labour market.

170
Sources
http://ajw.asahi.com/article/views/opinion/aj201202080021.
www.brookings.edu/research/interactives/global-metro-monitor
http://english.caixin.com/2012-03-08/100365525_all.html
Asia Pacific Viewpoint
Rethinking Global Urbanism: Comparative Insights from Secondary Cities
Facilities
www.forbes.com/sites/china/2010/05/20/byds-electric-taxis-hit-shenzhens-streets
Journal of Economic Surveys
Economic Policy Institutewww.epi.org/publication/bp316-china-auto-parts-industry.
Shenzhen Dailywww1.szdaily.com/content/2012-01/13/content_6390807.htm
Shenzhen Dailyhttp://szdaily.sznews.com/html/2012-05/30/content_2063478.htm
http://news.sohu.com/20120421/n341208808.shtml
China Alert www.kpmg.com/CN/en/IssuesAndInsights/ArticlesPublications/Newsletters/ChinaAlerts/Documents/china-alert-1208-18.pdf
Reuters www.reuters.com/article/2012/06/27/us-china-minihongkong-idUSBRE85Q0Z520120627
171
Shenzhen Dailywww.szdaily.com/content/2012-06/07/content_6816470.htm
Transactions in GIS
http://english.sz.gov.cn/ln/201112/t20111222_1792881.htm.
http://english.sz.gov.cn/ln/201112/t20111221_1789537.htm.
http://english.sz.gov.cn/ln/201201/t20120105_1796544.htm
http://english.sz.gov.cn/ln/201207/t20120730_1955782.htm.
http://english.sz.gov.cn/ln/201207/t20120704_1932840.htm.
http://english.sz.gov.cn/ln/201201/t20120120_1800234.htm.
http://english.sz.gov.cn/ln/201206/t20120618_1925382.htm
http://english.sz.gov.cn/ln/201208/t20120815_1963297.htm
http://english.sz.gov.cn/ln/201206/t20120621_1926503.htm
http://english.sz.gov.cn/ln/201203/t20120309_1824081.htm
http://english.sz.gov.cn/ln/201205/t20120510_1912318.htm
http://english.sz.gov.cn/ln/201202/t20120229_1821024.htm
http://english.sz.gov.cn/ln/201206/t20120614_1924592.htm
http://english.sz.gov.cn/ln/201206/t20120613_1924296.htm
http://english.sz.gov.cn/ln/201203/t20120301_1821553.htm.
http://english.sz.gov.cn/ln/201204/t20120420_1844344.htm.
http://english.sz.gov.cn/ln/201205/t20120518_1914906.htm
172
http://english.sz.gov.cn/ln/201206/t20120621_1926508.htm
http://english.sz.gov.cn/ln/201205/t20120507_1861851.htm
http://english.sz.gov.cn/ln/201204/t20120416_1842607.htm.
http://english.sz.gov.cn/ln/201203/t20120315_1832105.htm
http://english.sz.gov.cn/ln/201201/t20120105_1796543.htm
http://english.sz.gov.cn/ln/201204/t20120406_1839351.htm
http://english.sz.gov.cn/ln/201207/t20120727_1954796.htm.
http://english.sz.gov.cn/ln/201202/t20120223_1816930.htm
http://english.sz.gov.cn/ln/201201/t20120104_1796211.htm
http://english.sz.gov.cn/ln/201202/t20120210_1803822.htm.
http://english.sz.gov.cn/ln/201205/t20120518_1914899.htm
http://english.sz.gov.cn/ln/201204/t20120424_1845034.htm
http://english.sz.gov.cn/ln/201206/t20120615_1924920.htm
http://english.sz.gov.cn/ln/201204/t20120418_1843660.htm
www.szcpost.com/2012/06/shenzhen-to-make-huge-investment-for-intelligent-transportation.html.
GO Chinahttp://gochina.scmp.com/shenzhen/news/shenzhen-airport-confirms-expansion-plans
Public-Private Partnerships: Success and Failure Factors for In-Transition Countries
Asian Venture Capital Journal www.avcj.com/avcj/analysis/2200218/qianhai-offers-rmb-funds-fast-track

173
Zurich
Statistical comparison
Metro population (millions)
Metro size(thousands km²)
Metro GDP total(billions USD)
Income growth 1993-2011 (1993=100)
Employment growth 1993-2011 (1993=100)
1.5 (Low) 1.7 (Small) 93 127 (medium) 122 (high)
Source: www.brookings.edu/research/interactives/global-metro-monitor
Economic history and economic change: Investment and strategy implications

174
Current economic governance
Greater Zurich Area AG
Zurich Metropolitan Conference

175
Zurich Metropolitan Area Association
Current investment flows
176
Impact of crisis
177
Growth strategy
Attraction of international hedge funds
New technology clusters
178
Clean technology.www.zurichgreenregion.ch
Creative industries.

179
Investment strategy and tools
Implementation arrangements
The role of transport infrastructure
180
Key investment project: Integration of Limmat
Durchmesserlinie
The role of workforce development, telecommunications, culture and housing

181
Zürcher Kunstgesellschaft
182
Sources
www.brookings.edu/research/interactives/global-metro-monitor
www.stadt-zuerich.ch/ewz/de/index/ewz/medien/2012/telecom/anschluss-an-die-zukunft-mit-dem-glasfasernetz-.html
www.fifa.com/aboutfifa/footballdevelopment/news/newsid=1659679/index.html.
Eurocities Working Group: Metropolitan Areaswww.stadt-
zuerich.ch/content/dam/stzh/prd/Deutsch/Stadtentwicklung/Publikationen_und_Broschueren/Aussenbeziehungen/Eurocities/1%20-%2012%2009%2026%20-%20Harris%20-%20Welcome%20in%20Zurich_WGMA.pdf
www.zh.ch/internet/de/aktuell/news/medienmitteilungen/2011/219_beitraege_gza.html.
Finanzplatz Zurich 2011 www.finanzplatz-zuerich.ch/portals/1/Documents/DE/Studien/Monitoring_FinanzplatzZuerich_2011_de.pdf.
www.zh.ch/internet/de/aktuell/news/medienmitteilungen/2012/236_finanzhaushalt.html.
www.awa.zh.ch
www.zh.ch/internet/de/aktuell/news/medienmitteilungen/2012/250_arbeitsmarkt_september.html
www.zh.ch/internet/de/aktuell/news/medienmitteilungen/2012/144_herzzentrum.html
www.zh.ch/internet/de/aktuell/news/medienmitteilungen/2012/140-3_film_festival.html
www.zh.ch/internet/de/aktuell/news/medienmitteilungen/2012/248-7_strassenbauprogramm.html
www.zh.ch/internet/de/aktuell/news/medienmitteilungen/2012/146_agglomerationsprogramm_limmattal.html
www.zh.ch/internet/de/aktuell/news/medienmitteilungen/2012/209_arbeitskraefte.html
183
www.zh.ch/internet/de/aktuell/news/medienmitteilungen/2012/149_studentisches_wohnen.html.
www.kpmg.com/CH/en/Library/Interviews/Pages/interview-bruno-sauter.aspx
www.kunsthaus.ch/en/information/extension
www.metropolitanraum-zuerich.ch/fileadmin/user_upload/downloads/MM_Metrokonferenz-Zuerich_BFI_3April2012.pdf.
www.metropolitanraum-zuerich.ch/fileadmin/user_upload/downloads/MM_Clusteragentur_29Mai2012.pdf
www.metropolitanraum-zuerich.ch/124.html.
www.metropolitanraum-zuerich.ch/fileadmin/user_upload/downloads/MK_Winterthur_MM_V1_11Mai2012-1.pdf.
www.metropolitanraum-zuerich.ch/fileadmin/user_upload/downloads/FABI_MM_MetrokonferenzZH_26Maerz2012.pdf.
Switzerland as Location for Asset Managerswww.greaterzuricharea.ch/content/01/downloads/pwc_SwitzerlandForAssetManagers.pdf.
Zurich Strategies 2025 www.stadt-zuerich.ch/content/dam/stzh/portal/English/Documents/1203_2025_ueberarb_EN.pdf.
www.stadt-zuerich.ch/content/dam/stzh/fd/Deutsch/Finanzen/Publikationen%20und%20Broschueren/Budget%202012/budget_2012_folien_medienkonferenz.pdf.
www.stadt-zuerich.ch/content/fd/de/index/das_departement/medien/medienmitteilungen/2010/september/100922b.html
www.zvv.ch/en/about-us/infrastructure-projects/cross-city-link.html

ORGANISATION FOR ECONOMIC CO-OPERATIONAND DEVELOPMENT
The Organisation for Economic Co-operation and Development (OECD) is a unique forum where the
governments of 34 market democracies work together to address the economic, social and governance
challenges of globalisation as well as to exploit its opportunities. The OECD’s way of working consists of a
highly effective process that begins with data collection and analysis and moves on to collective discussion
of policy, then decision making and implementation. Mutual examination by governments, multi-lateral
surveillance and peer pressure to conform or reform are at the heart of the OECD’s effectiveness.
Much of the material collected and analysed at the OECD is published on paper or online: from press
releases and regular compilations of data and projections to one-off publications or monographs on
particular issues; from economic surveys of each member country to regular reviews of education systems,
science and technology policies or environmental performance. For more information on the OECD, please
visit www.oecd.org/about.
LOCAL ECONOMIC AND EMPLOYMENT DEVELOPMENT (LEED)
The OECD Programme on Local Economic and Employment Development (LEED) has advised
governments and communities since 1982 on how to respond to economic change and tackle complex
problems in a fast-changing world. Its mission is to contribute to the creation of more and better quality
jobs through more effective policy implementation, innovative practices, stronger capacities and
integrated strategies at the local level. LEED draws on a comparative analysis of experience from the five
continents in fostering economic growth, employment and inclusion. For more information on the LEED
Programme, please visit www.oecd.org/cfe/leed.
OECD PUBLISHING, 2, rue André-Pascal, 375775 PARIS CEDEX 16
(00 2013 09 1 P) – No. 90161 2013