Embed Size (px)
Citation preview

DELIVERING IN A PANDEMIC ANNUAL REPORT 2020
In 2020, UNFPA witnessed the greatest humanitarian crisis since the organization’s creation 52 years ago: the COVID-19 pandemic. This public health catastrophe brought with it socioeconomic, political and human rights crises, doubling the global need for humanitarian assistance from the previous year. Women and girls bore many of the worst impacts.
We saw this in our work. Health systems were strained. Supply chains were disrupted. Many programmes and services were driven to a halt. Globally, a United Nations survey found 7 in 10 countries experienced disruptions in contraceptive services. UNFPA offices reported stark increases in domestic violence cases and calls for help amid lockdowns and movement restrictions. Disrupted services and increased vulnerabilities are projected to result in 2 million more cases of female genital mutilation and an additional 13 million child marriages within the next decade that would otherwise have been averted.
But UNFPA rose to the challenge.
With ingenuity and flexibility, we ramped up distribution of personal protective equipment and training in infectious disease control. Many disrupted programmes and services were restored, and 74 per cent of UNFPA programme countries were able to maintain or expand family planning services at the community level. Ninety-one per cent maintained or expanded interventions to prevent gender-based violence.
The crisis is far from over. We know the road ahead will be long and hard. But we also know that we can deliver progress even amid world-shaking adversity. With solidarity and support, we can transform the future for women and girls.
THE YEAR IN REVIEW
THE COVID-19 RESPONSE
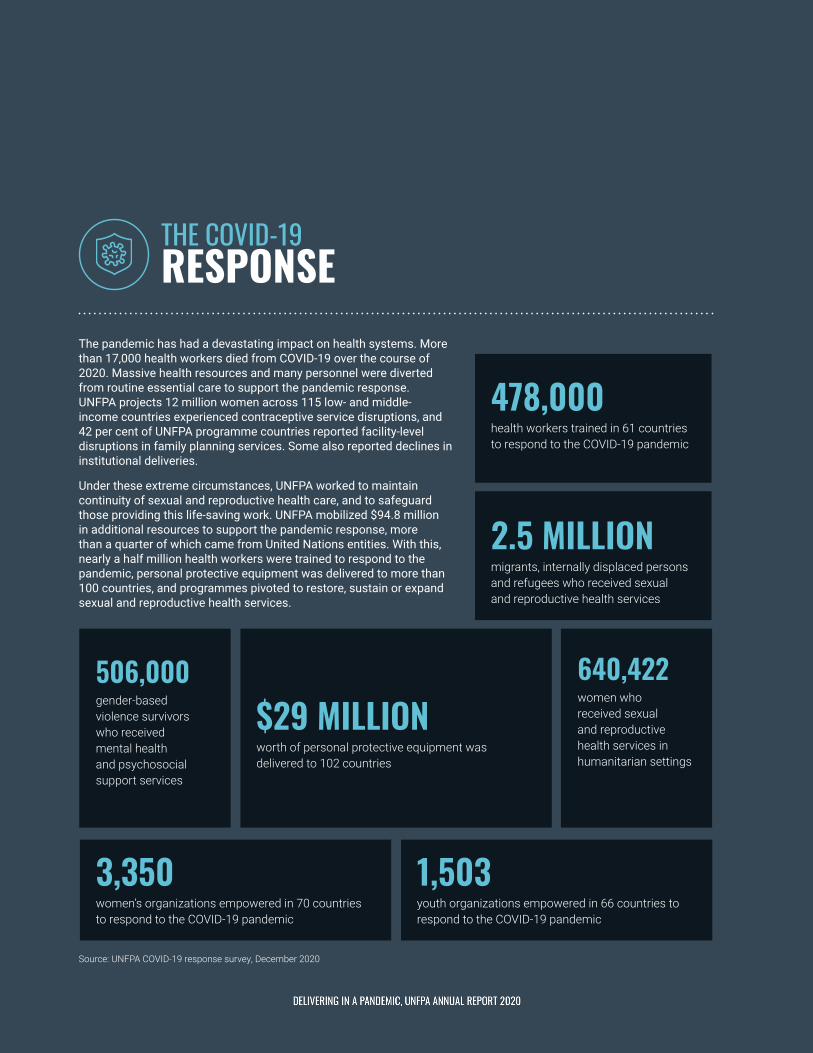
Source: UNFPA COVID-19 response survey, December 2020
The pandemic has had a devastating impact on health systems. More than 17,000 health workers died from COVID-19 over the course of 2020. Massive health resources and many personnel were diverted from routine essential care to support the pandemic response. UNFPA projects 12 million women across 115 low- and middle-income countries experienced contraceptive service disruptions, and 42 per cent of UNFPA programme countries reported facility-level disruptions in family planning services. Some also reported declines in institutional deliveries.
Under these extreme circumstances, UNFPA worked to maintain continuity of sexual and reproductive health care, and to safeguard those providing this life-saving work. UNFPA mobilized $94.8 million in additional resources to support the pandemic response, more than a quarter of which came from United Nations entities. With this, nearly a half million health workers were trained to respond to the pandemic, personal protective equipment was delivered to more than 100 countries, and programmes pivoted to restore, sustain or expand sexual and reproductive health services.
478,000health workers trained in 61 countries to respond to the COVID-19 pandemic
2.5 MILLIONmigrants, internally displaced persons and refugees who received sexual and reproductive health services
$29 MILLIONworth of personal protective equipment was delivered to 102 countries
3,350 women’s organizations empowered in 70 countries to respond to the COVID-19 pandemic
506,000gender-based violence survivors who received mental health and psychosocial support services
640,422women who received sexual and reproductive health services in humanitarian settings
1,503 youth organizations empowered in 66 countries to respond to the COVID-19 pandemic
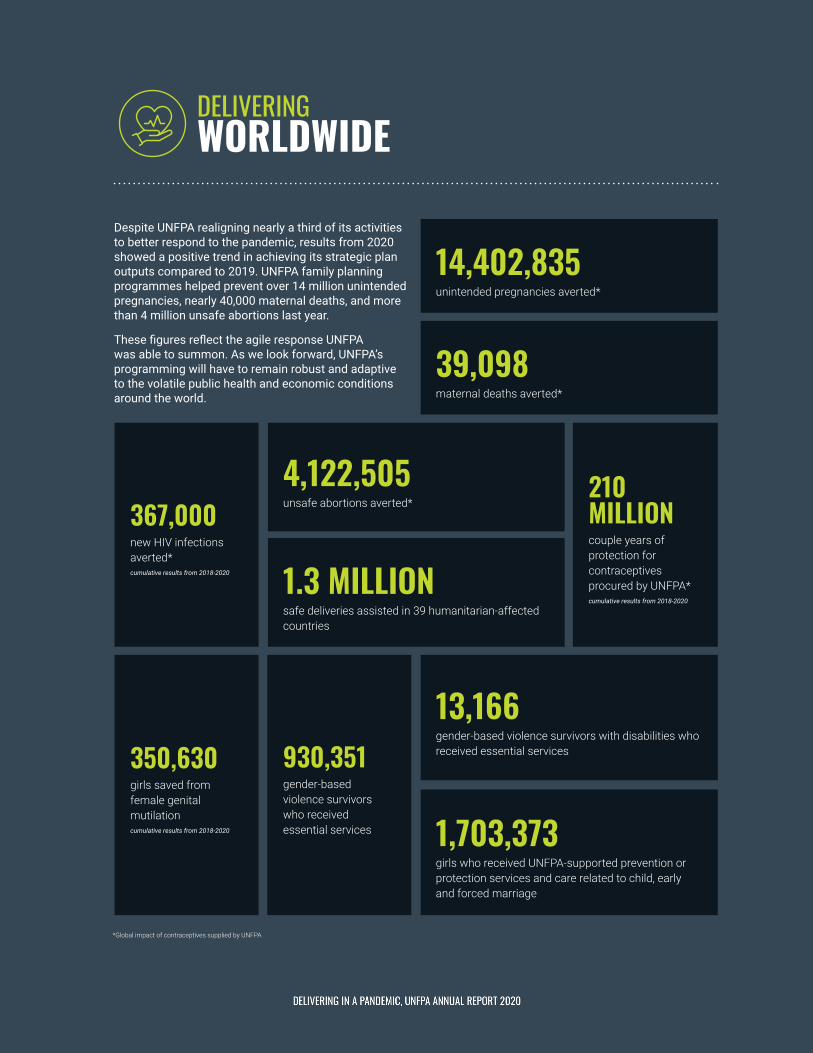
*Global impact of contraceptives supplied by UNFPA
Despite UNFPA realigning nearly a third of its activities to better respond to the pandemic, results from 2020 showed a positive trend in achieving its strategic plan outputs compared to 2019. UNFPA family planning programmes helped prevent over 14 million unintended pregnancies, nearly 40,000 maternal deaths, and more than 4 million unsafe abortions last year.
These figures reflect the agile response UNFPA was able to summon. As we look forward, UNFPA’s programming will have to remain robust and adaptive to the volatile public health and economic conditions around the world.
39,098maternal deaths averted*
367,000new HIV infections averted*cumulative results from 2018-2020
210 MILLIONcouple years of protection for contraceptives procured by UNFPA*cumulative results from 2018-2020
4,122,505unsafe abortions averted*
1.3 MILLIONsafe deliveries assisted in 39 humanitarian-affected countries
350,630girls saved from female genital mutilationcumulative results from 2018-2020
930,351gender-based violence survivors who received essential services
13,166gender-based violence survivors with disabilities who received essential services
1,703,373girls who received UNFPA-supported prevention or protection services and care related to child, early and forced marriage
14,402,835unintended pregnancies averted*
DELIVERING WORLDWIDE

CONTRACEPTION PROVIDED BY UNFPA WORLDWIDE:
MALE CONDOMS 724,643,280
ORAL CONTRACEPTIVES (MONTHLY CYCLES OF THE PILL) 80,089,103
CONTRACEPTIVE IMPLANTS (IUD) 11,084,230
EMERGENCY CONTRACEPTIVES 2,304,592
FEMALE CONDOMS 5,556,162
DOSES OFINJECTABLE CONTRACEPTIVES 54,702,365
INTRAUTERINE DEVICES (IUD) 2,606,795
TUBES OFPERSONAL LUBRICANTS 69,534,936

AFRICA, EAST AND SOUTHERN
304,405girls who received UNFPA-supported prevention or protection services and care related to child, early and forced marriage
277,741gender-based violence survivors, including persons with disabilities, who received essential services
50,597women and girls who received UNFPA-supported prevention or protection services and care related to female genital mutilation
COUNTRY/TERRITORY MILLIONS OF US$
ANGOLA 2.5
BOTSWANA 0.9
BURUNDI 4.5
COMOROS 0.8
DEMOCRATIC REPUBLIC OF THE CONGO 28.4
ERITREA 1.1
ESWATINI 1.3
ETHIOPIA 17.4
KENYA 9.4
LESOTHO 1.6
MADAGASCAR 6.6
MALAWI 19.8
MAURITIUS 0.2
COUNTRY/TERRITORY MILLIONS OF US$
MOZAMBIQUE 19.4
NAMIBIA 2.0
RWANDA 3.6
SOUTH AFRICA 2.7
SOUTH SUDAN 17.8
UGANDA 18.5
UNITED REPUBLIC OF TANZANIA 12.4
ZAMBIA 8.0
ZIMBABWE 17.9
TOTAL COUNTRY/TERRITORY ACTIVITIES 196.8
REGIONAL ACTIVITIES 6.6
TOTAL FOR EAST AND SOUTHERN AFRICA 203.40
2020 PROGRAMME EXPENSESINCLUDES CORE AND NON-CORE RESOURCES
See full regional results: www.unfpa.org/data/results
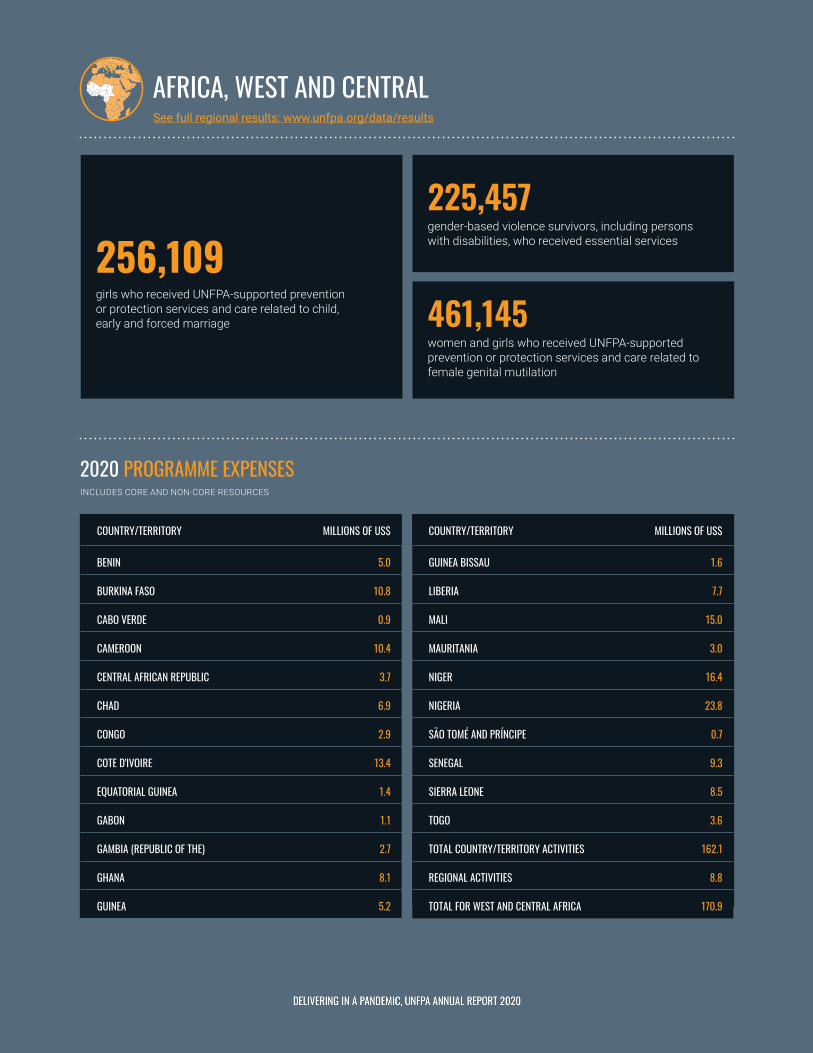
AFRICA, WEST AND CENTRAL
256,109girls who received UNFPA-supported prevention or protection services and care related to child, early and forced marriage
225,457gender-based violence survivors, including persons with disabilities, who received essential services
461,145women and girls who received UNFPA-supported prevention or protection services and care related to female genital mutilation
COUNTRY/TERRITORY MILLIONS OF US$
BENIN 5.0
BURKINA FASO 10.8
CABO VERDE 0.9
CAMEROON 10.4
CENTRAL AFRICAN REPUBLIC 3.7
CHAD 6.9
CONGO 2.9
COTE D'IVOIRE 13.4
EQUATORIAL GUINEA 1.4
GABON 1.1
GAMBIA (REPUBLIC OF THE) 2.7
GHANA 8.1
GUINEA 5.2
2020 PROGRAMME EXPENSESINCLUDES CORE AND NON-CORE RESOURCES
COUNTRY/TERRITORY MILLIONS OF US$
GUINEA BISSAU 1.6
LIBERIA 7.7
MALI 15.0
MAURITANIA 3.0
NIGER 16.4
NIGERIA 23.8
SÃO TOMÉ AND PRÍNCIPE 0.7
SENEGAL 9.3
SIERRA LEONE 8.5
TOGO 3.6
TOTAL COUNTRY/TERRITORY ACTIVITIES 162.1
REGIONAL ACTIVITIES 8.8
TOTAL FOR WEST AND CENTRAL AFRICA 170.9
See full regional results: www.unfpa.org/data/results

ARAB STATES
140,589girls who received UNFPA-supported prevention or protection services and care related to child, early and forced marriage
COUNTRY/TERRITORY MILLIONS OF US$
ALGERIA 1.0
DJIBOUTI 2.0
EGYPT 11.6
IRAQ 22.8
JORDAN 11.2
LEBANON 5.9
LIBYA 4.3
MOROCCO 3.0
OMAN 1.3
2020 PROGRAMME EXPENSESINCLUDES CORE AND NON-CORE RESOURCES
316,690gender-based violence survivors, including persons with disabilities, who received essential services
72,468women and girls who received UNFPA-supported prevention or protection services and care related to female genital mutilation
COUNTRY/TERRITORY MILLIONS OF US$
SOMALIA 20.7
STATE OF PALESTINE 5.6
SUDAN 20.0
SYRIAN ARAB REPUBLIC 32.9
TUNISIA 1.2
YEMEN 71.7
TOTAL COUNTRY/TERRITORY ACTIVITIES 214.2
REGIONAL ACTIVITIES 4.7
TOTAL FOR ARAB STATES 218.9
See full regional results: www.unfpa.org/data/results

ASIA AND THE PACIFIC
904,189girls who received UNFPA-supported prevention or protection services and care related to child, early and forced marriage
COUNTRY/TERRITORY MILLIONS OF US$
AFGHANISTAN 13.0
BANGLADESH 37.0
BHUTAN 1.0
CAMBODIA 2.3
CHINA 2.4
DEMOCRATIC PEOPLE'S REPUBLIC OF KOREA 1.1
INDIA 8.1
INDONESIA 6.6
IRAN (ISLAMIC REPUBLIC OF) 1.2
LAO PEOPLE’S DEMOCRATIC REPUBLIC 2.9
MALAYSIA 0.9
MALDIVES 0.4
MONGOLIA 2.7
2020 PROGRAMME EXPENSESINCLUDES CORE AND NON-CORE RESOURCES
89,100gender-based violence survivors, including persons with disabilities, who received essential services
COUNTRY/TERRITORY MILLIONS OF US$
MYANMAR 12.6
NEPAL 8.4
PACIFIC ISLANDS (MULTICOUNTRY)* 9.5
PAKISTAN 10.1
PAPUA NEW GUINEA 3.2
PHILIPPINES 7.8
SRI LANKA 1.6
THAILAND 0.9
TIMOR-LESTE 1.8
VIET NAM 4.5
TOTAL COUNTRY/TERRITORY ACTIVITIES 140.2
REGIONAL ACTIVITIES 7.4
TOTAL FOR ASIA AND THE PACIFIC 147.6
* Figures for the Pacific Islands (multi-country) covers the following countries: Cook Islands; Fiji; Kiribati; Marshall Islands; Federated States of Micronesia; Nauru; Niue; Palau; Samoa; Solomon Islands; Tokelau; Tonga; Tuvalu; and Vanuatu.
See full regional results: www.unfpa.org/data/results
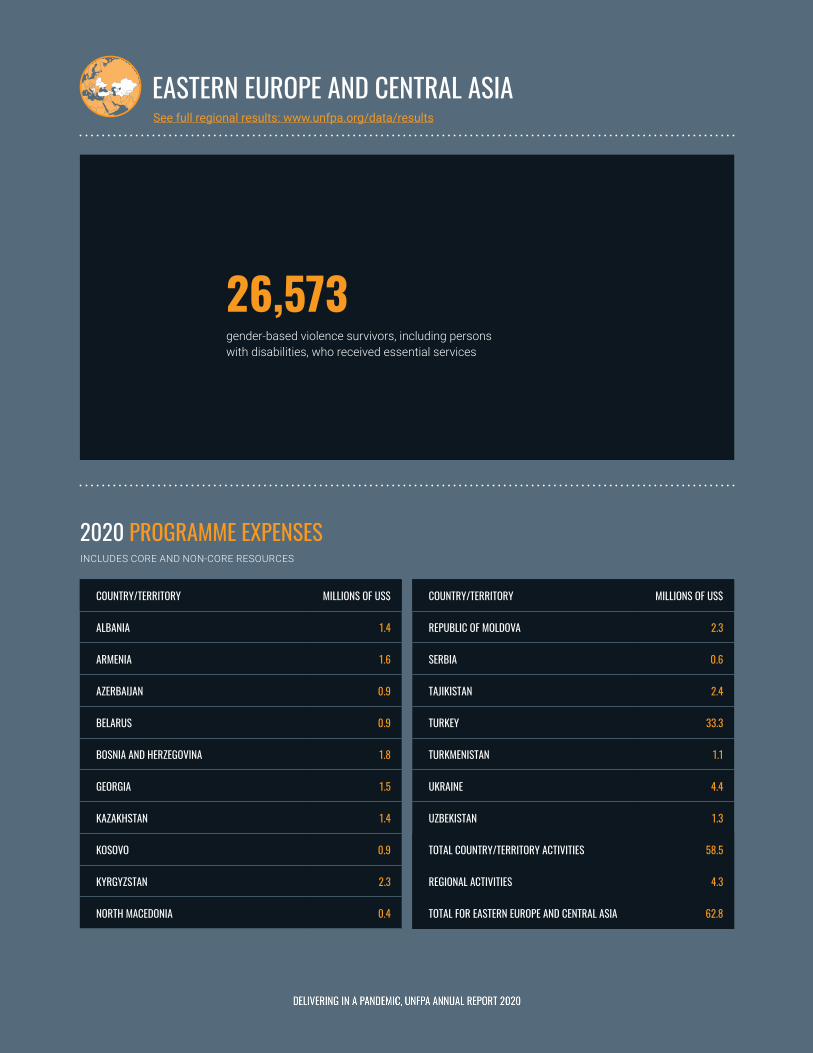
EASTERN EUROPE AND CENTRAL ASIA
26,573gender-based violence survivors, including persons with disabilities, who received essential services
2020 PROGRAMME EXPENSESINCLUDES CORE AND NON-CORE RESOURCES
COUNTRY/TERRITORY MILLIONS OF US$
ALBANIA 1.4
ARMENIA 1.6
AZERBAIJAN 0.9
BELARUS 0.9
BOSNIA AND HERZEGOVINA 1.8
GEORGIA 1.5
KAZAKHSTAN 1.4
KOSOVO 0.9
KYRGYZSTAN 2.3
NORTH MACEDONIA 0.4
COUNTRY/TERRITORY MILLIONS OF US$
REPUBLIC OF MOLDOVA 2.3
SERBIA 0.6
TAJIKISTAN 2.4
TURKEY 33.3
TURKMENISTAN 1.1
UKRAINE 4.4
UZBEKISTAN 1.3
TOTAL COUNTRY/TERRITORY ACTIVITIES 58.5
REGIONAL ACTIVITIES 4.3
TOTAL FOR EASTERN EUROPE AND CENTRAL ASIA 62.8
See full regional results: www.unfpa.org/data/results
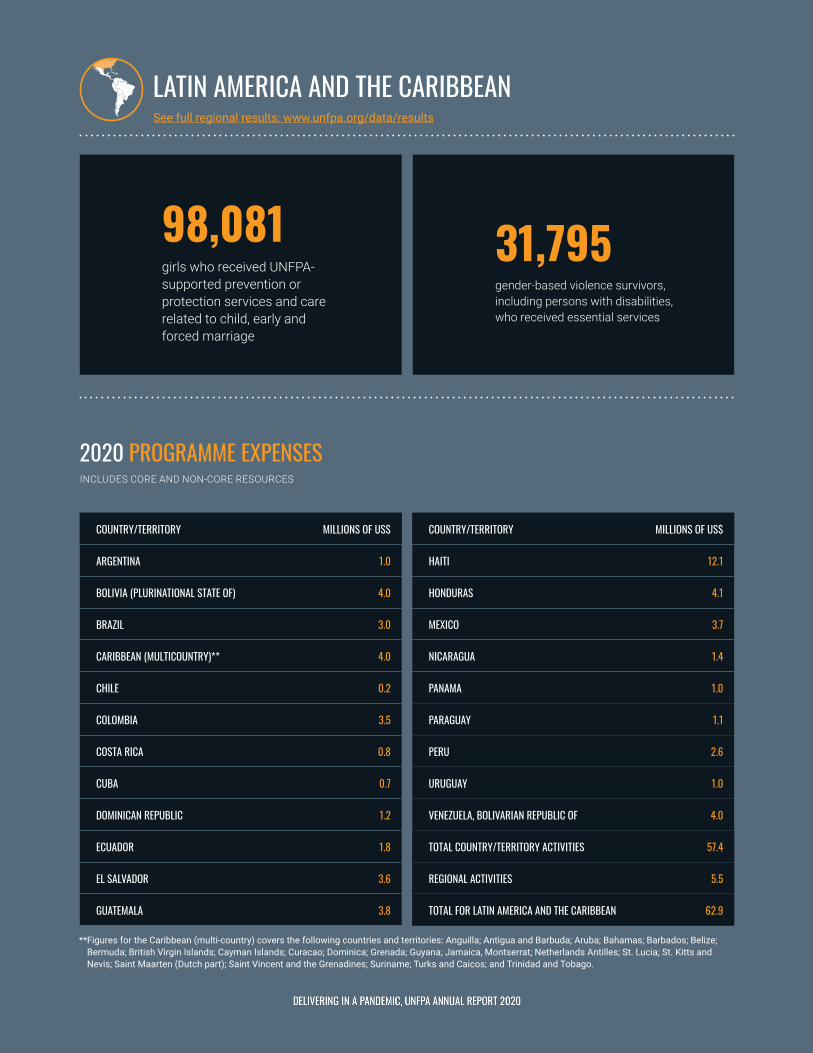
LATIN AMERICA AND THE CARIBBEAN
98,081girls who received UNFPA-supported prevention or protection services and care related to child, early and forced marriage
2020 PROGRAMME EXPENSESINCLUDES CORE AND NON-CORE RESOURCES
31,795gender-based violence survivors, including persons with disabilities, who received essential services
COUNTRY/TERRITORY MILLIONS OF US$
ARGENTINA 1.0
BOLIVIA (PLURINATIONAL STATE OF) 4.0
BRAZIL 3.0
CARIBBEAN (MULTICOUNTRY)** 4.0
CHILE 0.2
COLOMBIA 3.5
COSTA RICA 0.8
CUBA 0.7
DOMINICAN REPUBLIC 1.2
ECUADOR 1.8
EL SALVADOR 3.6
GUATEMALA 3.8
COUNTRY/TERRITORY MILLIONS OF US$
HAITI 12.1
HONDURAS 4.1
MEXICO 3.7
NICARAGUA 1.4
PANAMA 1.0
PARAGUAY 1.1
PERU 2.6
URUGUAY 1.0
VENEZUELA, BOLIVARIAN REPUBLIC OF 4.0
TOTAL COUNTRY/TERRITORY ACTIVITIES 57.4
REGIONAL ACTIVITIES 5.5
TOTAL FOR LATIN AMERICA AND THE CARIBBEAN 62.9
See full regional results: www.unfpa.org/data/results
** Figures for the Caribbean (multi-country) covers the following countries and territories: Anguilla; Antigua and Barbuda; Aruba; Bahamas; Barbados; Belize; Bermuda; British Virgin Islands; Cayman Islands; Curacao; Dominica; Grenada; Guyana; Jamaica, Montserrat; Netherlands Antilles; St. Lucia; St. Kitts and Nevis; Saint Maarten (Dutch part); Saint Vincent and the Grenadines; Suriname; Turks and Caicos; and Trinidad and Tobago.
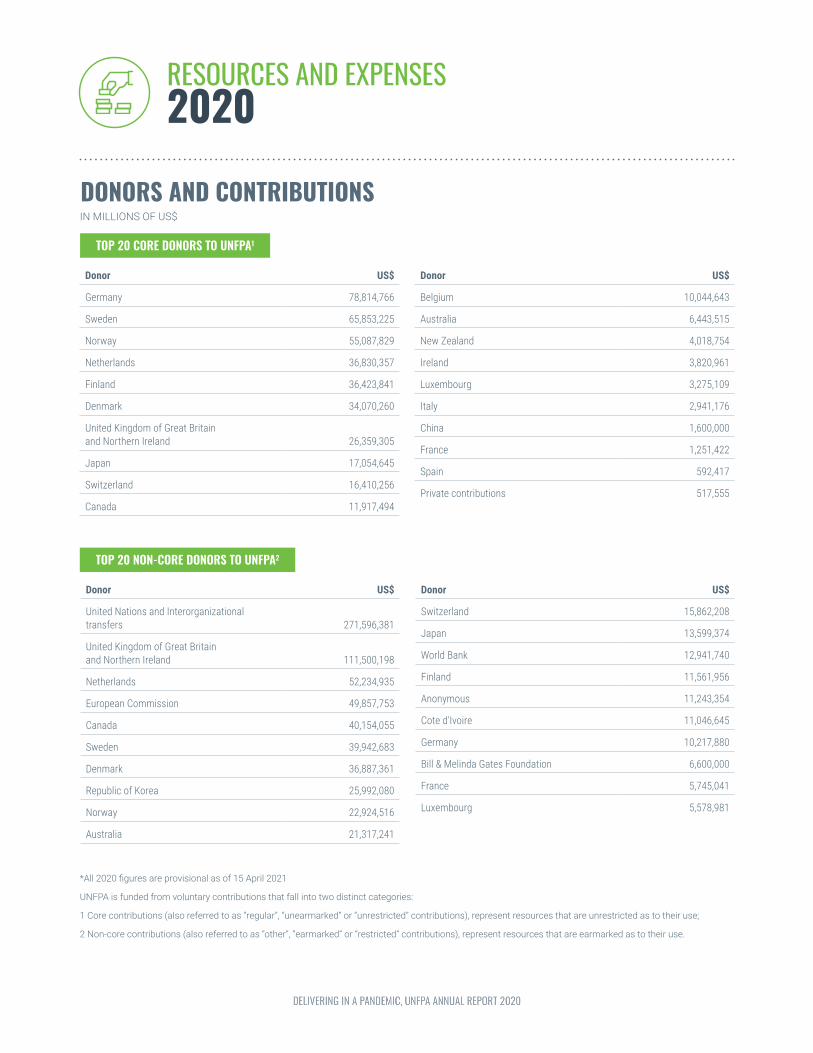
RESOURCES AND EXPENSES2020
Donor US$
Germany 78,814,766
Sweden 65,853,225
Norway 55,087,829
Netherlands 36,830,357
Finland 36,423,841
Denmark 34,070,260
United Kingdom of Great Britain and Northern Ireland 26,359,305
Japan 17,054,645
Switzerland 16,410,256
Canada 11,917,494
Donor US$
Belgium 10,044,643
Australia 6,443,515
New Zealand 4,018,754
Ireland 3,820,961
Luxembourg 3,275,109
Italy 2,941,176
China 1,600,000
France 1,251,422
Spain 592,417
Private contributions 517,555
Donor US$
United Nations and Interorganizational transfers 271,596,381
United Kingdom of Great Britain and Northern Ireland 111,500,198
Netherlands 52,234,935
European Commission 49,857,753
Canada 40,154,055
Sweden 39,942,683
Denmark 36,887,361
Republic of Korea 25,992,080
Norway 22,924,516
Australia 21,317,241
Donor US$
Switzerland 15,862,208
Japan 13,599,374
World Bank 12,941,740
Finland 11,561,956
Anonymous 11,243,354
Cote d'Ivoire 11,046,645
Germany 10,217,880
Bill & Melinda Gates Foundation 6,600,000
France 5,745,041
Luxembourg 5,578,981
*All 2020 figures are provisional as of 15 April 2021
UNFPA is funded from voluntary contributions that fall into two distinct categories:
1 Core contributions (also referred to as “regular”, “unearmarked” or “unrestricted” contributions), represent resources that are unrestricted as to their use;
2 Non-core contributions (also referred to as “other”, “earmarked” or “restricted” contributions), represent resources that are earmarked as to their use.
IN MILLIONS OF US$
TOP 20 NON-CORE DONORS TO UNFPA2
TOP 20 CORE DONORS TO UNFPA1
DONORS AND CONTRIBUTIONS

*All 2020 figures are provisional as of 15 April 2021.
Donor US$
Afghanistan 1,000
Albania 500
Algeria 10,000
Antigua and Barbuda 5,000
Armenia 3,000
Australia 6,443,515
Austria 235,571
Bahamas 1,000
Bangladesh 35,000
Barbados 5,000
Belgium 10,044,643
Bhutan 5,950
Botswana 4,675
Burkina Faso 13,259
Burundi 501
Canada 11,917,494
Chile 8,772
China 1,600,000
Cook Islands 914
Costa Rica 4,776
Cuba 5,051
Cyprus 11,900
Denmark 34,070,260
Dominican Republic 14,975
Egypt 24,481
Eritrea 5,000
Estonia 66,667
Ethiopia 1,863
Finland 36,423,841
France 1,251,422
Georgia 20,000
Germany 78,814,766
Ghana 131,169
Guinea Bissau 2,000
Donor US$
Guyana 9,620
Iceland 218,735
India 510,325
Indonesia 12,947
Iran (Islamic Republic of) 10,000
Iraq 50,000
Ireland 3,820,961
Israel 10,000
Italy 2,941,176
Japan 17,054,645
Jordan 49,930
Kenya 10,000
Kuwait 10,000
Lao People's Democratic Republic 3,000
Liechtenstein 26,567
Luxembourg 3,275,109
Malaysia 15,000
Maldives 5,000
Mali 25,138
Mauritania 3,449
Mauritius 2,534
Mexico 51,960
Micronesia (Federated States of) 3,000
Mongolia 4,000
Morocco 12,560
Nepal 4,240
Netherlands 36,830,357
New Zealand 4,018,754
Nicaragua 2,500
Norway 55,087,829
Panama 10,000
Peru 1,174
Philippines 43,335
Portugal 165,563
Donor US$
Qatar 30,000
Republic of Korea 177,004
Republic of Moldova 6,000
Romania 10,000
Russian Federation 300,000
Rwanda 5,000
Samoa 5,990
Sao Tome and Principe 9,200
Saudi Arabia 250,000
Senegal 11,870
Serbia 5,000
Singapore 5,000
Slovakia 5,433
South Africa 39,873
Spain 592,417
Sri Lanka 18,000
Sweden 65,853,225
Switzerland 16,410,256
Tajikistan 851
Thailand 150,000
Tonga 995
Trinidad and Tobago 5,000
Tunisia 18,890
Turkmenistan 6,000
United Kingdom of Great Britain and Northern Ireland 26,359,305
United Arab Emirates 10,000
Zambia 10,080
Zimbabwe 30,000
Private Contributions 517,555
Government contribution to local office costs* 504,661
ALL CONTRIBUTIONS TOWARDS CORE RESOURCES

PROGRAMME AND INSTITUTIONAL BUDGET EXPENSES BY REGION In millions of US$
COUNTRY PROGRAMMES, GRI AND OTHER
PROGRAMME ACTIVITIES
INSTITUTIONAL BUDGET TOTAL
CORE RESOURCES
NON-CORE RESOURCES
$M $M $M $M %
East and Southern Africa 51.7 151.7 20.7 224.1 18.6
West and Central Africa 48.0 122.9 20.4 191.3 15.9
Arab States 23.5 195.4 13.0 231.9 19.2
Asia and the Pacific 52.8 94.8 20.0 167.6 13.9
Latin America and the Caribbean 27.5 35.4 13.7 76.6 6.4
Eastern Europe and Central Asia 17.2 45.6 7.7 70.5 5.8
Global and regional interventions—global 17.0 - - 17.0 1.4
Global activities (0.3) 144.8 82.2 226.7 18.8
Total 237.4 790.6 177.7 1,205.7 100.0
Global and regional interventions - global1.4%
Eastern Europe and Central Asia5.8%
Global activities18.8%
Latin America and the Caribbean6.4%
Asia and the Pacific13.9%
Arab States19.2%
West and Central Africa15.9%
East and Southern Africa18.6%

In millions of US$
REVENUE
CORE RESOURCES $M
Contributions to core resources 416.8
Other revenue 88.9
Total core resources revenue 505.7
NON-CORE RESOURCES
Contributions to non-core resources—gross 850.9
Less: refunds to donors (6.2)
Less: indirect costs (58.5)
Less: allowance for doubtful contributions receivable 0.4
Other revenue 24.6
Total non-core resources revenue 811.2
TOTAL REVENUE 1,316.9
EXPENSES
CORE RESOURCES $M
Country programmes, Global and Regional Interventions (GRI) and other programme activities 237.4
Institutional budget 177.7
Corporate 15.5
Total core resources expenses 430.6
NON-CORE RESOURCES
Country programmes, Global and Regional Interventions (GRI) and other programme activities 790.6
Corporate 6.9
Total non-core resources expenses 797.5
TOTAL EXPENSES 1,228.1
*All figures are provisional, subject to external audit and, as a result of rounding, may not add up to the totals.
REVENUE AND EXPENSES 2020

Ensuring rights and choices for all since 1969
United Nations Population Fund605 Third Avenue, New York, NY 101581-212-297-5000 • www.unfpa.org • @UNFPA