Embed Size (px)
Citation preview

DELIVERING DATA ON TIME: THE ASSURANT HEALTH CASE (Practice-Oriented)
Pravin Nadkarni
Assurant, Inc [email protected]
Abstract: Data driven organizations have enormous and growing appetites for integrated and value added information. Not only are they expected to consistently deliver data on time, the data integration and delivery teams are under mounting pressure to shrink their ETL cycles and accommodate new and more stringent service level agreements. This paper outlines the methodology adopted by Assurant Health for ensuring timely delivery of data to its information consumers. Key Words: Timeliness, Data Integration, Data Delivery, ETL Cycle, Enterprise Data Warehouse, TDQM Cycle, Variation Analysis, Time Series Analysis, Critical Path Method, Variance Analysis, Change Impact Analysis
INTRODUCTION AND BACKGROUND Data integration and delivery teams in information driven organizations are expected to consistently deliver data on time to their customers. Quite often, they are under mounting pressure to shrink their data integration cycles to accommodate growth or spikes in input, process failures, unexpected delays and tighter service level agreements. In most instances, cycle times can be reduced by throwing in more hardware and increasing the capacity of the data integration environment. However, we live in a world of scarce resources. Improving the utilization of current capacity is usually preferred to investing in additional capacity. This paper shares the experience of Assurant Health in adopting the TDQM methodology to improve the timeliness of its information product. The Assurant Health experience is a valuable input to other companies struggling with data timeliness problem. Company Background Assurant is a provider of specialized insurance products and related services in North America and selected other markets. Assurant is distinguished by its leading positions in specialty insurance businesses. Founded in 1892, Assurant Health is one of its four operating businesses and ranks among the oldest insurance companies in the nation. Assurant Health writes individual and short-term health insurance and small employer group health insurance to employer groups primarily of two to 40 employees. The company also offers health insurance plans to full-time college students. Its core purpose is to protect people from financial hardship due to unforeseen illness or injury. In other words, Assurant Health assumes all or part of the risk of financial loss to its clients due to unexpected health related problems in exchange for insurance premium payments by the customers. Industry Background Insurance is possible only for an event that is unpredictable and causes a loss that is measurable [2]. It operates by spreading that risk across a large pool of insured customers. Assurant Health has no way to predict that any particular person will suffer a serious and costly illness. It can, however, make a reasonable estimate of total number of people in a large group who will incur medical expenses based on its past experience and also the morbidity statistics published by health care organizations. It has to rely on quality information, internal and external, to accurately predict and manage the risk. Besides risk,
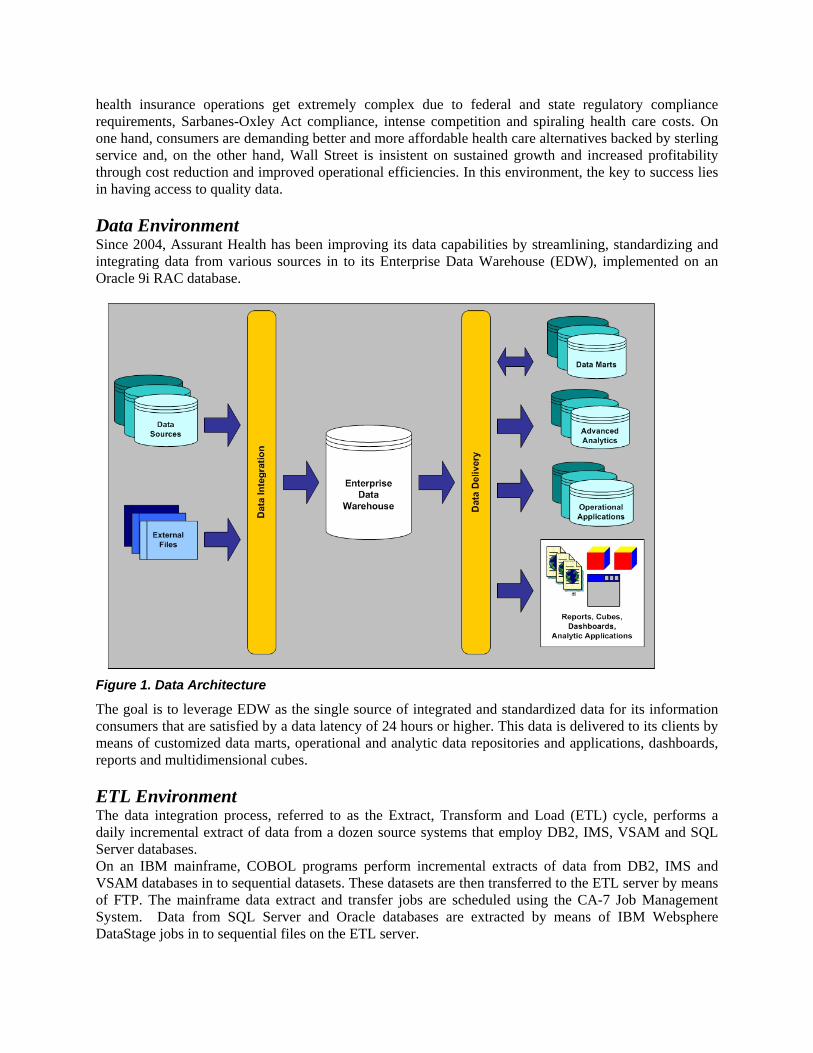
health insurance operations get extremely complex due to federal and state regulatory compliance requirements, Sarbanes-Oxley Act compliance, intense competition and spiraling health care costs. On one hand, consumers are demanding better and more affordable health care alternatives backed by sterling service and, on the other hand, Wall Street is insistent on sustained growth and increased profitability through cost reduction and improved operational efficiencies. In this environment, the key to success lies in having access to quality data. Data Environment Since 2004, Assurant Health has been improving its data capabilities by streamlining, standardizing and integrating data from various sources in to its Enterprise Data Warehouse (EDW), implemented on an Oracle 9i RAC database.
Figure 1. Data Architecture
The goal is to leverage EDW as the single source of integrated and standardized data for its information consumers that are satisfied by a data latency of 24 hours or higher. This data is delivered to its clients by means of customized data marts, operational and analytic data repositories and applications, dashboards, reports and multidimensional cubes. ETL Environment The data integration process, referred to as the Extract, Transform and Load (ETL) cycle, performs a daily incremental extract of data from a dozen source systems that employ DB2, IMS, VSAM and SQL Server databases. On an IBM mainframe, COBOL programs perform incremental extracts of data from DB2, IMS and VSAM databases in to sequential datasets. These datasets are then transferred to the ETL server by means of FTP. The mainframe data extract and transfer jobs are scheduled using the CA-7 Job Management System. Data from SQL Server and Oracle databases are extracted by means of IBM Websphere DataStage jobs in to sequential files on the ETL server.
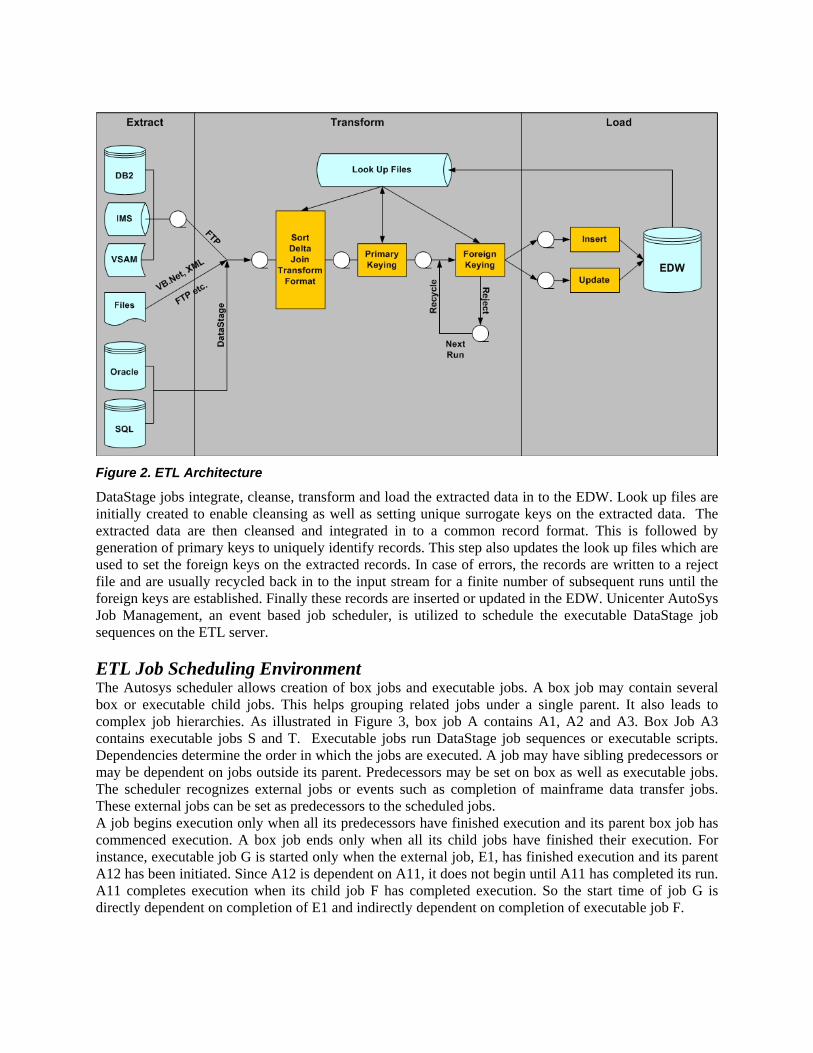
Figure 2. ETL Architecture
DataStage jobs integrate, cleanse, transform and load the extracted data in to the EDW. Look up files are initially created to enable cleansing as well as setting unique surrogate keys on the extracted data. The extracted data are then cleansed and integrated in to a common record format. This is followed by generation of primary keys to uniquely identify records. This step also updates the look up files which are used to set the foreign keys on the extracted records. In case of errors, the records are written to a reject file and are usually recycled back in to the input stream for a finite number of subsequent runs until the foreign keys are established. Finally these records are inserted or updated in the EDW. Unicenter AutoSys Job Management, an event based job scheduler, is utilized to schedule the executable DataStage job sequences on the ETL server. ETL Job Scheduling Environment The Autosys scheduler allows creation of box jobs and executable jobs. A box job may contain several box or executable child jobs. This helps grouping related jobs under a single parent. It also leads to complex job hierarchies. As illustrated in Figure 3, box job A contains A1, A2 and A3. Box Job A3 contains executable jobs S and T. Executable jobs run DataStage job sequences or executable scripts. Dependencies determine the order in which the jobs are executed. A job may have sibling predecessors or may be dependent on jobs outside its parent. Predecessors may be set on box as well as executable jobs. The scheduler recognizes external jobs or events such as completion of mainframe data transfer jobs. These external jobs can be set as predecessors to the scheduled jobs. A job begins execution only when all its predecessors have finished execution and its parent box job has commenced execution. A box job ends only when all its child jobs have finished their execution. For instance, executable job G is started only when the external job, E1, has finished execution and its parent A12 has been initiated. Since A12 is dependent on A11, it does not begin until A11 has completed its run. A11 completes execution when its child job F has completed execution. So the start time of job G is directly dependent on completion of E1 and indirectly dependent on completion of executable job F.
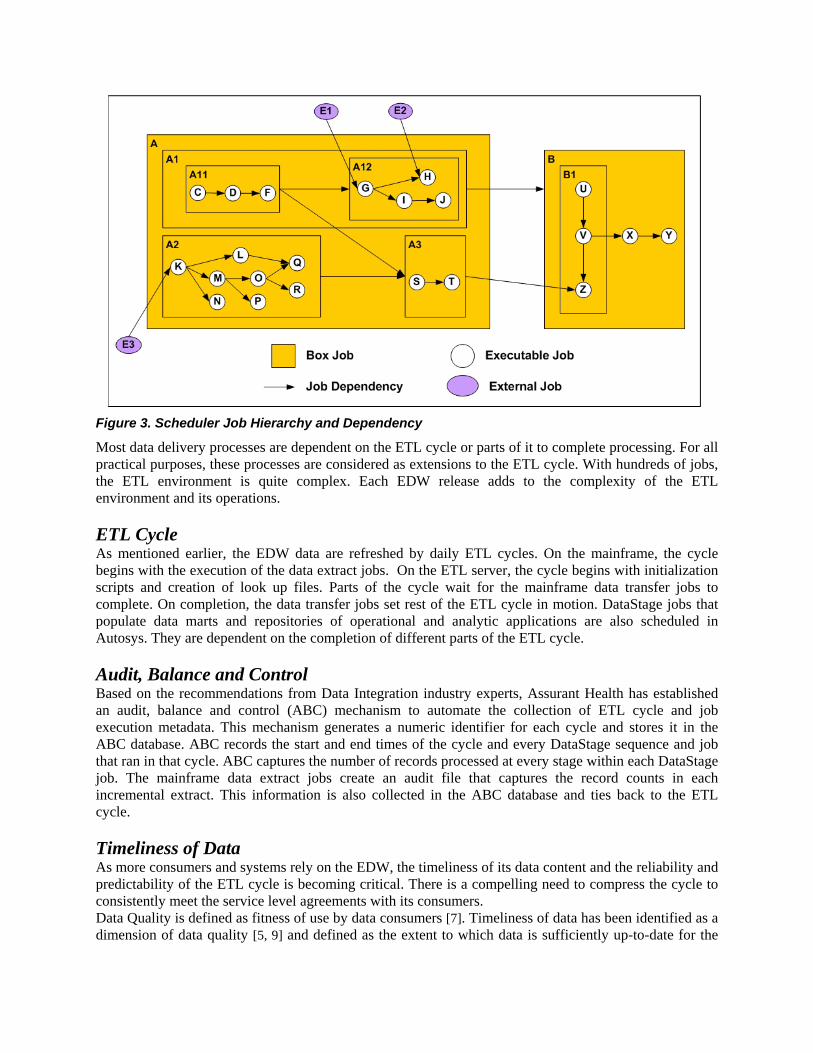
Figure 3. Scheduler Job Hierarchy and Dependency
Most data delivery processes are dependent on the ETL cycle or parts of it to complete processing. For all practical purposes, these processes are considered as extensions to the ETL cycle. With hundreds of jobs, the ETL environment is quite complex. Each EDW release adds to the complexity of the ETL environment and its operations. ETL Cycle As mentioned earlier, the EDW data are refreshed by daily ETL cycles. On the mainframe, the cycle begins with the execution of the data extract jobs. On the ETL server, the cycle begins with initialization scripts and creation of look up files. Parts of the cycle wait for the mainframe data transfer jobs to complete. On completion, the data transfer jobs set rest of the ETL cycle in motion. DataStage jobs that populate data marts and repositories of operational and analytic applications are also scheduled in Autosys. They are dependent on the completion of different parts of the ETL cycle. Audit, Balance and Control Based on the recommendations from Data Integration industry experts, Assurant Health has established an audit, balance and control (ABC) mechanism to automate the collection of ETL cycle and job execution metadata. This mechanism generates a numeric identifier for each cycle and stores it in the ABC database. ABC records the start and end times of the cycle and every DataStage sequence and job that ran in that cycle. ABC captures the number of records processed at every stage within each DataStage job. The mainframe data extract jobs create an audit file that captures the record counts in each incremental extract. This information is also collected in the ABC database and ties back to the ETL cycle. Timeliness of Data As more consumers and systems rely on the EDW, the timeliness of its data content and the reliability and predictability of the ETL cycle is becoming critical. There is a compelling need to compress the cycle to consistently meet the service level agreements with its consumers. Data Quality is defined as fitness of use by data consumers [7]. Timeliness of data has been identified as a dimension of data quality [5, 9] and defined as the extent to which data is sufficiently up-to-date for the
task at hand. Organizations capture the consumer expectation of data timeliness in the form of service level agreements [3]. Service Level Agreements (SLA) clearly state the negotiated and agreed time by which the ETL team would make up-to-date information available to the data consumers. Flagrant violation of a SLA reflects poorly on the quality of the EDW and erodes its reputation for reliability. Hence, it is important to develop a systematic process for service level management. TOTAL DATA QUALITY MANAGEMENT (TDQM) CYCLE Meeting SLAs consistently is, by no means, a trivial task. It is a complex problem because the length of the ETL cycle is impacted by several factors. Attempts to solve this problem simply by intuitive means will result in failure and, consequently, cost the organization a great deal in the long run. At Assurant Health, the Total Data Quality Management (TDQM) methodology was adopted to meet the challenge of delivering data on time.
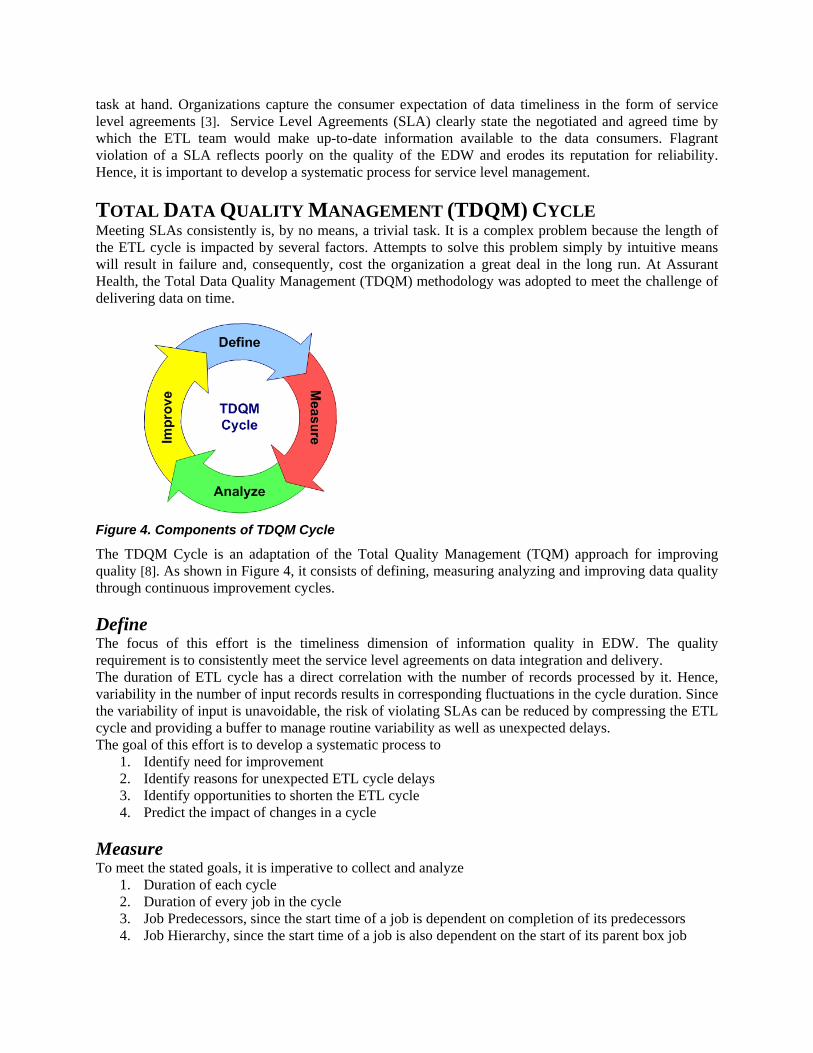
Figure 4. Components of TDQM Cycle
The TDQM Cycle is an adaptation of the Total Quality Management (TQM) approach for improving quality [8]. As shown in Figure 4, it consists of defining, measuring analyzing and improving data quality through continuous improvement cycles. Define The focus of this effort is the timeliness dimension of information quality in EDW. The quality requirement is to consistently meet the service level agreements on data integration and delivery. The duration of ETL cycle has a direct correlation with the number of records processed by it. Hence, variability in the number of input records results in corresponding fluctuations in the cycle duration. Since the variability of input is unavoidable, the risk of violating SLAs can be reduced by compressing the ETL cycle and providing a buffer to manage routine variability as well as unexpected delays. The goal of this effort is to develop a systematic process to
1. Identify need for improvement 2. Identify reasons for unexpected ETL cycle delays 3. Identify opportunities to shorten the ETL cycle 4. Predict the impact of changes in a cycle
Measure To meet the stated goals, it is imperative to collect and analyze
1. Duration of each cycle 2. Duration of every job in the cycle 3. Job Predecessors, since the start time of a job is dependent on completion of its predecessors 4. Job Hierarchy, since the start time of a job is also dependent on the start of its parent box job
5. Count of records processed, since duration of most jobs is directly impacted by it The following contextual information is also desirable for detailed analysis:
• Environment variables such as o Concurrent processes in database or ETL environment. The number of jobs or active user
sessions on the mainframe and the database compete with the ETL processes for processor time.
o Disk I/O wait times o Memory availability and usage on the ETL and database platforms o Free disk space o Network traffic
• History of ETL program and job changes, new releases, one time fixes • Schedule of processes such as periodic snapshots, data delivery cycles, disk back up processes
that are independent of the ETL cycle and compete for resources • History of environment changes such as upgrades, fixes, change in optimization parameters etc.
As mentioned earlier, ABC gathers metadata pertaining to the ETL cycles including cycle and job durations as well as counts of processed records. The job hierarchy and dependency information is extracted from Autosys, parsed and organized in an Oracle table. While data on environment variables is desirable, it is not always feasible or practical to collect it on a daily basis. Change requests are captured on IBM Rational Clearquest and environment upgrade notifications are sent by administrators to all users of the environment. Analyze Identifying Need for Improvement As mentioned earlier, routine fluctuation in ETL cycle duration is expected due to variability of input data. Hence a reserve time or buffer is established to accommodate the routine variation as well as occasional delays.
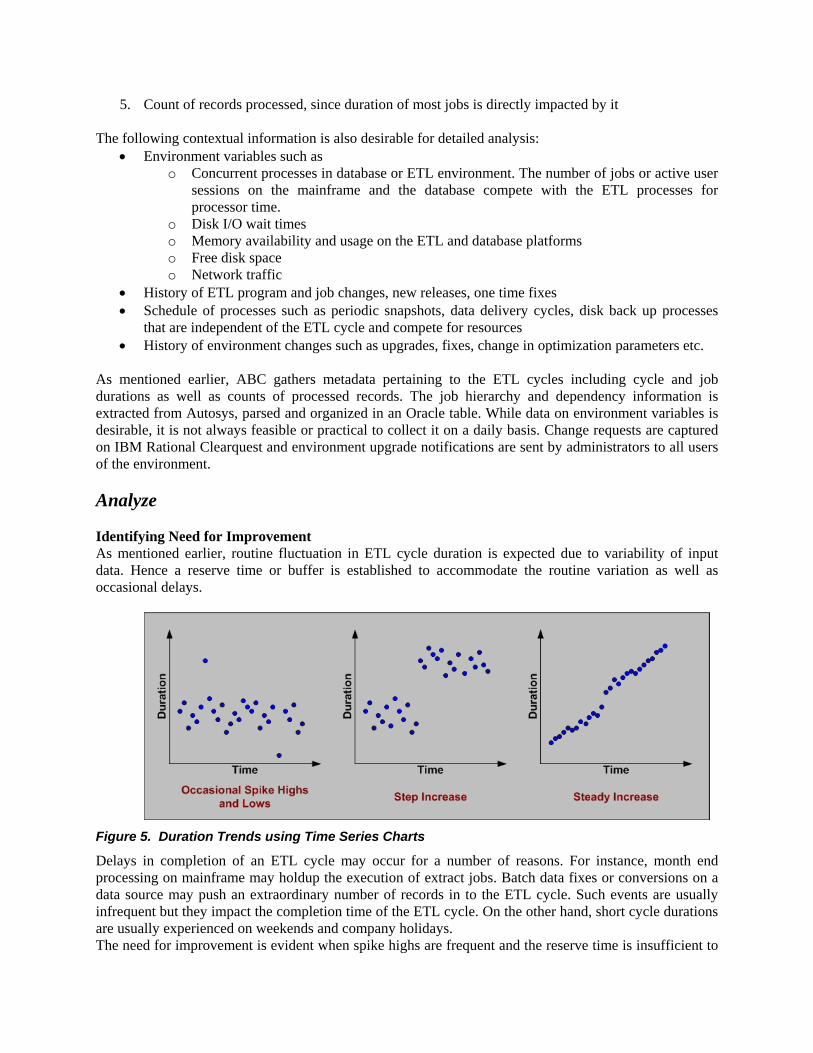
Figure 5. Duration Trends using Time Series Charts
Delays in completion of an ETL cycle may occur for a number of reasons. For instance, month end processing on mainframe may holdup the execution of extract jobs. Batch data fixes or conversions on a data source may push an extraordinary number of records in to the ETL cycle. Such events are usually infrequent but they impact the completion time of the ETL cycle. On the other hand, short cycle durations are usually experienced on weekends and company holidays. The need for improvement is evident when spike highs are frequent and the reserve time is insufficient to
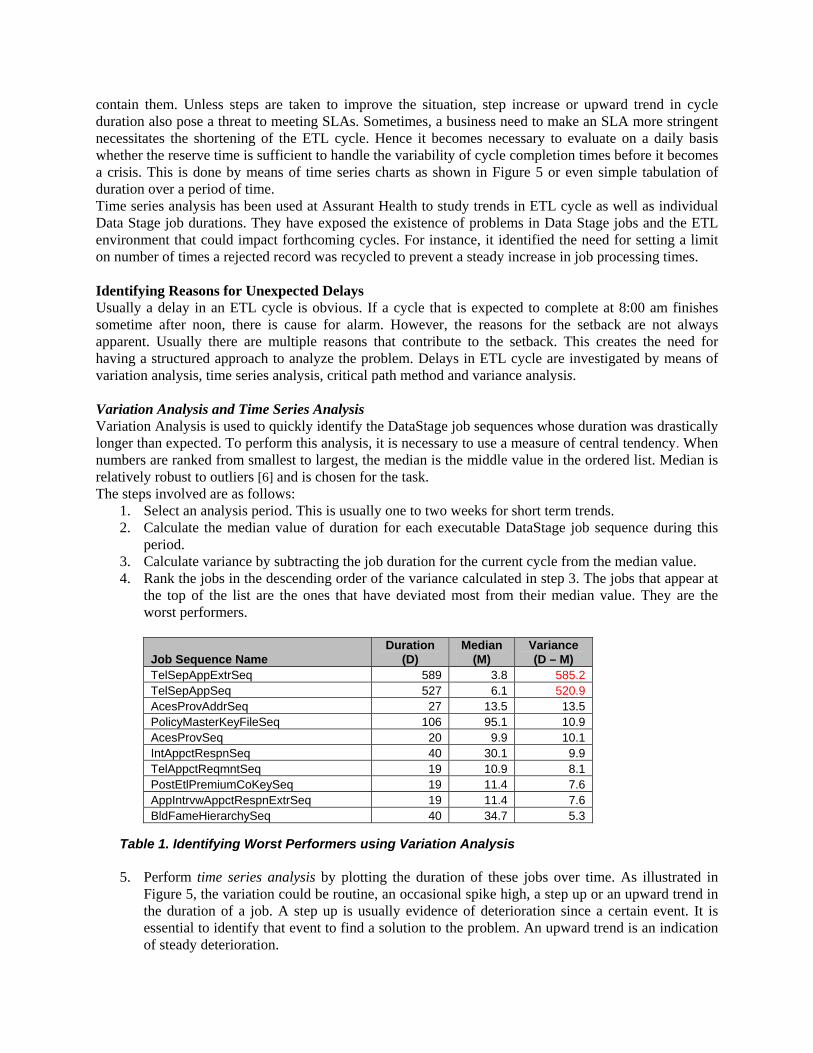
contain them. Unless steps are taken to improve the situation, step increase or upward trend in cycle duration also pose a threat to meeting SLAs. Sometimes, a business need to make an SLA more stringent necessitates the shortening of the ETL cycle. Hence it becomes necessary to evaluate on a daily basis whether the reserve time is sufficient to handle the variability of cycle completion times before it becomes a crisis. This is done by means of time series charts as shown in Figure 5 or even simple tabulation of duration over a period of time. Time series analysis has been used at Assurant Health to study trends in ETL cycle as well as individual Data Stage job durations. They have exposed the existence of problems in Data Stage jobs and the ETL environment that could impact forthcoming cycles. For instance, it identified the need for setting a limit on number of times a rejected record was recycled to prevent a steady increase in job processing times. Identifying Reasons for Unexpected Delays Usually a delay in an ETL cycle is obvious. If a cycle that is expected to complete at 8:00 am finishes sometime after noon, there is cause for alarm. However, the reasons for the setback are not always apparent. Usually there are multiple reasons that contribute to the setback. This creates the need for having a structured approach to analyze the problem. Delays in ETL cycle are investigated by means of variation analysis, time series analysis, critical path method and variance analysis. Variation Analysis and Time Series Analysis Variation Analysis is used to quickly identify the DataStage job sequences whose duration was drastically longer than expected. To perform this analysis, it is necessary to use a measure of central tendency. When numbers are ranked from smallest to largest, the median is the middle value in the ordered list. Median is relatively robust to outliers [6] and is chosen for the task. The steps involved are as follows:
1. Select an analysis period. This is usually one to two weeks for short term trends. 2. Calculate the median value of duration for each executable DataStage job sequence during this
period. 3. Calculate variance by subtracting the job duration for the current cycle from the median value. 4. Rank the jobs in the descending order of the variance calculated in step 3. The jobs that appear at
the top of the list are the ones that have deviated most from their median value. They are the worst performers.
Job Sequence Name Duration
(D) Median
(M) Variance (D – M)
TelSepAppExtrSeq 589 3.8 585.2 TelSepAppSeq 527 6.1 520.9 AcesProvAddrSeq 27 13.5 13.5 PolicyMasterKeyFileSeq 106 95.1 10.9 AcesProvSeq 20 9.9 10.1 IntAppctRespnSeq 40 30.1 9.9 TelAppctReqmntSeq 19 10.9 8.1 PostEtlPremiumCoKeySeq 19 11.4 7.6 AppIntrvwAppctRespnExtrSeq 19 11.4 7.6 BldFameHierarchySeq 40 34.7 5.3
Table 1. Identifying Worst Performers using Variation Analysis 5. Perform time series analysis by plotting the duration of these jobs over time. As illustrated in
Figure 5, the variation could be routine, an occasional spike high, a step up or an upward trend in the duration of a job. A step up is usually evidence of deterioration since a certain event. It is essential to identify that event to find a solution to the problem. An upward trend is an indication of steady deterioration.
6. These jobs are further analyzed by calculating the variance of records processed from their median value and studying their trend over the analysis period.
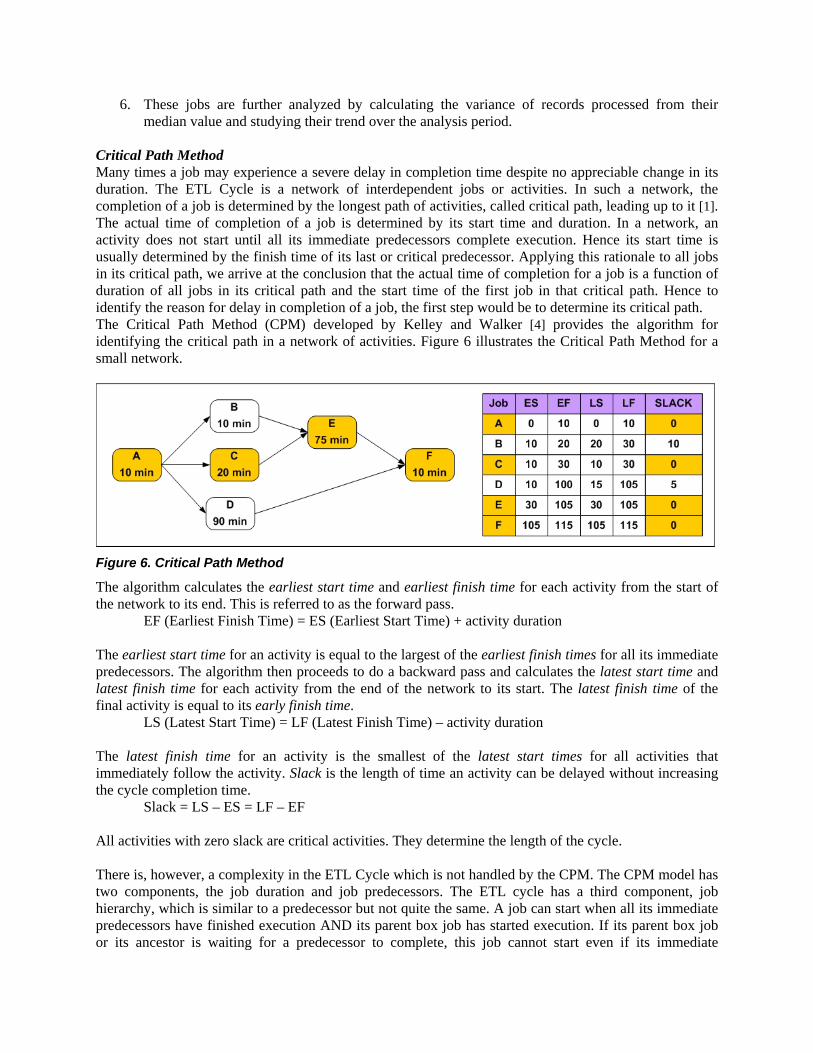
Critical Path Method Many times a job may experience a severe delay in completion time despite no appreciable change in its duration. The ETL Cycle is a network of interdependent jobs or activities. In such a network, the completion of a job is determined by the longest path of activities, called critical path, leading up to it [1]. The actual time of completion of a job is determined by its start time and duration. In a network, an activity does not start until all its immediate predecessors complete execution. Hence its start time is usually determined by the finish time of its last or critical predecessor. Applying this rationale to all jobs in its critical path, we arrive at the conclusion that the actual time of completion for a job is a function of duration of all jobs in its critical path and the start time of the first job in that critical path. Hence to identify the reason for delay in completion of a job, the first step would be to determine its critical path. The Critical Path Method (CPM) developed by Kelley and Walker [4] provides the algorithm for identifying the critical path in a network of activities. Figure 6 illustrates the Critical Path Method for a small network.
Figure 6. Critical Path Method
The algorithm calculates the earliest start time and earliest finish time for each activity from the start of the network to its end. This is referred to as the forward pass.
EF (Earliest Finish Time) = ES (Earliest Start Time) + activity duration
The earliest start time for an activity is equal to the largest of the earliest finish times for all its immediate predecessors. The algorithm then proceeds to do a backward pass and calculates the latest start time and latest finish time for each activity from the end of the network to its start. The latest finish time of the final activity is equal to its early finish time. LS (Latest Start Time) = LF (Latest Finish Time) – activity duration The latest finish time for an activity is the smallest of the latest start times for all activities that immediately follow the activity. Slack is the length of time an activity can be delayed without increasing the cycle completion time. Slack = LS – ES = LF – EF All activities with zero slack are critical activities. They determine the length of the cycle. There is, however, a complexity in the ETL Cycle which is not handled by the CPM. The CPM model has two components, the job duration and job predecessors. The ETL cycle has a third component, job hierarchy, which is similar to a predecessor but not quite the same. A job can start when all its immediate predecessors have finished execution AND its parent box job has started execution. If its parent box job or its ancestor is waiting for a predecessor to complete, this job cannot start even if its immediate
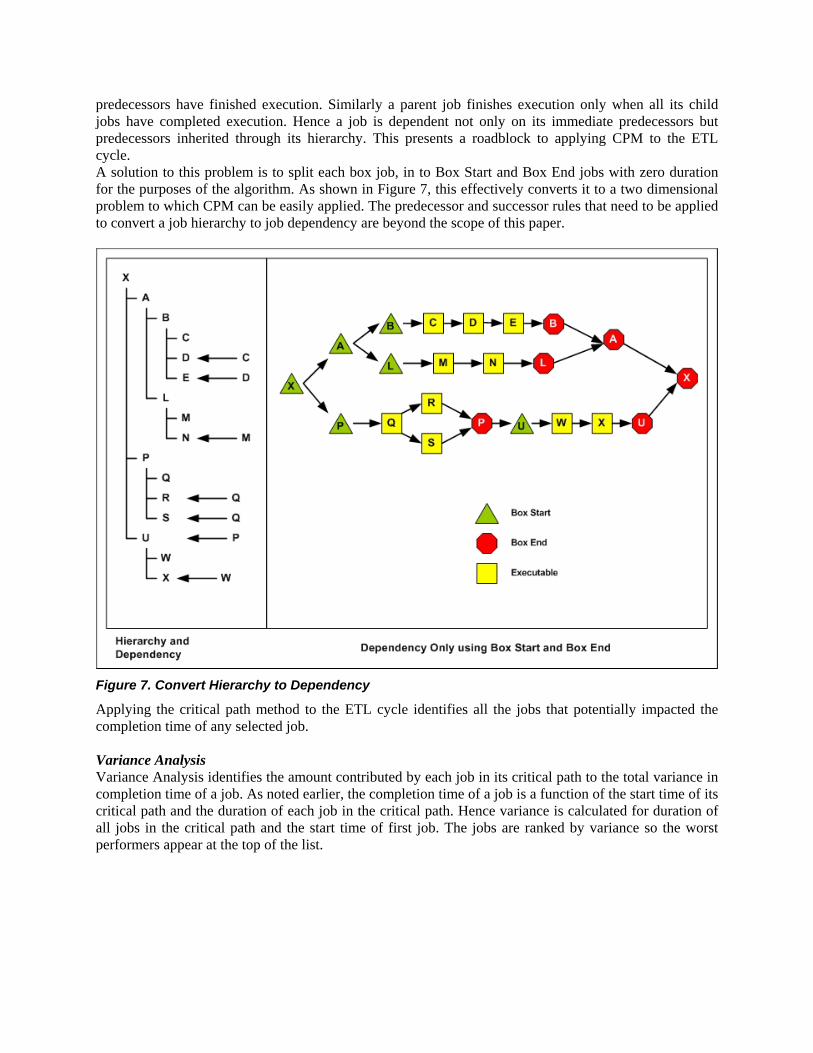
predecessors have finished execution. Similarly a parent job finishes execution only when all its child jobs have completed execution. Hence a job is dependent not only on its immediate predecessors but predecessors inherited through its hierarchy. This presents a roadblock to applying CPM to the ETL cycle. A solution to this problem is to split each box job, in to Box Start and Box End jobs with zero duration for the purposes of the algorithm. As shown in Figure 7, this effectively converts it to a two dimensional problem to which CPM can be easily applied. The predecessor and successor rules that need to be applied to convert a job hierarchy to job dependency are beyond the scope of this paper.
Figure 7. Convert Hierarchy to Dependency Applying the critical path method to the ETL cycle identifies all the jobs that potentially impacted the completion time of any selected job. Variance Analysis Variance Analysis identifies the amount contributed by each job in its critical path to the total variance in completion time of a job. As noted earlier, the completion time of a job is a function of the start time of its critical path and the duration of each job in the critical path. Hence variance is calculated for duration of all jobs in the critical path and the start time of first job. The jobs are ranked by variance so the worst performers appear at the top of the list.
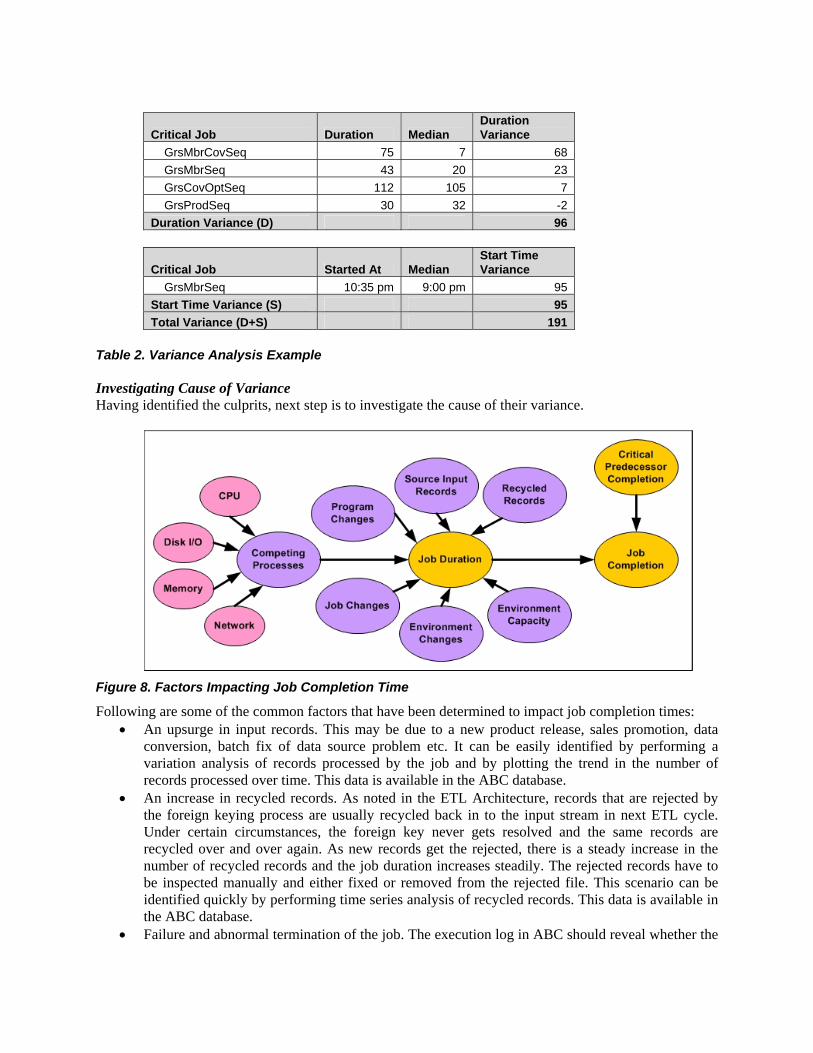
Critical Job Duration Median Duration Variance
GrsMbrCovSeq 75 7 68 GrsMbrSeq 43 20 23 GrsCovOptSeq 112 105 7 GrsProdSeq 30 32 -2 Duration Variance (D) 96
Critical Job Started At Median Start Time Variance
GrsMbrSeq 10:35 pm 9:00 pm 95 Start Time Variance (S) 95 Total Variance (D+S) 191
Table 2. Variance Analysis Example Investigating Cause of Variance Having identified the culprits, next step is to investigate the cause of their variance.
Figure 8. Factors Impacting Job Completion Time
Following are some of the common factors that have been determined to impact job completion times: • An upsurge in input records. This may be due to a new product release, sales promotion, data
conversion, batch fix of data source problem etc. It can be easily identified by performing a variation analysis of records processed by the job and by plotting the trend in the number of records processed over time. This data is available in the ABC database.
• An increase in recycled records. As noted in the ETL Architecture, records that are rejected by the foreign keying process are usually recycled back in to the input stream in next ETL cycle. Under certain circumstances, the foreign key never gets resolved and the same records are recycled over and over again. As new records get the rejected, there is a steady increase in the number of recycled records and the job duration increases steadily. The rejected records have to be inspected manually and either fixed or removed from the rejected file. This scenario can be identified quickly by performing time series analysis of recycled records. This data is available in the ABC database.
• Failure and abnormal termination of the job. The execution log in ABC should reveal whether the
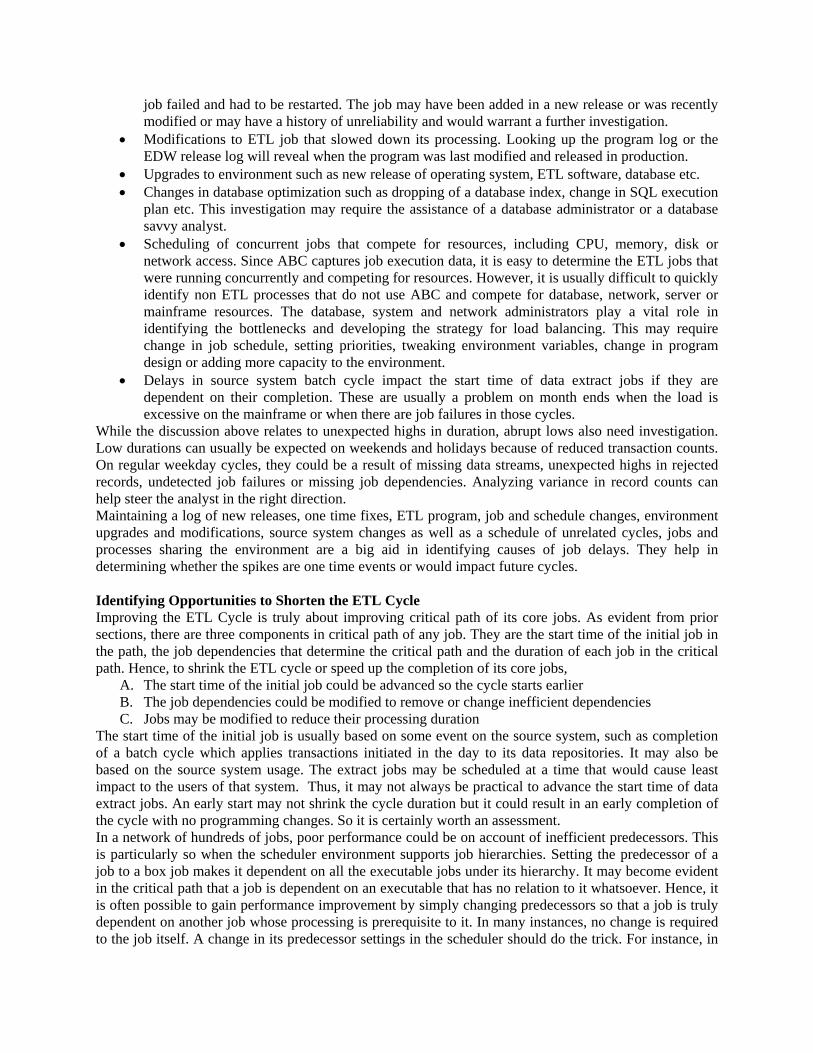
job failed and had to be restarted. The job may have been added in a new release or was recently modified or may have a history of unreliability and would warrant a further investigation.
• Modifications to ETL job that slowed down its processing. Looking up the program log or the EDW release log will reveal when the program was last modified and released in production.
• Upgrades to environment such as new release of operating system, ETL software, database etc. • Changes in database optimization such as dropping of a database index, change in SQL execution
plan etc. This investigation may require the assistance of a database administrator or a database savvy analyst.
• Scheduling of concurrent jobs that compete for resources, including CPU, memory, disk or network access. Since ABC captures job execution data, it is easy to determine the ETL jobs that were running concurrently and competing for resources. However, it is usually difficult to quickly identify non ETL processes that do not use ABC and compete for database, network, server or mainframe resources. The database, system and network administrators play a vital role in identifying the bottlenecks and developing the strategy for load balancing. This may require change in job schedule, setting priorities, tweaking environment variables, change in program design or adding more capacity to the environment.
• Delays in source system batch cycle impact the start time of data extract jobs if they are dependent on their completion. These are usually a problem on month ends when the load is excessive on the mainframe or when there are job failures in those cycles.
While the discussion above relates to unexpected highs in duration, abrupt lows also need investigation. Low durations can usually be expected on weekends and holidays because of reduced transaction counts. On regular weekday cycles, they could be a result of missing data streams, unexpected highs in rejected records, undetected job failures or missing job dependencies. Analyzing variance in record counts can help steer the analyst in the right direction. Maintaining a log of new releases, one time fixes, ETL program, job and schedule changes, environment upgrades and modifications, source system changes as well as a schedule of unrelated cycles, jobs and processes sharing the environment are a big aid in identifying causes of job delays. They help in determining whether the spikes are one time events or would impact future cycles. Identifying Opportunities to Shorten the ETL Cycle Improving the ETL Cycle is truly about improving critical path of its core jobs. As evident from prior sections, there are three components in critical path of any job. They are the start time of the initial job in the path, the job dependencies that determine the critical path and the duration of each job in the critical path. Hence, to shrink the ETL cycle or speed up the completion of its core jobs,
A. The start time of the initial job could be advanced so the cycle starts earlier B. The job dependencies could be modified to remove or change inefficient dependencies C. Jobs may be modified to reduce their processing duration
The start time of the initial job is usually based on some event on the source system, such as completion of a batch cycle which applies transactions initiated in the day to its data repositories. It may also be based on the source system usage. The extract jobs may be scheduled at a time that would cause least impact to the users of that system. Thus, it may not always be practical to advance the start time of data extract jobs. An early start may not shrink the cycle duration but it could result in an early completion of the cycle with no programming changes. So it is certainly worth an assessment. In a network of hundreds of jobs, poor performance could be on account of inefficient predecessors. This is particularly so when the scheduler environment supports job hierarchies. Setting the predecessor of a job to a box job makes it dependent on all the executable jobs under its hierarchy. It may become evident in the critical path that a job is dependent on an executable that has no relation to it whatsoever. Hence, it is often possible to gain performance improvement by simply changing predecessors so that a job is truly dependent on another job whose processing is prerequisite to it. In many instances, no change is required to the job itself. A change in its predecessor settings in the scheduler should do the trick. For instance, in
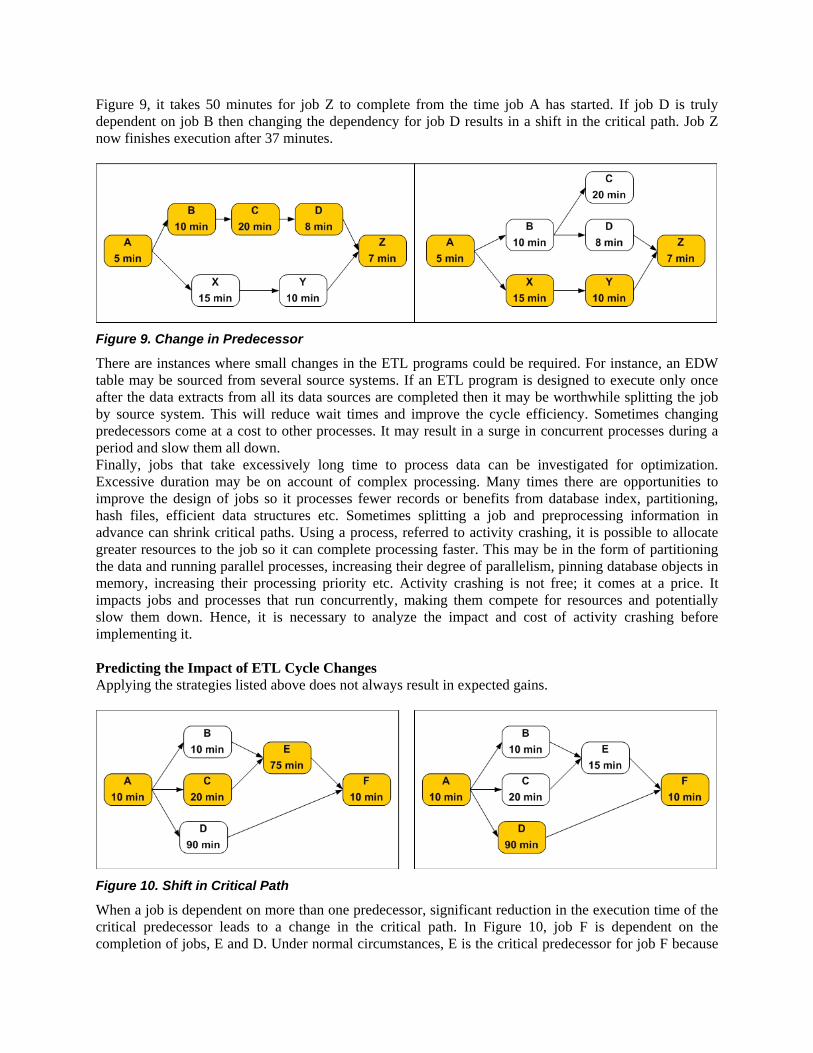
Figure 9, it takes 50 minutes for job Z to complete from the time job A has started. If job D is truly dependent on job B then changing the dependency for job D results in a shift in the critical path. Job Z now finishes execution after 37 minutes.
Figure 9. Change in Predecessor There are instances where small changes in the ETL programs could be required. For instance, an EDW table may be sourced from several source systems. If an ETL program is designed to execute only once after the data extracts from all its data sources are completed then it may be worthwhile splitting the job by source system. This will reduce wait times and improve the cycle efficiency. Sometimes changing predecessors come at a cost to other processes. It may result in a surge in concurrent processes during a period and slow them all down. Finally, jobs that take excessively long time to process data can be investigated for optimization. Excessive duration may be on account of complex processing. Many times there are opportunities to improve the design of jobs so it processes fewer records or benefits from database index, partitioning, hash files, efficient data structures etc. Sometimes splitting a job and preprocessing information in advance can shrink critical paths. Using a process, referred to activity crashing, it is possible to allocate greater resources to the job so it can complete processing faster. This may be in the form of partitioning the data and running parallel processes, increasing their degree of parallelism, pinning database objects in memory, increasing their processing priority etc. Activity crashing is not free; it comes at a price. It impacts jobs and processes that run concurrently, making them compete for resources and potentially slow them down. Hence, it is necessary to analyze the impact and cost of activity crashing before implementing it. Predicting the Impact of ETL Cycle Changes Applying the strategies listed above does not always result in expected gains.
Figure 10. Shift in Critical Path When a job is dependent on more than one predecessor, significant reduction in the execution time of the critical predecessor leads to a change in the critical path. In Figure 10, job F is dependent on the completion of jobs, E and D. Under normal circumstances, E is the critical predecessor for job F because
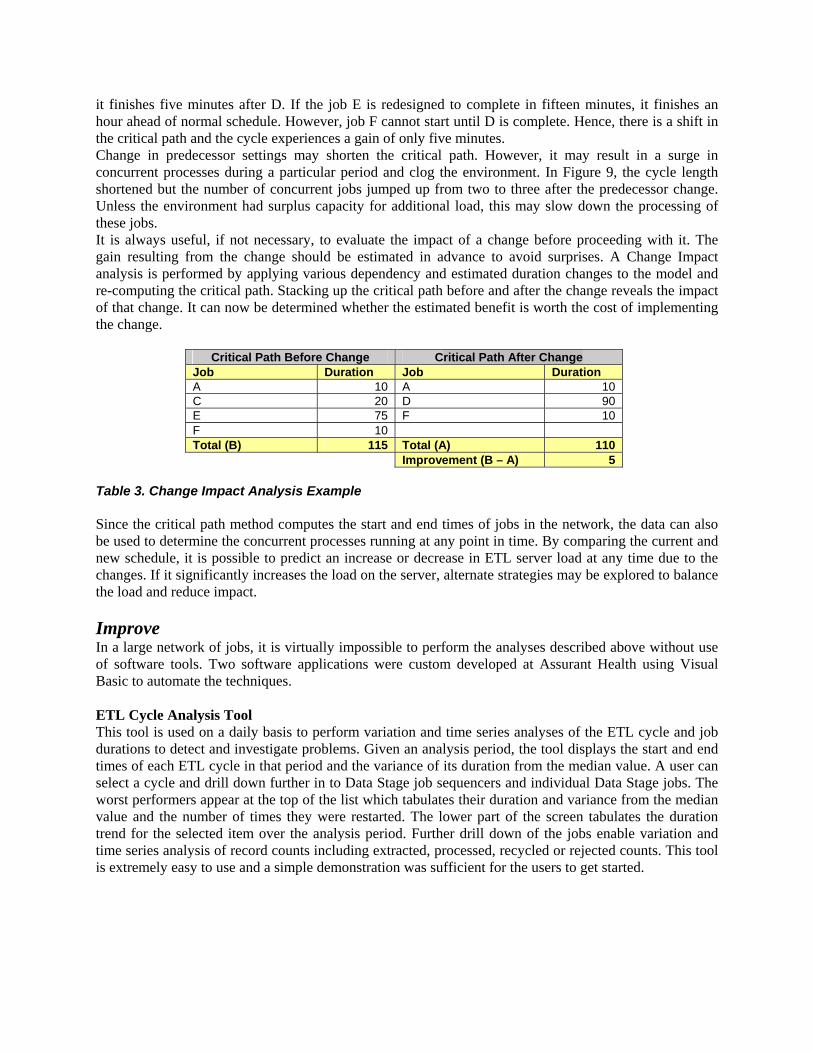
it finishes five minutes after D. If the job E is redesigned to complete in fifteen minutes, it finishes an hour ahead of normal schedule. However, job F cannot start until D is complete. Hence, there is a shift in the critical path and the cycle experiences a gain of only five minutes. Change in predecessor settings may shorten the critical path. However, it may result in a surge in concurrent processes during a particular period and clog the environment. In Figure 9, the cycle length shortened but the number of concurrent jobs jumped up from two to three after the predecessor change. Unless the environment had surplus capacity for additional load, this may slow down the processing of these jobs. It is always useful, if not necessary, to evaluate the impact of a change before proceeding with it. The gain resulting from the change should be estimated in advance to avoid surprises. A Change Impact analysis is performed by applying various dependency and estimated duration changes to the model and re-computing the critical path. Stacking up the critical path before and after the change reveals the impact of that change. It can now be determined whether the estimated benefit is worth the cost of implementing the change.
Critical Path Before Change Critical Path After Change Job Duration Job Duration A 10 A 10 C 20 D 90 E 75 F 10 F 10 Total (B) 115 Total (A) 110 Improvement (B – A) 5
Table 3. Change Impact Analysis Example Since the critical path method computes the start and end times of jobs in the network, the data can also be used to determine the concurrent processes running at any point in time. By comparing the current and new schedule, it is possible to predict an increase or decrease in ETL server load at any time due to the changes. If it significantly increases the load on the server, alternate strategies may be explored to balance the load and reduce impact. Improve In a large network of jobs, it is virtually impossible to perform the analyses described above without use of software tools. Two software applications were custom developed at Assurant Health using Visual Basic to automate the techniques. ETL Cycle Analysis Tool This tool is used on a daily basis to perform variation and time series analyses of the ETL cycle and job durations to detect and investigate problems. Given an analysis period, the tool displays the start and end times of each ETL cycle in that period and the variance of its duration from the median value. A user can select a cycle and drill down further in to Data Stage job sequencers and individual Data Stage jobs. The worst performers appear at the top of the list which tabulates their duration and variance from the median value and the number of times they were restarted. The lower part of the screen tabulates the duration trend for the selected item over the analysis period. Further drill down of the jobs enable variation and time series analysis of record counts including extracted, processed, recycled or rejected counts. This tool is extremely easy to use and a simple demonstration was sufficient for the users to get started.
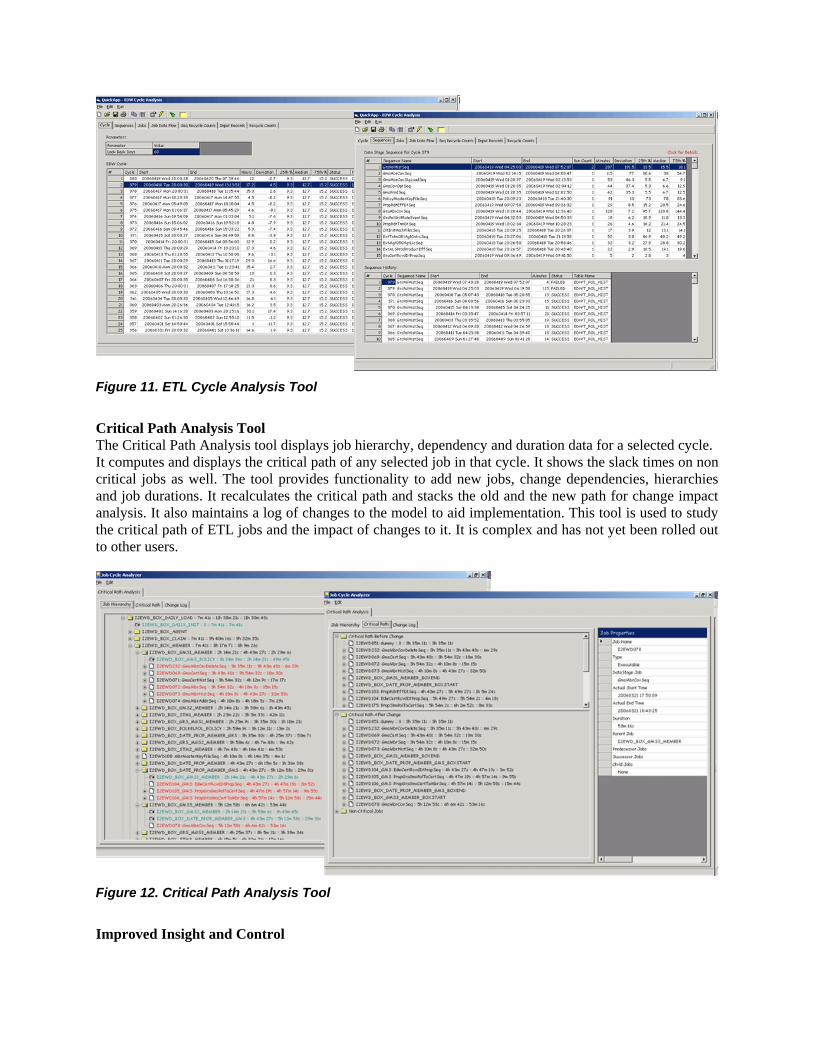
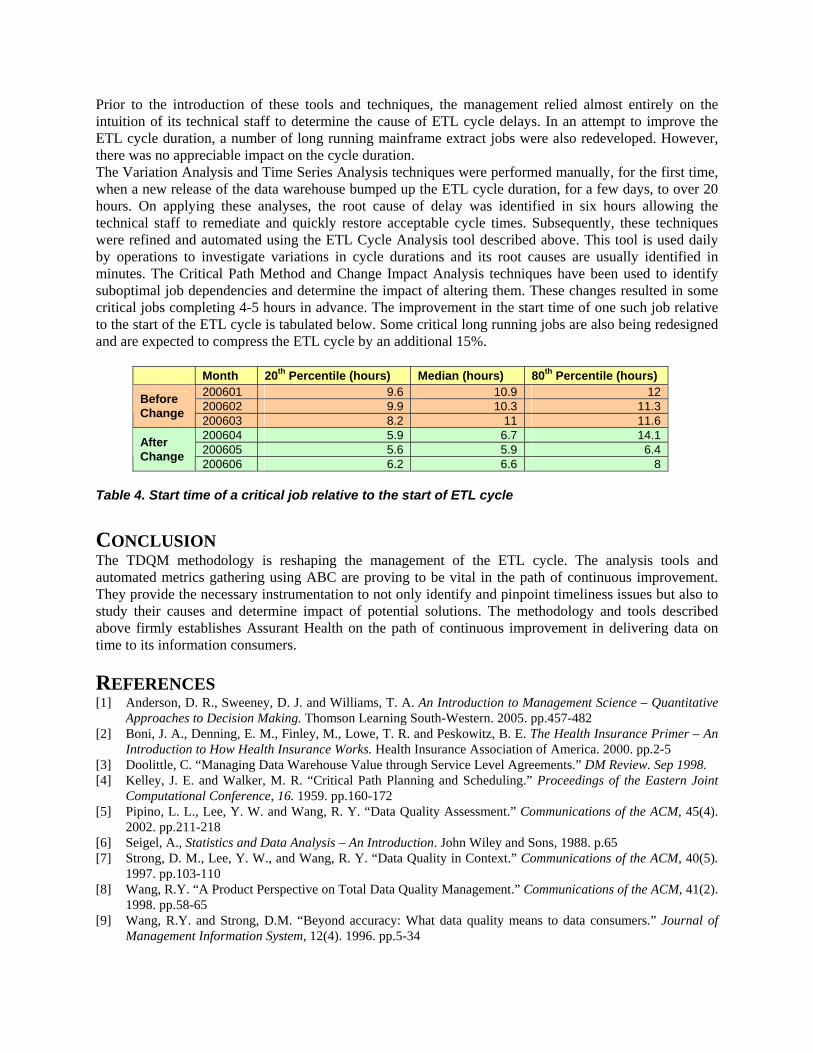
Figure 11. ETL Cycle Analysis Tool Critical Path Analysis Tool The Critical Path Analysis tool displays job hierarchy, dependency and duration data for a selected cycle. It computes and displays the critical path of any selected job in that cycle. It shows the slack times on non critical jobs as well. The tool provides functionality to add new jobs, change dependencies, hierarchies and job durations. It recalculates the critical path and stacks the old and the new path for change impact analysis. It also maintains a log of changes to the model to aid implementation. This tool is used to study the critical path of ETL jobs and the impact of changes to it. It is complex and has not yet been rolled out to other users.
Figure 12. Critical Path Analysis Tool Improved Insight and Control
Prior to the introduction of these tools and techniques, the management relied almost entirely on the intuition of its technical staff to determine the cause of ETL cycle delays. In an attempt to improve the ETL cycle duration, a number of long running mainframe extract jobs were also redeveloped. However, there was no appreciable impact on the cycle duration. The Variation Analysis and Time Series Analysis techniques were performed manually, for the first time, when a new release of the data warehouse bumped up the ETL cycle duration, for a few days, to over 20 hours. On applying these analyses, the root cause of delay was identified in six hours allowing the technical staff to remediate and quickly restore acceptable cycle times. Subsequently, these techniques were refined and automated using the ETL Cycle Analysis tool described above. This tool is used daily by operations to investigate variations in cycle durations and its root causes are usually identified in minutes. The Critical Path Method and Change Impact Analysis techniques have been used to identify suboptimal job dependencies and determine the impact of altering them. These changes resulted in some critical jobs completing 4-5 hours in advance. The improvement in the start time of one such job relative to the start of the ETL cycle is tabulated below. Some critical long running jobs are also being redesigned and are expected to compress the ETL cycle by an additional 15%.
Month 20th Percentile (hours) Median (hours) 80th Percentile (hours)
200601 9.6 10.9 12 200602 9.9 10.3 11.3 Before
Change 200603 8.2 11 11.6 200604 5.9 6.7 14.1 200605 5.6 5.9 6.4 After
Change 200606 6.2 6.6 8 Table 4. Start time of a critical job relative to the start of ETL cycle CONCLUSION The TDQM methodology is reshaping the management of the ETL cycle. The analysis tools and automated metrics gathering using ABC are proving to be vital in the path of continuous improvement. They provide the necessary instrumentation to not only identify and pinpoint timeliness issues but also to study their causes and determine impact of potential solutions. The methodology and tools described above firmly establishes Assurant Health on the path of continuous improvement in delivering data on time to its information consumers. REFERENCES [1] Anderson, D. R., Sweeney, D. J. and Williams, T. A. An Introduction to Management Science – Quantitative
Approaches to Decision Making. Thomson Learning South-Western. 2005. pp.457-482 [2] Boni, J. A., Denning, E. M., Finley, M., Lowe, T. R. and Peskowitz, B. E. The Health Insurance Primer – An
Introduction to How Health Insurance Works. Health Insurance Association of America. 2000. pp.2-5 [3] Doolittle, C. “Managing Data Warehouse Value through Service Level Agreements.” DM Review. Sep 1998. [4] Kelley, J. E. and Walker, M. R. “Critical Path Planning and Scheduling.” Proceedings of the Eastern Joint
Computational Conference, 16. 1959. pp.160-172 [5] Pipino, L. L., Lee, Y. W. and Wang, R. Y. “Data Quality Assessment.” Communications of the ACM, 45(4).
2002. pp.211-218 [6] Seigel, A., Statistics and Data Analysis – An Introduction. John Wiley and Sons, 1988. p.65 [7] Strong, D. M., Lee, Y. W., and Wang, R. Y. “Data Quality in Context.” Communications of the ACM, 40(5).
1997. pp.103-110 [8] Wang, R.Y. “A Product Perspective on Total Data Quality Management.” Communications of the ACM, 41(2).
1998. pp.58-65 [9] Wang, R.Y. and Strong, D.M. “Beyond accuracy: What data quality means to data consumers.” Journal of
Management Information System, 12(4). 1996. pp.5-34