Embed Size (px)
Citation preview
Please cite this paper as:
Moccero, D. (2008), "Delivering Cost-Efficient PublicServices in Health Care, Education and Housing in Chile",OECD Economics Department Working Papers, No. 606,OECD Publishing.doi:10.1787/242121837336
OECD Economics DepartmentWorking Papers No. 606
Delivering Cost-EfficientPublic Services in HealthCare, Education andHousing in Chile
D. Moccero*
JEL Classification: C6, I1, I2
*OECD, France
Unclassified ECO/WKP(2008)14 Organisation de Coopération et de Développement Économiques Organisation for Economic Co-operation and Development 14-Apr-2008
___________________________________________________________________________________________
_____________ English - Or. English ECONOMICS DEPARTMENT
DELIVERING COST-EFFICIENT PUBLIC SERVICES IN HEALTH CARE, EDUCATION AND
HOUSING IN CHILE
ECONOMICS DEPARTMENT WORKING PAPERS No. 606
By
D. Moccero
All Economics Department Working Papers are available through OECD's Internet Web site at
http://www.oecd.org/eco/Working_Papers
JT03244079
Document complet disponible sur OLIS dans son format d'origine
Complete document available on OLIS in its original format
EC
O/W
KP
(2008)1
4
Un
classified
En
glish
- Or. E
ng
lish
ECO/WKP(2008)14
2
ABSTRACT/RESUME
Delivering cost-efficient public services in health care, education and housing in Chile
The Chilean authorities plan to raise budgetary allocations over the medium term for a variety of social
programmes, including education, health care and housing. This incremental spending will need to be carried
out in a cost-efficient manner to make sure that it yields commensurate improvements in social outcomes.
Chile’s health indicators show that it fares relatively well in relation to comparator countries in the OECD area
and in Latin America. But this is less so in the case of education, where secondary and tertiary educational
attainment remain low, despite a significant increase over the years, and performance is poor on the basis of
standardised test scores, such as PISA. Even though comparison with countries in the OECD area is difficult, a
sizeable housing deficit has yet to be closed in Chile. To meet these various challenges, efforts will need to be
stepped up to: i) narrow the disparities in performance that currently exist among schools with students from
varying backgrounds through use of the “differentiated” voucher scheme and additional measures to improve
the quality of teaching and management; ii) improve risk sharing among private and public health insurers,
while increasing the coverage of health insurance to a broader variety of pathologies under AUGE; and
iii) continue to tackle the shortage of housing, while enhancing the quality of subsidised housing units and their
surrounding neighbourhoods for the poorest segments of society. This paper relates to the 2007 Economic
Survey of Chile (www.oecd.org/eco/surveys/chile).
JEL codes: I1, I2, C6
Keywords: Chile, education, health, social housing, public spending efficiency, Data Envelopment Analysis
(DEA)
*******
Pour des services publics efficients dans le domaine des soins de santé, de l’éducation
et du logement au Chili
Les autorités prévoient d’augmenter les dotations budgétaires à moyen terme pour divers programmes sociaux
touchant notamment aux secteurs de l’éducation, de la santé et du logement. Elles doivent faire preuve
d’efficience dans l’utilisation de ce surcroît de dépenses, de façon à s’assurer que les résultats sociaux
s’améliorent de manière proportionnelle. Les indicateurs de santé de la population montrent que la situation est
relativement bonne au Chili par rapport aux pays pris comme comparaison dans la zone OCDE et en Amérique
latine. Elle est moins favorable dans le secteur de l’éducation, où les résultats dans le secondaire et le supérieur
restent faibles, malgré une progression sensible au fil des années, et où la performance telle que la mesurent les
notes obtenues à des tests normalisés du type PISA est peu satisfaisante. Même s’il est difficile de faire des
comparaisons avec les pays de l’OCDE, le Chili doit encore faire face à une importante pénurie de logements.
Pour relever ces différents défis, il lui faudra redoubler d’effort afin de : i) réduire les disparités de résultats qui
existent actuellement entre les établissements publics, privés subventionnés et totalement privés grâce à
l’utilisation du dispositif de chèques-éducation « différenciés » ; ii) mieux partager les risques entre les
assureurs publics et les assureurs privés, tout en élargissant la couverture de l’assurance maladie à des
pathologies plus diverses ; et iii) continuer à faire face à la pénurie de logements tout en améliorant la qualité
des logements subventionnés au profit des catégories les plus pauvres de la société. Ce document se rapporte à
l’Étude économique du Chili 2007 (www.oecd.org/eco/etudes/chili).
JEL Classification : I1, I2, C6
Mots-clés : Chili, éducation, santé, logement social, efficience de dépenses publiques, méthode DEA
Copyright © OECD, 2008. All rights reserved. Application for permission to reproduce or translate
all, or part of, this material should be made to: Head of Publications Service, OECD, 2 rue
André-Pascal, 75775 PARIS CEDEX 16, France.
ECO/WKP(2008)14
3
Table of contents
Delivering cost-efficient public services in health care, education and housing in Chile ........................ 5
Introduction .................................................................................................................................................. 5 Spending and reforms in education, health care and housing ...................................................................... 5
Review of social spending ........................................................................................................................ 5 Recent policies: An overview................................................................................................................... 9 Education .................................................................................................................................................. 9 Health care.............................................................................................................................................. 11 Housing policies: Design and effectiveness ........................................................................................... 13
How well do the education and health systems perform? .......................................................................... 15 Education outcomes ............................................................................................................................... 15 Health care: Broad coverage but persistent segmentation ...................................................................... 19 Measuring the efficiency of government spending in education and health care .................................. 20
Challenges and policy recommendations ................................................................................................... 23 Closing the student performance gap ..................................................................................................... 23 Boosting the efficiency of health care programmes ............................................................................... 25 Facilitating access to better housing for vulnerable social groups ......................................................... 26
Bibliography .............................................................................................................................................. 28
Annex A1 Measuring efficiency in education and health care .................................................................. 31
Boxes
1. Chile’s primary and secondary education system: An overview ..................................................... 9
2. Chile’s health care system: An overview ....................................................................................... 11
3. Housing policies in Chile: An overview ........................................................................................ 13
4. Measuring efficiency in social spending ........................................................................................ 21
Tables
1. School enrolment by income level, 1990 and 2004 ....................................................................... 18
2. Education performance by school type: SIMCE scores, 2003 and 2004 ....................................... 18
A1.1. Technical efficiency in education .................................................................................................. 34
A1.2. Allocative efficiency in education ................................................................................................. 35
A1.3. Technical efficiency in health ........................................................................................................ 36
A1.4. Allocative efficiency in health ....................................................................................................... 37
ECO/WKP(2008)14
4
Figures
1. Private and public spending on education and health care ............................................................... 6
2. Expenditure on education and health case, 2003 ............................................................................. 7
3. Growth in government spending on health care and GDP ............................................................... 8
4. Access to housing and quality deficiency indicators ..................................................................... 15
5. Outcomes and inputs in health and education in OECD and non-OECD countries, 2003 ............ 16
6. Education outcomes: International comparisons ........................................................................... 17
7. Health outcomes: International comparisons, 2003 ....................................................................... 19
8. Efficiency gaps in education: OECD and selected non-OECD countries ...................................... 20
9. Efficiency frontiers ........................................................................................................................ 21
10. Health input indicators: Chile, OECD and selected non-OECD countries .................................... 22
ECO/WKP(2008)14
5
Delivering cost-efficient public services in health care, education
and housing in Chile
D. Moccero1
Introduction
Consistent with their social development objectives, the Chilean authorities plan to raise budgetary
allocations over the medium term for a variety of social programmes, including education, health care and
housing. A gap in government spending levels and in performance indicators between Chile and the OECD
area would justify an increase in government financing for selected programmes. While Chile’s health
indicators point to already good outcomes by international comparison, this is not the case for education,
where secondary school attainment remains lower than the OECD average, despite an increase over the
years, and performance is poor on the basis of standardised test scores, such as PISA. Indeed, the analysis
reported below suggests that there is much scope for boosting efficiency in the delivery of education
services. A sizeable housing deficit has yet to be overcome, calling for policy action in this area too.
Policy action, which has successfully facilitated access by the population to public services, is now
beginning to focus on measures to improve quality in service delivery and removing extant access barriers
for the most disadvantaged groups in society. For the planned increase in spending to be carried out in a
cost-efficient manner, so as to make sure that it yields commensurate improvements in social outcomes,
efforts will need to be stepped up to: i) narrow the disparities in performance that currently exist among
schools through the “differentiated” voucher scheme in primary and lower-secondary education;
ii) improve risk sharing among private and public health insurers, while increasing the coverage of health
insurance to a broader variety of pathologies as planned under AUGE; and iii) continue to shrink the
housing deficit, while enhancing the quality of subsidised housing for the poorest segments of society.
Current initiatives in these areas need to be evaluated against a background in which social protection is
being strengthened through concomitant reforms in pension and social assistance programmes.
Spending and reforms in education, health care and housing
Review of social spending
Trends in spending on education and health care have diverged over the years. A sizeable increase in
total spending (public and private) on education in relation to GDP contrasts with a relative stability of
outlays on heath care (Figure 1). Government spending on these programmes is accounting for a rising
1. This paper is part of the Economic Survey of Chile, published in November 2007 under the authority of the
Secretary General of the OECD and discussed at the Economic and Development Review Committee on
9 October 2007. The author thanks, without implicating, Andrew Dean, Peter Jarrett and Val Koromzay, as
well as Chilean experts, especially Marcela Perticara, Alberto Hurtado, and Harald Beyer, for helpful
comments and discussions. Special thanks are due to Anne Legendre for research assistance and
Mee-Lan Frank for excellent technical assistance.
ECO/WKP(2008)14
6
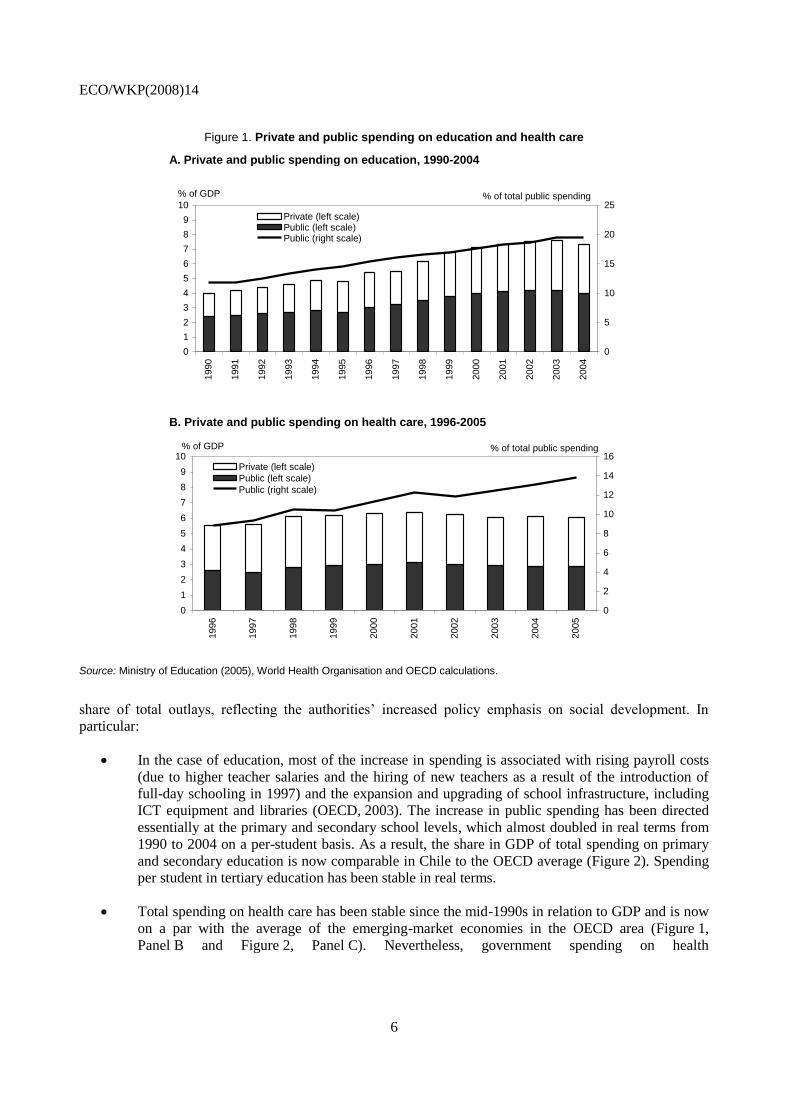
Figure 1. Private and public spending on education and health care
A. Private and public spending on education, 1990-2004
B. Private and public spending on health care, 1996-2005
0
1
2
3
4
5
6
7
8
9
101990
1991
1992
1993
1994
1995
1996
1997
1998
1999
2000
2001
2002
2003
2004
% of GDP
0
5
10
15
20
25
Private (left scale)Public (left scale)Public (right scale)
% of total public spending
0
1
2
3
4
5
6
7
8
9
10
1996
1997
1998
1999
2000
2001
2002
2003
2004
2005
% of GDP
0
2
4
6
8
10
12
14
16Private (left scale)
Public (left scale)
Public (right scale)
% of total public spending
Source: Ministry of Education (2005), World Health Organisation and OECD calculations.
share of total outlays, reflecting the authorities’ increased policy emphasis on social development. In
particular:
In the case of education, most of the increase in spending is associated with rising payroll costs
(due to higher teacher salaries and the hiring of new teachers as a result of the introduction of
full-day schooling in 1997) and the expansion and upgrading of school infrastructure, including
ICT equipment and libraries (OECD, 2003). The increase in public spending has been directed
essentially at the primary and secondary school levels, which almost doubled in real terms from
1990 to 2004 on a per-student basis. As a result, the share in GDP of total spending on primary
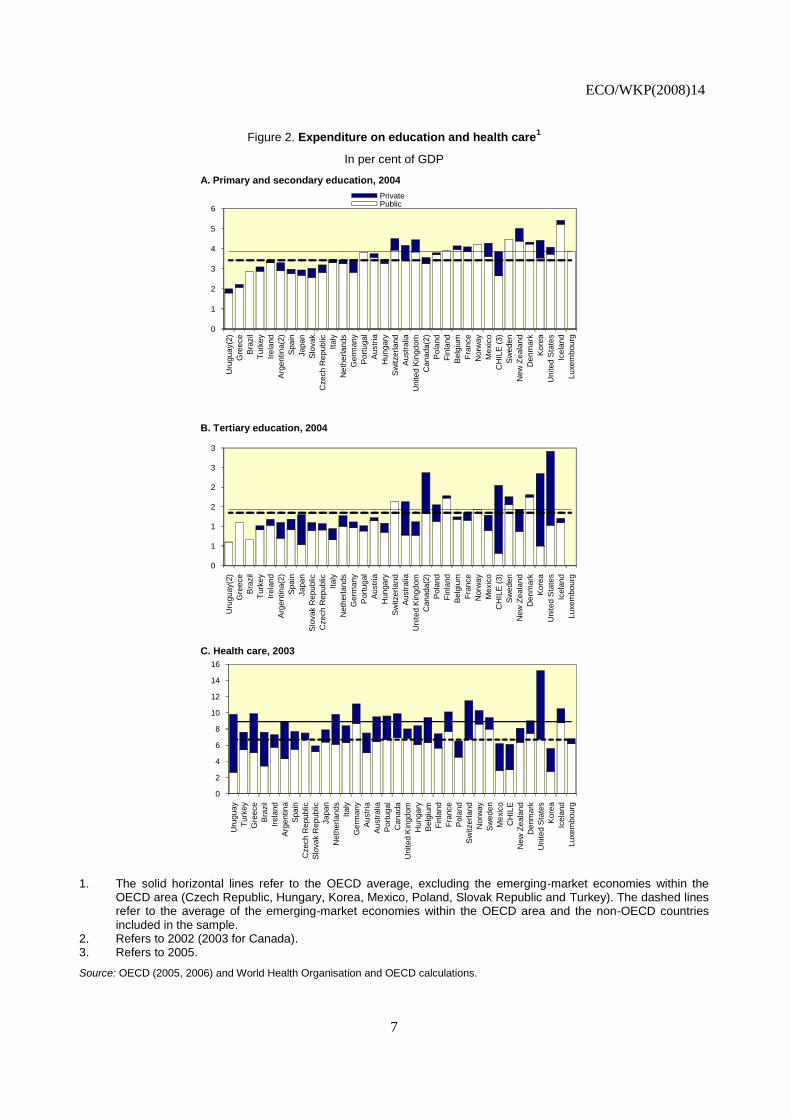
and secondary education is now comparable in Chile to the OECD average (Figure 2). Spending
per student in tertiary education has been stable in real terms.
Total spending on health care has been stable since the mid-1990s in relation to GDP and is now
on a par with the average of the emerging-market economies in the OECD area (Figure 1,
Panel B and Figure 2, Panel C). Nevertheless, government spending on health
ECO/WKP(2008)14
7
Figure 2. Expenditure on education and health care1
In per cent of GDP
A. Primary and secondary education, 2004
B. Tertiary education, 2004
C. Health care, 2003
0
1
2
3
4
5
6
Uru
guay(2
)
Gre
ece
Bra
zil
Turk
ey
Irela
nd
Arg
entina(2
)
Spain
Japan
Slo
vak …
Czech R
epublic
Italy
Neth
erlands
Germ
any
Port
ugal
Austr
ia
Hungary
Sw
itzerland
Austr
alia
United K
ingdom
Canada(2
)
Pola
nd
Fin
land
Belg
ium
Fra
nce
Norw
ay
Mexic
o
CH
ILE
(3)
Sw
eden
New
Zeala
nd
Denm
ark
Kore
a
United S
tate
s
Icela
nd
Luxem
bourg
PrivatePublic
0
1
1
2
2
3
3
Uru
guay(2
)
Gre
ece
Bra
zil
Turk
ey
Irela
nd
Arg
entina(2
)
Spain
Japan
Slo
vak R
epublic
Czech R
epublic
Italy
Neth
erlands
Germ
any
Port
ugal
Austr
ia
Hungary
Sw
itzerland
Austr
alia
United K
ingdom
Canada(2
)
Pola
nd
Fin
land
Belg
ium
Fra
nce
Norw
ay
Mexic
o
CH
ILE
(3)
Sw
eden
New
Zeala
nd
Denm
ark
Kore
a
United S
tate
s
Icela
nd
Luxem
bourg
0
2
4
6
8
10
12
14
16
Uru
guay
Turk
ey
Gre
ece
Bra
zil
Irela
nd
Arg
entina
Spain
Czech R
epublic
Slo
vak R
epublic
Japan
Neth
erlands
Italy
Germ
any
Austr
ia
Austr
alia
Port
ugal
Canada
United K
ingdom
Hungary
Belg
ium
Fin
land
Fra
nce
Pola
nd
Sw
itzerland
Norw
ay
Sw
eden
Mexic
o
CH
ILE
New
Zeala
nd
Denm
ark
United S
tate
s
Kore
a
Icela
nd
Luxem
bourg
1. The solid horizontal lines refer to the OECD average, excluding the emerging-market economies within the OECD area (Czech Republic, Hungary, Korea, Mexico, Poland, Slovak Republic and Turkey). The dashed lines refer to the average of the emerging-market economies within the OECD area and the non-OECD countries included in the sample.
2. Refers to 2002 (2003 for Canada). 3. Refers to 2005.
Source: OECD (2005, 2006) and World Health Organisation and OECD calculations.
ECO/WKP(2008)14
8
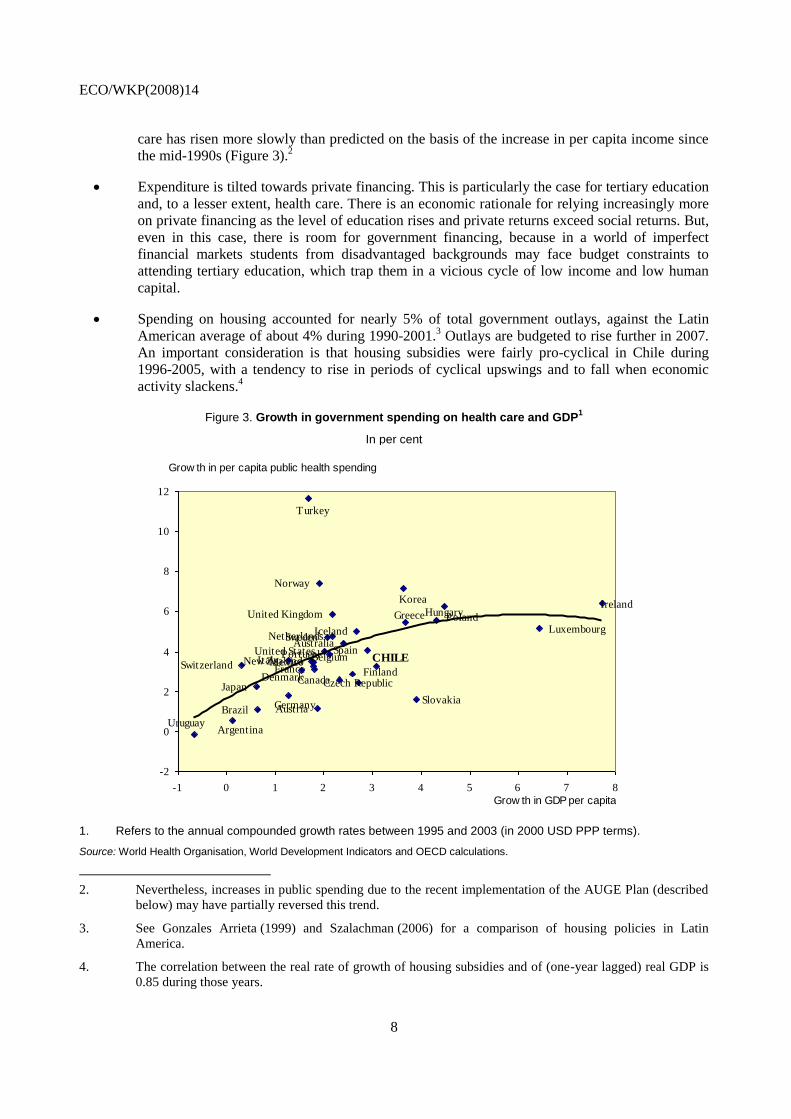
care has risen more slowly than predicted on the basis of the increase in per capita income since
the mid-1990s (Figure 3).2
Expenditure is tilted towards private financing. This is particularly the case for tertiary education
and, to a lesser extent, health care. There is an economic rationale for relying increasingly more
on private financing as the level of education rises and private returns exceed social returns. But,
even in this case, there is room for government financing, because in a world of imperfect
financial markets students from disadvantaged backgrounds may face budget constraints to
attending tertiary education, which trap them in a vicious cycle of low income and low human
capital.
Spending on housing accounted for nearly 5% of total government outlays, against the Latin
American average of about 4% during 1990-2001.3 Outlays are budgeted to rise further in 2007.
An important consideration is that housing subsidies were fairly pro-cyclical in Chile during
1996-2005, with a tendency to rise in periods of cyclical upswings and to fall when economic
activity slackens.4
Figure 3. Growth in government spending on health care and GDP1
In per cent
Uruguay
CHILE
Brazil
Argentina
United States
United Kingdom
Turkey
Switzerland
Sweden
Spain
Slovakia
Portugal
Poland
Norway
New Zealand
Netherlands
Mexico
Luxembourg
Korea
Japan
Italy
Ireland
Iceland
HungaryGreece
Germany
France FinlandDenmark
Czech RepublicCanada
Belgium
Austria
Australia
-2
0
2
4
6
8
10
12
-1 0 1 2 3 4 5 6 7 8
Grow th in per capita public health spending
Grow th in GDP per capita
1. Refers to the annual compounded growth rates between 1995 and 2003 (in 2000 USD PPP terms).
Source: World Health Organisation, World Development Indicators and OECD calculations.
2. Nevertheless, increases in public spending due to the recent implementation of the AUGE Plan (described
below) may have partially reversed this trend.
3. See Gonzales Arrieta (1999) and Szalachman (2006) for a comparison of housing policies in Latin
America.
4. The correlation between the real rate of growth of housing subsidies and of (one-year lagged) real GDP is
0.85 during those years.
ECO/WKP(2008)14
9
Recent policies: An overview
Education
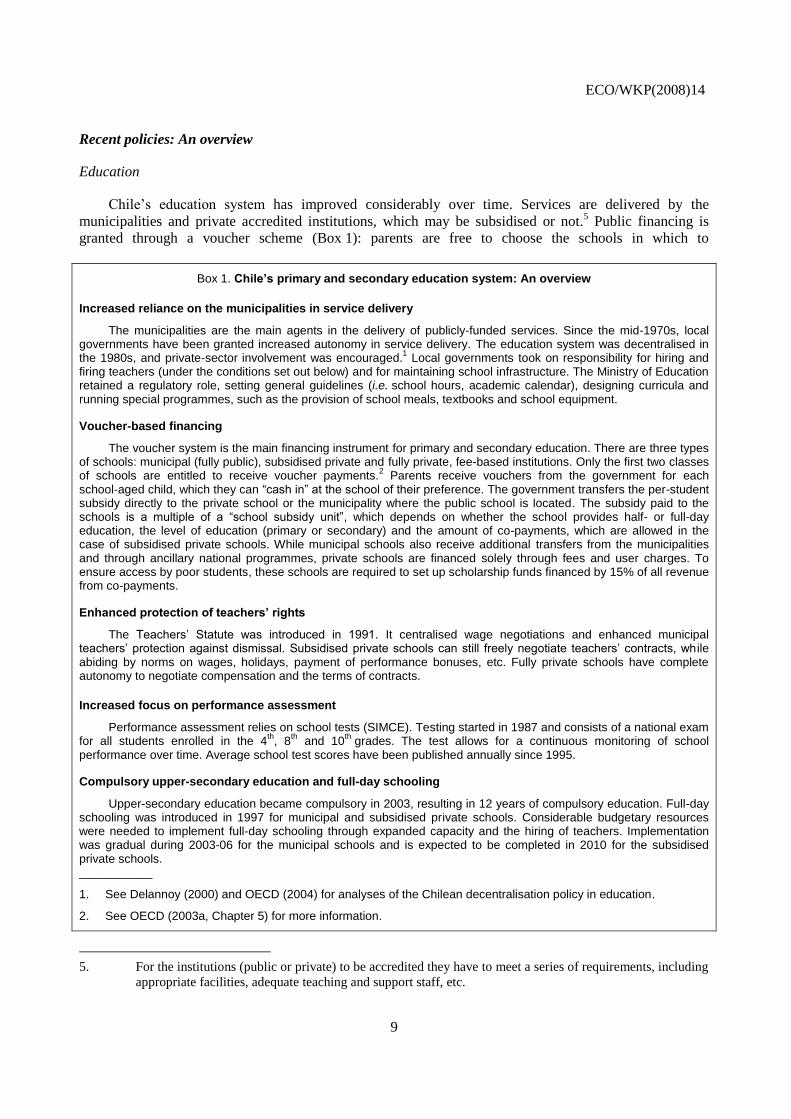
Chile’s education system has improved considerably over time. Services are delivered by the
municipalities and private accredited institutions, which may be subsidised or not.5 Public financing is
granted through a voucher scheme (Box 1): parents are free to choose the schools in which to
Box 1. Chile’s primary and secondary education system: An overview
Increased reliance on the municipalities in service delivery
The municipalities are the main agents in the delivery of publicly-funded services. Since the mid-1970s, local governments have been granted increased autonomy in service delivery. The education system was decentralised in the 1980s, and private-sector involvement was encouraged.
1 Local governments took on responsibility for hiring and
firing teachers (under the conditions set out below) and for maintaining school infrastructure. The Ministry of Education retained a regulatory role, setting general guidelines (i.e. school hours, academic calendar), designing curricula and running special programmes, such as the provision of school meals, textbooks and school equipment.
Voucher-based financing
The voucher system is the main financing instrument for primary and secondary education. There are three types of schools: municipal (fully public), subsidised private and fully private, fee-based institutions. Only the first two classes of schools are entitled to receive voucher payments.
2 Parents receive vouchers from the government for each
school-aged child, which they can “cash in” at the school of their preference. The government transfers the per-student subsidy directly to the private school or the municipality where the public school is located. The subsidy paid to the schools is a multiple of a “school subsidy unit”, which depends on whether the school provides half- or full-day education, the level of education (primary or secondary) and the amount of co-payments, which are allowed in the case of subsidised private schools. While municipal schools also receive additional transfers from the municipalities and through ancillary national programmes, private schools are financed solely through fees and user charges. To ensure access by poor students, these schools are required to set up scholarship funds financed by 15% of all revenue from co-payments.
Enhanced protection of teachers’ rights
The Teachers’ Statute was introduced in 1991. It centralised wage negotiations and enhanced municipal teachers’ protection against dismissal. Subsidised private schools can still freely negotiate teachers’ contracts, wh ile abiding by norms on wages, holidays, payment of performance bonuses, etc. Fully private schools have complete autonomy to negotiate compensation and the terms of contracts.
Increased focus on performance assessment
Performance assessment relies on school tests (SIMCE). Testing started in 1987 and consists of a national exam for all students enrolled in the 4
th, 8
th and 10
th grades. The test allows for a continuous monitoring of school
performance over time. Average school test scores have been published annually since 1995.
Compulsory upper-secondary education and full-day schooling
Upper-secondary education became compulsory in 2003, resulting in 12 years of compulsory education. Full-day schooling was introduced in 1997 for municipal and subsidised private schools. Considerable budgetary resources were needed to implement full-day schooling through expanded capacity and the hiring of teachers. Implementation was gradual during 2003-06 for the municipal schools and is expected to be completed in 2010 for the subsidised private schools. ___________
1. See Delannoy (2000) and OECD (2004) for analyses of the Chilean decentralisation policy in education.
2. See OECD (2003a, Chapter 5) for more information.
5. For the institutions (public or private) to be accredited they have to meet a series of requirements, including
appropriate facilities, adequate teaching and support staff, etc.
ECO/WKP(2008)14
10
enrol their children, and voucher payments are made directly by the central government to the
municipalities where the schools are located. Through the voucher scheme, public and private subsidised
schools compete for students (and voucher receipts), which has the potential for enhancing efficiency in
service delivery.
Empirical evidence suggests that the impact of competition on school performance in Chile is limited
(McEwan and Carnoy, 2000; Sapelli and Vial, 2002; Hsieh and Urquiola, 2003). It is often argued that the
transfer of voucher payments to the municipalities in a lump sum for all schools located in their
jurisdictions allows for cross-subsidisation among the schools, which weakens the incentive for bolstering
performance through competition within municipalities. Schools therefore seek to improve performance by
attracting better students, rather than by providing services more efficiently (Larrañaga, 2004). Problems
also arise from the demand side, because parents are not always able (or willing) to switch schools on the
basis of performance. Rather, practical considerations, such as school location, tend to play a determinant
role in choice, which reduces the scope for competition (Elacqua and Fabrega, 2004).
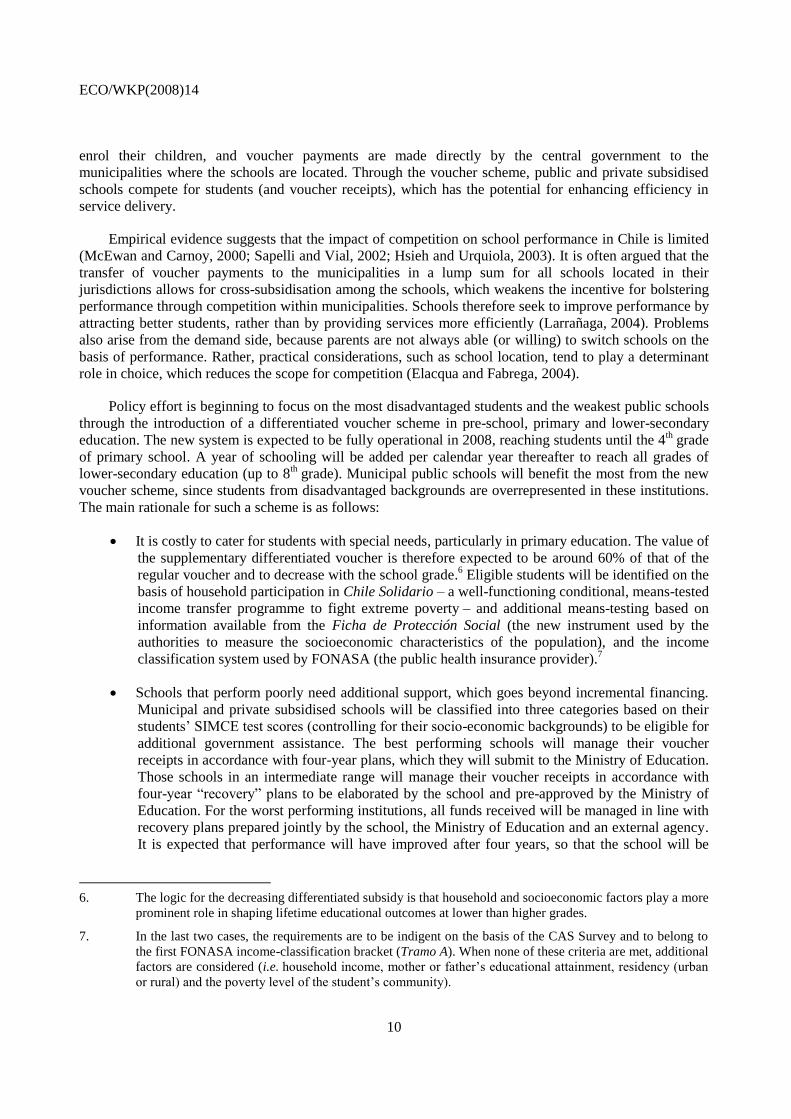
Policy effort is beginning to focus on the most disadvantaged students and the weakest public schools
through the introduction of a differentiated voucher scheme in pre-school, primary and lower-secondary
education. The new system is expected to be fully operational in 2008, reaching students until the 4th grade
of primary school. A year of schooling will be added per calendar year thereafter to reach all grades of
lower-secondary education (up to 8th grade). Municipal public schools will benefit the most from the new
voucher scheme, since students from disadvantaged backgrounds are overrepresented in these institutions.
The main rationale for such a scheme is as follows:
It is costly to cater for students with special needs, particularly in primary education. The value of
the supplementary differentiated voucher is therefore expected to be around 60% of that of the
regular voucher and to decrease with the school grade.6 Eligible students will be identified on the
basis of household participation in Chile Solidario – a well-functioning conditional, means-tested
income transfer programme to fight extreme poverty – and additional means-testing based on
information available from the Ficha de Protección Social (the new instrument used by the
authorities to measure the socioeconomic characteristics of the population), and the income
classification system used by FONASA (the public health insurance provider).7
Schools that perform poorly need additional support, which goes beyond incremental financing.
Municipal and private subsidised schools will be classified into three categories based on their
students’ SIMCE test scores (controlling for their socio-economic backgrounds) to be eligible for
additional government assistance. The best performing schools will manage their voucher
receipts in accordance with four-year plans, which they will submit to the Ministry of Education.
Those schools in an intermediate range will manage their voucher receipts in accordance with
four-year “recovery” plans to be elaborated by the school and pre-approved by the Ministry of
Education. For the worst performing institutions, all funds received will be managed in line with
recovery plans prepared jointly by the school, the Ministry of Education and an external agency.
It is expected that performance will have improved after four years, so that the school will be
6. The logic for the decreasing differentiated subsidy is that household and socioeconomic factors play a more
prominent role in shaping lifetime educational outcomes at lower than higher grades.
7. In the last two cases, the requirements are to be indigent on the basis of the CAS Survey and to belong to
the first FONASA income-classification bracket (Tramo A). When none of these criteria are met, additional
factors are considered (i.e. household income, mother or father’s educational attainment, residency (urban
or rural) and the poverty level of the student’s community).
ECO/WKP(2008)14
11
able to “graduate” from the programme after reaching the level of performance of those schools
in the performance category immediately above.
The authorities also intend to create an independent Superintendency of Education to boost the quality
of education services. Its main roles would be regulatory and supervisory. It would monitor school quality
and managerial standards and practices, therefore contributing to improving educational outcomes. The
Superintendency would also gather and disseminate information deemed relevant in the selection of
schools (e.g. test results at the school and student levels, indicators of teacher quality, information on the
institutions advising schools on pedagogical and technical matters). To perform its duties adequately, the
Superintendency would be staffed by highly-qualified individuals.
Health care
Chile’s health care system is characterised by the co-existence of private and public service providers
and insurers (Box 2). Insured individuals can seek treatment in public or private facilities, depending on
their insurance coverage and affordability of co-payments (which are required in private outlets). As in the
case of education, it is believed that competition among insurers and service providers enhances
performance. But, in fact, there is considerable segmentation in the market: around three-quarters of all
publicly insured individuals receive attention in public medical facilities, and a comparable share of
privately insured individuals receives attention in private facilities.8 Performance and service quality also
differ considerably between public and private medical facilities. Moreover, risk pooling is imperfect, as
private insurers still have considerable room for cream-skimming; as a result, risk is concentrated within
the public insurance and service delivery systems, which places a financial burden on the public budget.
Box 2. Chile’s health care system: An overview
The private and public insurers
The health care reform of the 1980s unbundled service delivery from insurance. Insurers can be private (Instituciones de Salud Previsional, ISAPRE) or public (Fondo Nacional de Salud, FONASA). Both the government and the private sector act as health care providers. Hospital management was decentralised to the regional level and primary health care to the municipalities. The Ministry of Health retained a regulatory role.
FONASA is financed by a payroll tax (7% for all wage earners) and direct financing from the government. Beneficiaries can choose to receive attention exclusively in public facilities under the Institutional Modality (Modalidad Institucional) of care, or in public or private facilities under the Free Choice Modality (Modalidad de Libre Elección) of care, where co-payments are required for service delivery in addition to the mandatory contribution. FONASA incorporates a solidarity mechanism by providing free insurance coverage to low-income individuals. To increase spending on vulnerable social groups, budgetary transfers to FONASA have been rising faster than mandatory contributions, reaching 54% of total FONASA revenue in 2005, up from 41% in 1990.
The private insurers (ISAPREs) are funded by the same 7% payroll tax plus surcharges for broader coverage and type of plan. ISAPREs can reject applications through a selection mechanism based on the insurance-holder’s socio-economic characteristics and family background (with the associated health risks). They are also free to change the cost and coverage of the plans yearly and have the right to restrict coverage during certain periods, although since 2005 price increases have been capped at 30% of the ISAPREs’ average tariff increase.
1 Pre-existent illnesses usually
have less complete coverage, and certain illnesses are not covered at all. As a result, coverage by ISAPREs is strongly associated with contribution capacity and the health risk of the individual or family group.
8. The share of FONASA beneficiaries receiving attention in private facilities (17.5% in 2003) is higher than
that of ISAPRE (private) policy-holders receiving attention in public outlets (7.4% in 2003). This is
because FONASA beneficiaries can choose to receive treatment in private facilities under the Free Choice
Modality of care (Modalidad de Libre Elección).
ECO/WKP(2008)14
12
FONASA beneficiaries accounted for 68% of the population in 2005 and ISAPRE affiliates for 16.3%. The remainder refers to the individuals who are not insured and to the army and police forces, which have their own health systems. Jointly with the ISAPREs, FONASA works under the supervision of the Health Insurance Regulatory Agency (Intendencia de Fondos y Seguros Previsionales de Salud), created in 1990.
The AUGE Plan
The AUGE plan (Acceso Universal con Garantías Explícitas en Salud) aims at increasing the health care coverage of the population (including diagnosis and treatment), improving the quality of services and limiting the financial burden of health care on households. AUGE was implemented in 2002 with three pathologies covered and was extended gradually to cover 56 of the most common pathologies in 2007, especially those more prevalent in poorer communities and with the highest impact on household budgets. The plan is set to be expanded further to cover 80 pathologies by 2010. AUGE does not discriminate on the basis of personal characteristics and is mandatory for certified providers in both the public and private sectors.
For each pathology covered by the plan, AUGE creates an entitlement for the insured in FONASA and ISAPREs: if treatment for a covered pathology is not received within a pre-determined time frame, the government is obliged to finance treatment in another hospital or clinic, private or public. AUGE also aims at guaranteeing quality through a certification mechanism by which only hospitals, clinics and medical facilities that comply with certain quality standards set by the Ministry of Health will be able to provide treatment for the pathologies covered.
AUGE sets ceilings on co-payments for both FONASA and ISAPREs at 20% of treatment costs. Diagnostics and treatments are provided free of charge to low-income individuals. When costs exceed two months’ salary, the beneficiary may request the insurer (FONASA or ISAPREs) to cover the full cost of co-payments.
To be granted access to AUGE, FONASA beneficiaries must seek attention in public primary health care units or hospitals. For those belonging to an ISAPRE, access is granted through a network of authorized health care providers. Outside this network, access is not guaranteed, and the individual is not covered. With the objective of increasing disease prevention, since 2005 FONASA and ISAPREs must cover a voluntary health check free of charge. The check includes laboratory tests, general health questions and a physical examination.
___________
1. For example, if the average tariff increase among the ISAPREs is 5%, then prices cannot rise by more than 6.5%.
The share of population with no health insurance almost halved during 1990-2003 to 7% (Ministry of
Planning, 2003a). Despite these achievements and in recognition of remaining shortcomings, recent policy
action has focused on two main areas:
The coverage of health care services has been broadened for low-income individuals through
AUGE, a plan introduced in 2002 to ensure treatment for a number of pre-selected pathologies
for all individuals, regardless of whether they are insured privately or publicly. AUGE creates an
entitlement for individuals to receive treatment for one of the pre-assigned pathologies within a
set time frame. The number of pathologies covered by AUGE is currently being extended, which
is expected to account for most of the increase in budgetary allocations for health care over the
medium term.
The private health insurance industry’s regulatory framework has been strengthened. Through the
2005 Law of ISAPREs (Ley Larga de Isapres) the scope for cream-skimming by private health
insurers has been reduced, and risk pooling has improved. The Ministry of Health now issues a
common list of pathologies and treatments that may be excluded from standard coverage, instead
of allowing the ISAPREs to set these exclusions freely. Also, pre-existing illnesses can now be
excluded from coverage only for an initial five-year period. Likewise, the ISAPREs are no
longer free to unilaterally terminate a contract with a policy-holder, except for a number of
special cases, including failure to declare a pre-existing illness. Moreover, the risk factors used
ECO/WKP(2008)14
13
by ISAPREs to price insurance policies are now regulated, and a ceiling was introduced on the
difference between minimum and maximum factors.9 Finally, an inter-ISAPRE solidarity fund
was created to facilitate risk-pooling among insurers holding low- and high-risk portfolios.
Housing policies: Design and effectiveness
Chile is a pioneer in Latin America in the design and implementation of housing subsidy programmes.
Publicly financed housing subsidies are demand-oriented, means-tested and granted through a scoring
mechanism based on the amount of pre-existing individual savings and household socio-economic
characteristics. Subsidies may also be complemented by mortgage loans from private financial institutions
(Box 3). The authorities are committed to bringing down the housing deficit (i.e. the difference between
the number of households and the housing stock), which almost halved between the end of the 1970s and
the beginning of the 2000s (Held, 2000; Ministry of Housing and Urban Planning, 2004), but remains
sizeable, at about 10-15% of the housing stock, or about 500 000 units. On the basis of current policies,
Chile’s housing deficit is projected to be eliminated in about 10 years.
Box 3. Housing policies in Chile: An overview
Housing policies are designed and carried out under the purview of the Ministry of Housing and Urban Planning (MINVU) and the Urban and Housing Service (SERVIU) agencies. MINVU manages the housing subsidy programmes at the national and regional levels, sets quality standards for social housing developments and provides collateral for subsidised mortgage operations. The SERVIUs operate at the local level and often act as an intermediary between MINVU and the subsidy applicants.
The old and new housing polices
Before the end of the 1970s, housing policy was conducted mainly through direct subsidised credit at a fixed nominal interest rate. Given the level of inflation prevailing at the time, real interest rates were often negative, which discouraged the development of a mortgage market (Pérez-Iñigo Gonzáles, 1999). Since then, housing policy has become demand-oriented and centred around the subsidy programmes discussed in the main text. Heads of households and single individuals who are not home-owners can apply for a housing subsidy on the basis of a scoring mechanism, whereby applicants are rated according to pre-existing savings and socio-economic characteristics (e.g. household size and composition, number of disabled people, etc.). Pre-existing savings are used to finance mortgage down-payments and can be made through a dedicated account at a private bank. In some cases, land can be used as down-payment in the absence of savings.
1
Income was not included among the set of socio-economic characteristics used in the scoring mechanism to allow individuals to select themselves into different programmes according to their preferences and willingness to pay. Increasing emphasis is being placed on means testing of applicants from the poorest segments of society; the Rural Housing Subsidy (Vivienda Rural) is being stepped up, and a new Solidarity Fund has been created.
2 Collective applications are also possible, so long as applicants are legally
organised as a group, such as a co-operative, and submit a housing project for consideration, including recreation areas, public infrastructure, etc. Since 2004, housing programmes targeted to middle-income individuals (Vivienda Básica, Programa Especial de Trabajadores, Sistema Unificado) are being merged under a programme called DS40. The Social Protection Survey (Ficha de Protección Social), which replaced the CAS Survey, is used to identify the target population.
3 Another element considered in the
evaluation process is the presence of elderly individuals in the household.
Individuals are eligible for the housing subsidy only once. The subsidy is granted directly to the beneficiary and can be cashed in by the property seller. The government itself commissions the construction of the housing development, and, in this case, the subsidy is implicit in the price of housing. Banks have been active in raising funds for mortgage purposes, by issuing debt and other financial instruments. In the second half of the 1990s, some 40 000 operations were conducted on a yearly basis for an average value of about USD 22 000 per unit.
___________
1. In spite of the switching to more market-oriented housing policies, MINVU continued to grant credits until 2001, when they were discontinued because of a comparatively high rate of non-performing loans.
2. The number of subsidies under the Solidarity Fund increased from about 2 200 in 2001 to more than 33 000 in 2005.
3. The CAS survey was the main instrument for targeting social programmes in Chile until mid-2007, including monetary transfers, social housing and others. The score was valid for two years. See Larrañaga (2005) for more information on the CAS survey.
9. Risk factors determine the cost of coverage and account for differences in gender and age. As such, premia
are higher during woman’s fertile period and for older people.
ECO/WKP(2008)14
14
The housing subsidy programme has encouraged private saving. Stable, clear rules have been
essential, but also the protection of contracts from inflation through comprehensive, backward-looking
indexation for the value of property, mortgage payments and accumulated savings. Nevertheless, the
market for small private mortgage loans remains small. High transactions costs in processing relatively
small mortgage contracts and high default rates make this market segment relatively unattractive to private
financial institutions. Access to mortgage loans for the poorest segments of society is now being facilitated
by government subsidies for administrative costs and guarantees for loans in the event of default.
The secondary housing market lacks liquidity. This is primarily because in most programmes,
subsidised housing cannot be sold during the initial five years after acquisition, thus reducing the scope for
home-owners to use their property as collateral for other mortgage operations, including for the purchase
of better-quality units. This “lock-in” effect is important, because subsidised housing built during
1990-2005 accounts for almost 30% of Chile’s housing stock. As noted in OECD (2005), this restriction
also discourages labour mobility, with undesirable consequences for the labour market. The authorities are
nevertheless relaxing these restrictions by now allowing homeowners to sell their subsidised property in
order to buy or build a new one (Programa para la Movilidad Habitacional), which will help to develop a
secondary housing market.
The targeting mechanism is being re-designed. Because the scoring mechanism attributes a high
weight to pre-existing savings, wealthier individuals end up receiving higher subsidies than poorer
individuals with limited saving capacity (Pérez-Iñigo Gonzáles, 1999). Recent measures are therefore
putting more weight on means-testing than accumulated savings, so that only households in the lower
income quintiles of the population are eligible for housing subsidies. As a result, the housing deficit of the
lowest income quintile is expected to be reduced from 150 000 to 50 000 units during 2006-10.
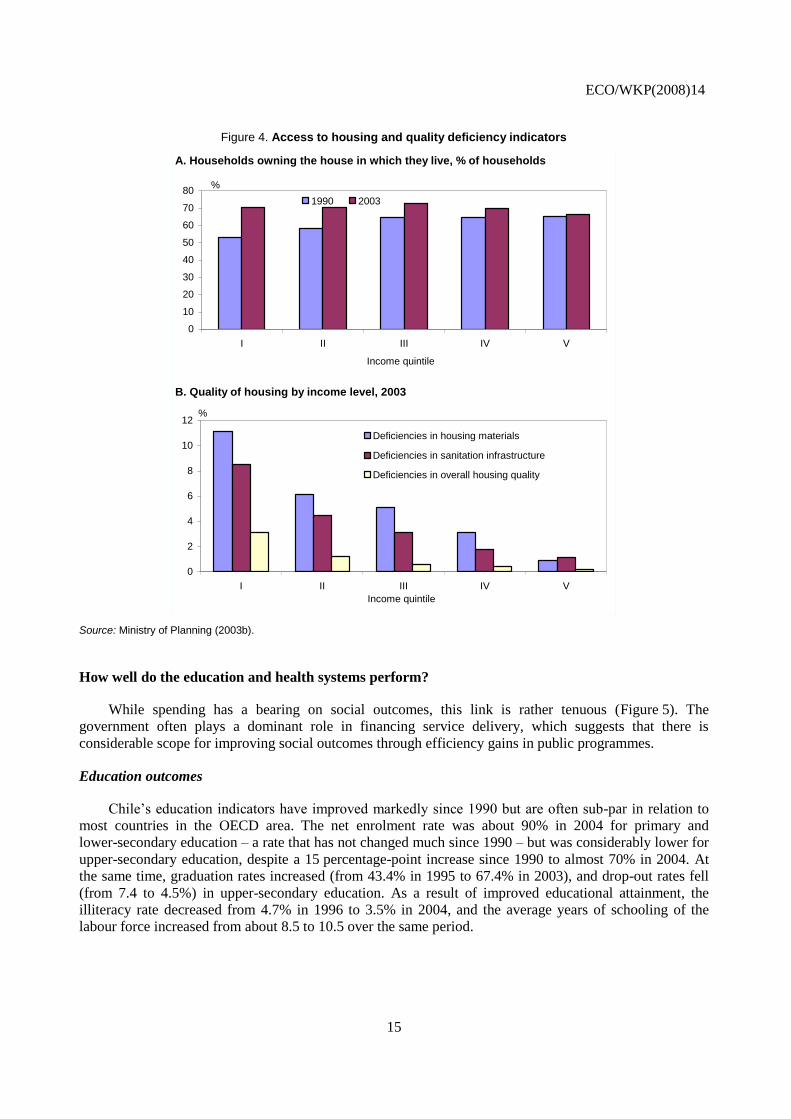
While access to housing has increased, especially for the poorest segments of the population, quality
deficiencies remain (Figure 4). New housing developments are located increasingly far from city centres
because of rising land prices, which have outpaced the increase in the real value of subsidies per housing
unit. As such, land costs almost doubled to about 60% of total housing costs, leading to a gradual reduction
in property size and the quality of construction. Overall, the Ministry of Housing and Urban
Planning (2004) estimates that some 670 000 units need upgrading (e.g. materials, sanitation, etc.) and that
some 500 000 units are overcrowded. Recent measures to close the qualitative housing deficit and to
reduce urban segregation include an increase in the value of the housing subsidy (by 20% per unit in real
terms in 2006) and improvements in public transportation and utility services, especially water and
sanitation. Programmes are also being implemented to improve the quality of the housing stock
(Protección del Patrimonio Familiar and Programa de Aseguramiento de la Calidad), to tighten the
accreditation of building societies and to launch a certification process for construction materials.
ECO/WKP(2008)14
15
Figure 4. Access to housing and quality deficiency indicators
A. Households owning the house in which they live, % of households
B. Quality of housing by income level, 2003
0
10
20
30
40
50
60
70
80
I II III IV V
Income quintile
%
1990 2003
0
2
4
6
8
10
12
I II III IV V
Income quintile
%
Deficiencies in housing materials
Deficiencies in sanitation infrastructure
Deficiencies in overall housing quality
Source: Ministry of Planning (2003b).
How well do the education and health systems perform?
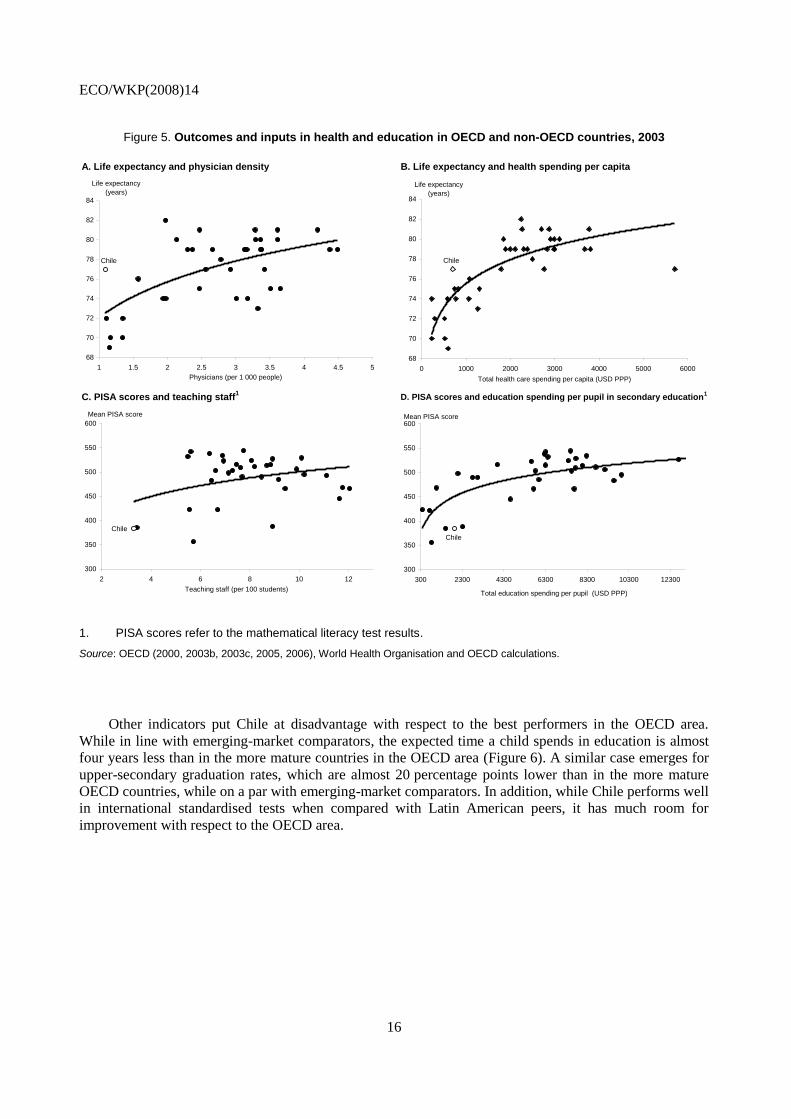
While spending has a bearing on social outcomes, this link is rather tenuous (Figure 5). The
government often plays a dominant role in financing service delivery, which suggests that there is
considerable scope for improving social outcomes through efficiency gains in public programmes.
Education outcomes
Chile’s education indicators have improved markedly since 1990 but are often sub-par in relation to
most countries in the OECD area. The net enrolment rate was about 90% in 2004 for primary and
lower-secondary education – a rate that has not changed much since 1990 – but was considerably lower for
upper-secondary education, despite a 15 percentage-point increase since 1990 to almost 70% in 2004. At
the same time, graduation rates increased (from 43.4% in 1995 to 67.4% in 2003), and drop-out rates fell
(from 7.4 to 4.5%) in upper-secondary education. As a result of improved educational attainment, the
illiteracy rate decreased from 4.7% in 1996 to 3.5% in 2004, and the average years of schooling of the
labour force increased from about 8.5 to 10.5 over the same period.
ECO/WKP(2008)14
16
Figure 5. Outcomes and inputs in health and education in OECD and non-OECD countries, 2003
A. Life expectancy and physician density B. Life expectancy and health spending per capita
C. PISA scores and teaching staff1
D. PISA scores and education spending per pupil in secondary education1
Chile
68
70
72
74
76
78
80
82
84
1 1.5 2 2.5 3 3.5 4 4.5 5
Physicians (per 1 000 people)
Life expectancy
(years)
Chile
68
70
72
74
76
78
80
82
84
0 1000 2000 3000 4000 5000 6000
Total health care spending per capita (USD PPP)
Life expectancy
(years)
Chile
300
350
400
450
500
550
600
2 4 6 8 10 12
Teaching staff (per 100 students)
Mean PISA score
Chile
300
350
400
450
500
550
600
300 2300 4300 6300 8300 10300 12300
Total education spending per pupil (USD PPP)
Mean PISA score
1. PISA scores refer to the mathematical literacy test results.
Source: OECD (2000, 2003b, 2003c, 2005, 2006), World Health Organisation and OECD calculations.
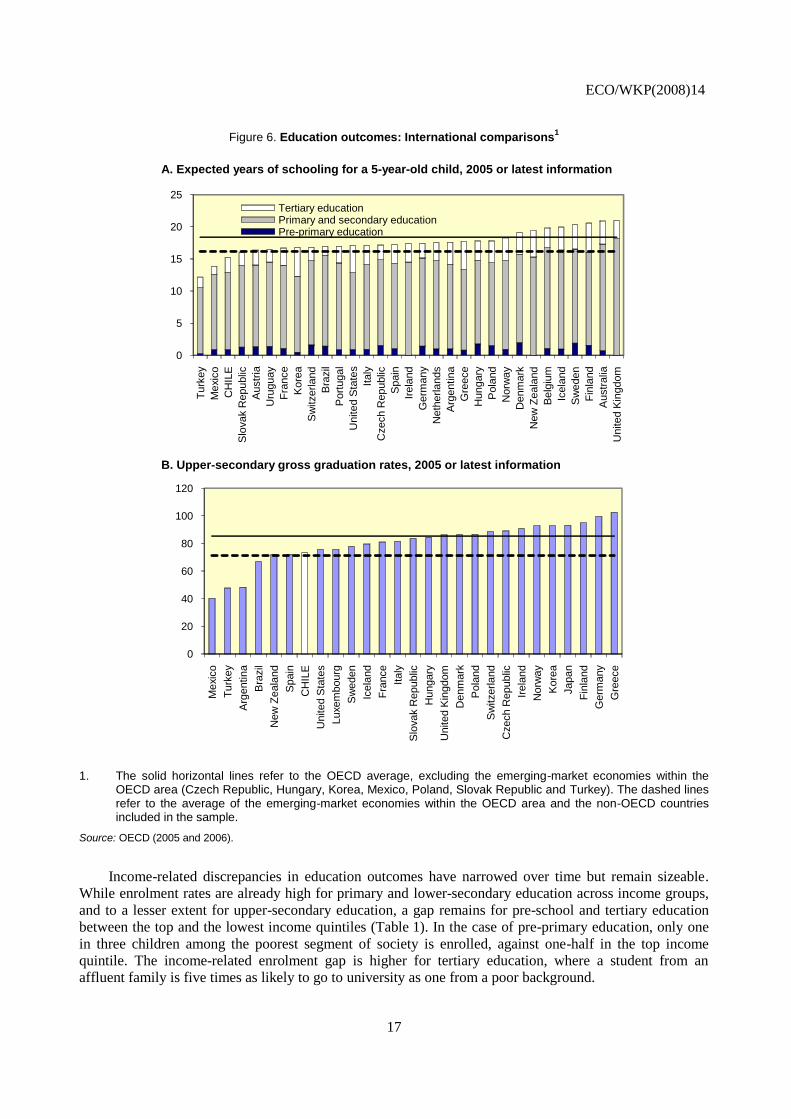
Other indicators put Chile at disadvantage with respect to the best performers in the OECD area.
While in line with emerging-market comparators, the expected time a child spends in education is almost
four years less than in the more mature countries in the OECD area (Figure 6). A similar case emerges for
upper-secondary graduation rates, which are almost 20 percentage points lower than in the more mature
OECD countries, while on a par with emerging-market comparators. In addition, while Chile performs well
in international standardised tests when compared with Latin American peers, it has much room for
improvement with respect to the OECD area.
ECO/WKP(2008)14
17
Figure 6. Education outcomes: International comparisons1
A. Expected years of schooling for a 5-year-old child, 2005 or latest information
B. Upper-secondary gross graduation rates, 2005 or latest information
0
5
10
15
20
25T
urk
ey
Mexic
o
CH
ILE
Slo
vak R
epublic
Au
str
ia
Uru
guay
Fra
nce
Ko
rea
Sw
itzerla
nd
Bra
zil
Port
ugal
Unite
d S
tate
s
Italy
Czech R
epublic
Spain
Irela
nd
Germ
any
Neth
erla
nds
Arg
entin
a
Gre
ece
Hungary
Pola
nd
Norw
ay
Denm
ark
New
Ze
ala
nd
Belg
ium
Icela
nd
Sw
eden
Fin
land
Austr
alia
United K
ingdom
Tertiary educationPrimary and secondary educationPre-primary education
0
20
40
60
80
100
120
Mexic
o
Tu
rkey
Arg
entin
a
Bra
zil
New
Ze
ala
nd
Spain
CH
ILE
United S
tate
s
Luxem
bourg
Sw
eden
Icela
nd
Fra
nce
Italy
Slo
vak R
epublic
Hungary
United K
ingdom
Den
ma
rk
Pola
nd
Sw
itzerland
Czech R
epublic
Irela
nd
Norw
ay
Kore
a
Japan
Fin
land
Germ
any
Gre
ece
1. The solid horizontal lines refer to the OECD average, excluding the emerging-market economies within the OECD area (Czech Republic, Hungary, Korea, Mexico, Poland, Slovak Republic and Turkey). The dashed lines refer to the average of the emerging-market economies within the OECD area and the non-OECD countries included in the sample.
Source: OECD (2005 and 2006).
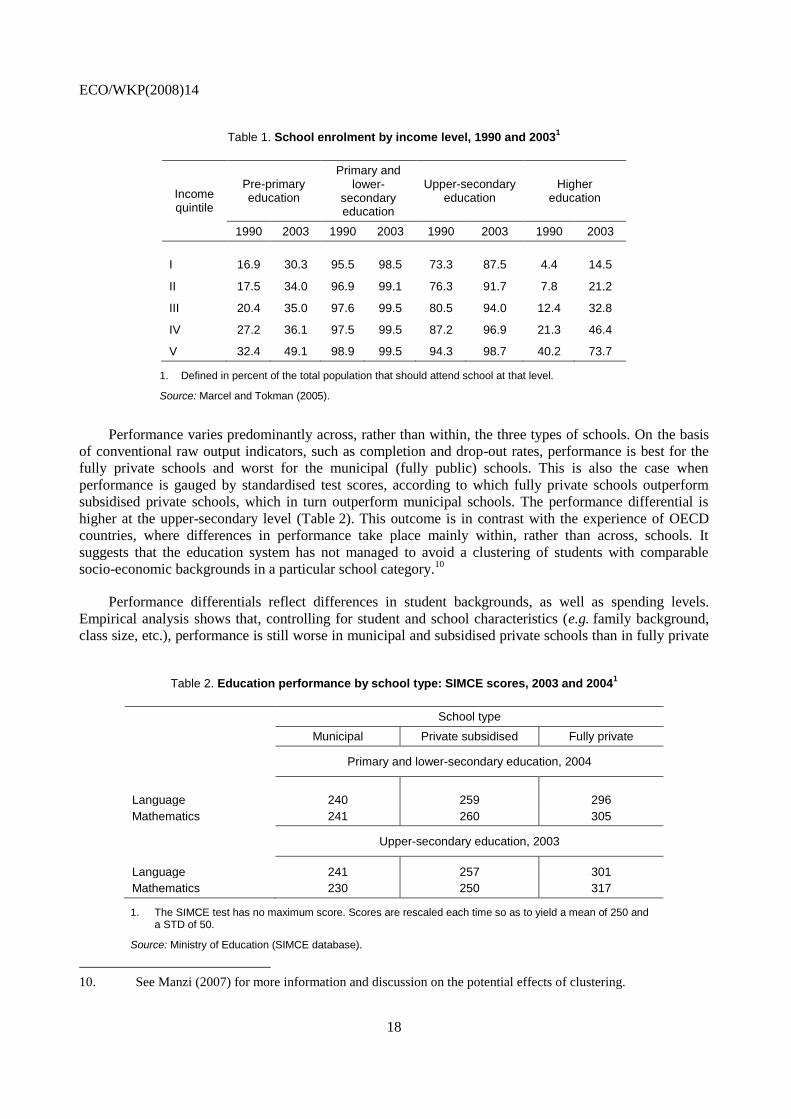
Income-related discrepancies in education outcomes have narrowed over time but remain sizeable.
While enrolment rates are already high for primary and lower-secondary education across income groups,
and to a lesser extent for upper-secondary education, a gap remains for pre-school and tertiary education
between the top and the lowest income quintiles (Table 1). In the case of pre-primary education, only one
in three children among the poorest segment of society is enrolled, against one-half in the top income
quintile. The income-related enrolment gap is higher for tertiary education, where a student from an
affluent family is five times as likely to go to university as one from a poor background.
ECO/WKP(2008)14
18
Table 1. School enrolment by income level, 1990 and 20031
Income quintile
Pre-primary education
Primary and lower-
secondary education
Upper-secondary education
Higher education
1990 2003 1990 2003 1990 2003 1990 2003
I 16.9 30.3 95.5 98.5 73.3 87.5 4.4 14.5
II 17.5 34.0 96.9 99.1 76.3 91.7 7.8 21.2
III 20.4 35.0 97.6 99.5 80.5 94.0 12.4 32.8
IV 27.2 36.1 97.5 99.5 87.2 96.9 21.3 46.4
V 32.4 49.1 98.9 99.5 94.3 98.7 40.2 73.7
1. Defined in percent of the total population that should attend school at that level.
Source: Marcel and Tokman (2005).
Performance varies predominantly across, rather than within, the three types of schools. On the basis
of conventional raw output indicators, such as completion and drop-out rates, performance is best for the
fully private schools and worst for the municipal (fully public) schools. This is also the case when
performance is gauged by standardised test scores, according to which fully private schools outperform
subsidised private schools, which in turn outperform municipal schools. The performance differential is
higher at the upper-secondary level (Table 2). This outcome is in contrast with the experience of OECD
countries, where differences in performance take place mainly within, rather than across, schools. It
suggests that the education system has not managed to avoid a clustering of students with comparable
socio-economic backgrounds in a particular school category.10
Performance differentials reflect differences in student backgrounds, as well as spending levels.
Empirical analysis shows that, controlling for student and school characteristics (e.g. family background,
class size, etc.), performance is still worse in municipal and subsidised private schools than in fully private
Table 2. Education performance by school type: SIMCE scores, 2003 and 20041
School type
Municipal Private subsidised Fully private
Primary and lower-secondary education, 2004
Language 240 259 296
Mathematics 241 260 305
Upper-secondary education, 2003
Language 241 257 301
Mathematics 230 250 317
1. The SIMCE test has no maximum score. Scores are rescaled each time so as to yield a mean of 250 and a STD of 50.
Source: Ministry of Education (SIMCE database).
10. See Manzi (2007) for more information and discussion on the potential effects of clustering.
ECO/WKP(2008)14
19
schools (Mizala et al., 2002). As for spending levels, in the case of primary and lower-secondary
education, spending per student was about 200% higher in fully private schools and 20% higher in
subsidised private schools than in municipal schools in 2003 (Marcel and Tokman, 2005). This suggests
that an increase in funding for the schools that tend to cater for disadvantaged students should go some
way to reducing the performance gap among school categories.
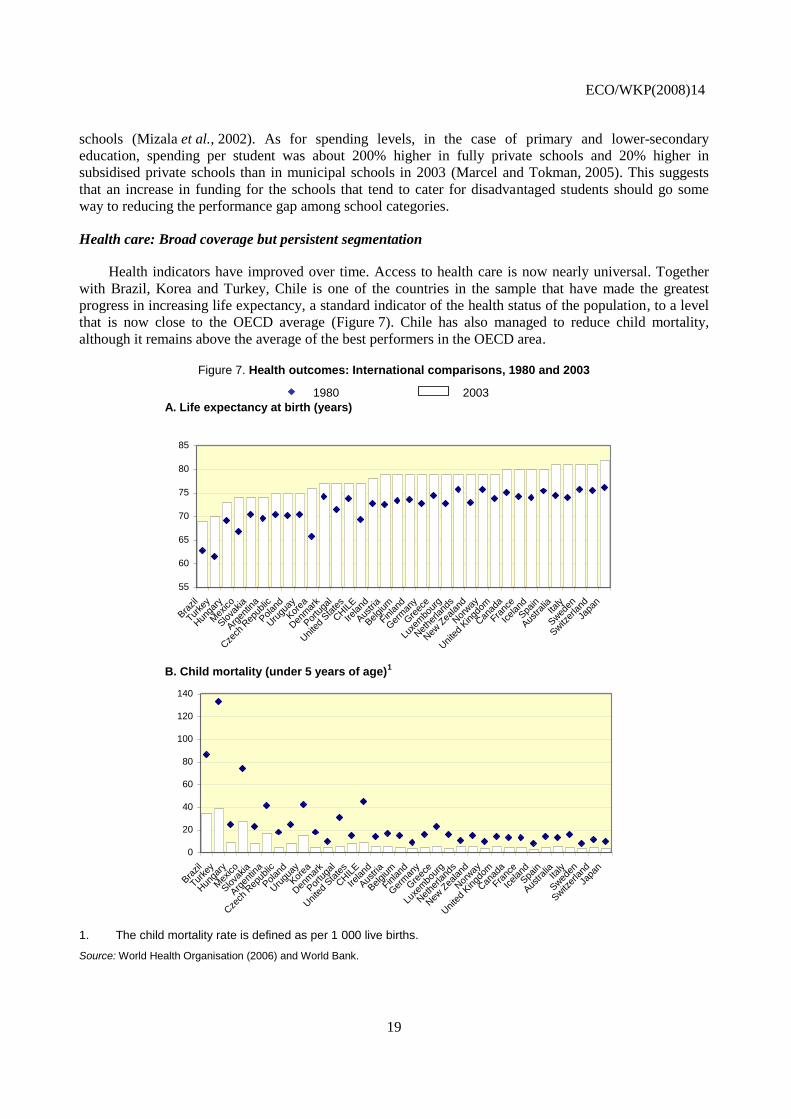
Health care: Broad coverage but persistent segmentation
Health indicators have improved over time. Access to health care is now nearly universal. Together
with Brazil, Korea and Turkey, Chile is one of the countries in the sample that have made the greatest
progress in increasing life expectancy, a standard indicator of the health status of the population, to a level
that is now close to the OECD average (Figure 7). Chile has also managed to reduce child mortality,
although it remains above the average of the best performers in the OECD area.
Figure 7. Health outcomes: International comparisons, 1980 and 2003
1980 2003
A. Life expectancy at birth (years)
B. Child mortality (under 5 years of age)1
55
60
65
70
75
80
85
Bra
zil
Turke
y
Hun
gary
Mex
ico
Slova
kia
Arg
entin
a
Cze
ch R
epub
lic
Polan
d
Uru
guay
Kor
ea
Den
mar
k
Por
tuga
l
Uni
ted
Sta
tes
CHIL
E
Ireland
Aus
tria
Belgium
Finland
Ger
man
y
Gre
ece
Luxe
mbo
urg
Net
herla
nds
New
Zea
land
Nor
way
Uni
ted
Kingd
om
Can
ada
Franc
e
Icelan
d
Spa
in
Aus
tralia
Italy
Swed
en
Switz
erland
Japa
n
0
20
40
60
80
100
120
140
Bra
zil
Turke
y
Hun
gary
Mex
ico
Slova
kia
Arg
entin
a
Cze
ch R
epub
lic
Polan
d
Uru
guay
Kor
ea
Den
mar
k
Por
tuga
l
Uni
ted
Sta
tes
CHIL
E
Ireland
Aus
tria
Belgium
Finland
Ger
man
y
Gre
ece
Luxe
mbo
urg
Net
herla
nds
New
Zea
land
Nor
way
Uni
ted
Kingd
om
Can
ada
Franc
e
Icelan
d
Spa
in
Aus
tralia
Italy
Swed
en
Switz
erland
Japa
n
1. The child mortality rate is defined as per 1 000 live births.
Source: World Health Organisation (2006) and World Bank.
ECO/WKP(2008)14
20
The health insurance market is segmented on the basis of socio-economic and risk characteristics. The
ISAPREs select comparatively healthier individuals through price discrimination, restricted coverage and
exclusion, whereas the riskier groups of the population, including low- to middle-income individuals, the
elderly and females, are overrepresented among FONASA beneficiaries. In 2003, 91% of individuals in the
lowest income quintile were insured by FONASA, whereas 51% of the top income quintile was insured by
an ISAPRE. In the same year, women accounted for 53% of FONASA beneficiaries and 49% of ISAPREs’
beneficiaries. As regards age, individuals of at least 60 years of age accounted for only 1% of ISAPREs’
beneficiaries and for about 13% of FONASA beneficiaries. As a result, both contributions and spending
per beneficiary substantially differ between FONASA and the ISAPREs, although this gap has narrowed
over time: spending per beneficiary was 1.7 times higher in the ISAPREs than in FONASA in 2005,
against 3.5 times in 1984.
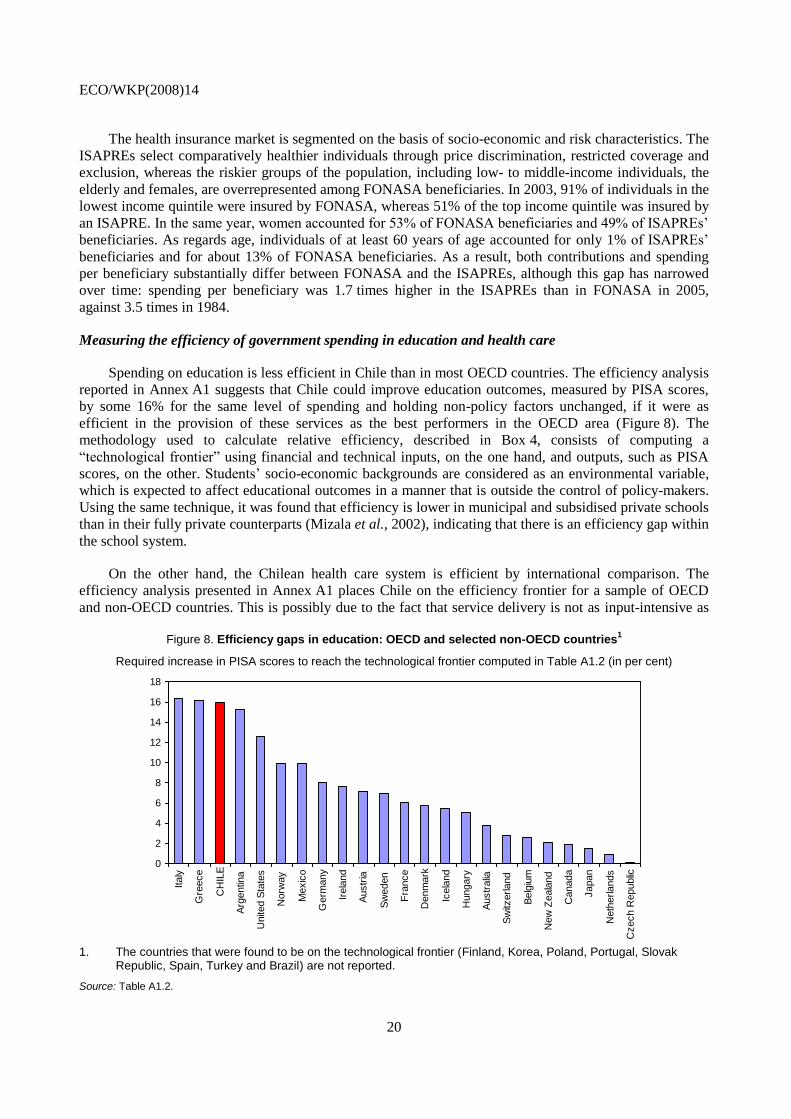
Measuring the efficiency of government spending in education and health care
Spending on education is less efficient in Chile than in most OECD countries. The efficiency analysis
reported in Annex A1 suggests that Chile could improve education outcomes, measured by PISA scores,
by some 16% for the same level of spending and holding non-policy factors unchanged, if it were as
efficient in the provision of these services as the best performers in the OECD area (Figure 8). The
methodology used to calculate relative efficiency, described in Box 4, consists of computing a
“technological frontier” using financial and technical inputs, on the one hand, and outputs, such as PISA
scores, on the other. Students’ socio-economic backgrounds are considered as an environmental variable,
which is expected to affect educational outcomes in a manner that is outside the control of policy-makers.
Using the same technique, it was found that efficiency is lower in municipal and subsidised private schools
than in their fully private counterparts (Mizala et al., 2002), indicating that there is an efficiency gap within
the school system.
On the other hand, the Chilean health care system is efficient by international comparison. The
efficiency analysis presented in Annex A1 places Chile on the efficiency frontier for a sample of OECD
and non-OECD countries. This is possibly due to the fact that service delivery is not as input-intensive as
Figure 8. Efficiency gaps in education: OECD and selected non-OECD countries
1
Required increase in PISA scores to reach the technological frontier computed in Table A1.2 (in per cent)
0
2
4
6
8
10
12
14
16
18
Italy
Gre
ece
CH
ILE
Arg
entin
a
Unite
d S
tate
s
Norw
ay
Mexic
o
Germ
any
Irela
nd
Austr
ia
Sw
eden
Fra
nce
Denm
ark
Icela
nd
Hungary
Austr
alia
Sw
itzerland
Belg
ium
New
Zeala
nd
Canada
Japan
Neth
erlands
Czech R
epublic
1. The countries that were found to be on the technological frontier (Finland, Korea, Poland, Portugal, Slovak
Republic, Spain, Turkey and Brazil) are not reported.
Source: Table A1.2.
ECO/WKP(2008)14
21
Box 4. Measuring efficiency in social spending
The efficiency analysis presented in Annex A1 consists of estimating an efficiency frontier for the delivery of education and health care services using financial and technical inputs. The analysis assesses the efficiency of government spending in different countries by comparing social outcomes with respect to the resources mobilised in service delivery.
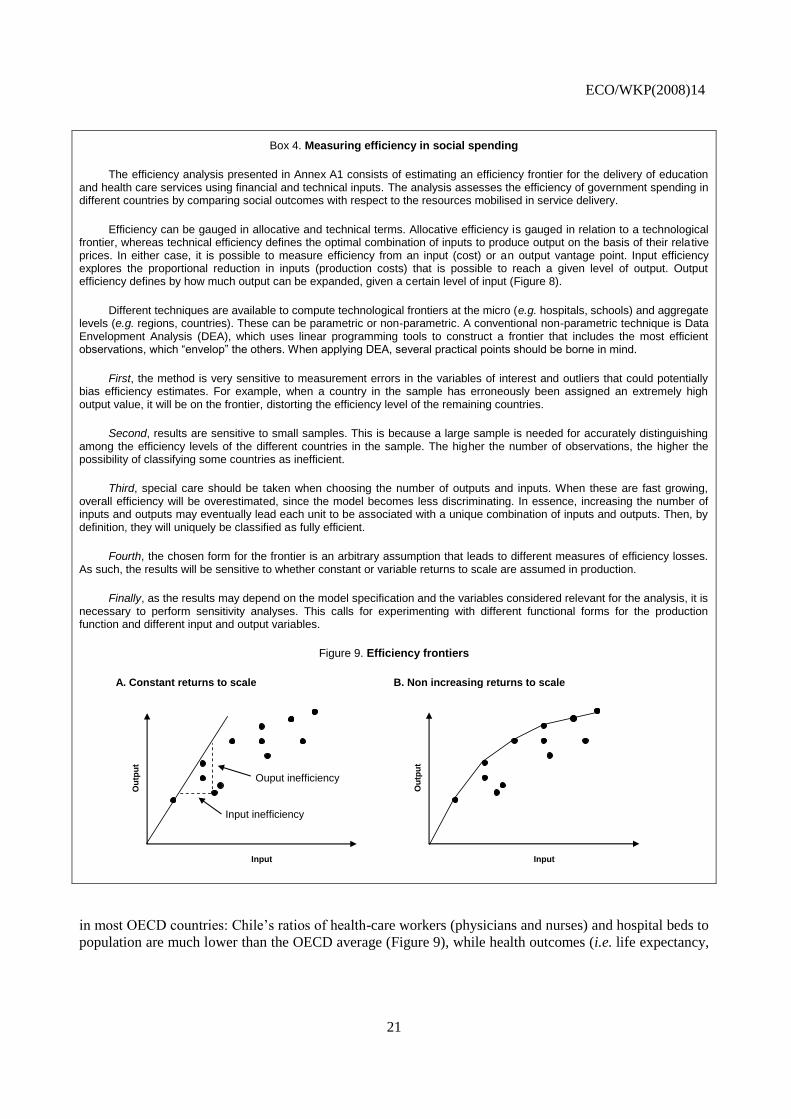
Efficiency can be gauged in allocative and technical terms. Allocative efficiency is gauged in relation to a technological frontier, whereas technical efficiency defines the optimal combination of inputs to produce output on the basis of their relative prices. In either case, it is possible to measure efficiency from an input (cost) or an output vantage point. Input efficiency explores the proportional reduction in inputs (production costs) that is possible to reach a given level of output. Output efficiency defines by how much output can be expanded, given a certain level of input (Figure 8).
Different techniques are available to compute technological frontiers at the micro (e.g. hospitals, schools) and aggregate levels (e.g. regions, countries). These can be parametric or non-parametric. A conventional non-parametric technique is Data Envelopment Analysis (DEA), which uses linear programming tools to construct a frontier that includes the most efficient observations, which “envelop” the others. When applying DEA, several practical points should be borne in mind.
First, the method is very sensitive to measurement errors in the variables of interest and outliers that could potentially bias efficiency estimates. For example, when a country in the sample has erroneously been assigned an extremely high output value, it will be on the frontier, distorting the efficiency level of the remaining countries.
Second, results are sensitive to small samples. This is because a large sample is needed for accurately distinguishing among the efficiency levels of the different countries in the sample. The higher the number of observations, the higher the possibility of classifying some countries as inefficient.
Third, special care should be taken when choosing the number of outputs and inputs. When these are fast growing, overall efficiency will be overestimated, since the model becomes less discriminating. In essence, increasing the number of inputs and outputs may eventually lead each unit to be associated with a unique combination of inputs and outputs. Then, by definition, they will uniquely be classified as fully efficient.
Fourth, the chosen form for the frontier is an arbitrary assumption that leads to different measures of efficiency losses. As such, the results will be sensitive to whether constant or variable returns to scale are assumed in production.
Finally, as the results may depend on the model specification and the variables considered relevant for the analysis, it is necessary to perform sensitivity analyses. This calls for experimenting with different functional forms for the production function and different input and output variables.
Figure 9. Efficiency frontiers
A. Constant returns to scale B. Non increasing returns to scale
Input
Ou
tpu
t
Input
Ou
tpu
t
Ouput inefficiency
Input inefficiency
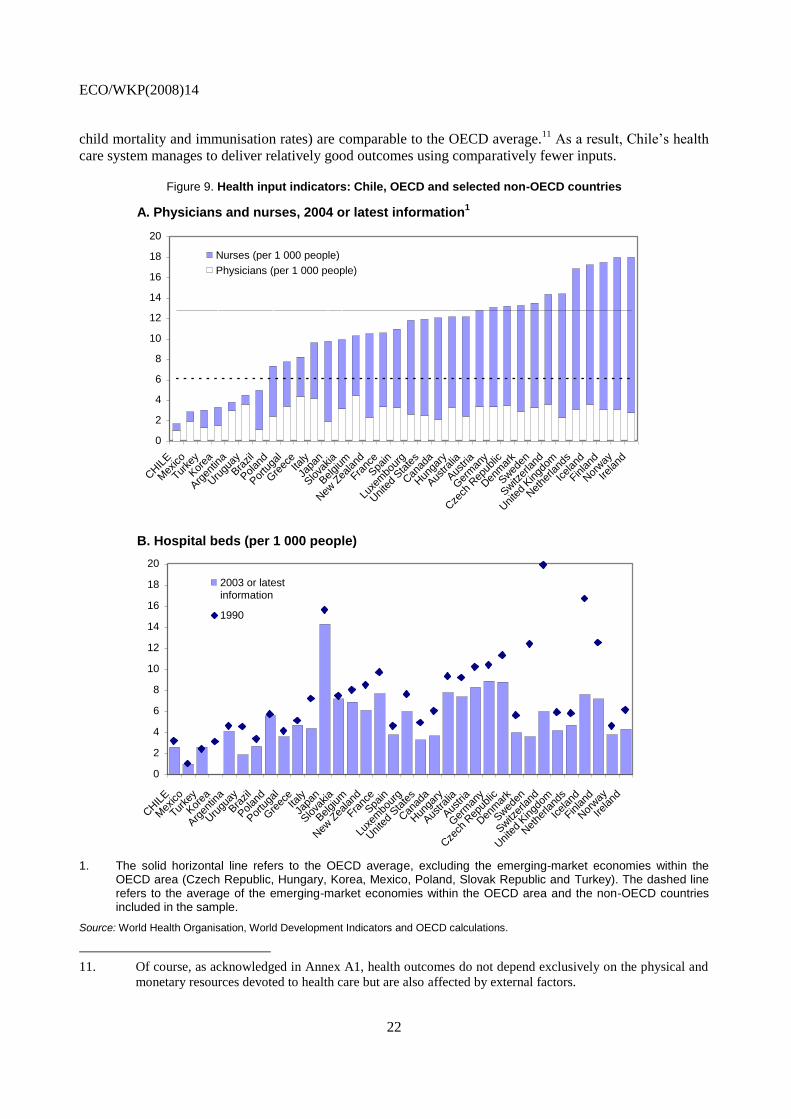
in most OECD countries: Chile’s ratios of health-care workers (physicians and nurses) and hospital beds to
population are much lower than the OECD average (Figure 9), while health outcomes (i.e. life expectancy,
ECO/WKP(2008)14
22
child mortality and immunisation rates) are comparable to the OECD average.11
As a result, Chile’s health
care system manages to deliver relatively good outcomes using comparatively fewer inputs.
Figure 9. Health input indicators: Chile, OECD and selected non-OECD countries
A. Physicians and nurses, 2004 or latest information1
B. Hospital beds (per 1 000 people)
0
2
4
6
8
10
12
14
16
18
20
CHIL
E
Mex
ico
Turke
y
Kor
ea
Arg
entin
a
Uru
guay
Bra
zil
Polan
d
Por
tuga
l
Gre
eceIta
ly
Japa
n
Slova
kia
Belgium
New
Zea
land
Franc
e
Spa
in
Luxe
mbo
urg
Uni
ted
Sta
tes
Can
ada
Hun
gary
Aus
tralia
Aus
tria
Ger
man
y
Cze
ch R
epub
lic
Den
mar
k
Swed
en
Switz
erland
Uni
ted
Kingd
om
Net
herla
nds
Icelan
d
Finland
Nor
way
Ireland
Nurses (per 1 000 people)
Physicians (per 1 000 people)
0
2
4
6
8
10
12
14
16
18
20
CHIL
E
Mex
ico
Turke
y
Kor
ea
Arg
entin
a
Uru
guay
Bra
zil
Polan
d
Por
tuga
l
Gre
eceIta
ly
Japa
n
Slova
kia
Belgium
New
Zea
land
Franc
e
Spa
in
Luxe
mbo
urg
Uni
ted
Sta
tes
Can
ada
Hun
gary
Aus
tralia
Aus
tria
Ger
man
y
Cze
ch R
epub
lic
Den
mar
k
Swed
en
Switz
erland
Uni
ted
Kingd
om
Net
herla
nds
Icelan
d
Finland
Nor
way
Ireland
2003 or latestinformation
1990
1. The solid horizontal line refers to the OECD average, excluding the emerging-market economies within the OECD area (Czech Republic, Hungary, Korea, Mexico, Poland, Slovak Republic and Turkey). The dashed line refers to the average of the emerging-market economies within the OECD area and the non-OECD countries included in the sample.
Source: World Health Organisation, World Development Indicators and OECD calculations.
11. Of course, as acknowledged in Annex A1, health outcomes do not depend exclusively on the physical and
monetary resources devoted to health care but are also affected by external factors.
ECO/WKP(2008)14
23
Challenges and policy recommendations
Much has been done to strengthen social policies in Chile over the years. Public spending levels have
increased and outcomes have improved. The focus of social policies is now shifting away from ensuring
access by the population to basic services – a policy objective that has by and large been achieved –
towards improving quality and removing extant access barriers for the most disadvantaged groups in
society.12
This, coupled with a strengthening of social protection, is paving the way for further
improvements in Chile’s social indicators in the years to come. The main policy challenge Chile will need
to face in this area is to ensure that the planned increases in government spending on social programmes
are implemented in a cost-efficient, fiscally sustainable manner so as to yield commensurate improvements
in social outcomes. This is particularly the case of education, where there is much room for raising
efficiency in service delivery to the level of the best performers in the OECD area.
Closing the student performance gap
Options for reducing performance differentials among the students with varying socio-economic
backgrounds should feature prominently on the government’s education policy agenda. Catering for
students from disadvantaged socio-economic backgrounds, who are over-represented in the municipal
school network, is costly, which places a financial burden on these schools. The differentiated voucher
scheme can do much to bridge this financial and performance gap. But, at present, there is no empirical
study on service delivery costs in the Chilean education system, which makes it difficult to assess whether
or not the value of the differentiated voucher will be adequate to compensate for higher provision costs.
The authorities are advised to closely monitor the functioning of the new system and to make the necessary
adjustments to guarantee that incremental resources deliver better educational outcomes. Once the new
system has been fully implemented and the initial results have been assessed, the possibility of extending
the differentiated voucher to upper-secondary education could be considered as a further step.
Spending per pupil differs substantially among different types of school. An important feature of the
Chilean education system is that it allows subsidised private schools to charge co-payments in addition to
the financial support they receive from the government through the voucher scheme. As an effort to
equalise spending needs across schools, the mechanism to withdraw public support from the subsidised
private schools in tandem with the collection of co-payments could be improved by raising the withdrawal
coefficient in a progressive manner, so that the coefficient would be higher the higher the share of
co-payments.
An increase in teachers’ compensation alone may not yield the expected improvement in outcomes
unless accompanied by measures to improve the quality of teaching, as noted in OECD (2004 and 2005).
This can be achieved through training programmes for both teaching and managerial personnel. An early
retirement programme, which is being considered, would also contribute to creating room in the system for
younger, better trained teachers. It is nevertheless important to make sure that the resources allocated to
funding teacher training programmes are well spent. An accreditation system for training institutions
should therefore be put in place and administered under the purview of the Ministry of Education. Options
for strengthening the link between teachers’ compensation and performance could also be considered as a
12. Estimations available from the Ministry of Planning for 2003 show that, if social spending (i.e. education,
health care and income transfers, such as the household subsidy, the water subsidy and unemployment
insurance) is imputed into the beneficiary population’s income, the income of households in the lowest
quintile almost doubles and that of households in the second quintile rises by 20% (Ministry of
Planning, 2004).
ECO/WKP(2008)14
24
means of encouraging human capital accumulation, especially in municipal and subsidised private schools,
where teachers are relatively less favourable to performance evaluations.13
The recovery plans that underperforming schools will have to devise need to be considered useful by
school managers. In this area, follow-up and political resolve are essential. For a plan to be credible, its
implementation should be assessed on a timely and frequent basis, which may overstretch the Ministry of
Education’s capacity. An appropriate assessment, including the costing, of the demands on the central
government associated with this requirement should therefore be carried out before the system is fully
operational in 2008. Also, some schools may perceive the need for approval by the Ministry of Education
of their recovery plans as micromanagement on the part of the central government or as a device to exert
control by the centre over municipal policies. Ministry of Education officials are therefore advised to work
closely with their municipal counterparts to allay such concerns, should they arise.
The additional resources allocated to the municipalities through the differentiated voucher scheme
should not substitute for locally raised funds. The municipalities can use voucher receipts freely and top up
grants with their own budgetary revenue. In 2005, municipal funds accounted for just over 12% of total
spending on education. But, because transfers are fungible, increases in voucher receipts may well
substitute for locally raised funds, leaving overall spending unaltered. To prevent this from happening, a
matching-grant mechanism could be considered in parallel with the introduction of differentiated vouchers.
Moreover, switching the direct transfer of voucher receipts from municipalities to schools would eliminate
the potential for cross-subsidisation among the schools within a municipality, therefore increasing
contestability and boosting performance.
Of course, for a shift in the allocation of voucher receipts to stimulate efficiency-enhancing
competition, it is important to grant the municipal schools greater managerial autonomy. Because the
Teachers’ Statute calls for centralised, nation-wide wage negotiations, and because there are restrictions on
personnel management, it is difficult for schools to compete on the basis of enhanced efficiency in the use
of inputs, which is at odds with the spirit of the voucher system. This is particularly important, because the
wage bill accounts for the lion’s share of municipal school budgets. The possibility of decentralising wage
setting to the municipal or regional levels and making personnel management more flexible would go in
the direction of enhancing managerial autonomy at the school level.
Competition depends crucially on the availability of information on student and school performance.
The Ministry of Education should therefore disseminate such information. The publication of SIMCE
scores at the school level is a useful step in this respect. But more is needed to raise parents’ awareness of
the scope for boosting school performance through competition, since many parents do not consider it a
key variable when selecting a school for their children. The announced creation of a Superintendency for
Education is therefore welcome, because it would contribute to improving the quality and quantity of
information available in the education system, while setting and enforcing quality standards in service
delivery.
The differentiated voucher scheme’s emphasis on non-performing schools is commendable, but
options for rewarding top performers should be strengthened at the same time. SNED (Sistema Nacional de
Evaluación de Desempeño de los Establecimientos Educacionales Subvencionados) – a national system
that has been in place since 1996 to monitor performance by municipal and private subsidised schools – is
being used to this end and preliminary evidence shows that it has a positive impact on performance. SNED
focuses not only on measuring student performance (through SIMCE scores), but also on teaching
13. See Mizala and Romaguera (2004) for more information based on opinion surveys. Also, in 2005 some
5 000 municipal teachers did not accept to be evaluated by a compulsory performance evaluation
programme put in place in 2003.
ECO/WKP(2008)14
25
innovation, work conditions, parents’ involvement in school management, student accessibility and
retention, etc.14
Information is subsequently used to construct a performance index per school and for
comparator groups of schools at the regional level using as clustering features the geographical location of
the school (urban or rural), its level of education (primary, lower secondary, etc.) and the income and the
level of education of students’ parents, among others. The index is calculated by an external institution, the
Centre for Applied Economics of the University of Chile. Currently, the best performing institutions
receive as a reward additional resources for two years, which are distributed as bonuses among teachers.
Public finances permitting, it would be advisable to strengthen this system by introducing rewards for the
schools that manage to “graduate” following successful implementation of their recovery plans using
SNED.
There is room for removing access barriers to selected education services, notably pre-primary and
tertiary education, for vulnerable social groups. In the case of pre-primary education, an extension of
public provision is often constrained by the financial burden it would place on the budget. This is the case
even among the wealthiest countries in the OECD area. But there is evidence suggesting that the presence
of children aged less than six years in a household is an important deterrent to women’s participation in the
labour market. The cost of public provision will therefore need to be assessed against the benefit of
increasing labour supply among prime-age women. As mentioned above, the supply of pre-school
education services has increased considerably over the years. With regards to higher education, there is
room for raising government spending from a level that is currently well below the OECD average and in
comparator countries in Latin America. For example, the number of recently created Excellence
Scholarships (Beca de Excelencia), which are currently granted to the top 5% performers in
upper-secondary education belonging to the first four income quintiles and having attended municipal or
subsidised private schools, could be increased. As noted in OECD (2005), another way of favouring access
is through means-tested student loans with government collateral (Sistema Crédito Estudios Superiores),
which are available from 2006. Budget restrictions permitting, government support to the Solidarity Funds
(Fondos de Crédito Solidario) administered by the universities could also be bolstered if actions are taken
in order to improve the system’s efficiency.
Boosting the efficiency of health care programmes
There is scope for improving risk pooling in health insurance. The main provisions of the 2005 Law
of ISAPREs go in this direction, especially through the creation of the Solidarity Compensation Fund
among private insurers, which mitigates incentives for cream-skimming within this industry segment. But
there is little risk pooling between the ISAPREs and FONASA. As a result, to the extent that risk is
concentrated in FONASA, the current system puts an undue burden on the budget. Previous reforms
considered the need to remedy this situation, but progress has so far been timid. The option of extending
the Solidarity Compensation Fund to FONASA should therefore be considered.
Competition should be enhanced between the public and private health care providers as a means of
fostering efficiency. Despite efforts towards unbundling, there remains a close link between insurance and
service delivery, since most FONASA beneficiaries receive treatment in public hospitals and most
ISAPRE policy-holders rely on private medical facilities. The main deterrent to competition among
ISAPREs is the higher level of co-payments policy-holders need to make to receive treatment in
non-authorised or non-insured facilities. In FONASA, competition is limited by a combination of
restrictions for beneficiaries to remain in the public sector (under the “Institutional Modality” of care), and
through higher co-payments in selected private health care providers with which FONASA has an
agreement (under the “Free Choice Modality” of care). This makes treatment in private hospitals and
clinics substantially more expensive for low- and middle-income individuals. The option of equalising the
14. See Mizala and Romaguera (2004) for more information.
ECO/WKP(2008)14
26
level of co-payments for both ISAPRE and FONASA beneficiaries for homogeneous services provided by
public and private providers would go in the direction of removing obstacles to competition. It would be
advisable, however, that the level of co-payments reflect marginal service-delivery costs, so as to avoid the
introduction of informal cost recovery if co-payments are set at unrealistic levels. Also, FONASA could
consider relaxing mobility restrictions for beneficiaries under the Institutional Modality of care. In this
case, the impact that this measure might have on the cost of insurance coverage would need to be carefully
evaluated. The fact that the proportion of ISAPRE beneficiaries receiving treatment in public hospitals has
risen over time, although it remains small, may indicate that public institutions are ready to compete.
Improvements in budgeting may boost efficiency in public hospitals. Financing has been traditionally
provided through historic budgeting, especially for recurrent outlays, such as payroll, and, to a lesser
extent, per-act billing (Facturación por Atención Prestada, FAP), mainly for materials and medical inputs.
Because it is well known that this budgeting mechanism discourages efficiency, efforts have been made to
strengthen the link between budgetary allocations and performance. The intention is to gradually replace
historical budgeting and FAP by diagnosis-related (Pagos Asociados a Diagnósticos, PAD) and
prospective payments (Pagos Prospectivos por Prestaciones, PPP). PAD links financing and outcomes by
providing fixed payments in advance per diagnosis for pre-specified interventions, and PPP is a payment
mechanism for treatments not included in PAD, which have no pre-specified reimbursement, and when
differences arise between diagnostic-based costing and the effective treatment received. Application of the
PAD-PPP system is still limited; it would therefore be advisable to broaden the range of treatments that can
be financed through the system, while continuing to evaluate its functioning to make sure that more budget
flexibility results in higher efficiency.
Competition among medical outlets could be enhanced through regular service satisfaction surveys.
Information is limited, but a survey conducted in 2003 shows that satisfaction is considerably lower in
public facilities (hospital and municipal units) than in their private counterparts (Ministry of
Planning, 2003a). Once remaining institutional constraints have been removed, the scope for boosting
competition among medical facilities on the basis of perceived quality should not be underestimated. In
this case, the results of satisfaction surveys should be disseminated broadly, including through the health
care insurers, so as to enhance societal control over service delivery.
Facilitating access to better housing for vulnerable social groups
Chile is a pioneer in designing and implementing housing subsidy programmes in Latin America. The
current focus on the most vulnerable segments of the population is welcome, because the housing deficit,
estimated at 10-15% of the housing stock, is concentrated among the poor: the lowest income quintile of
the population accounts for almost 40% of the quantitative deficit (almost 70% for the lowest and second
income quintiles). This policy focus has the merit of benefiting informal-sector workers, who have limited
access to non-subsidised mortgage loans. At the same time, the policy objective of reducing the qualitative
housing deficit and urban segregation are both sensible. The authorities are addressing this challenge by
raising the value of the housing subsidy and quality standards. The recent announcement of a housing debt
cancellation under certain conditions and for some programmes also goes in the direction of benefiting
mainly the most vulnerable groups.15
While there is some rationale for debt forgiveness in some cases,
including in the case of properties with construction deficiencies, the authorities should be careful not to
15. Debt cancellation is automatic for owners of properties with construction deficiencies, those who obtained
housing loans before 1977 and those for whom outstanding debt is lower than 15 UFs. For home-owners
who have reimbursed more than 50% of the loan, debt cancellation requires payment of 12 UFs, while for
those who have reimbursed less than 50% of their loans but never incurred payment arrears cancellation
requires payment of 18 UFs. Finally, those who have reimbursed less than 50% but have outstanding
payment arrears are required to pay 24 UFs to benefit from debt forgiveness.
ECO/WKP(2008)14
27
introduce an element of arbitrariness in a system that has traditionally operated with clear and predicable
rules.
The expansion of the housing subsidy programmes may affect land prices. To a certain extent, this is
beyond the authorities’ control, because an increase in the demand for housing associated with an
expansion of subsidy programmes will inevitably put upward pressure on land prices, especially in new
housing development areas. The authorities should therefore consider the possibility of using public land,
where available and zoning and environmental restrictions permitting, for new housing developments. But,
because the stock of public land that could be used for social housing may soon be exhausted, the option of
buying land in advance to be subsequently used for social housing developments should also be
considered. In any case, when assessing the economic viability of new housing developments, it is
important to balance the cost of land, which is higher near city centres, with that of extending urban and
transport infrastructure to new areas.
A reduction in the qualitative housing deficit requires better coordination among different
policy-makers in charge of urban planning, transport, public works and environment, at the central
government level, as well as in the municipalities. It is especially important to make sure that the housing
developments financed through the Solidarity Fund do not perpetuate urban segregation and social
exclusion. Improving access to services, such as medical facilities, schools and public transport, together
with urban amenities and better recreational areas outside the housing estates, is important for raising
living standards outside the city centres.
ECO/WKP(2008)14
28
Bibliography
ADB (2006), Key Indicators 2006: Measuring Policy Effectiveness in Health and Education, Asian
Development Bank, Mandaluyong City, Philippines.
Afonso, A. and M. St. Aubyn (2006), “Cross-Country Efficiency of Secondary Education Provision: A
Semi-Parametric Analysis with Non-Discretionary Inputs”, Economic Modelling, Vol. 23,
pp. 476-91.
Cutler, D. and A. Lleras-Muney (2006), “Education and Health: Evaluating Theories and Evidence”,
NBER Working Paper, No. 12352, National Bureau of Economic Research, Cambridge, MA.
de Mello, L. (2000), “Social Spending in Brazil: Education and Health Care”, Brazil: Selected Issues and
Statistical Appendix, Chapter 4, International Monetary Fund, Washington, D.C.
Delannoy, F. (2000), “Education Reforms in Chile, 1980-98: A Lesson in Pragmatism”, Education Reform
and Management Publication Series, Vol. I, No. 1, World Bank, Washington, D.C.
Di Gresia, L. (2000), “Medidas de Eficiencia Relativa en el Sector Público Local”, Cuaderno de
Economía, No. 39, Ministry of Economy, Buenos Aires Province, La Plata, Argentina.
Elacqua, G. and R. Fabrega (2004), “El Consumidor de la Educación: El Actor Olvidado de la Libre
Elección de Escuelas en Chile”, Unpublished manuscript, Adolfo Ibáñez University, Santiago, Chile.
Gonzales Arrieta, G.M. (1999), “Access to Housing and Direct Housing Subsidies: Some Latin American
Experiences”, CEPAL Review, No. 69, Santiago, Chile.
Held, G. (2000), “Políticas de Viviendas de Interés Social Orientadas al Mercado: Experiencias Recientes
con Subsidios a la Demanda en Chile, Costa Rica y Colombia”, Working Paper, No. 96, ECLAC,
Serie Financiamiento del Desarrollo, Santiago, Chile.
Herrera, S. and G. Pang (2005), “Efficiency of Public Spending in Developing Countries: An Efficiency
Frontier Approach”, Policy Research Working Paper, No. 3645, World Bank, Washington, D.C.
Hsieh, C. and M. Urquiola (2003), “When Schools Compete, How Do They Compete?”, NBER Working
Paper, No. 10008, National Bureau of Economic Research, Cambridge, MA.
Jacobs, R., P.C. Smith and A. Street (2006), Measuring Efficiency in Health Care. Analytic Techniques
and Health Policy, Cambridge University Press, Cambridge.
Jayasuriya, R. and Q. Wodon (2002), “Efficiency in Reaching the Millennium Development Goals”,
Working Paper, No. 9, The World Bank, Washington, D.C.
Larrañaga, O. (2004), “Competencia y participación privada: La experiencia chilena en educación”,
Estudios Públicos, No. 96, Santiago, Chile.
ECO/WKP(2008)14
29
Larrañaga, O. (2005), “Focalización de Programas en Chile: El Sistema CAS”, Documentos de Discusión
sobre la Protección Social, No. 0528, World Bank, Washington, D.C.
Manzi, J. (2007): “Selección de Estudiantes en el Sistema Escolar Chileno: ¿La Buena Educación Debe Ser
Sólo para los Mejores?”, in J.J. Brunner and C. Peña (Eds), La reforma al sistema escolar: aportes
para el debate, Diego Portales University, Santiago.
Marcel, M. and C. Tokman (2005), “Como se Financia la Educación en Chile?”, Estudios de Finanzas
Públicas, Ministry of Finance, Santiago, Chile.
McEwan, P.J. and M. Carnoy (2000), “The Effectiveness and Efficiency of Private Schools in Chile's
Voucher System”, Educational Evaluation and Policy Analysis, Vol. 22, pp. 213-39.
Ministry of Planning (2003a), “Encuesta de Caracterización Socioeconómica. Principales Resultados de
Salud”, Santiago, Chile.
Ministry of Planning (2003b), “Encuesta de Caracterización Socioeconómica. Principales Resultados de
Vivienda”, Santiago, Chile.
Ministry of Planning (2004), “Pobreza, Distribución del Ingreso e Impacto Distributivo del Gasto Social”,
Santiago.
Ministry of Education (2005), “Indicadores de la Educación en Chile: 2003-2004”, Santiago, Chile.
Ministry of Housing and Urban Planning (2004), “El Déficit Habitacional en Chile: Medición de los
Requerimientos de Vivienda y su Distribución Espacial”, Santiago, Chile.
Mizala, A., P. Romaguera and D. Farren (2002), “The Technical Efficiency of Schools in Chile”, Applied
Economics, Vol. 34, pp. 1533-52.
Mizala, A. and P. Romaguera (2004), “Teacher’s Salary Structure and Incentives in Chile”, Working
Paper, No. 193, Centre for Applied Economics, University of Chile, Santiago.
OECD (2000), Literacy Skills for the World of Tomorrow. Further Results from PISA 2000, OECD, Paris.
OECD (2003a), OECD Economic Survey of Chile, OECD, Paris.
OECD (2003b), PISA 2003 Technical Report, OECD, Paris.
OECD (2003c), Learning for Tomorrow's World. First Results from PISA 2003, OECD, Paris.
OECD (2004), Review of National Policies for Education: Chile, OECD, Paris.
OECD (2005), Education Trends in Perspective, Analysis of the World Education Indicators, OECD,
Paris.
OECD (2006), Education at a Glance, OECD, Paris.
Pérez-Iñigo Gonzáles, A. (1999), “El Factor Institucional en los Resultados y Desafíos de la Política de
Vivienda de Interés Social en Chile”, Working Paper, No. 78, ECLAC, Serie Financiamiento del
Desarrollo, Santiago, Chile.
ECO/WKP(2008)14
30
Puig-Junoy, J. (1998), “Measuring Health Production Performance in the OECD”, Applied Economics
Letters, Vol. 5, pp. 255-59.
Sapelli, C. and B. Vial (2002), “The Performance of Private and Public Schools in the Chilean Voucher
System”, Cuadernos de Economía, Vol. 39, Santiago, Chile.
Sutherland, D., R. Price, I. Joumard and C. Nicq (2007), “Performance Indicators for Public Spending
Efficiency in Primary and Secondary Education”, OECD Economics Department Working Paper,
No. 546, OECD, Paris.
Szalachman, R. (2006), “Instrumentos Financieros para Mejorar el Acceso a la Vivienda de los Sectores de
Menores Ingresos en América Latina y el Caribe”, ECLAC, unpublished manuscript, Santiago,
Chile.
World Health Organisation (2000), Health systems: improving performance, World Health Report,
Geneva.
World Health Organisation (2005), Make Every Mother and Child Count, World Health Report, Geneva.
World Health Organisation (2006), Working Together for Health, World Health Report, Geneva.
ECO/WKP(2008)14
31
Annex A1
Measuring efficiency in education and health care
This Annex uses Data Envelopment Analysis (DEA) to measure the efficiency of spending on
education and health care in Chile from an international perspective.1 The technique consists of computing
a technological frontier where the most efficient countries in the sample (i.e. those producing the maximum
amount of output for a given input level) operate. The countries that operate on the frontier “envelop” the
remaining ones, thus providing a benchmark for comparison. The frontier represents “best practices”, and
the degree of inefficiency is measured as the gap between the countries on the frontier and those within it.
Education and health inputs and outputs are measured as follows. With regard to output, in the case of
education, conventional indicators are school enrolment, average years of schooling and standardised test
scores; in the case of health, conventional output indicators are life expectancy, immunization rates (DTP
and measles) and child mortality rates. Inputs can be defined in physical or monetary units. When defined
in physical (monetary) units, inputs can be used to compute technical (allocative) efficiency measures.2
The data and sample
Health care
Output is measured by life expectancy at birth, under-five mortality rates (per 1 000 live births), and
the percentage of one-year-olds immunised with three doses of DPT (diphtheria-poliomyelitis-tetanus)
vaccine and two-year-olds immunised with one dose of measles vaccine. As the methodology requires a
higher output score to mean a better outcome, mortality rates were converted into survival rates. With
regards to inputs, the densities of physicians and hospital beds per 1 000 population are used as measures
of physical inputs (Puig-Junoy, 1998) and the total (public and private) per capita expenditure on health
care (in USD at PPP exchange rates) is used as the input cost measure.
To control for external factors affecting health outcomes, the urbanization rate (percentage of people
living in urban areas) and educational attainment (percentage of population aged 25-64 having attained at
least lower secondary education) are also considered in the computation of the technological frontier.
1. See Herrera and Pang (2005) and ADB (2006) for efficiency measurements in both health and education in
samples of 140 developing countries and Asian countries, respectively. See Afonso and Aubyn (2006) and
Sutherland et al. (2007) for efficiency measurements in primary and secondary education in the OECD
area, and World Health Organisation (2000) for health care in a sample of developed and developing
countries. Di Gresia (2000) and Mizala et al. (2002) carry out efficiency analyses at the school level in
Argentina and Chile, respectively. See also de Mello (2000) for measurements of efficiency in health care
and education in Latin America using Free Disposal Hull as an alternative technique.
2. It should be recognised that, when making international comparisons, the use of costs as an input measure
has the potential drawback of picking up national price inefficiencies. As such, countries that use the same
physical quantity of inputs to produce the same quantity of output, but differ in the price structure of
inputs, will exhibit different measured efficiency. See Jacobs et al. (2006) for more discussion on the
definition of inputs and outputs.
ECO/WKP(2008)14
32
Urbanisation may affect efficiency, because urban areas may attract higher-quality medical personnel and
enjoy economies of scale in service delivery, among other factors (Jayasuriya and Wodon, 2002).
Educational attainment is included in the analysis of efficiency in the provision of health care, because the
population’s education and health status are interconnected (Cutler and Lleras-Muney, 2006).
Education
Output is measured by PISA scores in mathematical literacy. Technical efficiency uses the number of
teaching staff per 100 students in secondary education as a measure of physical input, while annual
expenditure per student in secondary education (based on full-time equivalents) in USD (at PPP exchange
rates) is used for allocative efficiency.3 The socio-economic background of students is proxied by the Index
of Social and Cultural Status (ESCS) obtained from PISA.4 The ESCS was rescaled, because the original
index contains negative values, which undermine the functioning of DEA analysis.
The sample
The original sample includes all OECD countries, as well as Argentina, Brazil, Chile, Paraguay, Peru
and Uruguay in the case of health care, and Argentina, Brazil, Chile, Russia and Uruguay for education.5
Data are available from a variety of sources including OECD (2000, 2003c, 2005, 2006), the World Bank’s
World Development Indicators and the World Health Organisation (2005 and 2006). The data set refers to
2003, although 2000 PISA scores are used for Argentina and Chile, because these countries did not
participate in the 2003 PISA wave, and spending per student refers to 1999.6 Also, the ESCS was not
computed in the same manner in 2000 and 2003; therefore, this indicator had to be recomputed using the
2003 methodology for Argentina and Chile (OECD, 2003b).
Measured efficiency in education and health
The sample as a whole
In education, the benefits accruing from improving efficiency are considerable. The results reported in
Tables A.1.1 and A.1.2 show that the use of physical inputs could be reduced by 26-39% on average to
yield the same level of output, if all countries had the same level of efficiency as those on the
best-practices frontier.7 Instead, output could be raised by 6-8% for the same input intensity, if the
inefficient countries in the sample had the same level of efficiency as those on the frontier. Using spending
per student as the input measure suggests that delivery costs could be cut by 30-64% on average (41-68%
for the inefficient countries), without affecting PISA scores, if all units operated on the best-practice
3. This measure, as well as per capita spending in health care, has the potential drawback that education and
health status of the population should in principle depend on accumulated spending, since it takes time for
policies to bear fruit. Other physical inputs affecting efficiency in education include teacher quality and
school equipment (i.e. computers, furniture, etc.).
4. The index is derived from three variables related to family background: i) highest level of parental
education; ii) highest parental occupation; and iii) number of home possessions. See OECD (2003b) for
methodological discussion.
5. In education, Luxembourg and the United Kingdom were dropped due to lack of ESCS data. Also, Russia
and Uruguay were eliminated when performing the allocative efficiency analysis since they were
considered outliers.
6. Also, annual spending per student in 2002 was used for Uruguay, since data for 2003 were not available.
7. The scope for reducing input intensity is slightly greater, at 33-41%, if the countries that are already on the
frontier are excluded from the sample when calculating the averages.
ECO/WKP(2008)14
33
frontier. For their current level of spending, the inefficient countries could raise their PISA scores by 5-7%
if they operated on the frontier.8 A variety of sensitivity exercises show that the results are robust to the
inclusion of only one output and to the exclusion of the control variables.
With regards to health care, the results reported in Tables A.1.3 and A.1.4 show that, for the same
level of output, input intensity could be reduced on average by about 5-14% (or by about 12-18%, if
attention is focused on the inefficient countries alone), depending on model specification. Instead, for the
same level of technical inputs, output could be raised by 0.2-18% (or 0.4-24% for the inefficient countries
alone). When focusing on spending, rather than physical inputs, potential input intensity cuts are in the
neighbourhood of 10-17% (18-20% for the inefficient countries), and output could be raised by 0.3-23%
(0.4-28%, for the inefficient countries) by bringing all the countries in the sample to the best-practices
frontier.
How does Chile rank?
With regards to education, Chile lies on the frontier in terms of technical efficiency, but there is room
for boosting allocative efficiency. As such, spending per student may be reduced by 36-38% without
affecting PISA scores by raising allocative efficiency to the level of the countries that are currently on the
best-practice frontier. Alternatively, PISA scores could be increased through allocative-efficiency gains by
some 16%, while holding spending and other non-policy factors unaltered.9 The fact that Chile is
technically but not allocatively efficient indicates the presence of inefficiencies in the use of other inputs
needed to deliver education services.
In the case of health care, the results suggest that Chile is among the most efficient countries in the
sample. There seems to be scope for improvement only when the frontier is computed assuming constant
returns to scale. But, as discussed in Box 3, this hypothesis tends to overestimate inefficiency. In any case,
the results for the allocative efficiency analysis show that spending per capita could be cut by some 31%
while keeping life expectancy and the child survival rate unaltered, if Chile were to reach the efficiency
frontier. Also, health outcomes could be boosted by a sizeable 44% by keeping technical input intensity
constant.
8. As was mentioned in Box 3, inefficiency estimates are magnified when the constant returns to scale
assumption is used. This can easily be seen under output-orientation in the allocative efficiency analysis for
education.
9. The gains with constant returns to scale (under the output orientation) reach a sizeable 61%.
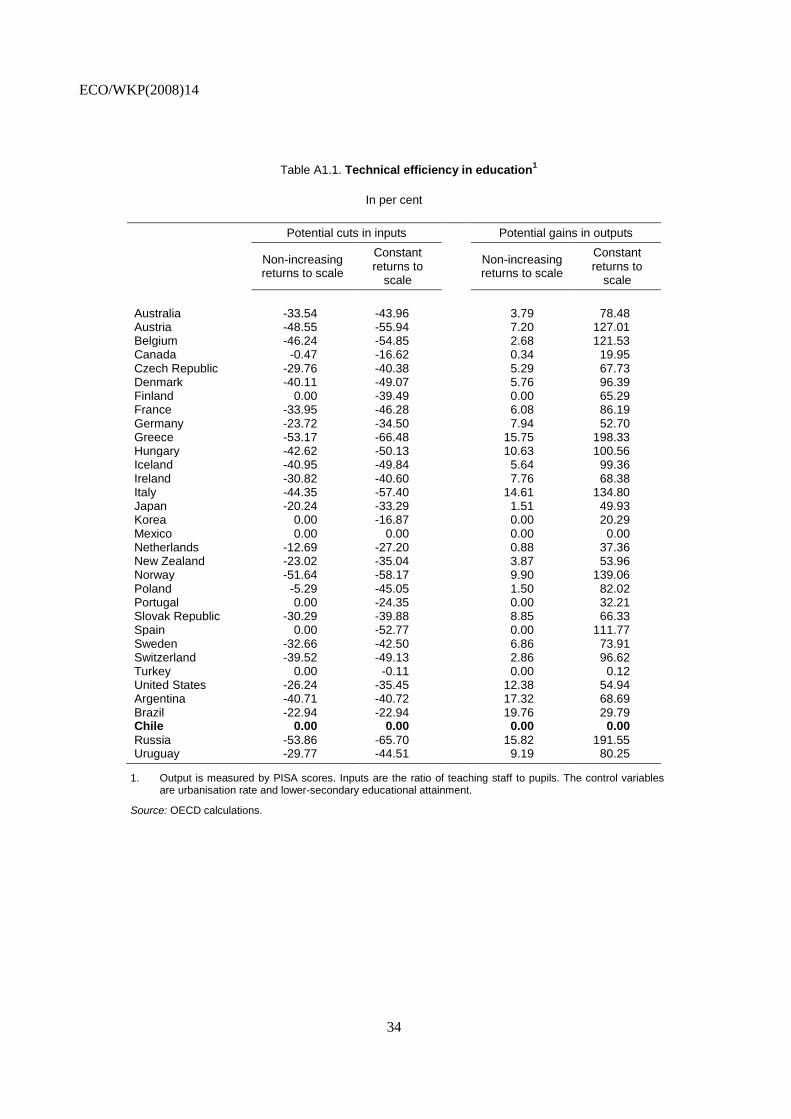
ECO/WKP(2008)14
34
Table A1.1. Technical efficiency in education1
In per cent
Potential cuts in inputs Potential gains in outputs
Non-increasing returns to scale
Constant returns to
scale
Non-increasing returns to scale
Constant returns to
scale
Australia -33.54 -43.96 3.79 78.48 Austria -48.55 -55.94 7.20 127.01 Belgium -46.24 -54.85 2.68 121.53 Canada -0.47 -16.62 0.34 19.95 Czech Republic -29.76 -40.38 5.29 67.73 Denmark -40.11 -49.07 5.76 96.39 Finland 0.00 -39.49 0.00 65.29 France -33.95 -46.28 6.08 86.19 Germany -23.72 -34.50 7.94 52.70 Greece -53.17 -66.48 15.75 198.33 Hungary -42.62 -50.13 10.63 100.56 Iceland -40.95 -49.84 5.64 99.36 Ireland -30.82 -40.60 7.76 68.38 Italy -44.35 -57.40 14.61 134.80 Japan -20.24 -33.29 1.51 49.93 Korea 0.00 -16.87 0.00 20.29 Mexico 0.00 0.00 0.00 0.00 Netherlands -12.69 -27.20 0.88 37.36 New Zealand -23.02 -35.04 3.87 53.96 Norway -51.64 -58.17 9.90 139.06 Poland -5.29 -45.05 1.50 82.02 Portugal 0.00 -24.35 0.00 32.21 Slovak Republic -30.29 -39.88 8.85 66.33 Spain 0.00 -52.77 0.00 111.77 Sweden -32.66 -42.50 6.86 73.91 Switzerland -39.52 -49.13 2.86 96.62 Turkey 0.00 -0.11 0.00 0.12 United States -26.24 -35.45 12.38 54.94 Argentina -40.71 -40.72 17.32 68.69 Brazil -22.94 -22.94 19.76 29.79 Chile 0.00 0.00 0.00 0.00
Russia -53.86 -65.70 15.82 191.55 Uruguay -29.77 -44.51 9.19 80.25
1. Output is measured by PISA scores. Inputs are the ratio of teaching staff to pupils. The control variables are urbanisation rate and lower-secondary educational attainment.
Source: OECD calculations.
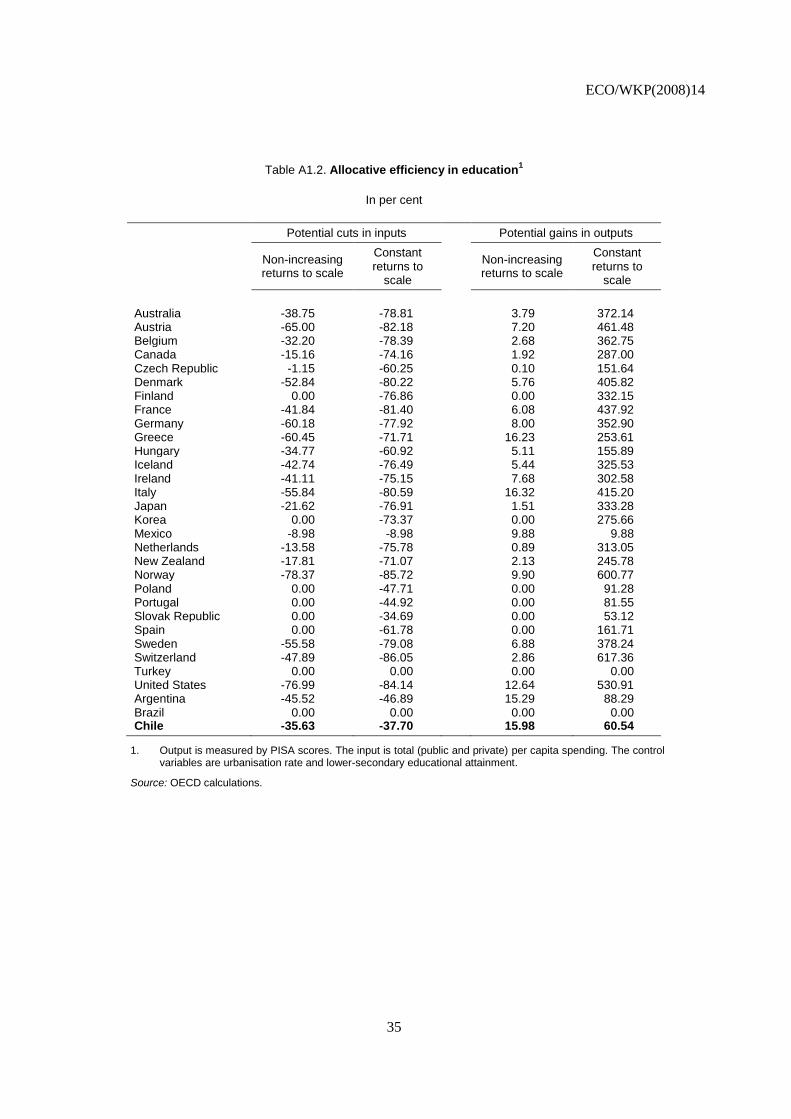
ECO/WKP(2008)14
35
Table A1.2. Allocative efficiency in education1
In per cent
Potential cuts in inputs Potential gains in outputs
Non-increasing returns to scale
Constant returns to
scale
Non-increasing returns to scale
Constant returns to
scale
Australia -38.75 -78.81 3.79 372.14 Austria -65.00 -82.18 7.20 461.48 Belgium -32.20 -78.39 2.68 362.75 Canada -15.16 -74.16 1.92 287.00 Czech Republic -1.15 -60.25 0.10 151.64 Denmark -52.84 -80.22 5.76 405.82 Finland 0.00 -76.86 0.00 332.15 France -41.84 -81.40 6.08 437.92 Germany -60.18 -77.92 8.00 352.90 Greece -60.45 -71.71 16.23 253.61 Hungary -34.77 -60.92 5.11 155.89 Iceland -42.74 -76.49 5.44 325.53 Ireland -41.11 -75.15 7.68 302.58 Italy -55.84 -80.59 16.32 415.20 Japan -21.62 -76.91 1.51 333.28 Korea 0.00 -73.37 0.00 275.66 Mexico -8.98 -8.98 9.88 9.88 Netherlands -13.58 -75.78 0.89 313.05 New Zealand -17.81 -71.07 2.13 245.78 Norway -78.37 -85.72 9.90 600.77 Poland 0.00 -47.71 0.00 91.28 Portugal 0.00 -44.92 0.00 81.55 Slovak Republic 0.00 -34.69 0.00 53.12 Spain 0.00 -61.78 0.00 161.71 Sweden -55.58 -79.08 6.88 378.24 Switzerland -47.89 -86.05 2.86 617.36 Turkey 0.00 0.00 0.00 0.00 United States -76.99 -84.14 12.64 530.91 Argentina -45.52 -46.89 15.29 88.29 Brazil 0.00 0.00 0.00 0.00 Chile -35.63 -37.70 15.98 60.54
1. Output is measured by PISA scores. The input is total (public and private) per capita spending. The control variables are urbanisation rate and lower-secondary educational attainment.
Source: OECD calculations.

ECO/WKP(2008)14
36
Table A1.3. Technical efficiency in health1
In per cent
Potential cuts in inputs Potential gains in outputs
Non-increasing returns to scale
Constant returns to
scale
Non-increasing returns to scale
Constant returns to
scale
Australia -1.26 -28.01 0.06 38.93 Austria -9.19 -10.70 0.22 11.99 Belgium -31.67 -38.82 0.16 63.45 Canada 0.00 -11.00 0.00 12.37 Czech Republic -12.46 -13.60 0.11 15.75 Denmark -9.50 -30.51 0.09 43.91 Finland 0.00 0.00 0.00 0.00 France -12.95 -20.81 0.14 26.29 Germany -16.25 -19.72 0.12 24.56 Greece 0.00 0.00 0.00 0.00 Hungary -12.61 -13.87 0.52 16.12 Iceland 0.00 -34.05 0.00 51.65 Ireland 0.00 -2.12 0.00 2.18 Italy 0.00 -12.15 0.00 13.84 Japan 0.00 -2.79 0.00 2.87 Korea 0.00 -22.01 0.00 28.24 Luxembourg 0.00 -9.98 0.00 11.10 Mexico 0.00 0.00 0.00 0.00 Netherlands -13.85 -23.65 0.22 30.99 New Zealand -13.84 -28.22 0.17 39.33 Norway 0.00 -16.46 0.00 19.70 Poland -0.59 -7.48 0.05 8.10 Portugal 0.00 0.00 0.00 0.00 Slovakia 0.00 0.00 0.00 0.00 Spain -1.82 -20.85 0.06 26.36 Sweden 0.00 -8.48 0.00 9.27 Switzerland 0.00 -4.92 0.00 5.20 Turkey -6.22 -6.22 1.68 6.63 United Kingdom -12.29 -30.81 0.13 44.55 United States 0.00 0.00 0.00 0.00 Argentina -29.90 -32.13 1.32 47.36 Brazil -5.38 -5.38 1.42 5.70 Chile 0.00 0.00 0.00 0.00
Paraguay 0.00 0.00 0.00 0.00 Uruguay 0.00 -34.53 0.00 52.77 Peru -5.91 -5.91 0.85 6.29
1. The outputs are life expectancy and child survival rate. The inputs are densities of physicians and hospital beds. The control variables are urbanisation rate and lower-secondary educational attainment.
Source: OECD calculations.
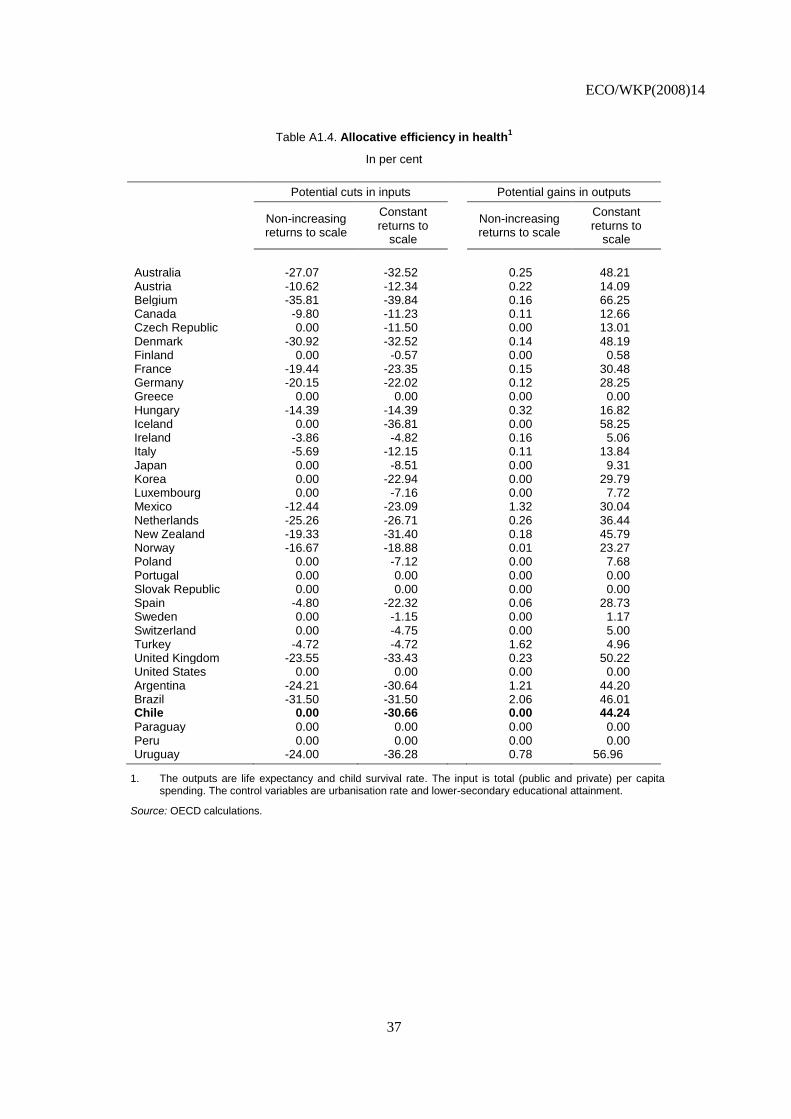
ECO/WKP(2008)14
37
Table A1.4. Allocative efficiency in health1
In per cent
Potential cuts in inputs Potential gains in outputs
Non-increasing returns to scale
Constant returns to
scale
Non-increasing returns to scale
Constant returns to
scale
Australia -27.07 -32.52 0.25 48.21 Austria -10.62 -12.34 0.22 14.09 Belgium -35.81 -39.84 0.16 66.25 Canada -9.80 -11.23 0.11 12.66 Czech Republic 0.00 -11.50 0.00 13.01 Denmark -30.92 -32.52 0.14 48.19 Finland 0.00 -0.57 0.00 0.58 France -19.44 -23.35 0.15 30.48 Germany -20.15 -22.02 0.12 28.25 Greece 0.00 0.00 0.00 0.00 Hungary -14.39 -14.39 0.32 16.82 Iceland 0.00 -36.81 0.00 58.25 Ireland -3.86 -4.82 0.16 5.06 Italy -5.69 -12.15 0.11 13.84 Japan 0.00 -8.51 0.00 9.31 Korea 0.00 -22.94 0.00 29.79 Luxembourg 0.00 -7.16 0.00 7.72 Mexico -12.44 -23.09 1.32 30.04 Netherlands -25.26 -26.71 0.26 36.44 New Zealand -19.33 -31.40 0.18 45.79 Norway -16.67 -18.88 0.01 23.27 Poland 0.00 -7.12 0.00 7.68 Portugal 0.00 0.00 0.00 0.00 Slovak Republic 0.00 0.00 0.00 0.00 Spain -4.80 -22.32 0.06 28.73 Sweden 0.00 -1.15 0.00 1.17 Switzerland 0.00 -4.75 0.00 5.00 Turkey -4.72 -4.72 1.62 4.96 United Kingdom -23.55 -33.43 0.23 50.22 United States 0.00 0.00 0.00 0.00 Argentina -24.21 -30.64 1.21 44.20 Brazil -31.50 -31.50 2.06 46.01 Chile 0.00 -30.66 0.00 44.24
Paraguay 0.00 0.00 0.00 0.00 Peru 0.00 0.00 0.00 0.00 Uruguay -24.00 -36.28 0.78 56.96
1. The outputs are life expectancy and child survival rate. The input is total (public and private) per capita spending. The control variables are urbanisation rate and lower-secondary educational attainment.
Source: OECD calculations.
ECO/WKP(2008)14
38
WORKING PAPERS
The full series of Economics Department Working Papers can be consulted at www.oecd.org/eco/Working_Papers/
605. Managing Chile’s macroeconomy during and after the copper price boom
(April 2008) Luiz de Mello
604. Avoiding the value added tax: Theory and cross-country evidence
(April 2008) Luiz de Mello
603. Oil Price Shocks, Rigidities and the Conduct of Monetary Policy: Some Lessons from a New
Keynesian Perspective
(April 2008) Romain Duval and Lukas Vogel
602. The Contribution of Economic Geography to GDP Per Capita
(April 2008) Hervé Boulhol, Alain de Serres and Margit Molnar
601. Estimating a supply block for Poland
(April 2008) Rafal Kierzenkowski, Patric Ollivaud, Franck Sédillot and Philippe Briard
600. Product market regulation and economic performance across Indian states
(March 2008) Paul Conway, Richard Herd and Thomas Chalaux
599. Improving product market regulation in India: an international and cross-state comparison
(March 2008) Paul Conway and Richard Herd
598. Revenue buoyancy and its fiscal policy implications
(February 2008) Isabelle Joumard and Christophe André
597. Monetary policy, market excesses and financial turmoil
(February 2008) Rudiger Ahrend, Boris Cournède and Robert Price
596. Explaining differences in hours worked among OECD countries: an empirical analysis
(February 2008) Sven Blondal and Jean-Marc Burniaux
595. Fiscal policy in India: past reforms and future challenges
(February 2008) Richard Herd and Willi Leibfritz
594. The significance of Switzerland’s enormous current-account surplus
(March 2008) Peter Jarrett and Céline Letremy
593. Interdependencies between monetary policy and foreign-exchange intervention under inflation
targeting: the case of Brazil and the Czech Republic
(January 2008) Jean-Yves Gnabo, Luiz de Mello and Diego Moccero
592. Solow or Lucas? Testing growth models using panel data from OECD countries
(December 2007) Jens Arnold, Andrea Bassanini and Stefano Scarpetta
591. The private internal rates of return to tertiary education: new estimates for 21 OECD countries
(December 2007) Romina Boarini and Hubert Strauss.
ECO/WKP(2008)14
39
590. Making federalism work
(December 2007) Alexandra Bibbee
589. The wage premium on tertiary education: New estimates for 21 OECD countries
(December 2007) Hubert Strauss and Christine de la Maisonneuve
588. Enhancing the benefits of financial liberalisation
(March 2007) Stefan Ide, Jens Høj and Patrick Lenain
587. Improving incentives in tertiary education
(March 2007) Jens Høj
586. Globalisation and the European Union: which countries are best placed to cope?
(December 2007) David Rae and Marte Sollie
585. Primary and secondary education in the United States
(November 2007) Peter Tulip and Gregory Wurzburg
584. Financing higher education in the United States
(November 2007) Peter Tulip
583. Corporate net lending: a review of recent trends
(November 2007) Christophe André, Stéphanie Guichard, Mike Kennedy and David Turner
581. Local government finances: The link between intergovernmental transfers and net worth
(September 2007) Luiz de Mello
580. Boosting Austria's innovation performance improving innovation
(September 2007) Willi Leibfritz and Jürgen Janger
579. Improving employment prospects in the Slovak Republic: Building on past reforms
(September 2007) Andres Fuentes
578. Improving education outcomes in the Slovak Republic
(September 2007) David Carey
577. Regulatory reforms in Sweden have boosted productivity
(September 2007) Espen Erlandsen and Jens Lundsgaard
576. The policy determinants of investment in tertiary education
(September 2007) Joaquim Oliveira Martins, Romina Boarini, Hubert Strauss,
Christine de la Maisonneuve and Clarice Saadi
575. Product market competition in the OECD countries: taking stock and moving forward
(September 2007) Jens Høj, Miguel Jimenez, Maria Maher, Giuseppe Nicoletti
and Michael Wise
574. Too little destruction too little creation: A Schumpeterian diagnosis of barriers to sustained growth
in Ukraine
(September 2007) Christian Gianella and William Tompson


![Delivering care in efficient environment medicall 2011 [compatibility mode]](https://img.pdfslide.us/doc/110x75/544431b7afaf9fb0098b471f/delivering-care-in-efficient-environment-medicall-2011-compatibility-mode.jpg)