Embed Size (px)
Citation preview

GAIN Deliverable 3.3
File: GAIN D3.3 – Report on value chain mapping for key species/systems, with SWOT analysis of key informants
The project has received funding from the European Union's Horizon 2020 Framework Research and Innovation Programme under GA n. 773330
1 of 56
This project has received funding
from the European Union’s Horizon
2020 research and innovation
programme under grant agreement
N° 773330
Deliverable report for
GAIN Green Aquaculture Intensification in Europe
Grant Agreement Number 773330
Deliverable D3.3
Title: Report on value chain mapping for key species/systems, with
SWOT analysis of key informants
Due date of deliverable: 31/10/19
Actual submission date: 31/10/19
Lead beneficiary: University of Stirling
Authors: Richard Newton, Wesley Malcorps, Mahmoud Eltholth, David Little
WP 3 – Policy and markets
Task 3.3 – Global market aspects
Dissemination Level:
PU Public Y
Document log
Version Date Comments Author(s)
Version 1 27/10/19 First draft Richard Newton, Wesley Malcorps, Mahmoud
Eltholth and David Little
Version 2 29/10/2019 Revision Roberto Pastres
Version 3 31/10/2019 Final version Richard Newton, Wesley Malcorps, Mahmoud
Eltholth and David Little
Recommended Citation
Malcorps W, Newton R, Little D., 2019. Report on value chain mapping for key species/systems, with SWOT analysis of key informants. Deliverable 3.3. GAIN - Green Aquaculture INtensification in Europe. EU Horizon 2020 project grant nº. 773330. 57 pp.

GAIN Deliverable 3.3
File: GAIN D3.3 – Report on value chain mapping for key species/systems, with SWOT analysis of key informants
The project has received funding from the European Union's Horizon 2020 Framework Research and Innovation Programme under GA n. 773330
2 of 56
GLOSSARY OF ACRONYMS
Acronym Definition
EU European Union EEA European Economic Area GAIN Green Aquaculture Intensification in Europe KI Key Informant LCA Life Cycle Assessment MT Metric Tonne PDNA Porter Diamond National Advantage Framework SWOT Strengths, Weaknesses, Opportunities and Threats T Task (G)VCA (Global) Value Chain Analysis DM Dry Matter

GAIN Deliverable 3.3
File: GAIN D3.3 – Report on value chain mapping for key species/systems, with SWOT analysis of key informants
The project has received funding from the European Union's Horizon 2020 Framework Research and Innovation Programme under GA n. 773330
3 of 56
Contents 1. Executive summary ............................................................................................................................. 4
2. Introduction .................................................................................................................................... 6
3. Value Chain Mapping of European Aquaculture ............................................................................ 7
3.1 Value Chain Analysis ..................................................................................................................... 7
3.1.1 European seafood consumption and trade ........................................................................... 7
3.1.2 Consumers‘ role in GVCs ........................................................................................................ 9
3.1.3 The role of regulations and standards ................................................................................. 10
3.1.4 Local community interaction ............................................................................................... 11
3.2 EU Aquaculture sector overview................................................................................................. 12
3.2.1 Atlantic Salmon (Salmo salar) .............................................................................................. 14
3.2.2 Rainbow Trout (Oncorhynchus mykiss) ................................................................................ 17
3.2.3 European Seabass (Dicentrarchus labrax) and Gilthead (Sea)Bream (Sparus aurata) ........ 20
3.2.4 Turbot (Scophthalmus maximus) Spain and Portugal .......................................................... 23
3.2.5 Common Carp (Cyprinus carpio) (Poland). ........................................................................... 25
3.2.6 European Blue Mussel (Mytillus edulis) ............................................................................... 27
3.2.7 Oysters; Pacific cup oyster (Crassostrea gigas) and European flat oyster (Ostrea edulis) ... 27
3.2.8 Striped Catfish (Pangasianodon hypophthalmus) ............................................................... 29
3.2.9 Tilapia (mostly Oreochromis Niloticus) ................................................................................ 31
4. Value Chain Analysis data collection methodology ...................................................................... 33
4.1 Seafood show sustainability surveys and Key Informant interviews .......................................... 33
4.1.1 Survey sustainability messaging .......................................................................................... 33
4.1.2 Key informant interviews ..................................................................................................... 35
4.1.3 SWOT analysis and Delphi process ...................................................................................... 37
4.1.4 Porter Diamond of National Advantage (PDNA frameworks).............................................. 37
4.2 European aquaculture value chain analysis surveys ................................................................... 38
4.2.1 Semi-structured value chain survey ..................................................................................... 38
5. Conclusions ................................................................................................................................... 41
6. References .................................................................................................................................... 42
7. Table of Contents for Figures and Tables ..................................................................................... 48
8. Annex 1 Value Chain Analysis Key Informant structured questions and checklist (as used in
Norway July – September 2019) ........................................................................................................... 50

GAIN Deliverable 3.3
File: GAIN D3.3 – Report on value chain mapping for key species/systems, with SWOT analysis of key informants
The project has received funding from the European Union's Horizon 2020 Framework Research and Innovation Programme under GA n. 773330
4 of 56
1. Executive summary
The EU funded Green Aquaculture Intensification (GAIN) project seeks to optimise output of
aquaculture in terms of product and value. In order to achieve this, it is essential to have a strong
understanding of the value chains which underpin the industry. This means not only understanding
the direct supply chains of production and processing but also the service industries, government,
research and development actors which take an active part in driving the success of an industry.
Deliverable 3.3 reports on the initial tasks which are underway as part of T3.3 and will feed into T4.2
over the coming months of the project.
The first part of the deliverable gives a basic literature-based overview of European aquaculture value
chains, including brief descriptions of consumption and trade, the role of consumers, regulation, policy
and certification and community interaction. We then provide a literature and expert based overview
of the key EU species, which are the focus of the GAIN project and of tilapia and pangasius, as key
traded species into the EU from Asia that can compete directly with EU culture species. A SWOT
analysis is provided for each of the species. The analysis shows that there are good opportunities for
most European aquaculture species to grow and add value. Salmon is growing in popularity world-
wide, but is constrained by space in the major production areas and pathogen-related challenges, but
better efficiencies, perhaps underpinned by precision aquaculture could boost production. Rainbow
trout production has shrunk in the EU, but opportunities exist to differentiate product forms and to
add value through better processing and marketing. Seabass and seabream are popular species but
have challenges regarding high costs of production, particularly at the hatchery stage linked to
required labour intensity and mortality. There are also challenges and opportunities related to imports
of the two low cost white fish species from Asia. Potentially improved processing and value addition
to by-products impacts positively on European actors through employment. However, this is affected
by attitudes to consumption which are known to vary by country and context. Shellfish have less
literature published regarding the specific opportunities and challenges and these are very different
from country to country. For example, mussels are usually sold live in Scotland but processed in Spain,
in contrast to finfish where northern Europeans tend to prefer processed fish compared to southern
Europeans who like to buy it whole. These differences in processing and consumption patterns are
complex and will become more apparent as the VCA is completed.
Section 4 of the deliverable provides a detailed methodology of the work that is currently underway
as part of T3.3 and will continue over the coming months based on SWOT analysis, Porter Diamond
National Advantage (PDNA) framework, Delphi process and the detailed in-country VCA work. SWOT
analysis has been included based on literature as described above. This will be improved based on Key
Informant (KI) interviews within the VCA. A Delphi process will engage a panel of experts drawn from
KIs in an iterative process, which will highlight the most important areas for innovation within EU
aquaculture sectors. This will be complemented by the PDNA analysis which will assess the
competitiveness of companies/industries based on their ability to drive innovation, technologically,
structurally, and related to legislation or policy.
To-date only Norwegian salmon has had the detailed VCA data collection completed. The list of the
type of stakeholders approached for the work is provided (Table 26) along with the semi-structured
survey and question checklist (Annex 1). In addition to the VCA country work, Key Informant interviews
GAIN Deliverable 3.3
File: GAIN D3.3 – Report on value chain mapping for key species/systems, with SWOT analysis of key informants
The project has received funding from the European Union's Horizon 2020 Framework Research and Innovation Programme under GA n. 773330
5 of 56
were performed at major seafood shows around the world to assess perceptions to trade and
sustainable aquaculture from different perspectives, including EU trade to Asia and vice versa. A study
of exhibitor sustainability messaging on the booths was also made by recording of all of the words
related to sustainability and quality of products, along with certification logos and other key
messaging. This has been undertaken at Boston, Brussels, Guangzhou and shortly to be completed, at
Qingdao seafood shows. A comparison will be made between the sustainability image that EU and
Asian producers and suppliers of seafood portray at the different shows around the world.
The different parts of the task are complementary in providing an industry driven consensus on the
necessary improvements needed for the EU aquaculture industry and to highlight opportunities to
add value responsibly and sustainably.

GAIN Deliverable 3.3
File: GAIN D3.3 – Report on value chain mapping for key species/systems, with SWOT analysis of key informants
The project has received funding from the European Union's Horizon 2020 Framework Research and Innovation Programme under GA n. 773330
6 of 56
2. Introduction
In order to understand the dynamics of any industry it is imperative to undertake a Value Chain
Analysis (VCA), or mapping exercise. The value chain can be defined as the interconnected actors and
stakeholders who provide resources, production capability, skills, innovation, and governance to an
industry. In the modern world of international trade in goods and commodities, it is often referred to
as the Global Value Chain (GVC). It is different to a supply chain, in that it includes indirectly affected
stakeholders such as policy makers, academics, consumers who may affect or be affected by the
activities within the chain and also seeks to understand the power relations between them. Moreover,
understanding the impact of decisions and unforeseen implications along this chain, requires a
comprehensive framework of sustainability indicators (Valenti et al., 2018). Integrated Value Chain
Analysis and Life Cycle Assessments (LCA) are an innovative approach to link social, economic and
environmental impacts of international trade. The design of the work will be based on currently
available literature, but supported where possible, with data drawn directly from stakeholders using
a combination of structured and semi-structured surveys and Key Informant (KI) interviews. As such,
the GAIN project is undertaking two VCA exercises to complement the LCA and sustainability indicator
work in WP4. D3.3 reports on the initial activities in T3.3, containing the literature analysis of European
value chains and an explanation of the methodological approach which will be used to underpin the
stakeholder-based analysis which will be detailed in D4.2
In addition to the VCA of European aquaculture production, the purpose of T3.3 is to understand the
strength of competitiveness of European production compared to cultured white fish imports,
particularly of Asian products; Pangasius (Pangasiadon hypophthalmus), also known as basa, and
tilapia (mainly Oreochromis niloticus). Global trade is increasingly centralised and dominated by
brands, supermarkets and food service companies. These are also called ‘lead’ firms that control
access and determine the terms of trade (Humphrey et al., 2001).
Therefore, to understand European aquaculture Value Chains, the work contained within T3.3 of the
project falls into four major parts:
(i) Develop a SWOT analysis of for each European major species/system context and for pangasius and
tilapia for two Asian contexts based on market data and key informant interviews with value-chain
members and industry observers;
(ii) Conduct a seafood value chain mapping exercises for each European major species/system context
and for pangasius and tilapia for two Asian contexts from secondary data derived from previous and
on going EU RTD projects (SEAT and Primefish), updated based on information derived using a DELPHI
process with key value chain actors. Selected key informant interviews will be used to validate the
findings in at least two international seafood exhibitions;
(iii) Develop competitiveness models for EU and Asian products using GVCA and PDNA frameworks
based on data from (i) and (ii) together with in depth interviews with key informants and other
industry sources;
GAIN Deliverable 3.3
File: GAIN D3.3 – Report on value chain mapping for key species/systems, with SWOT analysis of key informants
The project has received funding from the European Union's Horizon 2020 Framework Research and Innovation Programme under GA n. 773330
7 of 56
(iv) Assess impacts of agri-food standards on competitiveness and employment, based on a literature
review and an internet survey of seafood businesses.
Due to the timing of D3.3 (M18) and D4.2 (M24) compared to the timetables for T3.3 (M13-24) and
T4.2 (M13-36), some adjustment of the content related to D3.3 has been necessary as the work within
the task related to in-country surveys and key informant interviews will not be completed until M30.
The timings related to task and deliverables was raised as an issue within the inception meeting of
project in Venice 2018.
The content within this deliverable relates to the literature review work carried out on European and
Asian value chain mapping, including a SWOT analysis based on literature but not Key Informant
interviews, as field work has only been partially conducted to-date. Methodology related to the
continuing survey work is also presented within this deliverable.
3. Value Chain Mapping of European Aquaculture
3.1 Value Chain Analysis
Understanding the composition, structure and relationships within a value chain is vital for
understanding how an industry innovates and grows. It characterises the industry in terms of its
production and trends. More importantly it identifies, the challenges, bottlenecks, opportunities and
strengths from a multi-stakeholder perspective and identifies who the key players are that are driving
the industry forward or that are pivotal for its success. This is particularly the case for identifying
competitive challenges, including those related to sustainability, and acting to overcome them,
termed as “upgrading“
3.1.1 European seafood consumption and trade
Seafood consumption is covered in detail as part of D3.2. However, a short overview is given here to
provide context to the VCA. European seafood demand has gradually increased from 20.7 kg capita-1
year-1 to 24.3 kg capita-1 year-1 from 2005 till 2016. However, demand cannot be met from domestic
aquaculture and wild fisheries production combined. According to EUMOFA based on EUROSTAT,
National sources, FEAP and FAO data, the EU self-sufficiency ratio, indicating the ratio of domestic
production meeting demand, shows a decrease from 42.5% to 41.7% from 2015 to 2016, respectively.
Consequently, increasing demand and stable or declining production leads to an increasing
dependency on imports.
The European Union (EU-28) produced 6.3 million MT of seafood in 2016, equal to 3.1% of the total
fish production globally, covering both aquaculture as well as fisheries. Wild capture fisheries
produced 5 million MT, a relatively large share of 5.6%, while aquaculture accounted for almost 1.3
million metric tonnes, representing 1.2% of the global aquaculture production (EUMOFA, 2018; FAO,
2018a; EUROSTAT, 2019).

GAIN Deliverable 3.3
File: GAIN D3.3 – Report on value chain mapping for key species/systems, with SWOT analysis of key informants
The project has received funding from the European Union's Horizon 2020 Framework Research and Innovation Programme under GA n. 773330
8 of 56
Based on EUROSTAT and FAO data, the total fin-fish supply (live weight) increased from 13.8 to 14.2
MT from 2015 to 2016, respectively (EUMOFA, 2018). European fish production including fisheries and
aquaculture accounts for 5.2 million tonnes, while 75% comes from capture fisheries. Additional
fishery catches of 1.1 MT were destined for non-food use. The picture is complicated by global trade.
Imports accounts for 9.1 MT, while export reached 1.8 MT in 2016. It is estimated that 12.4 MT of live
weight equivalent is consumed within the European Union (EUMOFA, 2018). The red arrows in figure
1, below indicate a loss in the live weight balance through imports and exports, which if domestic
production would improve (green) it could create self-sufficiency and meet the 12.4MT currently
consumed in the EU and increase high value European export to other countries (Figure 1).
The majority of supply comes from imports, accounting for 63% to the seafood supply in the European
Union. Fish has a valuable place, as they account for 18% of a total of EU143 billions of food products
imported (EUMOFA, n.d.; European Commission, n.d. a). Fish imports are on the increase, with an
average annual growth rate of 6% (EUMOFA, 2018). Most of the import is driven by Spain, mainly
supplied by Morocco, China, Ecuador, Argentina, Peru and Chile. However, it must be noted that half
of fish products traded within and outside the EU consists of intra-EU trade. This trade is on the
increase, showing average annual growth of 3%, reaching 6.5 MT in 2017, with species, such as small
Import
9.05 MT
Export
1.81 MT
Seafood Supply in
the European
Union 14.22 MT
Consumption
in the EU 12.41
MT
Production
5.17 MT
Figure 1: EU supply balance for fisheries and aquaculture products in 2016 (live weight equivalent). Replicate of Chart 5
(The EU Fish Market 2018 - (EUROSTAT, no date; EUMOFA, 2018; FAO, 2018a))
GAIN Deliverable 3.3
File: GAIN D3.3 – Report on value chain mapping for key species/systems, with SWOT analysis of key informants
The project has received funding from the European Union's Horizon 2020 Framework Research and Innovation Programme under GA n. 773330
9 of 56
pelagics (18%), salmonids (15%), groundfish (14%) and non-food use (11%) dominating the intra-trade
market. Non-food use is dominated by fish oil (18%), fish waste (40%) and fishmeal (42%) volume
representing EU833 million in in 2017, compared to 26.7 billion in 2017 represented by intra-EU
exports (EUMOFA, 2018).
While food trade adds value to the resilience of the global food system from a food security
perspective (Dolfing et al., 2019), cultural attitudes towards socio-economic factors has implications
for its acceptability. While production overseas (e.g. pangasius and shrimp) creates economic
opportunities for developing countries, they have been criticised for negative social and
environmental impacts. The development and transformation of aquaculture in these countries is the
result of immanent (ongoing and undirected) and interventionist (intentional, externally inserted)
processes. While delivering wider inclusive growth in Asia, the ‘interventionist approach’ often results
in industrial scaled production, resulting in fewer local employment opportunities and centralised
accumulation of capital (Belton and Little, 2011). Despite the possible conflicts, overall development
of the aquaculture industry supports local production linked to integrated and circular economies with
in excess 90% of farmed fish in the top aquaculture-producing countries consumed domestically
(Belton et al., 2016; 2018).
Fisheries are still dominant within European seafood production, representing a share of 75%
(EUMOFA, 2018), but with little prospect of an increase in production, as they are close to production
limits (Bostock et al., 2016). Despite this, the European fishery is a relatively small player, contributing
to 5.6% of global wild capture fisheries (STECF, 2018) equal to 3.8 million MT. However, aquaculture
and fisheries are interlinked, based on sharing of fish resources, common ecosystems and common
markets (Soto et al., 2012; Knapp, 2015). Outcomes of this interrelationship can lead to both conflict
and opportunities.
Increased seafood supply must come from domestic or imported aquaculture product which currently
suffer from negative quality and reputation perceptions but could be positively influenced by
marketing campaigns and economic incentives (FAO, 2016a; European Commission, 2018). These
factors could affect the growth of European aquaculture in the future. It is expected that an overall
increase in production of 55% could be made by 2030. This growth supports the European goals of
increased food security and economic development, but such expansion of production systems and
feed demand may cause socio-economic and environmental implications in the EU and further afield
(Lane et al., 2014). However, there are many overlooked challenges regarding trade-offs from
aquaculture and fisheries contribution to the food supply chain in the field of health medicine, human
and fish welfare, safety and environment (Hall et al., 2011; EFSA, 2015; Jennings et al., 2016).
3.1.2 Consumers‘ role in GVCs
Sustainable supply chain management is increasingly driven by external factors, such as regulatory
pressure, reputation and consumer preference (Saeed and Kersten, 2019). Consumers are influenced
by other factors; primarily by food safety, taste and price but the hierarchy of preference is also is
dependent upon variables such as location, social status, age, gender and if they have children. Ethical
concerns such as social and environmental impact are becoming increasingly important but are

GAIN Deliverable 3.3
File: GAIN D3.3 – Report on value chain mapping for key species/systems, with SWOT analysis of key informants
The project has received funding from the European Union's Horizon 2020 Framework Research and Innovation Programme under GA n. 773330
10 of 56
generally lower down the list and evidence shows that consumers are generally not willing to pay
substantially more for ethical considerations (Chambers et al., 2008; Prescott et al., 2002).
The rapid development of aquaculture and the appearance of more aquaculture products on shelves
has been met with some suspicion among consumers fuelled by NGO criticism and protectionism from
traditional seafood suppliers. Aquaculture is heavily criticised for a range of social and environmental
impacts that have formed a long-term negative narrative amongst Western consumers. Nevertheless,
globally, public attitudes towards aquaculture in general show a positive trend (Froehlich et al., 2017).
A majority of Europeans prefer wild over farmed products and they also show a preference for marine
compared to freshwater fish (European Commission, 2018) However, mariculture is perceived more
negatively by the public, especially in the USA. This is often based on misunderstandings of
aquaculture systems and their associated (environmental) risks (Froehlich et al., 2017). Attitudes are
varied across Europe with countries with developed aquaculture industry and public awareness, such
as Norway, show often a more positive attitudes toward fish farming. Where there is high-awareness
consumers are often more optimistic about aquaculture and its various impacts (Hynes et al., 2018,
Thomas et al., 2018; Whitmarsh and Palmieri, 2011). Whereas some consumers claim a willingness to
pay more for what they consider to be more responsibly produced food, this is sometimes not
evidenced by sales. The attitudes of consumers and the perceptions that retailers as lead firms have
about consumer attitudes have a considerable influence on how the aquaculture industry develops
and the innovations that it pursues (Honkanen and Olsen, 2009). Further detail on seafood
consumption trends and consumer attitudes are given in D3.2 and 3.4, respectively. However, a
fundamental understanding of consumer perceptions is vital to understanding the drivers within
aquaculture value chains.
3.1.3 The role of regulations and standards
EU regulations are some of the most robust in the world forming a broad framework of law by which
EU producers and importers to the EU must abide, particularly on food safety regulation. The EU law
may serve to drive or be a barrier to innovation in some circumstances, but is a considerable factor in
the development of the aquaculture industry. This is playing a key role in the growth of sustainable
aquaculture and considered a key factor for boosting sustainable/responsible production practices.
Central to the EU’s legislation is traceability with various schemes to allow full tracing of products back
to their origins linked to the TRACES system and the Rapid Alert System for Food and Feed (RASFF)
which notifies authorities of food safety alerts, particularly of traded goods with in and from without
the EU. In addition to regulation, traceability is increasingly required by business through new
technology, such as the distributed ledger technology (DLTs) (e.g.) blockchain which shows potential
for supply chain management (Tijan et al., 2019), and increase traceability in the agri- and food sector
(Ge et al., 2017; Kim and Laskowski, 2017; Kamath, 2018; Lin et al., 2018). Intentional and
unintentional mislabelling is a problem in the seafood industry (Smejkal and Kakumanu, 2018) with
social, environmental and food safety consequences which could also be tackled through such
technology in many circumstances. However, EU law falls short in some respects regarding imports
from third countries, including environmental and social impacts. This not only raises questions about
competitiveness of EU producers who do have to conform to stricter rules on employment or
GAIN Deliverable 3.3
File: GAIN D3.3 – Report on value chain mapping for key species/systems, with SWOT analysis of key informants
The project has received funding from the European Union's Horizon 2020 Framework Research and Innovation Programme under GA n. 773330
11 of 56
environmental impact when third country producers do not and where production costs are
significantly lower. Where there is concern about such issues, consumers may turn to eco-labels and
other certification to provide trust for responsible sourcing. Global private standards often use a top-
down approach considering food safety and traceability , but may ignore the local complexity in
producing countries, which could potential lead to socio-economic inequality among indigenous
communities (Mialhe et al., 2018). Consolidated industries with large vertically integrated companies
are better positioned to obtain certification, compared to small scale farmers which operate through
large complex value chains. Small scale farmers, when they do meet the technical requirements of
certification may not benefit from being certified as they have little power in getting a premium for
their certified product and cannot afford the audit fees. However, buyers, both retail and food service,
often demand that the product is certified to give confidence. New innovations in the way eco-
certification is currently used in the aquaculture industry and, in particular, to the non-vertically
integrated value chains are required, often certifying collectives of small scale farmers (Bush, 2018).
Additionally, the wide range of eco-certification and standards currently applied in fisheries and
aquaculture creates confusion among consumers who may be given conflicting messages. While
standards are developed to improve clarification about the sustainability of seafood labels, some
standards use different criteria and compete each other, while some of them may offer cooperation
and mutual recognition, adding to the confusion (Samerwong et al., 2017). Although consumers could
and should be aware of sustainability issues regarding their food, it is the buyer who can offer a trusted
brand to their consumers which is bound by responsible, sustainable sourcing. Therefore, buyers tend
to be key actors in terms of how and what type of certification standards are required of producers
and processors alike.
3.1.4 Local community interaction
Perceptions towards aquaculture are often the results of community-based interactions with
aquaculture activities. A strategy defined as social licence to operate (SLO) could be used to provide
insights to the relationships between host communities and aquaculture and possibly improve it
(Gehman et al., 2017). However, ‘social licensing’ is often not clearly explained or quantified and
future research is needed to find the most optimal strategy for its application (Kelly et al., 2017).
Insight into public perceptions often reveals different views of aquaculture across and within certain
(sector) groups. These perceptions on aquaculture production correlates with the interpretation of its
environmental impact (Rudell and Miller, 2012; Whitmarsh and Wattage, 2006). Other environmental
disturbance in the area (not directly related to aquaculture) could have an effect on the perception
towards aquaculture activities (Froehlich et al., 2017).
A stakeholder perception analysis in Catalonia, Spain, showed that participants were in general in
favour of future marine fish farming development. Among these stakeholders 4 different perceptions
were observed; (1) aquaculture as an important socio-economic benefit with low environmental costs,
(2) importance to environmental concerns (eutrophication, chemicals and focussed on fish meal and
fish oil substitution), (3) valuing both socio-economic as well as economic concerns and (4) focusing
on economic aspects (Bacher et al., 2014).
GAIN Deliverable 3.3
File: GAIN D3.3 – Report on value chain mapping for key species/systems, with SWOT analysis of key informants
The project has received funding from the European Union's Horizon 2020 Framework Research and Innovation Programme under GA n. 773330
12 of 56
A case-study on the Mediterranean (Greece) (Perdikaris et al., 2016), focussing on farmed seabass and
seabream, revealed increasing awareness among consumers on demographics and socio-economic
aspects, which function as key factors in the consumers’ purchasing behaviour. This functions as a
driver for key players in the aquaculture industry to adopt sustainable practices. The survey results
indicated that environmental protection measures were applied by 82% of the marine and 60% of the
freshwater farmers responders. Farmers were aware of organic farming, fishmeal and fish oil
substitution and had different perceptions on the impact on the final product (Perdikaris et al., 2016).
High quality community-producer relationships are essential to the growth of the industry. In
Scotland, producers who wish to open a new site must participate in a community consultation period,
where objections are heard (Peel and Lloyd, 2008). Many producers engage with local communities
to improve their relationship and local image which may enhance the general perception of the
company and the industry (Hishamunda et al., 2014). Activities include sponsorship of local sports
teams and events, investing in local infrastructure and local outreach in schools and other public
establishments. However, the level of community engagement and the benefits that accrue are varied
between countries and will become more apparent during the data collection period of the T3.3 and
T4.2.
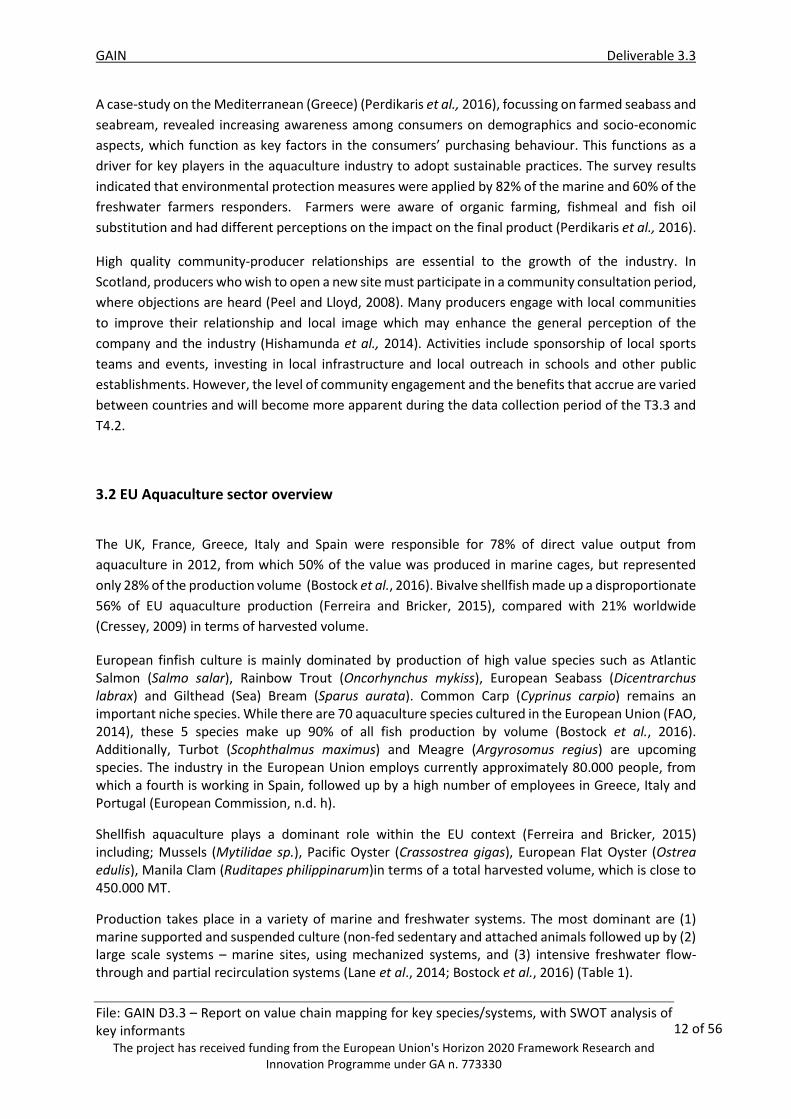
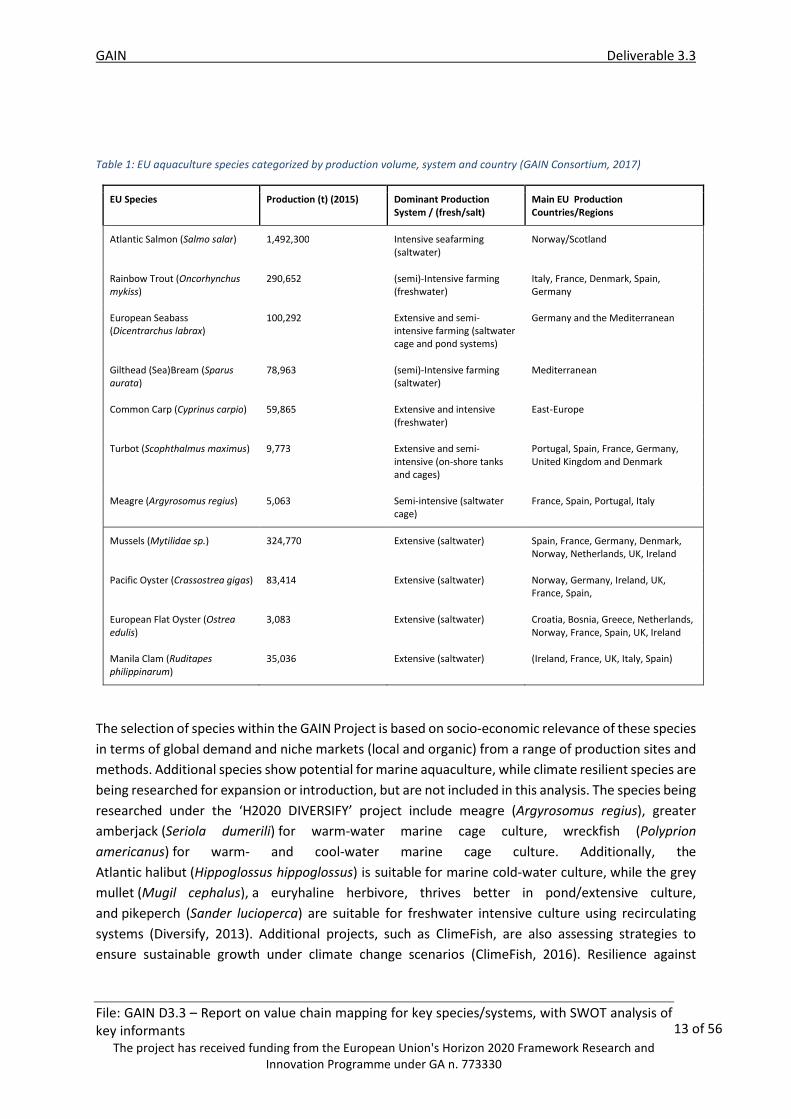
3.2 EU Aquaculture sector overview
The UK, France, Greece, Italy and Spain were responsible for 78% of direct value output from
aquaculture in 2012, from which 50% of the value was produced in marine cages, but represented
only 28% of the production volume (Bostock et al., 2016). Bivalve shellfish made up a disproportionate
56% of EU aquaculture production (Ferreira and Bricker, 2015), compared with 21% worldwide
(Cressey, 2009) in terms of harvested volume.
European finfish culture is mainly dominated by production of high value species such as Atlantic Salmon (Salmo salar), Rainbow Trout (Oncorhynchus mykiss), European Seabass (Dicentrarchus
labrax) and Gilthead (Sea) Bream (Sparus aurata). Common Carp (Cyprinus carpio) remains an important niche species. While there are 70 aquaculture species cultured in the European Union (FAO, 2014), these 5 species make up 90% of all fish production by volume (Bostock et al., 2016). Additionally, Turbot (Scophthalmus maximus) and Meagre (Argyrosomus regius) are upcoming species. The industry in the European Union employs currently approximately 80.000 people, from which a fourth is working in Spain, followed up by a high number of employees in Greece, Italy and Portugal (European Commission, n.d. h).
Shellfish aquaculture plays a dominant role within the EU context (Ferreira and Bricker, 2015) including; Mussels (Mytilidae sp.), Pacific Oyster (Crassostrea gigas), European Flat Oyster (Ostrea
edulis), Manila Clam (Ruditapes philippinarum)in terms of a total harvested volume, which is close to 450.000 MT.
Production takes place in a variety of marine and freshwater systems. The most dominant are (1) marine supported and suspended culture (non-fed sedentary and attached animals followed up by (2) large scale systems – marine sites, using mechanized systems, and (3) intensive freshwater flow-through and partial recirculation systems (Lane et al., 2014; Bostock et al., 2016) (Table 1).
GAIN Deliverable 3.3
File: GAIN D3.3 – Report on value chain mapping for key species/systems, with SWOT analysis of key informants
The project has received funding from the European Union's Horizon 2020 Framework Research and Innovation Programme under GA n. 773330
13 of 56
Table 1: EU aquaculture species categorized by production volume, system and country (GAIN Consortium, 2017)
EU Species Production (t) (2015) Dominant Production
System / (fresh/salt)
Main EU Production
Countries/Regions
Atlantic Salmon (Salmo salar) 1,492,300 Intensive seafarming (saltwater)
Norway/Scotland
Rainbow Trout (Oncorhynchus
mykiss) 290,652 (semi)-Intensive farming
(freshwater) Italy, France, Denmark, Spain, Germany
European Seabass (Dicentrarchus labrax)
100,292 Extensive and semi-intensive farming (saltwater cage and pond systems)
Germany and the Mediterranean
Gilthead (Sea)Bream (Sparus
aurata) 78,963 (semi)-Intensive farming
(saltwater) Mediterranean
Common Carp (Cyprinus carpio) 59,865 Extensive and intensive (freshwater)
East-Europe
Turbot (Scophthalmus maximus) 9,773 Extensive and semi-intensive (on-shore tanks and cages)
Portugal, Spain, France, Germany, United Kingdom and Denmark
Meagre (Argyrosomus regius) 5,063 Semi-intensive (saltwater cage)
France, Spain, Portugal, Italy
Mussels (Mytilidae sp.) 324,770 Extensive (saltwater) Spain, France, Germany, Denmark, Norway, Netherlands, UK, Ireland
Pacific Oyster (Crassostrea gigas) 83,414 Extensive (saltwater) Norway, Germany, Ireland, UK, France, Spain,
European Flat Oyster (Ostrea
edulis) 3,083 Extensive (saltwater) Croatia, Bosnia, Greece, Netherlands,
Norway, France, Spain, UK, Ireland
Manila Clam (Ruditapes
philippinarum) 35,036 Extensive (saltwater) (Ireland, France, UK, Italy, Spain)
The selection of species within the GAIN Project is based on socio-economic relevance of these species
in terms of global demand and niche markets (local and organic) from a range of production sites and
methods. Additional species show potential for marine aquaculture, while climate resilient species are
being researched for expansion or introduction, but are not included in this analysis. The species being
researched under the ‘H2020 DIVERSIFY’ project include meagre (Argyrosomus regius), greater
amberjack (Seriola dumerili) for warm-water marine cage culture, wreckfish (Polyprion
americanus) for warm- and cool-water marine cage culture. Additionally, the
Atlantic halibut (Hippoglossus hippoglossus) is suitable for marine cold-water culture, while the grey
mullet (Mugil cephalus), a euryhaline herbivore, thrives better in pond/extensive culture,
and pikeperch (Sander lucioperca) are suitable for freshwater intensive culture using recirculating
systems (Diversify, 2013). Additional projects, such as ClimeFish, are also assessing strategies to
ensure sustainable growth under climate change scenarios (ClimeFish, 2016). Resilience against

GAIN Deliverable 3.3
File: GAIN D3.3 – Report on value chain mapping for key species/systems, with SWOT analysis of key informants
The project has received funding from the European Union's Horizon 2020 Framework Research and Innovation Programme under GA n. 773330
14 of 56
climate change could be achieved by diversification of species and distribution of production (FAO,
2016b).
3.2.1 Atlantic Salmon (Salmo salar)
The majority of the salmon production takes place in Norway, which is the most developed
aquaculture value chain in Europe (EU and EEA) (Asche et al., 2018), producing approximately 1.3
million MT in 2016 (FAO, n.d. g). The production increased with over 1 million MT since the year 2000
(Figure 2) (FAO, no date b). Grow out production is exclusively in net pens in relatively sheltered fjords,
lochs and bays, relying on environmental services to disperse wastes and provide clean water. The
main recent innovation in production/ management practices is the introduction of Recirculating
Aquaculture Systems (RAS) for smolt production. Whereas historically, smolts were predominantly
produced freshwater cages and flow through systems, they did not offer the same amount of control
as RAS. Temperature, water quality, light regimes can be used to grow smolts to much larger sizes, in
closely controlled disease-free environments, before they go to sea. The advantage is that the smolts
are more robust when they go to the marine environment and mortality is much reduced from
challenges such as the shock of movement, and exposure to sea lice and environmental stresses.
The Norwegian aquaculture production is covered by approximately 20 large companies, producing
approximately 1.3 million MT in 2016 (salmonbusiness, 2019; Aas et al., 2019), from which the
majority of the production is dominated by only a few companies. Feed production takes place in 4
large companies (Biomar, Cargill (Ewos), MOWI and Skretting), from which some have a global
presence. It must be noted that a trend of vertical integration is observed, where some fish production
companies are producing their own feed (Asche et al., 2013). In 2016, 1.62 million metric tonnes of
feed were used to support production. The composition of feed changed significantly since 2012 and
includes an increasing share (% in DM) of terrestrial plant ingredients, such as soy protein concentrate
(19%), which has become a major source of protein. Additionally, included are wheat gluten (9%), corn
gluten (3.6%), faba beans (3.4%), sunflower meal (1.1%), pea protein concentrate (1.3%), sunflower
protein (0.5%), other vegetable protein (2.3%). Plants oil used are mainly rapeseed and camelina oil
(19.8%), and to a much more limited extent linseed oil (0.3%). Carbohydrates are included in the form
of wheat (8.9%), pea starch (0.8%) and others (1%). Marine ingredients converted into fishmeal make
up 14.5% of the feed, of which 2.8% of feed inclusion originated from trimmings. Marine oils originate
currently almost entirely from forage fish, and constitute around 7.8% of the feed, while trimmings
make up 2.6% of the feed inclusion. It must be noted that the majority of the marine ingredients fed
are imported and certified under IFFOrs, while plant ingredients, also mostly imported, show a lower
proportion of certification. Finally, micro ingredients, such as crystalline amino acids, phosphorus
sources and astaxanthin cover 4% of the total inclusion of salmon feeds in 2016 (Aas et al., 2019).
Slaughtering and primary processing (gutting) takes place in approximately 60 plants. This sector is
considered fragmentated, as approximately only half of the total revenue generated by 5 large
companies (EY, 2017). New development, such as processing boats shows potential and this might

GAIN Deliverable 3.3
File: GAIN D3.3 – Report on value chain mapping for key species/systems, with SWOT analysis of key informants
The project has received funding from the European Union's Horizon 2020 Framework Research and Innovation Programme under GA n. 773330
15 of 56
become more relevant in the future, as it shows several advantages in terms of lower mortalities,
lower contamination risk and improved fish welfare.
Norwagian salmon production is export driven and makes up 53% of global salmon production (FAO,
2018). Demand for salmon products (e.g. frozen fillets) in the European Union (EU28) and the USA is
stabilizing, while the demand for other salmon products, such as fresh salmon is increasing in the
European Union. Additionally, exports towards South-East Asian and Latin American markets show
potential (FAO, 2019b).
Figure 2: Geographical distribution of Salmon farming production (MT) between 2000 (left), and 2015 (right). Figure made
by Wesley Malcorps, based on (FAOSTAT, 2019)
Sea lice remains the biggest cause of mortality and is a source of criticism of the industry for welfare
reasons as well as disease transfer to vulnerable wild stocks. Physical and biological control/
management of sealice is being developed in preference to chemical treatment that dominated until
recently.
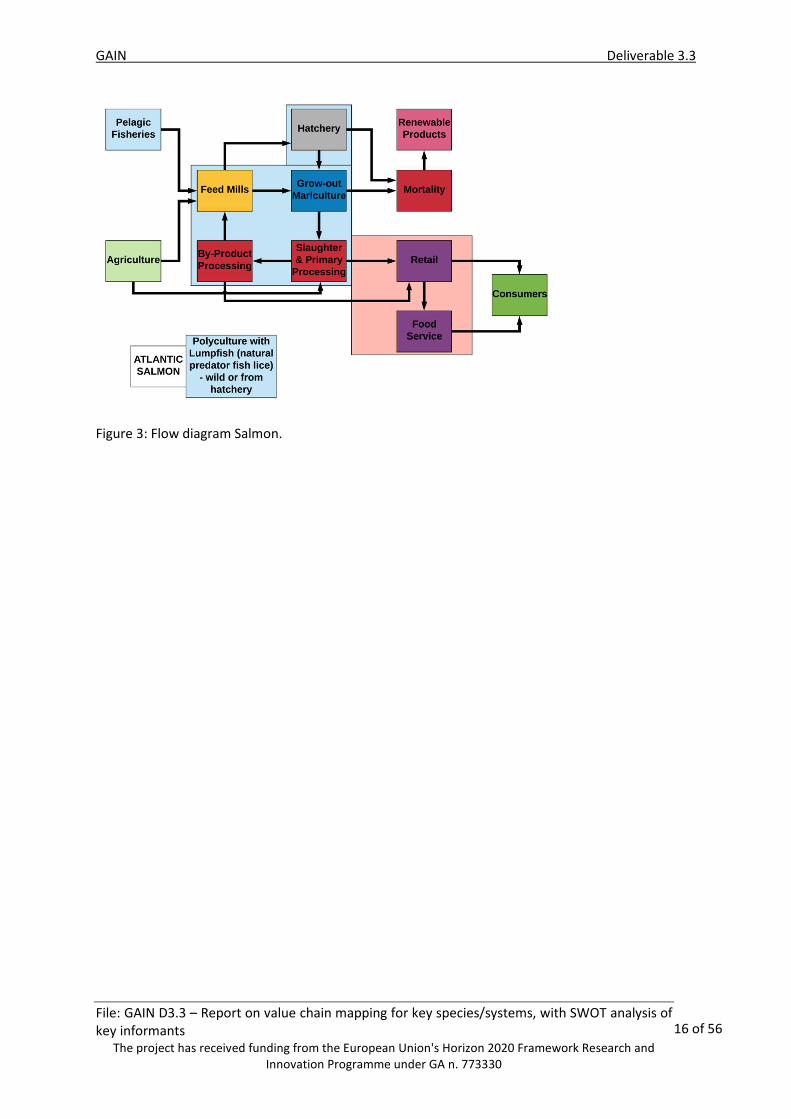
Despite significant challenges, substantial growth has been achieved with suitable environment for
marine aquaculture supported by increasingly vertically integrated value chains (Figure 3). The
production volume increased over the last decades, during a period of consolidation reducing
production costs and improving efficiency. In 2017 a total of approximately 1600 companies involved
in salmon and trout farming employed 7400 employees (Eurofish, n.d.). It must be noted that an
enormous shift from unskilled labour to academic qualified employees took place (FAO, no date b).
Additional factors contributing to the increase in production are ‘economics of scale’ resulting in
relative cost saving as result of increasing production. Additionally, the innovation model in Norway is
well established, consisting of industry, R&D and National and local authorities (FAO, no date b;
SINTEF, 2015).
GAIN Deliverable 3.3
File: GAIN D3.3 – Report on value chain mapping for key species/systems, with SWOT analysis of key informants
The project has received funding from the European Union's Horizon 2020 Framework Research and Innovation Programme under GA n. 773330
16 of 56
Figure 3: Flow diagram Salmon.

GAIN Deliverable 3.3
File: GAIN D3.3 – Report on value chain mapping for key species/systems, with SWOT analysis of key informants
The project has received funding from the European Union's Horizon 2020 Framework Research and Innovation Programme under GA n. 773330
17 of 56
Table 2: SWOT Analysis of Atlantic Salmon Production in the EU
Strengths Weaknesses
• High production • Production countries have a history of
production and experience • Established quality • Technology driven
• Marketing • Tasty and versatile fish (multiple product forms,
smoked etc) • Healthy (omega-3 content) • Establishing value addition opportunities
• Quality perception (wild vs farmed) • Negative media attention and public
perception; environment and welfare • High dependency on marine ingredients • Control of sea lice remains a challenge
Opportunities Threats
• Increasing export opportunities, especially China • Higher outputs as a result of technology • New technologies create USP (traceability,
salmon face recognition) • Pioneers of precision aquaculture
• Open systems and therefore less resilient (pollution, diseases etc.)
• Climate change • Chinese and other increasing external
competition • Competition for feed ingredients (marine) • Lack of space for expansion
3.2.2 Rainbow Trout (Oncorhynchus mykiss)
The total production of rainbow trout decreased from approximately 290,000MT to 250,000MT
between 2000 and 2015, respectively. The European Union represented 31% of global production in
2007, but this decreased to 23% in 2016 covered by Italy, Denmark, France, Spain, Poland, United
Kingdom, Finland (EUMOFA, n.d. b). Norway is the largest producer, as part of the European Union
(EU) and the European Economic Area (EEA) and represent a production volume of 75.000 tonnes in
2012, based on FAO and FEAP data (Janssen et al., 2015). Total production in intensive freshwater
flow-through was approximately 150.000MT-160.000MT (Bostock et al., 2016), while saltwater
production accounted for 91.000MT in 2015 (FAOSTAT, 2019). (Figure 3). Based on FAOSTAT, marine
culture showed a relative increase from 21% towards 37%, while freshwater showed a decrease from
75% till 59%, from 2000 till 2015, respectively (Figure 4). The reduction could be explained by
environmental legislation, as well as increased competition with the salmon industry (Bostock et al.,
2016) and trout producers outside of the European Union, such as in Turkey (Undercurrentnews,
2014)
Rainbow trout in Europe is produced by approximately 15 breeding companies (Janssen et al., 2015).
Production takes place in raceways and ponds with flow through from rivers systems (Figure 5).
However, they can also be produced in cages and recirculation systems (FAO, n.d. c). They are begin

GAIN Deliverable 3.3
File: GAIN D3.3 – Report on value chain mapping for key species/systems, with SWOT analysis of key informants
The project has received funding from the European Union's Horizon 2020 Framework Research and Innovation Programme under GA n. 773330
18 of 56
fed with a range of feed ingredients from marine and terrestrial resources, namely fishmeal, fish oil,
soybean meal, wheat gluten soy oil and canola oil, wheat and corn starch. Additionally, ingredients
such as krill meal and animal by-products can be found in trout feed (FAO, n.d. d). A significant
proportion of rainbow trout is smoked in the European Union in countries, such as Poland, United
Kingdom, Germany, France (EUMOFA, n.d. b). It must be noted that trout shows a self-sufficiency rate
in the EU of 89%, as a result of the increased farmed production. In other words, European
consumption demand is met with the current production rates.
Figure 4: Geographical distribution of rainbow trout farming production (MT) between 2000 (upper-left), and 2015 (upper-
right) and freshwater (lower-left) and marine (lower-right) production systems. Figure made by Wesley Malcorps, based on
(FAOSTAT, 2019).

GAIN Deliverable 3.3
File: GAIN D3.3 – Report on value chain mapping for key species/systems, with SWOT analysis of key informants
The project has received funding from the European Union's Horizon 2020 Framework Research and Innovation Programme under GA n. 773330
19 of 56
Figure 5: Flow diagram Rainbow Trout.
Table 3: SWOT Analysis of Rainbow Trout Production in the EU
Strengths Weaknesses
• Lower inclusion of marine ingredients than salmon
• Production in marine and freshwater
• Production in different systems • Well established species • Can be produced in variety of sizes for different
markets (pan size or larger) • Is also produced for large restocking and sport
fishing market (diversification) • Not susceptible to sea lice in freshwater • Potentially more sites available • Favourable taste and health perception
• Quality perception (wild vs farmed) • Less well developed than salmon • Product competes with salmon • Less established export markets than salmon • Shrinking domestic production • Dependence on wide range of broodstock
(spawning seasonal)
Opportunities Threats
• Product diversification into domestic and export markets
• Space for growth, especially in inland waters • Better processing and use of by-products
• Open systems and therefore less resilient (pollution, diseases etc.)
• Climate change • Growing non-EU production (competition) • Lower production costs in Turkey

GAIN Deliverable 3.3
File: GAIN D3.3 – Report on value chain mapping for key species/systems, with SWOT analysis of key informants
The project has received funding from the European Union's Horizon 2020 Framework Research and Innovation Programme under GA n. 773330
20 of 56
3.2.3 European Seabass (Dicentrarchus labrax) and Gilthead (Sea)Bream (Sparus aurata)
Seabass and seabream farming share the same geographical distribution, as they require similar
environmental conditions and are sometimes produced in ‘alternate culture’. Due to the grazing
nature of seabream on algae, it is common to have a cycle of sea bream after a cycle of seabass culture
within the same facilities. The seabream effectively de-foul the cages ready for the next cycle of
seabass.
The seed supply for both seabream as well as seabass is sophisticated and required skilled staff in the
hatcheries. Once the larvae are hatched the nutrients are provided by the sac for the first few days.
This is followed up by a diet of microscopic algae and zooplankton. The next diets consist of artemia
and a high-protein diet (European Commission, n.d. b; European Commission, n.d. c). The grow-out
phase of the production is dominated by sea cage farming systems, while some are farmed in seawater
ponds and lagoons (Figure 7 and 8). The production increased from approximately 42.000 MT in 2000
to approximately 70.000 MT in 2015, according to (FAOSTAT, 2019). On the other hand, gilthead
seabream production increased from 60.000MT to 83.000MT from 2000 till 2015, based on (FAOSTAT,
2019) (Figure 6). The majority of the production takes place in on-growing sea cages, which is
considered the most profitable due to low energy costs.
Seabass and seabream are fed a mixture of marine and terrestrial ingredients and over the last
decades the inclusion of fishmeal in the diets decreased significantly. Major ingredient components
consist of fishmeal, krill meal, corn (gluten meal), wheat (gluten), pea, faba beans, lupins. Additionally,
oilseeds such as rapeseed meal, sunflower meal, full fat soybean, soybean meal and soy protein
concentrate are included in the diets. Most of these ingredients are imported from outside Europe.
Seabass is often marketed as whole or fresh and only a minority of the production undergoes
processing or value addition. This is also applicable for most of the produced seabream in the main
European markets, such as Italy (EUMOFA, 2014; European Commission, n.d.). This is mainly because
of consumer preferences in southern Europe (The Fish Site, 2010). Seabass and seabream exports are
being dominated by intra-EU trade, and exports outside the European Union are very low (European
Commission, n.d. b; European Commission, n.d. c).

GAIN Deliverable 3.3
File: GAIN D3.3 – Report on value chain mapping for key species/systems, with SWOT analysis of key informants
The project has received funding from the European Union's Horizon 2020 Framework Research and Innovation Programme under GA n. 773330
21 of 56
Figure 6: Geographical distribution of seabass farming production (MT) in 2000 (upper-left), and 2015 (upper-right) and
gilthead seabream farming in 2000 (lower-left) and 2015 (lower-right). Figure made by Wesley Malcorps, based on
(FAOSTAT, 2019).
Figure 7: Flow diagram European Seabass (Spain)

GAIN Deliverable 3.3
File: GAIN D3.3 – Report on value chain mapping for key species/systems, with SWOT analysis of key informants
The project has received funding from the European Union's Horizon 2020 Framework Research and Innovation Programme under GA n. 773330
22 of 56
Figure 8: Flow diagram Gilthead Seabream (Spain)
Table 4: SWOT Analysis of European Seabass Production in the EU
Strengths Weaknesses
• Tolerant to changing environments (5-28°C) and fluctuating salinities
• Well established product throughout the EU • Favourable taste and health perceptions
• Quality perception (wild vs farmed) • One breeding season per year • High mortality at hatchery
• Need for live feeds • High labour and production costs (marine
hatchery RAS) • High price of product • Feed ingredients imported • Largely unprocessed
Opportunities Threats
• Better processing • Value addition and diversification
• Market access
• Open systems and therefore less resilient (pollution, diseases etc.)
• Aquaculture expansion in Turkey • Competing with other market segments, such
as white fish species; pangasius, tilapia and Asian sea bass
GAIN Deliverable 3.3
File: GAIN D3.3 – Report on value chain mapping for key species/systems, with SWOT analysis of key informants
The project has received funding from the European Union's Horizon 2020 Framework Research and Innovation Programme under GA n. 773330
23 of 56
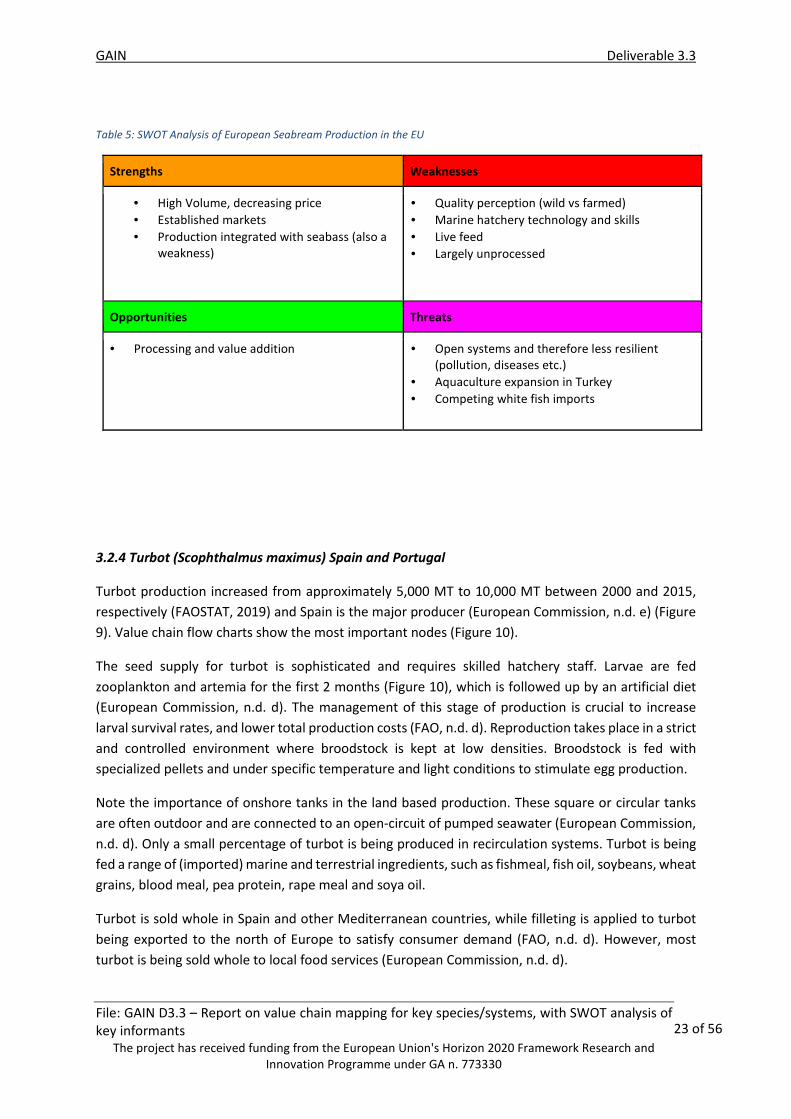
Table 5: SWOT Analysis of European Seabream Production in the EU
Strengths Weaknesses
• High Volume, decreasing price • Established markets • Production integrated with seabass (also a
weakness)
• Quality perception (wild vs farmed) • Marine hatchery technology and skills • Live feed • Largely unprocessed
Opportunities Threats
• Processing and value addition
• Open systems and therefore less resilient (pollution, diseases etc.)
• Aquaculture expansion in Turkey • Competing white fish imports
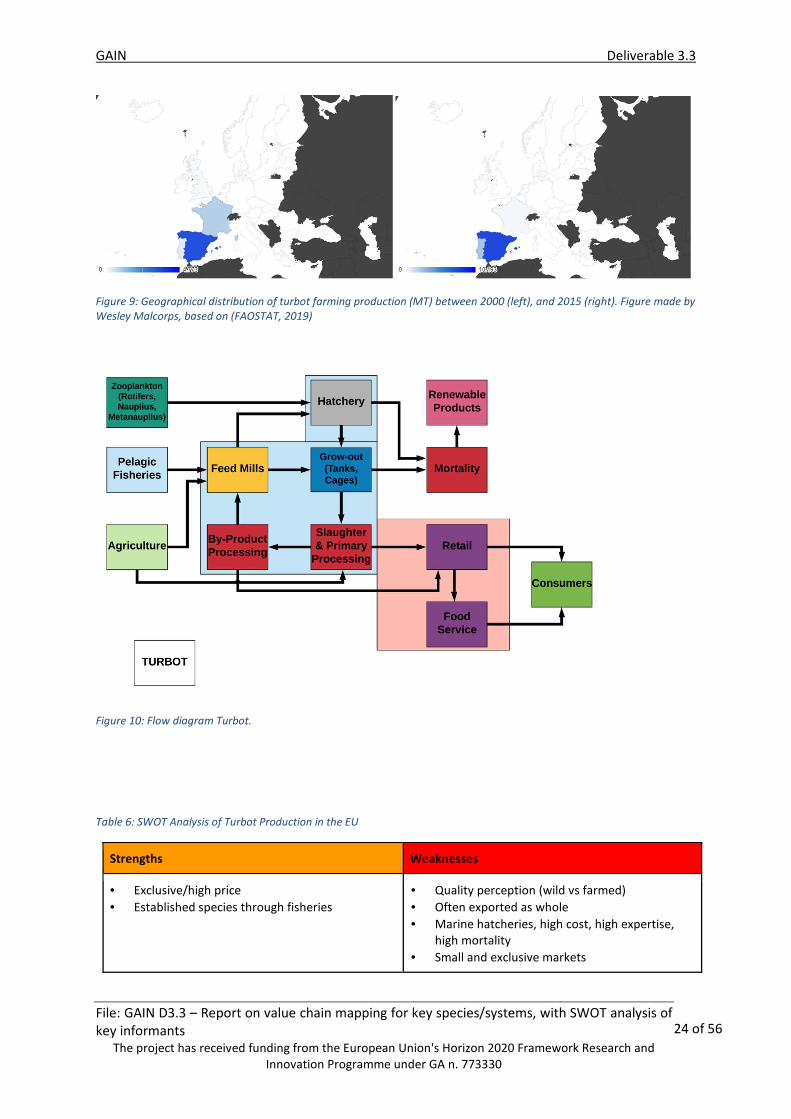
3.2.4 Turbot (Scophthalmus maximus) Spain and Portugal
Turbot production increased from approximately 5,000 MT to 10,000 MT between 2000 and 2015,
respectively (FAOSTAT, 2019) and Spain is the major producer (European Commission, n.d. e) (Figure
9). Value chain flow charts show the most important nodes (Figure 10).
The seed supply for turbot is sophisticated and requires skilled hatchery staff. Larvae are fed
zooplankton and artemia for the first 2 months (Figure 10), which is followed up by an artificial diet
(European Commission, n.d. d). The management of this stage of production is crucial to increase
larval survival rates, and lower total production costs (FAO, n.d. d). Reproduction takes place in a strict
and controlled environment where broodstock is kept at low densities. Broodstock is fed with
specialized pellets and under specific temperature and light conditions to stimulate egg production.
Note the importance of onshore tanks in the land based production. These square or circular tanks
are often outdoor and are connected to an open-circuit of pumped seawater (European Commission,
n.d. d). Only a small percentage of turbot is being produced in recirculation systems. Turbot is being
fed a range of (imported) marine and terrestrial ingredients, such as fishmeal, fish oil, soybeans, wheat
grains, blood meal, pea protein, rape meal and soya oil.
Turbot is sold whole in Spain and other Mediterranean countries, while filleting is applied to turbot
being exported to the north of Europe to satisfy consumer demand (FAO, n.d. d). However, most
turbot is being sold whole to local food services (European Commission, n.d. d).
GAIN Deliverable 3.3
File: GAIN D3.3 – Report on value chain mapping for key species/systems, with SWOT analysis of key informants
The project has received funding from the European Union's Horizon 2020 Framework Research and Innovation Programme under GA n. 773330
24 of 56
Figure 9: Geographical distribution of turbot farming production (MT) between 2000 (left), and 2015 (right). Figure made by
Wesley Malcorps, based on (FAOSTAT, 2019)
Figure 10: Flow diagram Turbot.
Table 6: SWOT Analysis of Turbot Production in the EU
Strengths Weaknesses
• Exclusive/high price • Established species through fisheries
• Quality perception (wild vs farmed) • Often exported as whole • Marine hatcheries, high cost, high expertise,
high mortality • Small and exclusive markets

GAIN Deliverable 3.3
File: GAIN D3.3 – Report on value chain mapping for key species/systems, with SWOT analysis of key informants
The project has received funding from the European Union's Horizon 2020 Framework Research and Innovation Programme under GA n. 773330
25 of 56
Opportunities Threats
• Processing and value addition
• Emerging species
• Open systems and therefore less resilient (pollution, diseases etc.)
• Low market opportunities
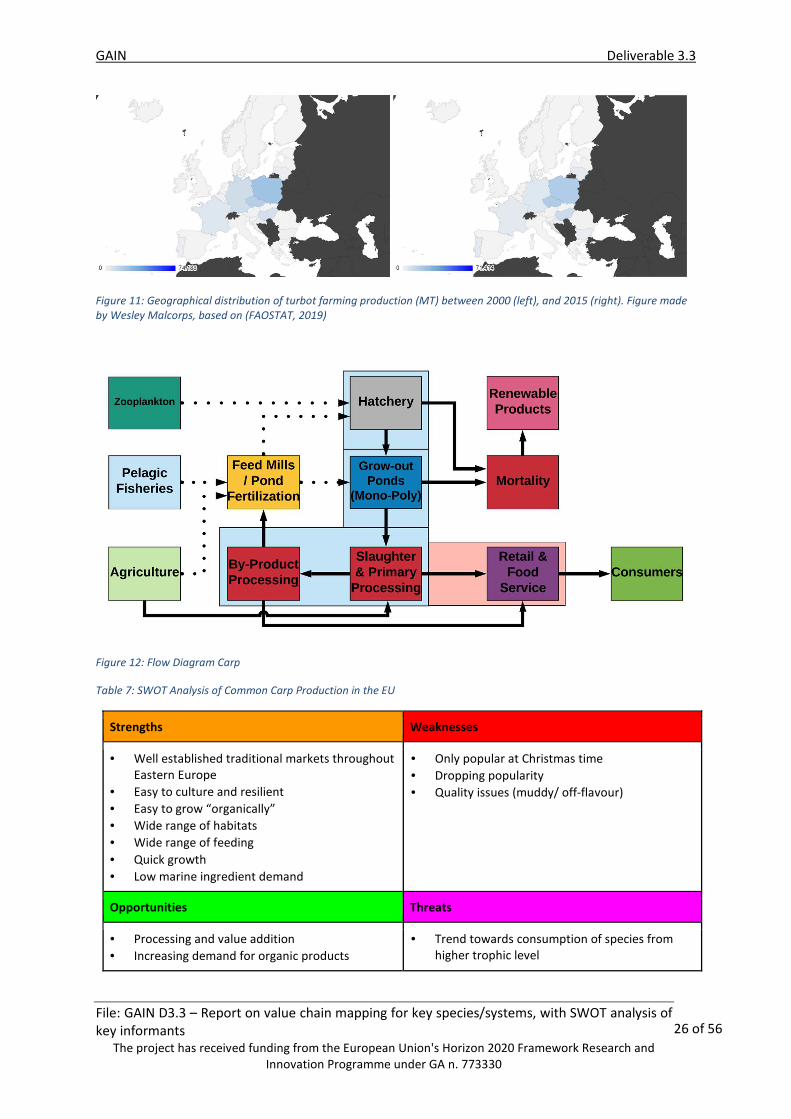
3.2.5 Common Carp (Cyprinus carpio) (Poland).
Carp aquaculture is ancient and well-established having been introduced from Asia during the Middle
Ages. Traditionally the fish was grown in low densities with little or no feeding. Carp production is
often classified as organic aquaculture because of the extensive nature of production but represents
only 4.7% of the total EU aquaculture production. This production approach is characterised by farm
management that combines best environmental practices, high level of biodiversity, and preservation
of natural resource with high animal welfare standards and supporting rural development (Guiseppe
and Mente, 2019).
Common carp production slightly decreased from approximately 74.2MT to 71.4 MT between 2000
and 2015, respectively (FAOSTAT, 2019) (Figure 11). This production takes mainly place in farmed
extensive systems in the rural areas the Czech Republic, Poland, Hungary and Germany.
Carp feeds mainly on natural organisms from pond fertilization, however, feed is sometimes applied
(Figure 12). Periodic grading takes place in order to sustain significant growth. At the start of the winter
carp is being transferred to a special tank, in which they reduce their activity and feed intake. The
spring of the third year is the time where the carp is moved to large ponds, where their natural feed
is supplemented with pellets. These pellets include ingredients, such as fishmeal, fish oil, plant
ingredients and vitamin and mineral supplements (European Commission, n.d. d). Harvest time is
December for the traditional Christmas market, typically 1.5 kg per specimen, sold live. However, a
change in consumer perspective has been observed, with increasing processing in fillets. Nevertheless,
live sales still dominate marketing of the species.
GAIN Deliverable 3.3
File: GAIN D3.3 – Report on value chain mapping for key species/systems, with SWOT analysis of key informants
The project has received funding from the European Union's Horizon 2020 Framework Research and Innovation Programme under GA n. 773330
26 of 56
Figure 11: Geographical distribution of turbot farming production (MT) between 2000 (left), and 2015 (right). Figure made
by Wesley Malcorps, based on (FAOSTAT, 2019)
Figure 12: Flow Diagram Carp
Table 7: SWOT Analysis of Common Carp Production in the EU
Strengths Weaknesses
• Well established traditional markets throughout Eastern Europe
• Easy to culture and resilient • Easy to grow “organically” • Wide range of habitats • Wide range of feeding
• Quick growth • Low marine ingredient demand
• Only popular at Christmas time • Dropping popularity • Quality issues (muddy/ off-flavour)
Opportunities Threats
• Processing and value addition • Increasing demand for organic products
• Trend towards consumption of species from higher trophic level
GAIN Deliverable 3.3
File: GAIN D3.3 – Report on value chain mapping for key species/systems, with SWOT analysis of key informants
The project has received funding from the European Union's Horizon 2020 Framework Research and Innovation Programme under GA n. 773330
27 of 56
• Competing species
3.2.6 European Blue Mussel (Mytillus edulis)
European blue mussel farming was the first organised shellfish farming in Europe. The major producers
in the European Union produce approximately 470,000MT, from which Italy produces 67,000, France
57,000, and the Netherlands approximately 54,000. It represents one third of all aquaculture
production in the European Union (European Commission, n.d. f; FAO, n.d. f; SeafoodSource, 2019)
and mussel farming in Europe produces 34% of the global mussel production (EUMOFA, n.d. c).
Mussels are often sold alive, but are also found canned, marinated or mixed with sauce. The main
processor of mussels is Spain, who produce almost 14.000 MT of canned mussels in 2016, according
to ANFACO. Most of the trade in mussels is intra-EU (EUMOFA, n.d. c). Where processing does occur,
it has often been a problem to dispose of the shells because there are few market opportunities, but
include making into building materials.
Table 8: SWOT Analysis of Mussel Production in the EU
Strengths Weaknesses
• Native
• No feed inputs • Regarded as environmentally benign • Established species • High omega-3, healthy. • Multiple systems • Potential in IMTA
• Filter feeders vulnerable to pollution/ bioaccumulation
• Depuration can have high energy costs and carbon footprint
• Low value by-products • Mixed reputation among consumers
Opportunities Threats
• Low impact food becoming more popular
• Open systems and therefore less resilient (pollution, diseases, predation, etc)
3.2.7 Oysters; Pacific cup oyster (Crassostrea gigas) and European flat oyster (Ostrea edulis)
The pacific cupped oyster is an exotic species, originally originating from Japan and was introduced
into the UK in 1965 (Wolff and Reise, 2002). The European Union had the fourth highest production
level wordwilde of 142.000 MT, with France being the dominant producer. On the other hand, the
European flat oyster is the native species, but shows a significantly lower production of 3000 MT (GAIN
consortium, 2017). Additionally, it must be noted that the wild populations of European oyster are

GAIN Deliverable 3.3
File: GAIN D3.3 – Report on value chain mapping for key species/systems, with SWOT analysis of key informants
The project has received funding from the European Union's Horizon 2020 Framework Research and Innovation Programme under GA n. 773330
28 of 56
highly endangered, as a result of overexploitation, habitat loss, pollution and disease. Currently there
is much effort to restore the native populations in Europe, which will create natural reefs beneficial
for local fish species. However, this is challenging due its slow growth rate and sensitivity for diseases
(NORA, n.d.).
The production of the Pacific cup oysters starts with the collection of the oyster larvae at strategic
locations in the wild, which are placed in tanks and fed algae. The oysters are then attached to a
substrate, which can be mesh bags (off-bottom), directly on the intertidal ground (bottom culture),
container culture at depths of 10 meters, or on ropes (suspended culture) and feed themselves with
plankton (European Commission, n.d. g). This process is relatively similar for the European flat oyster,
but this species is more sensitive to diseases. This has resulted in a demand for hatcheries trying to
develop a disease resistant strain (The Fish Site, 2010a). Until now, hatchery development has
focussed mainly on the pacific cup oyster, rather than the European oyster, due to it difficulties in this
production phase (FAO, n.d. f).
The main market for the pacific cup oyster is France where they are sold and consumed live (European
Commission, n.d. g). Most of the oysters are shipped to local markets and restaurants and consumed
half on the shell (FAO, n.d. f).
Table 9: SWOT Analysis of Pacific Oyster Production in the EU
Strengths Weaknesses
• Fast growth • Luxury, high value species
• Established with good provenance • Healthy, omega-3, micro nutrients • Unfed and regarded as environmentally benign
• Open systems and therefore less resilient (pollution etc.)
• non-native • Filter feeder susceptible to pollution and
bioaccumulation
Opportunities Threats
• Precision aquaculture and monitoring systems • Open systems and therefore less resilient (pollution, diseases etc.)
GAIN Deliverable 3.3
File: GAIN D3.3 – Report on value chain mapping for key species/systems, with SWOT analysis of key informants
The project has received funding from the European Union's Horizon 2020 Framework Research and Innovation Programme under GA n. 773330
29 of 56
Table 10: SWOT Analysis of Flat Oyster Production in the EU
Strengths Weaknesses
• Native oyster species High value species
• Unfed/ environmentally benign • Healthy, high in omega-3
• Slow growth • May not be price competitive with Pacific
oysters • Susceptible to pollution and bioaccumulation
• Susceptible to disease
Opportunities Threats
• Hatchery technology development
• Open systems and therefore less resilient (pollution, diseases etc.)
3.2.8 Striped Catfish (Pangasianodon hypophthalmus)
The striped catfish is more commonly known as basa by retailers or pangasius among scientific circles.
It is a white fish regarded as an overwhelming success story of intensification, with production
volumes of only a few tens of thousands of tonnes in 2000 rising to well over a million tonnes by 2012,
since when production stagnated for several reasons. Production of pangasius is dominated by
Vietnam (Figure 13) who pioneered the technology to close the cycle of successful large-scale
reproduction in hatcheries. Since 2000, a highly sophisticated, modern value chain has developed
supported by government and private initiatives. Production is almost exclusively in the Mekong Delta
which means highly concentrated production can be transported quickly to processors with highly
efficient economies of scale.
The fast growth of the industry brought a number of problems and criticisms. Western NGOs and
consumer groups criticised the industry as being dirty and exploitative while producing an unsafe
product. However, much of this was unfounded and based on protectionism as it competed with
higher cost domestically produced white fish from fisheries and aquaculture (Little et al., 2012).
Nevertheless, the negative press, along with disease issues and stagnating farm-gate prices led to
small scale farmers, struggling to make profits and a period of consolidation ensued, which arguably,
continues today. Imports into the EU remain significantly lower than at their peak in 2009(CBI, 2018),
but show recovery in the beginning of 2019 with an increase in export of 30% compared to the
beginning of 2018 (Comayimexco, 2019).

GAIN Deliverable 3.3
File: GAIN D3.3 – Report on value chain mapping for key species/systems, with SWOT analysis of key informants
The project has received funding from the European Union's Horizon 2020 Framework Research and Innovation Programme under GA n. 773330
30 of 56
Figure 13: Pangasius production in the Mekong Delta of Vietnam 2019, thousands of tonnes (Vietnam Pangasius
Association, 2019)
Since the high volatility of the market in the years following the price stagnation, Vietnamese
production has stabilised but with government targets to produce 2million MT. Vietnam is a
communist country, where the government has a very powerful influence over the industrial
strategies of the nation, including investment, land ownership and designation. However, private
companies also have a large influence and the two are not mutually exclusive with company owners
having influential roles within the Communist Party that control policy.
Production is almost universally in earth ponds, but they are much deeper than traditional fish ponds
at up to 4 meters. The intensive nature of production can mean rapid water degradation, which the
deep ponds mitigate against, where the uneaten feed and faeces sink to the bottom and form an
anoxic sludge. The fish populate the top layers of the pond and are facultative air breathers so they
can supplement their oxygen when water quality becomes poor. The minimal water exchange, and
sludge management remains a challenge (Phan, 2014).
Strict protocols need to be operated to achieve third party certification such as ASC, which EU buyers
are becoming more insistent on to give them confidence over the quality and responsible production
of the product where consumer confidence is low and legislation is thought to be weak and poorly
enforced.
The product is processed into skinless fillets and mostly exported all over the world, with popular
markets in the EU, USA, China, Middle East, CIS and Australia. The consolidated and universal nature
of the product has provided a good market for the processing by-products (Newton et al., 2014), which
are collected and processed into “marine ingredients” and mostly used for pig feeds. Lead firms such
as Vinh Hoan, which is one of the largest integrated producers and processors is pioneering better
utilisation of by-products by separation and further processing, especially fish collagen from skins.
Although Vietnam is the largest producer by far, other countries are now starting to produce
pangasius, such as Bangladesh which produces solely for its domestic market. However, they are
regarded as a competitor by the Vietnamese and may seek to find export markets in the future.
GAIN Deliverable 3.3
File: GAIN D3.3 – Report on value chain mapping for key species/systems, with SWOT analysis of key informants
The project has received funding from the European Union's Horizon 2020 Framework Research and Innovation Programme under GA n. 773330
31 of 56
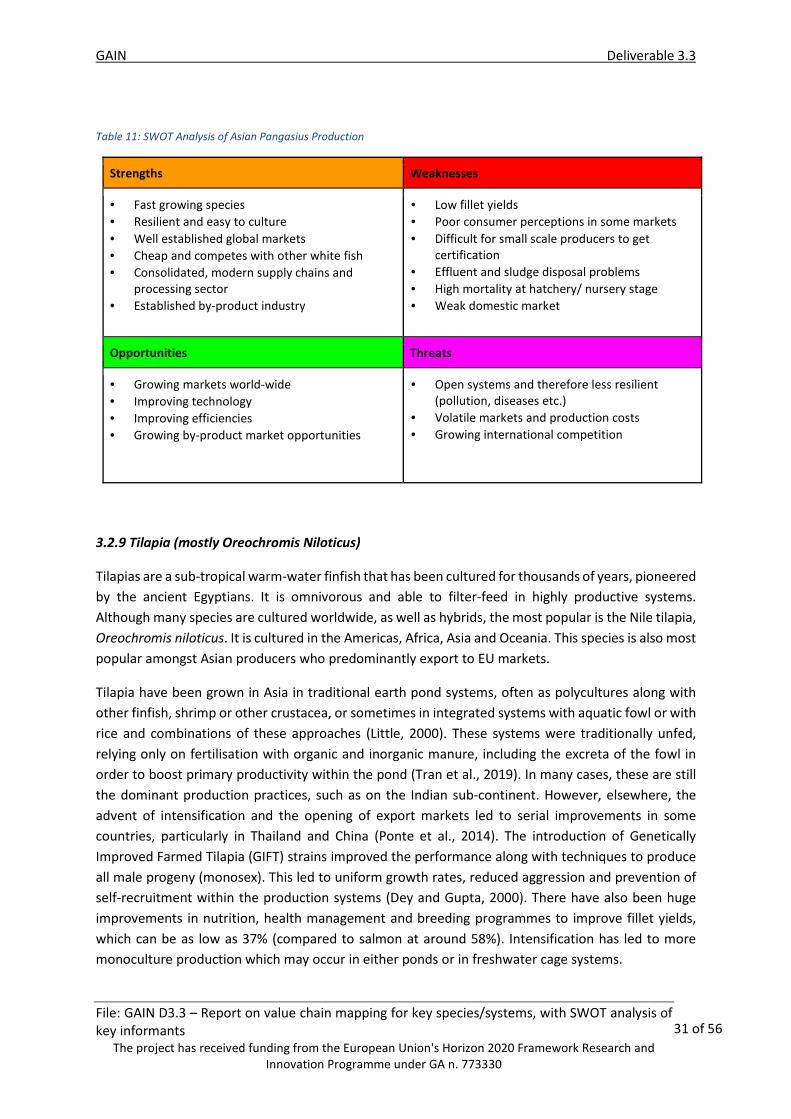
Table 11: SWOT Analysis of Asian Pangasius Production
Strengths Weaknesses
• Fast growing species • Resilient and easy to culture
• Well established global markets • Cheap and competes with other white fish • Consolidated, modern supply chains and
processing sector • Established by-product industry
• Low fillet yields • Poor consumer perceptions in some markets
• Difficult for small scale producers to get certification
• Effluent and sludge disposal problems • High mortality at hatchery/ nursery stage • Weak domestic market
Opportunities Threats
• Growing markets world-wide • Improving technology • Improving efficiencies • Growing by-product market opportunities
• Open systems and therefore less resilient (pollution, diseases etc.)
• Volatile markets and production costs • Growing international competition
3.2.9 Tilapia (mostly Oreochromis Niloticus)
Tilapias are a sub-tropical warm-water finfish that has been cultured for thousands of years, pioneered
by the ancient Egyptians. It is omnivorous and able to filter-feed in highly productive systems.
Although many species are cultured worldwide, as well as hybrids, the most popular is the Nile tilapia,
Oreochromis niloticus. It is cultured in the Americas, Africa, Asia and Oceania. This species is also most
popular amongst Asian producers who predominantly export to EU markets.
Tilapia have been grown in Asia in traditional earth pond systems, often as polycultures along with
other finfish, shrimp or other crustacea, or sometimes in integrated systems with aquatic fowl or with
rice and combinations of these approaches (Little, 2000). These systems were traditionally unfed,
relying only on fertilisation with organic and inorganic manure, including the excreta of the fowl in
order to boost primary productivity within the pond (Tran et al., 2019). In many cases, these are still
the dominant production practices, such as on the Indian sub-continent. However, elsewhere, the
advent of intensification and the opening of export markets led to serial improvements in some
countries, particularly in Thailand and China (Ponte et al., 2014). The introduction of Genetically
Improved Farmed Tilapia (GIFT) strains improved the performance along with techniques to produce
all male progeny (monosex). This led to uniform growth rates, reduced aggression and prevention of
self-recruitment within the production systems (Dey and Gupta, 2000). There have also been huge
improvements in nutrition, health management and breeding programmes to improve fillet yields,
which can be as low as 37% (compared to salmon at around 58%). Intensification has led to more
monoculture production which may occur in either ponds or in freshwater cage systems.

GAIN Deliverable 3.3
File: GAIN D3.3 – Report on value chain mapping for key species/systems, with SWOT analysis of key informants
The project has received funding from the European Union's Horizon 2020 Framework Research and Innovation Programme under GA n. 773330
32 of 56
As for pangasius, in most countries there are a huge number of small independent tilapia producers
that sell to whole sale markets before they are sold to processors (Bush and Belton, 2012). The trading
network and number of middlemen steps before the product reaches the processor varies with the
most complex network of traders in Bangladesh and other countries in the Indian subcontinent, but
these routes tend to be for domestic consumption only. There are also highly integrated companies
that export tilapia worldwide. Tilapia is also a white fish but the situation regarding competition is
different because tilapia is so widely produced compared to pangasius. In Thailand, Charoen Pokphand
(CP) is Thailand’s largest private company, employing 300,000 people (Wikipedia, accessed
24/10/2019). It is a conglomerate of companies that operate mainly in agrofood businesses, including
tilapia but many other aquatic and terrestrial species production, feeds, processing, retail etc, in
Thailand and throughout SE Asia and beyond. In addition to CP, Grobest is an integrated, producer
and processor, predominantly of aquatic animals feeds and animal health products operating mainly
in Asia. Both companies are at the forefront of utilising by-product fractions, with an effort to
maximise the edible yield such as producing snacks from trimmings and recycling other by-products
into feed ingredients in their feed industries. However, China has the largest tilapia production in the
world and exports to many countries, increasingly outcompeting the domestic markets of African and
other Asian producers. China’s aquaculture industry has been impressive, dominated by carps, but
with more valuable species becoming increasingly important. The growth in production, particularly
in shrimp and marine species, but also the sheer volumes of carps and tilapias has put pressure on
global marine ingredients supplies. China has devastated its own fisheries over decades of
mismanagement (Zhang et al., 2019) fishing further down the food web as more valuable species have
become depleted. The marine ingredients industry in China has provided an opportunity for fisheries
to stay viable parallel to aquaculture growth. The unsustainable depletion of domestic fisheries has
led to Chinese signing deals with other countries to allow them to exploit those waters too, particularly
in Africa, leading to fears over food security in those countries.
Table 12: SWOT Analysis of Asian Tilapia Production
Strengths Weaknesses
• Well established global species • Strong domestic and international markets • Omnivorous and versatile species
• Well regarded, tasty fish
• Low fillet yield • Poor quality seed in some locations
Opportunities Threats
• Improving technology • Breeding programmes for disease and fillet yield • Expanding by-product opportunities
• Open systems and therefore less resilient (pollution, diseases etc.)
• High levels of competition leading to volatility in many countries
• New disease threats (Lake virus)

GAIN Deliverable 3.3
File: GAIN D3.3 – Report on value chain mapping for key species/systems, with SWOT analysis of key informants
The project has received funding from the European Union's Horizon 2020 Framework Research and Innovation Programme under GA n. 773330
33 of 56
4. Value Chain Analysis data collection methodology
The methodology for the value chain analysis falls into two main sections. The first section is a survey
of major global seafood shows to assess business to business seafood sustainability messaging and
Key Informant interviews to assess aspects of international trade and sustainability. The major section
is a full value chain assessment conducted in country involving semi-structured surveys and interviews
with major aquaculture industry stakeholders in European production centres.
4.1 Seafood show sustainability surveys and Key Informant interviews
Seafood shows are a hotspot for traders and buyers from all over the world with different preferences
and perceptions towards seafood. Additionally, attitudes towards trade, environment, messaging and
other food cultures differ significantly round the World. Surveys will be conducted at the major
seafood shows in Boston, Brussels, Guangzhou and Qingdao in order to understand global seafood
trade, sustainability messaging attitudes and the potential of European aquaculture in the global
context of seafood trading. At first a survey regarding sustainability messaging was developed in order
to gain understanding about the different strategies to sell seafood. Secondly, a key informant survey
was developed in order to gain insight into global market aspects through a SWOT-analysis with a
focus on ‘adding value strategies’ and the use of by-products.
4.1.1 Survey sustainability messaging
Global seafood markets differ significantly in their production volumes. Global seafood trade is
complex and consumers’ preferences and perceptions differ significantly across the globe. This
influences the way that people market and promote their seafood. However, these differences are
relatively unknown. This led to a research framework developed in collaboration with researchers and
partners within GAIN and beyond to assess ‘sustainability’ messaging at global seafood shows in Asia,
Europe and the United States in 2019 (Table 13). Dates were selected based on the relationships
between the largest producers and largest seafood markets in the world, Asia, United States and
Europe, respectively.
Table 13: Details of seafood shows visited during T3.3
Seafood show Location Organizer Date (2019)
Seafood Expo North America Boston Seafood Expo Global March 17 Seafood Expo Global Brussel Seafood Expo Global May 7-9 Fishes Guangzhou Guangzhou FISHEX August 23-25 China Fisheries & Seafood Expo Qingdao China Seafood Expo October 30 –
November 1
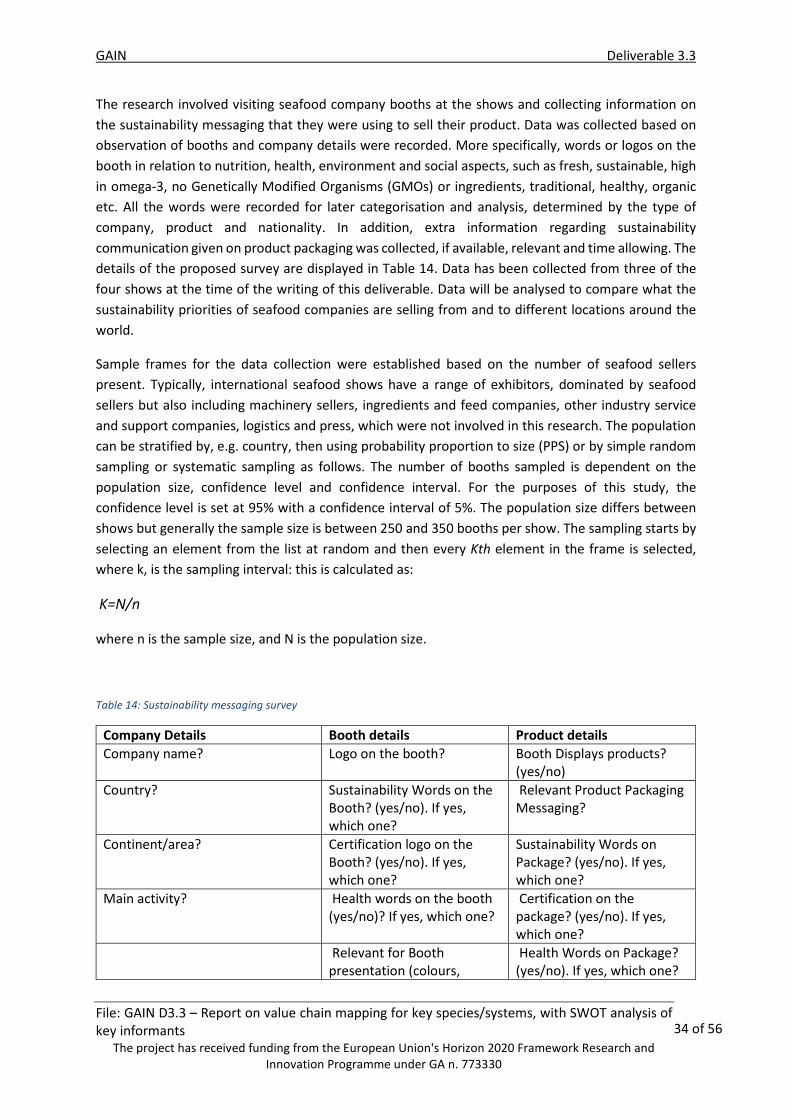
GAIN Deliverable 3.3
File: GAIN D3.3 – Report on value chain mapping for key species/systems, with SWOT analysis of key informants
The project has received funding from the European Union's Horizon 2020 Framework Research and Innovation Programme under GA n. 773330
34 of 56
The research involved visiting seafood company booths at the shows and collecting information on
the sustainability messaging that they were using to sell their product. Data was collected based on
observation of booths and company details were recorded. More specifically, words or logos on the
booth in relation to nutrition, health, environment and social aspects, such as fresh, sustainable, high
in omega-3, no Genetically Modified Organisms (GMOs) or ingredients, traditional, healthy, organic
etc. All the words were recorded for later categorisation and analysis, determined by the type of
company, product and nationality. In addition, extra information regarding sustainability
communication given on product packaging was collected, if available, relevant and time allowing. The
details of the proposed survey are displayed in Table 14. Data has been collected from three of the
four shows at the time of the writing of this deliverable. Data will be analysed to compare what the
sustainability priorities of seafood companies are selling from and to different locations around the
world.
Sample frames for the data collection were established based on the number of seafood sellers
present. Typically, international seafood shows have a range of exhibitors, dominated by seafood
sellers but also including machinery sellers, ingredients and feed companies, other industry service
and support companies, logistics and press, which were not involved in this research. The population
can be stratified by, e.g. country, then using probability proportion to size (PPS) or by simple random
sampling or systematic sampling as follows. The number of booths sampled is dependent on the
population size, confidence level and confidence interval. For the purposes of this study, the
confidence level is set at 95% with a confidence interval of 5%. The population size differs between
shows but generally the sample size is between 250 and 350 booths per show. The sampling starts by
selecting an element from the list at random and then every Kth element in the frame is selected,
where k, is the sampling interval: this is calculated as:
K=N/n
where n is the sample size, and N is the population size.
Table 14: Sustainability messaging survey
Company Details Booth details Product details
Company name? Logo on the booth? Booth Displays products? (yes/no)
Country? Sustainability Words on the Booth? (yes/no). If yes, which one?
Relevant Product Packaging Messaging?
Continent/area? Certification logo on the Booth? (yes/no). If yes, which one?
Sustainability Words on Package? (yes/no). If yes, which one?
Main activity? Health words on the booth (yes/no)? If yes, which one?
Certification on the package? (yes/no). If yes, which one?
Relevant for Booth presentation (colours,
Health Words on Package? (yes/no). If yes, which one?

GAIN Deliverable 3.3
File: GAIN D3.3 – Report on value chain mapping for key species/systems, with SWOT analysis of key informants
The project has received funding from the European Union's Horizon 2020 Framework Research and Innovation Programme under GA n. 773330
35 of 56
Company Details Booth details Product details
pictures, videos, flyers, leaflets)?
Email?
Relevant for Booth presentation (colours, pictures, videos, flyers, leaflets)?
1. Nutritional Composition on Package? 2. Moisture/Water Content on Package? 3. Place of Production on Package? 4. Origin of Raw Materials on Package? 5. Is Product Traceable for Consumers Through e.g. Scan-Code + App?
Contact details? How many different products are displayed in the booth?
4.1.2 Key informant interviews
The expansion of European aquaculture could create opportunities for exports. However, global trade
is driven by numerous factors and understanding the driving forces of the markets is crucial if certain
criteria want to be met. Therefore, a survey is created with in-depth questions regarding the strength,
weaknesses, opportunities and threats (SWOT) of European aquaculture derived from Key Informant
interviews which were conducted to gather more contextual information regarding sustainability
perceptions and priorities of stakeholders. The interviews were semi-structured involving discussions
around key themes, led by the interviewer who asks questions around the themes of sustainability,
value addition to by-products and EU trade (Table 15). Key informant interviews are conducted at
seafood shows and during field visits to partner countries as part of the Value Chain Analysis.
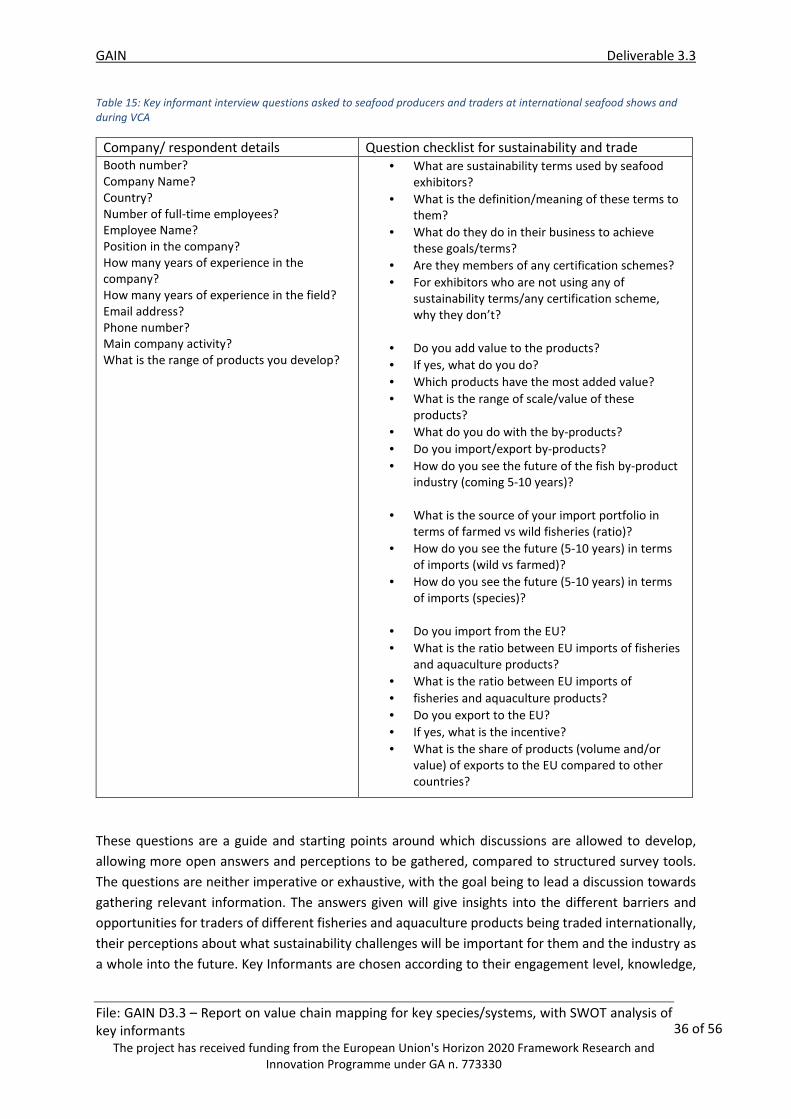
GAIN Deliverable 3.3
File: GAIN D3.3 – Report on value chain mapping for key species/systems, with SWOT analysis of key informants
The project has received funding from the European Union's Horizon 2020 Framework Research and Innovation Programme under GA n. 773330
36 of 56
Table 15: Key informant interview questions asked to seafood producers and traders at international seafood shows and
during VCA
Company/ respondent details Question checklist for sustainability and trade Booth number? Company Name? Country? Number of full-time employees? Employee Name? Position in the company? How many years of experience in the company? How many years of experience in the field? Email address? Phone number? Main company activity? What is the range of products you develop?
• What are sustainability terms used by seafood exhibitors?
• What is the definition/meaning of these terms to them?
• What do they do in their business to achieve these goals/terms?
• Are they members of any certification schemes? • For exhibitors who are not using any of
sustainability terms/any certification scheme, why they don’t?
• Do you add value to the products? • If yes, what do you do? • Which products have the most added value? • What is the range of scale/value of these
products? • What do you do with the by-products? • Do you import/export by-products?
• How do you see the future of the fish by-product industry (coming 5-10 years)?
• What is the source of your import portfolio in
terms of farmed vs wild fisheries (ratio)? • How do you see the future (5-10 years) in terms
of imports (wild vs farmed)? • How do you see the future (5-10 years) in terms
of imports (species)?
• Do you import from the EU? • What is the ratio between EU imports of fisheries
and aquaculture products? • What is the ratio between EU imports of • fisheries and aquaculture products? • Do you export to the EU? • If yes, what is the incentive? • What is the share of products (volume and/or
value) of exports to the EU compared to other countries?
These questions are a guide and starting points around which discussions are allowed to develop,
allowing more open answers and perceptions to be gathered, compared to structured survey tools.
The questions are neither imperative or exhaustive, with the goal being to lead a discussion towards
gathering relevant information. The answers given will give insights into the different barriers and
opportunities for traders of different fisheries and aquaculture products being traded internationally,
their perceptions about what sustainability challenges will be important for them and the industry as
a whole into the future. Key Informants are chosen according to their engagement level, knowledge,

GAIN Deliverable 3.3
File: GAIN D3.3 – Report on value chain mapping for key species/systems, with SWOT analysis of key informants
The project has received funding from the European Union's Horizon 2020 Framework Research and Innovation Programme under GA n. 773330
37 of 56
and representativeness of their business their experience in the industry and companies actively in
imports (European and American) of Asian seafood and vice versa.
4.1.3 SWOT analysis and Delphi process
SWOT analysis is an established technique used to characterise the current standing of a business or
industry and its capacity to meet future challenges. SWOT i.e. Strengths, Weaknesses, Opportunities
and Threats, where strengths and weaknesses refer to the company/industry itself and opportunities
and threats refer to the business environment in which they operate. The SWOT analysis is conducted
through a combination of survey work and literature. The results from the Key Informant interviews,
value chain analysis and literature review will be used to inform the SWOT analysis presented in D4.2.
In this deliverable a basic SWOT analysis of GAIN species, tilapia and pangasius has been presented
based purely on literature data. The results of the analysis are presented in Section 6.
The Delphi method was originally developed for consensus building, where expert’s opinions were
used for business forecasting. The method was later used for decision making in a variety of domains,
such as technology industry, engineering and social science (Hirschhorn, 2018). Within GAIN it is
applied to complements SWOT as a business/ industry forecasting methodology relying on a panel of
independent, anonymous experts. Essentially it is an iterative process by which the experts comment
on a selection of business scenarios/ forecasts/ innovations and are then invited to revise their
opinions based on the feedback from previous rounds as the iterations progress. The methodology is
particularly useful for gauging the timeline for implementing technology, the likelihood of certain
business developments and the policy required to allow for such changes within the industry. In this
case, the panel of experts will be drawn from Key Informants from seafood shows and the VCA with
their opinions from the interviews used within the process, but made available to the rest of the panel
anonymously. The University of Stirling will act as a facilitator whereby complementing and conflicting
opinions are compiled before returning the results to the panel for reassessment. The process is then
repeated towards finding a consensus between the different actors. The Delphi process will begin on
completion of the Key Informant interviews from the Seafood shows and VCA fieldwork up to month
30.
4.1.4 Porter Diamond of National Advantage (PDNA frameworks)
The Porter Diamond model or Theory of National Competitive Advantage of Industries, here referred
to as the Porter Diamond National Advantage (PDNA) framework, is used to explain why certain
industries or individual companies are more competitive internationally than others within a nation.
The SWOT analysis and Delphi results will be integrated in a PDNA framework in order to understand
the competitive advantages of European aquaculture and its international competitive advantage
compared to other producers around the globe. Missing gaps will be completed with the help of a
literature review. The 4 factors in this framework, namely: factor conditions; demand conditions;
strategy, structure and rivalry; and related supporting industry, will provide an overview of key drivers
and competitive advantages of European aquaculture to fulfil domestic demand. The model predicts
that if the four factors are favourable, then the industry/sector/company will be able to effectively

GAIN Deliverable 3.3
File: GAIN D3.3 – Report on value chain mapping for key species/systems, with SWOT analysis of key informants
The project has received funding from the European Union's Horizon 2020 Framework Research and Innovation Programme under GA n. 773330
38 of 56
innovate, “upgrade” and meet challenges, enabling it to compete on the international stage. Factor
conditions relate to the resources available within a country and available to the industry, including
natural and human capital. Demand conditions relate to the domestic demand for products which
may help an industry to innovate and prepare for international opportunities and challenges. Strategy,
structure and rivalry refers to how much domestic competition there is which drive innovation and
thus make companies more competitive on a world stage. Related supporting industry generally refers
to how strong the supply/ value chain is in helping companies to perform, giving them access to good
quality materials and resources, but can also refer to how much collaboration there is between similar
companies, enabling them to overcome mutual challenges and innovate. In addition to the four main
pillars of the diamond, the role of government and chance is also incorporated into the analysis.
Government plays a key role in influencing the demand and factor conditions by stimulating demand
and by helping to provide especially human resources. Chance is often incorporated into the model as
factors outside of the control of stakeholders but may influence the competitiveness of the industry.
These chance factors are often subjective and difficult to predict. The PDNA framework will be applied
when the results from the KI derived SWOT analysis has been completed.
4.2 European aquaculture value chain analysis surveys
Understanding the value chain, material-flows and stakeholders involved is crucial in order to assess
the suitability of innovations being developed within GAIN and other projects and cannot be
understood from literature alone. KI interviews at seafood shows give a good overview of trade and
industry trajectories but cannot represent the sustainability issues that are facing all of the
stakeholders within a value chain and cannot provide necessary resolution of the interrelationships
that exist. In order to GAIN insight into the power relationships within the industry, the effect of
innovation, the individual sustainability concerns and need for innovation, a full Value Chain Analysis
is necessary. This involves a series of structured and semi-structured surveys of a representative cross-
section of the stakeholders within the industry, including those directly involved in producing and
trading the product, as well as service providers, researchers, government, regulators etc.
4.2.1 Semi-structured value chain survey
Value chain surveys will be conducted for the main species in the EU and EEA, namely salmon
(Norway), carp (Poland), seabass, seabream and turbot (Spain and Portugal). After a preliminary
scoping meeting with Gildeskål Research Station (GIFAS), a total of 29 stakeholder groups were
selected for the stakeholder analysis in Norway. A similar scoping exercise will be carried out for field
work in Poland and Iberia. The stakeholder groups that were interviewed for the work can be seen in
Table 16 and a copy of the survey is given in Annex 1. Stakeholders were contacted through phone or
by email using the networks of project partners where possible to increase engagement in the project.
In some cases, VCA surveys were combined with LCA/ sustainability index surveys to optimise data
collection.

GAIN Deliverable 3.3
File: GAIN D3.3 – Report on value chain mapping for key species/systems, with SWOT analysis of key informants
The project has received funding from the European Union's Horizon 2020 Framework Research and Innovation Programme under GA n. 773330
39 of 56
Table 16: EU and EEA aquaculture value chain stakeholders contacted for the VCA of the Norwegian salmon industry
Broodstock/egg producers Integrated companies Recreational (Guide) Tour
Hatchery (RAS) Cleaner fish producers Research and innovation company (R&D)
Smolt production (RAS) Exporting and trading company
Trainer institution
Smolt production (Flow-through) Retail company Equipment producers, maintenance and recycling
Grow-out Farm Well boat/transport Government and representative authorities
Feed companies Transport and site maintenance boats (people and cargo)
Certifying body/organization
Slaughter house and primary processing
Vet/health management company
NGO/Representative organization
Secondary processing Ingredient producers (fish oil, hydrolysates/meals etc).
Consumer group/associations
Value addition processing End users Other supporting industry (chemicals, ice)
By-product processor Education
4.2.1.2 Stakeholders and their function in the value chain (power and interest relationships)
Stakeholders along the value chain fulfil different functions and innovate in order to stay competitive.
Assessing the suitability of certain innovations requires an understanding of the power and interest of
stakeholders (table 1.1, Annex 1) to make industry changes and the effect of changes or innovation
on stakeholders (interest), which could influence the perspective towards these innovations. As
stakeholders generally cannot objectively determine their own power or interest within an industry,
stakeholders were asked to score the power (1 = barely any influence, 10 = highly influential) and
interest of other stakeholders within the chain, which will then be combined to provide an average
score. In addition, stakeholders were asked to provide information on collaborations and partnerships,
the number and length of relationships regarding association members, workshop attendance, R&D
with academia/NGO, R&D with commercial and government programs. Stakeholders are asked to
highlight the stakeholders whom they have most contact with, by providing detailed information on
the type of relations, amount of meetings and years of relationship. All of the information given
provides a picture of the power relationships and structure of the industry.
4.2.1.3 Assessing knowledge, attitudes and perceptions regarding sustainability
A survey for the listed stakeholders (table 16) is developed to understand the knowledge, attitudes
and perceptions towards sustainability issues facing them as stakeholders and the innovations being
developed in GAIN. This will provide a better understanding of the suitability of the innovations and
the potential drivers and barriers for implementation. At first the stakeholders will be asked questions
in relation to sustainable intensification and the availability of information regarding this topic to the

GAIN Deliverable 3.3
File: GAIN D3.3 – Report on value chain mapping for key species/systems, with SWOT analysis of key informants
The project has received funding from the European Union's Horizon 2020 Framework Research and Innovation Programme under GA n. 773330
40 of 56
public (table 17). Then stakeholders are asked to score the most important sustainability issues facing
them and the industry which could be positive, negative or uncertain e.g. they might say sea lice is an
extremely negative factor which they score as -5. They also say that new feed ingredients are being
introduced which will have a positive influence on them which they score as +3. They also say that
there is new regulation coming in which they are uncertain of how it is going to affect them (see
Annex1).
Table 17: Survey regarding sustainable intensification and sustainability issues
How do you see sustainable intensification in aquaculture (positives/negatives/impacts)? Does your company have a vision/plan for sustainable intensification? What are the current topics / processes on sustainability that you are currently working on?
The GAIN innovations (Table 18) show potential to support the sustainable growth of the industry.
However, some innovations might be more suitable then others depending on active stakeholder
awareness towards these innovations. Stakeholders will be asked if they have any knowledge,
company interest or industry interest in these innovations. Their answers (yes/no/uncertain) will be
scored accordingly in order to gain quantitative insight in the awareness and potential of these
innovations. Stakeholders are also asked to comment more generally on the innovations.
Table 18: GAIN innovations and stakeholder perspectives.
Micro algae Macro algae Hydrolysed fish
proteins
Single cell
proteins
Insect proteins
Sludge for
fertiliser
Sludge for
biogas
Mortalities for
biogas
Processing by-
products for
feed
By-products for
cosmetics/nutraceuticals
Shells for
biofilters
Shells for
packaging
Shells for
cement/filler
Use of big data
management
support
Use of big data for fish
welfare
GAIN Deliverable 3.3
File: GAIN D3.3 – Report on value chain mapping for key species/systems, with SWOT analysis of key informants
The project has received funding from the European Union's Horizon 2020 Framework Research and Innovation Programme under GA n. 773330
41 of 56
5. Conclusions
Optimizing aquaculture output in terms of production volume and economic output requires an
understanding of the value chain in terms of production and processing and its related context,
especially services and broader such as governance. This requires a comprehensive approach,
including a literature review on trade, consumption, production, and processing and sustainability
issues. This will be combined with a VCA during fieldwork in Norway, Poland, Spain and Portugal
focussing on trade flows, stakeholder positions and sustainability perceptions.
Additionally, in terms of seafood trade, key informants will be interviewed and data will be organized
and analysed in SWOTs in combination with a Porter Diamond National Advantage (PDNA) framework
and Delphi process. This provides insights into global trade, seafood marketing and opportunities to
differentiate European aquaculture products in the global market. It will also provide understanding
of current drivers and barriers of European aquaculture in relation to competitive producers in e.g.
Asia.
These analysis and insights altogether will contribute to a better understanding of the aquaculture
value chain in the EU and EEA and the potential of innovations to increase aquaculture output
sustainably.
GAIN Deliverable 3.3
File: GAIN D3.3 – Report on value chain mapping for key species/systems, with SWOT analysis of key informants
The project has received funding from the European Union's Horizon 2020 Framework Research and Innovation Programme under GA n. 773330
42 of 56
6. References
Aas, T.S.; Ytrestøyl, T.; Åsgård, T.E. Tromsø: Nofima AS 2019 (ISBN 978-82-8296-605-4) 32, p. Nofima rapportserie (26/2019) https://nofima.no/pub/1713971/
Asche F, Roll K.H, Hilde N. Sandvold, H.N., Sørvig, A. & Zhang, D. (2013) SALMON AQUACULTURE: LARGER COMPANIES AND INCREASED PRODUCTION, Aquaculture Economics & Management, 17:3, 322-339, DOI: 10.1080/13657305.2013.812156
Asche, F., Cojocaru, A. L. and Roth, B. (2018) ‘The development of large scale aquaculture production: A comparison of the supply chains for chicken and salmon’, Aquaculture. Elsevier B.V., 493, pp. 446–455. doi: 10.1016/j.aquaculture.2016.10.031.
Bacher, K., A. Gordoa, and E. Mikkelsen. Stakeholders’ perceptions of marine fish farming in Catalonia (Spain): A Qmethodology approach. Aquaculture, 424: 78–85 (2014). Belton, B., Asseldonk, I.J.M., Bush, S. R. (2016) ‘Domestic Crop Booms, Livelihood Pathways and Nested Transitions: Charting the Implications of Bangladesh’s Pangasius Boom’, Journal of Agrarian Change, 17(4).
Belton, B., Bush, S. R. and Little, D. C. (2018) ‘Not just for the wealthy: Rethinking farmed fish consumption in the Global South’, Global Food Security. doi: 10.1016/j.gfs.2017.10.005.
Belton, B., Little, D. C. (2011) ‘Immanent and interventionist inland Asian aquaculture development and its outcomes’, Dev. Policy Rev., 29(4), pp. 459–484. doi: 10.1111/j.1467-7679.2011.00542.x.
Bostock, J. Lane, A., Hough C., Yamamoto, K. (2016) ‘An assessment of the economic contribution of EU aquaculture production and the influence of policies for its sustainable development’, Aquaculture
International. Springer International Publishing, 24(3), pp. 699–733. doi: 10.1007/s10499-016-9992-1.
Bush, S.R., Belton, B. Out of the factory and into the fish pond: can certification transform Vietnamese Pangasius? Spaargaren, G., Oosterveer, P., Loeber, A. (Eds.), Food Practices in Transition: Changing Food Consumption, Retail and Production in the Age of Reflexive Modernity, Routledge, London (2012). http://library.wur.nl/WebQuery/wurpubs/424043 Bush, S. R. (2018) ‘Understanding the potential of eco-certification in salmon and shrimp aquaculture value chains’, Aquaculture. Elsevier, 493 (July 2017), pp. 376–383. doi: 10.1016/j.aquaculture.2017.07.027.
Bush, S. R., Belon, B., Little, D.C., Islam, M.S. (2019) ‘Emerging trends in aquaculture value chain research’, Aquaculture. Elsevier, 498 (September 2018), pp. 428–434. doi: 10.1016/j.aquaculture.2018.08.077.
CBI (2018). Exporting pangasius to Europe. Retrieved from; https://www.cbi.eu/market-information/fish-seafood/pangasius/europe/
Chambers, S., Lobb, A., Butler, L.T., Traill, W.B. (2008). The influence of age and gender on food choice: a focus group exploration. Consumer Studies, 32 (4), pp 356-365. https://doi.org/10.1111/j.1470-6431.2007.00642.x
ClimeFish (2016) Climefish. Available at: https://climefish.eu/
Comayimexco (2019). Specialized News. Export of pangasius to EU rose by 31.5%. https://comayimexco.com/en/export-of-pangasius-to-eu-rose-by-31-5-.html
Cressey (2009) ‘Future fish’, Nature.
Diversify (2013) DIVERSIFY information. Available at: https://www.diversifyfish.eu/about-diversify.html.

GAIN Deliverable 3.3
File: GAIN D3.3 – Report on value chain mapping for key species/systems, with SWOT analysis of key informants
The project has received funding from the European Union's Horizon 2020 Framework Research and Innovation Programme under GA n. 773330
43 of 56
Dolfing, A.G., Leuven, J.R.F.W., Dermody, B. J. (2019) ‘The effects of network topology, climate variability and shocks on the evolution and resilience of a food trade network’, PLoS ONE, 14(3).
Edvard Tijan, Sasa Aksentijevic, Katarina Ivanic, M. J. (2019) ‘Blockchain Technology Implementation in Logistics’, Sustainability, 11(4), p. 1185. Available at: https://www.mdpi.com/2071-1050/11/4/1185.
EFSA (2015) ‘Statement on the benefits of fish/seafood consumption compared to the risks of methylmercury in fish/seafood.’, European Food Safety Authority Journal, 13(3982). EFSA (no date) European Food Safety Authority. Available at: https://www.efsa.europa.eu/en/topics/topic/animal-welfare.
EUMOFA (2014). Price structure in the supply chain for fresh seabream in Italy. Retrieved from; https://www.eumofa.eu/documents/20178/0/Price+structure+Seabream+in+Italy/f76598c2-50d3-4bc4-b98b-b13926430066
EUMOFA (2018) The EU Fish Market. Available at: https://www.eumofa.eu/documents/20178/132648/EN_The+EU+fish+market+2018.pdf.
EUMOFA (n.d. b) Rainbow Trout (Oncorhynchus mykiss). https://www.eumofa.eu/documents/20178/137160/Rainbow+trout_31-1.pdf
EUMOFA (n.d. c). Mussel (Mytilus edulis and Mytilus galloprovincialis). Retrieved from; https://www.eumofa.eu/documents/20178/137160/Mussel_31-1.pdf
EUMOFA (n.d.) Metadata CN-8 codes, Datamanagement - metadata CN-8 codes. Available at: http://www.eumofa.eu/documents/20178/24415/Metadata+2+-+DM+-+Annex+4+Corr+CN8-CG-MCS+%282002+-+2014%29.pdf/ae431f8e-9246-4c3a-a143-2b740a860291.
Eurofish (n.d.) Overview of the Norwegian fisheries and aquaculture sector. Retrieved from; https://www.eurofish.dk/norway
European Commission (2018). Special Eurobarometer 475 Report EU consumer habits regarding fishery and
aquaculture products. Survey requested by the European Commission. December 2018
European Commission (no date a) AGRI-FOOD TRADE STATISTICAL FACTSHEET. Available at: https://ec.europa.eu/agriculture/sites/agriculture/files/trade-analysis/statistics/outsideeu/regions/agrifood-extra-eu-28_en.pdf.
European Commission (no date b). Seabass (Dicentrarchus labrax). Retrieved from; https://ec.europa.eu/fisheries/sites/fisheries/files/docs/body/seabass_en.pdf
European Commission (no date c). Gilthead seabream. Retrieved from; https://ec.europa.eu/fisheries/marine_species/farmed_fish_and_shellfish/seabream_en
European Commission (no date d). Turbot Psetta maxima). Retrieved from; https://ec.europa.eu/fisheries/sites/fisheries/files/docs/body/turbot_en.pdf
European Commission (no date e). Carp. Retrieved from; https://ec.europa.eu/fisheries/marine_species/farmed_fish_and_shellfish/carp_en
European Commission (no date f). Blue mussels and Mediterranean mussels. Retrieved from: https://ec.europa.eu/fisheries/marine_species/farmed_fish_and_shellfish/mussels_en
European Commission (no date g). Pacific cupped oyster. Retrieved from; https://ec.europa.eu/fisheries/marine_species/farmed_fish_and_shellfish/oysters_en
European Commission (no date h). Fisheries facts and figures. 3. Employment. Retrieved from; https://ec.europa.eu/fisheries/facts_figures_en?qt-facts_and_figures=3

GAIN Deliverable 3.3
File: GAIN D3.3 – Report on value chain mapping for key species/systems, with SWOT analysis of key informants
The project has received funding from the European Union's Horizon 2020 Framework Research and Innovation Programme under GA n. 773330
44 of 56
EUROSTAT (2017) Archive:Aquaculture statistics. Available at: https://ec.europa.eu/eurostat/statistics-explained/index.php?title=Aquaculture_statistics&oldid=356961 (Accessed: 17 August 2019).
EUROSTAT (2019) Aquaculture production in tonnes and value. Available at: https://ec.europa.eu/eurostat/search?p_auth=Tk7pDDnN&p_p_id=estatsearchportlet_WAR_estatsearchportlet&p_p_lifecycle=1&p_p_state=maximized&p_p_mode=view&_estatsearchportlet_WAR_estatsearchportlet_theme=empty&_estatsearchportlet_WAR_estatsearchportlet_action=search&_estatsearchportlet_WAR_estatsearchportlet_collection=empty&text=aquaculture.
EUROSTAT (no date) No Title.
EY (2017). The Norwegian aquaculture analysis. Retrieved from: https://www.ey.com/Publication/vwLUAssets/EY_-_The_Norwegian_Aquaculture_Analysis_2017/$FILE/EY-Norwegian-Aquaculture-Analysis-2017.pdf
FAO (2011) ‘Waite et al., authors calculations based on (FAO, 2011) estiamted total agricultural land at 4,921 Mha’.
FAO (2012) The state of the world fisheries and aquaculture 2012. Available at: http://www.fao.org/docrep/016/i2727e/ i2727e.pdf.
FAO (2014) FishStatJ - Software for Fishery Statistical Time Series. (ed Department FFaA), Rome.
FAO (2014) The state of world fisheries and aquaculture—opportunities and challenges. Available at: http://www.fao.org/3/a-i3720e.pdf.
FAO (2016a) Market Competition Between Farmed and Wild fish: A Literature Survey.
FAO (2016b) Planning for aquaculture diversification: the importance of climate change and other drivers.
FAO (2018a) ‘FAO estimates’.
FAO (2018b) The State of the World Fisheries and Aquaculture - Meeting the Sustainable Development Goals.
FAO (2018c) the State World Fisheries and Aquaculture. doi: 978-92-5-130562-1.
FAO (2019) World Aquaculture Performance Indicators (WAPI)—Fish Consumption Module (WAPI-FISHCSP v.2018.1), In FAO Fisheries and Aquaculture Department. Rome. Updated 2018. Available at: http://www.fao.org/fishery/statistics/software/wapi/en.
FAO (2019b). Profitable growth continues in the global salmon sector despite price volatility. Retrieved from: http://www.fao.org/in-action/globefish/market-reports/resource-detail/en/c/1176223/
FAO (n.d. a) ‘Cultured Aquatic Species Information Programme’. Available at: http://www.fao.org/fishery/culturedspecies/Solea_spp/en.
FAO (n.d. b) National Aquaculture Sector Overview Norway, Food and Agriculture Organization of the United
Nations.
FAO (n.d. c). Cultured Aquatic Species Information Programme: Oncorhynchus mykiss. Retrieved from; http://www.fao.org/fishery/culturedspecies/Oncorhynchus_mykiss/en
FAO (n.d. d). Aquaculture Feed and Fertilizer Resources Information System. Rainbow trout – feed formulation. Retrieved from; http://www.fao.org/fishery/affris/species-profiles/rainbow-trout/feed-formulation/en/

GAIN Deliverable 3.3
File: GAIN D3.3 – Report on value chain mapping for key species/systems, with SWOT analysis of key informants
The project has received funding from the European Union's Horizon 2020 Framework Research and Innovation Programme under GA n. 773330
45 of 56
FAO (n.d. e). Cultured Aquatic Species Information Programme. Psetta maxima. Retrieved from; http://www.fao.org/fishery/culturedspecies/Psetta_maxima/en
FAO (n.d. f). Cultured Aquatic Species Information Programme. Ostrea edulis. Retrieved from; http://www.fao.org/fishery/culturedspecies/Ostrea_edulis/en
FAO (n.d. g). Aquaculture production (metric tons). Accessed through the World Bank. Retrieved from: https://data.worldbank.org/indicator/ER.FSH.AQUA.MT
FAO. 2018. “FishstatPlus.” Universal software for fishery statistical time series, FAO Fisheries and Aquaculture Department [online], Rome. (http://www.fao.org/fishery/statistics/software/fishstat/en)
FAOSTAT (2019) FAOSTAT.
FEAP (2014) European Aquaculture Production Report 2004-2013. (ed Dehasque M). Federation of European Aquaculture Producers
Ferreira, J.G., Bricker, S.B., 2016, ‘Goods and services of extensive aquaculture: shellfish culture and nutrient trading.’, Aquaculture International. Springer International Publishing, 24(3), pp. 803–835. doi: 10.1007/s10499-015-9949-9.
Froehlich, H. E. et al. (2017) ‘Public perceptions of aquaculture: Evaluating spatiotemporal patterns of sentiment around the world’, PLoS ONE, 12(1), pp. 1–18. doi: 10.1371/journal.pone.0169281.
GAIN Consortium (2017) Green Aquaculture Intensification (GAIN) in Europe.
Hirschhorn, F. (2018). Reflections on the application of the Delphi method: lessons from a case in public transport research. International Journal of Social Research Methodology. Volume 22(3), pp. 309-322.
https://doi.org/10.1080/13645579.2018.1543841
Hishamunda, N., Ridler, N. & Martone, E. 2014. Policy and governance in aquaculture: lessons learned and way forward. FAO Fisheries and Aquaculture Technical Paper No. 577. Rome, FAO. 59 pp.
Smejkal, G.B., Kakumanu, S. (2018) ‘Safely meeting global salmon demand’, npj Science of Food. Springer US, 2(17), p. 17. doi: 10.1038/s41538-018-0025-5.
Ge, L. et al. (2017) Blockchain for agriculture and food. doi: 10.18174/426747.
Gehman, J., Lefsrud, L.M., Fast, S. (2017) ‘Social license to operate: legitimacy by another name?’, Can. Publ.
Adm., 60(2), pp. 293–317. doi: https://doi.org/10.1111/capa.12218.
Guiseppe, L., Mente, E. (2019) Organic Aquaculture. Impacts and Future Developments.
Hall, S.J., Delaporte, A., Phillips, M.J., Beveridge, M. and O’Keefe, M. (2011) ‘Blue Frontiers: Managing the Environmental Costs of Aquaculture.’, The WorldFish Center, Penang.
Honkanen P., Olsen, S. V. (2009) ‘Environmental and animal welfare issues in food choice: the case of farmed fish’, British Food Journal, 111, pp. 293–309.
Hynes, S., Skoland, K., Ravagnan, E., Gjerstad, B., Krovel, A. V. (2018) ‘Public attitudes toward aquaculture: An Irish and Norwegian comparative study’, Marine Policy, 96(1), p. 8.
Janssen, K., Hervé, C., Berentsen, P., Komen, H., (2015). Rainbow trout (Oncorhynchus mykiss) – Current status of selective breeding in Europe. Fishboost. Retrieved from; http://www.fishboost.eu/uploads/2/5/8/8/25888062/rainbow_trout_-_current_status_of_selective_breeding_in_europe.pdf

GAIN Deliverable 3.3
File: GAIN D3.3 – Report on value chain mapping for key species/systems, with SWOT analysis of key informants
The project has received funding from the European Union's Horizon 2020 Framework Research and Innovation Programme under GA n. 773330
46 of 56
Jennings, S. et al. (2016) ‘Aquatic food security: insights into challenges and solutions from an analysis of interactions between fisheries, aquaculture, food safety, human health, fish and human welfare, economy and environment’, Fish and Fisheries, 17(4), pp. 893–938. doi: 10.1111/faf.12152.
Kamath (2018) ‘Food Traceability on Blockchain: Walmart’s Pork and Mango Pilots with IBM’, The Journal of
the British Blockchain Association, 1(1), pp. 1–12
Kelly, R., Pecl, G.T., Fleming, A. (2017) ‘Social licence in the marine sector: A review of understanding and application’, Marine Policy, 81, pp. 21–28.
Kim, H.M., Laskowski, M. (2017) ‘Agriculture on the Blockchain: Sustainable Solutions for Food, Farmers, and Financing.’, SSRN Electronic Journal, p. 23.
Knapp, G. (2015) ‘Interactions between fisheries and aquaculture.’, in Seminar on Advanced Lessons in
Fisheries and Aquaculture Economics., Santiago de Compostela, Spain, 7 July 2015.
Lane A., Hough, C., Bostock, J. (2014) EU Parliament Study IP/B/PECH/IC/2013_162 Fisheries.
Lin, J. et al. (2018) ‘Blockchain and IoT based Food Traceability for Smart Agriculture’, Proceedings of the 3rd
International Conference on Crowd Science and Engineering - ICCSE’18, pp. 1–6. doi: 10.1145/3265689.3265692.
Little, D.C., 2000. Meeting the needs of the poor in Asia—tilapia in the new millennium.In: Fitzsimmon, K.,
Filho, J.C. (Eds.), Proceedings from the Fifth International Symposium on Tilapia Aquaculture, Rio de Janeiro,
Brazil, 3–7 September 2000, pp. 641–650.
Mialhe, F., Morales, E., Dubuisson-Quellier, S., Vagneron, I., Dabbadie, L., Little, D.C. (2018) ‘Global standardization and local complexity. A case study of an aquaculture system in Pampanga delta, Philippines’, Aquaculture. Elsevier, 493 (October 2017), pp. 365–375. doi: 10.1016/j.aquaculture.2017.09.043.
Nora (no date). Why native oyster restoration. Retrieved from: https://noraeurope.eu
Peel., D., Lloyd, M.G. (2008). Governance and planning policy in the marine environment: regulating aquaculture in Scotland. The Geographical Journal, 174(4), pp. 361-373.
Perdikaris, C., Chrysafi, A. Ganias, K. (2016) ‘Environmentally Friendly Practices and Perceptions in Aquaculture: A Sectoral Case-study from a Mediterranean-based Industry’, Reviews in Fisheries Science & Aquaculture, 24(2), pp. 113–125. doi: https://doi.org/10.1080/23308249.2015.1112358.
Ponte, S., Kelling, I., Jespersen, K.S., Kruijssen, F. (2014). The Blue Revolution in Asia: Upgrading and
Governance in Aquaculture Value Chains. World Development. 64, 52-64.
Prescott, J., Young, O., O'Neill, L., Yau, N.J.N., Stevens, R. (2002). Motives for food choice: a comparison of consumers from Japan, Taiwan, Malaysia and New Zealand. Food Quality and Preference, 13(7-8), pp 489-495. https://doi.org/10.1016/S0950-3293(02)00010-1
P.N. Rudell, P.N., Miller, M.L. Human perceptions and attitudes regarding geoduck aquaculture in Puget
Sound, Washington: a Q-method approach. J. Shellfish Res., 31 (2012), pp. 342-343
Saeed, M.A., Kersten, W. (2019) ‘Drivers of Sustainable Supply Chain Management: Identification and Classification’, Sustainability, 11(4), p. 1137. doi: 10.3390/su11041137.
Samerwong, P., Bush, S. R. and Oosterveer, P. (2017) ‘Metagoverning Aquaculture Standards: A Comparison of the GSSI, the ASEAN GAP, and the ISEAL’, The Journal of Environment & Development, 26(4), pp. 429–451. doi: 10.1177/1070496517736872.

GAIN Deliverable 3.3
File: GAIN D3.3 – Report on value chain mapping for key species/systems, with SWOT analysis of key informants
The project has received funding from the European Union's Horizon 2020 Framework Research and Innovation Programme under GA n. 773330
47 of 56
Seafood Source (2019). Europe’s mussel market growing increasingly international. Retrieved from; https://www.seafoodsource.com/news/supply-trade/europes-mussel-market-growing-increasingly-international
SINTEF (2015) ‘Technology for a better society’.
Soto, D., White, P., Dempster, T., De Silva, S., Flores, A., Karakassis, Y., Knapp, G., M. and J., Miao, W., Sadovy, Y., Thorstad, E. & Wiefels, R. (2012) ‘Addressing aquaculture-fisheries interactions through the implementation of the ecosystem approach to aquaculture (EAA).’, in Farming the waters for people and food:
proceedings of the Global Conference on Aquaculture 2010, Phuket, Thailand, 22–25 September 2010, pp.
385–436. Rome, FAO, and Bangkok, Network of Aquaculture Centres in Asia-Pacific (NACA)., pp. 385–436.
STECF (2018) The Economic Performance Report on the EU Aquaculture sector (STECF-13-29), Publications
Office of the European Union, Luxembourg, EUR 26336 EN, JRC 86671. doi: 10.2788/18703.
The Fish Site (2010). How to Farm European Seabass. Retrieved from; https://thefishsite.com/articles/cultured-aquatic-species-european-seabass
The Fish Site (2010a). How to Farm European Flat Oyster. Retrieved from; https://thefishsite.com/articles/cultured-aquaculture-species-european-flat-oyster
Thomas, J. B. E., Nordström, J., Risén, E., Malmström, M.E., Gröndahl, F. (2018) ‘The perception of aquaculture on the Swedish West Coast’, Ambio, 47(4), pp. 398–409.
Tran K, Verdegem M, Wolkenfelt B, Chadag M and Verreth J. 2019. The relation between farming practices and tilapia production in small-scale fish farms in Bangladesh. Penang, Malaysia: CGIAR Research Program on Fish Agri-Food Systems. Program Report: FISH-2019-06
Undercurrentnews (2014). European trout farmers complain over Turkish 'dumping'. Retrieved from: https://www.undercurrentnews.com/2014/03/07/european-trout-farmers-complain-over-turkish-dumping/
Valenti, W. C. et al. (2018) ‘Indicators of sustainability to assess aquaculture systems’, Ecological Indicators. Elsevier, 88(August 2017), pp. 402–413. doi: 10.1016/j.ecolind.2017.12.068.
Vietnam Pangasius Assocation (2019).Pangasius production in the Mekong Delta of Vietnam 2019, thousands
of tonnes. Retrieved from: https://www.pangasiusmap.com/vi/ban-do accessed 24/10/2019)
Whitmarsh, D., Wattage, P. Public attitudes towards the environmental impact of salmon aquaculture in
Scotland. Eur. Environ., 16 (2006), pp. 108-121
Whitmarsh, D., Palmieri, M. G. (2011) ‘Consumer behaviour and environmental preferences: a case study of Scottish salmon aquaculture’, Aquaculture Research, 42(1). doi: https://doi.org/10.1111/j.1365-2109.2010.02672.x.
Wolff, W.J., Reise, K. (2002). Oyster imports as a vector for the introduction of alien species into northern and
western european coastal waters. Invasive Aquatic Species of Europe, 193-205. Retrieved from:
https://link.springer.com/chapter/10.1007/978-94-015-9956-6_21

GAIN Deliverable 3.3
File: GAIN D3.3 – Report on value chain mapping for key species/systems, with SWOT analysis of key informants
The project has received funding from the European Union's Horizon 2020 Framework Research and Innovation Programme under GA n. 773330
48 of 56
7. Table of Contents for Figures and Tables
Figure 1: EU supply balance for fisheries and aquaculture products in 2016 (live weight equivalent).
Replicate of Chart 5 (The EU Fish Market 2018 - (EUROSTAT, no date; EUMOFA, 2018; FAO, 2018a)) 8
Figure 2: Geographical distribution of Salmon farming production (MT) between 2000 (left), and
2015 (right). Figure made by Wesley Malcorps, based on (FAOSTAT, 2019) ....................................... 15
Figure 3: Flow diagram Salmon. ............................................................................................................ 16
Figure 4: Geographical distribution of rainbow trout farming production (MT) between 2000 (upper-
left), and 2015 (upper-right) and freswater (lower-left) and marine (lower-right) production systems.
Figure made by Wesley Malcorps, based on (FAOSTAT, 2019). ........................................................... 18
Figure 5: Flow diagram Rainbow Trout. ................................................................................................ 19
Figure 6: Geographical distribution of seabass farming production (MT) in 2000 (upper-left), and
2015 (upper-right) and gilthead seabream farming in 2000 (lower-left) and 2015 (lower-right). Figure
made by Wesley Malcorps, based on (FAOSTAT, 2019). ...................................................................... 21
Figure 7: Flow diagram European Seabass (Spain) ............................................................................... 21
Figure 8: Flow diagram Gilthead Seabream (Spain) .............................................................................. 22
Figure 9: Geographical distribution of turbot farming production (MT) between 2000 (left), and 2015
(right). Figure made by Wesley Malcorps, based on (FAOSTAT, 2019) ................................................ 24
Figure 10: Flow diagram Turbot. ........................................................................................................... 24
Figure 11: Geographical distribution of turbot farming production (MT) between 2000 (left), and
2015 (right). Figure made by Wesley Malcorps, based on (FAOSTAT, 2019) ....................................... 26
Figure 12: Flow Diagram Carp ............................................................................................................... 26
Figure 13: Pangasius production in the Mekong Delta of Vietnam 2019, thousands of tonnes
(Vietnam Pangasius Association, 2019) ................................................................................................ 30
Table 1: EU aquaculture species categorized by production volume, system and country (GAIN
Consortium, 2017) ................................................................................................................................ 13
Table 2: SWOT Analysis of Atlantic Salmon Production in the EU ........................................................ 17
Table 3: SWOT Analysis of Rainbow Trout Production in the EU ......................................................... 19
Table 4: SWOT Analysis of European Seabass Production in the EU .................................................... 22
Table 5: SWOT Analysis of European Seabream Production in the EU ................................................ 23
Table 6: SWOT Analysis of Turbot Production in the EU ...................................................................... 24
Table 7: SWOT Analysis of Common Carp Production in the EU .......................................................... 26
Table 8: SWOT Analysis of Mussel Production in the EU ...................................................................... 27
Table 9: SWOT Analysis of Pacific Oyster Production in the EU ........................................................... 28
Table 10: SWOT Analysis of Flat Oyster Production in the EU .............................................................. 29
Table 11: SWOT Analysis of Asian Pangasius Production ..................................................................... 31
Table 12: SWOT Analysis of Asian Tilapia Production ........................................................................... 32
Table 13: Details of seafood shows visited during T3.3 ........................................................................ 33
Table 14: Sustainability messaging survey ............................................................................................ 34

GAIN Deliverable 3.3
File: GAIN D3.3 – Report on value chain mapping for key species/systems, with SWOT analysis of key informants
The project has received funding from the European Union's Horizon 2020 Framework Research and Innovation Programme under GA n. 773330
49 of 56
Table 15: Key informant interview questions asked to seafood producers and traders at international
seafood shows and during VCA ............................................................................................................ 36
Table 16: EU and EEA aquaculture value chain stakeholders contacted for the VCA of the Norwegian
salmon industry .................................................................................................................................... 39
Table 17: Survey regarding sustainable intensification and sustainability issues ................................ 40
Table 18: GAIN innovations and stakeholder perspectives. ................................................................. 40

GAIN Deliverable 3.3
File: GAIN D3.3 – Report on value chain mapping for key species/systems, with SWOT analysis of key informants
The project has received funding from the European Union's Horizon 2020 Framework Research and Innovation Programme under GA n. 773330
50 of 56
8. Annex 1 Value Chain Analysis Key Informant structured
questions and checklist (as used in Norway July – September
2019)
Introduction and verbal consent
My name is …………… and I am working for ………..
We have a research project “GAIN – Green Aquaculture INtensification in Europe” to support the
ecological intensification of aquaculture in EU and the EEA. The objectives are to increase production
and competitiveness of the industry while ensuring sustainability and compliance with EU regulations
on food safety and environment.
Part of this project is to assess the consumers and stakeholders’ acceptance of eco-intensification
measures for which we are conducting a survey for the key players along the value chain.
Would you be happy to participate in this survey and discuss your opinions/vision and your business
plan regarding aquaculture intensification, it will take approximately 30 minutes? Yes/No
Company/business and interview details
What is the main activity of this company, which sector this company can be classified (farming,
processing, feed ……)?
What is your position/responsibility in this company?
How many years are you working in aquaculture?
How many years are you working for this company?
Value chain information
Total industry production (MT - feed, grow out, smolts etc)
Type of products or activities (Producer, R&d, education etc depending on stakeholder)
Comparison to other companies
Number of companies in Norway
Company production as % of total
Main markets of total industry (domestic, international)
Transportation methods (% air/sea/land of total industry).

GAIN Deliverable 3.3
File: GAIN D3.3 – Report on value chain mapping for key species/systems, with SWOT analysis of key informants
The project has received funding from the European Union's Horizon 2020 Framework Research and Innovation Programme under GA n. 773330
51 of 56
What are the main trends in the industry (growth, markets, practices, innovation, structural,
managerial, consolidation, integration, new players, diversification, value addition)?
What are the main changes in your part of the industry?
What are the main changes in your company?
1.1 Can you rate the power and interest of the following stakeholders in terms of their power to
make industry changes/innovate and how it could affect them? Score 1 (barely any influence) to
10 (highly influential)
Stakeholder Power Interest
Broodstock/egg producers
Hatcheries (RAS)
Smolt production (RAS)
Smolt production (flow-through)
Grow-out farms
Independent slaughter house and
primary processors
Independent secondary processors
Value addition processors/smokeries etc.
Integrated companies
By-product processors
Cleaner fish producers
Exporters/trading companies
Retail
Well boat/transport

GAIN Deliverable 3.3
File: GAIN D3.3 – Report on value chain mapping for key species/systems, with SWOT analysis of key informants
The project has received funding from the European Union's Horizon 2020 Framework Research and Innovation Programme under GA n. 773330
52 of 56
Stakeholder Power Interest
Vet/health management companies
Feed companies
Ingredient producers (fish oil,
hydrolysates/meals etc)
End users (pet food)
Education groups
Research innovation companies
Trainers
Equipment producers
Government authorities
Certifiers
NGOs
Consumer groups/associations
Other support industries/suppliers (ice,
chemicals, consumable products etc)
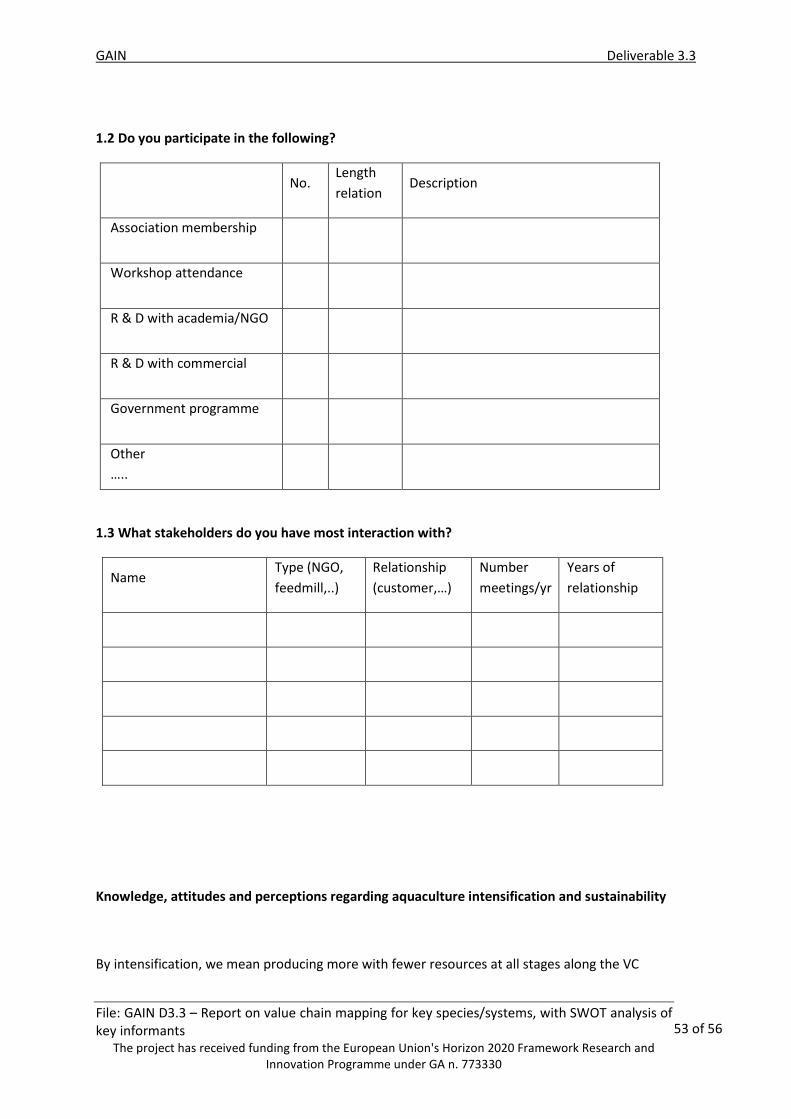
GAIN Deliverable 3.3
File: GAIN D3.3 – Report on value chain mapping for key species/systems, with SWOT analysis of key informants
The project has received funding from the European Union's Horizon 2020 Framework Research and Innovation Programme under GA n. 773330
53 of 56
1.2 Do you participate in the following?
No. Length
relation Description
Association membership
Workshop attendance
R & D with academia/NGO
R & D with commercial
Government programme
Other
…..
1.3 What stakeholders do you have most interaction with?
Name Type (NGO,
feedmill,..)
Relationship
(customer,…)
Number
meetings/yr
Years of
relationship
Knowledge, attitudes and perceptions regarding aquaculture intensification and sustainability
By intensification, we mean producing more with fewer resources at all stages along the VC
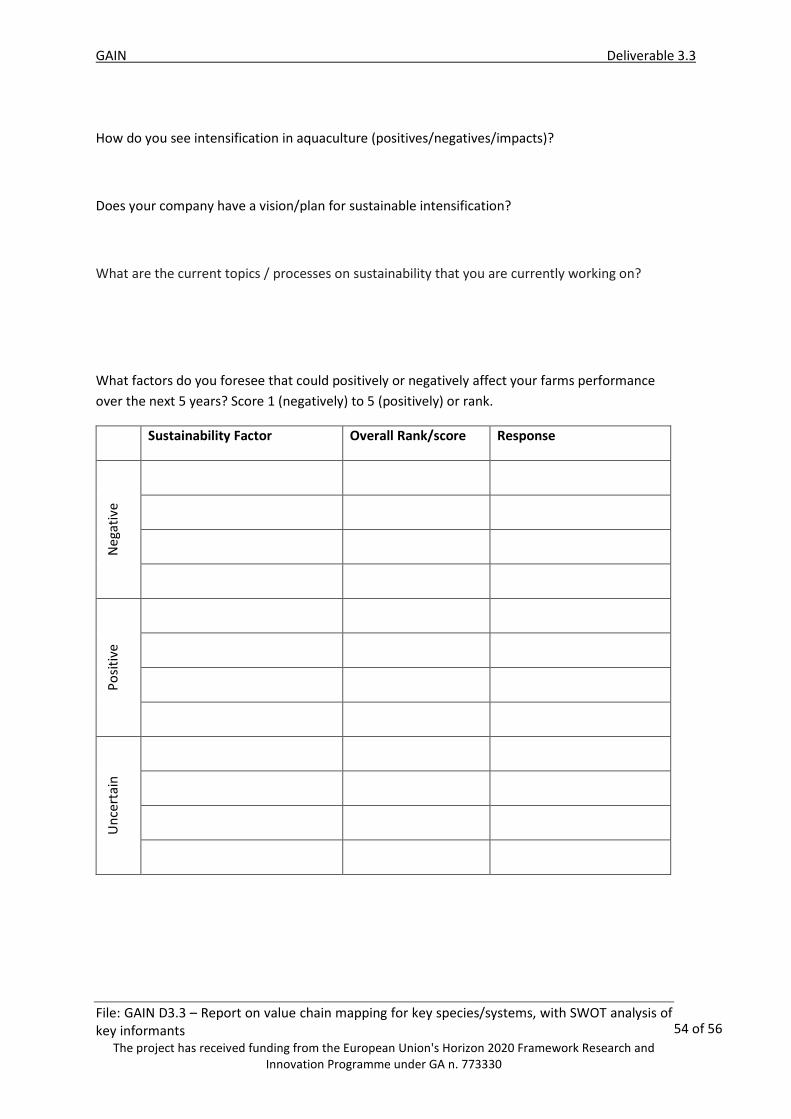
GAIN Deliverable 3.3
File: GAIN D3.3 – Report on value chain mapping for key species/systems, with SWOT analysis of key informants
The project has received funding from the European Union's Horizon 2020 Framework Research and Innovation Programme under GA n. 773330
54 of 56
How do you see intensification in aquaculture (positives/negatives/impacts)?
Does your company have a vision/plan for sustainable intensification?
What are the current topics / processes on sustainability that you are currently working on? What factors do you foresee that could positively or negatively affect your farms performance
over the next 5 years? Score 1 (negatively) to 5 (positively) or rank.
Sustainability Factor Overall Rank/score Response
Neg
ativ
e
Po
siti
ve
Un
cert
ain
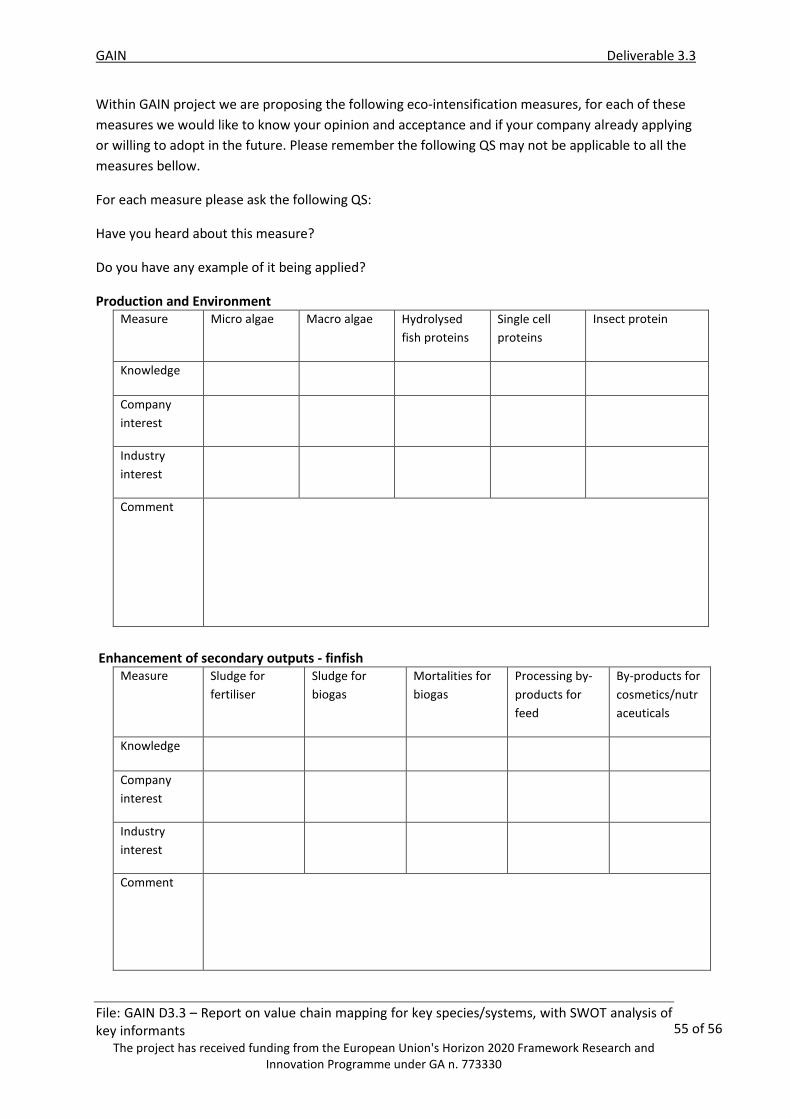
GAIN Deliverable 3.3
File: GAIN D3.3 – Report on value chain mapping for key species/systems, with SWOT analysis of key informants
The project has received funding from the European Union's Horizon 2020 Framework Research and Innovation Programme under GA n. 773330
55 of 56
Within GAIN project we are proposing the following eco-intensification measures, for each of these
measures we would like to know your opinion and acceptance and if your company already applying
or willing to adopt in the future. Please remember the following QS may not be applicable to all the
measures bellow.
For each measure please ask the following QS:
Have you heard about this measure?
Do you have any example of it being applied?
Production and Environment
Measure Micro algae Macro algae Hydrolysed
fish proteins
Single cell
proteins
Insect protein
Knowledge
Company
interest
Industry
interest
Comment
Enhancement of secondary outputs - finfish
Measure Sludge for
fertiliser
Sludge for
biogas
Mortalities for
biogas
Processing by-
products for
feed
By-products for
cosmetics/nutr
aceuticals
Knowledge
Company
interest
Industry
interest
Comment
GAIN Deliverable 3.3
File: GAIN D3.3 – Report on value chain mapping for key species/systems, with SWOT analysis of key informants
The project has received funding from the European Union's Horizon 2020 Framework Research and Innovation Programme under GA n. 773330
56 of 56
Enhancement of secondary outputs - shellfish Measure Shells for
biofilters
Shells for
packaging
Shells for
cement/filler
Use of big data
management
support
Use of big data for
welfare
Knowledge
Company
interest
Industry
interest
Comment
Do you think there is enough information available for the awareness of sustainable aquaculture
intensifications?