Embed Size (px)
Citation preview

ECO2 project number: 265847 Deliverable Number D14.1: Best Practice Guidance for Environmental Risk Assessment for offshore CO2 geological storage; WP14; lead beneficiary no 16 (DNVGL) ___________________________________________________________________________
Best Practice Guidance for Environmental Risk Assessment for offshore CO2 geological
storage
EU grant agreement no 265847 Deliverable 14.1
i

The research leading to these results has received funding from the European Union Seventh Framework Programme (FP7/2007-2013) under grant agreement n° 265847.
List of Contributors
Klaus Wallmann, GEOMAR
Tamara Baumberger, University of Bergen
Matthias Haeckel, GEOMAR
Stanley Beaubin, University of Roma
Peter Linke, GEOMAR
Samuela Vercelli, University of Roma
Laura Haffert GEOMAR
Alexander Proelss, University of Trier
Mark Schmidt GEOMAR
Ton Wildenborg, TNO
Stefan Buenz, University of Tromso
Tom Mikunda, TNO
Rachael James, Southampton University
Manuel Nepveu, TNO
Christopher Hauton, Southampton University
Carly Maynard, University of Edinburgh
Mikis Tsimplis, Southampton University
Sharnie Finnerty, DNV GL
Steve Widdicombe Plymouth Marine Laboratory
Todd Flach, DNV GL
Jeremy Blackford, Plymouth Marine Laboratory
Nada Ahmed, DNV GL
Ana M Queiros, Plymouth Marine Laboratory
Amund Ulfsnes, DNV GL
Doug Connelly, National Oceanography Centre
Lucy Brooks, DNV GL
Anna Lichtschlag, National Oceanography Centre
Thomas Moskeland, DNV GL
Marius Dewar, Heriot Watt University
Mark Purcell, DNV GL
Baixin Chen, Heriot Watt University
Acknowledgement should also be given to the entire ECO2 consortium who contributed at various stages of the ECO2 project to the results and content presented within this guidance document.
i

Table of contents
EXECUTIVE SUMMARY ........................................................................................................................ 1
1 INTRODUCTION .................................................................................................................. 3 1.1 Overview of the Guidance Document 3 1.2 Purpose 3 1.3 Users and applicability 3 1.4 Contributors 4
2 CCS LEGISLATIVE FRAMEWORK ................................................................................................. 5 2.1 Relevant legislation for CO2 storage in Europe 5 2.2 Public consultation of storage projects 12 2.3 Managing risk 13
3 ASSESSING THE CONSEQUENCES, PROBABILITIES AND RISKS ............................................................... 15 3.1 Overall approach 16 3.2 Step 1 – Apply EBSA methodology 18 3.3 Step 2 - Determine overlap between Plume and Valued resources 20 3.4 Step 3 - Define vulnerability and significance of impact 20 3.5 Step 4 – assess consequence 21 3.6 Step 5 – Estimate Propensity to Leak (PTL) 22 3.1 Step 6 – Assess individual risk for each potential leakage pathway 27
4 CRITERIA FOR SITE SELECTION IN THE MARINE ENVIRONMENT ............................................................ 28 4.1 Characterization of the architecture and integrity of the overburden 29 4.2 Footprints of CO2 leakage in the environment 32 4.3 Impact of leaked CO2 on marine ecosystems 35
5 RECOMMENDATIONS FOR ENVIRONMENTAL MONITORING AND BASELINE STUDIES AT SUB-SEABED CO2
STORAGE SITES ................................................................................................................. 39 5.1 Monitoring 39 5.2 Baseline studies 45
6 REFERENCES ................................................................................................................ 48
i
EXECUTIVE SUMMARY Carbon dioxide (CO2) separated from natural gas has been stored successfully below the seabed off Norway for almost two decades. Based on these experiences several demonstration projects supported by the EU and its member states are now setting out to store CO2 captured at power plants in offshore geological formations. The ECO2 project was triggered by these activities and funded by the EU to assess the environmental risks associated with the sub-seabed storage of CO2 and to provide guidance on environmental practices. ECO2 conducted a comprehensive offshore field programme at the Norwegian storage sites Sleipner and Snøhvit and at several natural CO2 seepage sites in order to identify potential pathways for CO2 leakage through the overburden, monitor seep sites at the seabed, track and trace the spread of CO2 in ambient bottom waters, and study the response of benthic biota to CO2. ECO2 identified a rich variety of geological structures in the broader vicinity of the storage sites that may have served as conduits for gas release in the geological past and located a seabed fracture and several seeps and abandoned wells where natural gas and formation water are released into the marine environment. Even though leakage may occur if these structures are not avoided during site selection, observations at natural seeps, release experiments, and numerical modelling revealed that the footprint at the seabed where organisms would be impacted by CO2 is small for realistic leakage scenarios. ECO2 conducted additional studies to assess and evaluate the legal framework and the public perception of CO2 storage below the seabed. The following guidelines and recommendations for environmental practices are based on these experiences.
The legal framework that should be considered in the selection of storage sites and the planning of environmental risk assessments and monitoring studies includes not only the EU directive on CO2 capture and storage (CCS) but related legislations including the EU Emission Trading Scheme, the Environmental Liability Directive, the London Protocol, OSPAR Convention, and Aarhus Convention. Public involvement in the planning and development of CCS projects is required by legislation. Based on its public perception studies, ECO2 recommends that messages to be communicated should address the specific contribution of CCS to the mitigation of anthropogenic CO2 emissions, its role within the context of other low carbon options as well as costs, safety and implementation issues at the local level.
ECO2 developed a generic approach for assessing consequences, probability and risk associated with sub-seabed CO2 storage based on the assessment of i) the environmental value of local organisms and biological resources, ii) the potentially affected fraction of population or habitat, iii) the vulnerability of, and the impact on the valued environmental resource, iv) consequences (based on steps i – iii), v) propensity to leak, vi) environmental risk (based on steps iv and v). The major new element of this approach is the propensity to leak factor which has been developed by ECO2 since it is not possible to simulate all relevant geological features, processes and events in the storage complex including the multitude of seepage-related structures in the overburden and at the seabed with currently available reservoir modelling software. The leakage propensity is thus estimated applying a compact description of the storage complex and more heuristic techniques accommodating for the large number of parameter uncertainties related to e.g. the permeability of potential leakage structures.
For site selection, ECO2 recommends to choose storage sites that have insignificant risks related to i) geological structures in the overburden and at the seabed that may serve as conduits for formation water and gas release, ii) geological formations containing toxic compounds that can be displaced to the seabed, iii) low-energy hydrographic settings with sluggish currents and strongly stratified water column, iv) proximity of storage sites to valuable natural resources (e.g. Natura 2000 areas, natural conservation habitats, reserves for wild fauna and flora), v) areas in which biota is already living at its tolerance limits because of existing exposure to additional environmental and/or other anthropogenic stressors.
Based on its extensive field programme ECO2 recommends that overburden, seabed, and water column should be surveyed applying the following techniques: i) 3-D seismic, ii) high-resolution bathymetry/backscatter mapping of the seabed, iii) acoustic imaging of shallow gas accumulations in the
1

seabed and gas bubbles ascending through the water column, iv) video/photo imaging of biota at the seabed, v) chemical detection of dissolved CO2 and related parameters in ambient bottom waters. Additional targeted studies have to be conducted if active formation water seeps, gas seeps, and pockmarks with deep roots reaching into the storage formation occur at the seabed. These sites have to be revisited on a regular basis to determine emission rates of gases and fluids and exclude that seepage is invigorated and pockmarks are re-activated by the storage operation. Baseline studies serve to determine the natural variability against which the response of the storage complex to the storage operation has to be evaluated. All measurements being part of the monitoring program, thus, need to be performed during the baseline study prior to the onset of the storage operation to assess the spatial and temporal variability of leakage-related structures, parameters, and processes.
2

1 INTRODUCTION At the European and International level Carbon dioxide capture and storage (CCS) is regarded as a key technology for the abatement of CO2 emissions from power plants and other industrial sources for mitigating the impact of climate change caused by the increase of anthropogenic carbon dioxide in the atmosphere. Hence the European Commission adopted the directive on the geological storage of carbon dioxide (CCS-Directive; 2009/31/EC) in 2009 and promotes the implementation of CCS in Europe at industrial scale by supporting selected demonstration projects. To implement the CCS Directive several European states (e.g. United Kingdom, the Netherlands, and Norway) propose to store CO2 below the seabed. Despite CO2 having been stored below the seabed in the North Sea (Sleipner, Utsira storage formation) since 1996 and in the Barents Sea (Snøhvit) since 2007, little is known about the potential short and long-term impacts of CO2 storage on marine ecosystems. In consequence of this lack of knowledge, ECO2 assessed the likelihood of CO2 leakage from current and potential storage sites and the impact of CO2 leakage on marine ecosystems. The project investigated two currently operating sub-seabed storage sites which are storing CO2 in saline aquifers at the continental shelf at ~90 m water depth (Sleipner) and the upper continental slope at ~330 m water depth (Snøhvit). Comprehensive process and monitoring studies at natural seepage sites, regarded as natural analogues for potential CO2 leaks at storage sites, as well as laboratory experiments and numerical modelling supported the fieldwork at the CO2 storage sites. The recommendations for environmental practices presented in the following sections are based on the data and experiences gained by ECO2.
1.1 Overview of the Guidance Document Successful implementation of any CO2 storage project will require comparisons of certain critical criteria among candidate sites as well as implementing appropriate monitoring regimes.
This Guidance document presents key highlights from the ECO2 project as well as recommendations fundamental to enabling successfully selection of a storage site and the implementation of an appropriate monitoring programme.
This guidance document is divided into five major chapters:
1. Introduction to the ECO2 project
2. Overview of the CCS Legal Framework including Public Perception and Managing Risks
3. Assessing the Consequences, Probabilities and Risks
4. Criteria and Recommendations for Site Selection in the Marine Environment
5. Recommendations for Environmental Monitoring and Baseline Studies at Sub-Seabed CO2 storage sites
1.2 Purpose This guidance document on Environmental Practices will enable stakeholders to assess the environmental risks associated with subsea storage of CO2 based on fundamental scientific and experimental research recently extended and updated with data from actual offshore sites.
1.3 Users and applicability This document will provide a reference to any developers, operators or stakeholders requiring guidance on environmental practices specific to a CCS project.
3

1.4 Contributors The ECO2 consortium consisted of 24 research institutes, one independent foundation (DNV GL), and 2 commercial entities (Statoil AS and Grupa Lotos). The consortium consists of nine European countries (Germany (8), Norway (5), U.K. (5), Italy (2), The Netherlands (2), Poland (2), Belgium (1), Sweden (1), France (1)). The project was coordinated by Prof. Klaus Wallmann from GEOMAR Helmholtz Centre for Ocean Research Kiel, Germany with an EC fund allocation of €10.5 million. The project commenced on the 1st of May 2011, and completed on the 30th of April 2015.
4
2 CCS LEGISLATIVE FRAMEWORK The recent emergence of CCS as a significant technology in the portfolio of mitigation options for greenhouse gas reduction has prompted the development of an enabling regulatory framework in the European Union (EU), in parallel to similar actions taken in multiple overseas countries. Thus far, the bulk of legislation has been targeted towards ensuring the safe and permanent geological storage of CO2. The integrity of the storage formation is the overriding concern because its breach will render CCS projects as inefficient in terms of isolating the CO2 stored from the atmosphere, but also because leakage may cause environmental degradation or damage.
The ECO2 project has made a major research and development effort to obtain answers related to; minimizing the risks of CO2 leakage from CO2 storage sites, developing suitable techniques for identifying and measuring CO2 leakage, and understanding the environmental and ecological impacts of possible leakage. In this Section, the regulatory setting in which the objectives of ECO2 are relevant is defined. Furthermore, examples of where the outputs of the ECO2 project are concretely supporting the operationalization of the EU CCS legislative framework are provided, linking regulatory requirements to the more detailed practice documentation in the following chapters.
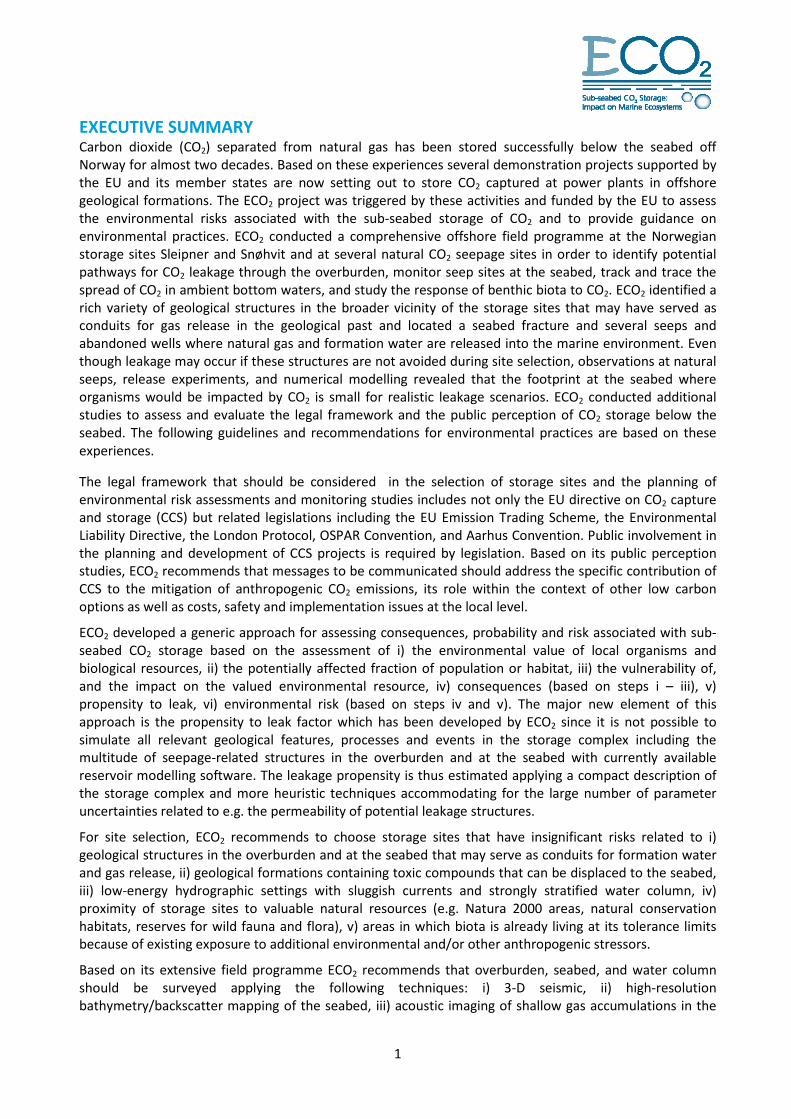
2.1 Relevant legislation for CO2 storage in Europe The development of offshore CCS is under the exclusive jurisdiction of each EU member state which may chose not to permit the development of such technology within its jurisdictional zones (This also has the consequence that CCS is not permitted where the storage site extends beyond the jurisdictional areas of EU member states). CCS development is facilitated by a European wide legal framework – the EU Directive on the geological storage of CO2. However it is also expressly subjected to various other European legal frameworks primarily contained in EU Directives (There is an extensive international legal framework which imposes specific duties to the EU member states and to the EU). This is outlined in Annex 1. However note that compliance with the requirements of national law is what is required by each operator. Compliance with the international laws and norms is a matter for the state. The choice of Directives as part of the European harmonisation of the regulatory and liability system for offshore CCS requires a further step of implementation at national level which includes significant discretion to national legislators on how to implement the obligations imposed by the Directives.
Figure 2-1: Overview of relevant legislation for CO2 storage in the EU
EU Directive on geological storage of
CO2
2009/31/EC
EU Emission Trading Scheme - Monitoring
and Reporting 2003/87/EC
Environmental liability Directive
2004/35/EC
International Agreements (London
Protocol, OSPAR Convention)
Member State
Jurisdiction
5

Despite the fact that the national legislator has discretion to implement stricter controls on certain elements of CO2 storage, the minimum mandatory requirements of the Directive must be transposed and enforced in national legislation. Therefore requirements of the Directive have, indirectly, helped to structure and steer research to meet the needs of industry with regards to safe operation and legal compliance. The rationale of ECO2 is no exception.
2.1.1 The EU Directive on the geological storage of CO2 The EU Directive on the geological storage of CO2 (commonly referred to as the CCS Directive), is the primary and only dedicated piece of European legislation for CCS, which contains a series of amendments for other existing EU Directives, notably on waste (ref /1/), water (ref /2/) and environmental liability (ref /3/), which are necessary to accommodate the specific risks to the environment posed by the technology. The Directive introduces the necessity for obtaining an exploration and CO2 storage permit, and outlines the obligatory components of a storage permit, including inter alia site selection procedures, site characterisation, monitoring plans, financial security and liability transfer protocols.
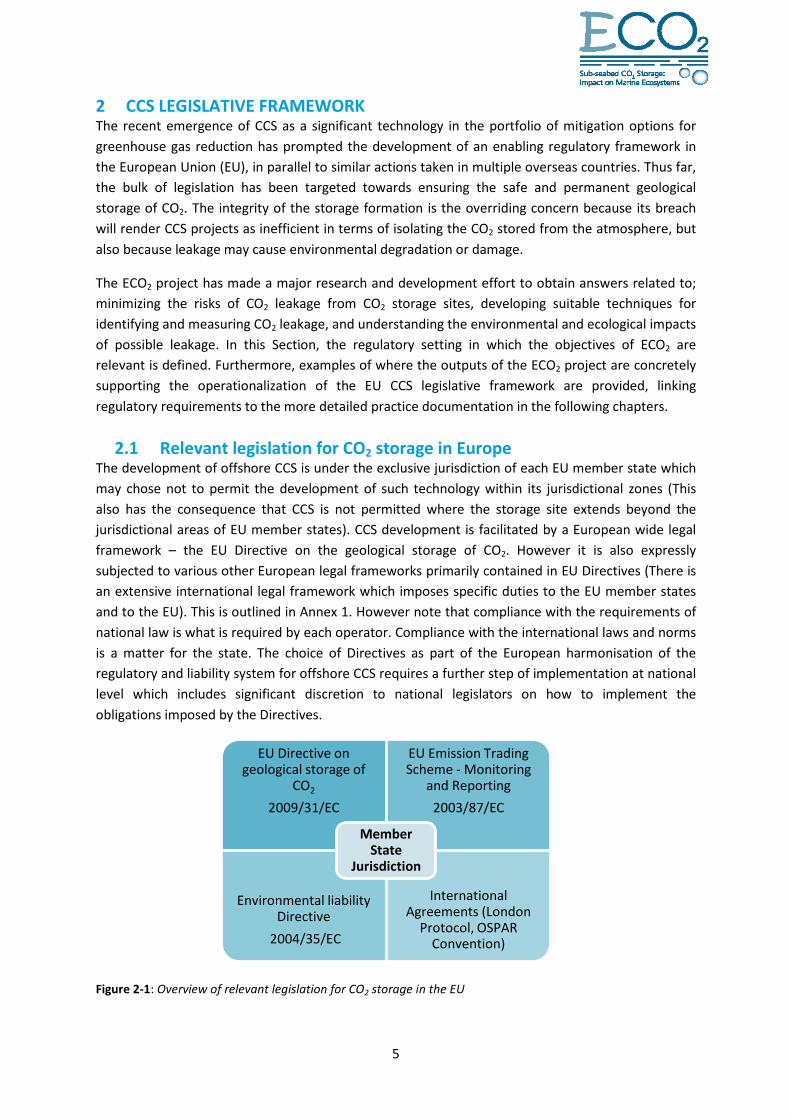
With specific relevance to the work of ECO2, the CCS Directive introduces a number of legal definitions (ref /4/) for ‘leakage’, ‘significant irregularity’ [in the storage operation or complex], and ‘significant risk’ [of leakage or risk to environment or human health]. Article 4(3) of the Directive introduces the legal requirements for the characterisation and assessment of the geological formation (potential storage complex), in application for a storage permit. The primary goal of the characterisation and assessment of the geological formation is to prove that there is no significant risk of future leakage and no significant environmental or health risks exist (art. 4). The assessment process must conform to set criteria, which is provided in Annex I of the Directive. The criteria are structured into 3 primary steps, of which a summary is presented below:
6
1. Data Collection
Sufficient data must be collected to be able to develop a volumetric and three-dimensional static model of the storage complex, including the sedimentary cover, surrounding area, including hydraulically connected areas.
2. Building the three-dimensional static geological earth model
Using the data collected in the previous step build a static geological model which can be used to characterise the storage complex.
3. Characterisation of the storage dynamic behaviour, sensitivity characterization, risk assessment
• Characterisation of the storage dynamic behaviour - based on dynamic modelling, comprising a
variety of time-step simulations of CO2 injection into the storage site using the three-dimensional static geological earth model
• Sensitivity characterisation - Multiple simulations shall be undertaken using altered parameters, rate functions and assumptions to identify the sensitivity of the assessment. Significant sensitivity must be used in the risk assessment.
• Risk assessment – incorporating:
• Hazard characterisation – Identify possible risks of leakage • Exposure assessment – Based on characteristics of environment and human population
above the storage complex • Effects assessment - based on the sensitivity of particular species, communities or habitats
linked to potential leakage events
• Risk characterization – comprise as assessment of the safety and integrity of the site in the short and long term, including an assessment of the leakage under the proposed conditions of use, and the worst-case environment and health impacts.
Figure 2-2: Overview of risk characterisation requirements of the EU CCS Directive
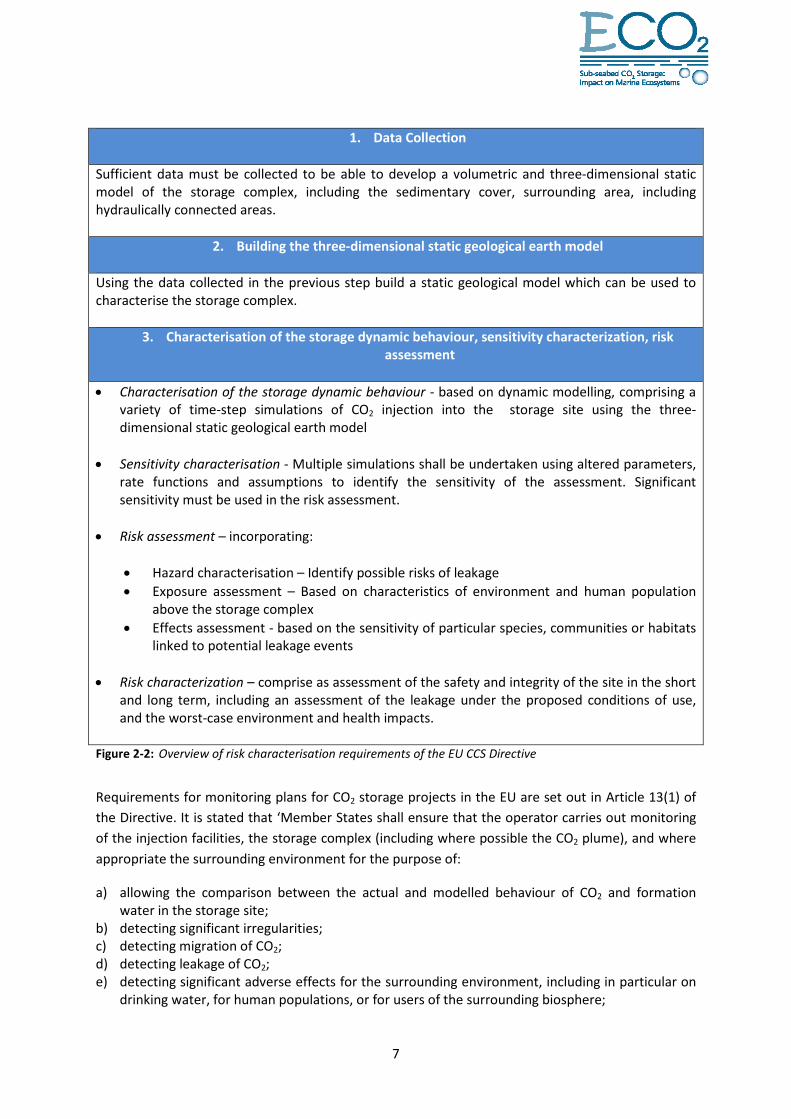
Requirements for monitoring plans for CO2 storage projects in the EU are set out in Article 13(1) of the Directive. It is stated that ‘Member States shall ensure that the operator carries out monitoring of the injection facilities, the storage complex (including where possible the CO2 plume), and where appropriate the surrounding environment for the purpose of:
a) allowing the comparison between the actual and modelled behaviour of CO2 and formation water in the storage site;
b) detecting significant irregularities; c) detecting migration of CO2; d) detecting leakage of CO2; e) detecting significant adverse effects for the surrounding environment, including in particular on
drinking water, for human populations, or for users of the surrounding biosphere;
7
Article 13(2) of the Directive further obligates the operator to develop a monitoring plan in line with the requirements of Annex II of the Directive. This Annex outlines the criteria for establishing and updating the monitoring plan, including post-closure monitoring. The design of the monitoring plan must take into account the risks identified in Article 4(3), and the fundamental purposes of the monitoring listed above in Article 13(1). The criteria include a list of specifications and parameters that must be incorporated into the monitoring plan, for the purposes of baseline, operational and post-closure phases.
2.1.2 International agreements for protection of the marine environment
The CCS Directive, while certainly being the most elaborated legal instrument concerning the regulation of CCS in general, does not represent an autonomous European approach to the matter relevant here. It is rather closely related to other binding legal instruments, which have been negotiated and adopted within institutional frameworks whose scope goes beyond that of the EU legal system. Recitals 12 (Recital 12 of the CCS Directive states that: “At the international level, legal barriers to the geological storage of CO2 in geological formations under the seabed have been removed through the adoption of related risk management frameworks under the 1996 London Protocol to the 1972 Convention on the Prevention of Marine Pollution by Dumping of Wastes and Other Matter (1996 London Protocol) and under the Convention for the Protection of the Marine Environment of the North-East Atlantic (OSPAR Convention)”, Articles 13 and 14 of the CCS Directive confirm that an effective regulation of offshore CCS cannot be achieved in an isolated manner by the EU, and underline the significance of obligations arising out of the 1996 London Protocol to the 1972 Convention on the Prevention of Marine Pollution by Dumping of Wastes and Other Matter (1996 London Protocol) (ref /5/) and the Convention for the Protection of the Marine Environment of the North-East Atlantic (OSPAR Convention) (ref/6/).
These international treaties are particularly relevant in the present context as they focus on the protection of the marine environment. Thus, the pertinent issue of sub-seabed storage of CO2 cannot legally be examined without reference to these agreements, also taking into account that their contracting parties (including, as far as the OSPAR Convention is concerned, the EU) are bound to observe and implement the obligations contained therein within their domestic legal systems.
In light of the potential activity of CO2 storage with potential effects on marine environments, both the OSPAR Convention and the London Protocol have developed a framework for risk assessment and management for CO2 sequestration in sub-seabed geological structures, abbreviated to FRAM. The FRAM includes the following steps:
Table 2-1: The London Protocol framework for risk assessment and management for CO2 sequestration in sub-seabed geological structures
Stage Description
1. Problem formulation Definition of boundaries of the assessment; outlines scenarios and pathways of CO₂ leakage
2. Site selection and characterisation
Collection of data of the physical, geological, chemical and biological conditions at the site which form the basis of the site selection and evaluation
8
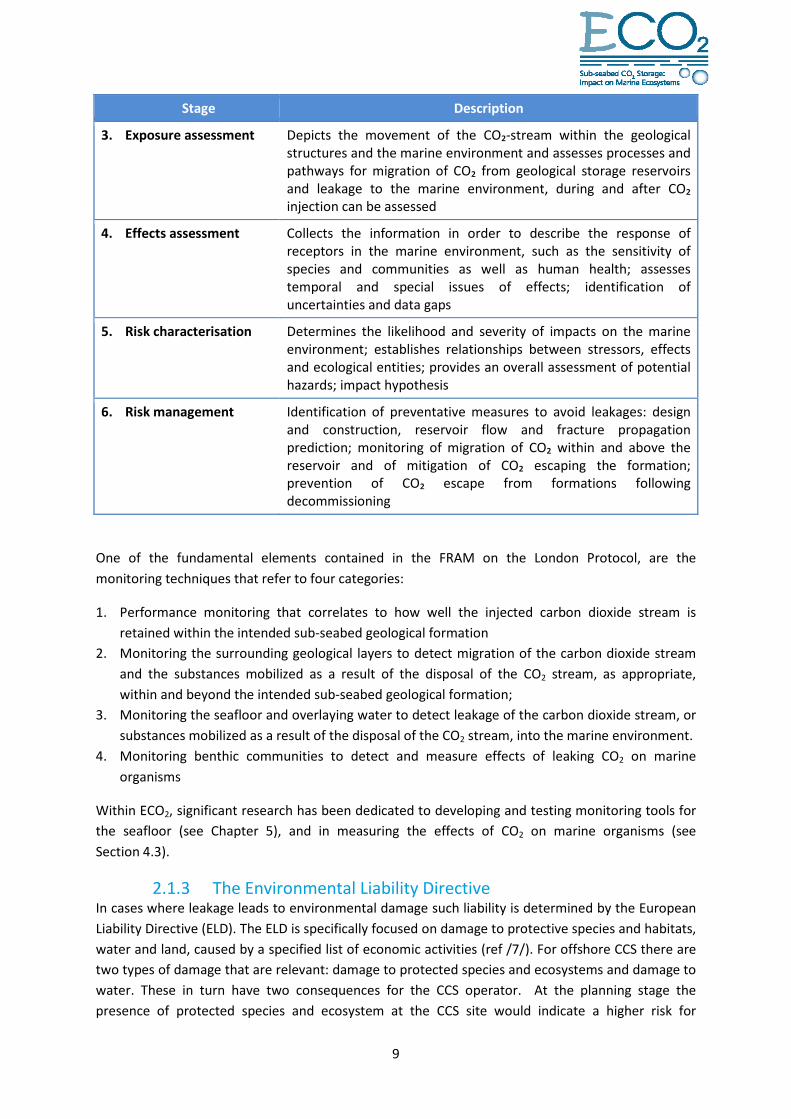
Stage Description
3. Exposure assessment Depicts the movement of the CO₂-stream within the geological structures and the marine environment and assesses processes and pathways for migration of CO₂ from geological storage reservoirs and leakage to the marine environment, during and after CO₂ injection can be assessed
4. Effects assessment Collects the information in order to describe the response of receptors in the marine environment, such as the sensitivity of species and communities as well as human health; assesses temporal and special issues of effects; identification of uncertainties and data gaps
5. Risk characterisation Determines the likelihood and severity of impacts on the marine environment; establishes relationships between stressors, effects and ecological entities; provides an overall assessment of potential hazards; impact hypothesis
6. Risk management Identification of preventative measures to avoid leakages: design and construction, reservoir flow and fracture propagation prediction; monitoring of migration of CO₂ within and above the reservoir and of mitigation of CO₂ escaping the formation; prevention of CO₂ escape from formations following decommissioning
One of the fundamental elements contained in the FRAM on the London Protocol, are the monitoring techniques that refer to four categories:
1. Performance monitoring that correlates to how well the injected carbon dioxide stream is retained within the intended sub-seabed geological formation
2. Monitoring the surrounding geological layers to detect migration of the carbon dioxide stream and the substances mobilized as a result of the disposal of the CO2 stream, as appropriate, within and beyond the intended sub-seabed geological formation;
3. Monitoring the seafloor and overlaying water to detect leakage of the carbon dioxide stream, or substances mobilized as a result of the disposal of the CO2 stream, into the marine environment.
4. Monitoring benthic communities to detect and measure effects of leaking CO2 on marine organisms
Within ECO2, significant research has been dedicated to developing and testing monitoring tools for the seafloor (see Chapter 5), and in measuring the effects of CO2 on marine organisms (see Section 4.3).
2.1.3 The Environmental Liability Directive In cases where leakage leads to environmental damage such liability is determined by the European Liability Directive (ELD). The ELD is specifically focused on damage to protective species and habitats, water and land, caused by a specified list of economic activities (ref /7/). For offshore CCS there are two types of damage that are relevant: damage to protected species and ecosystems and damage to water. These in turn have two consequences for the CCS operator. At the planning stage the presence of protected species and ecosystem at the CCS site would indicate a higher risk for
9
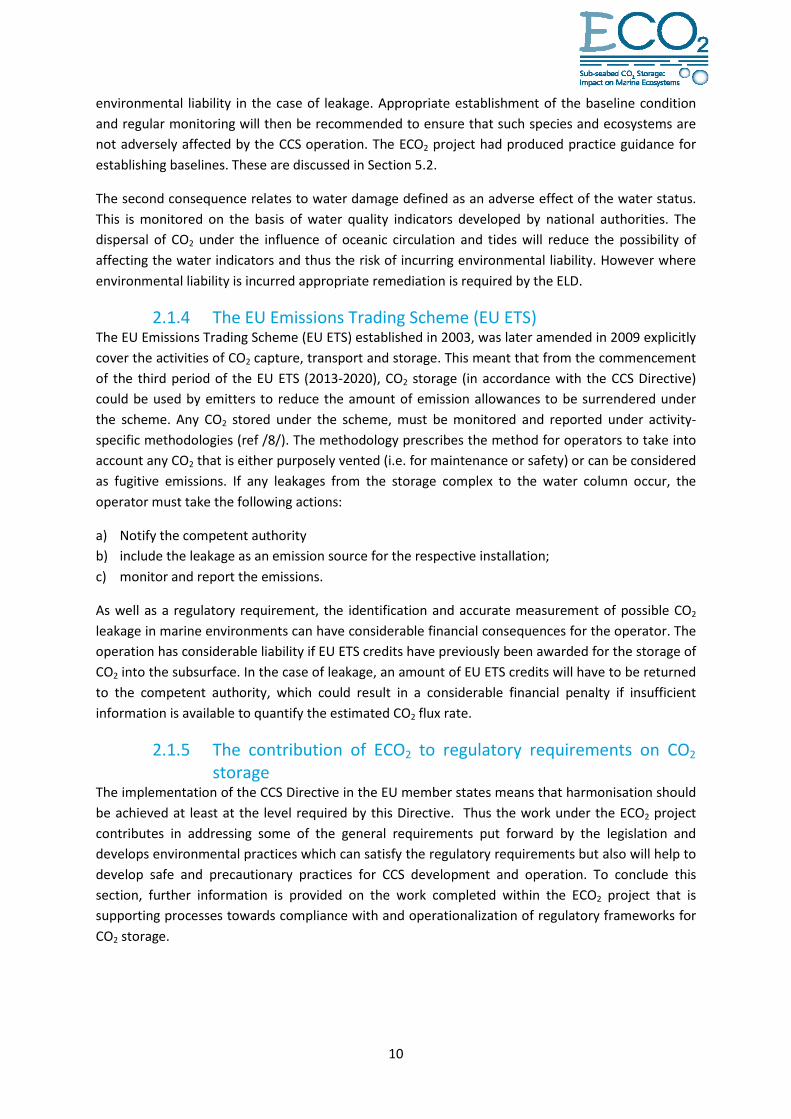
environmental liability in the case of leakage. Appropriate establishment of the baseline condition and regular monitoring will then be recommended to ensure that such species and ecosystems are not adversely affected by the CCS operation. The ECO2 project had produced practice guidance for establishing baselines. These are discussed in Section 5.2.
The second consequence relates to water damage defined as an adverse effect of the water status. This is monitored on the basis of water quality indicators developed by national authorities. The dispersal of CO2 under the influence of oceanic circulation and tides will reduce the possibility of affecting the water indicators and thus the risk of incurring environmental liability. However where environmental liability is incurred appropriate remediation is required by the ELD.
2.1.4 The EU Emissions Trading Scheme (EU ETS) The EU Emissions Trading Scheme (EU ETS) established in 2003, was later amended in 2009 explicitly cover the activities of CO2 capture, transport and storage. This meant that from the commencement of the third period of the EU ETS (2013-2020), CO2 storage (in accordance with the CCS Directive) could be used by emitters to reduce the amount of emission allowances to be surrendered under the scheme. Any CO2 stored under the scheme, must be monitored and reported under activity-specific methodologies (ref /8/). The methodology prescribes the method for operators to take into account any CO2 that is either purposely vented (i.e. for maintenance or safety) or can be considered as fugitive emissions. If any leakages from the storage complex to the water column occur, the operator must take the following actions:
a) Notify the competent authority b) include the leakage as an emission source for the respective installation; c) monitor and report the emissions.
As well as a regulatory requirement, the identification and accurate measurement of possible CO2 leakage in marine environments can have considerable financial consequences for the operator. The operation has considerable liability if EU ETS credits have previously been awarded for the storage of CO2 into the subsurface. In the case of leakage, an amount of EU ETS credits will have to be returned to the competent authority, which could result in a considerable financial penalty if insufficient information is available to quantify the estimated CO2 flux rate.
2.1.5 The contribution of ECO2 to regulatory requirements on CO2 storage
The implementation of the CCS Directive in the EU member states means that harmonisation should be achieved at least at the level required by this Directive. Thus the work under the ECO2 project contributes in addressing some of the general requirements put forward by the legislation and develops environmental practices which can satisfy the regulatory requirements but also will help to develop safe and precautionary practices for CCS development and operation. To conclude this section, further information is provided on the work completed within the ECO2 project that is supporting processes towards compliance with and operationalization of regulatory frameworks for CO2 storage.
10
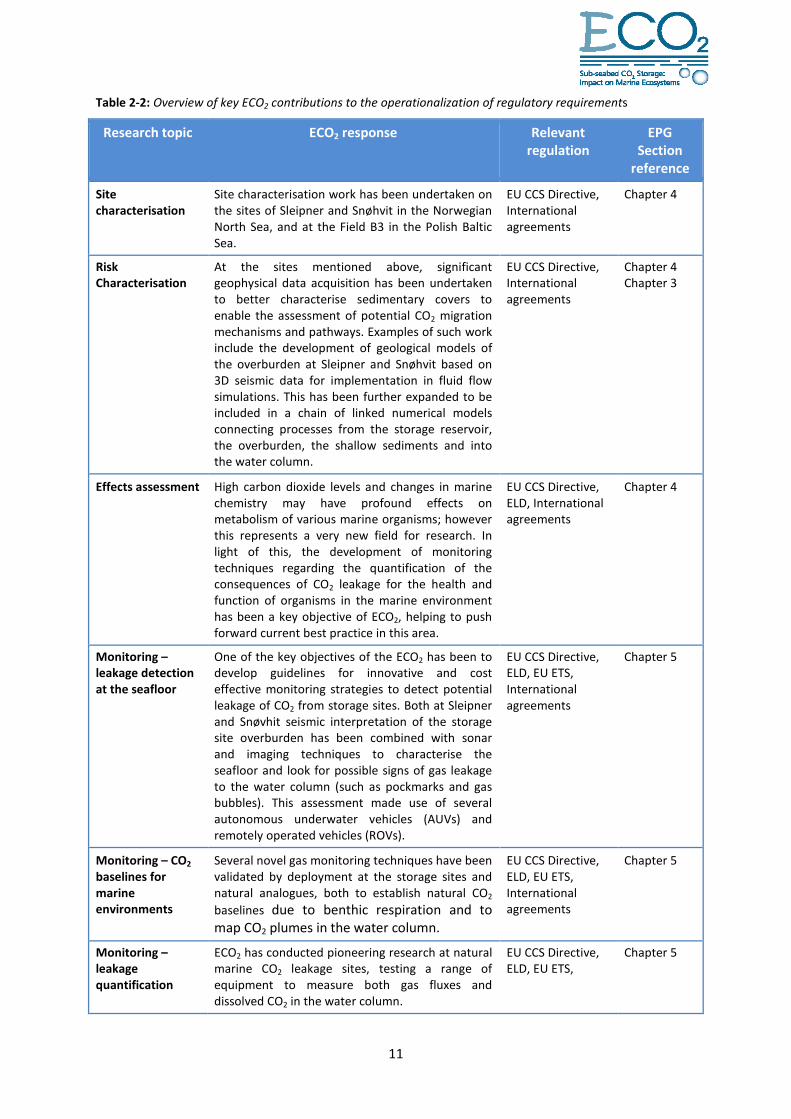
Table 2-2: Overview of key ECO2 contributions to the operationalization of regulatory requirements
Research topic ECO2 response Relevant regulation
EPG Section
reference
Site characterisation
Site characterisation work has been undertaken on the sites of Sleipner and Snøhvit in the Norwegian North Sea, and at the Field B3 in the Polish Baltic Sea.
EU CCS Directive, International agreements
Chapter 4
Risk Characterisation
At the sites mentioned above, significant geophysical data acquisition has been undertaken to better characterise sedimentary covers to enable the assessment of potential CO2 migration mechanisms and pathways. Examples of such work include the development of geological models of the overburden at Sleipner and Snøhvit based on 3D seismic data for implementation in fluid flow simulations. This has been further expanded to be included in a chain of linked numerical models connecting processes from the storage reservoir, the overburden, the shallow sediments and into the water column.
EU CCS Directive, International agreements
Chapter 4 Chapter 3
Effects assessment High carbon dioxide levels and changes in marine chemistry may have profound effects on metabolism of various marine organisms; however this represents a very new field for research. In light of this, the development of monitoring techniques regarding the quantification of the consequences of CO2 leakage for the health and function of organisms in the marine environment has been a key objective of ECO2, helping to push forward current best practice in this area.
EU CCS Directive, ELD, International agreements
Chapter 4
Monitoring – leakage detection at the seafloor
One of the key objectives of the ECO2 has been to develop guidelines for innovative and cost effective monitoring strategies to detect potential leakage of CO2 from storage sites. Both at Sleipner and Snøvhit seismic interpretation of the storage site overburden has been combined with sonar and imaging techniques to characterise the seafloor and look for possible signs of gas leakage to the water column (such as pockmarks and gas bubbles). This assessment made use of several autonomous underwater vehicles (AUVs) and remotely operated vehicles (ROVs).
EU CCS Directive, ELD, EU ETS, International agreements
Chapter 5
Monitoring – CO2 baselines for marine environments
Several novel gas monitoring techniques have been validated by deployment at the storage sites and natural analogues, both to establish natural CO2 baselines due to benthic respiration and to map CO2 plumes in the water column.
EU CCS Directive, ELD, EU ETS, International agreements
Chapter 5
Monitoring – leakage quantification
ECO2 has conducted pioneering research at natural marine CO2 leakage sites, testing a range of equipment to measure both gas fluxes and dissolved CO2 in the water column.
EU CCS Directive, ELD, EU ETS,
Chapter 5
11

Key findings from ECO2 public participation studies
• There is an urgent need for policy makers and technical stakeholders to provide convincing answers to the public about the CCS option and its role with respect to other technologies
• There is a general lack of awareness, understanding and enthusiasm about CCS among the public
• There is curiosity and interest for existing projects all over the world, thus the importance for pilot or demo projects to share their experience with the public
• Perceptions are influenced by values, context and experience
• Because of how we learn and form perceptions, careful attention must be paid to the way in which we engage the public – this affects the way in which they come to an opinion on CCS
• Technologies need to have a level of tangibility and the public also need to feel some sense of ‘ownership’, in order to engage
• The main question among the public we engaged with was around whether the CCS process is worthwhile, rather than around concerns about a specific project
2.2 Public consultation of storage projects Public involvement in the planning and development of CCS projects is required by legislation (e.g. to meet the principles of the Aarhus Convention, and as part of the EIA process). The European Directive on the geological storage of CO2, however, only requires that Member States make available to the public environmental information relating to the geological storage of CO2, while more detailed provision of information about real projects and guidance on how to approach this is lacking.
Members of the public have the opportunity to scrutinise and/or object to CCS development plans as part of the Environmental Impact Assessment, which is required for any new project, and it will be important to provide stakeholders with useful elements for setting the grounds of a constructive exchange with the public, to avoid public opposition which can lead to the delaying and cancellation of projects as has happened in the past, for instance in the Netherlands and in Germany. An exploration of how to approach public engagement, underpinned by an understanding of public perceptions, how they change, and what affects the formation of perceptions, will allow stakeholders to effectively involve the public in the process.
Through work carried out as part of the project, ECO2 has characterised public perception and identified current gaps in public and stakeholders’ relationships about this technology. The perception of CO2 geological storage is limited by scarce information and the lack of societal debate on how the current energy mix can influence the development of the energy system in the long term. Within this framework, we have identified that the success of single storage projects, in terms of public perception, hangs on wider and more general issues as much as on the good and safe management of each individual project’s procedures.
12

Awareness, understanding and approval of CCS is limited, but necessary, if CCS is to be deployed extensively in Europe to reduce emissions from power and heavy industry sectors. Early geological storage projects carry the burden of demonstrating efficacy, cost effectiveness, safety and environmental integrity to the public. People who learn for the first time about this technology frequently express interest in existing cases in order to form a judgement on the technology.
The level of public understanding of the overall role of CCS is key and messages to be communicated should include: the specific contribution of CCS, its role within the context of other low carbon options, understanding of costs, safety and implementation issues at the local level. Policy makers and other stakeholders should find a way to learn together on these issues and provide convincing answers to the public.
What is still unclear to the public is:
- The compatibility of CCS with the development of other low carbon options - The real costs and who is going to pay for them - The implementation timeline (including transport and pipeline networks) - Means of verification of correct operation, site management and closure - Long term demonstration, liability and management
Answers are required that are understandable to the general public and non-technical stakeholders, for a global understanding and also with regard to single projects.
2.3 Managing risk Risk management plays a key role in ensuring that risks related to the geological storage of CO2 at a given site are effectively managed in an accurate, balanced, transparent and traceable way and formed a key part of the deliverables of the ECO2 project.
Although permanent containment is the ultimate objective of any CO2 storage site, it is necessary to understand the probability of a release and its adverse consequences on the marine environment in order to establish the risk. As discussed in section 2.1.2 it is a legal requirement of the European CCS Directive to undertake a risk assessment in application for a storage permit. Risk assessment forms part of an overall risk management framework.
The risk management process and procedures applicable to a CO2 storage project should be consistent with the requirements of internationally recognised standards and legislation such as ISO31000, the CCS Directive and FRAM (OSPAR). The risk management framework needs to therefore:
• Set the Context: critical scoping step, describing the boundaries/context of the assessment; • Site selection and characterisation: collection and evaluation of data concerning the site • Exposure assessment: characterisation and movement of the CO2 stream • Effects assessment: assembly of information to describe the response of receptors; • Risk characterisation: integration of exposure and effect data to estimate the likely impact; and • Risk treatment: selecting the most appropriate risk treatment option • Risk monitoring: to ensure a safe and reliable operation of CCS storage sites • Communication and consultation: to ensure stakeholders are informed about the project
13

Chapter 3 below presents more details of the overall risk approach developed and employed as part of the ECO2 project.
14
3 ASSESSING THE CONSEQUENCES, PROBABILITIES AND RISKS Risks are characterized (ISO31000) by their consequence (or impact) and probability (or frequency). The objective of the assessment of environmental risks involves estimating consequence for the benthic species above a geological storage site and the probability of CO2 stored deep in the subsurface to leak into the marine environment. This is done for each identified discrete risk scenario, which are generally linked to potential site-specific leakage pathways from the target storage reservoir as described in chapter 4.
The estimation of consequences involves setting site specific environmental value for environmental resources within the potential impact area (benthic species), and defining the degree of impact based on vulnerability to exposure provided for by CO2 storage, leakage and dispersion modelling in the water column.
In the common risk evaluation method of discrete scenario analysis, the task of estimating probability is usually separated from the parallel task of estimating consequences. Reservoir simulation models provide plausible estimates of leakage rates for assumed subsurface structure, geology, leakage features and storage forecasts. To complete the risk scenarios related to CO2 geological storage sites requires estimates of the probability for realizing the given leakage outcome with associated consequences. The lessons learnt from analogue subsurface industrial activities are that
• Proper application of proven geoscience and subsurface engineering methods results in very safe and secure operations
• Cost-effective site performance is achievable and
• Technical and geological risks are manageable.
In addition, hundreds of thousands of wellbores in the oil and gas industry have provided deep insight into why and how frequently wellbores leak both during active operations and after they have been plugged and abandoned.
However, the overall impression of these subsurface industrial analogues is that although they have large statistical databases of performance, these have limited relevance for predicting future performance of CO2 geological storage sites. The reasons are varied, but the conclusion is clear.
It is considered best practice to estimate probability for a given CO2 geological storage site leakage scenario based on site-specific geological and engineering system descriptions.
This entails constructing a structural model of the specific storage site subsurface based on seismic and wellbore data and subsurface engineering description of the specific storage complex and injection project, complete with the relevant uncertainties including those implied in forward modelling.
Because there is limited industrial experience with CO2 geological storage site operations, there is no direct statistical basis for estimating leakage probability from sites which have been observed to leak, and therefore, probability estimates must be based on a “bottom-up” approach in which site-specific features are represented and evaluated. This has been the overall approach of ECO2, in which a portfolio of extended simulation modelling platforms has been applied to understand the most important physical processes in the main domains of the overall risk evaluation.
15
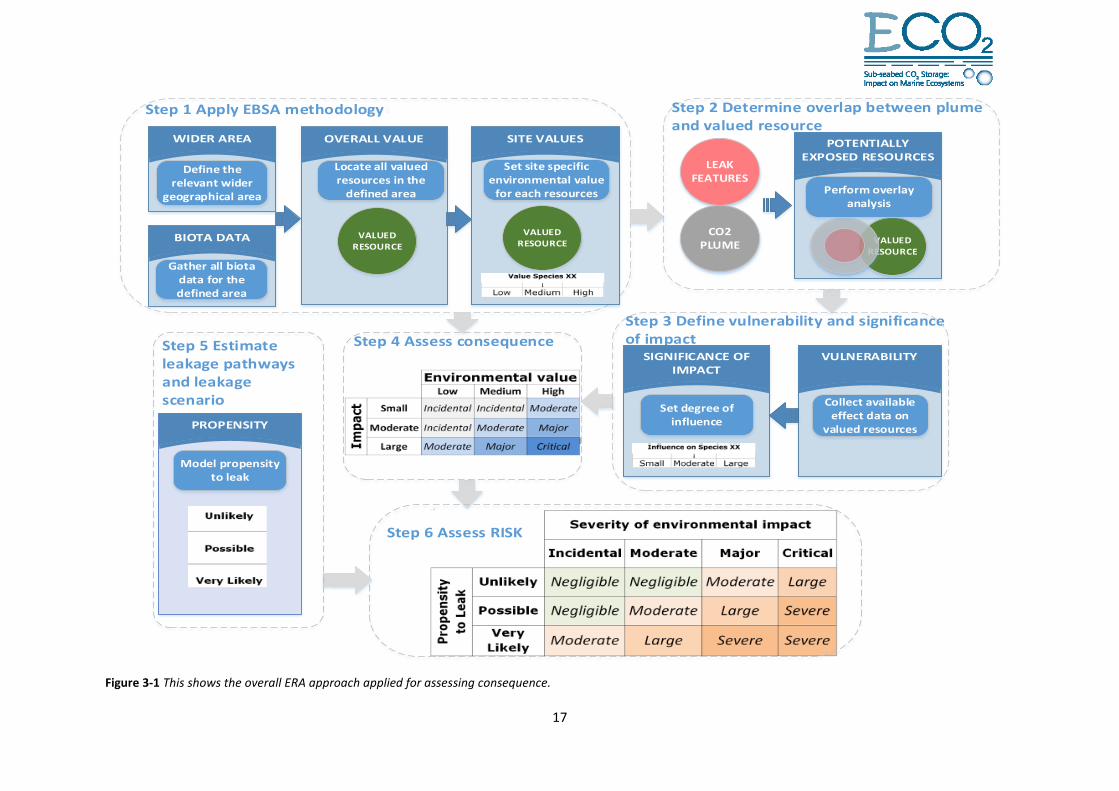
3.1 Overall approach A generic approach for assessing consequence, probability and risk has been developed to incorporate different scenarios ranging from small to large scale and different sources of influence, and can be applied for different environments such as offshore, inshore, benthic and pelagic. This approach has been applied to the Sleipner case study as part of the ECO2 project. The approach contains six main steps (Figure 3-1):
1. EBSA methodology (Ecologically or Biologically Significant Marine Areas). A description of marine resources within a defined area, and a site specific environmental value for each highlighted resource in that area.
2. Overlap analysis of plume and valued resource. A quantification of the potentially affected population or habitat expressed as a proportion, number of individuals, or size of an area.
3. Vulnerability and degree of impact. An assessment of the vulnerability of, and the impact on the valued environmental resource.
4. Consequence. Combination of the “environmental value” and “degree of impact” for each valued environmental resource expressed as consequence categories incidental, moderate, major or critical
5. Propensity to Leak. Estimated for each site-specific leakage pathway and leakage scenario. 6. Risk matrices for valued environmental resources
16
Locate all valued resources in the
defined area
VALUED RESOURCE
Gather all biota data for the defined area
Define the relevant wider
geographical area
Step 1Step 1 Apply EBSA methodology
VALUED RESOURCE
Set site specific environmental value
for each resources
Step 6 Assess RISK
Step 4 Assess consequence
Step 2 Determine overlap between plume and valued resource
VALUED RESOURCE
Perform overlay analysis
LEAK FEATURES
CO2 PLUME
Step 3 Define vulnerability and significance of impact
Set degree of influence
Collect available effect data on
valued resources
Step 5 Estimate leakage pathways and leakage scenario
Model propensity to leak
Figure 3-1 This shows the overall ERA approach applied for assessing consequence.
17

3.2 Step 1 – Apply EBSA methodology Site specific biology and habitats should be investigated and described in a systematic manner. The description should highlight species and habitats considered as important and a measure of value should be given for identified important species and habitats.
A recommended approach for this is the EBSA (Ecologically or Biologically Significant Marine Areas) approach. EBSA approach is an already established method, first initiated at a high level, by the Convention on Biological Diversity (CBD). The EBSA approach is transparent and logical, and aims to ensure that no resources of value are overlooked. A set of seven criteria to identify ecologically or biologically important areas in the sea (see CBD COP 9 Decision IX/20) are proposed as the basis for the environmental value assessments.
Table 3-1: The seven criteria used to identify ecologically or biologically important areas in the sea in the EBSA approach
CBD COP 9 Decision IX/20) Criteria Definition
Uniqueness or rarity
(i) unique ("the only one of its kind") rare (occurs only in few locations) endemic species/populations/communities
(ii) unique/rare/distinct habitats unique/rare/distinct ecosystems
(iii) unique/unusual geomorphological features unique/unusual oceanographic features
Special importance for life history stages of species
Those areas required for a population to survive and thrive.
Importance for threatened, endangered or declining species and/or habitats
Area containing habitat for the survival and recovery of endangered/threatened/declining species.
Area with significant assemblages of endangered/threatened/declining species.
Vulnerability, fragility, sensitivity, or slow recovery
Relatively high proportion of sensitive habitats/biotopes/species that are functionally fragile
Habitats/biotopes/species with slow recovery
Biological productivity
Area containing species/populations/communities with comparatively higher natural biological productivity
Biological diversity
Area contains comparatively higher diversity of ecosystems/habitats/communities/species/diversity.
Naturalness Area with a comparatively higher degree of naturalness as a result of the lack of or low level of human-induced disturbance or degradation.
In order to investigate and describe the site specific biology and habitats in an objective and transparent way, three main processes (based on Clark et al. 2014) are suggested.
1. Identify the area to be examined 2. Determine appropriate data sets, and identify valued resources 3. Assign environmental value
18
3.2.1 Identifying the area to be examined The seabed area potentially at risk from CO2 leakage should be defined based on the location of the CO2 storage reservoir, the maximum extent of the stored CO2 in its target reservoir, of leak features and pathways such as chimneys and conduits, bathymetry of the site within this volume and prevailing ocean currents at the site. The potential risk area is placed in the context of its location and importance. Marine areas are characterized by particular bathymetric conditions, human impacts and ecosystems, and they can be classified into distinct entities at different geographical scales. It is this area that is assessed for Valued Resources in an ERA methodology.
3.2.2 Determine appropriate data sets and identify valued resources in the area
To ensure a comprehensive assessment, all sources of biota and habitat information available for the area are consulted and documented. This refers principally to biological resources, such as benthic species and important habitats. The biota data is evaluated against criteria (such as that illustrated in Table 3-1, to ensure no resources of value are overlooked. Existing recognized frameworks which evaluate the conservation/value status of marine species, habitats and areas can be applied. These include international, national and regional frameworks, such as the OSPAR List of threatened or declining species, IUCN Red List of threatened species, and national Red Lists of threatened habitat and species. This method does not exclude resources which are considered valuable by a particular sector, and any resource can be taken through the process.
The outcome of this step within the overall process should be an overview of the ecological and biological components along with an environmental map for each identified species/habitat describing the spatial distribution.
3.2.3 Assign environmental value Each identified valued resource within the anticipated influence area should be valued descriptively according to the following criteria:
Low value: Area with local importance for species and habitats
Medium value: Area with regional importance for species and habitats, and/or having national Red List species/habitats classified as data deficient (DD) or nearly threatened (NT).
High value: Area with national importance for species and habitats, and/or having national Red List species/habitats classified as vulnerable (VU), endangered (EN), critically endangered (CR) or regionally extinct (RE).
As a starting point, the value assigned by recognized frameworks (international, national and regional) are applied. If higher resolution data on abundance and distribution of the valued resource are available, these can be used to adjust the assigned value. The value derived would thus be case-specific. The rationale behind assigning a value to a resource, and the sources of data used, must be clearly documented and traceable.
For a given species which e.g. has been assessed to have “medium value” the outcome would be as illustrated below.
Environmental value Species XX
↓ Low Medium High
19
3.3 Step 2 - Determine overlap between Plume and Valued resources
3.3.1 Sub-seabed Leak features In order to assess environmental consequences one has to identify potential leak features that can connect the CO2 stored in the target subsurface geological formation with the seabed. All identified leak features should be described and drawn up in a scaled map which also shows estimates of the extent of the stored CO2 in its target formation.
3.3.2 Model of leaks and plumes The CO2 leak from identified leak features is modelled. Modelling should include all necessary aspects of a leak scenario appropriate for the leak pathways identified. As each leak features is unique, the potential leakage should ideally be modelled for each individual feature based on its specific characteristics and the overall operation of the storage site. The results from modelling should in general be data on the plume characteristics leaking into the water column and being dispersed by local ocean currents and include, but not necessarily limited to, changes in pH and/or pCO2, and the extent of the change in 3 dimensions (x, y, z). A cut-off of the plume extent should be defined based on either natural variation and/or specific tolerance for a given environmental resource (see section 3.4.2).
3.3.3 Overlap analysis The purpose of the overlap analysis is to determine the overlap between the CO2 leak and each valued resource identified in Step 1. By combining identified leak features, simulation model results on seepage to the seabed, dispersion of the leaked CO2 in the water column as influenced by local currents and bathymetry with the spatial distribution of the identified valued resources, the leak features that may have an impact on identified resources are visualized. The potentially affected valuable population or habitat in the overlap area can then be quantified. This could be expressed as a proportion of a population, number of individuals, or size of an area.
3.4 Step 3 - Define vulnerability and significance of impact After valued resources have been identified, an environmental value for each has been generated, leak features have been identified, and CO2 leakage plume and dispersion modelling results are available, impacts on each valued resource need to be described and defined for the source of influence (i.e. pH change). This description should refer to results from research available for the public. If there is no published research available on effects, conservative thresholds of impact (precautionary principle) should be applied.
3.4.1 Vulnerability The most up-to-date and comprehensive data available on the valued organisms’ vulnerability to increased levels of carbon dioxide at the sea bed should be gathered. The vulnerability can be expressed as a ‘threshold value’ -a level to which it is believed a species can be exposed without adverse effects. As new information from research becomes available, the ERA can be updated. All sources of data should be documented clearly to ensure traceability and reproducibility of the ERA, and to enable policy decisions based on particular information to be traced back to source.
The following source of species effects data should be used in the ERA in the following order of preference:
20
1. Specially designed experiments on the particular species of interest from the population in the potential risk area.
2. Published data on the species of interest from a different population
3. Published data from closely related taxa that are matched for life history, traits and physiology
4. Published data on less closely related taxa, matched for life history, traits and physiology
5. Expert judgment based on knowledge of the organisms’ physiology and life history traits
6. Apply precautionary approach: if there is a suspected risk of causing an effect to the species, in the absence of scientific consensus that the action is not harmful, the burden of proof that it is not harmful lies with those taking the action.
3.4.2 Defining the degree of the impact on the valued resource The threshold values obtained from literature are integrated into the modeled pH/pCO2 plume as a cut-off, outside which no adverse effect on that particular valuable resource is expected. Contours within the plume indicate zones of effect on the particular valuable resource.
The degree of the impact (i.e. the magnitude of the effect on the species) on each identified resource can be descriptively assessed according to the following criteria:
Small degree: The impact can impair/reduce species and habitats on an individual level.
Moderate degree: The impact can impair species and habitats at the population level.
Large degree: The impact can reduce/remove species and habitats at the population level.
The method for defining degree of impact will depend on the particular valuable resource being assessed: whether it is a discrete entity which has an individual value, whether it is a valuable habitat which must cover a certain area of sea bed, etc.
For a given species, which for example has been evaluated to be impacted to a “moderate degree” the outcome would be as illustrated below:
Degree of impact on Species XX ↓
Small Moderate Large
3.5 Step 4 – assess consequence The assessment of environmental value and the degree of impact are further compiled in a consequence matrix (see below). Each valued resource identified in Step 3.2.2 is taken through the process from 3.2.3 onwards, and ultimately placed in the consequence table. The results from the consequence matrix are a direct input to the risk matrix for the given resource.
21
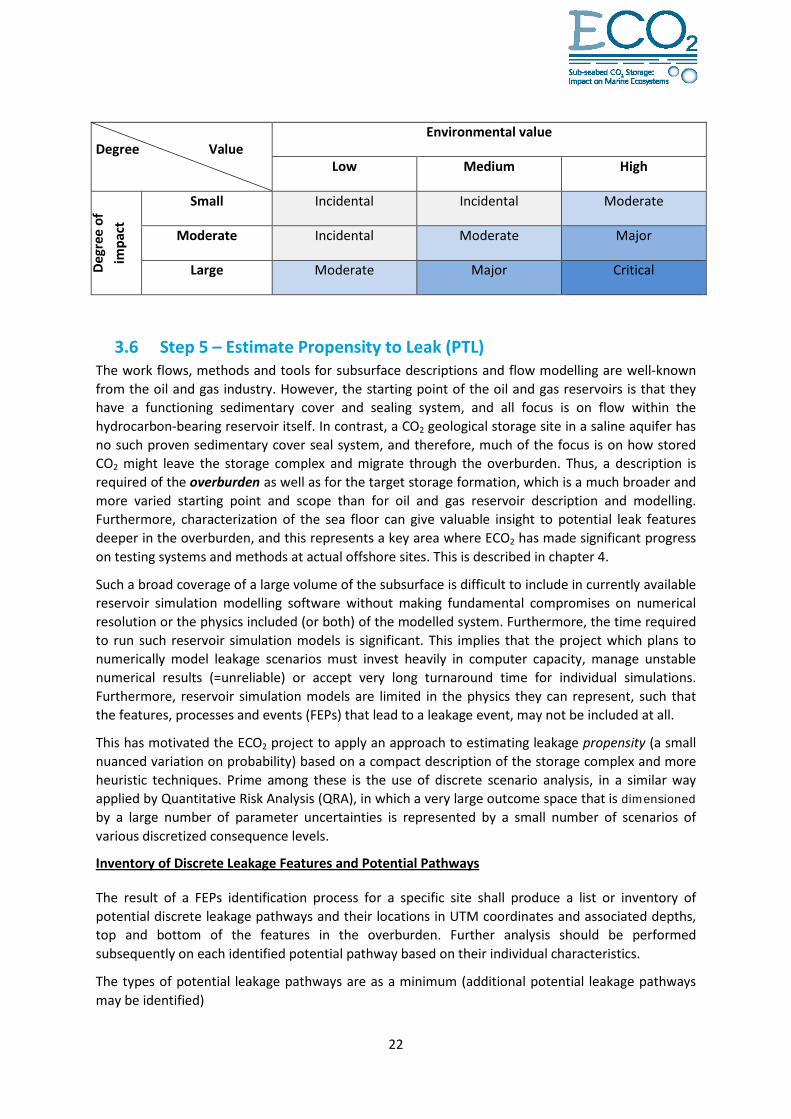
Degree Value Environmental value
Low Medium High
Degr
ee o
f im
pact
Small Incidental Incidental Moderate
Moderate Incidental Moderate Major
Large Moderate Major Critical
3.6 Step 5 – Estimate Propensity to Leak (PTL) The work flows, methods and tools for subsurface descriptions and flow modelling are well-known from the oil and gas industry. However, the starting point of the oil and gas reservoirs is that they have a functioning sedimentary cover and sealing system, and all focus is on flow within the hydrocarbon-bearing reservoir itself. In contrast, a CO2 geological storage site in a saline aquifer has no such proven sedimentary cover seal system, and therefore, much of the focus is on how stored CO2 might leave the storage complex and migrate through the overburden. Thus, a description is required of the overburden as well as for the target storage formation, which is a much broader and more varied starting point and scope than for oil and gas reservoir description and modelling. Furthermore, characterization of the sea floor can give valuable insight to potential leak features deeper in the overburden, and this represents a key area where ECO2 has made significant progress on testing systems and methods at actual offshore sites. This is described in chapter 4.
Such a broad coverage of a large volume of the subsurface is difficult to include in currently available reservoir simulation modelling software without making fundamental compromises on numerical resolution or the physics included (or both) of the modelled system. Furthermore, the time required to run such reservoir simulation models is significant. This implies that the project which plans to numerically model leakage scenarios must invest heavily in computer capacity, manage unstable numerical results (=unreliable) or accept very long turnaround time for individual simulations. Furthermore, reservoir simulation models are limited in the physics they can represent, such that the features, processes and events (FEPs) that lead to a leakage event, may not be included at all.
This has motivated the ECO2 project to apply an approach to estimating leakage propensity (a small nuanced variation on probability) based on a compact description of the storage complex and more heuristic techniques. Prime among these is the use of discrete scenario analysis, in a similar way applied by Quantitative Risk Analysis (QRA), in which a very large outcome space that is dimensioned by a large number of parameter uncertainties is represented by a small number of scenarios of various discretized consequence levels.
Inventory of Discrete Leakage Features and Potential Pathways
The result of a FEPs identification process for a specific site shall produce a list or inventory of potential discrete leakage pathways and their locations in UTM coordinates and associated depths, top and bottom of the features in the overburden. Further analysis should be performed subsequently on each identified potential pathway based on their individual characteristics.
The types of potential leakage pathways are as a minimum (additional potential leakage pathways may be identified)
22
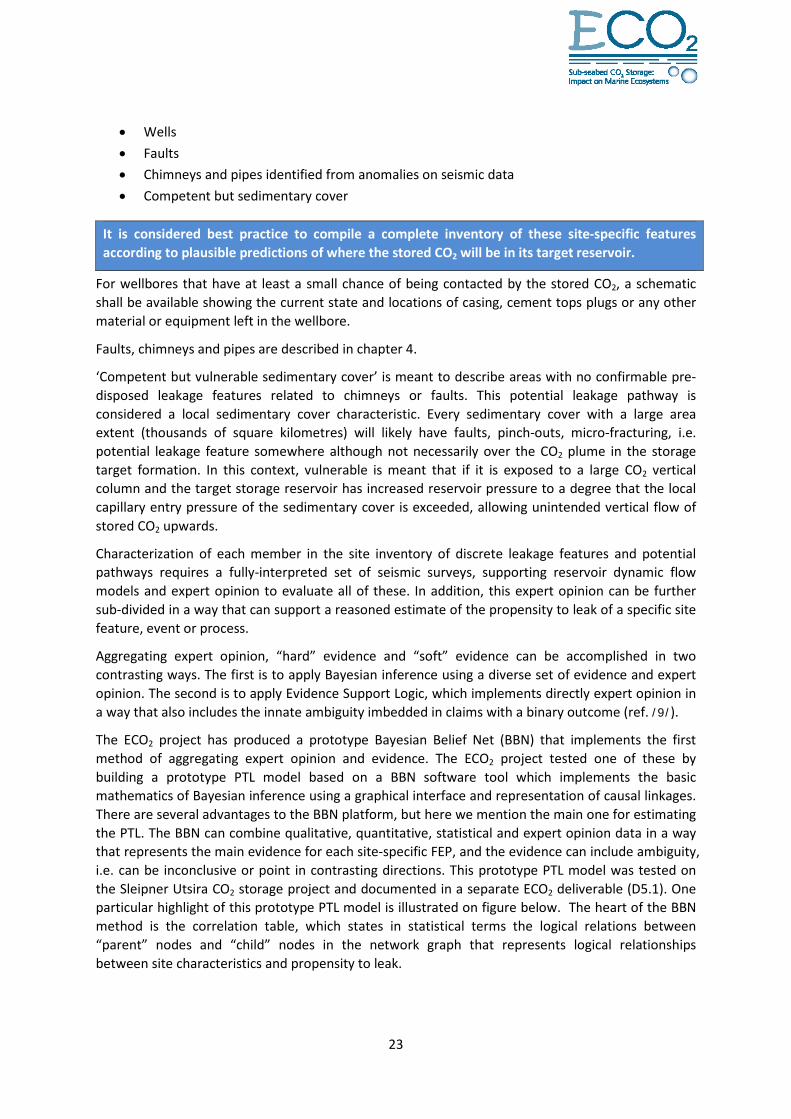
• Wells • Faults • Chimneys and pipes identified from anomalies on seismic data • Competent but sedimentary cover
It is considered best practice to compile a complete inventory of these site-specific features according to plausible predictions of where the stored CO2 will be in its target reservoir.
For wellbores that have at least a small chance of being contacted by the stored CO2, a schematic shall be available showing the current state and locations of casing, cement tops plugs or any other material or equipment left in the wellbore.
Faults, chimneys and pipes are described in chapter 4.
‘Competent but vulnerable sedimentary cover’ is meant to describe areas with no confirmable pre-disposed leakage features related to chimneys or faults. This potential leakage pathway is considered a local sedimentary cover characteristic. Every sedimentary cover with a large area extent (thousands of square kilometres) will likely have faults, pinch-outs, micro-fracturing, i.e. potential leakage feature somewhere although not necessarily over the CO2 plume in the storage target formation. In this context, vulnerable is meant that if it is exposed to a large CO2 vertical column and the target storage reservoir has increased reservoir pressure to a degree that the local capillary entry pressure of the sedimentary cover is exceeded, allowing unintended vertical flow of stored CO2 upwards.
Characterization of each member in the site inventory of discrete leakage features and potential pathways requires a fully-interpreted set of seismic surveys, supporting reservoir dynamic flow models and expert opinion to evaluate all of these. In addition, this expert opinion can be further sub-divided in a way that can support a reasoned estimate of the propensity to leak of a specific site feature, event or process.
Aggregating expert opinion, “hard” evidence and “soft” evidence can be accomplished in two contrasting ways. The first is to apply Bayesian inference using a diverse set of evidence and expert opinion. The second is to apply Evidence Support Logic, which implements directly expert opinion in a way that also includes the innate ambiguity imbedded in claims with a binary outcome (ref. /9/).
The ECO2 project has produced a prototype Bayesian Belief Net (BBN) that implements the first method of aggregating expert opinion and evidence. The ECO2 project tested one of these by building a prototype PTL model based on a BBN software tool which implements the basic mathematics of Bayesian inference using a graphical interface and representation of causal linkages. There are several advantages to the BBN platform, but here we mention the main one for estimating the PTL. The BBN can combine qualitative, quantitative, statistical and expert opinion data in a way that represents the main evidence for each site-specific FEP, and the evidence can include ambiguity, i.e. can be inconclusive or point in contrasting directions. This prototype PTL model was tested on the Sleipner Utsira CO2 storage project and documented in a separate ECO2 deliverable (D5.1). One particular highlight of this prototype PTL model is illustrated on figure below. The heart of the BBN method is the correlation table, which states in statistical terms the logical relations between “parent” nodes and “child” nodes in the network graph that represents logical relationships between site characteristics and propensity to leak.
23
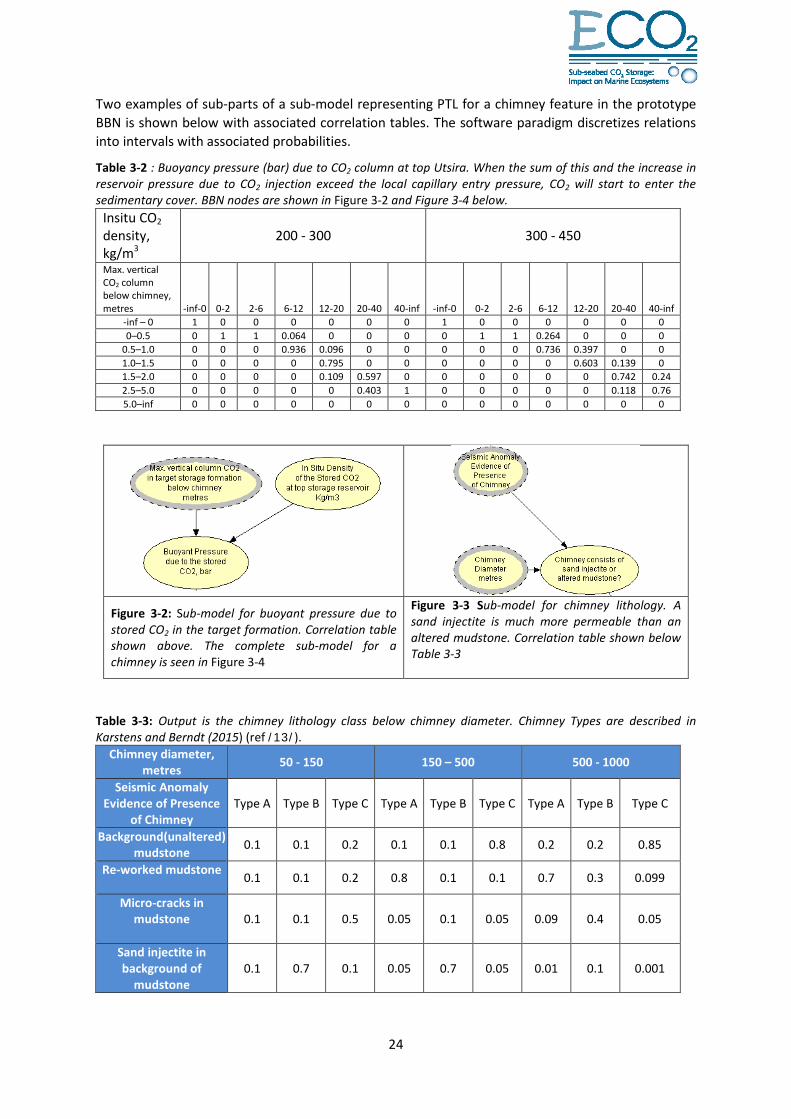
Two examples of sub-parts of a sub-model representing PTL for a chimney feature in the prototype BBN is shown below with associated correlation tables. The software paradigm discretizes relations into intervals with associated probabilities.
Table 3-2 : Buoyancy pressure (bar) due to CO2 column at top Utsira. When the sum of this and the increase in reservoir pressure due to CO2 injection exceed the local capillary entry pressure, CO2 will start to enter the sedimentary cover. BBN nodes are shown in Figure 3-2 and Figure 3-4 below.
Insitu CO2 density, kg/m3
200 - 300 300 - 450
Max. vertical CO2 column below chimney, metres -inf-0 0-2 2-6 6-12 12-20 20-40 40-inf -inf-0 0-2 2-6 6-12 12-20 20-40 40-inf
-inf – 0 1 0 0 0 0 0 0 1 0 0 0 0 0 0 0–0.5 0 1 1 0.064 0 0 0 0 1 1 0.264 0 0 0
0.5–1.0 0 0 0 0.936 0.096 0 0 0 0 0 0.736 0.397 0 0 1.0–1.5 0 0 0 0 0.795 0 0 0 0 0 0 0.603 0.139 0 1.5–2.0 0 0 0 0 0.109 0.597 0 0 0 0 0 0 0.742 0.24 2.5–5.0 0 0 0 0 0 0.403 1 0 0 0 0 0 0.118 0.76 5.0–inf 0 0 0 0 0 0 0 0 0 0 0 0 0 0
Figure 3-2: Sub-model for buoyant pressure due to stored CO2 in the target formation. Correlation table shown above. The complete sub-model for a chimney is seen in Figure 3-4
Figure 3-3 Sub-model for chimney lithology. A sand injectite is much more permeable than an altered mudstone. Correlation table shown below Table 3-3
Table 3-3: Output is the chimney lithology class below chimney diameter. Chimney Types are described in Karstens and Berndt (2015) (ref /13/).
Chimney diameter, metres 50 - 150 150 – 500 500 - 1000
Seismic Anomaly Evidence of Presence
of Chimney Type A Type B Type C Type A Type B Type C Type A Type B Type C
Background(unaltered) mudstone 0.1 0.1 0.2 0.1 0.1 0.8 0.2 0.2 0.85
Re-worked mudstone 0.1 0.1 0.2 0.8 0.1 0.1 0.7 0.3 0.099
Micro-cracks in mudstone
0.1 0.1 0.5 0.05 0.1 0.05 0.09 0.4 0.05
Sand injectite in background of
mudstone 0.1 0.7 0.1 0.05 0.7 0.05 0.01 0.1 0.001
24
The simple sub-models shown above are part of a total BBN for a chimney feature shown in Figure 3-4 below. A sub-model has been created for the other leakage features mentioned above. A node with no arrows going into it is an input node with a simple discrete interval uncertainty table associated with it. All nodes “downstream” of these input nodes require a correlation table (also based on discrete numerical interval representation, qualitative labels for intervals, or an intermediate formula calculation) which relates all incoming arrow links to be represented and an output from the intermediate (or final node).
The BBN model platform is considered best practice for representing uncertainties from different sources (from directly measured data, interpreted proxy data, numerical simulation model data, analogue data and statistics and expert opinion) in a model that includes a large number of contrasting geological, physics and engineering features, events and processes (FIPs). The experience of ECO2 has shown conclusively that trying to integrate all these into a single reservoir numerical simulation model is still not feasible with today’s best software and computing hardware. Furthermore, the lack of data for critical parameters for some FIPs is simply not reconcilable without disproportionately large investment in collecting field data. The most prominent examples are the capillary entry pressure, effective permeability of a chimney or pipe and its base depth. For these, expert opinion based on proxy data and advanced interpretation or small-scale sub-models with increased detail and physics will still be the only source of estimates.
But an even more fundamental site characteristic can be crucial yet uncertain despite good coverage of survey data. The movement of CO2 in the target reservoir determines whether it will contact a potential leakage feature. The mapping of the topography of the top of the target storage reservoir is deduced by processing and interpreting acoustic seismic data, which has a fundamental limit on resolution and accuracy. It is known that top target reservoir may have low spots and high spots which determine whether CO2 can travel in one direction or another. Numerical reservoir simulation models may be useful to identify scenarios of different CO2 movement directions, but these are often limited to even coarser resolution than the static models on which they are based. So even in this basic site characteristic of mapping target storage formation topography, it is considered best practice to apply a high-level approach which captures a full range of possible outcomes in direction of movement of the stored CO2 plume. This has been tested in the BBN model for ECO2.
Figure 3-4 shows one BBN sub-model that produces an estimate of the propensity to leak (PTL) for a single site-specific chimney. This figure is intended to illustrate both the causal relationships between different characteristics of the chimney itself, the main physical features that influence the PTL for the chimney, the storage site overall layout and properties of the sedimentary cover sealing system. It has been constructed based on a specific storage site. Different storage sites may have different FEPs as primary influencers and the BBN sub-model that works best may be different.
The second method for aggregating expert opinion is the Evidence Support Logic (ESL) technique (ref /9/ and /10/). This starts with a top-level binary claim or hypothesis and structures a linearly-linked hierarchy of sub-claims or sub-hypotheses that lead to the top-level. Each sub-claim has evidence for which it is directly assigned two numerical values, one value for the degree to which the evidence supports the sub-claim, and one value for the degree to which the evidence refutes the sub-claim. A single piece of evidence can in other words have both supporting and refuting value at the same time. A special mathematical algorithm then aggregates the values of support and refutation for each evidence piece for each sub-claim up to the top-level claim, and this then is seen in terms of conclusiveness of result and otherwise. In contrast to the BNN platform described above, there is no option in ESL for including other calculation logic or other results than support/refute of the sub-claim or lower-level hypothesis. As such ESL is purely mapping expert opinion, for which the original sources are completely outside the ESL method.
25
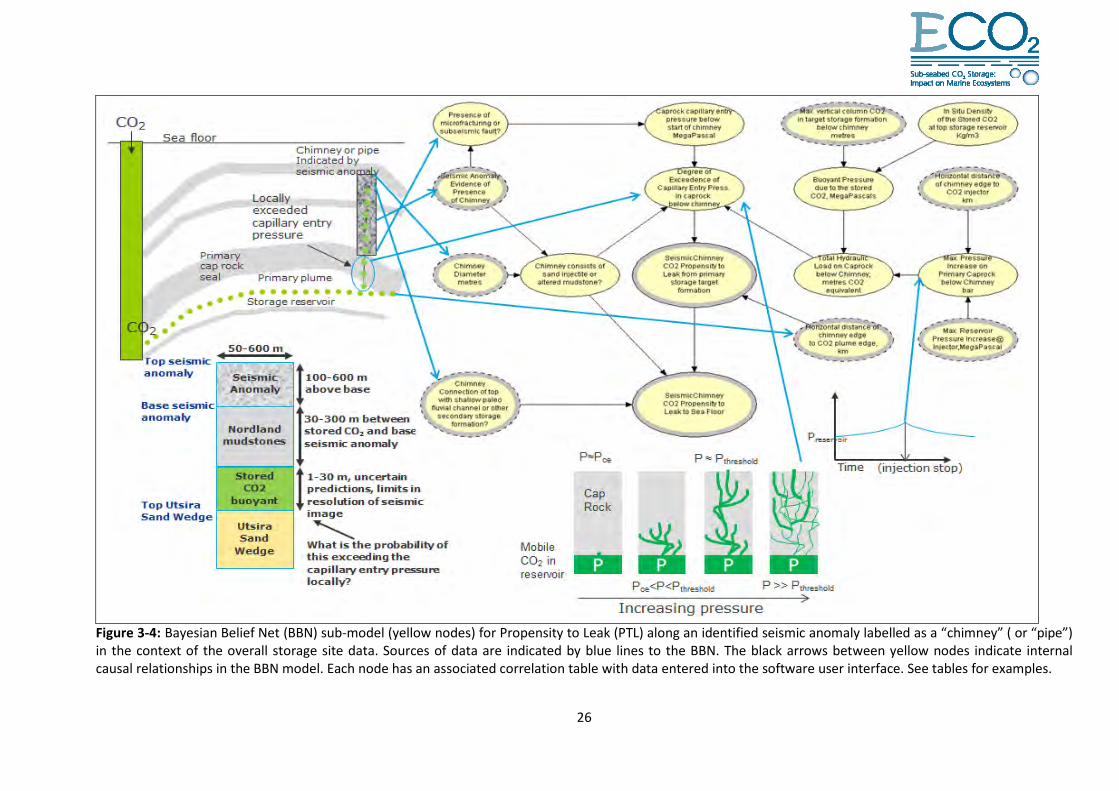
Figure 3-4: Bayesian Belief Net (BBN) sub-model (yellow nodes) for Propensity to Leak (PTL) along an identified seismic anomaly labelled as a “chimney” ( or “pipe”) in the context of the overall storage site data. Sources of data are indicated by blue lines to the BBN. The black arrows between yellow nodes indicate internal causal relationships in the BBN model. Each node has an associated correlation table with data entered into the software user interface. See tables for examples.
26
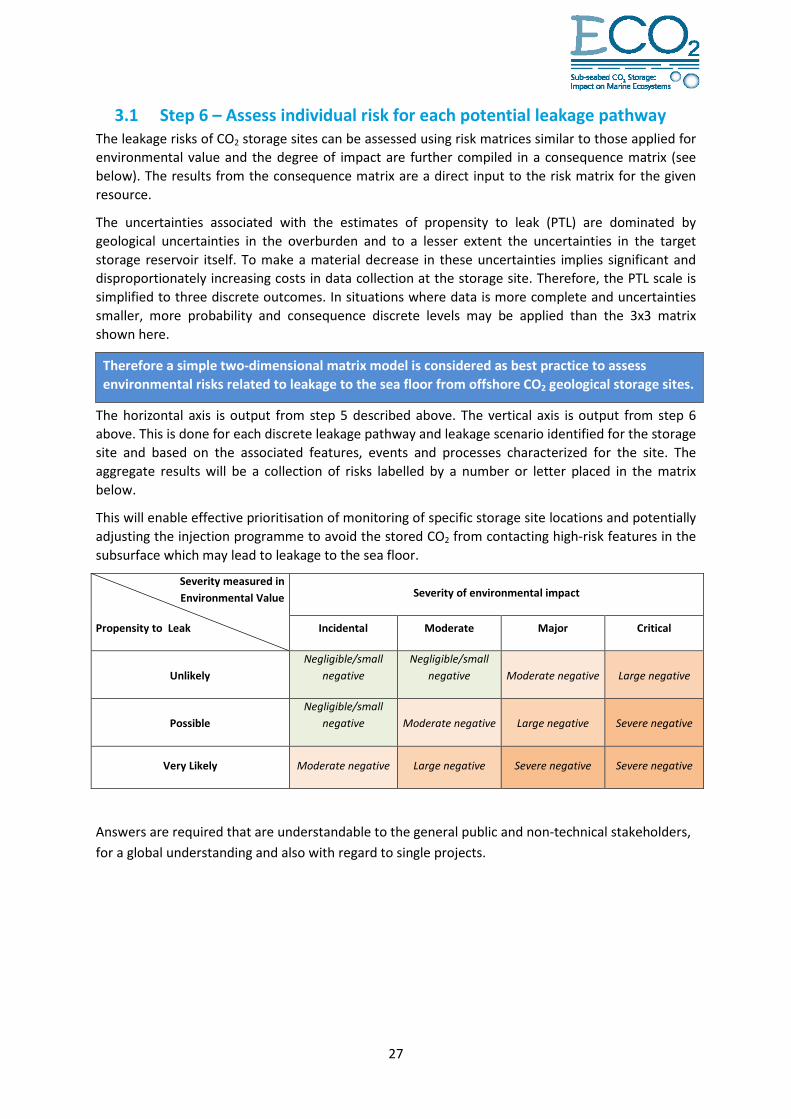
3.1 Step 6 – Assess individual risk for each potential leakage pathway The leakage risks of CO2 storage sites can be assessed using risk matrices similar to those applied for environmental value and the degree of impact are further compiled in a consequence matrix (see below). The results from the consequence matrix are a direct input to the risk matrix for the given resource.
The uncertainties associated with the estimates of propensity to leak (PTL) are dominated by geological uncertainties in the overburden and to a lesser extent the uncertainties in the target storage reservoir itself. To make a material decrease in these uncertainties implies significant and disproportionately increasing costs in data collection at the storage site. Therefore, the PTL scale is simplified to three discrete outcomes. In situations where data is more complete and uncertainties smaller, more probability and consequence discrete levels may be applied than the 3x3 matrix shown here.
Therefore a simple two-dimensional matrix model is considered as best practice to assess environmental risks related to leakage to the sea floor from offshore CO2 geological storage sites.
The horizontal axis is output from step 5 described above. The vertical axis is output from step 6 above. This is done for each discrete leakage pathway and leakage scenario identified for the storage site and based on the associated features, events and processes characterized for the site. The aggregate results will be a collection of risks labelled by a number or letter placed in the matrix below.
This will enable effective prioritisation of monitoring of specific storage site locations and potentially adjusting the injection programme to avoid the stored CO2 from contacting high-risk features in the subsurface which may lead to leakage to the sea floor.
Severity measured in Environmental Value
Propensity to Leak
Severity of environmental impact
Incidental Moderate Major Critical
Unlikely Negligible/small
negative Negligible/small
negative Moderate negative Large negative
Possible Negligible/small
negative Moderate negative Large negative Severe negative
Very Likely Moderate negative Large negative Severe negative Severe negative
Answers are required that are understandable to the general public and non-technical stakeholders, for a global understanding and also with regard to single projects.
27

4 CRITERIA FOR SITE SELECTION IN THE MARINE ENVIRONMENT Sub-seafloor CO2 storage complexes are usually selected based on information on its properties, such as storage capacity, trapping potential, existence of a primary seal, and achievable CO2 injection rate. The ECO2 project has demonstrated that it is equally important to characterize the architecture and integrity of the entire overburden, to assess the likelihood and risk for leakage, and to analyse its potential impact on the environment.
This chapter is intended to provide guidance on geological, oceanographic and biological criteria to be considered during the process of site selection in the marine realm.
While the selection of offshore storage sites may be more attractive because it reduces public scrutiny and opposition, applying the outlined criteria for site selection will also minimize the overall risk level for a particular storage site. The potential damage costs – whether tangible or intangible – will also be minimized according to the probabilistic cost-benefit analysis conducted in ECO2.
Recommendations for Site Selection
Operators should
1. Apply a risk assessment approach to site selection 2. Stay away from potential leakage structures when selecting potential storage sites. If this is
not possible, these structures need to be characterized in detail to assess their propensity to leak and should be prime targets for the monitoring program during storage operation.
3. Discard geological formations containing toxic compounds which have a high probability of being displaced by the stored CO2 to the seabed. These are leached from the rock and displaced with the formation water by the injected CO2 and may leak into the environment.
4. Acquire knowledge of the hydrographic setting above the storage complex in order to assess the dispersal of the CO2 plume, i.e. the footprint impacted by pH reduction. Selecting a storage site in a high-energy oceanographic environment, where water ventilation is strong, is superior to a low-energy hydrographic setting with sluggish currents and/or a more stratified water column, in which the impacted zone as well as the magnitude of impact will be significantly larger.
5. Employ bespoke numerical simulations for a range of plausible leakage scenarios to assist the risk assessment and planning of the monitoring strategy.
6. Avoid proximity of storage sites to valuable natural resources, for example, Natura 2000 areas, natural conservation habitats, reserves for wild fauna and flora.
7. Avoid areas, in which biota is already living at its tolerance limits because of existing exposure to additional environmental and/or other anthropogenic stressors. Such biota will be more vulnerable to impacts from leakage of CO2 and formation waters. If this is not possible, operators need to establish a detailed baseline study, assess the environmental impact from exposure to the multiple stressors and monitor the biota during storage operation.
28
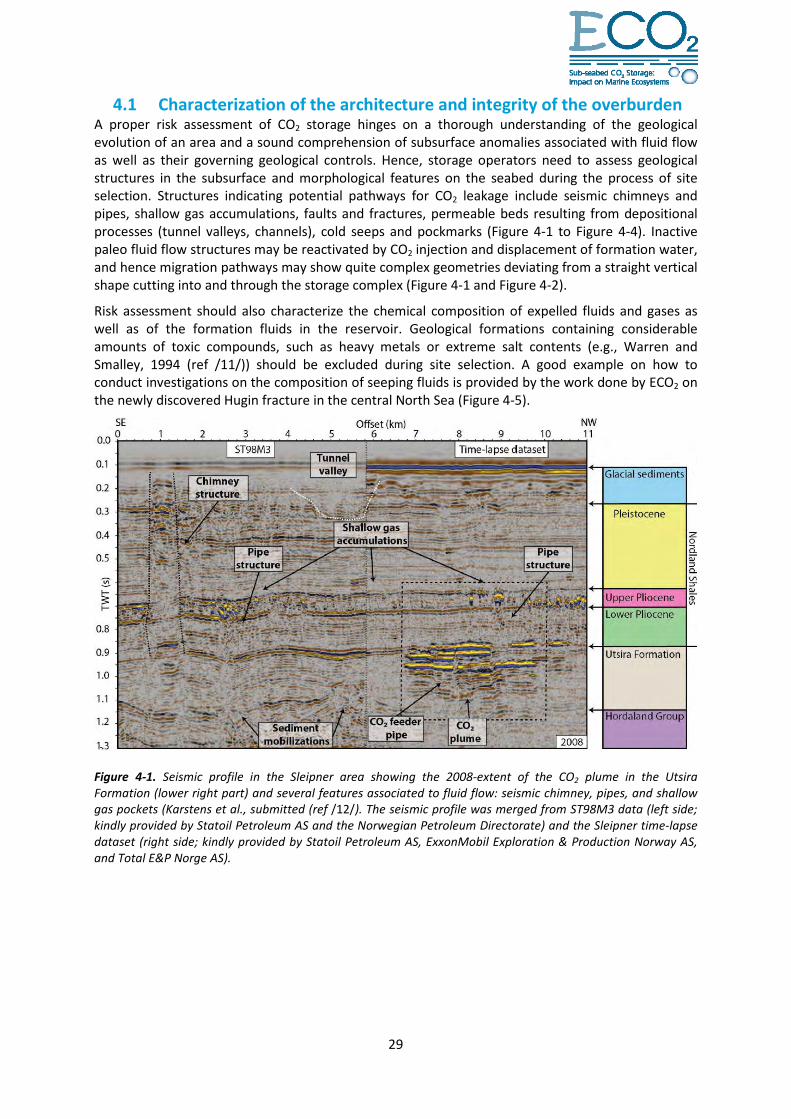
4.1 Characterization of the architecture and integrity of the overburden A proper risk assessment of CO2 storage hinges on a thorough understanding of the geological evolution of an area and a sound comprehension of subsurface anomalies associated with fluid flow as well as their governing geological controls. Hence, storage operators need to assess geological structures in the subsurface and morphological features on the seabed during the process of site selection. Structures indicating potential pathways for CO2 leakage include seismic chimneys and pipes, shallow gas accumulations, faults and fractures, permeable beds resulting from depositional processes (tunnel valleys, channels), cold seeps and pockmarks (Figure 4-1 to Figure 4-4). Inactive paleo fluid flow structures may be reactivated by CO2 injection and displacement of formation water, and hence migration pathways may show quite complex geometries deviating from a straight vertical shape cutting into and through the storage complex (Figure 4-1 and Figure 4-2).
Risk assessment should also characterize the chemical composition of expelled fluids and gases as well as of the formation fluids in the reservoir. Geological formations containing considerable amounts of toxic compounds, such as heavy metals or extreme salt contents (e.g., Warren and Smalley, 1994 (ref /11/)) should be excluded during site selection. A good example on how to conduct investigations on the composition of seeping fluids is provided by the work done by ECO2 on the newly discovered Hugin fracture in the central North Sea (Figure 4-5).
Figure 4-1. Seismic profile in the Sleipner area showing the 2008-extent of the CO2 plume in the Utsira Formation (lower right part) and several features associated to fluid flow: seismic chimney, pipes, and shallow gas pockets (Karstens et al., submitted (ref /12/). The seismic profile was merged from ST98M3 data (left side; kindly provided by Statoil Petroleum AS and the Norwegian Petroleum Directorate) and the Sleipner time-lapse dataset (right side; kindly provided by Statoil Petroleum AS, ExxonMobil Exploration & Production Norway AS, and Total E&P Norge AS).
29
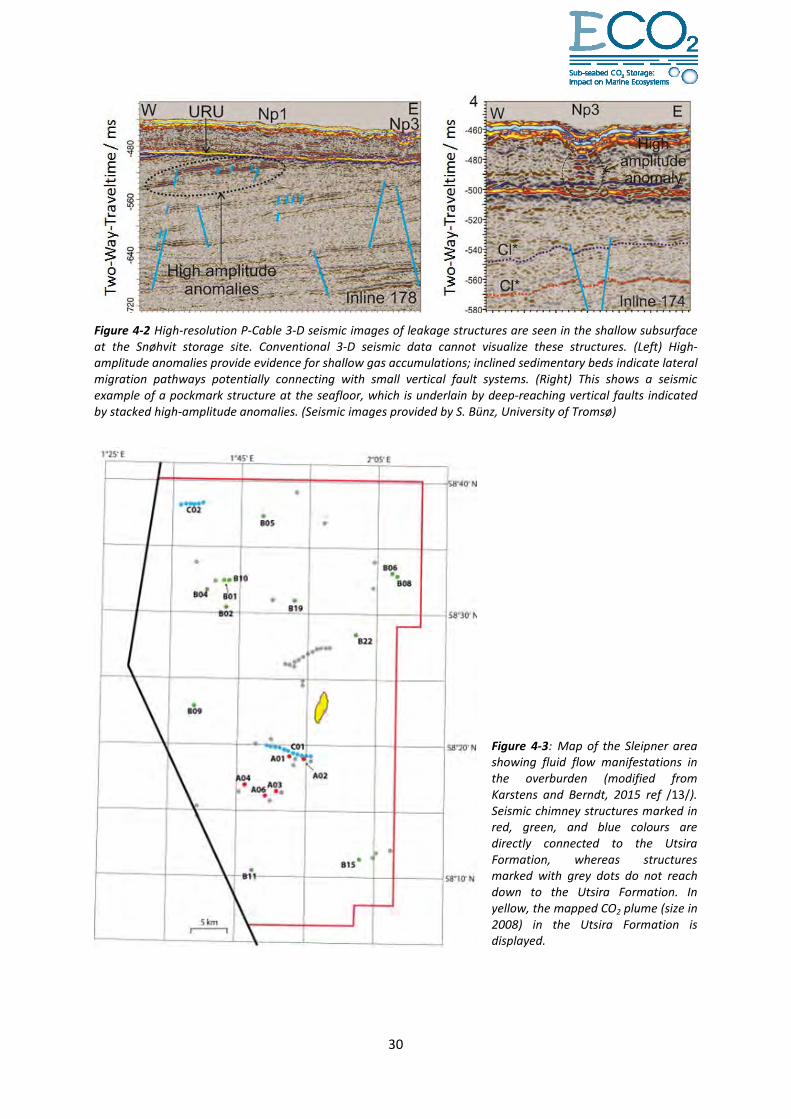
Figure 4-2 High-resolution P-Cable 3-D seismic images of leakage structures are seen in the shallow subsurface at the Snøhvit storage site. Conventional 3-D seismic data cannot visualize these structures. (Left) High-amplitude anomalies provide evidence for shallow gas accumulations; inclined sedimentary beds indicate lateral migration pathways potentially connecting with small vertical fault systems. (Right) This shows a seismic example of a pockmark structure at the seafloor, which is underlain by deep-reaching vertical faults indicated by stacked high-amplitude anomalies. (Seismic images provided by S. Bünz, University of Tromsø)
Figure 4-3: Map of the Sleipner area showing fluid flow manifestations in the overburden (modified from Karstens and Berndt, 2015 ref /13/). Seismic chimney structures marked in red, green, and blue colours are directly connected to the Utsira Formation, whereas structures marked with grey dots do not reach down to the Utsira Formation. In yellow, the mapped CO2 plume (size in 2008) in the Utsira Formation is displayed.
30
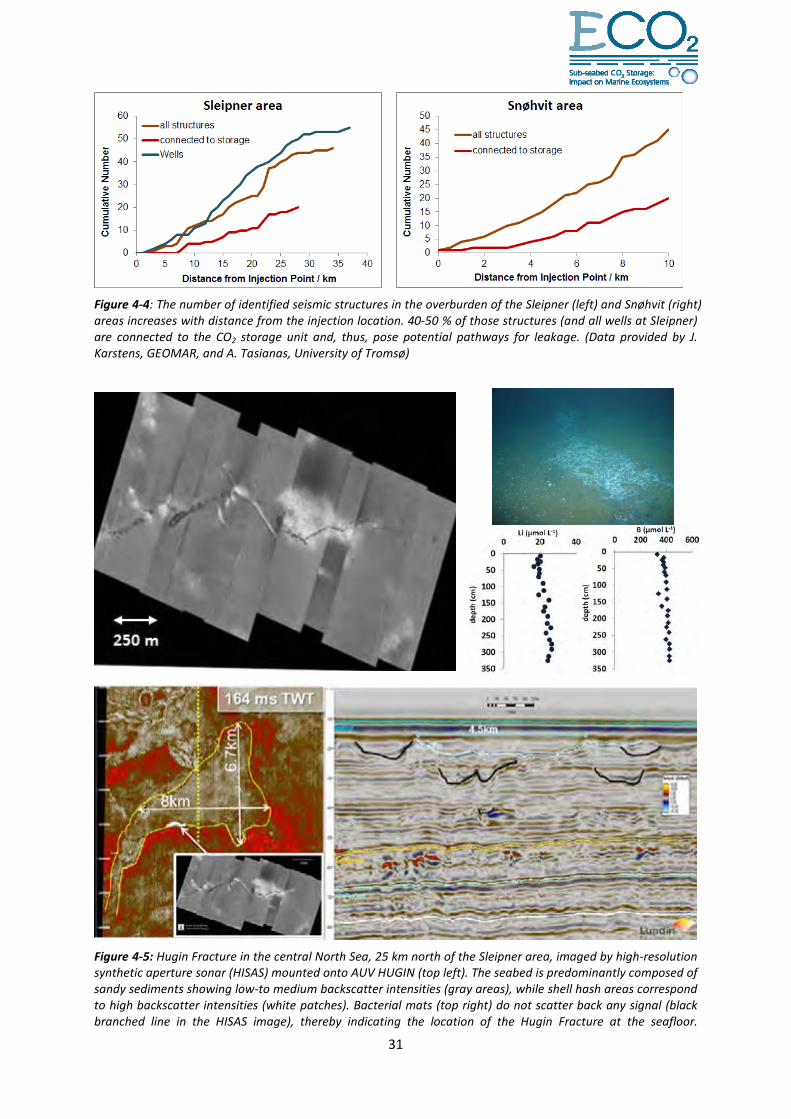
Figure 4-4: The number of identified seismic structures in the overburden of the Sleipner (left) and Snøhvit (right) areas increases with distance from the injection location. 40-50 % of those structures (and all wells at Sleipner) are connected to the CO2 storage unit and, thus, pose potential pathways for leakage. (Data provided by J. Karstens, GEOMAR, and A. Tasianas, University of Tromsø)
Figure 4-5: Hugin Fracture in the central North Sea, 25 km north of the Sleipner area, imaged by high-resolution synthetic aperture sonar (HISAS) mounted onto AUV HUGIN (top left). The seabed is predominantly composed of sandy sediments showing low-to medium backscatter intensities (gray areas), while shell hash areas correspond to high backscatter intensities (white patches). Bacterial mats (top right) do not scatter back any signal (black branched line in the HISAS image), thereby indicating the location of the Hugin Fracture at the seafloor.
31
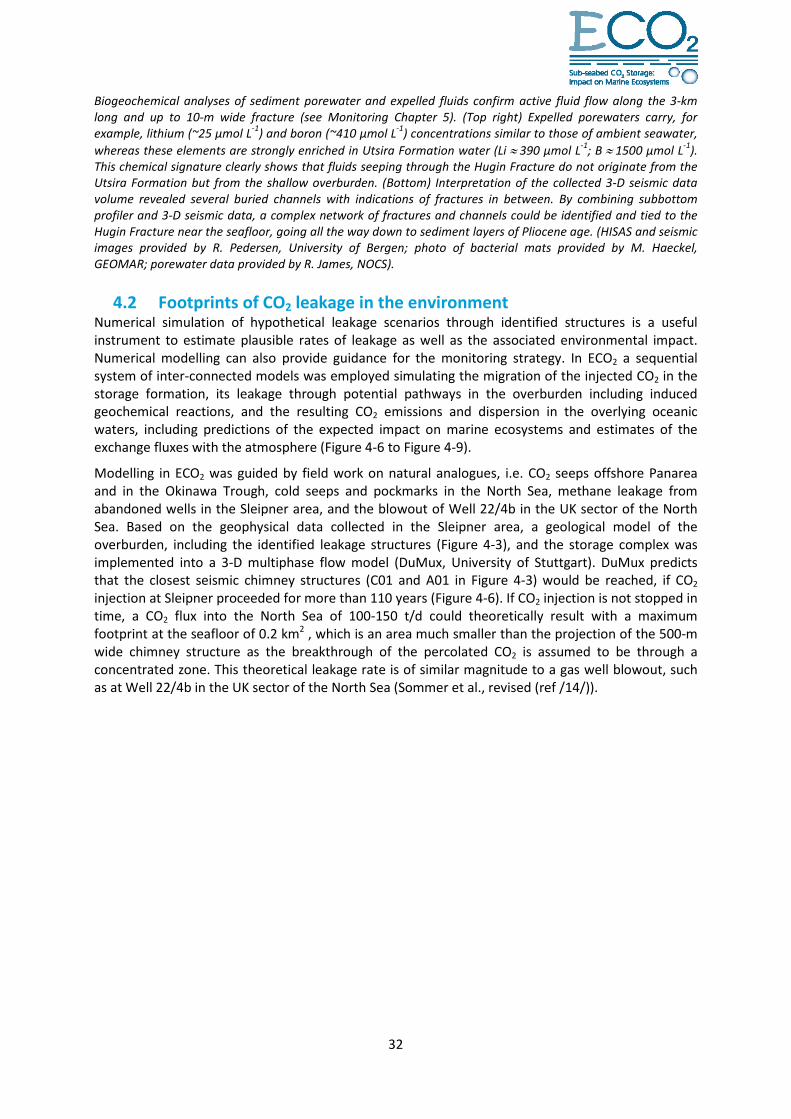
Biogeochemical analyses of sediment porewater and expelled fluids confirm active fluid flow along the 3-km long and up to 10-m wide fracture (see Monitoring Chapter 5). (Top right) Expelled porewaters carry, for example, lithium (~25 µmol L-1) and boron (~410 µmol L-1) concentrations similar to those of ambient seawater, whereas these elements are strongly enriched in Utsira Formation water (Li ≈ 390 µmol L-1; B ≈ 1500 µmol L-1). This chemical signature clearly shows that fluids seeping through the Hugin Fracture do not originate from the Utsira Formation but from the shallow overburden. (Bottom) Interpretation of the collected 3-D seismic data volume revealed several buried channels with indications of fractures in between. By combining subbottom profiler and 3-D seismic data, a complex network of fractures and channels could be identified and tied to the Hugin Fracture near the seafloor, going all the way down to sediment layers of Pliocene age. (HISAS and seismic images provided by R. Pedersen, University of Bergen; photo of bacterial mats provided by M. Haeckel, GEOMAR; porewater data provided by R. James, NOCS).
4.2 Footprints of CO2 leakage in the environment Numerical simulation of hypothetical leakage scenarios through identified structures is a useful instrument to estimate plausible rates of leakage as well as the associated environmental impact. Numerical modelling can also provide guidance for the monitoring strategy. In ECO2 a sequential system of inter-connected models was employed simulating the migration of the injected CO2 in the storage formation, its leakage through potential pathways in the overburden including induced geochemical reactions, and the resulting CO2 emissions and dispersion in the overlying oceanic waters, including predictions of the expected impact on marine ecosystems and estimates of the exchange fluxes with the atmosphere (Figure 4-6 to Figure 4-9).
Modelling in ECO2 was guided by field work on natural analogues, i.e. CO2 seeps offshore Panarea and in the Okinawa Trough, cold seeps and pockmarks in the North Sea, methane leakage from abandoned wells in the Sleipner area, and the blowout of Well 22/4b in the UK sector of the North Sea. Based on the geophysical data collected in the Sleipner area, a geological model of the overburden, including the identified leakage structures (Figure 4-3), and the storage complex was implemented into a 3-D multiphase flow model (DuMux, University of Stuttgart). DuMux predicts that the closest seismic chimney structures (C01 and A01 in Figure 4-3) would be reached, if CO2 injection at Sleipner proceeded for more than 110 years (Figure 4-6). If CO2 injection is not stopped in time, a CO2 flux into the North Sea of 100-150 t/d could theoretically result with a maximum footprint at the seafloor of 0.2 km2 , which is an area much smaller than the projection of the 500-m wide chimney structure as the breakthrough of the percolated CO2 is assumed to be through a concentrated zone. This theoretical leakage rate is of similar magnitude to a gas well blowout, such as at Well 22/4b in the UK sector of the North Sea (Sommer et al., revised (ref /14/)).
32
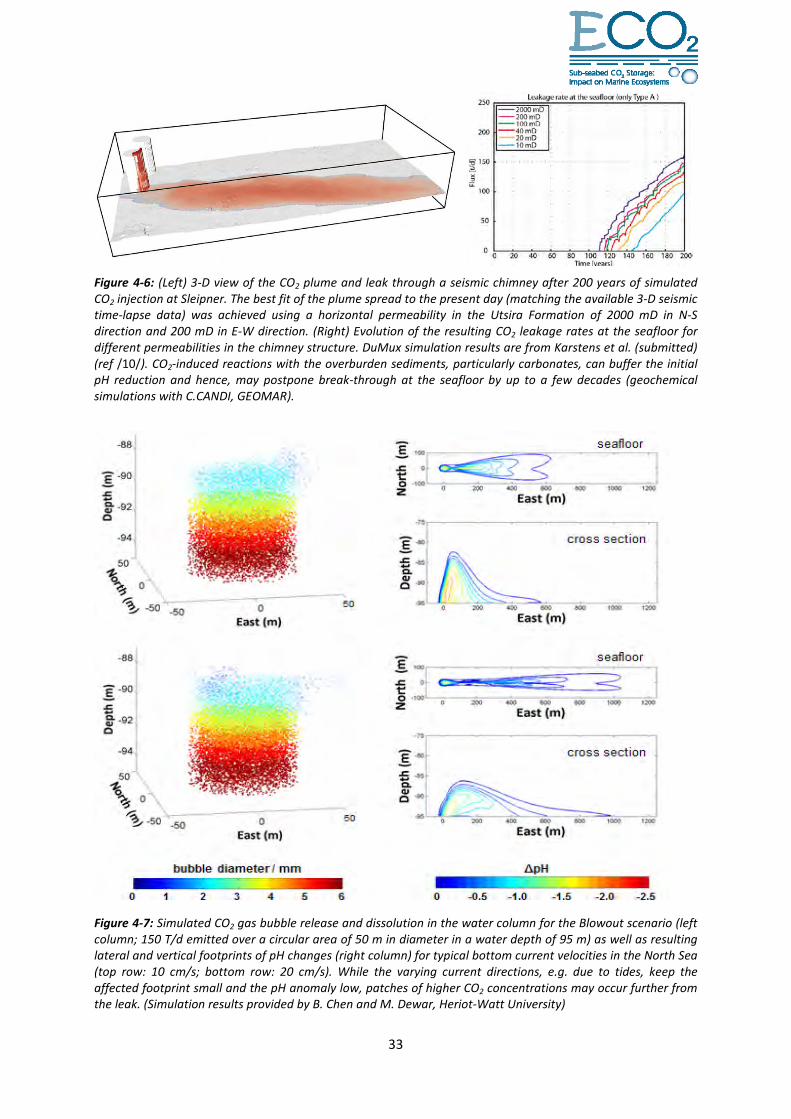
Figure 4-6: (Left) 3-D view of the CO2 plume and leak through a seismic chimney after 200 years of simulated CO2 injection at Sleipner. The best fit of the plume spread to the present day (matching the available 3-D seismic time-lapse data) was achieved using a horizontal permeability in the Utsira Formation of 2000 mD in N-S direction and 200 mD in E-W direction. (Right) Evolution of the resulting CO2 leakage rates at the seafloor for different permeabilities in the chimney structure. DuMux simulation results are from Karstens et al. (submitted) (ref /10/). CO2-induced reactions with the overburden sediments, particularly carbonates, can buffer the initial pH reduction and hence, may postpone break-through at the seafloor by up to a few decades (geochemical simulations with C.CANDI, GEOMAR).
Figure 4-7: Simulated CO2 gas bubble release and dissolution in the water column for the Blowout scenario (left column; 150 T/d emitted over a circular area of 50 m in diameter in a water depth of 95 m) as well as resulting lateral and vertical footprints of pH changes (right column) for typical bottom current velocities in the North Sea (top row: 10 cm/s; bottom row: 20 cm/s). While the varying current directions, e.g. due to tides, keep the affected footprint small and the pH anomaly low, patches of higher CO2 concentrations may occur further from the leak. (Simulation results provided by B. Chen and M. Dewar, Heriot-Watt University)
33
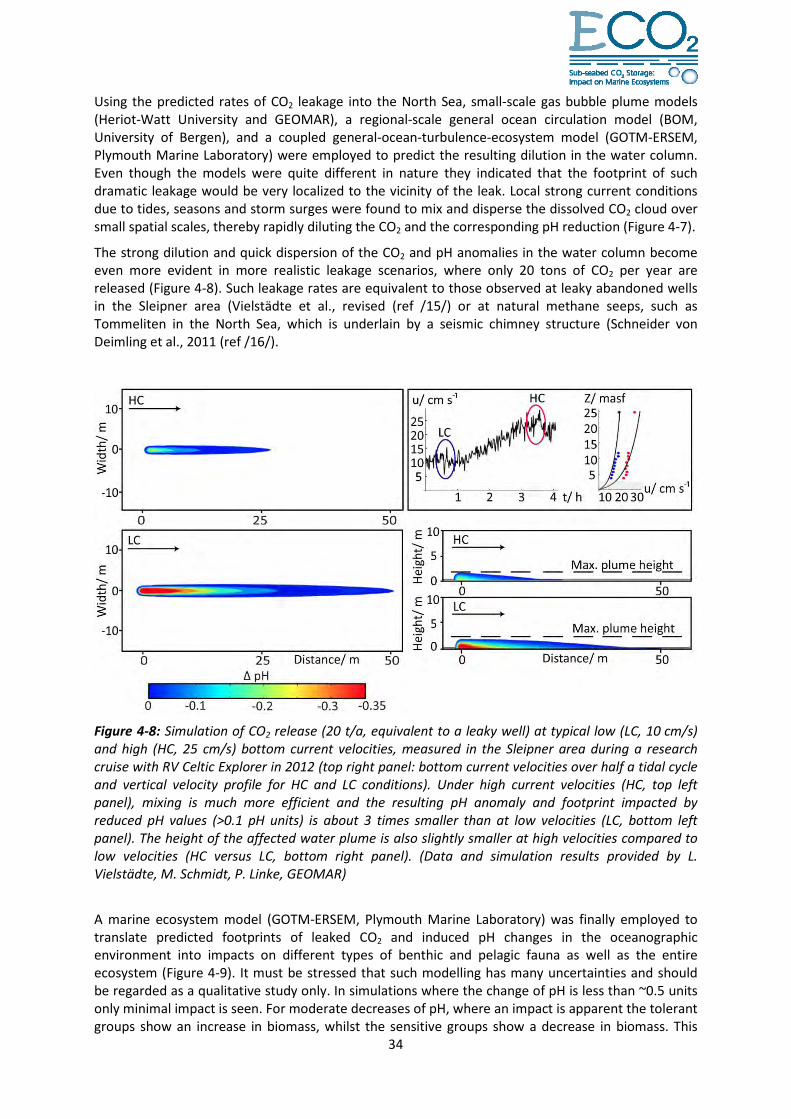
Using the predicted rates of CO2 leakage into the North Sea, small-scale gas bubble plume models (Heriot-Watt University and GEOMAR), a regional-scale general ocean circulation model (BOM, University of Bergen), and a coupled general-ocean-turbulence-ecosystem model (GOTM-ERSEM, Plymouth Marine Laboratory) were employed to predict the resulting dilution in the water column. Even though the models were quite different in nature they indicated that the footprint of such dramatic leakage would be very localized to the vicinity of the leak. Local strong current conditions due to tides, seasons and storm surges were found to mix and disperse the dissolved CO2 cloud over small spatial scales, thereby rapidly diluting the CO2 and the corresponding pH reduction (Figure 4-7).
The strong dilution and quick dispersion of the CO2 and pH anomalies in the water column become even more evident in more realistic leakage scenarios, where only 20 tons of CO2 per year are released (Figure 4-8). Such leakage rates are equivalent to those observed at leaky abandoned wells in the Sleipner area (Vielstädte et al., revised (ref /15/) or at natural methane seeps, such as Tommeliten in the North Sea, which is underlain by a seismic chimney structure (Schneider von Deimling et al., 2011 (ref /16/).
Figure 4-8: Simulation of CO2 release (20 t/a, equivalent to a leaky well) at typical low (LC, 10 cm/s) and high (HC, 25 cm/s) bottom current velocities, measured in the Sleipner area during a research cruise with RV Celtic Explorer in 2012 (top right panel: bottom current velocities over half a tidal cycle and vertical velocity profile for HC and LC conditions). Under high current velocities (HC, top left panel), mixing is much more efficient and the resulting pH anomaly and footprint impacted by reduced pH values (>0.1 pH units) is about 3 times smaller than at low velocities (LC, bottom left panel). The height of the affected water plume is also slightly smaller at high velocities compared to low velocities (HC versus LC, bottom right panel). (Data and simulation results provided by L. Vielstädte, M. Schmidt, P. Linke, GEOMAR)
A marine ecosystem model (GOTM-ERSEM, Plymouth Marine Laboratory) was finally employed to translate predicted footprints of leaked CO2 and induced pH changes in the oceanographic environment into impacts on different types of benthic and pelagic fauna as well as the entire ecosystem (Figure 4-9). It must be stressed that such modelling has many uncertainties and should be regarded as a qualitative study only. In simulations where the change of pH is less than ~0.5 units only minimal impact is seen. For moderate decreases of pH, where an impact is apparent the tolerant groups show an increase in biomass, whilst the sensitive groups show a decrease in biomass. This
34
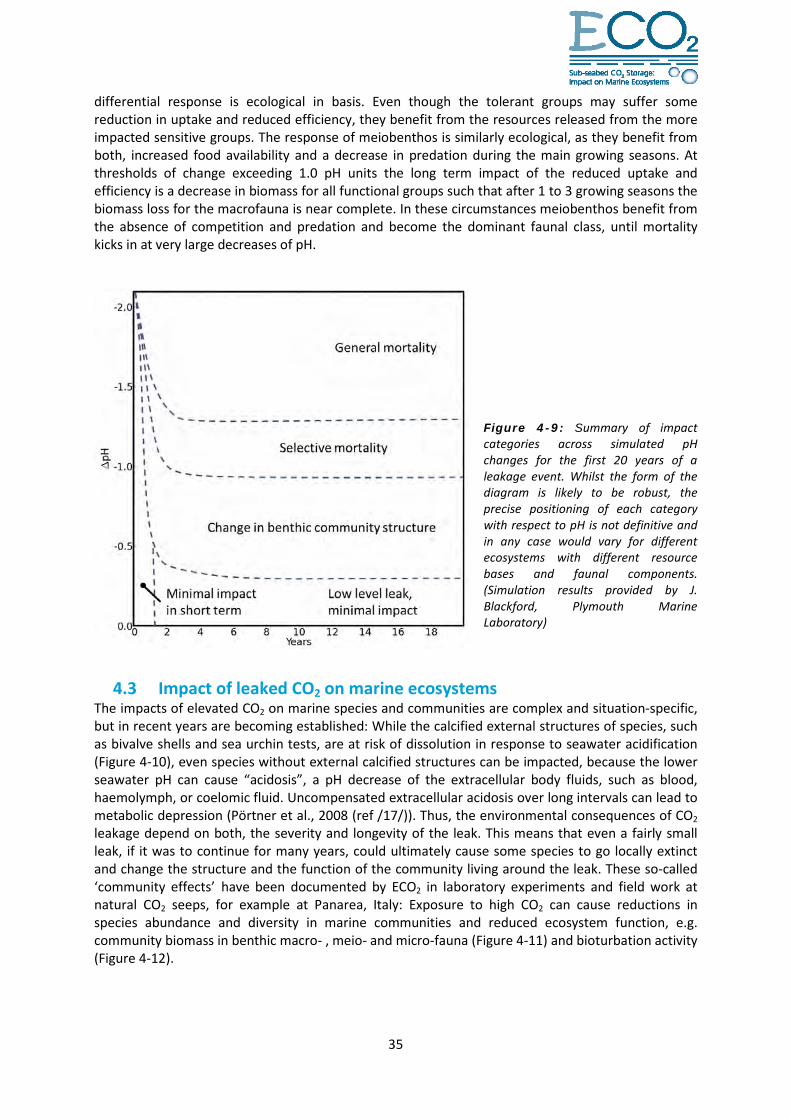
differential response is ecological in basis. Even though the tolerant groups may suffer some reduction in uptake and reduced efficiency, they benefit from the resources released from the more impacted sensitive groups. The response of meiobenthos is similarly ecological, as they benefit from both, increased food availability and a decrease in predation during the main growing seasons. At thresholds of change exceeding 1.0 pH units the long term impact of the reduced uptake and efficiency is a decrease in biomass for all functional groups such that after 1 to 3 growing seasons the biomass loss for the macrofauna is near complete. In these circumstances meiobenthos benefit from the absence of competition and predation and become the dominant faunal class, until mortality kicks in at very large decreases of pH.
Figure 4-9: Summary of impact categories across simulated pH changes for the first 20 years of a leakage event. Whilst the form of the diagram is likely to be robust, the precise positioning of each category with respect to pH is not definitive and in any case would vary for different ecosystems with different resource bases and faunal components. (Simulation results provided by J. Blackford, Plymouth Marine Laboratory)
4.3 Impact of leaked CO2 on marine ecosystems The impacts of elevated CO2 on marine species and communities are complex and situation-specific, but in recent years are becoming established: While the calcified external structures of species, such as bivalve shells and sea urchin tests, are at risk of dissolution in response to seawater acidification (Figure 4-10), even species without external calcified structures can be impacted, because the lower seawater pH can cause “acidosis”, a pH decrease of the extracellular body fluids, such as blood, haemolymph, or coelomic fluid. Uncompensated extracellular acidosis over long intervals can lead to metabolic depression (Pörtner et al., 2008 (ref /17/)). Thus, the environmental consequences of CO2 leakage depend on both, the severity and longevity of the leak. This means that even a fairly small leak, if it was to continue for many years, could ultimately cause some species to go locally extinct and change the structure and the function of the community living around the leak. These so-called ‘community effects’ have been documented by ECO2 in laboratory experiments and field work at natural CO2 seeps, for example at Panarea, Italy: Exposure to high CO2 can cause reductions in species abundance and diversity in marine communities and reduced ecosystem function, e.g. community biomass in benthic macro- , meio- and micro-fauna (Figure 4-11) and bioturbation activity (Figure 4-12).
35
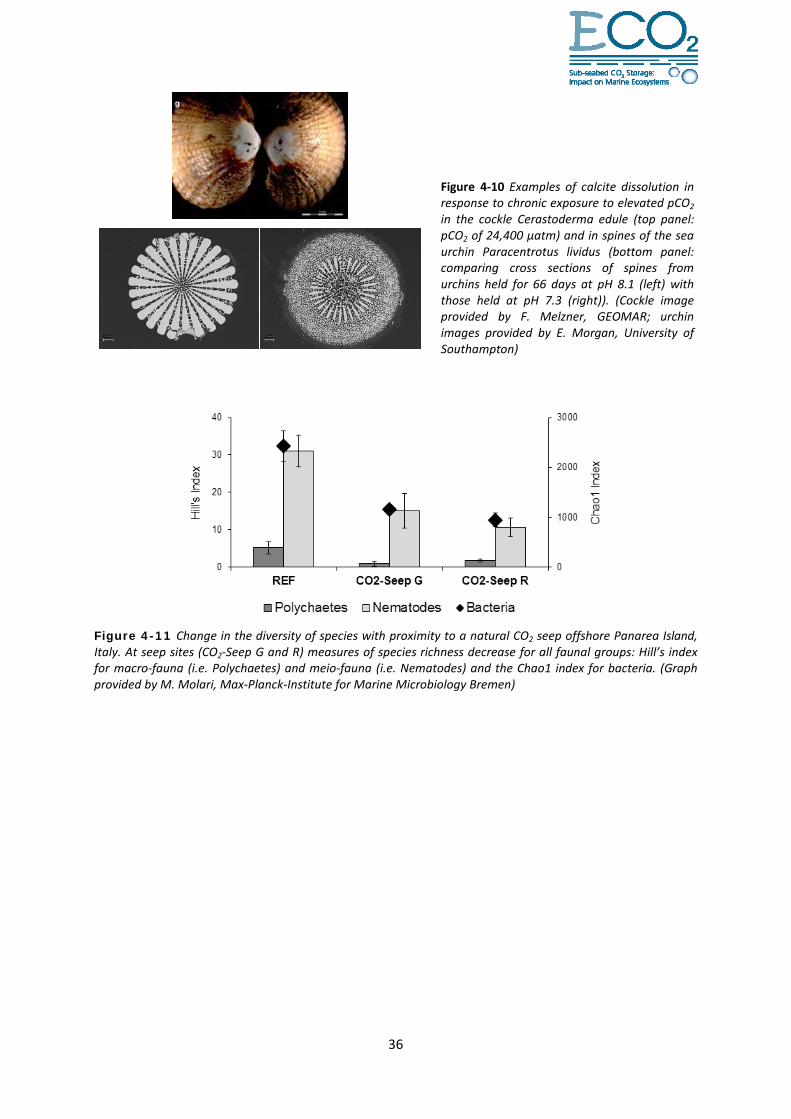
Figure 4-10 Examples of calcite dissolution in response to chronic exposure to elevated pCO2 in the cockle Cerastoderma edule (top panel: pCO2 of 24,400 µatm) and in spines of the sea urchin Paracentrotus lividus (bottom panel: comparing cross sections of spines from urchins held for 66 days at pH 8.1 (left) with those held at pH 7.3 (right)). (Cockle image provided by F. Melzner, GEOMAR; urchin images provided by E. Morgan, University of Southampton)
Figure 4-11 Change in the diversity of species with proximity to a natural CO2 seep offshore Panarea Island, Italy. At seep sites (CO2-Seep G and R) measures of species richness decrease for all faunal groups: Hill’s index for macro-fauna (i.e. Polychaetes) and meio-fauna (i.e. Nematodes) and the Chao1 index for bacteria. (Graph provided by M. Molari, Max-Planck-Institute for Marine Microbiology Bremen)
36
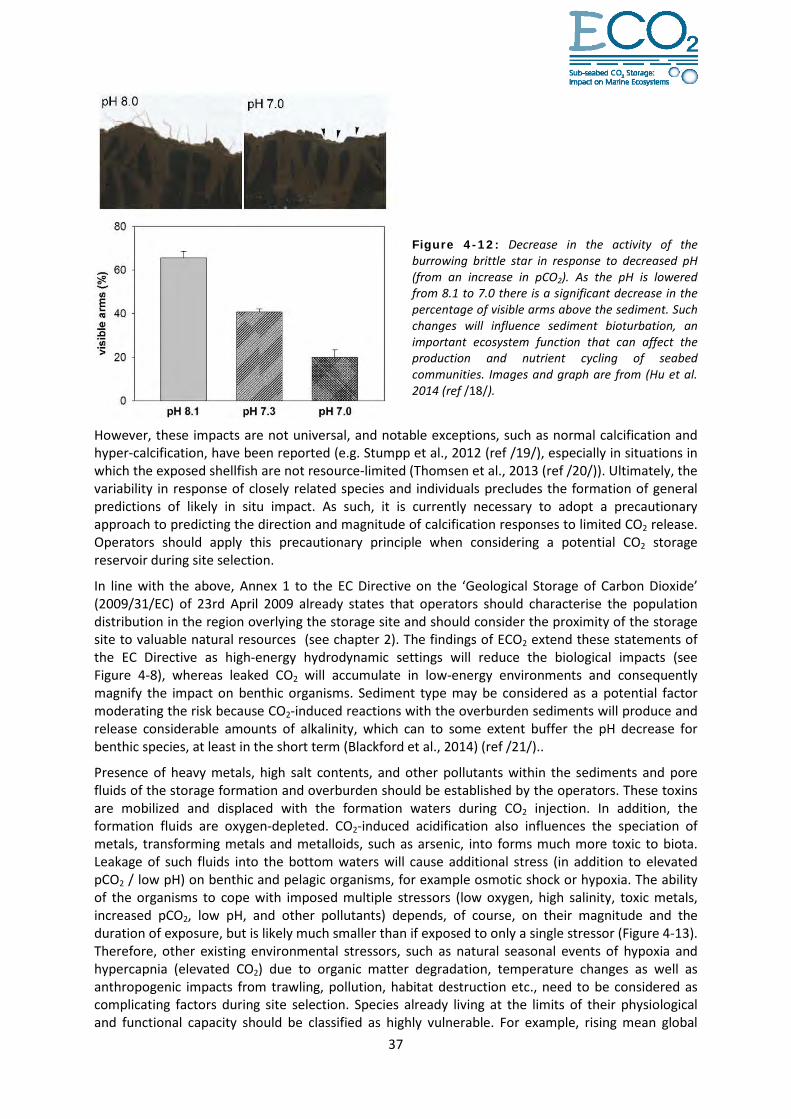
Figure 4-12: Decrease in the activity of the burrowing brittle star in response to decreased pH (from an increase in pCO2). As the pH is lowered from 8.1 to 7.0 there is a significant decrease in the percentage of visible arms above the sediment. Such changes will influence sediment bioturbation, an important ecosystem function that can affect the production and nutrient cycling of seabed communities. Images and graph are from (Hu et al. 2014 (ref /18/).
However, these impacts are not universal, and notable exceptions, such as normal calcification and hyper-calcification, have been reported (e.g. Stumpp et al., 2012 (ref /19/), especially in situations in which the exposed shellfish are not resource-limited (Thomsen et al., 2013 (ref /20/)). Ultimately, the variability in response of closely related species and individuals precludes the formation of general predictions of likely in situ impact. As such, it is currently necessary to adopt a precautionary approach to predicting the direction and magnitude of calcification responses to limited CO2 release. Operators should apply this precautionary principle when considering a potential CO2 storage reservoir during site selection.
In line with the above, Annex 1 to the EC Directive on the ‘Geological Storage of Carbon Dioxide’ (2009/31/EC) of 23rd April 2009 already states that operators should characterise the population distribution in the region overlying the storage site and should consider the proximity of the storage site to valuable natural resources (see chapter 2). The findings of ECO2 extend these statements of the EC Directive as high-energy hydrodynamic settings will reduce the biological impacts (see Figure 4-8), whereas leaked CO2 will accumulate in low-energy environments and consequently magnify the impact on benthic organisms. Sediment type may be considered as a potential factor moderating the risk because CO2-induced reactions with the overburden sediments will produce and release considerable amounts of alkalinity, which can to some extent buffer the pH decrease for benthic species, at least in the short term (Blackford et al., 2014) (ref /21/)..
Presence of heavy metals, high salt contents, and other pollutants within the sediments and pore fluids of the storage formation and overburden should be established by the operators. These toxins are mobilized and displaced with the formation waters during CO2 injection. In addition, the formation fluids are oxygen-depleted. CO2-induced acidification also influences the speciation of metals, transforming metals and metalloids, such as arsenic, into forms much more toxic to biota. Leakage of such fluids into the bottom waters will cause additional stress (in addition to elevated pCO2 / low pH) on benthic and pelagic organisms, for example osmotic shock or hypoxia. The ability of the organisms to cope with imposed multiple stressors (low oxygen, high salinity, toxic metals, increased pCO2, low pH, and other pollutants) depends, of course, on their magnitude and the duration of exposure, but is likely much smaller than if exposed to only a single stressor (Figure 4-13). Therefore, other existing environmental stressors, such as natural seasonal events of hypoxia and hypercapnia (elevated CO2) due to organic matter degradation, temperature changes as well as anthropogenic impacts from trawling, pollution, habitat destruction etc., need to be considered as complicating factors during site selection. Species already living at the limits of their physiological and functional capacity should be classified as highly vulnerable. For example, rising mean global
37
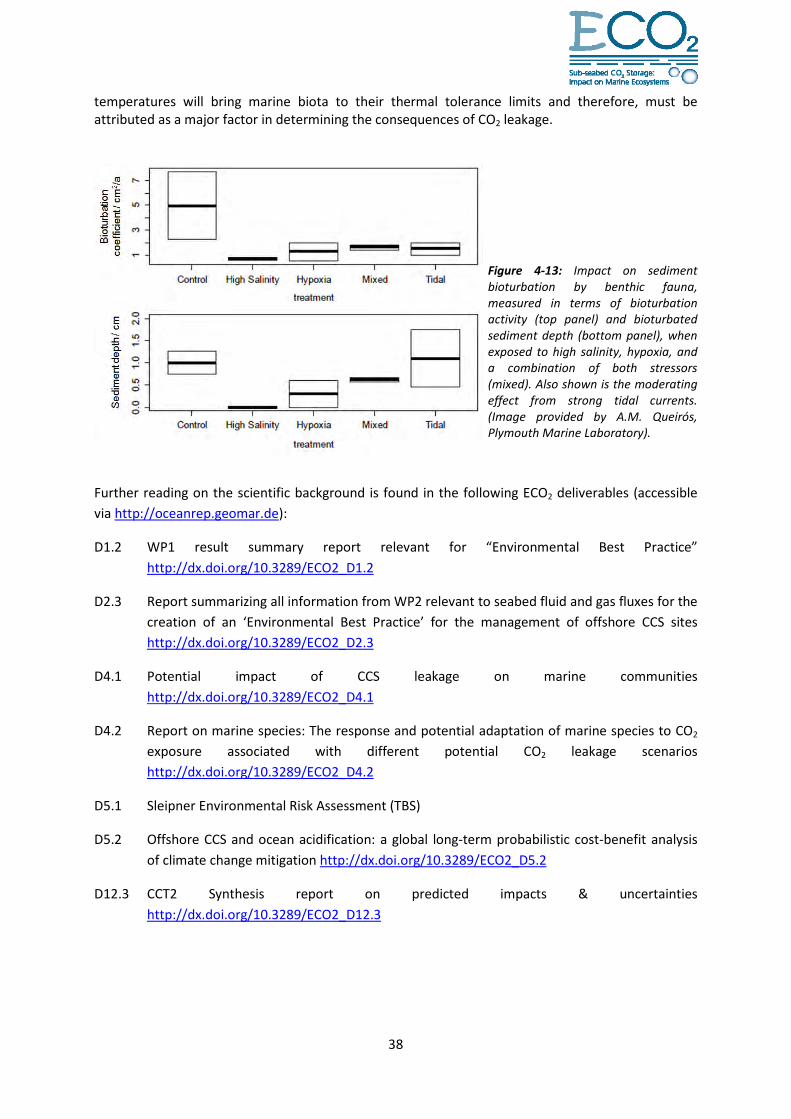
temperatures will bring marine biota to their thermal tolerance limits and therefore, must be attributed as a major factor in determining the consequences of CO2 leakage.
Figure 4-13: Impact on sediment bioturbation by benthic fauna, measured in terms of bioturbation activity (top panel) and bioturbated sediment depth (bottom panel), when exposed to high salinity, hypoxia, and a combination of both stressors (mixed). Also shown is the moderating effect from strong tidal currents. (Image provided by A.M. Queirós, Plymouth Marine Laboratory).
Further reading on the scientific background is found in the following ECO2 deliverables (accessible via http://oceanrep.geomar.de):
D1.2 WP1 result summary report relevant for “Environmental Best Practice” http://dx.doi.org/10.3289/ECO2_D1.2
D2.3 Report summarizing all information from WP2 relevant to seabed fluid and gas fluxes for the creation of an ‘Environmental Best Practice’ for the management of offshore CCS sites http://dx.doi.org/10.3289/ECO2_D2.3
D4.1 Potential impact of CCS leakage on marine communities http://dx.doi.org/10.3289/ECO2_D4.1
D4.2 Report on marine species: The response and potential adaptation of marine species to CO2 exposure associated with different potential CO2 leakage scenarios http://dx.doi.org/10.3289/ECO2_D4.2
D5.1 Sleipner Environmental Risk Assessment (TBS)
D5.2 Offshore CCS and ocean acidification: a global long-term probabilistic cost-benefit analysis of climate change mitigation http://dx.doi.org/10.3289/ECO2_D5.2
D12.3 CCT2 Synthesis report on predicted impacts & uncertainties http://dx.doi.org/10.3289/ECO2_D12.3
38
5 RECOMMENDATIONS FOR ENVIRONMENTAL MONITORING AND BASELINE STUDIES AT SUB-SEABED CO2 STORAGE SITES
ECO2 conducted a comprehensive field programme at two operating CO2 geological storage sites and at several natural CO2 seeps in order to identify potential pathways for CO2 leakage, locate and quantify seeps at the seabed, track and trace the spread of CO2 in ambient bottom waters, and study the response of benthic biota to CO2. The following recommendations are based on these field studies and the related lab and modelling work. They concern the shallow part of the storage complex, i.e. seals, sedimentary overburden, seabed, bottom waters covering the seabed, and benthic biota settling at the seabed. We aim to define how operators should characterize this system in a baseline study prior to the operational phase and how monitoring should be performed during the operation. We recommend that the same techniques and approaches should be applied in both phases since baseline studies serve to characterize the natural variability against which monitoring data are evaluated to detect anomalies related to the storage operation. In the following section, we suppose that storage formations are characterized in detail during site selection and that numerical modelling is performed to forecast the spread of CO2 in the reservoir and describe the future shape and maximum size of the subsurface CO2 plume after site closure. The extent of the seabed area and the size of the sub-seafloor volume that need to be characterized and monitored will be delineated by these modelling studies.
5.1 Monitoring CO2 leakage can occur only if fractures, seismic pipes and chimneys, or abandoned wells cutting through seals and overburden have higher permeability than the background sealing formations. Upward migration of CO2 via large-scale vertical structures can be imaged by seismic data while leakage through wells and other narrow structures is not detectable by geophysical surveys. Additional measurements need to be conducted at the seabed to detect CO2 release through these small-scale features. Early precursor signs of potential CO2 leakage at the seabed are the release of formation waters and natural gas filling the sub-surface plumbing system which are pushed towards the surface by rising, buoyant CO2. Depending on water depth and bottom water temperature, CO2 will be subsequently emitted either as gas bubble or as liquid droplet. CO2 also dissolves during its passage through water-filled high-permeability conduits and may be emitted in dissolved form together with expelled formation fluids. Monitoring at the seabed should thus be able to detect seeping formation water, natural gas, dissolved CO2, CO2 gas bubbles and, at water depth larger than ca. 300 m, liquid CO2 droplets. Special care has to be taken to monitor active and dormant natural seepage sites identified during site selection and baseline surveys since fluids and gases migrating through the overburden will tend to use their roots as conduits and leave the seabed through these already existing outlets.
39

Recommendations for Monitoring
Monitoring activities can be separated in surveys covering the entire storage complex and targeted studies focused on seeps, abandoned wells, and other specific sites at the seabed. The following surveys should be conducted repeatedly over the life time of a storage site:
• 3-D seismic surveys to detect/exclude CO2 ascent via large-sale features cutting through seals and overburden (fractures, seismic chimneys and pipes). Operators will conduct and repeat 3-D seismic surveys to image the spread of CO2 in the storage formation. It is, however, important to record and evaluate data not only from the storage reservoir but also from the overlying sequences to detect/exclude changes in seismic signatures indicating upward migration of CO2, natural gas, and formation fluids through seals and overburden.
• Bathymetry/backscatter surveys to identify and locate formation water seeps at the seabed. Formation water seepage creates seabed structures with distinct morphologies and specific acoustic backscatter properties. A good example is the Hugin Fracture which was discovered in the Central North Sea applying high-resolution backscatter imaging (Figure 5-1).
• Hydro-acoustic surveys of shallow subsurface and water column to detect and locate subsurface shallow gas accumulations and gas bubble seeps at the seabed. These surveys serve to detect any signs of invigorated gas seepage activity. Sub-bottom profiler and multi-beam echo-sounder systems providing suitable spatial coverage and resolution are commercially available. They can visualize shallow gas accumulations and gas bubbles ascending through the water(Figure 5-2)
• Video/photo surveys to observe biological indicators for formation water and gas seepage. Mats of sulphide-oxidizing bacteria are often found at seep sites where methane-bearing formation waters and gas bubbles emanate from the seabed. These bacterial mats are easily identified on videos and still photos and are useful indicators for seepage (Fig. 5-3). CO2 leaking from the storage formation affects animals living in the sediment (benthic infauna). They try to escape from the sediment and accumulate at the seabed. Conspicuous clusters of infauna and their remains at the seabed may thus indicate CO2 leakage (Figure 5-4).
• Chemical surveys to measure CO2 concentrations and related parameters in bottom waters above the storage complex. Dissolved CO2 can be detected in situ with suitable chemical sensors and in water samples retrieved from the seabed. CO2 leakage affects the chemical composition of seawater and creates strong chemical anomalies in bottom waters located just a few metres above the seabed (Figure 5-5). Additional chemical substances such as dissolved oxygen and nutrients should be included in the monitoring program to better discriminate between natural background CO2 and CO2 leaking from the storage formation. The release of reducing formation fluids can be detected by sensors measuring the redox potential (Eh) of ambient bottom waters (Figure 5-6).
• Surveys can be conducted using autonomous underwater vehicles (AUVs) and/or monitoring vessels. Commercially available AUVs can be equipped with suitable instruments (echo sounders, hydrophones, chemical sensors, still camera, etc.) to conduct multiple surveys with full areal coverage at affordable costs (Figure 5-7).
• Each of the surveys should, however, be conducted at a specific height above the seabed to achieve optimal results.
40
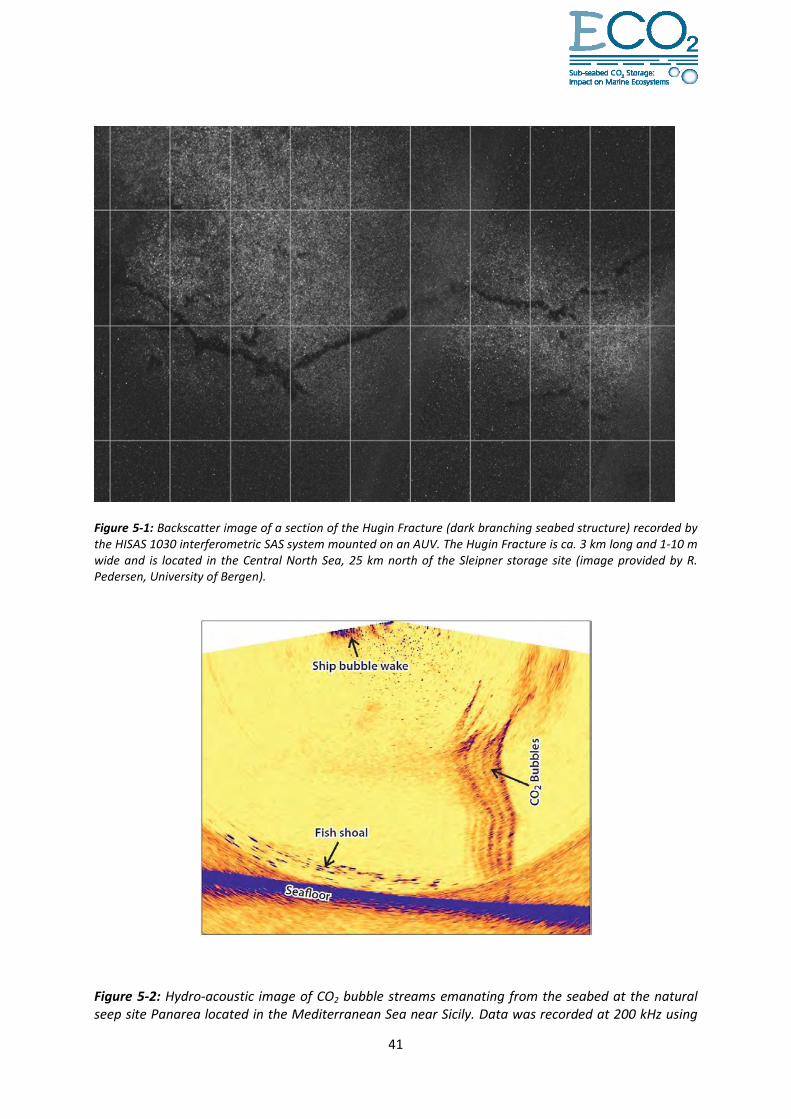
Figure 5-1: Backscatter image of a section of the Hugin Fracture (dark branching seabed structure) recorded by the HISAS 1030 interferometric SAS system mounted on an AUV. The Hugin Fracture is ca. 3 km long and 1-10 m wide and is located in the Central North Sea, 25 km north of the Sleipner storage site (image provided by R. Pedersen, University of Bergen).
Figure 5-2: Hydro-acoustic image of CO2 bubble streams emanating from the seabed at the natural seep site Panarea located in the Mediterranean Sea near Sicily. Data was recorded at 200 kHz using
41

an R2Sonic 2024 installed on RV Urania in 2011 (Schneider von Deimling and Weinrebe, 2014 (ref /23/))
Figure 5-3: White bacterial mats (arrow) at the seabed in the vicinity of an abandoned well in the North Sea. Images recorded using UK HYBIS ROV deployed from UK NERC RRS James Cook in 2012 (image provided by C. Hauton, University of Southampton).
Figure 5-4: Behaviour of the common cockle Cerastoderma edule in response to elevated pCO2. (a) Average abundance (as a percentage of the total) of non-buried cockles in six different treatments over the 80-days experiment. At a concentration of 24,400 µatm over 80% of the cockles were found on the surface of the sediment after 80 days of exposure. (b) Image of the control experimental unit: sediment surface with cockle siphons opened and visible, but no cockles on the sediment surface. (c) At 24,400 µatm cockles have accumulated on the sediment surface at the end of the experiment (data and images provided by F. Melzner, GEOMAR).
42

Figure 5-5: CO2 plume above the seabed at Panarea (size: 300 x 400 m). Greenish colours indicate dissolved pCO2 values in the range of 500 – 650 µatm clearly exceeding the local background value of ca. 390 µatm (blue colour), resulting in pH values of 0.1-0.35 units below the ambient pH of 8.15. The data were recorded with a chemical sensor (HydroC, CONTROS) which was towed above the seabed with RV Poseidon in May 2014 (Schmidt et al. 2015 ref /22/).
Figure 5-6: Chemical sensors deployed on NERC AUV Autosub 6000 successfully detected seepage of reduced (low Eh) fluids from the region of the Hugin Fracture. The figure on the right shows a backscatter image of the seafloor, with the position of the Hugin Fracture shown in red. The AUV was flown at a height of 12 m above the seafloor, from the upper red circle to the lower red circle, and data recorded by the Eh sensor are shown on the left. Arrows indicate negative excursions in Eh, as the AUV encountered reduced (low oxygen) fluids. The location of the fracture is shown by the middle arrow (data and images provided by R. James, NOCS).
43
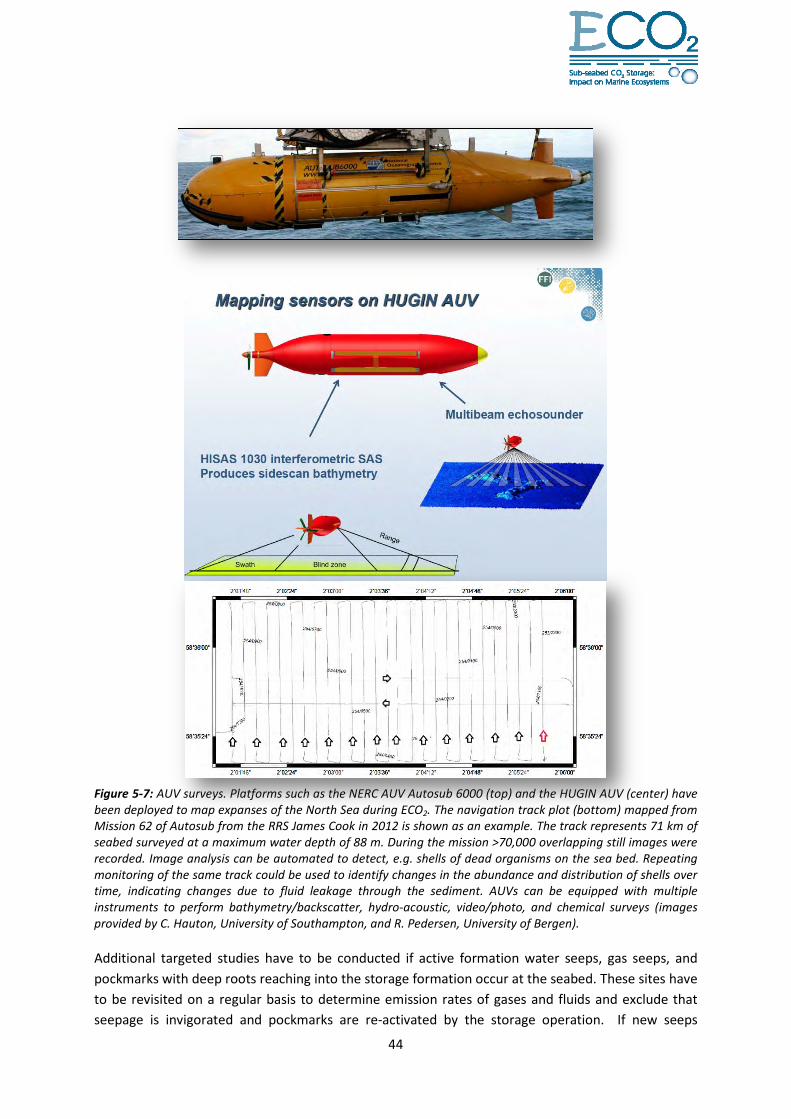
Figure 5-7: AUV surveys. Platforms such as the NERC AUV Autosub 6000 (top) and the HUGIN AUV (center) have been deployed to map expanses of the North Sea during ECO2. The navigation track plot (bottom) mapped from Mission 62 of Autosub from the RRS James Cook in 2012 is shown as an example. The track represents 71 km of seabed surveyed at a maximum water depth of 88 m. During the mission >70,000 overlapping still images were recorded. Image analysis can be automated to detect, e.g. shells of dead organisms on the sea bed. Repeating monitoring of the same track could be used to identify changes in the abundance and distribution of shells over time, indicating changes due to fluid leakage through the sediment. AUVs can be equipped with multiple instruments to perform bathymetry/backscatter, hydro-acoustic, video/photo, and chemical surveys (images provided by C. Hauton, University of Southampton, and R. Pedersen, University of Bergen). Additional targeted studies have to be conducted if active formation water seeps, gas seeps, and pockmarks with deep roots reaching into the storage formation occur at the seabed. These sites have to be revisited on a regular basis to determine emission rates of gases and fluids and exclude that seepage is invigorated and pockmarks are re-activated by the storage operation. If new seeps
44
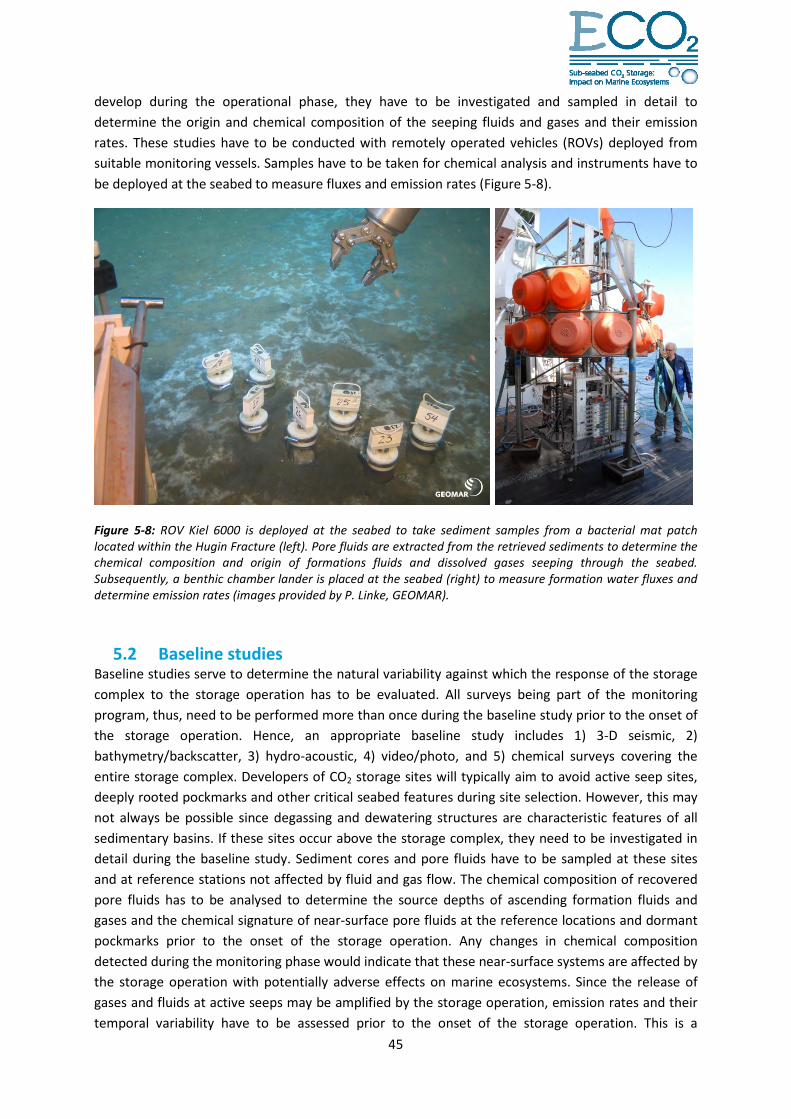
develop during the operational phase, they have to be investigated and sampled in detail to determine the origin and chemical composition of the seeping fluids and gases and their emission rates. These studies have to be conducted with remotely operated vehicles (ROVs) deployed from suitable monitoring vessels. Samples have to be taken for chemical analysis and instruments have to be deployed at the seabed to measure fluxes and emission rates (Figure 5-8).
Figure 5-8: ROV Kiel 6000 is deployed at the seabed to take sediment samples from a bacterial mat patch located within the Hugin Fracture (left). Pore fluids are extracted from the retrieved sediments to determine the chemical composition and origin of formations fluids and dissolved gases seeping through the seabed. Subsequently, a benthic chamber lander is placed at the seabed (right) to measure formation water fluxes and determine emission rates (images provided by P. Linke, GEOMAR).
5.2 Baseline studies Baseline studies serve to determine the natural variability against which the response of the storage complex to the storage operation has to be evaluated. All surveys being part of the monitoring program, thus, need to be performed more than once during the baseline study prior to the onset of the storage operation. Hence, an appropriate baseline study includes 1) 3-D seismic, 2) bathymetry/backscatter, 3) hydro-acoustic, 4) video/photo, and 5) chemical surveys covering the entire storage complex. Developers of CO2 storage sites will typically aim to avoid active seep sites, deeply rooted pockmarks and other critical seabed features during site selection. However, this may not always be possible since degassing and dewatering structures are characteristic features of all sedimentary basins. If these sites occur above the storage complex, they need to be investigated in detail during the baseline study. Sediment cores and pore fluids have to be sampled at these sites and at reference stations not affected by fluid and gas flow. The chemical composition of recovered pore fluids has to be analysed to determine the source depths of ascending formation fluids and gases and the chemical signature of near-surface pore fluids at the reference locations and dormant pockmarks prior to the onset of the storage operation. Any changes in chemical composition detected during the monitoring phase would indicate that these near-surface systems are affected by the storage operation with potentially adverse effects on marine ecosystems. Since the release of gases and fluids at active seeps may be amplified by the storage operation, emission rates and their temporal variability have to be assessed prior to the onset of the storage operation. This is a
45
considerable challenge since gas and water fluxes at cold seeps and abandoned wells feature strong temporal variability over a wide range of time scales (hours to years). Continuous time series data recorded over a period of at least one year are thus needed to capture the variability of these systems. Stationary lander systems have been applied successfully by academia to record time series data at cold seep sites (e.g. gas flux quantification based on hydro-acoustic bubble detection, fluid flow meters based on osmosis sampling). Some of these systems are now commercially available and should thus be employed during the baseline study at active seeps located above the storage complex.
CO2 contents of bottom waters are highly dynamic also at storage sites where no seepage occurs. In the North Sea, pCO2 values are close to atmospheric values during the cold season when the water column is well mixed whereas CO2 values increase towards the seabed during the warm season when the water column is stratified. This natural CO2 enrichment is driven by the degradation of marine organic matter producing metabolic CO2 in the water column and at the seabed. The extent of the enrichment depends on biological activity, current velocities, and local rates of horizontal and vertical mixing. It varies not only between seasons but also from year to year. It is, thus, challenging to fully explore and quantify the natural variability of the near-seabed CO2 system. To address and minimize this problem, ECO2 developed and successfully tested a new sensitive tracer (Cseep) which highlights the impact of leakage-related CO2 on bottom water chemistry and largely excludes the effects of metabolic CO2 (Botnen et al., 2015 ref /24/). It employs the fact that biological production of CO2 is always associated with a certain amount of oxygen consumption and nutrient release while CO2 leakage has no specific effect on oxygen and nutrient levels in ambient bottom waters (Figure 5-9). Baseline and monitoring surveys should thus aim to measure concentrations of dissolved inorganic carbon, alkalinity, salinity, phosphate and oxygen and apply these data to determine the concentration of the Cseep tracer in ambient bottom waters above the storage complex which should cluster at values close to zero prior to the onset of the storage operation. The chemical baseline is also shifted by the uptake of anthropogenic CO2 via the seawater-atmosphere interface inducing a continuous increase in background CO2. Additional measurements at reference stations upstream from the storage site can be applied to assess this effect during the operational phase since it affects the ocean at large and not just the storage area.
Efforts and costs for the recommended baseline and monitoring studies increase in proportion to the number of seep sites situated above the storage complex. The guidelines presented in this document, thus, provide strong financial incentives to avoid these features during site selection as far as possible and may thereby help to minimize the likelihood that CO2 will leak from sub-seabed storage sites.
46

Figure 5-9: Cseep concentrations in bottom waters at a hydrothermal vent field in the Norwegian Sea near the Jan Mayen Island (Botnen et al. 2015 9 (ref/24/)). Left panel: 3-dimensional sketch of the location of the hydrothermal vents, the reference station, and sampling depths during the measurement campaign, July-Aug 2012. Right panel: Excess DIC input from subsea hydrothermal vents (in micro-moles of carbon per kg of seawater) determined for various depths in the water column. In contrast to cold seeps, hot vents produce buoyant CO2 plumes rising towards the surface.
47
6 REFERENCES /1/ The Waste Framework Directive 2006/12/EC
/2/ The Water Framework Directive 2006/60/EC
/3/ The Environmental Liability Directive 2004/35/EC
/4/ Directive 2009/31/EC Article 3
/5/ International Legal Materials (ILM) 36 (1997), 7. The Protocol entered into force on 24 March 2006. For its contracting parties, it substitutes the obligations arising from the 1972 Convention on the Prevention of Marine Pollution by Dumping of Wastes and Other Matter (London Convention, ILM 11 [1976], 1294). There are currently 45 contracting parties to the Protocol (see http://www.imo.org/OurWork/Environment/SpecialProgrammesAndInitiatives/Pages/London-Convention-and-Protocol.aspx accessed on 26 November 2014). Note that not all Member States of the EU have ratified the Protocol.
/6/ ILM 32 (1993), 1069. The OSPAR Convention entered into force on 25 March 1998 and has 16 contracting parties (including the EU). For more information see http://www.ospar.org/content/content.asp?menu=01481200000026_000000_000000
(last accessed on 26 November 2014). /7/ Annex III of Directive 2004/35/EC
/8/ Annex IV, para 23, of Commission Regulation EU No. 601/2012
/9/ R. Metcalfe, A. Paulley, P.M. Suckling, C.E. Watson, A Tool for Integrating and Communicating Performance-Relevant Information in CO2 Storage Projects: Description and Application to In Salah, Energy Procedia, Volume 37, 2013, Pages 4741-4748, ISSN 1876-6102, http://dx.doi.org/10.1016/j.egypro.2013.06.383.
(http://www.sciencedirect.com/science/article/pii/S1876610213006267)
/10/ Commercial software that implements Evidence Support Logic is available from Quintessa (Tesla) and Argevide (NOR-STA).
/11/ Warren, E.A., Smalley, P.C. (1994) North Sea Formation Waters Atlas. Memoirs of the Geological Society of London, vol. 15, London, 208p.
/12/ Karstens J., Ahmed W., Berndt C., Class H. (submitted) The impact of chimney structures on the CO2 storage at Sleipner: Evaluation of numerical fluid flow simulations basing on time-lapse seismic data.
/13/ Karstens J., Berndt C. (2015) Seismic chimneys in the Southern Viking Graben - Implications for palaeo fluid migration and overpressure evolution. Earth and Planetary Science Letters 412, 88-100.
/14/ Sommer S., Schmidt M., Linke P. (revised) Continuous inline mapping of a dissolved methane plume at a blowout site in the Central North Sea UK using a membrane inlet mass spectrometer - water column stratification impedes immediate methane release into the atmosphere. Marine and Petroleum Geology.
/15/ Vielstädte L., Karstens J., Haeckel M., Schmidt M., Liebetrau V., Reimann S., McGinnis D. F., Linke P., Wallmann K. (revised) Quantification of methane emissions at abandoned gas wells in the central North Sea. Marine and Petroleum Geology.
48
/16/ Schneider von Deimling J., Rehder G., Greinert J., McGinnis D.F., Boetius A., Linke P. (2011) Quantification of seep-related methane gas emissions at Tommeliten, North Sea. Continental Shelf Research 31, 867-878.
/17/ Pörtner H.O. (2008) Ecosystem effects of ocean acidification in times of ocean warming: a physiologist's view. Marine Ecology Progress Series 373, 203-217.
/18/ Hu M.Y., Casties I., Stumpp M., Ortega-Martinez O., Dupont S. (2014) Energy metabolism and regeneration are impaired by seawater acidification in the infaunal brittlestar Amphiura filiformis. Journal of Experimental Biology 217, 2411-2421.
/19/ Stumpp M., Hu M.Y., Melzner F., Gutowska M.A., Dorey N., Himmerkus N., Holtmann W.C., Dupont S.T., Thorndyke M.C., Bleich M. (2012) Acidified seawater impacts sea urchin larvae pH regulatory systems relevant for calcification. Proceedings of the National Academy of Sciences of the USA 109, 18192-18197.
/20/ Thomsen J., Casties I., Pansch C., Körtzinger A., Melzner F. (2013) Food availability outweighs ocean acidification effects in juvenile Mytilus edulis: laboratory and field experiments. Global Change Biology 19, 1017-1027.
/21/ Blackford J., Stahl H., Bull J.M., Bergès B.J.P., Cevatoglu M., Lichtschlag A., Connelly D., James R.H., Kita J., Long D., Naylor M., Shitashima K., Smith D., Taylor P., Wright I., Akhurst M., Chen B., Gernon T.M., Hauton C., Hayashi M., Kaieda H., Leighton T.G., Sato T., Sayer M.D.J., Suzumura M., Tait K., Vardy M.E., White P.R., Widdicombe S. (2014) Detection and impacts of leakage from sub-seafloor carbon dioxide storage. Nature Climate Change 4, 1011-1016.
/22/ Schmidt, M., Linke, P., Sommer, S., Esser, D., Cherednichenko, S. (2015) Natural CO2 seeps offshore Panarea: A test site for subsea CO2 leak detection technology. Marine Technology Society Journal 49(1), 19-30.
/23/ Schneider von Deimling, J., & Weinrebe, W. (2014). Beyond Bathymetry: Water Column Imaging with Multibeam Echo Sounder Systems. Hydrographische Nachrichten, 31(97), 6-10.
/24/ Botnen, H. A., Omar, A. M., Thorseth, I., Johannessen, T. and Alendal, G. (2015) The effect of submarine CO2 vents on seawater: Implications for detection of subsea carbon sequestration leakage. Limnology and Oceanography, 60, 402-410. doi: 10.1002/lno.10037
49