Embed Size (px)
Citation preview

Project undertaken with the financial support of th e European Commission
Grant Agreement Number: 686031
Deliverable n° D2.3
Standard for common (water) testing conditions
Lars Venhuis & Ludwin Daal - Sweco
D2_3_SWECO_2016_V1.0 1.0 Oktober 10, 2016 L.P. Venhuis H. Huyn
Public
Sweco LBE
Document Name REV Issue Date Prepared by Approved by Classification

Document Name D2_3_SWECO_2016_V1.0
Document Type Report
Title Standard for common (water) testing conditions
WP WP2 task 2.2
Deliverable D2.3 GA 686031 Pag 2 / 50
Revision History
Version Date Author/reviewer Notes
V0.1 May 20, 2016 H. Huyn & Ch. Vanschepdael (ENGIE) -
V0.2 June 20, 2016 H. Huyn & Ch. Vanschepdael (ENGIE) -
V0.3 July 1, 2016 H. Huyn & Ch. Vanschepdael (ENGIE) -
V0.4 August 11,
2016
C. Danila (E&R RIC) &
S. van Ermen (VITO)
V0.5, V0.6,V0.7
Oktober 10, 2016 Intern Sweco Nederland BV Final Review
V1.0 Oktober 10, 2016 / Released
Distribution List
Classification Code Distribution list Dissemination Level
PU Partners + Project officer +
Project monitor + User’s Group
Public

Document Name D2_3_SWECO_2016_V1.0
Document Type Report
Title Standard for common (water) testing conditions
WP WP2 task 2.2
Deliverable D2.3 GA 686031 Pag 3 / 50
Summary Within the MATChING project, WP2 is a crossing work package where methodology and tools will be defined to guide and support lab, pilot and demonstration work. This to provide the necessary context, framework and scenario hypotheses for the Business Case validation (WP7) of the different technologies tested in the WPs (WP3 to 6). This Task 2.2 document describes appropriate monitors, equipment, test facilities and pilot plants and the standards for common (water) testing conditions (incl. quality) for the different MATChING lab testing and DEMO tests, to ensure the MATChING achievements. This Task 2.2 document is a discussion document, providing guidelines, for all partners, laboratory and test facility owners to improve its own testing procedures for selecting most promising technologies. These guidelines should make it possible to compare the different technologies in the Business Case validation (WP7). For identification of the standard waters, a questionnaire was send to the different thermal power (ENEL, Endesa and ENGIE) and geothermal power (VITO and EGP) utility owners to identify operational parameters, chemical water and geofluid composition and water treatment chemicals added for anti-scaling, anti-corrosion and biofouling mitigation. The gathered information resulted in the following:
• For the water/steam cycle identification the VGB, EPRI and Sweco guidelines were used. This is comparable with the water steam quality of the As Pontes demo plant. The TRHyCo pilot unit is using potable water for steam production, which has less water/steam quality as mentioned in the different guidelines.
• Selected geothermal fluids are geofluids from locations: Balmatt (for low temperature application) and Nuova San Martino (for high temperature application), chemical compositions are presented in the report.
• Selected (cooling) water types are the ‘high quality’ water from As Pontes power plant and ‘less quality’ water from Drogenbos power plant, chemical compositions are presented in the report. The choice of using additional water types for Lab and/or Pilot unit tests (for Merades; Pericles and Mistral) depends on the test strategy adopted by each WP.
• For wastewater the characteristics of the Brindisi power plant FGD purge water chemical composition is presented in the report.
Within this report an overview of standard water used within the WPs Laboratory tests and Pilot scale / DEMO test is presented. The choice of using (additional) water types for Lab and/or Pilot unit tests depend on the test strategy adopted by each WP. Also test procedures; monitoring & reporting protocols are provided as guidelines for each laboratory and test facility owner to help improve its own procedures. It is recommended to provide Sweco and Engie Lab with applied deviations and/or additions for the validation of the different Pilot plants in WP7 and the update of this document.

Document Name D2_3_SWECO_2016_V1.0
Document Type Report
Title Standard for common (water) testing conditions
WP WP2 task 2.2
Deliverable D2.3 GA 686031 Pag 4 / 50
TABLE OF CONTENTS
Summary ........................................... ................................................................................. 3
1 Introduction ...................................... ........................................................................... 6
1.1 Aim of Task 2.2 ................................................................................................................. 6
2 Demonstration Program ............................. ................................................................ 7
3 Description of existing DEMO facilities and test ri gs (pilot units) ........................ 10
3.1 Merades (Portable Unit) - Engie Laboratories ................................................................. 10
3.2 Pericles facility – EdF Laboratories ................................................................................. 11
3.3 TRHyCo facility - EdF Laboratories ................................................................................. 11
3.4 Mistral facility - EdF Laboratories .................................................................................... 12
3.5 Test-Rig facility – Sweco Nederland BV .......................................................................... 13
3.6 Main instrumentation and monitoring techniques ............................................................ 14
4 Description of Demo sites ......................... ............................................................... 16
4.1 Balmatt Geothermal Site (Low Temperature) .................................................................. 16
4.2 Nuova San Martino (High Temperature) ......................................................................... 16
4.3 Brindisi Sud .................................................................................................................... 18
4.4 As Pontes ....................................................................................................................... 18
5 Water Qualities ................................... ....................................................................... 19
5.1 Geothermal Fluids .......................................................................................................... 19
5.1.1 Low temperature geothermal fluid ............................................................................ 19
5.1.2 High temperature geothermal fluid ........................................................................... 20
5.2 Process water/steam ...................................................................................................... 20
5.2.1 Cooling waters ......................................................................................................... 21
5.2.2 As Pontes Power Plant (Endesa) ............................................................................. 21
5.2.3 Drogenbos Power Plant (ENGIE) ............................................................................. 23
5.3 Waste waters ................................................................................................................. 23
6 Monitoring Protocols .............................. .................................................................. 26
6.1 Low Temperature Geothermal power plants ................................................................... 26
6.1.1 Monitoring parameters ............................................................................................. 26
6.2 High Temperature Geothermal power plants .................................................................. 26
6.2.1 Monitoring parameters ............................................................................................. 26
6.2.2 Steam / cooling water characteristics ....................................................................... 27

Document Name D2_3_SWECO_2016_V1.0
Document Type Report
Title Standard for common (water) testing conditions
WP WP2 task 2.2
Deliverable D2.3 GA 686031 Pag 5 / 50
6.2.3 Temperature / humidity measurement ..................................................................... 27
6.2.4 Steam feed, evaporation and blow-down measurement ........................................... 27
6.2.5 Geothermal cooling tower ........................................................................................ 28
6.3 Cooling Tower Systems Thermal Power Plants and Pilot units ....................................... 28
6.3.1 Monitoring parameters ............................................................................................. 28
6.3.2 Water characteristics ............................................................................................... 28
6.3.3 Temperature measurement...................................................................................... 29
6.3.4 Water (circulation) flowrate detection ....................................................................... 30
6.3.5 Make-up, evaporation and blow-down measurement ............................................... 30
6.3.6 Cooling tower ........................................................................................................... 30
6.3.7 Membranes .............................................................................................................. 31
7 Reporting protocols ............................... ................................................................... 31
7.1 Low Temperature Geothermal power plants ................................................................... 31
7.2 High Temperature Geothermal power plants .................................................................. 31
7.3 Cooling Tower systems Thermal Power Plants and Pilot units ........................................ 32
8 References ........................................ ......................................................................... 34
ANNEX A Appropriate Monitors and Equipment ................ ........................................ 35
ANNEX B Questionnaire information Power Plants ............ .................................... 37
B1. Water/steam Standard .................................................................................................. 37
B2. As Pontes Power Plant (ENDESA) ............................................................................... 38
B3. Brindisi Power Plant (ENEL) ........................................................................................ 41
B4. Knippegroen Power Plant (ENGIE) .............................................................................. 42
B5. Drogenbos Power Plant (ENGIE) ................................................................................. 43
B6. Standard synthetic cooling water composition as use d in NEN 7420 ...................... 44
B7. Nuova San Martino geofluid (ENEL Green Power) ..................................................... 45
ANNEX C Test Procedures mentioned in Dutch Standard NEN 742 0 ....................... 46
ANNEX D Test Procedures for Coating Characterization and Co rrosion evaluation 48

Document Name D2_3_SWECO_2016_V1.0
Document Type Report
Title Standard for common (water) testing conditions
WP WP2 task 2.2
Deliverable D2.3 GA 686031 Pag 6 / 50
1 Introduction
MATChING Task 2.2 is part of the WP2 “Success indicators, techno-economical targets, scenario definitions, and establishment of standard conditions for testing” with main objective - to pave the way to technological WPs (WP3 to 6) providing criteria for demonstration phase execution and validation, together with identification of future possible technological, regulatory and market trends for Business Case Validation (WP7).
WP2 is a crossing work package (see Figure 1) where methodology and tools to guide and support lab, pilot and demonstration work will be defined: KPIs, standard for testing conditions. Starting from a first set of KPIs, Lab test screening will help the definition of KPIs for the pilot & demo phase. WP2 will provide all the necessary context, framework and scenario hypotheses for the Business Case validation (WP7): the technology selection and the scenario identification will be representative of the EU context thanks to the contribution of several utilities with fossil fuelled and geothermal power plants located in different areas of Europe, and to the interaction with the Users’ Group.
This report “Standard for common (water) testing conditions”, describes the typology and composition of fluids for the different MATChING Lab testing and DEMO tests.
1.1 Aim of Task 2.2 The aim of this task is to describe appropriate monitors, equipment, test-rigs and test procedures and identify water quality for the different MATChING tasks to ensure the MATChING achievements. As the quality of cooling water and geothermal fluids is different everywhere, it will affect the outcome of the results and using uniform water composition will minimize this risk.
Two (2) cooling water quality types and two (2) geothermal fluid suitable for representative testing wil be described in this taks. For the identification of the standard cooling water, a questionnaire was send to Endesa As Pontes Power Plant (La Coruna, Spain) and ENEL Brindisi Power Plant (Brindisi, Italy). Also questionnaire information was requested from ENGIE Knippegroen Power Plant (Gent, Belgium) and ENGIE Drogenbos Power Plant (Drogenbos, Belgium). This to identify operational parameters, chemical water composition and water treatment chemicals added for anti-scaling, anti-corrosion and biofouling mitigation.
Figure 1 Overview of MATChING work plan
Document Name D2_3_SWECO_2016_V1.0
Document Type Report
Title Standard for common (water) testing conditions
WP WP2 task 2.2
Deliverable D2.3 GA 686031 Pag 7 / 50
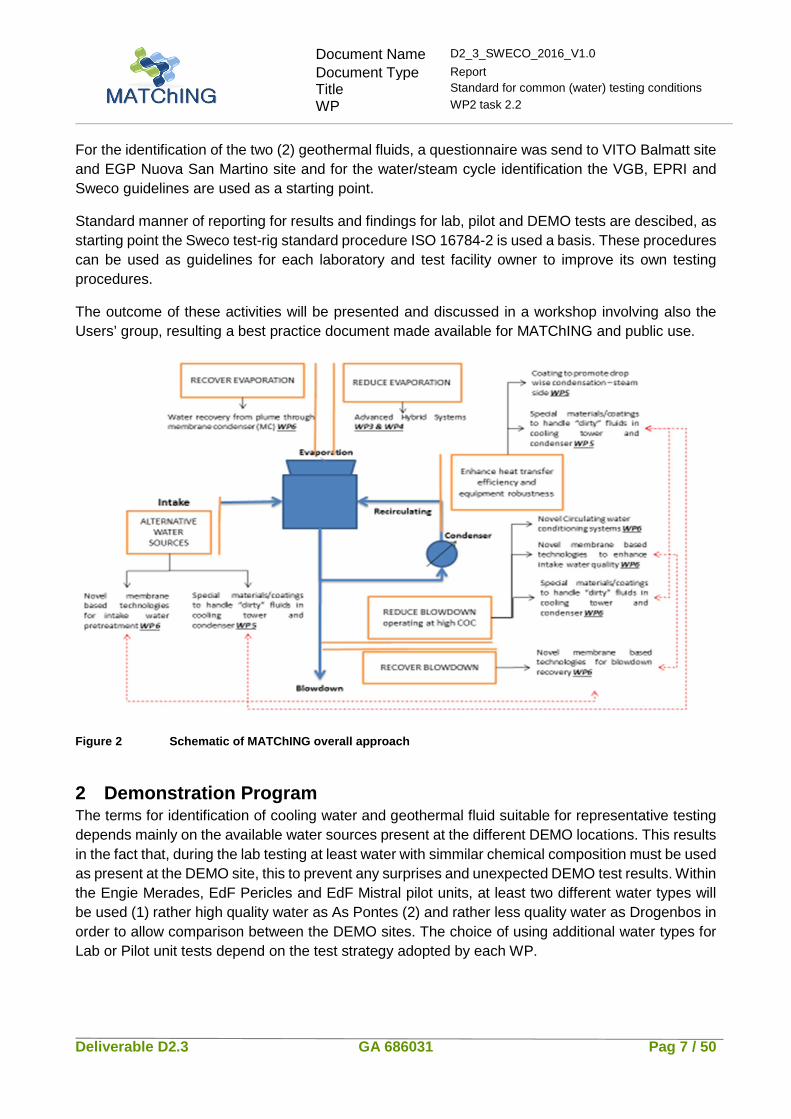
For the identification of the two (2) geothermal fluids, a questionnaire was send to VITO Balmatt site and EGP Nuova San Martino site and for the water/steam cycle identification the VGB, EPRI and Sweco guidelines are used as a starting point.
Standard manner of reporting for results and findings for lab, pilot and DEMO tests are descibed, as starting point the Sweco test-rig standard procedure ISO 16784-2 is used a basis. These procedures can be used as guidelines for each laboratory and test facility owner to improve its own testing procedures.
The outcome of these activities will be presented and discussed in a workshop involving also the Users’ group, resulting a best practice document made available for MATChING and public use.
Figure 2 Schematic of MATChING overall approach
2 Demonstration Program The terms for identification of cooling water and geothermal fluid suitable for representative testing depends mainly on the available water sources present at the different DEMO locations. This results in the fact that, during the lab testing at least water with simmilar chemical composition must be used as present at the DEMO site, this to prevent any surprises and unexpected DEMO test results. Within the Engie Merades, EdF Pericles and EdF Mistral pilot units, at least two different water types will be used (1) rather high quality water as As Pontes (2) and rather less quality water as Drogenbos in order to allow comparison between the DEMO sites. The choice of using additional water types for Lab or Pilot unit tests depend on the test strategy adopted by each WP.

Document Name D2_3_SWECO_2016_V1.0
Document Type Report
Title Standard for common (water) testing conditions
WP WP2 task 2.2
Deliverable D2.3 GA 686031 Pag 8 / 50
For the water/steam cycle tests within the EdF TRHyCo pilot unit a steam composition compared to the VGB, EPRI and Sweco guidelines need to be used. Water/steam quality as mentioned in the report corresponds with As Pontes power plant water/steam conditioning regime. The TRHyCo pilot unit is using potable water for steam production, which has less water/steam quality as mentioned in the different guidelines.
For wastewater the chateristics of the Brindisi power plant FGD waste water is presented in the report.
Overview of water used during the Laboratory phase and Pilot scale / DEMO sites is presented in respectively Table 2.1 and Tabel 2.2.
Table 2.1 Minimal water composition used duri ng Laboratory phase
Technology Lab Owner Water /Fluid Quality
WP &Task Water/Fluid Composition
Coatings for geofluid side
DTI LAB Balmatt geofluid WP3. Task 3.1.2 Paragraph 5.1.1
Coatings for geofluids side
SPIG Subcontractor
Nuova San Martino geofluid
WP4. Task 4.1.2 Paragraph 5.1.2
Advanced filling for hybrid CT
SPIG Nuova San Martino geofluid
WP4. Task 4.1.1 Paragraph 5.1.2
Coatings/Materials for steam side
DTI LAB & MANOVA LAB
Water//steam Standard
WP5. Task 5.1.1 Paragraph 5.2
Coatings/Materials for cooling water side
AIMEN LAB As Pontes CW + Drogenbos CW
WP5. Task 5.2.1 Paragraph 5.3.1 + Paragraph 5.3.2
Coatings/Materials for cooling water side
DTI LAB & MANOVA LAB
As Pontes CW + Drogenbos CW
WP5. Task 5.3.1 Paragraph 5.3.1 + Paragraph 5.3.2
MCDI VITO LAB Drogenbos CW WP6 Task 6.1.1 Paragraph 5.3.2 + Paragraph 5.4
VORTEX (VPT©) VITO LAB As Pontes CW + Drogenbos CW
WP6 Task 6.2.1 Paragraph 5.3.1 + Paragraph 5.3.2
MD VITO LAB As Pontes CW + Drogenbos CW
WP6 Task 6.3.1 Paragraph 5.3.1 + Paragraph 5.3.2
Pressure Driven membranes and MD
ITM LAB Brindisi FGD Wastewater
WP6. Task 6.4.1 and 6.5.1
Paragraph 5.4
Membrane condensers
ITM LAB CT Plume composition from As Pontes CW + Drogenbos CW
WP6. Task 6.6.1 Paragraph 5.3.1 + Paragraph 5.3.2

Document Name D2_3_SWECO_2016_V1.0
Document Type Report
Title Standard for common (water) testing conditions
WP WP2 task 2.2
Deliverable D2.3 GA 686031 Pag 9 / 50
Table 2 .2 Water used during tests on Pilot scale and Demo site s References within Task 2.2 report
Technology Facility/Demo Site
Water/Fluid Quality
WP &Task Facility/Demo Description
Water/Fluid Composition
Coatings for low T geofluid side
DEMO: Balmatt in MOL
Balmatt geofluid WP3. Task 3.1.3
Paragraph 4.1 Paragraph 5.1.1
Coatings for high T geofluid side
DEMO: Nuova San Martino
Nuova San Martino geofluid
WP4. Task 4.2 and 4.3
Paragraph 4.2 Paragraph 5.1.2
Advanced filling for hybrid CT
DEMO: Nuova San Martino
Nuova San Martino geofluid
WP4. Task 4.2 and 4.3
Paragraph 4.2 Paragraph 5.1.2
Coatings for steam side
FACILITY: Thryco
Water/steam Standard
WP5. Task 5.1.2
Paragraph 3.3 Paragraph 5.2
Coatings for steam side
DEMO: As Pontes
As Pontes steam and As Pontes CW
WP5. Task 5.1.3
Paragraph 4.4 Paragraph 5.3.1 (tabel 5.4)
Coating/Materials for cooling water (CW) side
FACILITY: Pericles
As Pontes CW + Drogenbos CW
WP5. Task 5.2.3 & 5.3.2
Paragraph 3.2 Paragraph 5.3.1 (tabel 5.5)
Coatings/Materials for cooling water (CW) side
DEMO: As Pontes
As Pontes CW WP5. Task 5.2.3 & 5.3.2
Paragraph 4.4 Paragraph 5.3.1
MCDI Facility: MERADES
Drogebons CW WP6 Task 6.1.3
Paragraph 3.1 Paragraph 5.3.2 and 5.4 (tabel 5.7)
VORTEX (VPT©) Facility: MERADES
Drogenbos CW WP6 Task 6.2.2
Paragraph 3.1 Paragraph 5.3.2
VORTEX (VPT©) DEMO: As Pontes plus Sweco Test-rig
As Pontes CW WP6 Task 6.2.2
Paragraph 3.5 and 4.4
Paragraph 5.3.1
MD Facility: MERADES
Drogenbos CW WP6 Task 6.3.3
Paragraph 3.1 Paragraph 5.4 (table 5.8)
MD DEMO: As Pontes
As Pontes CW WP6 Task 6.3.3
Paragraph 4.4 Paragraph 5.4 (table 5.8)
Pressure Driven membranes and MD
DEMO SITE: Brindisi Sud
Brindisi FGD Wastewater
WP6. Task 6.4.3 and 6.5.2
Paragraph 4.3 Paragraph 5.4
Membrane condensers
FACILITY: MISTRAL
CT Plume composition from As Pontes CW and Drogenbos CW
WP6. Task 6.6 Paragraph 3.4 Paragraph 5.4

Document Name D2_3_SWECO_2016_V1.0
Document Type Report
Title Standard for common (water) testing conditions
WP WP2 task 2.2
Deliverable D2.3 GA 686031 Pag 10 / 50
3 Description of existing DEMO facilities and test rigs (pilot units)
3.1 Merades (Portable Unit) - Engie Laboratories The mobile pilot unit Merades II of Engie Lab (formerly Laborelec) makes it possible to test and evaluate new cooling water designs or conditionings for industrial plants and can also be used to validate new types of cooling water monitors. The Merades pilot unit is located at Linkebeek, Belgium, on the Engie Lab site. The pilot unit consists of two identical independent cooling circuits which include each its own condenser with ball cleaning system, forced cooling tower with fill, biocide and anti-scalant injection system, chemical and physical monitoring, circulation pumps, water captation, water purge,…The pilot works full continuous and can be operated from a distance.
Figure 3. overview of Merades II pilot unit of Engie Lab
Table 3.1 Merades unit main components and parameters:
Component Parameter
Water circulation flow rate: 1000 – 4000 l/hour Blow down flow rate: - x to 300 l/h (pump 1)
- 10 to (x+20) l/h (pump 2) Heat exchanger delta T: 0 to 14 oC Air outlet temperature cooling tower: 10 to 45 oC
In the MATChING project three (3) different technologies will be tested: • Membrane De-ionization (MCDI) provided by VITO for feed pre-treatment of the cooling circuit • IVG-C CoolWATER™ provided by PATHEMA for chemical-free circulation water treatment of
the cooling circuit • Membrane Distillation (MD) unit provided from VITO for cooling circuit blowdown reuse.

Document Name D2_3_SWECO_2016_V1.0
Document Type Report
Title Standard for common (water) testing conditions
WP WP2 task 2.2
Deliverable D2.3 GA 686031 Pag 11 / 50
3.2 Pericles facility – EdF Laboratories PERICLES is a facility equipped with: • Full on-line water quality instrumentation • Full-length steam condenser tubes to duplicate flow velocities, heat flux, inlet/outlet cooling
water temperatures • Pilot cooling towers.
Figure 4. Overview of the Pericles facility of EdF Laboratories
The Pericles facility is located at EdF R&D Chatou cedex, France and is generally using River Seine water but is also able to use water from a strorage tank. In the MATChING project PERICLES will be used to evaluate stainless steel with biocide properties and antifouling coatings simulating the internal tube side of condenser with the final aim to explore alternative water sources usages without treatment (re-use) and/or after treatments (re-cycled).
3.3 TRHyCo facility - EdF Laboratories The TRHyCo Facility is used to investigate the thermal performances of the surface steam condensers at low pressure. The volume of test section can host around 30-40 tubes of 1.5 m length. The facility is used to characterise qualitatively and quantitatively the heat transfer coefficients of steam condenser tube bundles. The TRHyCo facility is located at EdF R&D Chatou cedex, France and is using potable water for water/steam production. In the MATChING project the TRHyCo facility will be used to evaluate coated condenser (with selected hydrophobic surface coatings and special surface texturing at the tubes water/steam side), with the final aim to promote drop wise condensation and consequentially increase the overall heat transfer coefficient.
Table 3.2 Pericles facility main components and parameters:
Component Parameter
- Water circulation flow rate: 1200 l/h - Blow down flow rate: 30 l/h - Make-up water flow rate: 50 l/h - Heat-exchanger delta temperatuur: 10 oC

Document Name D2_3_SWECO_2016_V1.0
Document Type Report
Title Standard for common (water) testing conditions
WP WP2 task 2.2
Deliverable D2.3 GA 686031 Pag 12 / 50
Figure 5 Overview of the TRHyCo facility of EdF Laboratories
3.4 Mistral facility - EdF Laboratories MISTRAL is a facility equipped with a pilot Cooling Tower including the following components: 1. A comprehensive set of different equipment such as exchanger surfaces (fills, splashing grids,
etc.); 2. Water distribution device; 3. Drift eliminators. 4. MISTRAL is fully instrumented with flow meters, temperature probes and differential pressure
drop.
Figure 6 Overview of the Mistral facility of EdF Laboratories
The Mistral facility is located at EdF Bugey Nuclear Power Plant, located in Bugey in the Frence Saint-Vulbas commune (Ain), about 65 km from the Swiss border. The NPP is on the edge of the Rhône River, from where it gets its cooling water, and is about 30 km upstream from Lyon. In the MATChING project the Mistral facility will be used to test membranes condensers (MC) provided by ITM in order to evaluate water recovery from the CT plume, with the aim to evaluate the
Table 3.3 TRHyCo facility main components and parameters:
Component Parameter
- Boiler (thermal power): 75 kw (< 1,5 bar abs) - Pressure in the test section: 20 to 100 mbar - Desuperheating device at 300 mbar - Cooling water supply with regulation on velocity and inlet temperature (5 – 30 °C)
Table 3.4 Mistral facility main components and
parameters:
Component Parameter
- Air flow (counter / cros-flow): 0 – 225 m3/s - Air velocity: 0 - 4.5 m/s - Water flow: 0 – 600 l/s - Max. thermal capacity: 25 MW

Document Name D2_3_SWECO_2016_V1.0
Document Type Report
Title Standard for common (water) testing conditions
WP WP2 task 2.2
Deliverable D2.3 GA 686031 Pag 13 / 50
amount water recovery (Liter /day /m2); the quality of collected water; and the associated energy consumption.
3.5 Test-Rig facility – Sweco Nederland BV The Test-Rig has been set up in order to mimic an open recirculating cooling water system and has been built and designed - according to ISO-norm, ISO 16784-2. The Test-Rig can be transported on site, or tested at Sweco in Arnhem the Netherlands with site test collected water. The Test-Rig is equipped with the following main sections: 1) Coatings of condensers; 2) 3D filler; 3) Water of site source.
Figure 7. Overview of the Test-Rig facility of Sweco Nederland BV
Table 3.5 Sweco Test-Rig facility main components and parameters:
Component Parameter
Water circulation flow rate: Water velocity:
circa. 760 m3/h 0.6 – 1 m/s
Blow down flow rate: 1.4 l/h Heat exchanger delta T: Electrical power per test heat exchanger:
0 to 10 oC 400 – 500 Watt (corresponding to a wall temp. of 50 °C)
Air outlet temperature cooling tower: 10 to 35 oC
The Sweco Test-Rig facility is located in Arnhem, the Netherlands, about 30 km from the German border. The Test-Rig facility is on the edge of the Rhine River, from where it can gets its make-up water. In the MATChING project the Test-Rig is used at location As Pontes to evaluate the Vortex degasification technology (VPT©) from Pathema, for CT circulation water treatment.
Document Name D2_3_SWECO_2016_V1.0
Document Type Report
Title Standard for common (water) testing conditions
WP WP2 task 2.2
Deliverable D2.3 GA 686031 Pag 14 / 50
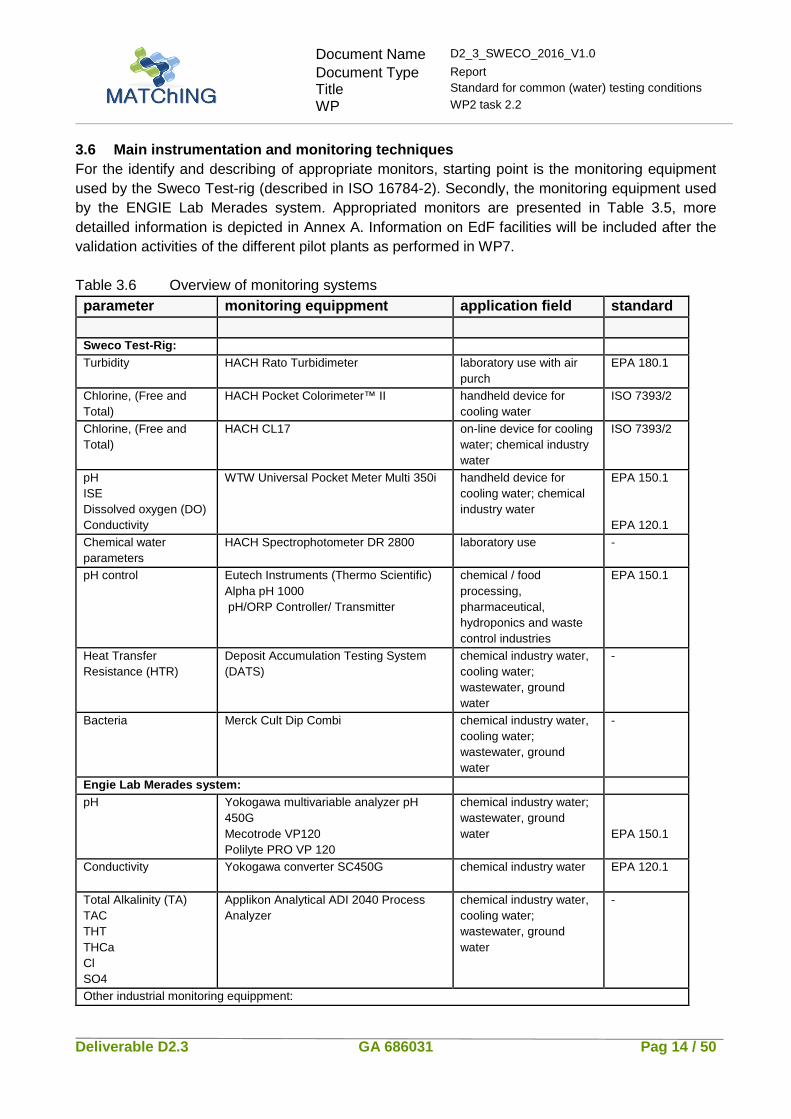
3.6 Main instrumentation and monitoring techniques For the identify and describing of appropriate monitors, starting point is the monitoring equipment used by the Sweco Test-rig (described in ISO 16784-2). Secondly, the monitoring equipment used by the ENGIE Lab Merades system. Appropriated monitors are presented in Table 3.5, more detailled information is depicted in Annex A. Information on EdF facilities will be included after the validation activities of the different pilot plants as performed in WP7. Table 3.6 Overview of monitoring systems parameter monitoring equippment application field standard Sweco Test -Rig: Turbidity HACH Rato Turbidimeter laboratory use with air
purch EPA 180.1
Chlorine, (Free and Total)
HACH Pocket Colorimeter™ II handheld device for cooling water
ISO 7393/2
Chlorine, (Free and Total)
HACH CL17 on-line device for cooling water; chemical industry water
ISO 7393/2
pH ISE Dissolved oxygen (DO) Conductivity
WTW Universal Pocket Meter Multi 350i
handheld device for cooling water; chemical industry water
EPA 150.1 EPA 120.1
Chemical water parameters
HACH Spectrophotometer DR 2800 laboratory use -
pH control Eutech Instruments (Thermo Scientific) Alpha pH 1000 pH/ORP Controller/ Transmitter
chemical / food processing, pharmaceutical, hydroponics and waste control industries
EPA 150.1
Heat Transfer Resistance (HTR)
Deposit Accumulation Testing System (DATS)
chemical industry water, cooling water; wastewater, ground water
-
Bacteria Merck Cult Dip Combi chemical industry water, cooling water; wastewater, ground water
-
Engie Lab Merades system: pH Yokogawa multivariable analyzer pH
450G Mecotrode VP120 Polilyte PRO VP 120
chemical industry water; wastewater, ground water
EPA 150.1
Conductivity Yokogawa converter SC450G
chemical industry water EPA 120.1
Total Alkalinity (TA) TAC THT THCa Cl SO4
Applikon Analytical ADI 2040 Process Analyzer
chemical industry water, cooling water; wastewater, ground water
-
Other industrial monitoring equippment:

Document Name D2_3_SWECO_2016_V1.0
Document Type Report
Title Standard for common (water) testing conditions
WP WP2 task 2.2
Deliverable D2.3 GA 686031 Pag 15 / 50
Conductivity
Hach Lange SIPAN 32 Liquid analyser (sensor 2EL; 4EL; IND.
Boiler feedwater, ultra-pure water, reverse osmosis, drinking water and surface water
EPA 120.1
pH / redox potential
Hach Lange SIPAN 32 Liquid analyser Chemical industry, water, wastewater; high-purity water
EPA 150.1
Chlorine, (Free and Total)
Bran+Luebbe 90S Kolorimeter chemical industry water, cooling water; wastewater, ground water
ISO 7393/2
EdF TRHyCo facility : Flow meters Electromagnetic flow meters - - Pressure Absolute and differential pressure
transmitters - -
Temperatures 12 RTD - - EdF Mistral facility: Temperatures water circuit:
- 3x RTD for hot water - 6x RTD for cold water
- -
- -
Flow meters water circuit:
1x electromagnetic flowmeter in hot water flow
- -
Temperatures air circuit:
- 6x RTD inlet air temperature - 12 RTD Hot air temperature (diffusor) - 9 RTD (droplet separators)
- - -
- - -
Humidity air circuit: 4x hygrometers at inlet - - Pressure air circuit: - 3x differential pressure for air flow
- 1x atmospheric pressure - 6x differential pressure drop transmitter
- - -
- - -
EdF Pericles facility: - - Temperature: - - Flow meters: - - Turbidimeters: - - Redox potential: - - Conductivity: - - pH meters: - -

Document Name D2_3_SWECO_2016_V1.0
Document Type Report
Title Standard for common (water) testing conditions
WP WP2 task 2.2
Deliverable D2.3 GA 686031 Pag 16 / 50
4 Description of Demo sites
4.1 Balmatt Geothermal Site (Low Temperature) The Balmatt site is located in Mol, a city in the northern part of Belgium. Geothermal fluid will be used to heat the nearby district area and, if the temperature of the brine is high enough, to produce electricity (48MW). The aim is to drill into a 3.5 kilometres deep layer of limestone which holds water with a temperature of 130 °C. In the MATChING project, a bypass will be installed onto the geothermal brine circuit for the evaluation of different coated materials in contact with the brine (at extraction temperature). Coatings with nanometer-thin surface layers - obtained through optimization of already commercial coatings or specifically developed within the project- will be first selected in the laboratory and then tested at real scale. The performance of the coatings will be demonstrated through periodic examination, in-situ measurements of corrosion rates and post-exposure lab analysis.
Figure 8. Overview of the Balmatt Geothermal site
4.2 Nuova San Martino (High Temperature) Nuova San Martino geothermal power plant in Larderello, (Tuscany) Italy was commissioned in 2005. Dry steam geothermal power plants use hydrothermal fluids that are primarily steam. Nuova San Martino has an average operating steam flow load of 73.6 kg/sec that travels directly to the turbine and produces up to 4,800 GWh geothermal electricity per year. The generating unit consists of six forced-draft wet cooling towers with a total cooling water flow of 12,000 m3/h. The hydrothermal fluid steam (175°C) is cooled in a direct contact condenser, the cooling water temperature increases in the condenser from 25°C to 35°C and is cooled again in the cooling towers. In the MATChING project, one of the towers will be retrofitted to a hybrid configuration. This hybrid cooling tower will include an innovative dry section, designed with new materials and coatings, while the underneath wet section will be optimized by means of a high-efficiency advanced packing, allowing a drastic reduction of the section height. In this way, the place for the dry section will be
Document Name D2_3_SWECO_2016_V1.0
Document Type Report
Title Standard for common (water) testing conditions
WP WP2 task 2.2
Deliverable D2.3 GA 686031 Pag 17 / 50
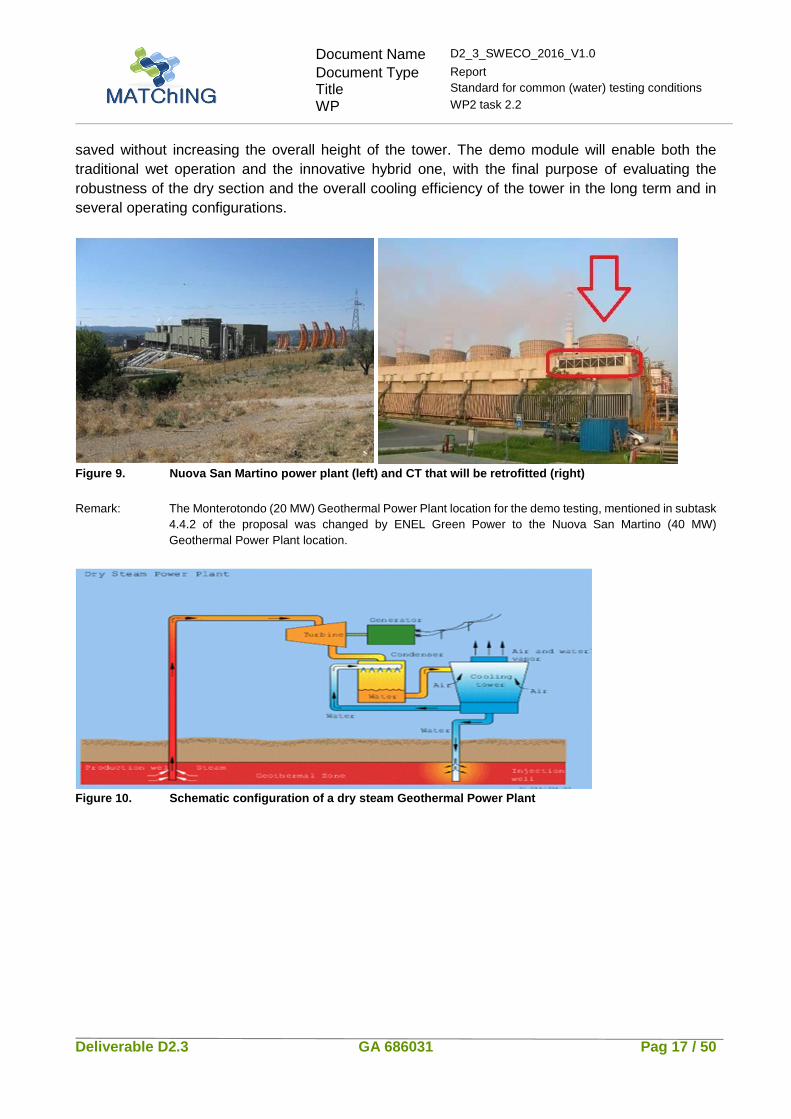
saved without increasing the overall height of the tower. The demo module will enable both the traditional wet operation and the innovative hybrid one, with the final purpose of evaluating the robustness of the dry section and the overall cooling efficiency of the tower in the long term and in several operating configurations.
Figure 9. Nuova San Martino power plant (left) and CT that will be retrofitted (right)
Remark: The Monterotondo (20 MW) Geothermal Power Plant location for the demo testing, mentioned in subtask
4.4.2 of the proposal was changed by ENEL Green Power to the Nuova San Martino (40 MW) Geothermal Power Plant location.
Figure 10. Schematic configuration of a dry steam Geothermal Power Plant

Document Name D2_3_SWECO_2016_V1.0
Document Type Report
Title Standard for common (water) testing conditions
WP WP2 task 2.2
Deliverable D2.3 GA 686031 Pag 18 / 50
4.3 Brindisi Sud Brindisi Sud (Federico II) is a 2640 MWe thermal power plant, divided in 4 independent units, its primary fuel is subbituminous coal. All units are equipped with wet flue gas desulphurization systems (FGD) for SO2-abatement. Currently, the waste waters coming from such units are pre-treated and recovered through a thermal evaporative process following the zero-liquid-discharge policy (ZLD).
Figure 11. Brindisi Sud (Federico II) thermal power plant
In the MATChING project a new membrane test facility will be integrated in the Brindisi power plant to recover water from waste streams coming from the flue gas desulphurization (FGD) unit. The facility will include pilot units of both membrane distillation modules and pressure driven membranes (MF, UF, NF (micro, ultra, nano filtration) or RO (reverse osmosis)).
4.4 As Pontes As Pontes Power Plant is a 1403 MWe combined cycle thermal power plant, divided in 4 independent Units around 350MWe each one, its primary fuel is subbituminous coal. All Units are equipped with its own independent natural draft cooling tower and they share the same raw water, taken from the river Eume.
Figure 12. As Pontes thermal power plant

Document Name D2_3_SWECO_2016_V1.0
Document Type Report
Title Standard for common (water) testing conditions
WP WP2 task 2.2
Deliverable D2.3 GA 686031 Pag 19 / 50
In the MATChING project the following testing facilities will be installed, integrated and operated into As Pontes Power Plant: • A condenser pilot plant, manufactured by Integasa, with the aim to evaluate the performance of
different materials through long run test in operating conditions; ° hydrophobic coatings and laser surface texturizing to promote drop-wise condensation,
increasing the heat transfer rate; ° stainless steel with biocide properties and ° anti-fouling coatings to reduce bio-fouling inside the tubes of the condenser and other parts of
the cooling water circuit. • A vortex degasification module, provided by Pathema and integrated in the Sweco Test-rig, to
evaluate and demonstrate higher COC through reduced scaling without anti-scalant chemical addition in CT circulating water.
• Membrane distillation modules, provided by Aquastill, to be installed in side stream to the blowdown of CT, to perform a long run demonstration of CT blowdown water recovery.
5 Water Qualities The Standards for water test conditions for the DEMO testing will be presented per work package in the following paragraph. These standards can be used as guidelines for each laboratory and test facility owner to improve its own testing procedures. It is recommended to provide Sweco and Engie lab with applied deviations and/or additions for the validation of the different pilot plants in WP7 and the update of this document.
5.1 Geothermal Fluids 5.1.1 Low temperature geothermal fluid
WP3 DEMO will be performed at the Balmatt Geothermal Site. WP3 aims to improve electricity production processes from Low temperature geothermal sources (100–175°C) considering both the geothermal fluid and the cooling water 100% saving, maximizing the energetic efficiency of the geothermal plant and support their exploitation in DG application. The five (5) most advantageous coatings identified in subtask 3.1.2 will be scaled-up for application on appropriate pipe sections to be mounted in the testing facility at the Balmatt geothermal site. Table 5.1 Chemical composition of Balmatt geofluid and main operating parameters.
MATChING task 3.1.3 Geofluid parameter Value Range (min / max) - geofluid temperature (°C) - geofluid velocity (m/s) - geofluid conductivity (µS/cm) - geofluid pH (at 19.6 oC)
130 1
187 (120 mS/cm) 7.33
100 – 150 - - -
- main geofluid composition chloride, calcium, kalium, natrium en mangaan
Remark: * Rest of chemical composition of Balmatt geofluid is confidential information.

Document Name D2_3_SWECO_2016_V1.0
Document Type Report
Title Standard for common (water) testing conditions
WP WP2 task 2.2
Deliverable D2.3 GA 686031 Pag 20 / 50
5.1.2 High temperature geothermal fluid
WP4 DEMO will be performed at Nuova San Martino geothermal power plant. WP4 main goal is to thoroughly demonstrate the use of advanced/innovative materials solutions to increase the robustness of hybrid CTs in High temperature geothermal power plants in order to make them a competitive alternative of currently used wet CTs. The hybrid CTs are expected to allow the reduction of about 15-20% of evaporative losses. Nuova San Martino geothermal power plant fluid contains high levels of conductivity (mainly chloride) and ammonium. For information see Annex B7. Table 5.2 Chemical composition of CT water at Nuova San Martino geothermal plant and main
operating parameters.
MATChING task 4.2 and 4.3 Demo parameters CT Value Range - geofluid temperature tower inlet (°C) 35 30 - 40 - geofluid temperature tower outfall (°C) 25 20 - 30 - geofluid composition Nova San Martino geofluid (see Annex B7)
Remark: EGP says that under the geothermal conditions there are no bacteria so this parameter can be canceled in this case.
5.2 Process water/steam For the process water (steam cycle water) the VGB, EPRI and Sweco guidelines can be used as a starting point. The suggested standard chemical composition of process water used in the MATChING project is presented in Annex B1. This means that it is recommended to use this water/steam composition in all the test with TRHyCo facility, As Pontes etc. WP5 aims at improving the performance of the steam condenser, increasing heat transfer rate and condenser robustness on tube sides, improving the overall efficiency of the power plant and allowing alternative water source usage. Investigation and validation of condenser tubes external and internal coatings in combination with other technical solutions will be carried out. The different coatings and surface texturing to promote dropwise condensation will be tested for heat transfer characterisation in the EdF TRHyCo loop (Subtask 5.1.2). Table 5.3 The Task 2.2 Standard chemical composition of demi water and operating parameters
for representative testing suggested are as follows:
MATChING Subtask 5.1.2 TRHyCo loop parameter Value Range - condenser pressure steam side (mbar) 75 23 - 88 - condenser temperature range 40 19.7 - 43 - cooling water velocity in tubing (m/s) 1 min = 0.5
Stainless max = 4 & Carbon steel max = 1.5 - cooling water temperature (°C) 24 15 - 29 - delta T (°C) 11 5 - 12 - tubing material Stainless steel & carbon steel - Standard demi water composition Water/steam standard (see Annex B1) - Standard cooling water composition Suggested is potable water quality
Document Name D2_3_SWECO_2016_V1.0
Document Type Report
Title Standard for common (water) testing conditions
WP WP2 task 2.2
Deliverable D2.3 GA 686031 Pag 21 / 50
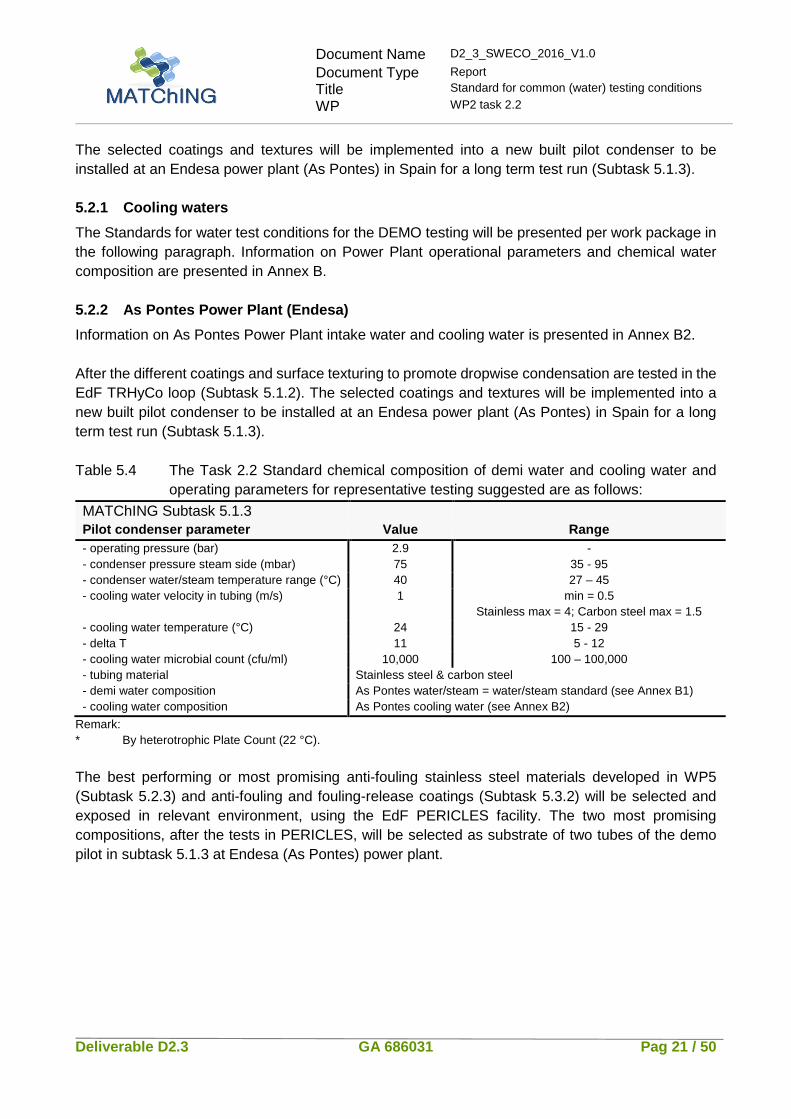
The selected coatings and textures will be implemented into a new built pilot condenser to be installed at an Endesa power plant (As Pontes) in Spain for a long term test run (Subtask 5.1.3). 5.2.1 Cooling waters
The Standards for water test conditions for the DEMO testing will be presented per work package in the following paragraph. Information on Power Plant operational parameters and chemical water composition are presented in Annex B. 5.2.2 As Pontes Power Plant (Endesa)
Information on As Pontes Power Plant intake water and cooling water is presented in Annex B2. After the different coatings and surface texturing to promote dropwise condensation are tested in the EdF TRHyCo loop (Subtask 5.1.2). The selected coatings and textures will be implemented into a new built pilot condenser to be installed at an Endesa power plant (As Pontes) in Spain for a long term test run (Subtask 5.1.3). Table 5.4 The Task 2.2 Standard chemical composition of demi water and cooling water and
operating parameters for representative testing suggested are as follows:
MATChING Subtask 5.1.3 Pilot condenser parameter Value Range - operating pressure (bar) 2.9 - - condenser pressure steam side (mbar) 75 35 - 95 - condenser water/steam temperature range (°C) 40 27 – 45 - cooling water velocity in tubing (m/s) 1 min = 0.5
Stainless max = 4; Carbon steel max = 1.5 - cooling water temperature (°C) 24 15 - 29 - delta T 11 5 - 12 - cooling water microbial count (cfu/ml) 10,000 100 – 100,000 - tubing material Stainless steel & carbon steel - demi water composition As Pontes water/steam = water/steam standard (see Annex B1) - cooling water composition As Pontes cooling water (see Annex B2)
Remark: * By heterotrophic Plate Count (22 °C).
The best performing or most promising anti-fouling stainless steel materials developed in WP5 (Subtask 5.2.3) and anti-fouling and fouling-release coatings (Subtask 5.3.2) will be selected and exposed in relevant environment, using the EdF PERICLES facility. The two most promising compositions, after the tests in PERICLES, will be selected as substrate of two tubes of the demo pilot in subtask 5.1.3 at Endesa (As Pontes) power plant.

Document Name D2_3_SWECO_2016_V1.0
Document Type Report
Title Standard for common (water) testing conditions
WP WP2 task 2.2
Deliverable D2.3 GA 686031 Pag 22 / 50
Table 5.5 The Task 2.2 Standard chemical composition of cooling water and operating parameters for representative testing suggested for the EdF PERICLES test are as follows:
MATChING Subtask 5.2.3 and 5.3.2 PERICLES facility parameter Value Range - condenser temperature (°C) 40 27 - 45 - cooling water velocity in tubing (m/s) 1 min = 0.5
Stainless max = 4, Carbon steel max = 1.5 - cooling water temperature (°C) 24 15 - 29 - delta T 11 5 - 12 - cooling water microbial count (cfu/ml) 10,000 100 – 100,000 - tubing material Stainless steel & carbon steel - Standard cooling water composition As Pontes cooling water composition (see Annex B2);
Drogenbos cooling water composition (see Annex B5).
Remark: * By heterotrophic Plate Count (22 °C).
In Task 6.2 “Vortex degasification technology (VPT©) for chemical free CT circulation water treatment”, the application of VPT will be evaluated and demonstrated for higher COC through reduced scaling without anti-scalant chemicals addition and higher cooling efficiency. Demonstration in intended environment (Subtask 6.2.2) will be performed at ENGIE Lab (MERADES system) and As Pontes Power Plant using the SWECO Test-rig facility. Lab tests using a small scale IVG-C unit will be done using two types of cooling water (Drogenbos and As Pontes cooling water). Both analytical evaluation of Ca-concentration in the water during the test and visual evaluation of CaCO3 deposit will be done to evaluate the technology.
Document Name D2_3_SWECO_2016_V1.0
Document Type Report
Title Standard for common (water) testing conditions
WP WP2 task 2.2
Deliverable D2.3 GA 686031 Pag 23 / 50
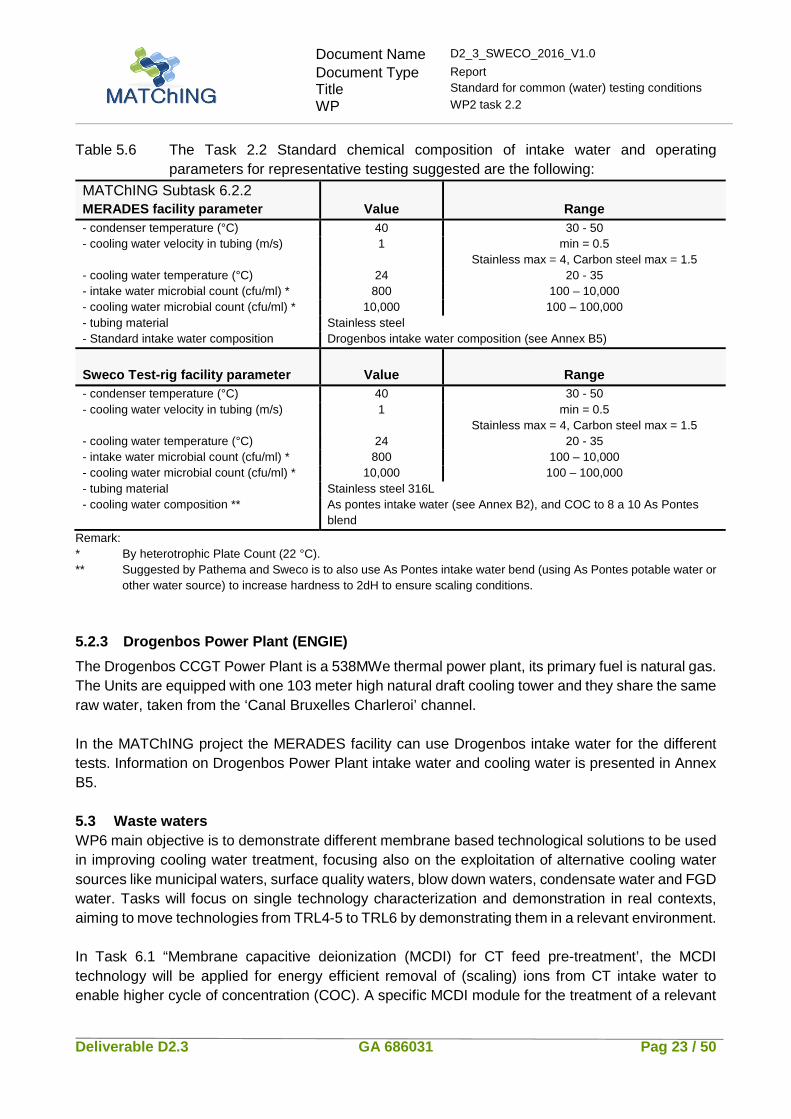
Table 5.6 The Task 2.2 Standard chemical composition of intake water and operating parameters for representative testing suggested are the following:
MATChING Subtask 6.2.2 MERADES facility parameter Value Range - condenser temperature (°C) 40 30 - 50 - cooling water velocity in tubing (m/s) 1 min = 0.5
Stainless max = 4, Carbon steel max = 1.5 - cooling water temperature (°C) 24 20 - 35 - intake water microbial count (cfu/ml) * 800 100 – 10,000 - cooling water microbial count (cfu/ml) * 10,000 100 – 100,000 - tubing material Stainless steel - Standard intake water composition Drogenbos intake water composition (see Annex B5)
Sweco Test-rig facility parameter
Value
Range
- condenser temperature (°C) 40 30 - 50 - cooling water velocity in tubing (m/s) 1 min = 0.5
Stainless max = 4, Carbon steel max = 1.5 - cooling water temperature (°C) 24 20 - 35 - intake water microbial count (cfu/ml) * 800 100 – 10,000 - cooling water microbial count (cfu/ml) * 10,000 100 – 100,000 - tubing material Stainless steel 316L - cooling water composition ** As pontes intake water (see Annex B2), and COC to 8 a 10 As Pontes
blend
Remark: * By heterotrophic Plate Count (22 °C). ** Suggested by Pathema and Sweco is to also use As Pontes intake water bend (using As Pontes potable water or
other water source) to increase hardness to 2dH to ensure scaling conditions.
5.2.3 Drogenbos Power Plant (ENGIE)
The Drogenbos CCGT Power Plant is a 538MWe thermal power plant, its primary fuel is natural gas. The Units are equipped with one 103 meter high natural draft cooling tower and they share the same raw water, taken from the ‘Canal Bruxelles Charleroi’ channel. In the MATChING project the MERADES facility can use Drogenbos intake water for the different tests. Information on Drogenbos Power Plant intake water and cooling water is presented in Annex B5. 5.3 Waste waters WP6 main objective is to demonstrate different membrane based technological solutions to be used in improving cooling water treatment, focusing also on the exploitation of alternative cooling water sources like municipal waters, surface quality waters, blow down waters, condensate water and FGD water. Tasks will focus on single technology characterization and demonstration in real contexts, aiming to move technologies from TRL4-5 to TRL6 by demonstrating them in a relevant environment. In Task 6.1 “Membrane capacitive deionization (MCDI) for CT feed pre-treatment’, the MCDI technology will be applied for energy efficient removal of (scaling) ions from CT intake water to enable higher cycle of concentration (COC). A specific MCDI module for the treatment of a relevant

Document Name D2_3_SWECO_2016_V1.0
Document Type Report
Title Standard for common (water) testing conditions
WP WP2 task 2.2
Deliverable D2.3 GA 686031 Pag 24 / 50
water source (Subtask 6.1.1) will be developed and demonstrated by coupling of a MCDI unit with the ENGIE lab MERADES facility (Subtask 6.1.3). Table 5.7 The Task 2.2 Standard chemical composition of intake water and operating
parameters for representative testing suggested are the following:
MATChING Subtask 6.1.3 MERADES facility parameters Value Range - electrode surface (m2) 10 - - intake water amount to membrane (m3/h) 100 - - intake water temperature 15 10 - 25 - intake water microbial count (cfu/ml) * 800 100 – 10,000 - intake water composition Drogenbos intake water (see Annex B5)
Remark: * By heterotrophic Plate Count (22 °C).
In Task 6.3 “Membrane Distillation (MD) for CT blow-down reuse’, reduction and reuse of CT blowdown using MD, combined with pre-treatment to tackle scaling/fouling issues. In subtask 6.3.3 MD are tested in two demo sites ENGIE Lab using the MERADES pilot blowdown line (LBE) simulating Drogenbos Power Plant water and As Pontes Endesa Power Plant coupled to CT blow-down. Lab tests using two types of blowdown water (Drogenbos and As Pontes blowdown water) will be done. Table 5.8 The Task 2.2 Standard chemical composition of cooling water and operating
parameters for representative testing suggested are the following:
MATChING Subtask 6.3.3 MERADES facility parameter Value Range - cooling water temperature (°C) 24 15 - 29 - cooling water microbial count (cfu/ml) * 10,000 100 – 100,000 - Standard cooling water composition Drogenbos composition (see Annex B5)
AS Pontes CT blowdown parameter
Value
Range
- cooling water temperature (°C) 24 15 - 29 - cooling water microbial count (cfu/ml) * 10,000 100 – 100,000 - cooling water composition As Pontes cooling water (see Annex B2)
Remark: * By heterotrophic Plate Count (22 °C).
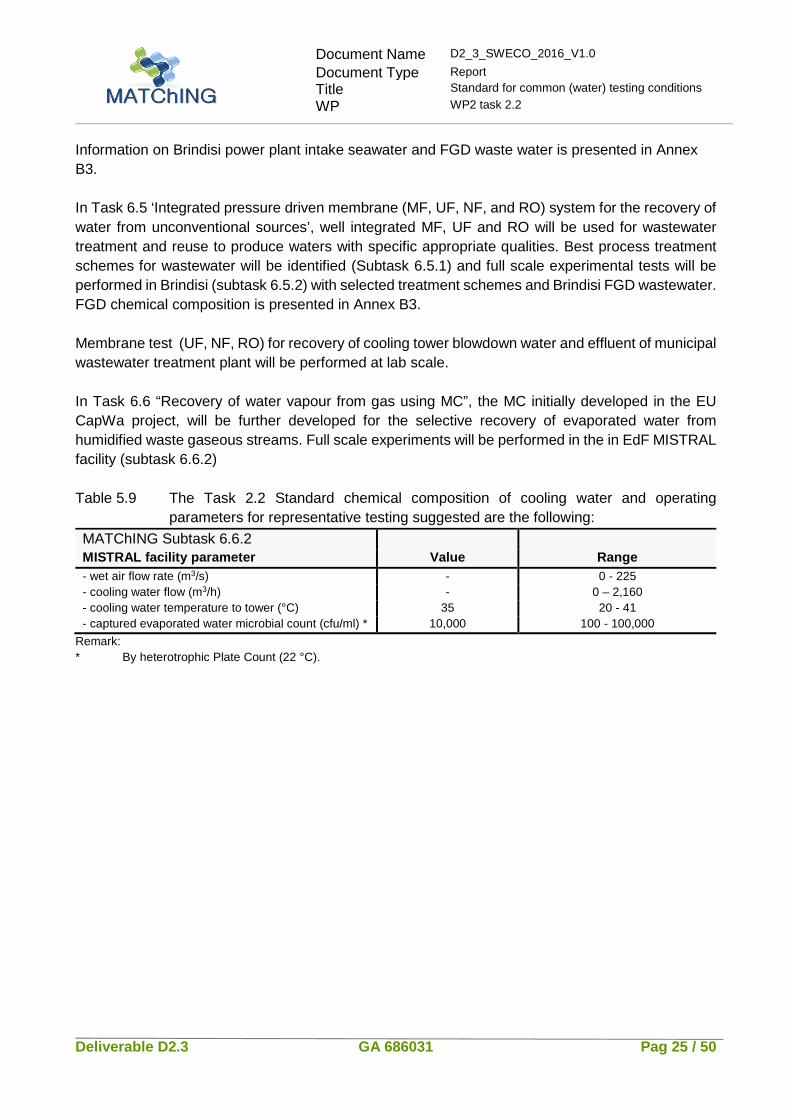
In Task 6.4 ‘Thermally driven membranes MD for the recovery of water from unconventional sources’, commercially available MD membranes, either as standalone process or integrated with the pressure driven membrane operations, will be studied for wastewater treatment and reuse. Different MD arrangements to perform an energetic analysis and the best operating conditions will be selected (Subtask 6.4.1) using the typical composition of wastewaters available on power plants. Demonstration (Subtask 6.4.3) will be performed at Brindisi power plant (10-20 m3/day, using FGD wastewater.
Document Name D2_3_SWECO_2016_V1.0
Document Type Report
Title Standard for common (water) testing conditions
WP WP2 task 2.2
Deliverable D2.3 GA 686031 Pag 25 / 50
Information on Brindisi power plant intake seawater and FGD waste water is presented in Annex B3. In Task 6.5 ‘Integrated pressure driven membrane (MF, UF, NF, and RO) system for the recovery of water from unconventional sources’, well integrated MF, UF and RO will be used for wastewater treatment and reuse to produce waters with specific appropriate qualities. Best process treatment schemes for wastewater will be identified (Subtask 6.5.1) and full scale experimental tests will be performed in Brindisi (subtask 6.5.2) with selected treatment schemes and Brindisi FGD wastewater. FGD chemical composition is presented in Annex B3. Membrane test (UF, NF, RO) for recovery of cooling tower blowdown water and effluent of municipal wastewater treatment plant will be performed at lab scale. In Task 6.6 “Recovery of water vapour from gas using MC”, the MC initially developed in the EU CapWa project, will be further developed for the selective recovery of evaporated water from humidified waste gaseous streams. Full scale experiments will be performed in the in EdF MISTRAL facility (subtask 6.6.2) Table 5.9 The Task 2.2 Standard chemical composition of cooling water and operating
parameters for representative testing suggested are the following:
MATChING Subtask 6.6.2 MISTRAL facility parameter Value Range - wet air flow rate (m3/s) - 0 - 225 - cooling water flow (m3/h) - 0 – 2,160 - cooling water temperature to tower (°C) 35 20 - 41 - captured evaporated water microbial count (cfu/ml) * 10,000 100 - 100,000
Remark: * By heterotrophic Plate Count (22 °C).
Document Name D2_3_SWECO_2016_V1.0
Document Type Report
Title Standard for common (water) testing conditions
WP WP2 task 2.2
Deliverable D2.3 GA 686031 Pag 26 / 50
6 Monitoring Protocols
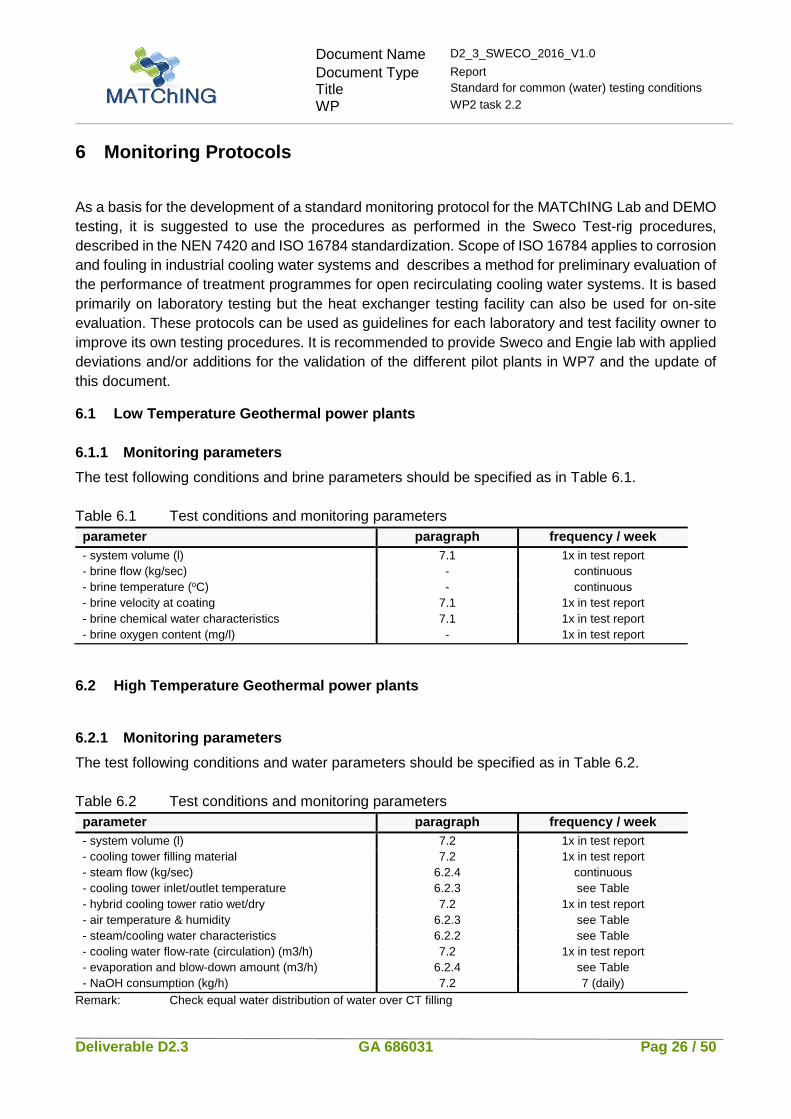
As a basis for the development of a standard monitoring protocol for the MATChING Lab and DEMO testing, it is suggested to use the procedures as performed in the Sweco Test-rig procedures, described in the NEN 7420 and ISO 16784 standardization. Scope of ISO 16784 applies to corrosion and fouling in industrial cooling water systems and describes a method for preliminary evaluation of the performance of treatment programmes for open recirculating cooling water systems. It is based primarily on laboratory testing but the heat exchanger testing facility can also be used for on-site evaluation. These protocols can be used as guidelines for each laboratory and test facility owner to improve its own testing procedures. It is recommended to provide Sweco and Engie lab with applied deviations and/or additions for the validation of the different pilot plants in WP7 and the update of this document.
6.1 Low Temperature Geothermal power plants 6.1.1 Monitoring parameters
The test following conditions and brine parameters should be specified as in Table 6.1. Table 6.1 Test conditions and monitoring parameters parameter paragraph frequency / week - system volume (l) 7.1 1x in test report - brine flow (kg/sec) - continuous - brine temperature (oC) - brine velocity at coating
- 7.1
continuous 1x in test report
- brine chemical water characteristics - brine oxygen content (mg/l)
7.1 -
1x in test report 1x in test report
6.2 High Temperature Geothermal power plants
6.2.1 Monitoring parameters
The test following conditions and water parameters should be specified as in Table 6.2. Table 6.2 Test conditions and monitoring parameters parameter paragraph frequency / week - system volume (l) 7.2 1x in test report - cooling tower filling material 7.2 1x in test report - steam flow (kg/sec) 6.2.4 continuous - cooling tower inlet/outlet temperature 6.2.3 see Table - hybrid cooling tower ratio wet/dry 7.2 1x in test report - air temperature & humidity 6.2.3 see Table - steam/cooling water characteristics 6.2.2 see Table - cooling water flow-rate (circulation) (m3/h) 7.2 1x in test report - evaporation and blow-down amount (m3/h) 6.2.4 see Table - NaOH consumption (kg/h) 7.2 7 (daily)
Remark: Check equal water distribution of water over CT filling

Document Name D2_3_SWECO_2016_V1.0
Document Type Report
Title Standard for common (water) testing conditions
WP WP2 task 2.2
Deliverable D2.3 GA 686031 Pag 27 / 50
6.2.2 Steam / cooling water characteristics
The condensed steam / cooling water used should be characterized as specified in Table 6.3. This Table should be used to record the chemical composition. Table 6.3 Standard documentation and analyse frequencies of condensed steam / circulating
cooling water composition frequency / week No. Component Value Units Steam / cooling water
1 pH pH units Continuous 2 Conductivity µS/cm Continuous 4 Alkalinity * 1 5 NH4+ mg/l 1 6 H2S mg/l 1 7 Hg mg/l 1 8 Turbidity FTU or NTU 1 9 Total Suspended Solids mg/l 1 10 Bacteria CFU/ml or CFU/l 1
Remark * The unit of measurement will depend on the test method 6.2.3 Temperature / humidity measurement
The following temperatures should be measured: Table 6.4 Standard documentation of temperature registration
No. Component Value Units frequency / week 1 - water temperature CT inlet °C Continuous 2 - water temperature CT outfall °C Continuous 3 - ambient relative air humidity air % Continuous 4 - air temperature °C Continuous
6.2.4 Steam feed, evaporation and blow-down measure ment
A means for measuring the mass flow of steam feed, the amounts of evaporation and blow-down water (including minimum, average and maximum values) shall be established and shall be included in the test report. Table 6.5 Standard documentation steam feed, evaporation and blow-down measurement.
No. Component Time Value Units frequency / week 1 - amount steam flow - Kg/sec Continuous 2 - amount blow-down (water meter) - m3/h Continuous 3 - registration blow-down water amount Yes m3/h 7 (daily)
Remark: For accurate water mass balance it is important to register any leakages or sampling amounts.

Document Name D2_3_SWECO_2016_V1.0
Document Type Report
Title Standard for common (water) testing conditions
WP WP2 task 2.2
Deliverable D2.3 GA 686031 Pag 28 / 50
6.2.5 Geothermal cooling tower
The design and heat rejection capacity of the wet and hybrid cooling tower and tower fill shall be reported. Also the dry/wet ratio of the hybrid CT shall be reported. Deposition of salts in the cooling tower may occur depending on the system design and shall be determined see 3.1.5.
6.3 Cooling Tower Systems Thermal Power Plants and Pilot units 6.3.1 Monitoring parameters
The test following conditions and water parameters should be specified as in Table 6.6. Table 6.6 Test conditions and monitoring parameters parameter paragraph Frequency - system volume (l) 7.3 1x in test report - condenser tube material (tube thickness) 7.3 1x in test report - exposed condenser tube length (cm) 7.3 1x in test report - water characteristics 6.3.2 see Table - condenser wall temperature (°C) 6.3.3 see Table - condenser inlet/outlet temperature (°C) 6.3.3 see Table - water velocity condenser tube (m/s) 6.3.4 1x week - water velocity (m/s) / flow-rate (circulation) (m3/h) 6.3.4 1x week - make-up, evaporation and blow-down amount (m3/h) 6.3.5 - concentration factor 7.3 1x in test report
Remark: When important scaling, fouling or corrosion changes occur during the test on tubing or filling, it should be recorded on color photos.
6.3.2 Water characteristics
The water used in the DEMO facility should be characterized as specified in Table 6.7. This Table should be used to record compositions of both the circulating water and the make-up water, or water in front and after a membrane unit, if used. Sample frequency of 1 per week is recommended but is depending on the pilot and the variation in chemical water composition.

Document Name D2_3_SWECO_2016_V1.0
Document Type Report
Title Standard for common (water) testing conditions
WP WP2 task 2.2
Deliverable D2.3 GA 686031 Pag 29 / 50
Table 6.7 Standard documentation and analyse frequencies of make-up and circulating cooling water composition
frequency / week No. Component Value Units make-up water cooling water 1 pH pH units 1 Continuous 2 Conductivity µS/cm 1 Continuous 3 Total hardness * 1 1 4 Alkalinity * 1 1 5 Ca2+ mg/l 1 1 6 Mg2+ mg/l 1 1 7 Na+ mg/l 1 1 8 K+ mg/l 1 1 9 NH4
+ mg/l 1 1 10 Fe2+ mg/l 1 1 11 Cu2+ mg/l 1 1 12 Al3+ mg/l 1 1 13 CO3
2- mg/l 1 1 14 HCO3
- mg/l 1 1 15 Cl- mg/l 1 1 16 SO4
2- mg/l 1 1 17 NO3 - mg/l 1 1 18 PO4 3- mg/l 1 1 19 SiO2 mg/l 1 1 20 Turbidity FTU or NTU 1 1 21 Suspended solids mg/l 1 1 22 Bacteria CFU/ml or CFU/l 1 1 Chemical additions: - code and dosages - concentration and frequency of dosing - dosing amount (litres) - control parameter chemical treatment
- - - -
1x in test report 1x in test report
1 3
Remark * The unit of measurement will depend on the test method
6.3.3 Temperature measurement
In case of a condenser, wall temperature of the metal tubes should be registered continuously by a thermocouple placed between the heater element and the inside of the heat-transfer tube wall, preferably as close to the tube wall as possible. Because of temperature gradients, this measurement will not be fully accurate but will be indicative. More accurate determination would require three thermocouples mounted at varying distances from the tube wall, with the temperature gradient used to determine the temperature at the wall. Other continuous temperature measurements are: • Temperature of recirculating water in front and after the condenser

Document Name D2_3_SWECO_2016_V1.0
Document Type Report
Title Standard for common (water) testing conditions
WP WP2 task 2.2
Deliverable D2.3 GA 686031 Pag 30 / 50
Table 6.8 Standard documentation of temperature measurement No. Component Value Units frequency
1 - wall temperature condenser °C Continuous 2 - water temperature in front of condenser °C Continuous 3 - water temperature after condenser °C Continuous
6.3.4 Water (circulation) flowrate detection
The water (circulation)-rate in cooling tower systems and once-through systems should be measured by using a flow meter in the flow line, either preceding or following the heat exchange tubes. Calculation should me made related to the speed in the condenser tubes. Remark: As a general rule of thumb a speed of 1.0 m/s are held for an S&T heat exchanger as optimum velocity
in order to reduce the tendency of a liquid to form deposits.
6.3.5 Make-up, evaporation and blow-down measuremen t
A means for measuring the mass flow of make-up, the amounts of evaporation and blow-down water (including minimum, average and maximum values) shall be established and shall be included in the test report. In essence, blow-down and make-up rates can be monitored by water meters and the evaporation rate deduced. Measurement frequency is presented in Table 6.9. Chemical feed may be based on blow-down or make-up. Blow-down is normally controlled using the conductivity of the circulating water. Make-up is controlled by a level controller in the cooling-tower basin. Table 6.9 Standard documentation make-up, evaporation and blow-down measurement.
No. Component Time Value Units Frequency / week 1 - amount make-up water (water meter) - m3/h Continuous 2 - registration make-up water amount Yes m3/h 7 (daily) 3 - amount blow-down (water meter) - m3/h Continuous 4 - registration make-up water amount Yes m3/h 7 (daily)
Remark: For accurate water mass balance it is important to register any leakages or sampling amounts.
6.3.6 Cooling tower
The design and heat rejection capacity of the CT and CT fill shall be reported. Deposition of salts in the cooling tower may occur depending on the system design and shall be determined. A visual inspection of the inside of the cooling tower at the end of the test is advised.

Document Name D2_3_SWECO_2016_V1.0
Document Type Report
Title Standard for common (water) testing conditions
WP WP2 task 2.2
Deliverable D2.3 GA 686031 Pag 31 / 50
6.3.7 Membranes
The following membrane parameters should be specified, see Table 6.10. Table 6.10 Standard documentation of membrane parameters (if available).
No. Component Value Units frequency / week 1 Type of membrane (MD; MCDI; MF; RO etc.): 1x in test report (see 7.3) 2 Membrane thickness µm 1x in test report (see 7.3) 3 Membrane surface area m2 1x in test report (see 7.3) 4 Membrane tortuosity - 1x in test report (see 7.3) 5 Membrane pore size µm 1x in test report (see 7.3) 6 Membrane porosity / permeability - 1x in test report (see 7.3) 7 Water viscosity Pa.s 1x in test report (see 7.3) 8 Water temperature to membrane °C Continuous 9 Water flow to membrane m3/h 7
10 Pressure difference over membrane bar Continuous
7 Reporting protocols As a basis for the development of a standard for reporting protocols for the MATChING Lab and DEMO testing, the following items are suggested for reporting. These protocols can be used as guidelines for each laboratory and test facility owner to improve its own testing procedures. It is recommended to provide Sweco and Engie lab with applied deviations and/or additions for the validation of the different pilot plants in WP7 and the update of this document.
7.1 Low Temperature Geothermal power plants The test report for Geothermal (Low T) shall contain at least the following information: • the starting and ending date of the test (exposure period) • description of the facility / location and system volume used • reference to International Standards • new materials and coatings description (mechanical design and manufacturing of probes) • coating exposure parameters (incl. oxygen concentration in the geofluid) • monitoring of the corrosion rate • accurate visual description (incl. pictures) of the scaling, corrosion and fouling, e.g., general
corrosion, pitting, composition of deposit and biomass on coating, if any (in case of no deposition etc. record this also by a picture, see Annex C6
• analysis of physical coating properties (basic characterization).
7.2 High Temperature Geothermal power plants The test report for Geothermal (High T) shall contain at least the following information: • the starting and ending date of the test • description of the facility / location and system volume used • reference to International Standards

Document Name D2_3_SWECO_2016_V1.0
Document Type Report
Title Standard for common (water) testing conditions
WP WP2 task 2.2
Deliverable D2.3 GA 686031 Pag 32 / 50
• the control parameters, chemical water compositions during the test: special attention should be given to deviations of the water quality during the run time of the test (see reference waters Annex B) (incl. oxygen concentration in the geofluid)
• CT(s) design specifications • the design, type and duty of the advanced filling for wet hybrid CT section (pictures) • the design, type and duty of materials and coatings used for the dry hybrid CT section (pictures) • dry/wet ratio of the hybrid cooling tower • the mass flow of steam feed, evaporation and blow-down • new materials and coatings thermal efficacy and resistance against fouling. • period when fouling/scale occurred. • accurate description (incl. pictures) of the scaling, corrosion and fouling, e.g., general corrosion,
pitting, composition of deposit and biomass, if any (in case of no deposition etc. record this also by a picture, see Annex C6 and C7.
7.3 Cooling Tower systems Thermal Power Plants and Pilot units The test report shall contain at least the following information (if applicable): • the starting and ending date of the test • reference to International Standards • the type of water tested and chemical composition • the metal type of the condenser test tubes • the method of heating the test tubes and of measuring the changes in temperature in the test
tube; the tube arrangement; total exposed length and total heated length of the test tube; the cooling water flowrate along and/or through the test tube
• type and number of heat exchangers and test tubes including duty and local heat flux • the mass flow of make-up, evaporation and blow-down • the design, type and duty of the CT and CT fill (picture). • Characterization of membrane performance (l/m2.bar) • the control parameters, water compositions during the test: special attention should be given to
deviations of the water quality during the run time of the test • concentrations, amount and frequency of chemical treatment additive used expressed in
milligrams per liter (mg/l), per quantity of blow-down water. • chemicals, equipment, and test methods used to inhibit or activate biofilm formation, including
bacterial counts. • Cooling water amount over the membrane (m3/h) • Membrane water flux (m3/m2.h), transmembrane pressure and total membrane resistance. • Periods of Membrane backwashing, backwashing product (water/air) (when relevant) • Type, amount and frequency of chemicals used for advanced backwashing or ‘Cleaning in
Place’. • period when fouling/scale occurred. • accurate description (incl. pictures) of the scaling, corrosion and fouling, e.g., general corrosion,
pitting, composition of deposit and biomass, if any (in case of no deposition etc. record this also by a picture, see Annex C5, C6, C7 and C8.
•••• membrane autopsy (when relevant).

Document Name D2_3_SWECO_2016_V1.0
Document Type Report
Title Standard for common (water) testing conditions
WP WP2 task 2.2
Deliverable D2.3 GA 686031 Pag 33 / 50
LIST OF TABLES
Number Name Page nr. in document
Table 2.1 Minimal water composition used during laboratory phase Table 2.2 Water used during tests on Pilot scale and Demo sites Table 3.1 Merades unit main components and parameters Table 3.2 Pericles facility main components and parameters Table 3.3 TRHyCo facility main components and parameters Table 3.4 Mistral facility main components and parameters Table 3.5 Sweco Test-rig facility main components and parameters Table 3.6 Overview of monitoring systems Tabel 5.1 Chemical composition of Balmatt geofluid and main opeating
parameters
Table 5.2 Chemical composition of CT water at Nuova San Martino geothermal plant and main opeating parameters
Table 5.3 The subtask 5.1.2 standard chemical composition of demi water and operating parameters for representative testing
Table 5.4 The subtask 5.1.3 standard chemical composition of demi water and cooling water and operating parameters for representative testing
Table 5.5 The subtask 5.2.3 and 5.3.2 standard chemical composition of cooling water and operating parameters for representative testing
Table 5.6 The subtask 5.2.3 and 5.3.2 standard chemical composition of cooling water and operating parameters for representative testing
Table 5.7 The subtask 6.1.3 standard chemical composition of intake water and operating parameters for representative testing
Table 5.8 The subtask 6.3.3 standard chemical composition of cooling water and operating parameters for representative testing
Table 5.9 The subtask 6.6.2 standard chemical composition of cooling water and operating parameters for representative testing
Table 6.1 Test conditions and monitoring parameters for low temperature geothermal fluids
Table 6.2 Test conditions and monitoring parameters for high temperature geothermal fluids
Table 6.3 Standard documentation and analyse frequencies of condensed steam / circulating cooling water composition
Table 6.4 Standard documentation of temperature registration Table 6.5 Standard documentation steam feed, evaporation and blow-down
measurement
Table 6.6 Test conditions and monitoring parameters for cooling tower systems thermal power plants and pilot units
Table 6.7 Standard documentation and analyse frequencies of make-up and circulating cooling water composition
Table 6.8 Standard documentation of temperature measurement Table 6.9 Standard documentation make-up, evaporation and blow-down
measurement
Table 6.10 Standard documentation of membrane parameters

Document Name D2_3_SWECO_2016_V1.0
Document Type Report
Title Standard for common (water) testing conditions
WP WP2 task 2.2
Deliverable D2.3 GA 686031 Pag 34 / 50
LIST OF FIGURES
Number Name Page nr. in document
Figure 1 Overview of MATChING work plan Figure 2 Schematic of MATChING overall approach Figure 3 Overview of Merades II pilot unit of Engie Lab Figure 4 Overview of the Pericles facility of EdF Laboratories Figure 5 Overview of the TRHyCo facility of EdF Laboratories Figure 6 Overview of the Mistral facility of EdF Laboratories Figure 7 Overview of Test-Rig facility of Sweco Nederland BV Figure 8 Overview of the Balmatt Geothermal site Figure 9 Nuova San Martino power plant and CT that will be retrofitted Figure 10 Schematic configuration of a dry steam Geothermal power plant Figure 11 Brindisi Sud (Federico II) thermal power plant Figure 12 As Pontes thermal power plant
8 References
Dutch Standard NEN 7420 – Industrial cooling water. A ssessment of the performance of treatment programmes under standard conditions, Nederlandse Norm. Dutch Standard NEN-EN-ISO 16784-2 “Corrosion of metals and alloys - Corrosion and fouling in industrial cooling water systems – Part 2: Evaluation of the performance of cooling water treatment programmes using a pilot-scale test rig (ISO 16784-2:2006,IDT) International Standard ISO 11463:1995 - Corrosion of metals and alloys -- Evaluation of pitting corrosion, first edition. 1995-1 2-15. ISO 7393/2 (water quality - determination of free chlorine and total chlorine - Part 2: Colorimetric method using N,N-diethyl-1,4-phenylenediamine (DPD) sulphate, for routine control purposes) which describes an FO and TRO determination which operates in accordance with a colorimetric assay using DPD. This measurement takes place at a wavelength of 510 nm

Document Name D2_3_SWECO_2016_V1.0
Document Type Report
Title Standard for common (water) testing conditions
WP WP2 task 2.2
Deliverable D2.3 GA 686031 Pag 35 / 50
ANNEX A Appropriate Monitors and Equipment (partners can add their own equippment)
parameter range desciption pH 0 to 16 pH
Accuracy: pH input : ≤ 0.01 pH. ORP input : ≤ 1 mV. Temperature : ≤ 0.3ºC
Yokogawa Model PH450G: is a multivariable analyzer that combines pH with Temperature and ORP (Redox) Measurement pH and Redox (ORP) Converter. - Polilyte PRO VP 120: Suitable for samples containing solids, bacteria or sludge as well as normal drinking water. Stable measurement in low-conductive solutions. Suitable for process temperatures from -10°C up to 60°C. Built-inn temperature sensor (VP version); Maximum pressure: 6 bar - Mecotrode (VP): Additional characteristics; Specially suitable for applications with a higher pH or higher Temperatures (Maximum: 6 bar at 130ºC; Maximum: 16 bar at 25°C)
pH -2.00 to 16.00 pH -1000 to 1000 mV / 0 to 100.0 % -9.9 to 125.0 ºC Accuracy: ±0.01 pH ±1 mV / ±0.2 % ±0.5 ºC
- Eutech Instruments (Thermo Scientific) Alpha pH 1000 pH/ORP Controller/ Transmitter: The Alpha pH 1000 controllers/transmitters combines consistent performance and sophisticated control functions with user-friendly features.
Conductivity 1 µS/cm – 2,000 mS/cm Resistivity : 0.0 Ω•cm - 1000 MΩ•cm (Min: 5Ω / c.c. / Max: 1MΩ / c.c.)
Yokogawa (EXAxt) SC450G : is a converter designed for industrial process monitoring, measurement and control applications. The EXAxt converter is intended to be used for continuous on-line measurement of Conductivity, Resistivity and/or Concentration in industrial installations. The unit combines simple operation and microprocessor-based performance with advanced self-diagnostics and enhanced communications capability to meet the most advanced requirements. The measurement can be used as part of an automated process control system. It can also be used to indicate operating limits of a process, to monitor product quality, or to function as a controller for a dosing/dilution system. Accuracy: Conductivity/resistivity : ≤ 0.5 % of reading Temperature : ≤ 0.3 ºC (≤ 0.4 ºC for Pt100) Environment and operational conditions: Ambient temperature : -20 to +55 ºC Storage temperature : -30 to +70 ºC Humidity : 10 to 90% RH at 40 ºC (non-condensing)
Total Alkalinity (TA)
Applikon Analytical ADI 2040 Process Analyzer
Total Anorganic Carbon (TAC)
Applikon Analytical ADI 2040 Process Analyzer
Turbidity
HACH Rato Turbidimeter: the Hach Model 18900 Ratio Turbidimeter is a laboratory nephelometer capable of measuring turbidities up to 199 Nephelometer Turbidity Units (NTU) even in colored samples.
Conductivity 0.04 µS/cm – 2,500 mS/cm Accuracy: with temperature compensation < 0.5% of measured value
Hach Lange SIPAN 32 Liquid analyser • 2EL sensor: used to measure the conductivity of ultra-pure water and highly diluted aqueous solutions from 0.04 µS/cm to 25 000 µS/cm.

Document Name D2_3_SWECO_2016_V1.0
Document Type Report
Title Standard for common (water) testing conditions
WP WP2 task 2.2
Deliverable D2.3 GA 686031 Pag 36 / 50
(for pure liquids) • 4EL sensor: used in media of average conductivity from 0.01 mS/cm to 500 mS/cm. • IND sensor: used to measure the conductivity of small to very high values from 1 µS/cm to approx. 2 500 mS/cm.
pH / redox 0 to 15 pH -2000 to 2000 mV
Hach Lange SIPAN 32 Liquid analyser
pH / ORP -2 to 20 pH
-1000 to 2000 mV (-5,0 to 105,0 grC) Accuracy: ± 0.004 pH -1000 to +1000 = ± 0.2 mV - 2000 to + 2000 = ± 1 mV
WTW Universal Pocket Meter Multi 350i
WTW Universal Pocket Meter Multi 350i

Document Name D2_3_SWECO_2016_V1.0
Document Type Report
Title Standard for common (water) testing conditions
WP WP2 task 2.2
Deliverable D2.3 GA 686031 Pag 37 / 50
ANNEX B Questionnaire information Power Plants
B1. Water/steam Standard
Following is based on water/steam guidelines for high pressure (once-through) boilers.
Guidelines Operational conditions
Parameter Value Range (min/max)
Value Range (min/max)
Process water (water/steam)*** Steam quality (cation conductivity in µS/cm) < 0.15 Steam quality (specific conductivity in µS/cm) 2.5 – 4.5 Steam quality – volatile compound concentration (ammonia ppm)****
0.03 – 0.05
Steam – oxygen content (ppb) < 20 Steam - Na content (ppb) < 1 Steam - SiO2 content (ppb) < 10 Steam - pH 9.0 - 9.2 +/- 0.2, 0.4 and
1.0***
Condensate quality based on AVT conditioning (cation conductivity in µS/cm)
< 0.15 < 0.20**
Condensate quality (specific conductivity in µS/cm) 2.5 – 4.5 Condensate Na content (ppb) < 1* Condensate pH value > 9.2 Condensate SiO2 content (ppb) < 10 Condensate TOC content (ppb) < 50
* depending on pressure of boiler ** alarm levels *** assumption is that the chemical conditioning is based on All Volatile Treatment for once through
boilers. Oxygenated Treatment requires more stringent values on condensate/steam quality. **** distribution ratio from (liquid) water to steam is 10, thus the NH3 concentrations in liquid water is 0.3 to
0.5 mg/kg.

Document Name D2_3_SWECO_2016_V1.0
Document Type Report
Title Standard for common (water) testing conditions
WP WP2 task 2.2
Deliverable D2.3 GA 686031 Pag 38 / 50
B2. As Pontes Power Plant (ENDESA) GENERAL INFORMATION
Site name: As Pontes Power Plant
Location: Puente’s de Garcia Rodriguez, La Coruna (Spain)
Type of plant:
(geothermal (High T/ Low T) / power plant / test facility)
Power Plant
Surface water type:
(sea / brackish / fresh water)
Fresh water (river Eume)
Type of cooling water system:
(once-through / recirculation with cooling tower)
Recirculation with cooling tower
DESIGN SPECIFICATIONS & OPERATIONAL PARAMETERS Parameter Value Range (min / max) Remark: minimum values at minimum load (195 MW in winter, maximum values at maximum load (350 MW) in summer) Cooling water:
- Cooling water flow in (m3/h) (make up) 1,040 - Cooling water flow out (m3/h) (blow down) 350 Remark: High blowdown because of this water is used for bottom ash cooling in boiler (open circuit) - Cooling water recirculation flow (m3/h) 38,000 - Delta-T (oC) 11 5 - 12 - Water temperature before condenser (oC) 24 15 - 29 - Water temperature after condenser (oC) 35 20 - 41 - Condenser skin temperature (oC) 38 26 - 44 - Side stream filtration (yes /no) No - Velocity along tubing (m/s) - 1.5 – 2.5 Process water (water/steam): - Operating pressure (bar) 169 Remark: Operating pressure, operating temperature and steam flow of superheated steam at boiler outlet - Condenser pressure (mbar) 68 35 - 95 - Steam flow at operating load(kg/sec) 285 Remark: Steam flow at high pressure steam turbine inlet. Steam flow at condenser is lower than this value. - Operating Temperature 540 - Conditioning agent for steam (AVT, OT etc.) Ammonia - Conditioning agent for drum (solid alkalizer) None
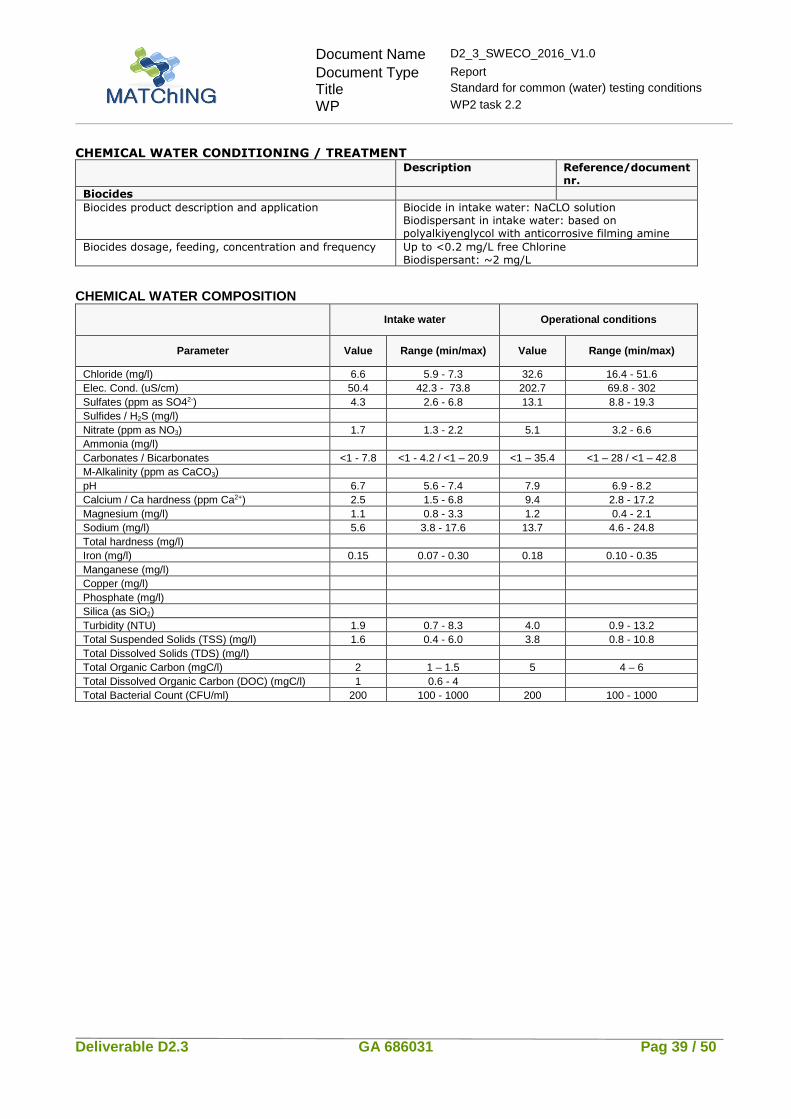
Document Name D2_3_SWECO_2016_V1.0
Document Type Report
Title Standard for common (water) testing conditions
WP WP2 task 2.2
Deliverable D2.3 GA 686031 Pag 39 / 50
CHEMICAL WATER CONDITIONING / TREATMENT Description Reference/document
nr.
Biocides
Biocides product description and application Biocide in intake water: NaCLO solution Biodispersant in intake water: based on polyalkiyenglycol with anticorrosive filming amine
Biocides dosage, feeding, concentration and frequency Up to <0.2 mg/L free Chlorine Biodispersant: ~2 mg/L
CHEMICAL WATER COMPOSITION
Intake water Operational conditions
Parameter Value Range (min/max) Value Range (min/max)
Chloride (mg/l) 6.6 5.9 - 7.3 32.6 16.4 - 51.6 Elec. Cond. (uS/cm) 50.4 42.3 - 73.8 202.7 69.8 - 302 Sulfates (ppm as SO42-) 4.3 2.6 - 6.8 13.1 8.8 - 19.3 Sulfides / H2S (mg/l) Nitrate (ppm as NO3) 1.7 1.3 - 2.2 5.1 3.2 - 6.6 Ammonia (mg/l) Carbonates / Bicarbonates <1 - 7.8 <1 - 4.2 / <1 – 20.9 <1 – 35.4 <1 – 28 / <1 – 42.8 M-Alkalinity (ppm as CaCO3) pH 6.7 5.6 - 7.4 7.9 6.9 - 8.2 Calcium / Ca hardness (ppm Ca2+) 2.5 1.5 - 6.8 9.4 2.8 - 17.2 Magnesium (mg/l) 1.1 0.8 - 3.3 1.2 0.4 - 2.1 Sodium (mg/l) 5.6 3.8 - 17.6 13.7 4.6 - 24.8 Total hardness (mg/l) Iron (mg/l) 0.15 0.07 - 0.30 0.18 0.10 - 0.35 Manganese (mg/l) Copper (mg/l) Phosphate (mg/l) Silica (as SiO2) Turbidity (NTU) 1.9 0.7 - 8.3 4.0 0.9 - 13.2 Total Suspended Solids (TSS) (mg/l) 1.6 0.4 - 6.0 3.8 0.8 - 10.8 Total Dissolved Solids (TDS) (mg/l) Total Organic Carbon (mgC/l) 2 1 – 1.5 5 4 – 6 Total Dissolved Organic Carbon (DOC) (mgC/l) 1 0.6 - 4 Total Bacterial Count (CFU/ml) 200 100 - 1000 200 100 - 1000

Document Name D2_3_SWECO_2016_V1.0
Document Type Report
Title Standard for common (water) testing conditions
WP WP2 task 2.2
Deliverable D2.3 GA 686031 Pag 40 / 50
CHEMICAL WATER/STEAM COMPOSITION Guidelines (see Annex B1) Operational conditions Parameter Value Range (min/max) Value Range (min/max)
Steam Quality (Cation conductivity in µS/cm) < 0.15 0.25 0.2 – 0.30
Steam Quality (Degassed Cation Conductivity µS/cm)
0.07 0.06 – 0.15
Steam Quality (specific conductivity in µS/cm)
2.5 – 4.5 7 6.8 – 7.2
Steam quality – volatile compound concentration (ammonia ppm)****
0.03 – 0.05 1 0.9 – 1.1
Steam – oxygen content (ppb) < 20 5 0 - 10
Condensate quality (cation conductivity in µS/cm)
0.25 0.15 - 0.30
Condensate quality (specific conductivity in µS/cm)
2.5 – 4.5 7 6.8 – 7.2
Condensate Na content (ppb) < 1 0.1 0.1 – 0.3
Condensate pH > 9.2 9.4 9.3 – 9.5
Condensate SiO2 content (ppb) < 10 3 2 - 10
Condensate TOC content (ppb) < 50 5 3 - 15
TOC in make-up : 40 30 - 300

Document Name D2_3_SWECO_2016_V1.0
Document Type Report
Title Standard for common (water) testing conditions
WP WP2 task 2.2
Deliverable D2.3 GA 686031 Pag 41 / 50
B3. Brindisi Power Plant (ENEL) GENERAL INFORMATION
Site name: Federico II Power Plant
Location: Brindisi - Italy
Type of plant: (geothermal (High T/ Low T) / power plant / test facility)
Coal Power Plant
Surface water type: (sea / brackish / fresh water)
Fresh water (Flue gas desulphurization (FGD) unit
Type of cooling water system: (once-through / recirculation with cooling tower)
Once-through
WASTEWATER – FGD PURGE
Parameter Value Range (min / max)
Flow rate – m3/h 70 35 - 70
Remark: FGD purge after a physical-chemical treatment and softening is routed to the brine concentrator. The brine obtained is then routed to the crystallizer
Brine production amount (m3/h) 10.5 5 - 10.5
Brine extraction temperature (oC) 115
Chloride (mg/l) 5148.5 3000 - 30000
Elec. Cond. (uS/cm) 27610 20000 - 50000
Sulfates (ppm as CaCO3) 11144 4000 - 12000
Nitrate (ppm as NO3) 185 30 - 300
Ammonia (mg/l) 11.6 10 - 20
Carbonates / Bicarbonates 35
M-Alkalinity (ppm as CaCO3) 28.68
pH 6.5
Calcium / Ca hardness 345 20 - 450
Magnesium (mg/l) 336.6 50 - 350
Sodium (mg/l) 6482 5000 - 30000
Total hardness (mg/l) 716.60
Iron (mg/l) < 0.004
Manganese (mg/l) < 0.001
Copper (mg/l) 0.05769
Silica (as SiO2) 1.4 10
Turbidity (NTU) 1.63

Document Name D2_3_SWECO_2016_V1.0
Document Type Report
Title Standard for common (water) testing conditions
WP WP2 task 2.2
Deliverable D2.3 GA 686031 Pag 42 / 50
B4. Knippegroen Power Plant (ENGIE) GENERAL INFORMATION
Site name: Knippegroen Power Plant
Location: Knippergroen Belgie
Type of plant:
(geothermal (High T/ Low T) / power plant / test facility)
Power Plant
Surface water type:
(sea / brackish / fresh water)
Fresh water
Type of cooling water system:
(once-through / recirculation with cooling tower)
Recirculation with cooling tower
CHEMICAL WATER COMPOSITION
Intake water Operational conditions
Parameter Value Range (min/max) Value Range (min/max)
Cycles of concentration (COC) = 1.3
Chloride (mg/l) 140 100 – 175 180 130 – 225 Elec. Cond. (uS/cm) 1100 1000 – 1500 1400 1300 – 2000 Sulfates (ppm as SO42-) Sulfides / H2S (mg/l) Nitrate (ppm as NO3) Ammonia (mg/l) Carbonates / Bicarbonates M-Alkalinity (ppm as CaCO3) 260 250 - 270 200 150 – 250 pH 7.5 7.3 - 7.8 8.3 8.2 - 8.5 Calcium / Ca hardness (ppm Ca2+) 325 310 - 340 450 400 – 500 Magnesium (mg/l) Sodium (mg/l) Total hardness (mg/l) 390 350 - 430 500 450 – 550 Iron (mg/l) Manganese (mg/l) Copper (mg/l) Phosphate (mg/l) Silica (as SiO2) Turbidity (NTU) Total Suspended Solids (TSS) (mg/l) Total Dissolved Solids (TDS) (mg/l) Total Organic Carbon (mg/l) Total Bacterial Count (CFU/ml)

Document Name D2_3_SWECO_2016_V1.0
Document Type Report
Title Standard for common (water) testing conditions
WP WP2 task 2.2
Deliverable D2.3 GA 686031 Pag 43 / 50
B5. Drogenbos Power Plant (ENGIE) GENERAL INFORMATION
Site name: Drogenbos Power Plant
Location: Drogenbos Belgie
Type of plant:
(geothermal (High T/ Low T) / power plant / test facility)
Power Plant
Surface water type:
(sea / brackish / fresh water)
Fresh water
Type of cooling water system:
(once-through / recirculation with cooling tower)
Recirculation with cooling tower
CHEMICAL WATER COMPOSITION
Intake water Operational conditions
Parameter Value Range (min/max) Value Range (min/max)
Cycles of concentration (COC) = 1.6
Chloride (mg/l) 70 35 – 170 110 50 – 300 Elec. Cond. (uS/cm) 800 500 – 1500 1200 800 – 2000 Sulfates (ppm as SO42-) 100.5 48.3 - 131.5 161 77.3 - 210 Sulfides / H2S (mg/l) Nitrate (ppm as NO3) 4.3 3.0 - 5.5 6.9 4.8 – 8.8 Ammonia (mg/l) Carbonates / Bicarbonates M-Alkalinity (ppm as CaCO3) 220 180 - 300 130 80 – 200 pH 7.8 7.5 - 8.2 8.3 8.2 - 8.5 Calcium / Ca hardness (ppm Ca2+) 250 150 - 300 350 200 – 500 Magnesium (mg/l) Sodium (mg/l) Total hardness (mg/l) 300 150 - 400 480 225 – 700 Iron (mg/l) 4.4 1.8 - 12 Manganese (mg/l) Copper (mg/l) Phosphate (mg/l) 1.5 0.3 – 4.1 2.4 0.5 – 6.6 Silica (as SiO2) Turbidity (NTU) Total Suspended Solids (TSS) (mg/l) Total Dissolved Solids (TDS) (mg/l) Total Organic Carbon (mg/l) 26.9 8 - 70 Total Bacterial Count (CFU/ml)

Document Name D2_3_SWECO_2016_V1.0
Document Type Report
Title Standard for common (water) testing conditions
WP WP2 task 2.2
Deliverable D2.3 GA 686031 Pag 44 / 50
B6. Standard synthetic cooling water composition a s used in NEN 7420 CHEMICAL WATER COMPOSITION
Intake
water
Operational conditions
Parameter Value Range (min/max) Value Range (min/max)
Cycles of concentration (COC) = 2.5
Chloride (mg/l) 200 500 Elec. Cond. (uS/cm) Sulfates (ppm as SO42-) 58 145 Sulfides / H2S (mg/l) Nitrate (ppm as NO3) 3.5 8.8 Ammonia (mg/l) 0.12 Carbonates CO32- 30 M-Alkalinity (ppm as CaCO3) HCO3- 305 pH Calcium (mg/l) 80 200 Magnesium (mg/l) 8 20 Sodium (mg/l) 108 270 Potassium (mg/l) 2.8 6.9 Total hardness (mg/l) Iron (mg/l) Manganese (mg/l) Copper (mg/l) Phosphate (mg/l) 1.1 Silica (as SiO2) 6.9 Turbidity (NTU) Total Suspended Solids (TSS) (mg/l) Total Dissolved Solids (TDS) (mg/l) Total Organic Carbon (mg/l) Total Bacterial Count (CFU/ml)
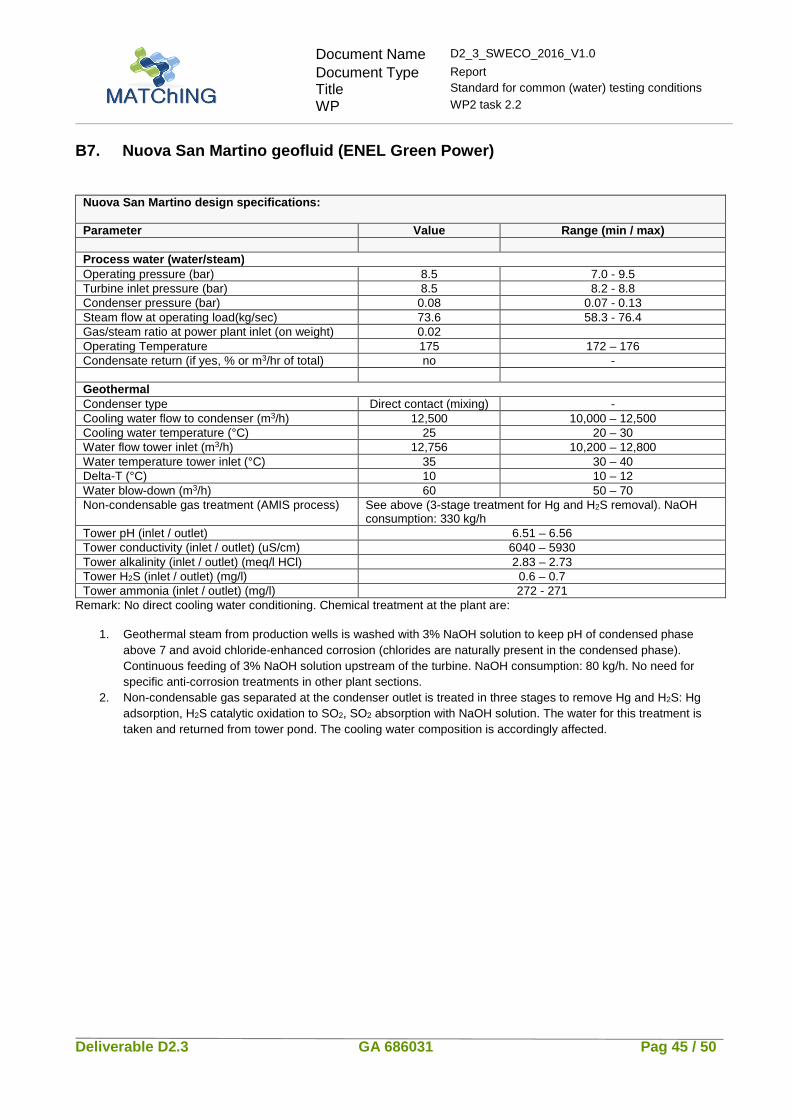
Document Name D2_3_SWECO_2016_V1.0
Document Type Report
Title Standard for common (water) testing conditions
WP WP2 task 2.2
Deliverable D2.3 GA 686031 Pag 45 / 50
B7. Nuova San Martino geofluid (ENEL Green Power)
Nuova San Martino design specifications: Parameter Value Range (min / max) Process water (water/steam) Operating pressure (bar) 8.5 7.0 - 9.5 Turbine inlet pressure (bar) 8.5 8.2 - 8.8 Condenser pressure (bar) 0.08 0.07 - 0.13 Steam flow at operating load(kg/sec) 73.6 58.3 - 76.4 Gas/steam ratio at power plant inlet (on weight) 0.02 Operating Temperature 175 172 – 176 Condensate return (if yes, % or m3/hr of total) no - Geothermal Condenser type Direct contact (mixing) - Cooling water flow to condenser (m3/h) 12,500 10,000 – 12,500 Cooling water temperature (°C) 25 20 – 30 Water flow tower inlet (m3/h) 12,756 10,200 – 12,800 Water temperature tower inlet (°C) 35 30 – 40 Delta-T (°C) 10 10 – 12 Water blow-down (m3/h) 60 50 – 70 Non-condensable gas treatment (AMIS process) See above (3-stage treatment for Hg and H2S removal). NaOH
consumption: 330 kg/h Tower pH (inlet / outlet) 6.51 – 6.56 Tower conductivity (inlet / outlet) (uS/cm) 6040 – 5930 Tower alkalinity (inlet / outlet) (meq/l HCl) 2.83 – 2.73 Tower H2S (inlet / outlet) (mg/l) 0.6 – 0.7 Tower ammonia (inlet / outlet) (mg/l) 272 - 271
Remark: No direct cooling water conditioning. Chemical treatment at the plant are:
1. Geothermal steam from production wells is washed with 3% NaOH solution to keep pH of condensed phase above 7 and avoid chloride-enhanced corrosion (chlorides are naturally present in the condensed phase). Continuous feeding of 3% NaOH solution upstream of the turbine. NaOH consumption: 80 kg/h. No need for specific anti-corrosion treatments in other plant sections.
2. Non-condensable gas separated at the condenser outlet is treated in three stages to remove Hg and H2S: Hg adsorption, H2S catalytic oxidation to SO2, SO2 absorption with NaOH solution. The water for this treatment is taken and returned from tower pond. The cooling water composition is accordingly affected.

Document Name D2_3_SWECO_2016_V1.0
Document Type Report
Title Standard for common (water) testing conditions
WP WP2 task 2.2
Deliverable D2.3 GA 686031 Pag 46 / 50
ANNEX C Test Procedures mentioned in Dutch Standard NEN 7420 This paragraph describes the general procedures as mentioned in the Dutch Standard NEN-EN-ISO 16784-2 “Corrosion of metals and alloys - Corrosion and fouling in industrial cooling water systems – Part 2: Evaluation of the performance of cooling water treatment programmes using a pilot-scale test rig (ISO 16784-2:2006,IDT). These procedures can be used as guidelines for each laboratory and test facility owner to improve its own procedures. C1. Cleaning of the test assembly / module Before starting a test, the test assembly / module shall be cleaned in order to prevent contamination with products from a possible previous test or undesirable microbiological fouling. The following cleaning solutions are suggested, see Table C1.1. Table C1.1 Standard cleaning procedure test assembly before starting a test. Step no. Description
1 flushing with tap water 2 flushing out with hypochlorite solution to remove slime formation 3 flushing out with sulfamic acid or citric acid and EDTA solution to remove iron and/or calcium
deposits 4 flushing with demineralized water and neutralize pH 5 flush again with demineralized water until the pH is neutral
Remark: The use of demineralized water is recommended because tap water can have significant hardness.
C2. Test tube preparation The surface state of the metal condenser tubes under test will have a significant influence on corrosion and fouling. The method of surface preparation shall ensure good repeatability and the surface shall be free of artefacts from the preparation process, see Table C2.1. Table C2.1 Standard pre-treatment and preparation procedure for the stainless steel test tubes. Step no. Description
1 Measure and record the length, thickness of the test tubes 2 Degrease the test tubes internally and externally with acetone (99.5% purity) 3 Subsequently, blast-clean the test tubes externally with abrasive to preparation grade Sa3 (in
accordance with ISO 8501-1) and to a roughness, Ra, of approximately 2,5 µm. Alternatively, abrade using SiC paper of grade P400
4 Clean the test tubes by blowing with compressed air (oil-free) and weigh, to at least an accuracy of 0,01 g, and install them in the heat exchanger
5 If possible: record the mass of each test tube in the report. Remark: In case of using coated test tubes it is recommended to use carbon steel as base material.
C3. Test duration A test duration of 500 +/- 10 hours ( i.e. approximately 21 days) is recommended for representative testing in the NEN 7420 documentation.

Document Name D2_3_SWECO_2016_V1.0
Document Type Report
Title Standard for common (water) testing conditions
WP WP2 task 2.2
Deliverable D2.3 GA 686031 Pag 47 / 50
C4. Mitigation of micro fouling during testing During the MATChING testing, increased micro fouling levels should be mitigated by dosing of sodium hypochlorite solution (150 g/l active chlorine content). This if cooling water microbial content increases 100,000 cfu/ml or intake water microbial content increases 10,000 cfu/ml. For mitigation hypochlorite solution should be dosed in such a way that 30 minutes after stopping the dosing the content of free chlorine is 0,2 mg/l to 1,0 mg/l. The total dosed quantity of chlorine shall be at least 0,5 mg/l. During dosing, the concentration of free chlorine shall not exceed 2 mg/l; this in order to prevent excessive oxidation of the added substances and corrosion of materials. The dosing shall not take longer than one (1) hour. C5. Assessment of results on deposition and fouling on condenser tubing For the scale deposition and fouling assessment on the condenser tubes, the following protocol is suggested, see Table C5.1. Table C5.1 Standard procedure for assessment of results on deposition and fouling on condenser
tubing. Step no. Description
1 Remove test tubes from the test assembly while they are still wet. Describe and photograph (color) the wet tubes and rinse with distilled water, then carefully place them in a drying oven for a period of 24 hour at about 105°C.
2 Take a photograph of the dry test tubes and make a print showing the tubes at least at 1/3 real size. Study the photo and record; if thought necessary, any details on the fouling.
3 Scrape the deposits from one test tube using a plastic knife (from a fixed determined surface). Determine the mass and loss in mass of the scraped off deposits at 600 °C and at 900 °C (loss on ignition) and perform a semi-quantitative analysis on the ash residue remaining by X-ray fluorescence (XRF) or an equivalent method. Record the results (loss in mass on ignition and content of MgO, Al2O3, SiO2, P2O5, SO3, Cl, K2O, CaO, Cr2O3, MnO, Fe2O3, NiO, CuO, ZnO, MoO3, as needed).
C6. Assessment of result on corrosion on materials / condenser tubing For the corrosion assessment on materials / coatings / condenser tubes, the following protocol is suggested, see Table C6.1. Table C6.1 Standard procedure for assessment of result on corrosion on materials / condenser
tubing. Step no. Description
1 Remove test materials / tubes from the test assembly while they are still wet. Describe and photograph (color) the wet tubes and rinse with distilled water, then carefully place them in a drying oven for a period of 24 hour at about 105°C.
2 Take a photograph of the dry materials or test tubes and assess the corrosion phenomena by visual inspection and describe the type of corrosion. Where appropriate, describe type(s) (e.g., uniform, pitting or patchy corrosion), distribution and maximum depth of local corrosion on the tubes.
Remark: Corrosion of metal in aerated aqueous systems is often of the "pitting" type. Measurement of the pitting depth will therefore give information that is very useful in practice, although the pit growth is not linear in time. Assess the extent of corrosion by determining the maximum pitting depth of tubes, by measurement with a needle-type depth gauge for example (see ISO 11463 or Annex D).

Document Name D2_3_SWECO_2016_V1.0
Document Type Report
Title Standard for common (water) testing conditions
WP WP2 task 2.2
Deliverable D2.3 GA 686031 Pag 48 / 50
C7. Assessment of results on deposition and foulin g on cooling tower fill For the scale deposition and fouling assessment on the cooling tower fill, the following protocol is suggested, see Table C7.1. Table C7.1 Standard procedure for assessment of results on deposition and fouling on cooling
tower fill. Step no. Description
1 Remove cooling tower filling from the cooling tower (if possible) and describe, photograph (color) the wet filling.
2 Allow the filling to air dry into a container and photograph (color) the dry filling. 3 Shake deposits from the filling (from a fixed determined surface) into the container or scrape
the deposits from the filling using a plastic knife. Determine the mass and loss in mass of the deposits at 600 °C and at 900 °C (loss on ignition) and perform a semi-quantitative analysis on the ash residue remaining by X-ray fluorescence (XRF) or an equivalent method. Record the results (loss in mass on ignition and content of MgO, Al2O3, SiO2, P2O5, SO3, Cl, K2O, CaO, Cr2O3, MnO, Fe2O3, NiO, CuO, ZnO, MoO3, as needed).
C8. Assessment of results on deposition and fouling on membranes For the scale deposition and fouling assessment on membrane elements, evaluation by comparison of clean water flux before and after test and by following flux and pressure during tests is recommended. Membrane autopsy as mentioned in the following protocol, see Table C8.1, is recommended for fouling type determination. Table C8.1 Standard procedure for assessment of results on deposition and fouling on
membranes. Step no. Description
1 A membrane element autopsy is best done as soon as possible after the element has been removed from service.
2 An element being autopsied that is likely to contain some biocide should be thoroughly rinsed with water to remove the biocide, provided that this rinsing is not likely to remove or displace the kind of material which the autopsy is intended to find.
3 To remove excess water, let the element stand in the vertical position and drain for about 30 minutes. In a particularly dry ambience a plastic cover may be placed over the top of the element to prevent excessive drying of the membrane surfaces
4 Removal carefully the hard shell from the element and note which end of the element is the feed end.
5 Examine the element and membrane leaves carefully. Check surfaces for deposits of scale or organic growth. Samples should be taken of any unusual deposits. Note the condition of all visible components, particularly any unusual features, in the autopsy record. In some cases, the absence of visible features may be the most important observation.
6 Carefully taken photographs are good for documentation of unusual observations. However, considerable photographic skill is required to deal with the common problems of poor lighting, low contrast, and glare from wet surfaces.
7 Identify chemical composition of scale deposits and perform biological analysis.
ANNEX D Test Procedures for Coating Characterizatio n and Corrosion evaluation

Document Name D2_3_SWECO_2016_V1.0
Document Type Report
Title Standard for common (water) testing conditions
WP WP2 task 2.2
Deliverable D2.3 GA 686031 Pag 49 / 50
This paragraph describes the standard procedures for Coating Characterization and Corrosion evaluation. These procedures can be used as guidelines for each laboratory and test facility owner to improve its own procedures.
Basic coating characterization
- Adhesion: ISO 2409:2007 and ISO 4624:2002
- Hardness: ISO 15184
- Wettability (surface energy): ISO 4624
- Wet adhesion: ASTM D870, DIN EN 14879-1 and ISO 4624:2002
- Mock Up test ASTM E 1068-85 (immersion)
Corrosion evaluation
- Sample preparation ASTM G1
- Electrochemical techniques: - ASTM G3-14: “Standard practice for conventions applicable to electrochemical measurements in corrosion testing”
- ASTM G15-07: “Standard terminology relating to corrosion and corrosion testing”
- Linear Polarization Measurements - ASTM G5-14: “Standard reference test method for making potentiostatic and potentiodynamic anodic polarization measurement”
- ASTM G59-97 (2014): “Standard reference test method for making potentiodynamic polarization resistance measurement”
- ASTM G102-89 (2015): “Standard practice for calculation rates and related information from electrochemical measurement”
- Electrochemical Impedance Spectroscopy measurements
- UNE-EN -ISO 16773-1: Paint and varnishes.
Electrochemical impedance spectroscopy (EIS) on high
impedance coated specimens. Part 1: Terms and
definitions

Document Name D2_3_SWECO_2016_V1.0
Document Type Report
Title Standard for common (water) testing conditions
WP WP2 task 2.2
Deliverable D2.3 GA 686031 Pag 50 / 50
- UNE-EN -ISO 16773-2: Paint and varnishes.
Electrochemical impedance spectroscopy (EIS) on high
impedance coated specimens. Part 2: Collection of data
- UNE-EN -ISO 16773-3: Paint and varnishes.
Electrochemical impedance spectroscopy (EIS) on high
impedance coated specimens. Part 3: Processing and
analysis of data from dummy cells
- In the case of pitting corrosion ASTM G46-94: “Standard guide for examination and
evaluation of pitting corrosion”