Embed Size (px)
Citation preview

D8.1 Scientific and Technical coordination Guidelines
Lead partner: WavEC Offshore Renewables
Contributing partners: Sandia national laboratories, DBE – DEME Blue Energy nv, Tecnalia Fundacion
Authors: Boris Teillant, Alex Raventos, Paulo Chainho, Lander Victor, Jan Goormachtigh, Vincenzo Nava, Pablo Ruiz Minguela, Richard Jepsen
DTOcean - "Optimal Design Tools for Ocean Energy Arrays" is funded by the European Commission’s 7th Framework Programme. Grant agreement number: 608597
Deliverable 5.1: Methodology report and logistic model flow charts
Deliverable 5.1 – Methodology report and logistic model flow charts
2
Doc: DTO_WP5_ECD_D5.1 Rev: 1.0 Date: 23.07.2014
D5.1: Methodology report and logistic model flow charts
Project: DTOcean - Optimal Design Tools for Ocean Energy Arrays
Code: DTO_WP5_ECD_D5.1
Name Date
Prepared Work Package 5 11/07/14
Checked WP6, J. Giebhardt 23/07/14
Approved Project Coordinator 25/07/14
The research leading to these results has received funding from the European Community’s Seventh Framework Programme under grant agreement No. 608597 (DTOcean). No part of this publication may be reproduced, stored in a retrieval system, or transmitted in any form – electronic, mechanical, photocopy or otherwise without the express permission of the copyright holders. This report is distributed subject to the condition that it shall not, by way of trade or otherwise, be lent, re-sold, hired-out or otherwise circulated without the publishers prior consent in any form of binding or cover other than that in which it is published and without a similar condition including this condition being imposed on the subsequent purchaser.

Deliverable 5.1 – Methodology report and logistic model flow charts
3
Doc: DTO_WP5_ECD_D5.1 Rev: 1.0 Date: 23.07.2014
Deliverable 5.1 – Methodology report and logistic model flow charts
4
Doc: DTO_WP5_ECD_D5.1 Rev: 1.0 Date: 23.07.2014
Abstract
This deliverable includes the proposed logistic model architecture in terms of flow charts,
including data flows within the model and with other WPs and external databases and tools.
For this purpose, a detailed analysis of existing external databases and tools was performed.
Also interviews with project developers of wave and tidal arrays (the end-users of the tool) as
well as marine contractors and wave and tidal technology developers were carried out to
define the scope of the tool and validate the proposed approach.
Firstly, the suitability to integrate existing tools and databases into the ocean energy logistic
model is assessed. Given a review of the most relevant offshore logistics tools and maritime
infrastructure databases available, a conclusion is made on how the lifecycle logistics model
under DTOcean can benefit from previous work.
Secondly, the type of inputs and outputs that will be flowing through the logistic model and
the interactions with other modules is detailed. In the end, the flows of information circulate
into logistic functions allowing the user to assess logistic operations time, costs, reliability and
environmental impacts.
Deliverable 5.1 – Methodology report and logistic model flow charts
5
Doc: DTO_WP5_ECD_D5.1 Rev: 1.0 Date: 23.07.2014
TABLE OF CONTENTS
Chapter Description Page
Abstract 4
1. INTRODUCTION ........................................................................................................................ 8
2. EXTERNAL TOOLS AND DATABASES ................................................................................ 12
2.1. REVIEW OF OFFSHORE LOGISTIC TOOLS ................................................... 12
2.2. REVIEW OF THE MARITIME INFRASTRUCTURE DATABASES .............. 15
2.3. SUITABILITY TO INTEGRATE EXISTING TOOLS AND DATABASES
INTO DTOCEAN MODEL.................................................................................................. 16
3. METHODOLOGY FOR THE LIFECYCLE LOGISTICS MODEL ....................................... 17
3.1. GENERAL DESCRIPTION OF THE MODEL .................................................... 18
3.2. INPUTS TO THE LOGISTIC MODEL ................................................................. 21
3.3. MODULES OF THE LOGISTICS MODEL .......................................................... 22
3.3.1. CHARACTERIZATION OF THE LOGISTIC REQUIREMENTS ....................... 22
3.3.2. SELECTION OF THE MARITIME INFRASTRUCTURE ................................... 24
3.3.3. PERFORMANCE ASSESSMENT OF THE MARITIME INFRASTRUCTURE ... 25
3.4. OUTPUTS OF THE LOGISTICS MODEL ........................................................... 27
4. SUMMARY ................................................................................................................................ 28
5. REFERENCES........................................................................................................................... 29
APPENDIXES .................................................................................................................................... 33
APPENDIX A. REVIEW OF LOGISTIC TOOLS ............................................................ 33
APPENDIX B. REVIEW OF LOGISTIC PORT AND VESSEL DATABASES ............ 47
Deliverable 5.1 – Methodology report and logistic model flow charts
6
Doc: DTO_WP5_ECD_D5.1 Rev: 1.0 Date: 23.07.2014
Table 1. Summary list of relevant existing tools for supporting offshore logistics management. .............................................. 13
Table 2. Summary list of existing databases of ports and vessels potentially suitable for the MRE sector ............................... 15
Table 3. List of existing databases of vessels potentially suitable for the MRE sector. ............................................................. 48
Table 4. List of existing databases of ports potentially suitable for the MRE sector. ................................................................ 49
TABLES INDEX
Description Page
Deliverable 5.1 – Methodology report and logistic model flow charts
7
Doc: DTO_WP5_ECD_D5.1 Rev: 1.0 Date: 23.07.2014
FIGURES INDEX
Description Page
Figure 1. Development of costs over the course of the individual logistics phases in the onshore and the offshore
sector for the offshore wind industry (source: [1]) ..................................................................................................................... 8
Figure 2. Alternative hydrocarbon production systems (source: Oilfield Publications Ltd., Houston, US) ............................... 9
Figure 3. Jack up platform Neptune installing a wind turbine at Thorntonbank OWF in 2012 (source: GeoSea) ..................... 9
Figure 4. Jules Verne of Cable laying vessel (source: Prysmian) ............................................................................................. 10
Figure 5. Crew transfer vessel “Aquata” at Thorntonbank OWF in 2012 (source: GeoSea) ................................................... 10
Figure 6. Anchor handling tugs “Afon Cadnant” (source: Holyhead Towing Company Ltd.) ................................................. 10
Figure 7. Overview top level flow chart of the lifecycle logistics model ................................................................................... 18
Figure 8. Detailed flow chart of the lifecycle logistics model ................................................................................................... 20
Figure 9. Overview of the offshore logistic tool common to the ISL and Fraunhofer (source: [2]) .......................................... 33
Figure 10. Example of a vessel turbine installation states with MERMAId (source: [10]) ...................................................... 34
Figure 11. Example of cost variation against the phase length for different type of vessels with MERMAId (source:
[10]) .......................................................................................................................................................................................... 34
Figure 12. Schematic overview of the OMCE concept developed by the ECN (source: [13]) ................................................... 35
Figure 13. Example of format to report results of statistical analysis of logistic data with the ECN’s O&M tool
(source: [13]) ............................................................................................................................................................................ 35
Figure 14. Example of offshore wind installation strategies investigated with the NREL tool (source: [39]) .......................... 36
Figure 15. Tornado graph results of the offshore wind installation strategies investigated with the NREL tool
(source: [39]) ............................................................................................................................................................................ 37
Figure 16. Schematic overview of the improved ECUME tool developed by the EDF Group (source: [14]) ........................... 37
Figure 17. Schematic overview of the NOWIcob tool developed by SINTEF (source: [15]) ..................................................... 38
Figure 18. Example of results on availability for an O&M mothership wind farm scenario with the NOWIcob tool
developed by SINTEF (source: [15]) ......................................................................................................................................... 39
Figure 19. Diagram of the BBN approach O&M tool developed by the University of Strathclyde (source: [21]) ................... 40
Figure 20. Probability of reaching a certain lost in revenues (source: [21]) ........................................................................... 40
Figure 21. Flow chart with the O&M tool developed by the University of Strathclyde (source: [22]) ..................................... 41
Figure 22. Summary of the capabilities of the O&M tool (source: [22]) .................................................................................. 41
Deliverable 5.1 – Methodology report and logistic model flow charts
8
Doc: DTO_WP5_ECD_D5.1 Rev: 1.0 Date: 23.07.2014
1. INTRODUCTION
Logistics may be defined as "the detailed coordination of a complex operation involving many
people, facilities, or supplies"1. This definition of logistics is general and may refer to a very
large variety of activities. Since the focus of the DTOcean project is on the wave and tidal
energy sector, this report will consider only logistics within the frame of an offshore project.
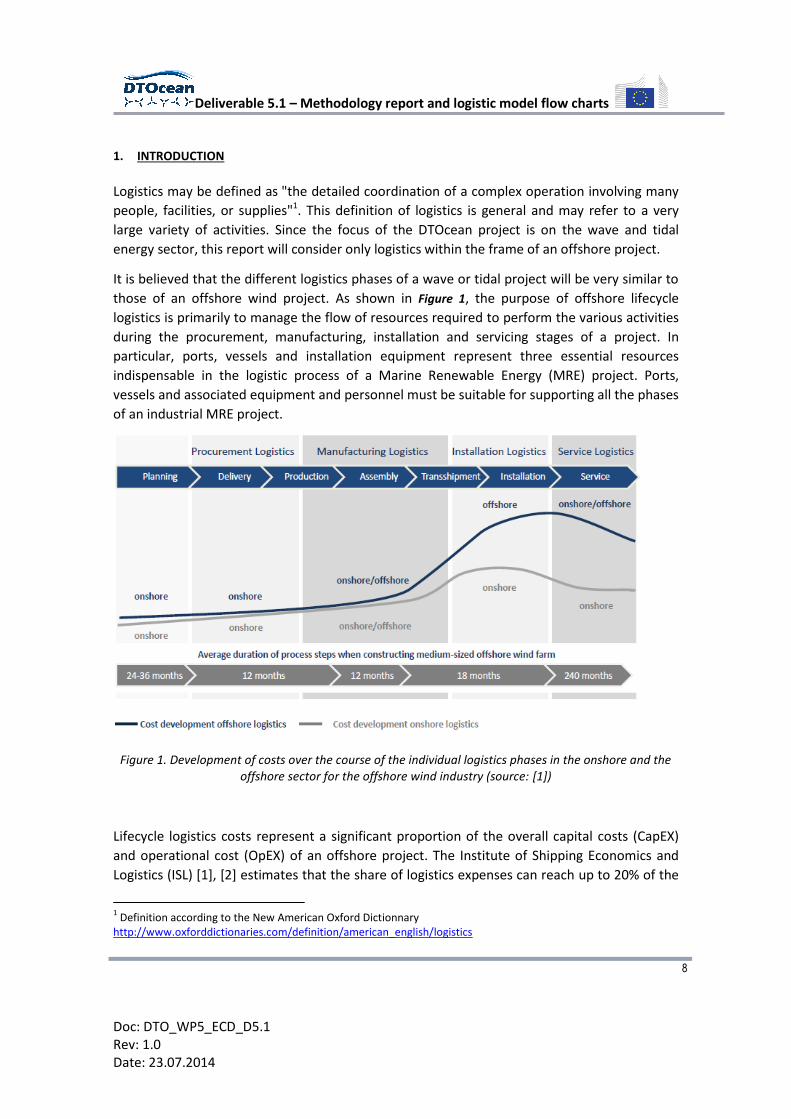
It is believed that the different logistics phases of a wave or tidal project will be very similar to
those of an offshore wind project. As shown in Figure 1, the purpose of offshore lifecycle
logistics is primarily to manage the flow of resources required to perform the various activities
during the procurement, manufacturing, installation and servicing stages of a project. In
particular, ports, vessels and installation equipment represent three essential resources
indispensable in the logistic process of a Marine Renewable Energy (MRE) project. Ports,
vessels and associated equipment and personnel must be suitable for supporting all the phases
of an industrial MRE project.
Figure 1. Development of costs over the course of the individual logistics phases in the onshore and the offshore sector for the offshore wind industry (source: [1])
Lifecycle logistics costs represent a significant proportion of the overall capital costs (CapEX)
and operational cost (OpEX) of an offshore project. The Institute of Shipping Economics and
Logistics (ISL) [1], [2] estimates that the share of logistics expenses can reach up to 20% of the
1 Definition according to the New American Oxford Dictionnary
http://www.oxforddictionaries.com/definition/american_english/logistics
Deliverable 5.1 – Methodology report and logistic model flow charts
9
Doc: DTO_WP5_ECD_D5.1 Rev: 1.0 Date: 23.07.2014
total cost of an offshore wind farm with an average value around 15%. While in the long term,
one can reasonably expect similar share for the lifecycle logistics of the wave and tidal sector,
in the first small pre-commercial arrays the share of logistic costs may be even higher [3].
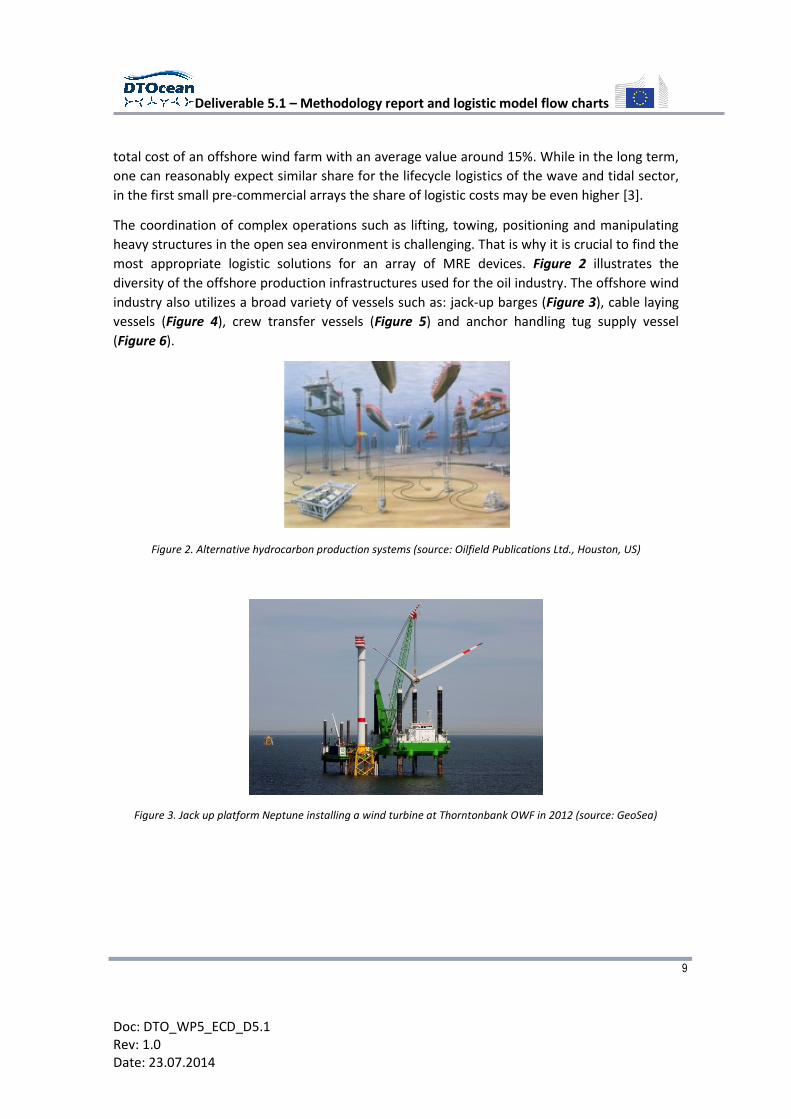
The coordination of complex operations such as lifting, towing, positioning and manipulating
heavy structures in the open sea environment is challenging. That is why it is crucial to find the
most appropriate logistic solutions for an array of MRE devices. Figure 2 illustrates the
diversity of the offshore production infrastructures used for the oil industry. The offshore wind
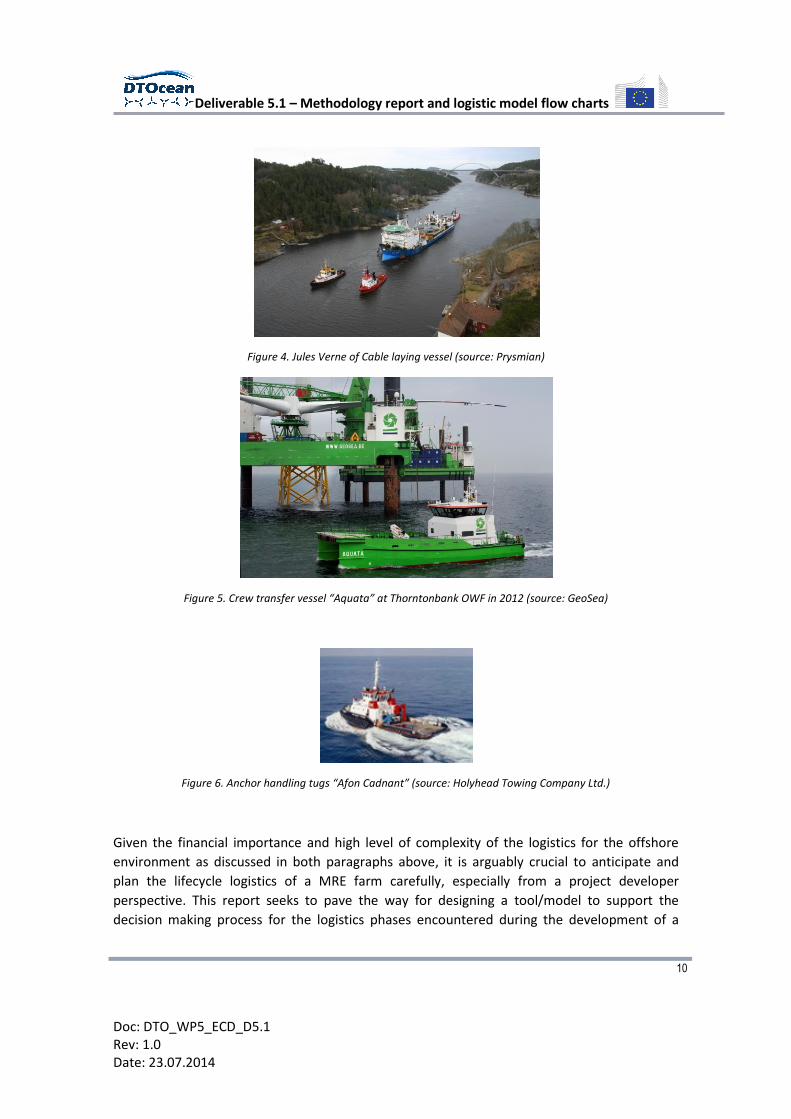
industry also utilizes a broad variety of vessels such as: jack-up barges (Figure 3), cable laying
vessels (Figure 4), crew transfer vessels (Figure 5) and anchor handling tug supply vessel
(Figure 6).
Figure 2. Alternative hydrocarbon production systems (source: Oilfield Publications Ltd., Houston, US)
Figure 3. Jack up platform Neptune installing a wind turbine at Thorntonbank OWF in 2012 (source: GeoSea)
Deliverable 5.1 – Methodology report and logistic model flow charts
10
Doc: DTO_WP5_ECD_D5.1 Rev: 1.0 Date: 23.07.2014
Figure 4. Jules Verne of Cable laying vessel (source: Prysmian)
Figure 5. Crew transfer vessel “Aquata” at Thorntonbank OWF in 2012 (source: GeoSea)
Figure 6. Anchor handling tugs “Afon Cadnant” (source: Holyhead Towing Company Ltd.)
Given the financial importance and high level of complexity of the logistics for the offshore
environment as discussed in both paragraphs above, it is arguably crucial to anticipate and
plan the lifecycle logistics of a MRE farm carefully, especially from a project developer
perspective. This report seeks to pave the way for designing a tool/model to support the
decision making process for the logistics phases encountered during the development of a
Deliverable 5.1 – Methodology report and logistic model flow charts
11
Doc: DTO_WP5_ECD_D5.1 Rev: 1.0 Date: 23.07.2014
MRE project. It is important to define what will be the capabilities and limitations of the tool in
terms of logistics. Ultimately, the model aims to design optimal logistic solutions for ocean
energy arrays. In other words, the tool should select the best combination of ports, vessels and
installation equipment to operate all the phases of an ocean energy project, and eventually
other specific services that may be pointed out by the end users. It will assess feasible
combinations of ports, vessels and installation equipment and prioritize them according to
their contribution to minimize the Levelised Cost of Energy (LCoE) but also the risks and/or
environmental impacts.
The final end-users of the tool are MRE project developers, in supporting investment and
management decisions and discriminating between alternative logistical offers. However,
other users may also benefit from the tool, such as:
Prospective investors in assessing the relevance of any MRE project development in
terms of logistic issues and in mitigating the financial risks,
Technology developers in guiding their R&D program and prioritizing their financial
efforts with the view to facilitate the logistic requirements of their technology,
Maritime contractors in anticipating the need for specialized equipment and
evaluating the level of competitiveness.
Specialized consulting companies provided services to the before mentioned players.
R&D institutions and universities in designing new solutions that streamline marine
operations and reduce its associated costs and risks.
This report is articulated in two main sections. The first section deals with the analysis of the
existing offshore logistic tools and maritime infrastructure databases. These have been
primarily developed for the offshore wind sector. A conclusion is also made on how the
lifecycle logistics model that will be developed under DTOcean can benefit from those tools
and databases. The second section of this report covers the methodology for the lifecycle
logistic model as proposed under DTOcean. The architecture of the model as well as the
interactions with the other work packages is discussed. The last section of this deliverable
contains a summary of the overall document together with an outlook of the forthcoming
work.
Deliverable 5.1 – Methodology report and logistic model flow charts
12
Doc: DTO_WP5_ECD_D5.1 Rev: 1.0 Date: 23.07.2014
2. EXTERNAL TOOLS AND DATABASES
Offshore logistics have been studied in other offshore industries, more mature than the wave
and tidal sector, such as the oil and gas and the offshore wind. Despite differences between
these industries, it may be time saving to rely upon existing external tools and databases
instead of building an offshore lifecycle logistics model from scratch. In this section, a review of
the existing tools and databases is conducted to reflect the state-of-the-art of the simulation
and data collections of offshore logistics, relevant to the wave and tidal energy sector. The
suitability of integrating the existing tools and databases into the offshore logistics model that
will be developed under WP5 is eventually examined.
2.1. REVIEW OF OFFSHORE LOGISTIC TOOLS
Acknowledging the full complexity of logistics issues for offshore energy production projects,
one can expect to find available tools for supporting the logistics planning in related industries
such as oil & gas and offshore wind. During the research of existing offshore logistics tools, a
wide range of software with significantly different purposes have been discovered. For
instance, there are tools for real time logistics management systems designed for the oil and
gas production [4], tools for tracking vessel management systems [5], and many others [6]–[8].
Many of these purposes are not in line with the overall goal of what the tool developed under
DTOcean should deliver in terms of logistics explained in section 1. With the purpose of
narrowing the scope of the research only to the most relevant existing tools, the remainder of
this section will be restricted to offshore wind tools as it is considered as the unique industry
sharing enough common characteristics with the wave and tidal sector in terms of logistics
issues. Moreover, logistic tools designed to be employed in real time during the operational
stage (or in planning an operation very shortly before the operational stage) will not be further
reported in this section. Nonetheless, the leading tools of this category have also been
investigated to inspire the methodology of the lifecycle logistics tool for DTOcean. Within
DTOcean, the lifecycle logistics tool will not be directly applicable for real time applications. It
should be noted that there exist tool developers with the capabilities to provide services for
both the planning and the operating phases.
Table 1 (see APPENDIX A. REVIEW OF LOGISTIC TOOLS for a more detailed description of the
tools) introduces a list of existing numerical tools for the offshore wind logistics in line with the
objectives of DTOcean. Nine tools were identified as relevant to the requirements of the wave
and tidal energy sector. Interviews with these tool developers were undertaken wherever
possible. The discussions resulting from these interviews have highlighted that the immaturity
of the offshore wind sector implies some a wide variety of expectations from the industry and
a need for specialized case studies that prevent the use of a single interface capable of
covering all the special needs. However, tool developers are confident in the commercial
Deliverable 5.1 – Methodology report and logistic model flow charts
13
Doc: DTO_WP5_ECD_D5.1 Rev: 1.0 Date: 23.07.2014
prospects of their products as the offshore industry progresses. They also encourage the idea
to develop logistics tools at an early stage of the ocean energy sector in order to:
Facilitate the definition of best practices for logistic procedures by contributing to its
standardization.
Decrease the costs associated with the logistics.
Identify the gaps and barriers in the currently available maritime infrastructures
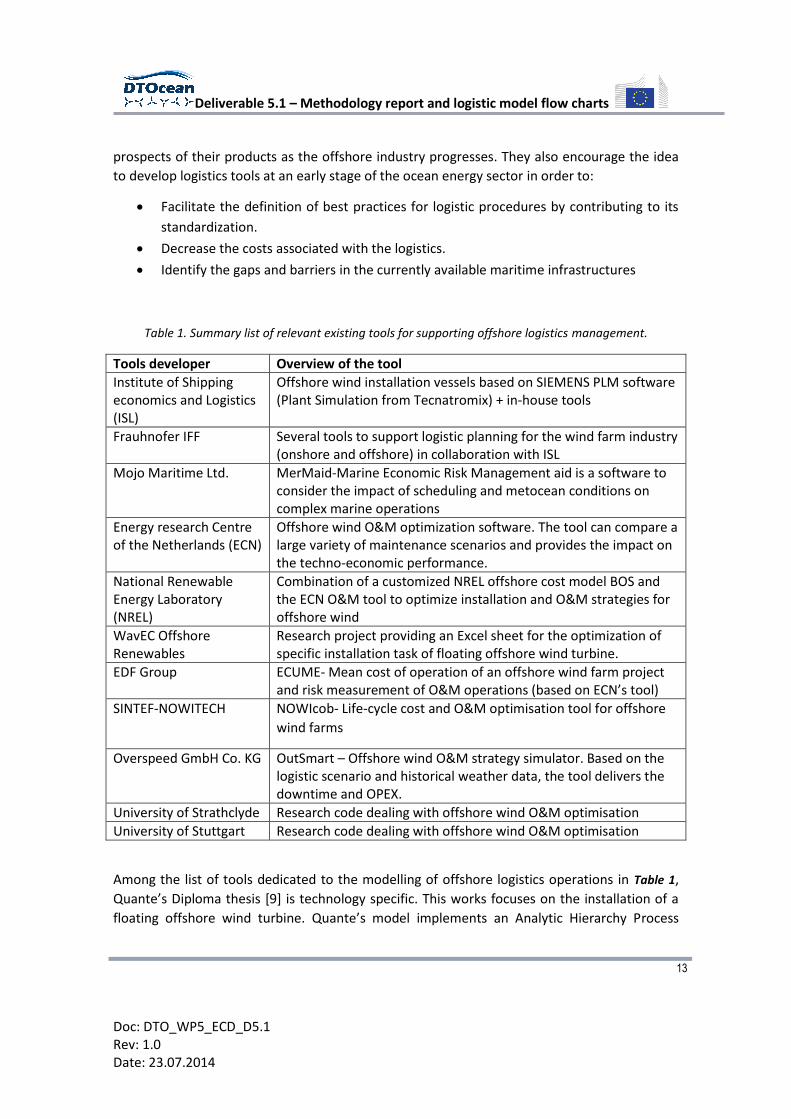
Table 1. Summary list of relevant existing tools for supporting offshore logistics management.
Tools developer Overview of the tool
Institute of Shipping economics and Logistics (ISL)
Offshore wind installation vessels based on SIEMENS PLM software (Plant Simulation from Tecnatromix) + in-house tools
Frauhnofer IFF Several tools to support logistic planning for the wind farm industry (onshore and offshore) in collaboration with ISL
Mojo Maritime Ltd. MerMaid-Marine Economic Risk Management aid is a software to consider the impact of scheduling and metocean conditions on complex marine operations
Energy research Centre of the Netherlands (ECN)
Offshore wind O&M optimization software. The tool can compare a large variety of maintenance scenarios and provides the impact on the techno-economic performance.
National Renewable Energy Laboratory (NREL)
Combination of a customized NREL offshore cost model BOS and the ECN O&M tool to optimize installation and O&M strategies for offshore wind
WavEC Offshore Renewables
Research project providing an Excel sheet for the optimization of specific installation task of floating offshore wind turbine.
EDF Group ECUME- Mean cost of operation of an offshore wind farm project and risk measurement of O&M operations (based on ECN’s tool)
SINTEF-NOWITECH NOWIcob- Life-cycle cost and O&M optimisation tool for offshore
wind farms
Overspeed GmbH Co. KG OutSmart – Offshore wind O&M strategy simulator. Based on the logistic scenario and historical weather data, the tool delivers the downtime and OPEX.
University of Strathclyde Research code dealing with offshore wind O&M optimisation
University of Stuttgart Research code dealing with offshore wind O&M optimisation
Among the list of tools dedicated to the modelling of offshore logistics operations in Table 1,
Quante’s Diploma thesis [9] is technology specific. This works focuses on the installation of a
floating offshore wind turbine. Quante’s model implements an Analytic Hierarchy Process
Deliverable 5.1 – Methodology report and logistic model flow charts
14
Doc: DTO_WP5_ECD_D5.1 Rev: 1.0 Date: 23.07.2014
(AHP) which demonstrates the suitability of AHPs to be used as decision making tools for the
selection of a goal according to a broad variety of criteria, such as the selection of the maritime
infrastructure in the context of a complex offshore operation. Most recently, one should
mention the MerMaid software of Mojo Maritime Ltd. [10] which potentially simulates all
marine operations that may occur over the course of a MRE project.
The first two rows in Table 1 refer to two German organizations which have been collaborating
to develop a set of numerical tools designed for the key logistic operations during the
deployment of an offshore wind farm. The ISL [2] has provided is expertise in the shipping
industry while Fraunhofer [11] has shared its extensive experience in dealing with wind energy
systems. In the end, they possess common simulation tools that they use for consultancy
purposes in conjunction with their other in-house tools and expertise. In particular, they
render services for managing the installation phase of offshore wind park. Their tools continue
to be refined as the industry matures. However, the commercial availability of these tools is
restricted to project developers.
The second main type of tools for offshore wind logistics encountered addresses essentially
the O&M stage. ECN [12], [13] O&M optimisation software claims the leadership in the current
offshore O&M wind market. ECN software makes use of information such as the durations and
rates of preventive maintenance activities, the failure rates and the degradation of
components to estimate the annual O&M costs of the plant. ECUME [14] is a tool based on
ECN software, which is developed by the EDF group. It introduces a risk measurement of the
O&M strategies in addition to the mean cost of the operation. Similarly, NOWiTech [15], with
their tool called “NOWicob”, as well as the University of Strathclyde [16] and the University of
Stuttgart [17] are currently developing their own numerical model for the optimisation of
offshore wind O&M.
For further information about these nine tools, including a comparison through a scoring
system, please refer to APPENDIX A. REVIEW OF LOGISTIC TOOLS.
Despite the fact that the wave and tidal energy industry is at an relatively early stage when
compared to the offshore wind sector, early work on thorough techno-economic analysis of
MRE converters was already accounting for some logistic issues in terms of impact on the
energy production and costs. Two different approaches are generally implemented to cope
with the simulation of logistic operations. On the one hand, the statistical approach, as
employed by Raventos et al. [18] and Dalton et al.[19], [20], relies on scatter diagrams and
probability of exceedance for describing the resource. As such, the probability of occurrence
for a given weather window (duration and accessibility criteria) can be determined. On the
other hand, the time series approach, as implemented by Teillant et al.[21] and O’Connor et
al.[22], makes use of measurements of the resource for a period of time as long as possible at
the site of interest. While this second approach allows more sophisticated and realistic analysis
of the accessibility to the site, it requires in-situ measurements which are not always available.
Deliverable 5.1 – Methodology report and logistic model flow charts
15
Doc: DTO_WP5_ECD_D5.1 Rev: 1.0 Date: 23.07.2014
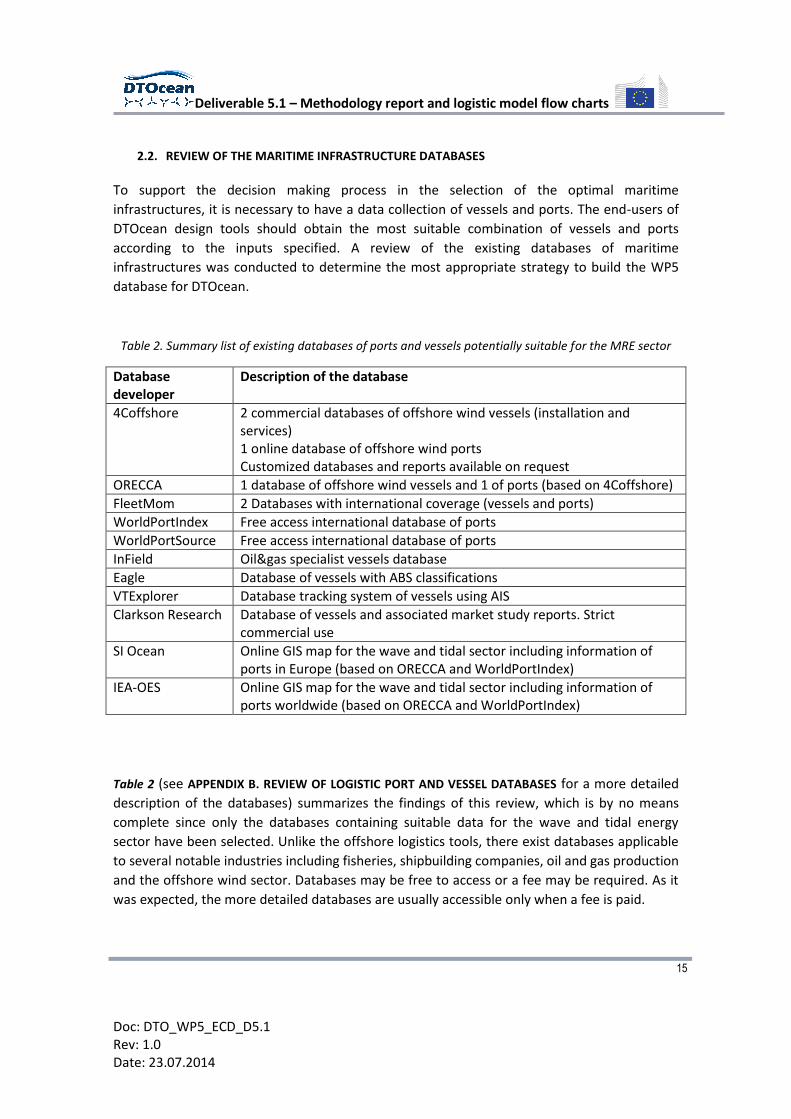
2.2. REVIEW OF THE MARITIME INFRASTRUCTURE DATABASES
To support the decision making process in the selection of the optimal maritime
infrastructures, it is necessary to have a data collection of vessels and ports. The end-users of
DTOcean design tools should obtain the most suitable combination of vessels and ports
according to the inputs specified. A review of the existing databases of maritime
infrastructures was conducted to determine the most appropriate strategy to build the WP5
database for DTOcean.
Table 2. Summary list of existing databases of ports and vessels potentially suitable for the MRE sector
Database developer
Description of the database
4Coffshore 2 commercial databases of offshore wind vessels (installation and services) 1 online database of offshore wind ports Customized databases and reports available on request
ORECCA 1 database of offshore wind vessels and 1 of ports (based on 4Coffshore)
FleetMom 2 Databases with international coverage (vessels and ports)
WorldPortIndex Free access international database of ports
WorldPortSource Free access international database of ports
InField Oil&gas specialist vessels database
Eagle Database of vessels with ABS classifications
VTExplorer Database tracking system of vessels using AIS
Clarkson Research Database of vessels and associated market study reports. Strict commercial use
SI Ocean Online GIS map for the wave and tidal sector including information of ports in Europe (based on ORECCA and WorldPortIndex)
IEA-OES Online GIS map for the wave and tidal sector including information of ports worldwide (based on ORECCA and WorldPortIndex)
Table 2 (see APPENDIX B. REVIEW OF LOGISTIC PORT AND VESSEL DATABASES for a more detailed
description of the databases) summarizes the findings of this review, which is by no means
complete since only the databases containing suitable data for the wave and tidal energy
sector have been selected. Unlike the offshore logistics tools, there exist databases applicable
to several notable industries including fisheries, shipbuilding companies, oil and gas production
and the offshore wind sector. Databases may be free to access or a fee may be required. As it
was expected, the more detailed databases are usually accessible only when a fee is paid.
Deliverable 5.1 – Methodology report and logistic model flow charts
16
Doc: DTO_WP5_ECD_D5.1 Rev: 1.0 Date: 23.07.2014
The first databases on maritime infrastructure for the wave and tidal sector have been
published (two EU projects: ORECCA, SI Ocean; IEA-OES). The data provides a good starting
point for DTOcean, which will gather further information to increase the level of detail.
4COffshore delivers valuable information concerning the offshore wind industry including a
database of vessels involved in the lifecycle logistics of existing offshore wind parks. Two
separate data collections are accessible for a fee, namely the installation vessels database and
the servicing vessels database. While a high level of technical characteristics describing the
vessels is available, these databases have only limited information with regards to the
economics and the operational working conditions of the vessels and it is not clear whether
this information is accurate/complete or not.
2.3. SUITABILITY TO INTEGRATE EXISTING TOOLS AND DATABASES INTO DTOCEAN MODEL
In the end, WP5 would benefit from identifying the best approaches to develop a lifecycle
logistics model from the review presented in sections 2.1 and 2.2 and eventually build the
logistic model upon existing models applied to other sectors. Facing the lack of operational
experience of full scale ocean energy arrays, it seems logical to look at the offshore wind
sector since it is simply the industry that has most in common with the wave and tidal sector.
However, based on the communication established with the key tool developers listed in Table
1, none existing offshore logistics tool can be directly integrated into the suite of tools of
DTOcean, mainly because of the open-source nature of the DTOcean project. Furthermore, the
wave and tidal sector shows some specific logistics requirements which are different to those
of the offshore wind sector. Nonetheless, existing offshore wind logistics software will be used
as a source of inspiration to determine the methodology for developing a tool dedicated to
arrays of MRE devices.
For the reasons mentioned above, a new lifecycle logistic tool will be developed within the
frame of the DTOcean project. An effort will be made to facilitate the possibility, for the end-
user of DTOcean’s software, of using other existing (or in-house code) logistic tools in
replacement of WP5 module on lifecycle logistics if preferred.
One objective of WP5 is to provide an updated database of suitable maritime infrastructure for
the ocean energy arrays defined in the scenarios in Deliverable 1.1, including detailed
specifications to match array logistic requirements. To fulfill this objective, it is advised to rely
upon external data collections and upgrade them to cover the geographical regions of interest
and include the latest information available with a satisfying level of details.
Several key institutions which have compiled a first set of databases, involved in the ORECCA
and SI Ocean projects [23, 42] and IEA implementing agreement on Ocean Energy [43], are
partners of the DTOcean project so they can share their spreadsheets of vessels and ports with
DTOcean collaborators. Therefore, the databases for ports and vessels will be built upon
previous work, ensuring no duplication of efforts. Furthermore, 4Coffshore [24] is a reference
for the offshore wind industry. Ongoing discussions with 4COffshore may conclude on the
Deliverable 5.1 – Methodology report and logistic model flow charts
17
Doc: DTO_WP5_ECD_D5.1 Rev: 1.0 Date: 23.07.2014
purchase of a customized vessels database to serve as a solid basis for the lifecycle logistics
tool. The most appropriate vessel classes (or categories) will be determined as the work in
WP5 progresses so that the lifecycle tool will select a type of vessel rather than an individual
vessel. The use of average values (with an associated standard deviation) for some very
volatile parameters such as the vessel availability will also be preferred.
As for the ports database, the World Port Index was identified as one of the largest resources
for port and harbors specification worldwide (which has served as input to ORECCA, SI Ocean
and IEA-OES). Searching the internet for port information has also proven to be quite a simple
and efficient way to populate a database.
Additionally, information sheets consisting of forms to be completed by external entities
(shipbuilding companies, vessels’ operators, administrative representative of ports, etc…)
should be distributed among partners of the different regions to upgrade the database. In
turn, the information sheets would be post processed by WP5 leader to update the
information of the DTOcean database. In particular, early participation and strong
commitment of partners is critical. This is especially true for those based in the regions that are
excluded from existing databases, or only partially considered such as Western Europe (France,
Ireland, Portugal and Spain). The lack of available data sets in these regions can be explained
by the inexperience in the offshore wind industry compared to other European countries
(Belgium, Denmark, Germany, the Netherlands and UK).
The DTOcean website [25] could also serve as a platform for online questionnaires. Following
the format of the information sheet, multi-step online surveys would be constructed in the
manner of a series of questions. In turn, the actors of the DTOcean project would be able to
share the link with targeted contacts to widen and strengthen the data collection process.
Finally, as soon as a well-proven database of ports and vessels will be available for DTOcean, a
set of plugins may be developed to automatically update it with the relevant external source
(e.g WorldPortIndex, 4COffshore, customized fact sheets, online questionnaires, etc…) on a
regular basis. This can only be decided on a later stage of the project.
3. METHODOLOGY FOR THE LIFECYCLE LOGISTICS MODEL
This section explains the architecture of the lifecycle logistics model as initially proposed in this
first deliverable. The scope of the model was determined so that the essential logistic phases
of a commercial ocean energy project are included. A description of the range of application
envisaged for the tool was provided in section 1 of this document. In summary, the tool should
enable to identify the most suitable scenario for ports, vessels and installation equipment and
potentially of other specific services to operate all the phases of an ocean energy project. This
section presents how the model is structured including its interactions with other WPs.
Deliverable 5.1 – Methodology report and logistic model flow charts
18
Doc: DTO_WP5_ECD_D5.1 Rev: 1.0 Date: 23.07.2014
The structure presented below results from a consultation round with key industrials at the
forefront of the offshore renewable energy sector including: technology developers (both
wave and tidal), project developers, utilities and marine contractors. All the persons
interviewed during this consultation are potential end-users of the DTOcean tool. In general,
the discussions were very constructive so that WP5 can build a logistic tool as useful as
possible for the sector. The invaluable offshore experience gained by these industrials greatly
helped in refining the scope of the lifecycle logistic tools and determine the critical lifecycle
logistic issues encountered during an offshore renewable energy project. WavEC Offshore
Renewables would like to gratefully acknowledge all the persons consulted.
A summary of the main conclusions of the consultation is the following:
Positive feedback on the general approach of the methodology.
Interest in the output and asked to be informed in the next steps
Keep the first version of the module as simple as possible to test it and improve it as
the tool matures
Focus on the marine operations (vessels) rather than on the onshore operations.
An accurate weather window calculator is critical.
The availability of the vessels should be taken into account.
Integration of a risk and uncertainty analysis is strongly advised.
The flexibility to replace some of the module of the DTOcean global tool by in-house
code is a very attractive feature.
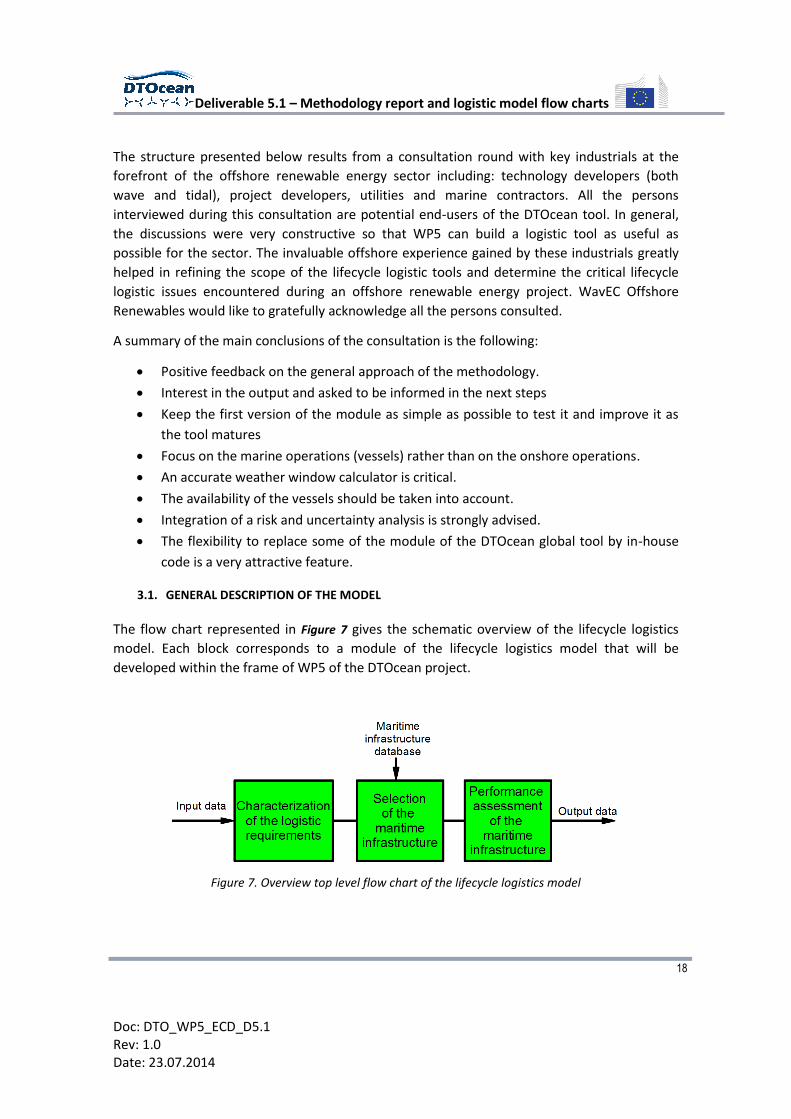
3.1. GENERAL DESCRIPTION OF THE MODEL
The flow chart represented in Figure 7 gives the schematic overview of the lifecycle logistics
model. Each block corresponds to a module of the lifecycle logistics model that will be
developed within the frame of WP5 of the DTOcean project.
Figure 7. Overview top level flow chart of the lifecycle logistics model
Deliverable 5.1 – Methodology report and logistic model flow charts
19
Doc: DTO_WP5_ECD_D5.1 Rev: 1.0 Date: 23.07.2014
The lifecycle logistics model is articulated in three modules incrementally assessing the
feasibility and the performance of the logistical resources necessary to support the
development of an array of MRE devices. The first step consists of defining the logistic
requirements for all phases forming the industrial MRE project development. Then, the model
will eliminate the combination of ports, vessels and installation equipment that do not match
with the logistic requirements previously determined. Finally, the performance of the feasible
logistical solutions is examined in terms of schedule, economics, risk & reliability and
environment. The outputs will then a description of the chosen solution(s) with the associated
schedule, costs risk and environmental data.
Assuming the maritime infrastructure database contains a wide variety of offshore logistical
equipment, the selection of feasible combination of ports, vessels and installation equipment
and personnel is justified to avoid assessing the performance of irrelevant logistic resources.
The approach depicted in Figure 7 allows a straightforward and efficient procedure to deal with
some aspects of management of the offshore logistic issues in the context of an energy
production project.
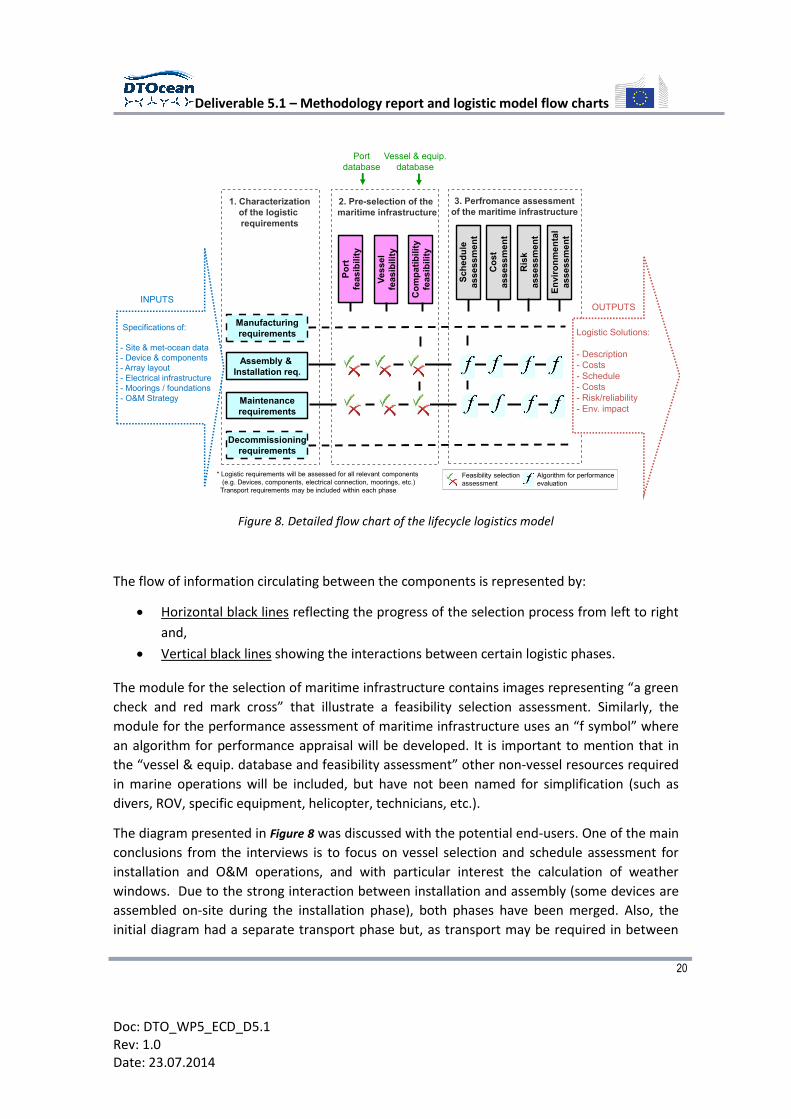
A more detailed flow chart showing the flow of data circulating between the three modules of
the lifecycle logistic tool is given in Figure 8. It specifies the type of inputs and outputs of the
model and also introduces labeled boxes to split the modules into individual components.
Deliverable 5.1 – Methodology report and logistic model flow charts
20
Doc: DTO_WP5_ECD_D5.1 Rev: 1.0 Date: 23.07.2014
Figure 8. Detailed flow chart of the lifecycle logistics model
The flow of information circulating between the components is represented by:
Horizontal black lines reflecting the progress of the selection process from left to right
and,
Vertical black lines showing the interactions between certain logistic phases.
The module for the selection of maritime infrastructure contains images representing “a green
check and red mark cross” that illustrate a feasibility selection assessment. Similarly, the
module for the performance assessment of maritime infrastructure uses an “f symbol” where
an algorithm for performance appraisal will be developed. It is important to mention that in
the “vessel & equip. database and feasibility assessment” other non-vessel resources required
in marine operations will be included, but have not been named for simplification (such as
divers, ROV, specific equipment, helicopter, technicians, etc.).
The diagram presented in Figure 8 was discussed with the potential end-users. One of the main
conclusions from the interviews is to focus on vessel selection and schedule assessment for
installation and O&M operations, and with particular interest the calculation of weather
windows. Due to the strong interaction between installation and assembly (some devices are
assembled on-site during the installation phase), both phases have been merged. Also, the
initial diagram had a separate transport phase but, as transport may be required in between
Manufacturing
requirements
Assembly &
Installation req.
1. Characterization
of the logistic
requirements
Maintenance
requirements
2. Pre-selection of the
maritime infrastructure
Decommissioning
requirements
Ve
ss
el
feasib
ilit
y
Po
rt
fea
sib
ilit
y
3. Perfromance assessment
of the maritime infrastructure
Sc
he
du
le
assessm
en
t
Co
st
as
se
ss
me
nt
Ris
k
assessm
en
t
En
vir
on
men
tal
as
se
ss
me
nt
Port
database
Vessel & equip.
database
Co
mp
ati
bilit
y
fea
sib
ilit
y
* Logistic requirements will be assessed for all relevant components
(e.g. Devices, components, electrical connection, moorings, etc.)
Transport requirements may be included within each phase
Feasibility selection
assessment
Algorithm for performance
evaluation
Logistic Solutions:
- Description
- Costs
- Schedule
- Costs
- Risk/reliability
- Env. impact
Specifications of:
- Site & met-ocean data
- Device & components
- Array layout
- Electrical infrastructure
- Moorings / foundations
- O&M Strategy
INPUTSOUTPUTS
Deliverable 5.1 – Methodology report and logistic model flow charts
21
Doc: DTO_WP5_ECD_D5.1 Rev: 1.0 Date: 23.07.2014
each phase2, transport will be integrated in each phase. Finally, the logistics involved in the
manufacturing facilities (and transport to the installation port) as well as the decommissioning
stage were considered secondary, and will be considered using simplified models (this is why a
dotted line is included in the figure).
3.2. INPUTS TO THE LOGISTIC MODEL
Initially, the logistic model requires a set of inputs to define the characteristics of the project
that will affect the choice of the optimal logistic solutions. There exist two types of inputs:
User scenario description,
Global DTOcean database and relevant outputs from other WPs, and
Database of maritime infrastructure and their performance capabilities as indicated in
green in Figure 8.
The input will derive either directly from the users, or from the outputs of the other modules
of the DTOcean tool e.g. the electrical infrastructure or the moorings and foundations. Six
categories of inputs have been identified as mentioned below along with their main WP
provider:
Site characteristics and metocean data (WP1): inputs describing the onsite location,
bathymetry, the seabed and the metocean resource data (wave height, wave period,
wind speed, current speed, etc…).
Devices & components specifications (WP1): inputs listing the specifications of the
main components of the devices such as their dimensions and weight as well as the
description of the assembly and installation strategy preferred for the device.
Array layout (WP2): inputs defining the array layout configuration such as the number
and location of the devices and the interspacing configuration.
Electrical infrastructure specifications (WP3): inputs covering the relevant
characteristics of the grid connection (e.g. the cable types and lengths, substation
requirements, etc…)
Moorings & foundations specifications (WP4): inputs covering the relevant
specifications of the moorings and foundations (e.g. the dimensions and weights of its
components, the spatial configuration, etc…)
Maintenance & decommissioning requirements (WP6): all relevant information
relative to the maintenance activities concerning the monitoring, the preventive and
corrective actions (e.g. type of operation, date, dimensions and weight of components
to be replaced, etc.).
2 e.g. from the manufacturing facility to the assembly port, from the assembly port to the site for installation, and
from the site to the O&M port for maintenance.
Deliverable 5.1 – Methodology report and logistic model flow charts
22
Doc: DTO_WP5_ECD_D5.1 Rev: 1.0 Date: 23.07.2014
An Excel file containing the expected list of inputs for each category will be prepared to
disseminate between the WP coordinators. For each input, the WP provider will be specified
according to the DTOcean proposal.
The second type of input concerns the use of a database for maritime infrastructure required
to meet the logistic requirements. As discussed in section 2, the logistics model will require a
collection of information concerning the ports, vessels in Europe, but will also include generic
information of other relevant resources (specialized workforce and equipment). For this
reason, WP5 is responsible for assembling existing data sets and additional external
contributions in order to compile a list of vessels/equipment and ports with their associated
characteristics (task 5.3). The database of maritime infrastructure should be sufficiently large
to cover the geographical regions of interest for DTOcean. It should also include the
appropriate levels of detail to extract all useful information for the selection of the best
maritime infrastructure within manageable levels for the implementation of a user-friendly
tool.
3.3. MODULES OF THE LOGISTICS MODEL
In this section, the working principle of the three main modules introduced in section 3.1 is
presented.
3.3.1. CHARACTERIZATION OF THE LOGISTIC REQUIREMENTS
In Figure 8, one can identify 4 boxes corresponding to various phases of an MRE project which
involve logistic support. Each box refers to the logistic requirements associated with the phase.
A key objective of defining the logistic requirements consists of complying with the guidelines
[26]–[31] and standards [32], [33] available for the offshore industry.
The boundaries of the model have been defined with the view to find a balanced compromise
between three objectives:
Cover the lifecycle of a commercial MRE project as exhaustively as possible
Reach a satisfying level of detail in the description of the logistic activities, but
maintaining the tool as simple and user-friendly as possible
Ensure the manageability of the tool with respect to its flexibility, its interactions with
other modules of the tool and the budget allocated to develop it.
ASSEMBLY, INSTALLATION AND O&M PHASES
As previously mentioned the results from the interviews from industry indicated that the key
phases where such a tool should be most valuable are installation and O&M, so these phases
Deliverable 5.1 – Methodology report and logistic model flow charts
23
Doc: DTO_WP5_ECD_D5.1 Rev: 1.0 Date: 23.07.2014
will be the core of the tool and characterized in detail, while other phases will be included
when necessary.
The installation requirements concern primarily the selection of the most appropriate set of
vessels to perform the following operations:
Trenching, laying and protecting the electrical cables,
Installing the other electrical infrastructure equipment and, in particular, the
substation where necessary,
Positioning and pre-installing the moorings and foundations,
Transferring and assembling all components of the devices from the port to the site,
Installing, positioning and connecting the devices to the electrical infrastructure and
the moorings and foundations hardware equipment.
The design specifications and constraints associated with the electrical infrastructure, the
moorings and foundations and the devices with all its components, will guide the choice of the
vessels capable of accomplishing these operations. Note that the original purpose of the final
DTOcean tool is to support the design of an array of ocean energy devices. The use of such a
tool is not to provide real time management software. For this reason, the lifecycle logistics
model will opt for average values for the locations, the costs and the availability of the vessels
instead of vessel live tracking system and quotes for individual vessels. The variation of vessel
daily rates due to different seasons and other factors will be incorporated in the model in the
best possible way within reasonable limits.
Whilst a suitable port for the O&M activities will have similar requirements as a port for the
assembly and transportation of MRE devices, certain factors such as the distance to site, the
availability of specialized personnel will become more influent. In the maintenance
requirements, the description of the type of maintenance operations to be carried out will set
the choice of the port(s) and vessel(s) eligible to execute the O&M activities [34].
MANUFACTURING
After the interviews with the industry, and due to the variety of projects and contracts, the
tool will assume that the manufacture and provision of the goods will be assumed by the
supplier. The scope of the tool will start at the installation/O&M port, and costs and delivery
time of the components/devices will be direct inputs from the user or simplified compared to
the installation and O&M phases.
However, since the manufacturing and assembly requirements are generally strongly linked,
the lifecycle logistics model will attempt to consider some of the manufacturing requirements
if necessary. For instance, depending on the location of the manufacturing of the main
components and the assembly strategy, the selection of the best port(s)/shipyard(s) at the
deployment phase (i. e. transportation and installation of the farm) may differ. Consequently,
Deliverable 5.1 – Methodology report and logistic model flow charts
24
Doc: DTO_WP5_ECD_D5.1 Rev: 1.0 Date: 23.07.2014
the port manufacturing capabilities, the storage capacity, lifting and maneuvering equipment
will be included to cover both the manufacturing and the assembly requirements.
DECOMISSIONING
At the current stage of development of the wave and tidal energy sector, forecasting the
requirements for the decommissioning stage of a MRE farms is a difficult task because:
No fully commercial arrays of MRE devices have been decommissioned yet.
In 20 years’ time (or more), when the first commercial arrays of wave and tidal farms
are expected to be decommissioned, the state-of-the-art of the infrastructure and
policies could be significantly different.
In the offshore wind industry, the typical method to account for the decommissioning in a
project feasibility assessment is simply to consider the costs of this phase as a percentage of
the installation & assembly costs based on available numbers for related industries (oil & gas)
and the type of moorings/foundations of the array (see [35], [36]). More sophisticated costing
functions (see[37], [38]) may be implemented following the work that has been done in the
offshore wind industry but it is suggested not to apply these functions at such an early stage of
the MRE industry.
OTHER PROJECT PHASES
There are other phases that involve logistics in MRE projects, but that have been considered as
not relevant or out of the scope of an array design tool. For example, in the context of a
commercial MRE project development, the surveying phase (surveys related to
characterization resource, geophysics, and environment) is done prior to the final design of the
array, which is the focus of DTOcean. Thus, the surveying phase will not be implemented in the
logistic model.
3.3.2. SELECTION OF THE MARITIME INFRASTRUCTURE
As soon as the requirements for the logistics are defined, one can identify the resources that
meet these requirements among a list of available ports and vessels. This is the purpose of the
second module entitled “Selection of the maritime infrastructure”.
The logic behind the selection of maritime infrastructure consists of discarding the ports,
vessels and equipment that do not satisfy the logistic requirements determined upstream, i.e.
during the previous module entitled “Characterization of the logistic requirements”. The
selection of the maritime infrastructure straightforwardly looks for the ports and vessels
available in the database that matches the logistic requirements. As a result, only the suitable
ports and vessels are considered for further analysis. It is assumed that the “selection of the
maritime infrastructure” will result in different possible sets of ports and vessels.
Deliverable 5.1 – Methodology report and logistic model flow charts
25
Doc: DTO_WP5_ECD_D5.1 Rev: 1.0 Date: 23.07.2014
In addition to individual feasibility assessment for ports and vessels, a compatibility check to
ensure the feasibility of the combination of port and vessels selected should be performed.
This step would prevent situations where, for example, vessels do not fit in the selected port
or the distance between the average location of the vessels and the place of the port are not
acceptable.
From a project manager perspective, there might be additional requirements to ensure that
only effective and competent ports and vessels are considered during the deployment phase
from manufacturing until complete installation. For instance, it could be an end-user defined
constraint that only one single port must be used for manufacturing, assembly, installation and
O&M (or a combination of them).
3.3.3. PERFORMANCE ASSESSMENT OF THE MARITIME INFRASTRUCTURE
The decision making process of what set of maritime infrastructure is the most efficient for an
array of wave and tidal energy devices are based upon four criteria:
Schedule: the total duration of each operation will be calculated from the net duration
of the operation and, if applicable, the downtime due to external factors such as the
availability of weather windows, delivery times for supplying a replacement, skilled
personnel, etc.
CapEx and OpEx: the costs associated with the lifecycle logistics,
Risk level: risk assessment of the different operations,
Environmental impact: impact on the environment of the different operations.
For each type operation different one or more logistic solutions will be obtained (depending
on the overall DTOcean optimization process to be discussed within the project partners).
Results for schedule, costs, risk and environmental impact will be attached to each logistic
solution. The tool may allow the user to constrain different logistic solutions (e.g. use the same
port/vessel for several operations, start one operation only after another has ended, etc.).
First, a schedule assessment is performed to calculate the estimated time required for the
completion of all the logistic operations. Providing the selected feasible combination of vessels
and ports, the site characteristics and the metocean data, the schedule assessment determines
the weather windows, the transit times and the duration of the operation. In the end, one can
extract estimates of the overall durations for the various phases of the lifecycle logistics. The
commissioning schedule and the availability of the farm over the entire lifetime of the project
are therefore constructed.
Deliverable 5.1 – Methodology report and logistic model flow charts
26
Doc: DTO_WP5_ECD_D5.1 Rev: 1.0 Date: 23.07.2014
Secondly, a cost assessment algorithm sums up all the cost estimates associated with the
logistic operations. For instance, the daily rates of the vessels will multiply the total duration,
calculated from the net duration plus the downtime due to weather conditions.
Thirdly, the risk assessment attempts to value the risk of encountering an issue during the
preparation or the completion of a logistic operation. Depending on factors, such as the
availability of the vessel and supply or the difficulty to have long-term weather forecast, the
implications of having to delay, abort or modify a marine operation should be reflected
through a risk analysis. Monte Carlo simulation has been identified over the course of the
preparation of this report as a powerful method to deal with risk assessment, and will be
considered for this purpose.
Lastly, an environmental impact assessment provides a qualitative measure of the influence of
the choice of the logistic resources on the environment. It is planned to implement a scaling
system to facilitate the identification of the most favorable options.
Deliverable 5.1 – Methodology report and logistic model flow charts
27
Doc: DTO_WP5_ECD_D5.1 Rev: 1.0 Date: 23.07.2014
3.4. OUTPUTS OF THE LOGISTICS MODEL
As one propagates through the lifecycle logistic model, intermediate outputs aggregate to
form a pile of information. With the objective to generate a consistent set of outputs for the
end-user and for WP7, the results of the model may be divided in six categories:
1. Logistical solutions: a description of the set of ports, vessels and equipment that have
been selected.
2. Schedule: an expected schedule of the logistical activities with their estimated
durations. The impact on energy production due to the downtime in the maintenance
activities or delays on the installation procedure will be probably assessed in WP6, as it
is required to have information on the operation of the array during that period (info
which is not required for the rest of WP5 tasks).
3. CapEx and OpEx contributions: all the costs estimations are gathered and tagged with
“capital expenditures” or “operational expenditures”3.
4. Energy production impact: the outputs affecting the energy production are essentially
the downtime due to the maintenance activities and the schedule of the installation
procedure. In turn, this will give the availability of the farm for power production
throughout the lifetime of the project.
5. Risk & reliability outcome: a summary of the information corresponding to the issues
related to the reliability/risk during the installation and O&M procedures could be
valuable. Risk could be reflected in the form of ranges of uncertainty for the key
outputs but is yet to be decided. The reliability outcome would contain the summary
of the consequences of the maintenance activities on the logistic performance.
6. Environmental impact: outputs relative to the environmental impact should be
included as in other WPs.
The LCoE was chosen as the objective value to optimize for the DTOcean tool. As a result, the
selected feasible combinations of ports, vessels and installation equipment should be
compared in order to find the set of logistical solutions minimizing the LCoE. However, it is not
possible to decide which the optimal solution for the array is if other modules interact with the
decisions taken. The final optimization process will be defined in agreement with the rest of
the consortium and should be guided by WP7.
3 The economic assessments that are performed under other WPs are excluded here. Only the costs associated with
the logistics activities are compiled (the other costs will be assessed within each module in order for each WP to be able to work stand-alone during the development of their tool).
Deliverable 5.1 – Methodology report and logistic model flow charts
28
Doc: DTO_WP5_ECD_D5.1 Rev: 1.0 Date: 23.07.2014
4. SUMMARY
This report presents the methodology for the lifecycle logistics assessment of ocean energy
arrays and its range of application as proposed for the DTOcean project. A summary of the
state-of-the art of the offshore logistic tools relevant to the wave and tidal energy sector is
initially depicted. In addition, the availability of information with regards to the maritime
infrastructure is examined.
The proposed model relies on inputs that can be either defined by the user or provided by
upstream WPs outputs. Furthermore, inputs relative to the maritime infrastructure and the
components to the model can be obtained in a database that will be constructed from data for
similar industries. Ultimately, the model is to feed WP7 with the lifecycle logistical algorithms
evaluated through a suite of appropriate functions reflecting all the important phases of an
ocean energy array project. More detail on the different components of the model will be
determined during the coming months of the project and provided in the future deliverables
to be produced.
As the work under WP5 progresses, the development of the lifecycle logistic model and the
construction of the database of maritime infrastructure will rely upon the work reported in this
document.
A wide variety of project partners and external companies (end-users) have been consulted to
define the methodology for a lifecycle logistics model. These interactions have allowed the
identification of the areas of interest for the targeted end-users of the DTOcean tool.
Deliverable 5.1 – Methodology report and logistic model flow charts
29
Doc: DTO_WP5_ECD_D5.1 Rev: 1.0 Date: 23.07.2014
5. REFERENCES
[1] F. Reichert, R. Kunze, and S. Kitvarametha, “Like a Journey to the Moon,” 2011.
[2] K. Lange, A. Rinne, and H.-D. Haasis, “Planning Sustainable Maritime Logistics Concepts
for the Offshore Wind Industry : A newly developed Decision Support System,” in Third
International Conference on Computational Logistics, 2012, pp. 1–9.
[3] Low Carbon Innovation Coordination Group, “Technology Innovation Needs Assessment
(TINA) Marine Energy Summary Report,” 2012.
[4] MARINTEK, “MOPSIM Real-time simulator for complex marine operations.” 2012.
[5] IBS, “Vessel management module provides up-to date information on vessel status,
vessel activities, safety and inspections.” .
[6] SeaRoc, “SeaPlanner.” 2014.
[7] Overspeed GmbH & Co. KG, “OptiFarm.” 2014.
[8] Offshore Marine Management, “Enhanced Project Offshore Cable History (EPOCH).”
2014.
[9] P. Quante, “Maritime Infrastructure and Operator Selection Tool for Offshore Wind
Installations,” Karlsruhe Institute of Technology, 2012.
[10] M. Morandeau, R. T. Walker, R. Argall, and R. F. Nicholls-Lee, “Optimisation of marine
energy installation operations,” Int. J. Mar. Energy, vol. 3–4, pp. 14–26, Dec. 2013.
[11] IWES Fraunhofer, “Offshore Logistics - Weather dependency and forecasting
procedures for offshore wind farm construction and operation.” 2014.
[12] T. Obdam, L. W. M. M. Rademakers, H. Braam, and P. Eecen, “Estimating Costs of
Operation & Maintenance for Offshore Wind Farms,” in European Offshore Wind 2007
Conference, 2007.
[13] L. W. M. . Rademakers, H. Braam, T. . Obdam, and R. P. v. . Pieterman, “Operation and
maintenance cost estimator (OMCE) to estimate the future O&M costs of offshore wind
farms,” in European Offshore Wind 2009 Conference, 2009, pp. 14–16.
[14] F. Douard, C. Domecq, and W. Lair, “A Probabilistic Approach to Introduce Risk
Measurement Indicators to an Offshore Wind Project Evaluation – Improvement to an
Existing Tool Ecume,” Energy Procedia, vol. 24, no. January, pp. 255–262, Jan. 2012.
[15] M. Hofmann and I. B. Sperstad, “NOWIcob – A Tool for Reducing the Maintenance Costs
of Offshore Wind Farms,” Energy Procedia, vol. 35, no. 1876, pp. 177–186, Jan. 2013.
Deliverable 5.1 – Methodology report and logistic model flow charts
30
Doc: DTO_WP5_ECD_D5.1 Rev: 1.0 Date: 23.07.2014
[16] I. Dinwoodie, D. McMillan, M. Revie, I. Lazakis, and Y. Dalgic, “Development of a
Combined Operational and Strategic Decision Support Model for Offshore Wind,”
Energy Procedia, vol. 35, pp. 157–166, Jan. 2013.
[17] M. Scheu, D. Matha, M. Hofmann, and M. Muskulus, “Maintenance Strategies for Large
Offshore Wind Farms,” Energy Procedia, vol. 24, no. January, pp. 281–288, Jan. 2012.
[18] A. Raventos, A. Sarmento, F. Neumann, and N. Matos, “Projected Deployment and
Costs of Wave Energy in Europe,” in Third International Conference on Ocean Energy,
Bilbao, Spain, 2010, pp. 12–17.
[19] G. J. Dalton, R. Alcorn, and T. Lewis, “Case study feasibility analysis of the Pelamis wave
energy convertor in Ireland, Portugal and North America,” Renew. Energy, vol. 35, no. 2,
pp. 443–455, 2010.
[20] G. J. Dalton and T. Lewis, “Performance and economic feasibility analysis of 5 wave
energy devices off the west coast of Ireland,” in Ninth European Wave and Tidal Energy
Conference, Southampton, United Kingdom, 2011, p. not paginated.
[21] B. Teillant, R. Costello, J. Weber, and J. Ringwood, “Productivity and economic
assessment of wave energy projects through operational simulations,” Renew. Energy,
vol. 48, pp. 220–230, Dec. 2012.
[22] M. O’Connor, T. Lewis, and G. Dalton, “Techno-economic performance of the Pelamis
P1 and Wavestar at different ratings and various locations in Europe,” Renew. Energy,
vol. 50, pp. 889–900, Feb. 2013.
[23] “ORECCA project,” 2012. [Online]. Available: http://www.orecca.eu/home.
[24] “4COffshore Limited.” [Online]. Available: http://www.4coffshore.com/index.html.
[25] “DTOcean project.” [Online]. Available: http://www.dtocean.eu/.
[26] Det Norske Veritas, “Design and installation of fluke anchors in clay,” Oslo, Norway,
2000.
[27] Det Norske Veritas, “Design and installation of plate anchors in clay,” Oslo, Norway.
[28] Det Norske Veritas, “Geotechnical design and installation of suction anchors in clay,”
Oslo, Norway, 2005.
[29] Det Norske Veritas, “Risk management in marine - and subsea operations,” Oslo,
Norway, 2003.
[30] Det Norske Veritas, “Marine operations during removal of offshore installations,” Oslo,
Norway, 2004.
Deliverable 5.1 – Methodology report and logistic model flow charts
31
Doc: DTO_WP5_ECD_D5.1 Rev: 1.0 Date: 23.07.2014
[31] Det Norske Veritas, “Modelling and analysis of marine operations,” Oslo, Norway, 2011.
[32] Det Norske Veritas, “Certification of Tidal and Wave Energy Converters,” Oslo, Norway,
2011.
[33] Det Norske Veritas, “Position Mooring,” Oslo, Norway, 2010.
[34] G. J. W. Van Bussel and M. B. Zaaijer, “Reliability , Availability and Maintenance aspects
of large-scale offshore wind farms , a concepts study .,” in Marine Renewable Energy
Conference, 2001.
[35] C. Januário, S. Semino, and M. Bell, “Offshore Windfarm Decommissioning : A proposal
for guidelines to be included in the European Maritime Policy,” in European Wind
Energy Conference, 2007, pp. 1–10.
[36] Climate Change Capital, “Offshore Renewable Energy Installation Decommissioning
Study,” 2006.
[37] M. J. Kaiser and B. Snyder, “Modeling the decommissioning cost of offshore wind
development on the U.S. Outer Continental Shelf,” Mar. Policy, pp. 1–12, 2011.
[38] M. J. Kaiser and B. Snyder, “Offshore Wind Energy Installation and Decommissioning
Cost Estimation in the U . S . Outer Continental Shelf,” Herndon, VA, 2010.
[39] B. Maples, G. Saur, M. Hand, R. van de Pietermen, and T. Obdam, “Installation,
operation, and maintenance strategies to reduce the cost of offshore wind energy,”
2013.
[40] O. Bonini, “Assessment of an Installation Logistics Model for Ocean Energy Arrays,”
2014.
[41] Institute of Shipping Economics and Logistics, “Offshore Wind Power Logistics as a
Competitive Factor.” pp. 1–4, 2012.
[42] MojoMaritime Ltd., “Marine Economic Risk Management aid - Mermaid,”
http://mojomaritime.com/en/rd/mermaid/. 2013.
[43] L. W. M. . Rademakers, H. Braam, and T. S. Obdam, “Estimating costs of operation &
maintenance for offshore wind farms,” in European Wind Energy Conference, 2008, vol.
2008, pp. 1–10.
[44] L. W. M. . Rademakers and H. Braam, “O&M aspects of the 500MW offshore wind farm
at NL7 Baseline Configuration,” 2002.
[45] OutSmart, “O&M Optimization Tool.” 2013.

Deliverable 5.1 – Methodology report and logistic model flow charts
32
Doc: DTO_WP5_ECD_D5.1 Rev: 1.0 Date: 23.07.2014
[46] I. Dinwoodie and D. McMillan, “Sensitivity of Offshore Wind Turbine Operation &
Maintenance Costs to Operational Parameters,” in 42nd ESReDA Seminar: Risk and
Reliability for Wind Energy and other Renewable Sources, 2012, no. May.
[47] InField the energy analyst, “Offshore Construction Vessels Database.” 2014.
[48] ABS, “ABS Eagle Record online database.” 2014.
[49] VTExplorer, “Vessel database / Ship database.” 2014.
[50] FleetMon, “Vessel database.” 2014.
[51] Clarkson Research, “Offshore Databases & Bespoke Data Feeds.” 2014.
[52] DHIGroup, “SI Ocean GIS map.” 2014.
[53] Ocean Energy Systems, “OES GIS map.” 2013.
[54] National Geospatial-Intelligence Agency, “Wold Port Index.” 2014.
[55] Wolrd Port Source, “Wold Port Source database.” 2014.
[56] FleetMon, “Port database.” 2014.
APPENDIXES
APPENDIX A. REVIEW OF LOGISTIC TOOLS
This appendix reviews the list of the selected offshore logistic numerical tools relevant to MRE
sector. First, a brief description of every logistic tool encountered is provided. Any useful image
illustrating the methodology or the capabilities of the tools found in the literature is pasted in this
appendix.
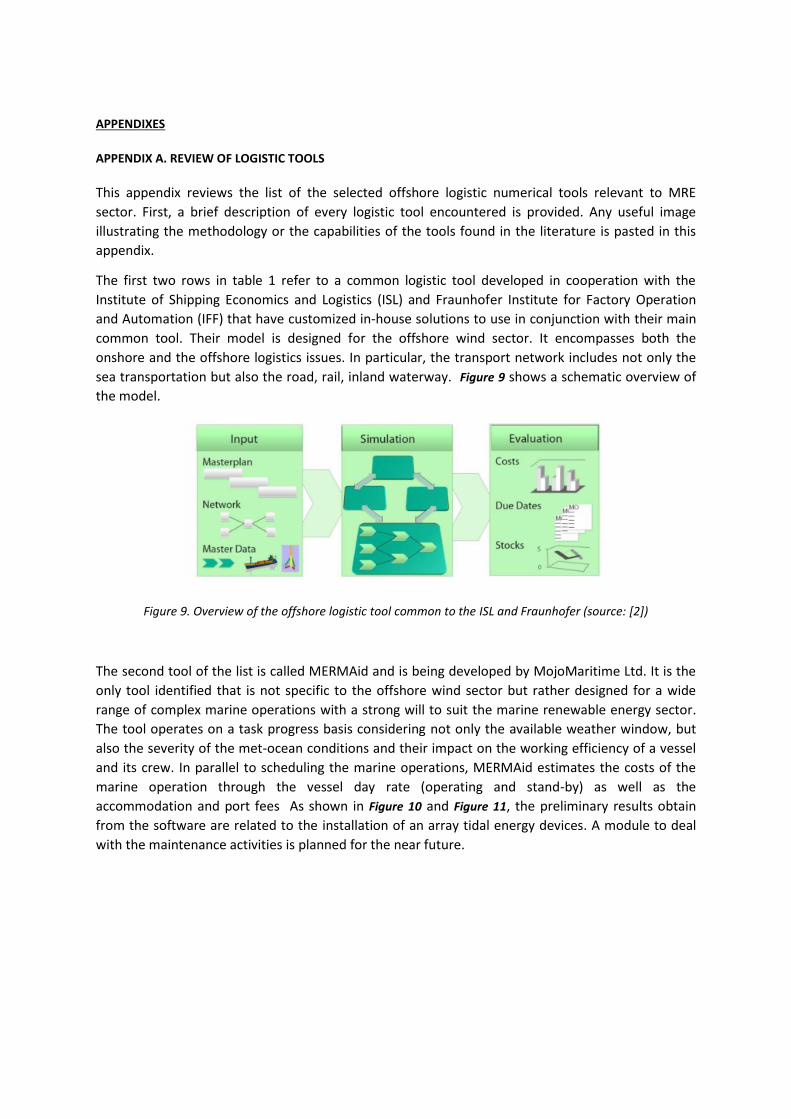
The first two rows in table 1 refer to a common logistic tool developed in cooperation with the
Institute of Shipping Economics and Logistics (ISL) and Fraunhofer Institute for Factory Operation
and Automation (IFF) that have customized in-house solutions to use in conjunction with their main
common tool. Their model is designed for the offshore wind sector. It encompasses both the
onshore and the offshore logistics issues. In particular, the transport network includes not only the
sea transportation but also the road, rail, inland waterway. Figure 9 shows a schematic overview of
the model.
Figure 9. Overview of the offshore logistic tool common to the ISL and Fraunhofer (source: [2])
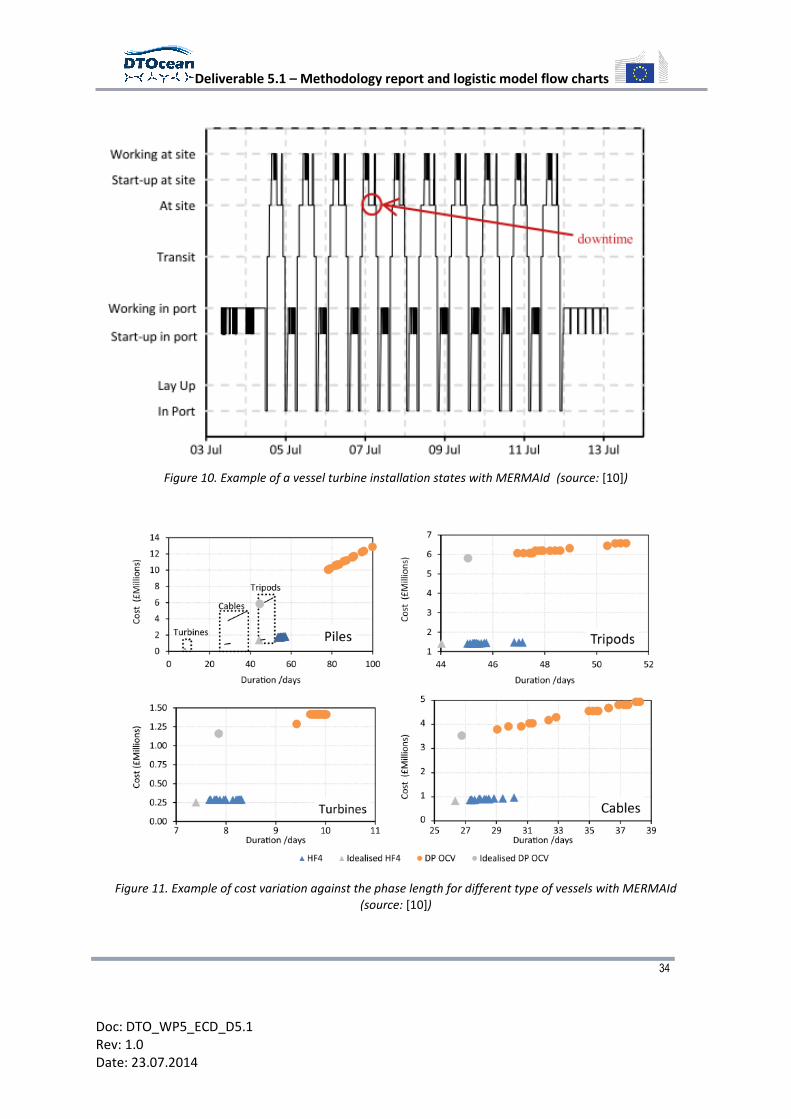
The second tool of the list is called MERMAid and is being developed by MojoMaritime Ltd. It is the
only tool identified that is not specific to the offshore wind sector but rather designed for a wide
range of complex marine operations with a strong will to suit the marine renewable energy sector.
The tool operates on a task progress basis considering not only the available weather window, but
also the severity of the met-ocean conditions and their impact on the working efficiency of a vessel
and its crew. In parallel to scheduling the marine operations, MERMAid estimates the costs of the
marine operation through the vessel day rate (operating and stand-by) as well as the
accommodation and port fees As shown in Figure 10 and Figure 11, the preliminary results obtain
from the software are related to the installation of an array tidal energy devices. A module to deal
with the maintenance activities is planned for the near future.
Deliverable 5.1 – Methodology report and logistic model flow charts
34
Doc: DTO_WP5_ECD_D5.1 Rev: 1.0 Date: 23.07.2014
Figure 10. Example of a vessel turbine installation states with MERMAId (source: [10])
Figure 11. Example of cost variation against the phase length for different type of vessels with MERMAId (source: [10])
Deliverable 5.1 – Methodology report and logistic model flow charts
35
Doc: DTO_WP5_ECD_D5.1 Rev: 1.0 Date: 23.07.2014
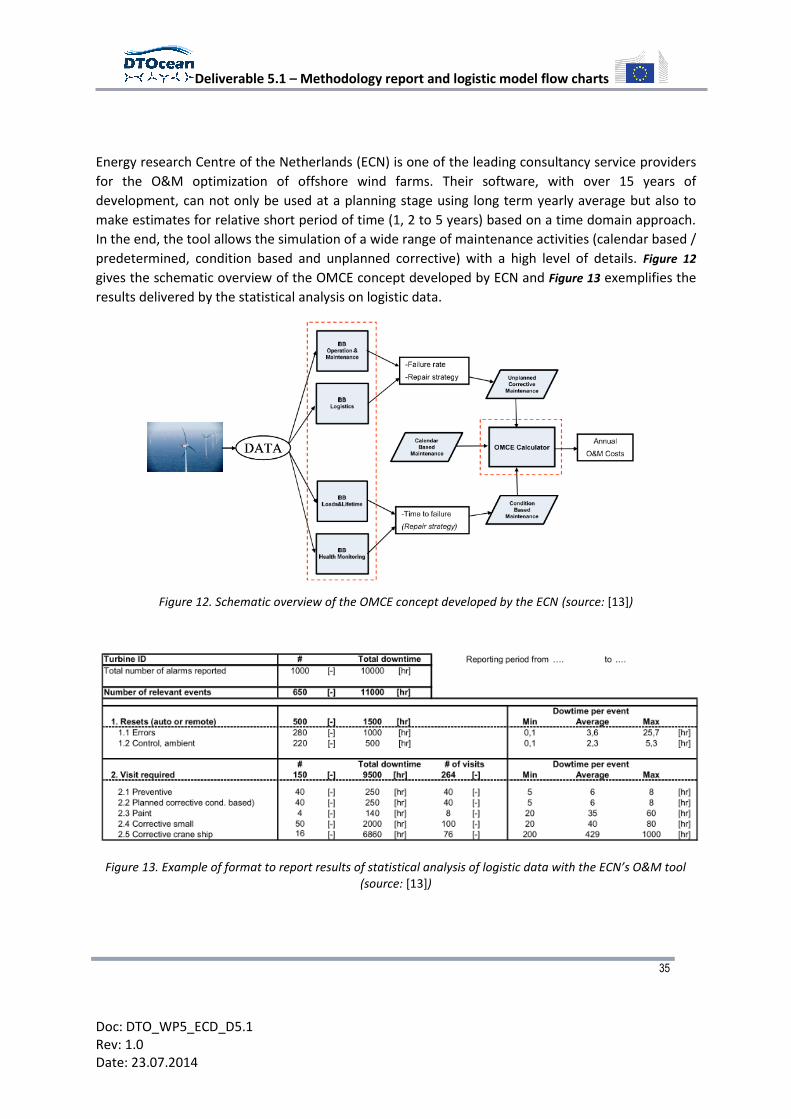
Energy research Centre of the Netherlands (ECN) is one of the leading consultancy service providers
for the O&M optimization of offshore wind farms. Their software, with over 15 years of
development, can not only be used at a planning stage using long term yearly average but also to
make estimates for relative short period of time (1, 2 to 5 years) based on a time domain approach.
In the end, the tool allows the simulation of a wide range of maintenance activities (calendar based /
predetermined, condition based and unplanned corrective) with a high level of details. Figure 12
gives the schematic overview of the OMCE concept developed by ECN and Figure 13 exemplifies the
results delivered by the statistical analysis on logistic data.
Figure 12. Schematic overview of the OMCE concept developed by the ECN (source: [13])
Figure 13. Example of format to report results of statistical analysis of logistic data with the ECN’s O&M tool (source: [13])
Deliverable 5.1 – Methodology report and logistic model flow charts
36
Doc: DTO_WP5_ECD_D5.1 Rev: 1.0 Date: 23.07.2014
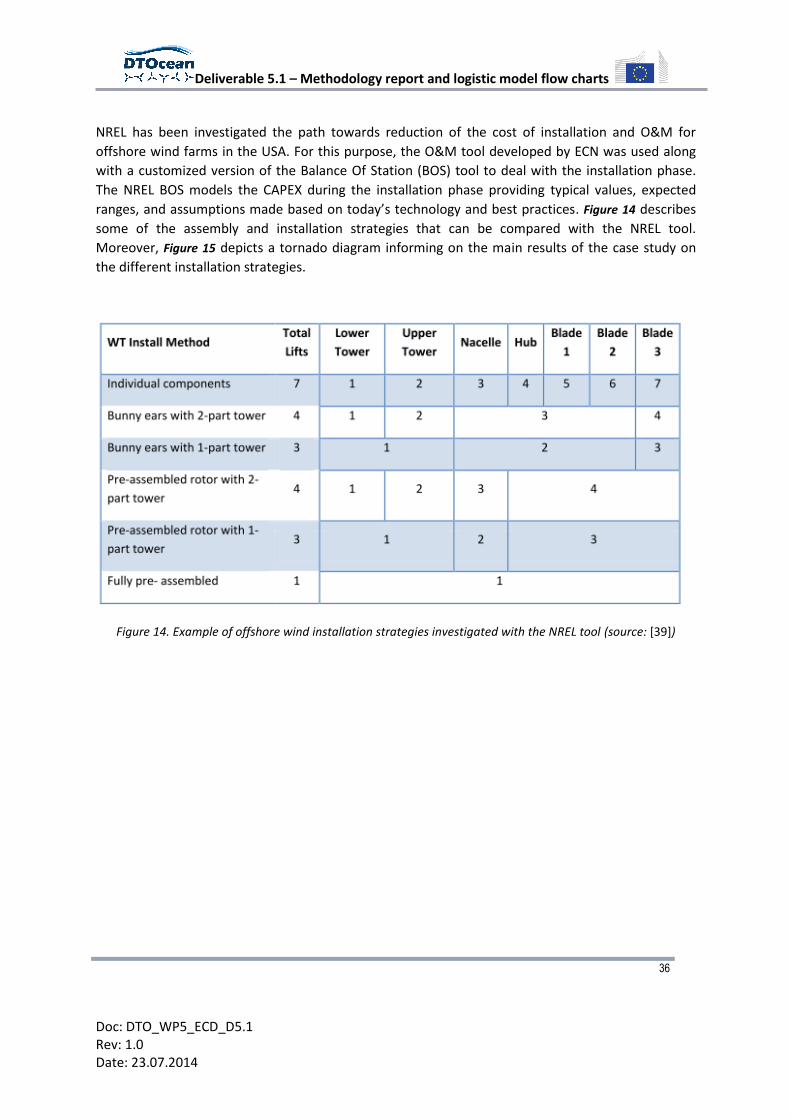
NREL has been investigated the path towards reduction of the cost of installation and O&M for
offshore wind farms in the USA. For this purpose, the O&M tool developed by ECN was used along
with a customized version of the Balance Of Station (BOS) tool to deal with the installation phase.
The NREL BOS models the CAPEX during the installation phase providing typical values, expected
ranges, and assumptions made based on today’s technology and best practices. Figure 14 describes
some of the assembly and installation strategies that can be compared with the NREL tool.
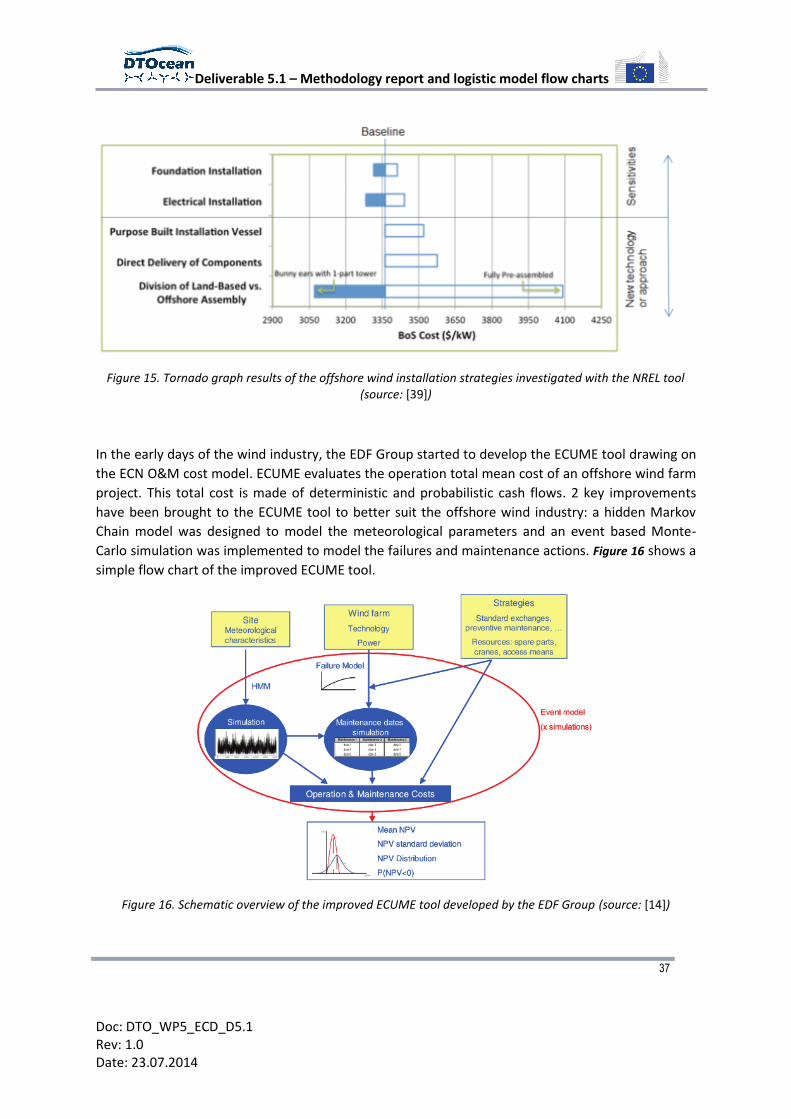
Moreover, Figure 15 depicts a tornado diagram informing on the main results of the case study on
the different installation strategies.
Figure 14. Example of offshore wind installation strategies investigated with the NREL tool (source: [39])
Deliverable 5.1 – Methodology report and logistic model flow charts
37
Doc: DTO_WP5_ECD_D5.1 Rev: 1.0 Date: 23.07.2014
Figure 15. Tornado graph results of the offshore wind installation strategies investigated with the NREL tool (source: [39])
In the early days of the wind industry, the EDF Group started to develop the ECUME tool drawing on
the ECN O&M cost model. ECUME evaluates the operation total mean cost of an offshore wind farm
project. This total cost is made of deterministic and probabilistic cash flows. 2 key improvements
have been brought to the ECUME tool to better suit the offshore wind industry: a hidden Markov
Chain model was designed to model the meteorological parameters and an event based Monte-
Carlo simulation was implemented to model the failures and maintenance actions. Figure 16 shows a
simple flow chart of the improved ECUME tool.
Figure 16. Schematic overview of the improved ECUME tool developed by the EDF Group (source: [14])
Deliverable 5.1 – Methodology report and logistic model flow charts
38
Doc: DTO_WP5_ECD_D5.1 Rev: 1.0 Date: 23.07.2014
The OutSmart tool consists of two parts: the EBITDA calculator and the strategy simulator. The
EBITDA calculator has a large variety of costs structures build in that can be adjusted for some
location. EBITDA estimates the cost of a given logistic scenario. Then the strategy simulator
processes the data belonging to the logistic scenario, delivering production loss and wind turbine
stop hours. The strategy simulator makes uses of the historical weather data of the specific site.
OutSmart suite of tools are primarily designed for the operational phase but can also be used at a
preliminary design stage.
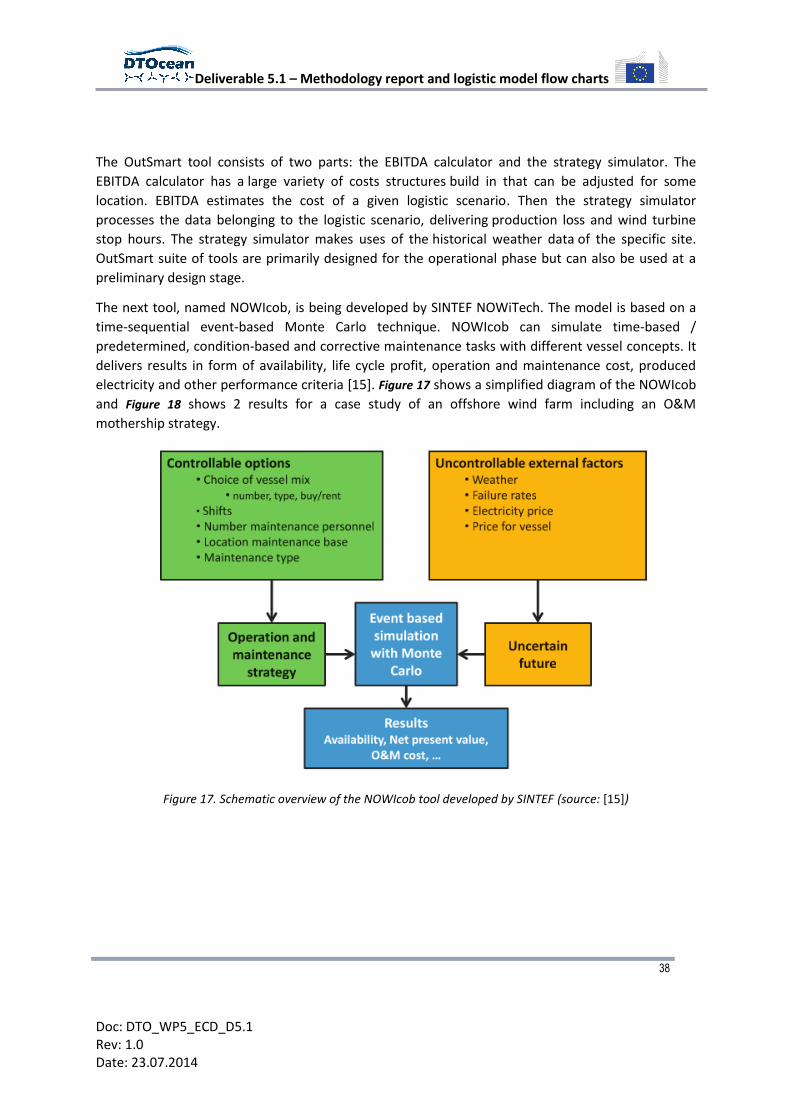
The next tool, named NOWIcob, is being developed by SINTEF NOWiTech. The model is based on a
time-sequential event-based Monte Carlo technique. NOWIcob can simulate time-based /
predetermined, condition-based and corrective maintenance tasks with different vessel concepts. It
delivers results in form of availability, life cycle profit, operation and maintenance cost, produced
electricity and other performance criteria [15]. Figure 17 shows a simplified diagram of the NOWIcob
and Figure 18 shows 2 results for a case study of an offshore wind farm including an O&M
mothership strategy.
Figure 17. Schematic overview of the NOWIcob tool developed by SINTEF (source: [15])
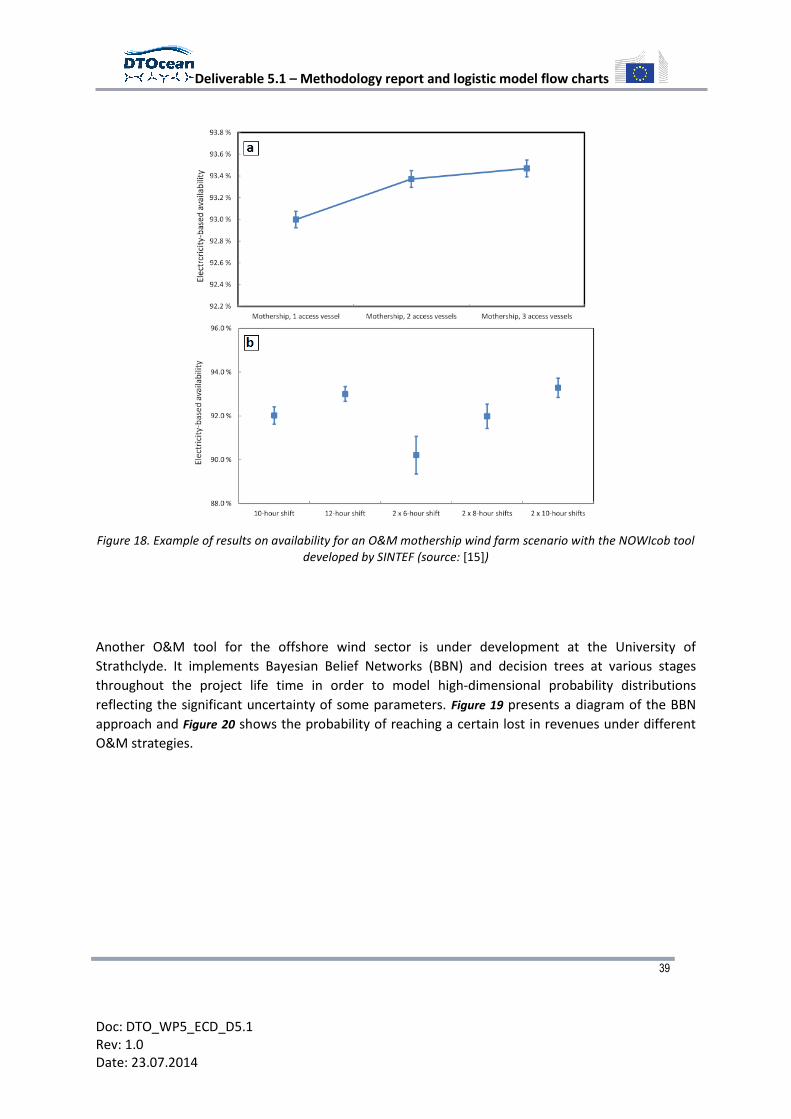
Deliverable 5.1 – Methodology report and logistic model flow charts
39
Doc: DTO_WP5_ECD_D5.1 Rev: 1.0 Date: 23.07.2014
Figure 18. Example of results on availability for an O&M mothership wind farm scenario with the NOWIcob tool developed by SINTEF (source: [15])
Another O&M tool for the offshore wind sector is under development at the University of
Strathclyde. It implements Bayesian Belief Networks (BBN) and decision trees at various stages
throughout the project life time in order to model high-dimensional probability distributions
reflecting the significant uncertainty of some parameters. Figure 19 presents a diagram of the BBN
approach and Figure 20 shows the probability of reaching a certain lost in revenues under different
O&M strategies.
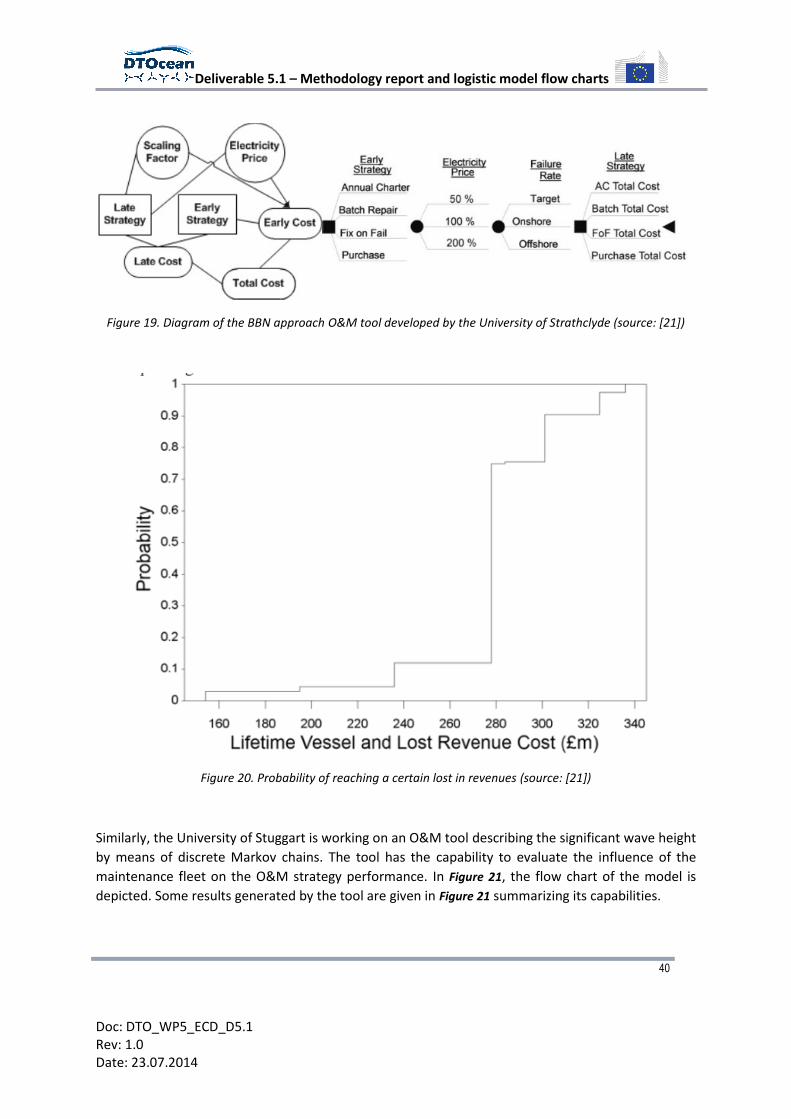
Deliverable 5.1 – Methodology report and logistic model flow charts
40
Doc: DTO_WP5_ECD_D5.1 Rev: 1.0 Date: 23.07.2014
Figure 19. Diagram of the BBN approach O&M tool developed by the University of Strathclyde (source: [21])
Figure 20. Probability of reaching a certain lost in revenues (source: [21])
Similarly, the University of Stuggart is working on an O&M tool describing the significant wave height
by means of discrete Markov chains. The tool has the capability to evaluate the influence of the
maintenance fleet on the O&M strategy performance. In Figure 21, the flow chart of the model is
depicted. Some results generated by the tool are given in Figure 21 summarizing its capabilities.
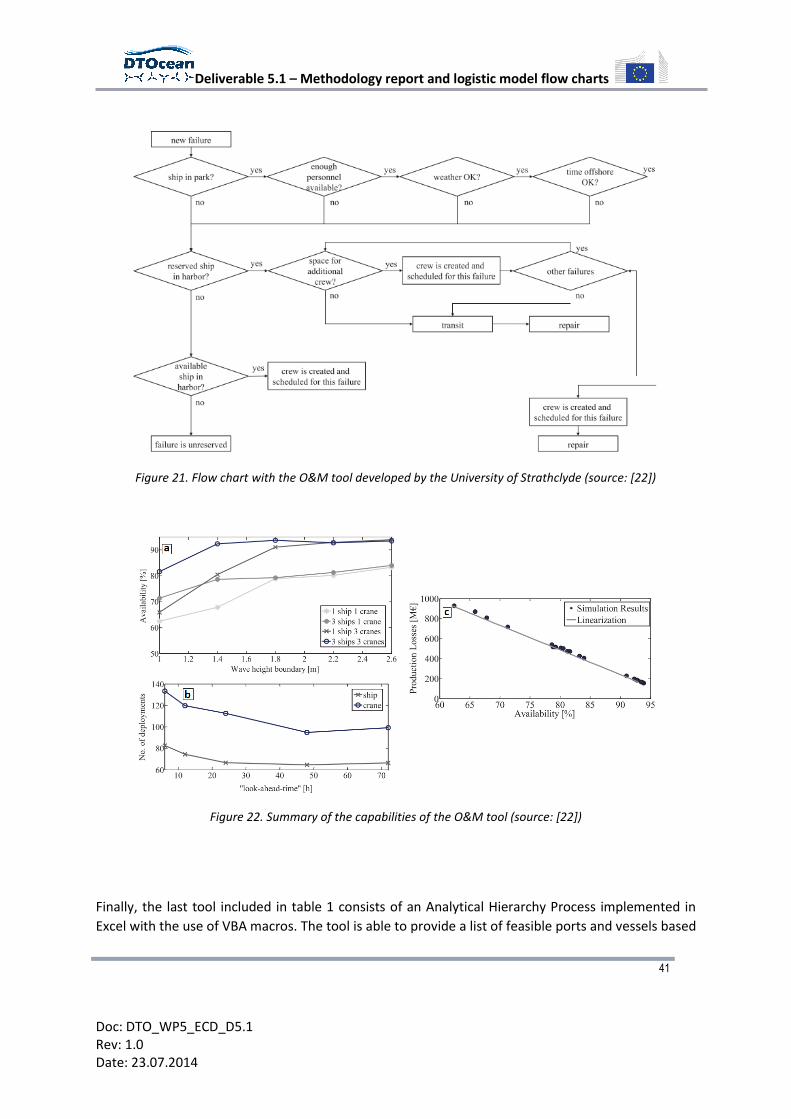
Deliverable 5.1 – Methodology report and logistic model flow charts
41
Doc: DTO_WP5_ECD_D5.1 Rev: 1.0 Date: 23.07.2014
Figure 21. Flow chart with the O&M tool developed by the University of Strathclyde (source: [22])
Figure 22. Summary of the capabilities of the O&M tool (source: [22])
Finally, the last tool included in table 1 consists of an Analytical Hierarchy Process implemented in
Excel with the use of VBA macros. The tool is able to provide a list of feasible ports and vessels based
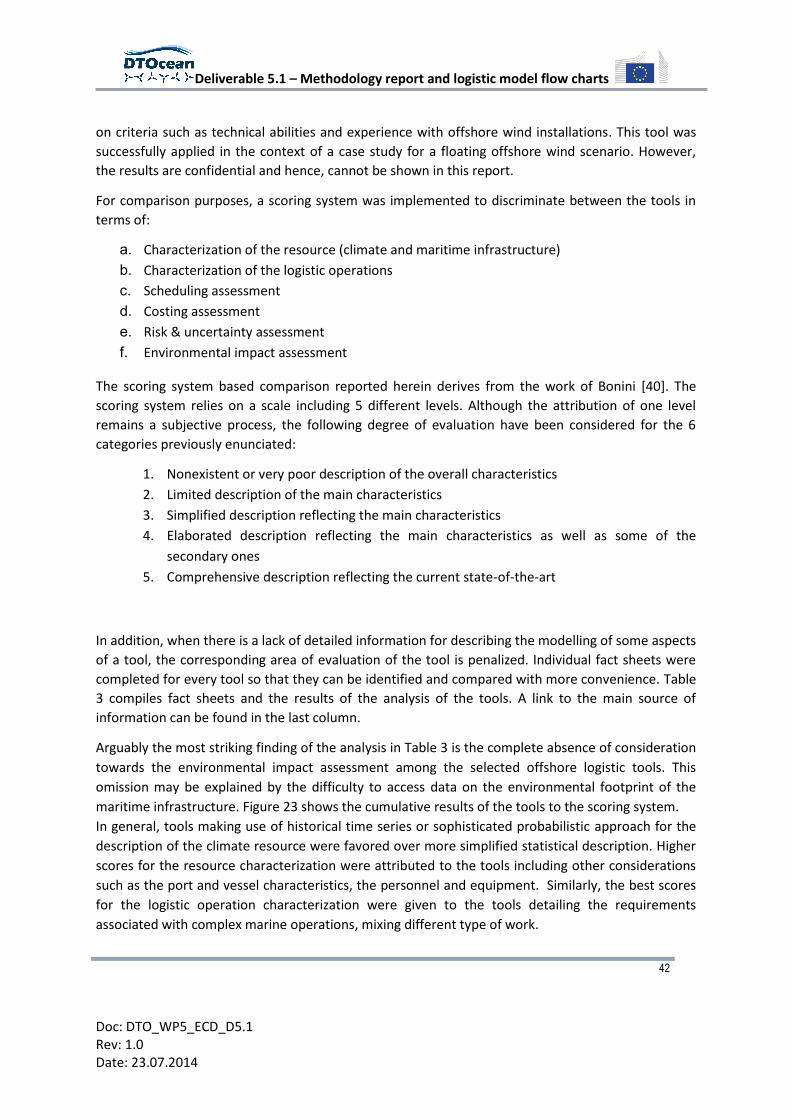
Deliverable 5.1 – Methodology report and logistic model flow charts
42
Doc: DTO_WP5_ECD_D5.1 Rev: 1.0 Date: 23.07.2014
on criteria such as technical abilities and experience with offshore wind installations. This tool was
successfully applied in the context of a case study for a floating offshore wind scenario. However,
the results are confidential and hence, cannot be shown in this report.
For comparison purposes, a scoring system was implemented to discriminate between the tools in
terms of:
a. Characterization of the resource (climate and maritime infrastructure)
b. Characterization of the logistic operations
c. Scheduling assessment
d. Costing assessment
e. Risk & uncertainty assessment
f. Environmental impact assessment
The scoring system based comparison reported herein derives from the work of Bonini [40]. The
scoring system relies on a scale including 5 different levels. Although the attribution of one level
remains a subjective process, the following degree of evaluation have been considered for the 6
categories previously enunciated:
1. Nonexistent or very poor description of the overall characteristics
2. Limited description of the main characteristics
3. Simplified description reflecting the main characteristics
4. Elaborated description reflecting the main characteristics as well as some of the
secondary ones
5. Comprehensive description reflecting the current state-of-the-art
In addition, when there is a lack of detailed information for describing the modelling of some aspects
of a tool, the corresponding area of evaluation of the tool is penalized. Individual fact sheets were
completed for every tool so that they can be identified and compared with more convenience. Table
3 compiles fact sheets and the results of the analysis of the tools. A link to the main source of
information can be found in the last column.
Arguably the most striking finding of the analysis in Table 3 is the complete absence of consideration
towards the environmental impact assessment among the selected offshore logistic tools. This
omission may be explained by the difficulty to access data on the environmental footprint of the
maritime infrastructure. Figure 23 shows the cumulative results of the tools to the scoring system.
In general, tools making use of historical time series or sophisticated probabilistic approach for the
description of the climate resource were favored over more simplified statistical description. Higher
scores for the resource characterization were attributed to the tools including other considerations
such as the port and vessel characteristics, the personnel and equipment. Similarly, the best scores
for the logistic operation characterization were given to the tools detailing the requirements
associated with complex marine operations, mixing different type of work.
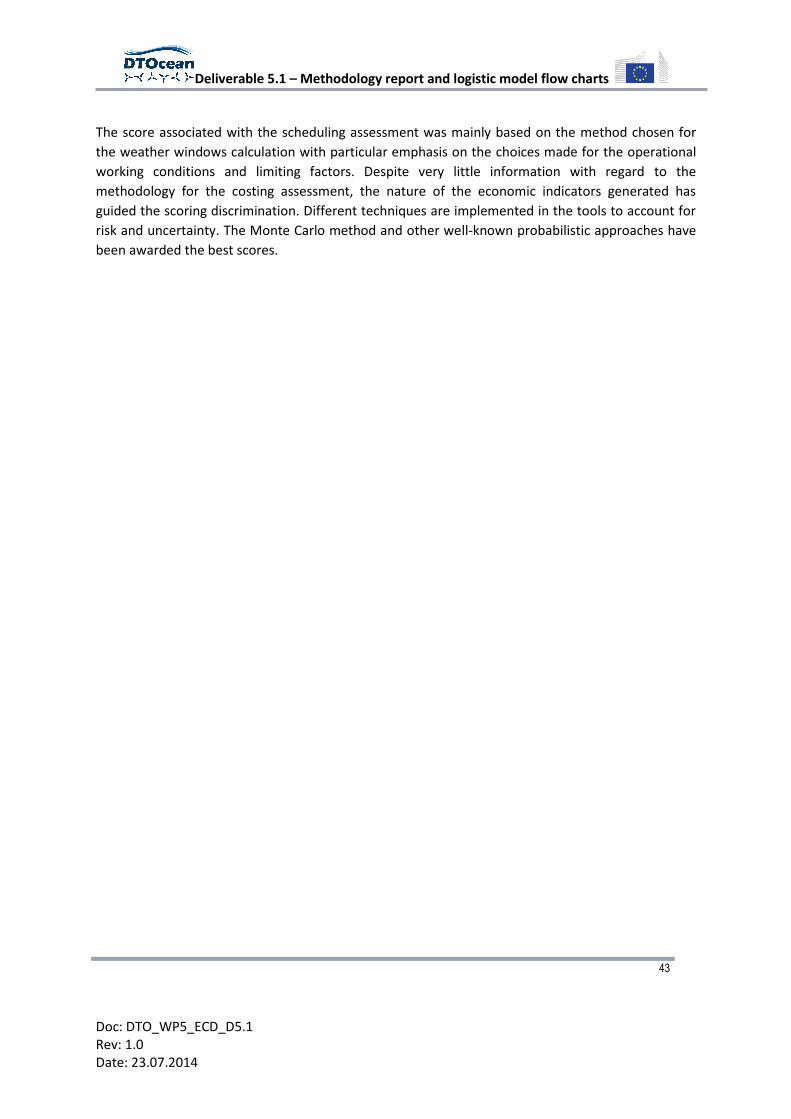
Deliverable 5.1 – Methodology report and logistic model flow charts
43
Doc: DTO_WP5_ECD_D5.1 Rev: 1.0 Date: 23.07.2014
The score associated with the scheduling assessment was mainly based on the method chosen for
the weather windows calculation with particular emphasis on the choices made for the operational
working conditions and limiting factors. Despite very little information with regard to the
methodology for the costing assessment, the nature of the economic indicators generated has
guided the scoring discrimination. Different techniques are implemented in the tools to account for
risk and uncertainty. The Monte Carlo method and other well-known probabilistic approaches have
been awarded the best scores.
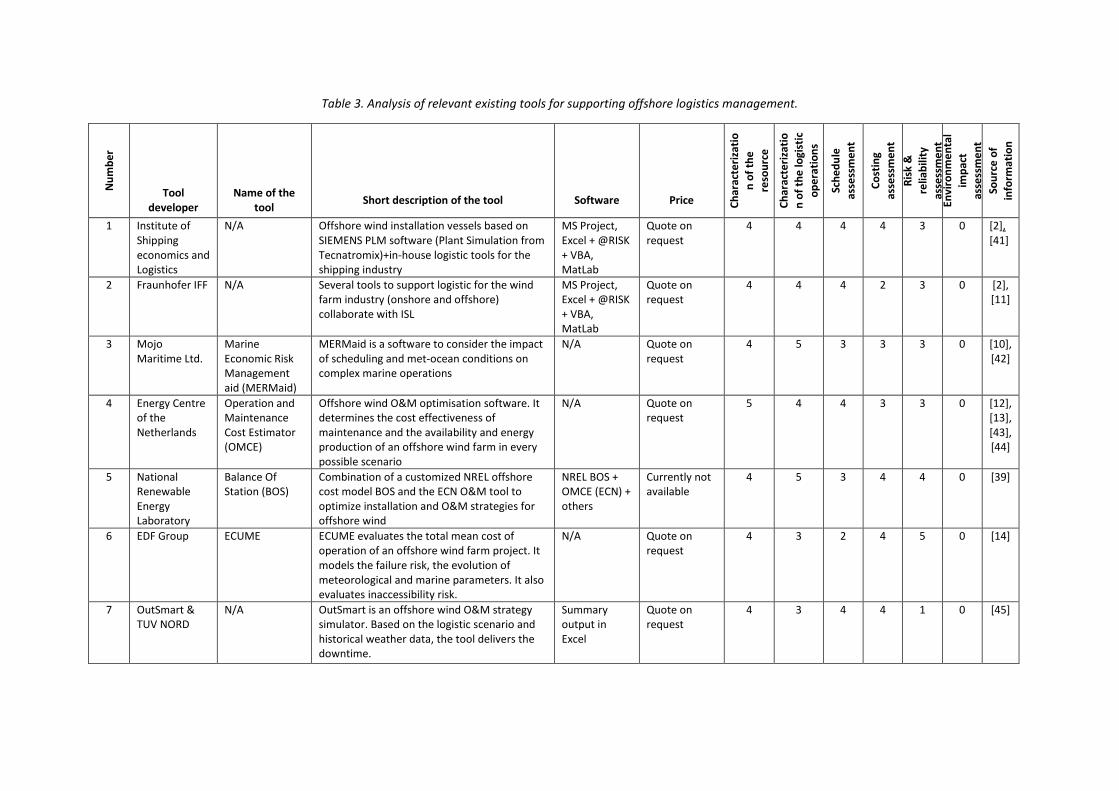
Table 3. Analysis of relevant existing tools for supporting offshore logistics management. N
um
be
r
Tool developer
Name of the tool
Short description of the tool
Software
Price Ch
arac
teri
zati
o
n o
f th
e
reso
urc
e
Ch
arac
teri
zati
o
n o
f th
e lo
gist
ic
op
era
tio
ns
Sch
ed
ule
asse
ssm
en
t
Co
stin
g
asse
ssm
en
t
Ris
k &
relia
bili
ty
asse
ssm
en
t En
viro
nm
en
tal
imp
act
asse
ssm
en
t
Sou
rce
of
info
rmat
ion
1 Institute of Shipping economics and Logistics
N/A Offshore wind installation vessels based on SIEMENS PLM software (Plant Simulation from Tecnatromix)+in-house logistic tools for the shipping industry
MS Project, Excel + @RISK + VBA, MatLab
Quote on request
4 4 4 4 3 0 [2], [41]
2 Fraunhofer IFF N/A Several tools to support logistic for the wind farm industry (onshore and offshore) collaborate with ISL
MS Project, Excel + @RISK + VBA, MatLab
Quote on request
4 4 4 2 3 0 [2], [11]
3 Mojo Maritime Ltd.
Marine Economic Risk Management aid (MERMaid)
MERMaid is a software to consider the impact of scheduling and met-ocean conditions on complex marine operations
N/A Quote on request
4 5 3 3 3 0 [10], [42]
4 Energy Centre of the Netherlands
Operation and Maintenance Cost Estimator (OMCE)
Offshore wind O&M optimisation software. It determines the cost effectiveness of maintenance and the availability and energy production of an offshore wind farm in every possible scenario
N/A Quote on request
5 4 4 3 3 0 [12], [13], [43], [44]
5 National Renewable Energy Laboratory
Balance Of Station (BOS)
Combination of a customized NREL offshore cost model BOS and the ECN O&M tool to optimize installation and O&M strategies for offshore wind
NREL BOS + OMCE (ECN) + others
Currently not available
4 5 3 4 4 0 [39]
6 EDF Group ECUME ECUME evaluates the total mean cost of operation of an offshore wind farm project. It models the failure risk, the evolution of meteorological and marine parameters. It also evaluates inaccessibility risk.
N/A Quote on request
4 3 2 4 5 0 [14]
7 OutSmart & TUV NORD
N/A OutSmart is an offshore wind O&M strategy simulator. Based on the logistic scenario and historical weather data, the tool delivers the downtime.
Summary output in Excel
Quote on request
4 3 4 4 1 0 [45]
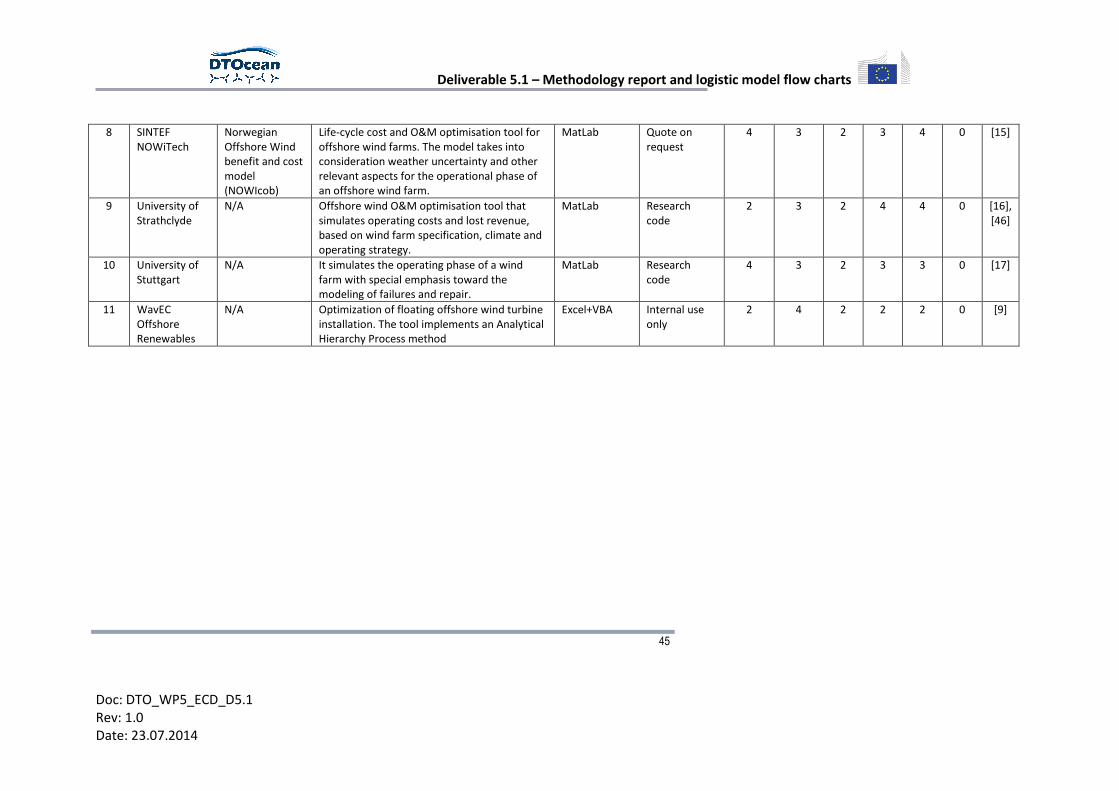
Deliverable 5.1 – Methodology report and logistic model flow charts
45
Doc: DTO_WP5_ECD_D5.1 Rev: 1.0 Date: 23.07.2014
8 SINTEF NOWiTech
Norwegian Offshore Wind benefit and cost model (NOWIcob)
Life-cycle cost and O&M optimisation tool for offshore wind farms. The model takes into consideration weather uncertainty and other relevant aspects for the operational phase of an offshore wind farm.
MatLab Quote on request
4 3 2 3 4 0 [15]
9 University of Strathclyde
N/A Offshore wind O&M optimisation tool that simulates operating costs and lost revenue, based on wind farm specification, climate and operating strategy.
MatLab Research code
2 3 2 4 4 0 [16], [46]
10 University of Stuttgart
N/A It simulates the operating phase of a wind farm with special emphasis toward the modeling of failures and repair.
MatLab Research code
4 3 2 3 3 0 [17]
11 WavEC Offshore Renewables
N/A Optimization of floating offshore wind turbine installation. The tool implements an Analytical Hierarchy Process method
Excel+VBA Internal use only
2 4 2 2 2 0 [9]
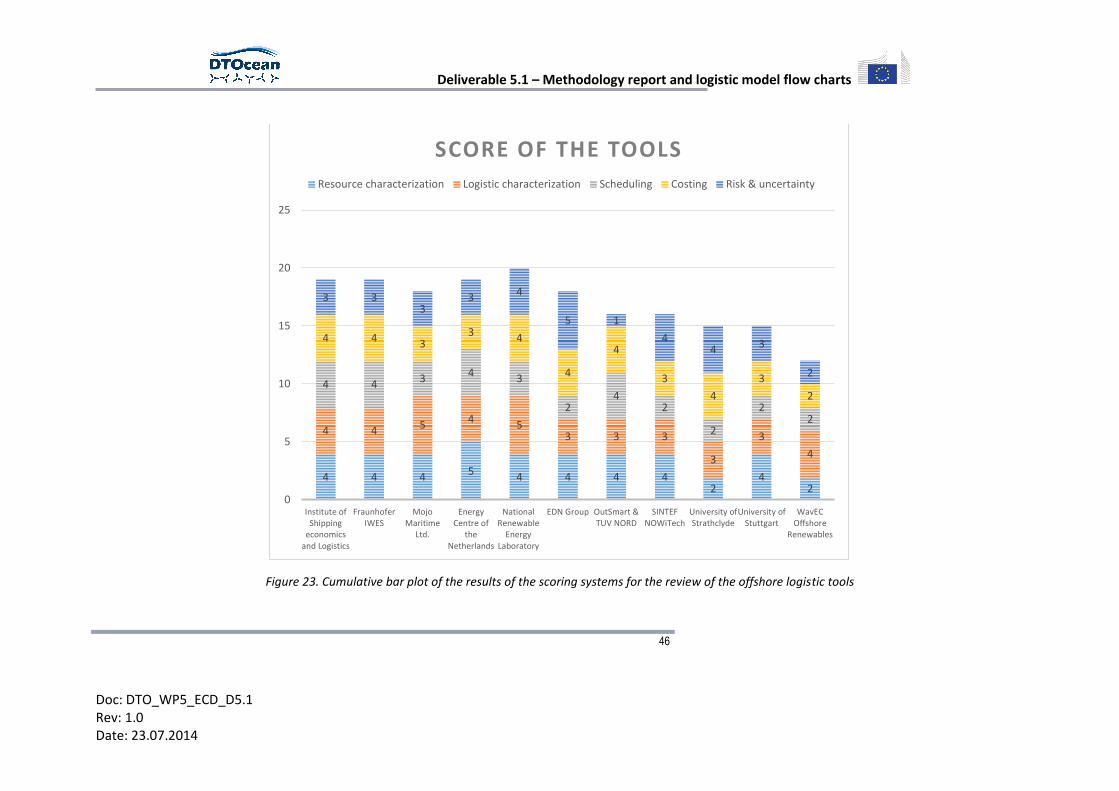
Deliverable 5.1 – Methodology report and logistic model flow charts
46
Doc: DTO_WP5_ECD_D5.1 Rev: 1.0 Date: 23.07.2014
Figure 23. Cumulative bar plot of the results of the scoring systems for the review of the offshore logistic tools
4 4 4 5 4 4 4 4 2
4 2
4 4 5 4 5 3 3 3
3
3
4
4 4 3 4 3
2 4
2
2
2 2
4 4 3 3 4
4
4
3
4
3
2
3 3 3
3 4
5 1
4 4 3
2
0
5
10
15
20
25
Institute ofShipping
economicsand Logistics
FraunhoferIWES
MojoMaritime
Ltd.
EnergyCentre of
theNetherlands
NationalRenewable
EnergyLaboratory
EDN Group OutSmart &TUV NORD
SINTEFNOWiTech
University ofStrathclyde
University ofStuttgart
WavECOffshore
Renewables
SCORE OF THE TOOLS
Resource characterization Logistic characterization Scheduling Costing Risk & uncertainty

APPENDIX B. REVIEW OF LOGISTIC PORT AND VESSEL DATABASES
To assess the level of details of the description of the maritime infrastructure characteristics, a scale
has also been used. Below, the signification of each degree of the scale is given:
1. Only general information,
2. Include the main technical specifications or only some non-technical information,
3. Detailed technical description or detailed non-technical information,
4. Full technical specifications and some additional information such as experience, working
conditions, access, availability and/or costs, and
5. Comprehensive listing of all characteristics.
In comparison with table 1, the databases corresponding to ports and vessels have been separately
tabulated.
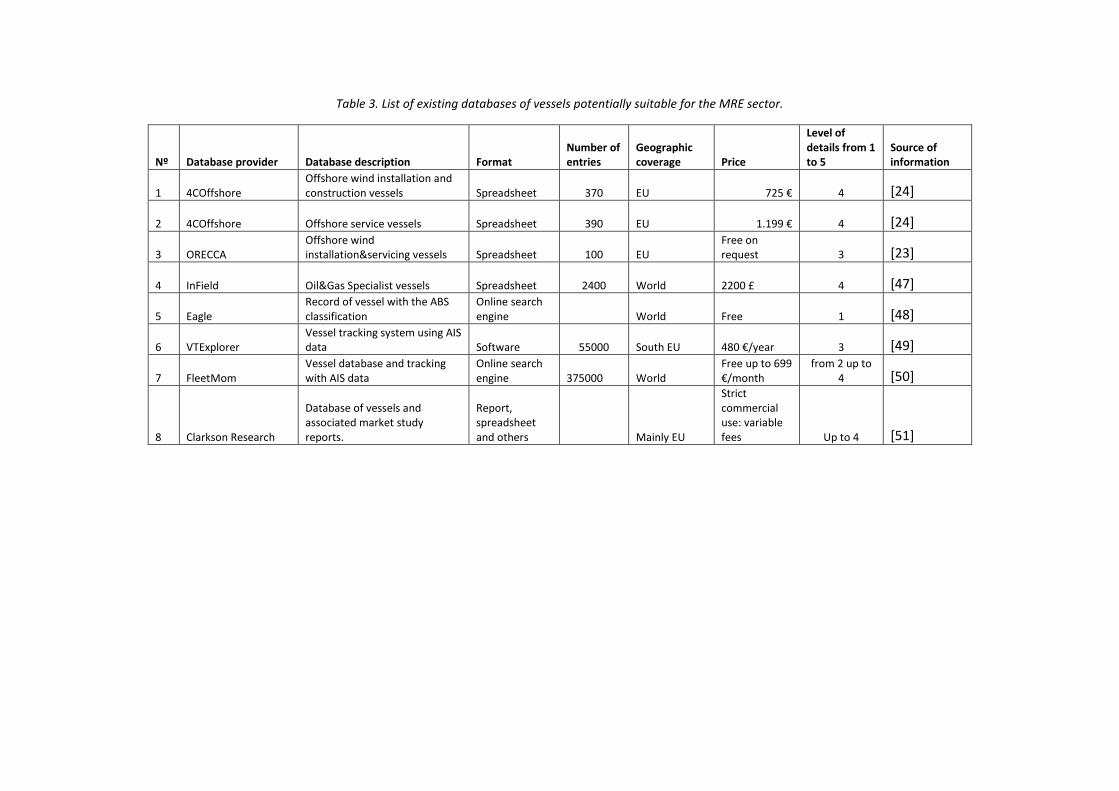
Table 3. List of existing databases of vessels potentially suitable for the MRE sector.
Nº Database provider Database description Format Number of entries
Geographic coverage Price
Level of details from 1 to 5
Source of information
1 4COffshore Offshore wind installation and construction vessels Spreadsheet 370 EU 725 € 4 [24]
2 4COffshore Offshore service vessels Spreadsheet 390 EU 1.199 € 4 [24]
3 ORECCA Offshore wind installation&servicing vessels Spreadsheet 100 EU
Free on request 3 [23]
4 InField Oil&Gas Specialist vessels Spreadsheet 2400 World 2200 £ 4 [47]
5 Eagle Record of vessel with the ABS classification
Online search engine
World Free 1 [48]
6 VTExplorer Vessel tracking system using AIS data Software 55000 South EU 480 €/year 3 [49]
7 FleetMom Vessel database and tracking with AIS data
Online search engine 375000 World
Free up to 699 €/month
from 2 up to 4 [50]
8 Clarkson Research
Database of vessels and associated market study reports.
Report, spreadsheet and others
Mainly EU
Strict commercial use: variable fees Up to 4 [51]
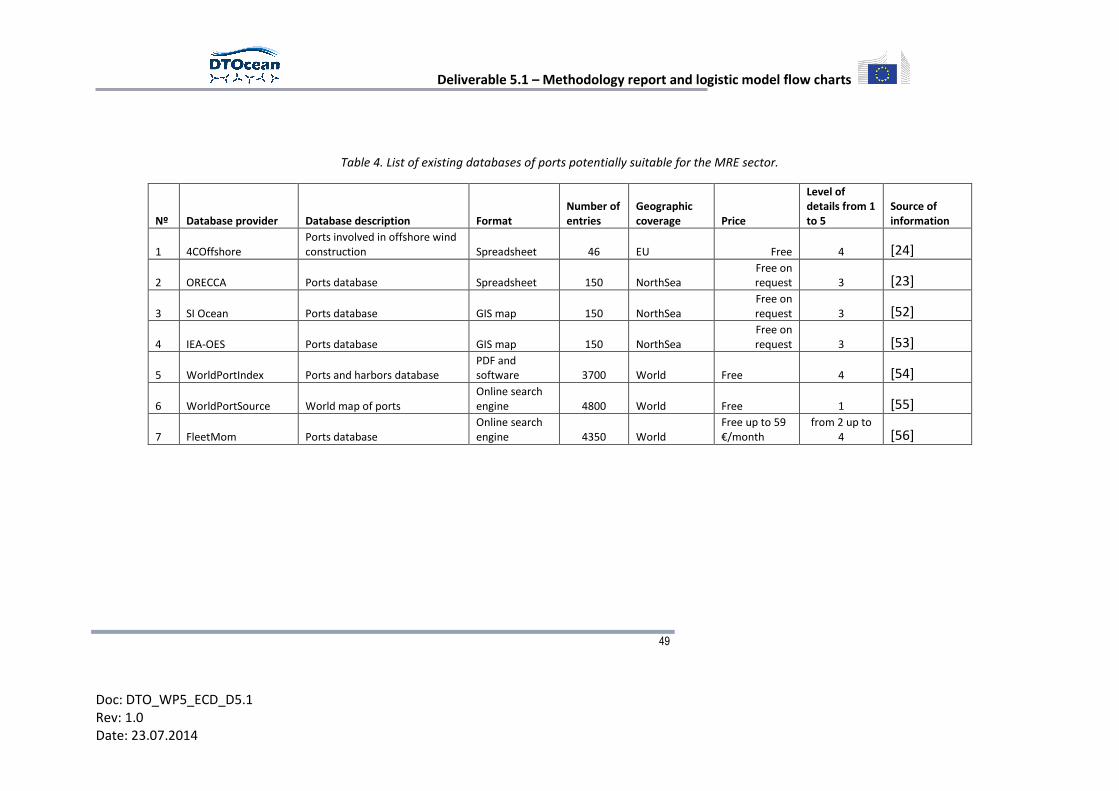
Deliverable 5.1 – Methodology report and logistic model flow charts
49
Doc: DTO_WP5_ECD_D5.1 Rev: 1.0 Date: 23.07.2014
Table 4. List of existing databases of ports potentially suitable for the MRE sector.
Nº Database provider Database description Format Number of entries
Geographic coverage Price
Level of details from 1 to 5
Source of information
1 4COffshore Ports involved in offshore wind construction Spreadsheet 46 EU Free 4 [24]
2 ORECCA Ports database Spreadsheet 150 NorthSea Free on request 3 [23]
3 SI Ocean Ports database GIS map 150 NorthSea Free on request 3 [52]
4 IEA-OES Ports database GIS map 150 NorthSea Free on request 3 [53]
5 WorldPortIndex Ports and harbors database PDF and software 3700 World Free 4 [54]
6 WorldPortSource World map of ports Online search engine 4800 World Free 1 [55]
7 FleetMom Ports database Online search engine 4350 World
Free up to 59 €/month
from 2 up to 4 [56]