Embed Size (px)
Citation preview
WATER-M
Unified Intelligent WATER
Deliverable 3.5
Standard Operation Procedures for water security -
Hazard identification and risk assessment
Confidential Page 2 of 53 15/12/2017
Project Identifier Water-M
Project Title Unified Intelligent Water
Document Version 1.0
Planned Delivery Date 15.12.2017
Actual Delivery Date 15.12.2017
Document Title Standard Operation Procedures for water security -
Hazard identification and risk assessment
Work Package WP3 (Task 3.5)
Document Type Word
Abstract Risk Assessment, Physical security and Damage Containment Report on drinking water risk assessment in Finland and in EU.
Keywords Drinking water, risk assessment, water safety
Function Name Entity
Editor Päivi Meriläinen National Institute for Health and Welfare, Finland
Authors Päivi Meriläinen, Jenni Ikonen, Anna-Maria Hokajärvi, Ilkka Miettinen
Jarkko Räty
National Institute for Health and Welfare, Finland
University of Oulu, Finland
Confidential Page 3 of 53 15/12/2017
Content
List of abbreviations ................................................................................................................... 5
1 Introduction ......................................................................................................................... 7
1.1 Risk assessment of water supply ................................................................................... 8
1.2 Physical security - operational risk in drinking water production .................................... 9
1.3 Hazard identification .................................................................................................... 11
1.4 Health risks in drinking water ....................................................................................... 11
2 Physical security in drinking water treatment ................................................................ 13
2.1 Water storage .............................................................................................................. 13
2.2 Straining ....................................................................................................................... 13
2.3 Filters ........................................................................................................................... 14
2.3.1 Microfilters, slow and rapid sand filters ................................................................ 14
2.4 Activated carbon filters ................................................................................................. 14
2.5 Nanofiltration/Reverse osmosis (RO) ........................................................................... 14
2.6 Mixing .......................................................................................................................... 15
2.7 Clarification .................................................................................................................. 15
2.8 Disinfection .................................................................................................................. 16
2.8.1 Chlorination .......................................................................................................... 16
2.8.2 Other disinfection methods .................................................................................. 18
3 Health risks in drinking water .......................................................................................... 20
3.1 Microbiological health risks .......................................................................................... 20
3.2 Chemical health risks ................................................................................................... 26
3.2.1 Arsenic ................................................................................................................. 37
3.2.2 Fluoride ................................................................................................................ 37
3.2.3 Nitrate .................................................................................................................. 38
3.2.4 Selenium .............................................................................................................. 39
3.2.5 Organic contaminants .......................................................................................... 39
4 Risk assessment methods ............................................................................................... 41
4.1 Water safety plans ....................................................................................................... 41
4.2 Multi-Barrier approach ................................................................................................. 43
4.3 Quantitative microbial risk assessment (QMRA) .......................................................... 43
5 Risk Management protocols in water security ............................................................... 46
5.1 Example of risk management method: Real-time monitoring and Early warning systems (EWS) 47
Confidential Page 4 of 53 15/12/2017
6 Conclusion ......................................................................................................................... 49
References ................................................................................................................................. 51

Confidential Page 5 of 53 15/12/2017
List of abbreviations
EC European Council
EU European Union
DWD drinking water directive
QMRA quantitative microbial risk assessment
UN United Nations
WHO World Health Organization
WSP Water Safety Planning
Confidential Page 6 of 53 15/12/2017
The scope of task 3.5
In this task, a number of current security guidelines and damage containment plans for water supply safety in Finland and EU will be reported. In the Water-M project this task considers the hazard identification and risk assessment in drinking water production from raw water supply to distribution of drinking water to consumers by introducing a Standard Operation Procedures (SOP) for water security with main focus on human health risks. Deliverable D3.5 focuses mainly on the risk assessment and management protocols concerning microbial and chemical hazards.The water security SOP presents basic information on how to assess the notified hazards to determine whether there is a health risk or not. D3.5 promotes information about the corrective mitigation actions could be used for removing/minimizing the assessed risks.
Confidential Page 7 of 53 15/12/2017
1 Introduction
There are several issues concerning the drinking water safety, such as the water supply safety, quality issues regarding raw water source as well as certainty and fluency of the water treatment process. Furthermore, maintenance of the whole water system, from supply to consumer is important. Hazards and risks related to drinking water production can be evaluated and minimized with the different risk assessment tools and frameworks. Different types of risks include: health based risks (chemical and microbial), physical and operational risks, , and cyber security risks. Most common tools for securing drinking water safety are Water Safety Plan (WSP), Multi-barrier Analysis (MBA), and Quantitative Microbial Risk Assessment (QMRA).
Risk assessment has been introduced in the Drinking Water Directive (DWD, EU). According to the amended annexes II and III entered into force on 27th October 2015 (EU COMMISSION DIRECTIVE (EU) 2015/1787), monitoring of drinking water may be based on the risk assessment. If the risk assessment is performed in accordance with the Directive, member states may provide for the possibility to derogate from the parameters and sampling frequencies determined in the Directive. In Finland, the comprehensive risk assessment and risk management protocol has been obligatory in water services since October 2017.
In the 1984 -85, the first edition of the WHO`s Guidelines for Drinking water quality (GDWQ) was published introducing comprehensive knowledge on drinking water quality and safety. During the revision of the 4th edition of it, the value of the Water Safety Plan (WSP) has been constantly highlighted. The WSP can be used to identify the potential hazards in water, assess significance and probability of the risks, and determine the necessary risk management measures to reduce the risks. In briefly: minimizing the dangers and ensuring the water quality. The objectives of WSP is to ensure the safe drinking-water production through a good water supply practice, which includes three main parts (WHO 2011c):
1) Preventing contamination of source waters
2) Treating the water to reduce or remove contamination that could be present to the extent necessary to meet the water quality targets
3) Preventing re-contamination during storage, distribution and handling of drinking-water.
WSP is a step-by-step risk management procedure for drinking water suppliers aiming consistently to ensure safe and acceptable water quality during production. When WSP concept is used, it requires assembling the WSP team among the staff workers of water utility, description of the water supply system assessments including describing the water supply system, identifying the hazardous events and assessing the risks among it. There are several tools that can be used for WSPs and other drinking water related risk assessments. Quantitative microbial risk assessment (QMRA) is a tool for microbial risks assessment. In QMRA, the inputs and estimated health impacts are numerically quantified, and it is a valuable tool to support WSPs (Petterson and Ashbolt 2016). Microbial barrier analysis (MBA) is also used to ensure the sufficient microbial barriers in waterworks (Norwegian Water BA 2014). The Water-M risk assessment diagram (Figure 1) is adapted mainly from QMRA to estimate the health risks in drinking water production

Confidential Page 8 of 53 15/12/2017
systems. This method can be applied to the all drinking water related hazard identifications and risk assessments.
Figure 1. Water-M risk assessment diagram applied for different risks and scenarios
This document will introduce the most common standard operation procedures in securing drinking water safety from hazard identification to risk assessment. The aim of this report was to gather together relevant information on drinking water related health risk assessment and operational security. A number of risk assessment models and tools are introduced. Health guidelines are also be reported in this Water-M deliverable D 3.5 report. These procedures presented here could be used as examples or they can be utilized in the Water-M project`s case studies: Vehmersalmi in Finland and St.Etienne in France.
1.1 Risk assessment of water supply
In the system assessment process, the first step is to describe the water supply. The description should cover the whole system from the source to the point of supply, covering the various types of source water and treatment processes. The following water supply parts may include different types of hazards within these topics:
● Confined or unconfined aquifer
● Aquifer hydrogeology
● Flow rate and direction
Confidential Page 9 of 53 15/12/2017
● Dilution characteristics
● Recharge area
● Well -head protection
● Depth of casing
● Bulk water transport
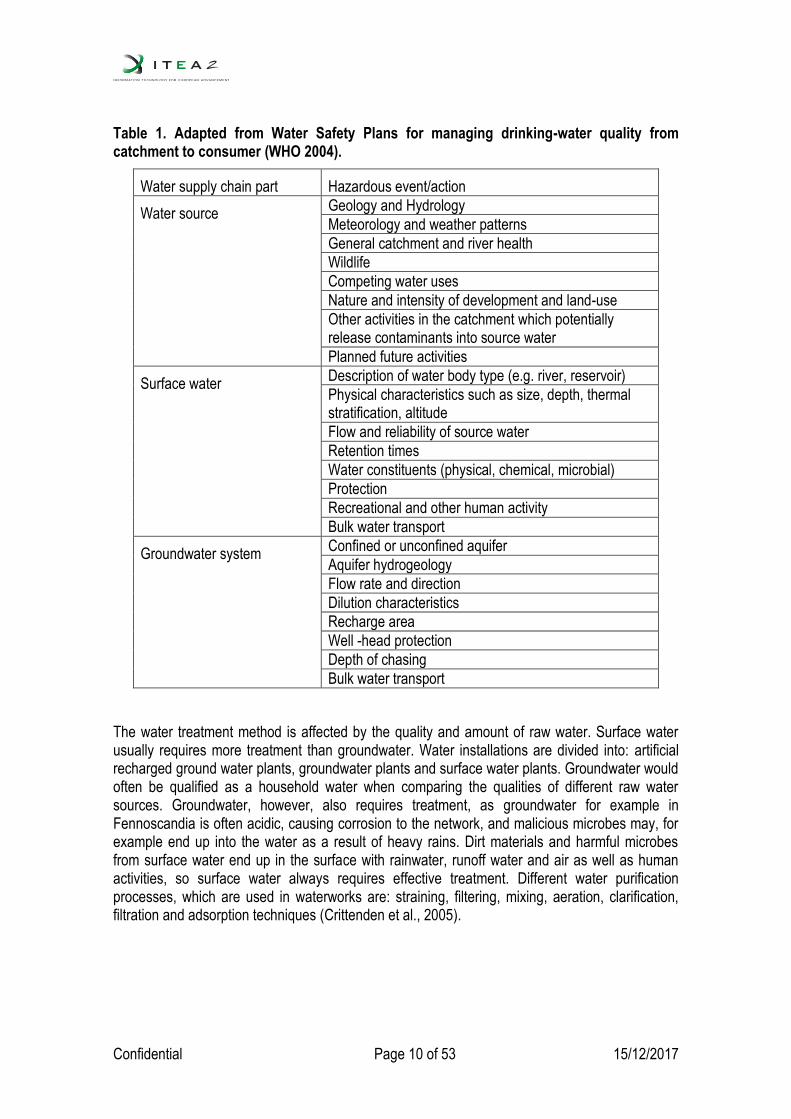
In Table 1. several different hazards are described for drinking water supply from catchment to consumer (WHO 2001b).
1.2 Physical security - operational risk in drinking water production
The production of the drinking water includes raw water source, which is either: surface water, groundwater or artificial ground water. In the water production, raw water is purified from the harmful substances and microbes for the distribution and use. Water treatment takes places at the waterworks; which situates before the tap water system (consumers). In industrial plants, it may be necessary to improve water treatment before production processes.
The water treatment method is affected by the quality and amount of raw water. Surface water usually requires more treatment than groundwater. Raw water plants are therefore divided into artificial bedding plants, groundwater plants and surface water plants. Groundwater would often be qualified as a household water when comparing the quality of raw waters with the quality standards and recommendations set for drinking water. Groundwater, however, usually requires treatment as well as surface water. Groundwater is often acidic, causing corrosion to the network, and malicious microbes may, for example, lead to crude water as a result of heavy rains. Dirt materials and harmful microbes from surface water end up in the surface with rainwater, runoff water and air as well as human activities, so surface water always requires effective treatment.
Different water production processes, which are used in drinking water purification systems are: straining, filtering, mixing, aeration, clarification, filtration and adsorption techniques (Crittenden et al., 2005). Raw water sources can either be: artificial groundwater, groundwater or surface water. With water purification: raw water is purified from harmful substances and microbes for the distribution and use. The water treatment takes place at the waterworks; before the tap water system. In industrial plants, it may be necessary to improve water treatment before production processes. Even the water of the consumer's own well may have a small-scale water treatment unit installed before the tap.
Confidential Page 10 of 53 15/12/2017
Table 1. Adapted from Water Safety Plans for managing drinking-water quality from catchment to consumer (WHO 2004).
Water supply chain part Hazardous event/action
Water source Geology and Hydrology
Meteorology and weather patterns
General catchment and river health
Wildlife
Competing water uses
Nature and intensity of development and land-use
Other activities in the catchment which potentially release contaminants into source water
Planned future activities
Surface water
Description of water body type (e.g. river, reservoir)
Physical characteristics such as size, depth, thermal stratification, altitude
Flow and reliability of source water
Retention times
Water constituents (physical, chemical, microbial)
Protection
Recreational and other human activity
Bulk water transport
Groundwater system
Confined or unconfined aquifer
Aquifer hydrogeology
Flow rate and direction
Dilution characteristics
Recharge area
Well -head protection
Depth of chasing
Bulk water transport
The water treatment method is affected by the quality and amount of raw water. Surface water usually requires more treatment than groundwater. Water installations are divided into: artificial recharged ground water plants, groundwater plants and surface water plants. Groundwater would often be qualified as a household water when comparing the qualities of different raw water sources. Groundwater, however, also requires treatment, as groundwater for example in Fennoscandia is often acidic, causing corrosion to the network, and malicious microbes may, for example end up into the water as a result of heavy rains. Dirt materials and harmful microbes from surface water end up in the surface with rainwater, runoff water and air as well as human activities, so surface water always requires effective treatment. Different water purification processes, which are used in waterworks are: straining, filtering, mixing, aeration, clarification, filtration and adsorption techniques (Crittenden et al., 2005).

Confidential Page 11 of 53 15/12/2017
1.3 Hazard identification
Raw water and drinking water monitoring results are typically available after drinking water has left a treatment plant and has already been consumed. Therefore in risk assessment; one step is to determine and evaluate “events,” defined as incidents or situations that may lead to hazards being introduced into the system or not being removed from water (Nokes and Taylor, 2003). There are multiple hazardous events that can occur in raw water resources, during water treatment, in distribution network or at the consumer end (house piping). Majority of the hazardous events can be seen as accidental incidents that occur rarely, but when they happen the consequences may be drastic.
The following events can be considered as the most vulnerable hazard case scenarios in drinking water production:
● Prevention of contaminants entering the raw water supply
● Removal of particles from the water
● Inactivation of microorganisms in the water
● Maintenance of the water quality during distribution
The following situations are the most typical hazardous events that are faced during risk assessment of drinking water:
● Variations due to weather
● Accidental or deliberate contamination
● Pollution source control practices
● Wastewater treatment processes
● Drinking-water treatment processes
● Receiving and storage practices
● Sanitation and hygiene
● Distribution maintenance and protection practices
● Intended consumer use
A good example of a hazard identification checklists is found here: https://www.worksafe.qld.gov.au/__data/assets/pdf_file/0005/82841/onlinesafetytool-appendix1.pdf.
1.4 Health risks in drinking water
Access to safe drinking water is a basic human right, which is declared even in the United Nations 2030 Agenda for Sustainable Development (UN 2015). Water is mentioned in several cases and clean water and sanitation is one of the main development goals. Improving access to safe drinking water can result in great benefits to health because microbial and chemical
Confidential Page 12 of 53 15/12/2017
contaminants in drinking water can cause severe health effects in human. Pathogenic microbes in drinking water kills millions of people every year and causes high number of diarrhea illness cases even in western countries. Pathogens are generally less prevalent in the industrialized countries than in developing countries, but their dispersion through waterways into drinking water supply chain needs to be prevented with appropriate management actions (Juntunen et al. 2017). Additionally, an ever increasing number of chemicals are applied in manufacturing processes of modern goods, used in agriculture and healthcare, which adds to potential to water-related human health risks. Although new technologies have created emerging water-related health risks with new contaminants, they have also improved the possibilities to mitigate the risks.
Confidential Page 13 of 53 15/12/2017
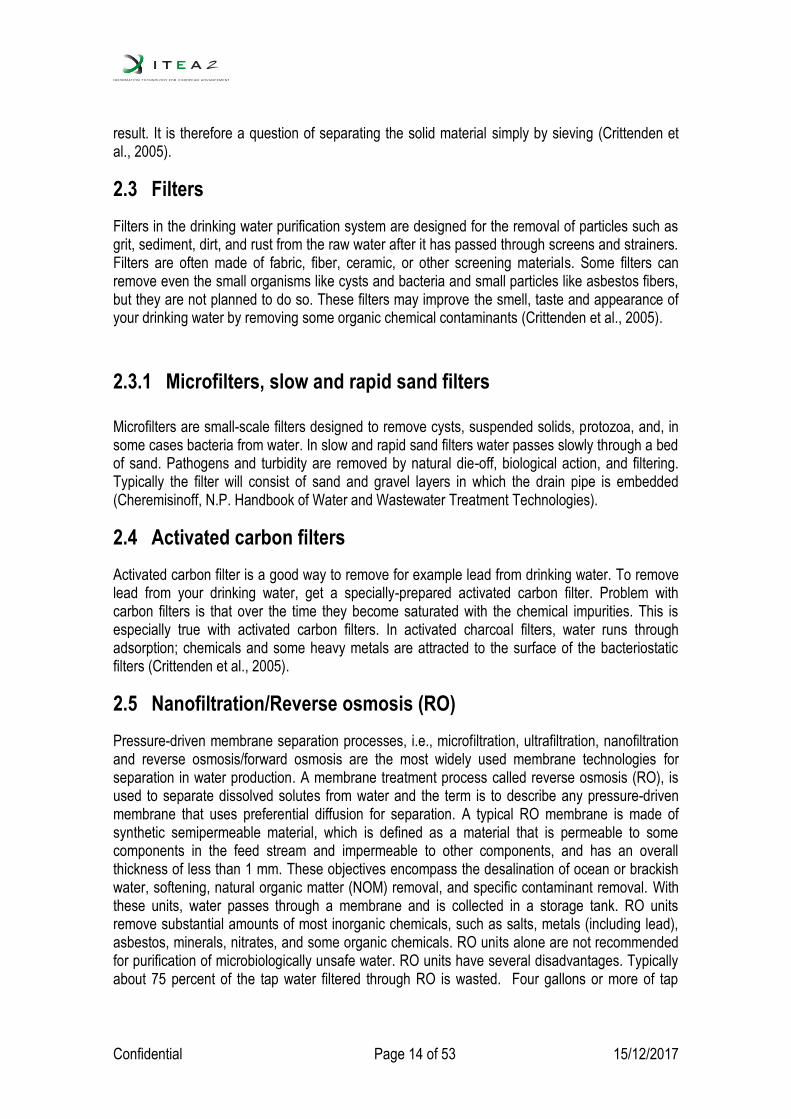
2 Physical security in drinking water treatment
Figure 2. Flow diagram showing possible treatment stages (adapted from Smethurst.1988)
2.1 Water storage
When storing water, drinking water suppliers require water tanks, for example when a community or industrial customers require potable water more than what can be produced from a source over a period of time. If water is taken directly from the water course, water supply can be improved by regulating waterways. For the storage of the raw water, a separate reservoir can be built, whereby the amount of water from the watercourse to the reservoir is regulated by the estimated demand for drinking water. When raw water is taken, raw material storage may also be required, if the water source yield is insufficient during maximum use. Additionally, the waterworks can use equalizing reservoir for balancing the consumption phases (Crittenden et al., 2005).
2.2 Straining
The water's roughest impurities can be eliminated with rough filters, whereby larger solids particles are retained in the device. Most commonly, the strain acts on either a rigid support structure or a wire-type metal or nylon fabric. Depending on the target, the mesh size of the tissue can be chosen within a fairly wide range. Depending on the size of the openings, the strainers are divided into micro switches and macros. For example, if you want to remove the natural plankton of water, fine tissues must be used. Bar screens and strainers are designed to remove all the larger organic and inorganic loads from the water. The process is characterized by the fact that factors other than the relative magnitude of the particles and the flow openings do not affect the
Confidential Page 14 of 53 15/12/2017
result. It is therefore a question of separating the solid material simply by sieving (Crittenden et al., 2005).
2.3 Filters
Filters in the drinking water purification system are designed for the removal of particles such as grit, sediment, dirt, and rust from the raw water after it has passed through screens and strainers. Filters are often made of fabric, fiber, ceramic, or other screening materials. Some filters can remove even the small organisms like cysts and bacteria and small particles like asbestos fibers, but they are not planned to do so. These filters may improve the smell, taste and appearance of your drinking water by removing some organic chemical contaminants (Crittenden et al., 2005).
2.3.1 Microfilters, slow and rapid sand filters
Microfilters are small-scale filters designed to remove cysts, suspended solids, protozoa, and, in some cases bacteria from water. In slow and rapid sand filters water passes slowly through a bed of sand. Pathogens and turbidity are removed by natural die-off, biological action, and filtering. Typically the filter will consist of sand and gravel layers in which the drain pipe is embedded (Cheremisinoff, N.P. Handbook of Water and Wastewater Treatment Technologies).
2.4 Activated carbon filters
Activated carbon filter is a good way to remove for example lead from drinking water. To remove lead from your drinking water, get a specially-prepared activated carbon filter. Problem with carbon filters is that over the time they become saturated with the chemical impurities. This is especially true with activated carbon filters. In activated charcoal filters, water runs through adsorption; chemicals and some heavy metals are attracted to the surface of the bacteriostatic filters (Crittenden et al., 2005).
2.5 Nanofiltration/Reverse osmosis (RO)
Pressure-driven membrane separation processes, i.e., microfiltration, ultrafiltration, nanofiltration and reverse osmosis/forward osmosis are the most widely used membrane technologies for separation in water production. A membrane treatment process called reverse osmosis (RO), is used to separate dissolved solutes from water and the term is to describe any pressure-driven membrane that uses preferential diffusion for separation. A typical RO membrane is made of synthetic semipermeable material, which is defined as a material that is permeable to some components in the feed stream and impermeable to other components, and has an overall thickness of less than 1 mm. These objectives encompass the desalination of ocean or brackish water, softening, natural organic matter (NOM) removal, and specific contaminant removal. With these units, water passes through a membrane and is collected in a storage tank. RO units remove substantial amounts of most inorganic chemicals, such as salts, metals (including lead), asbestos, minerals, nitrates, and some organic chemicals. RO units alone are not recommended for purification of microbiologically unsafe water. RO units have several disadvantages. Typically about 75 percent of the tap water filtered through RO is wasted. Four gallons or more of tap
Confidential Page 15 of 53 15/12/2017
water is needed to get one gallon of RO filtered water. The membranes on RO units must be replaced periodically (Crittenden et al., 2005).
Nanofiltration with a membrane pore size (0.5–2.0 nm) and operation pressure between reverse osmosis and ultrafiltration combines their advantages of high-solute rejection and low-energy consumption (Ji et al., 2017).
2.6 Mixing
Mixing is very common and central element in many water treatment processes. It ensures that chemicals that are added into the water are mixed as well as possible and helps to achieve a uniform concentration level and temperature throughout the system. A good mixing affects, among other things; the amount of chemicals use, the formation of flocs and the success of clarification. Thorough mixing the water treatment is a prerequisite for the success for example disinfection, especially when chlorine is used, mixing of disinfectant is very important in order to achieve the desired level of disinfection with as little chlorine as possible(Crittenden et al., 2005).
In the water treatment; chemicals are used in the following operations: chemical coagulation, chemical precipitation, neutralizing, remineralization, carbonate balance and water aggressiveness, oxidation-reduction process as well as disinfection (Crittenden et al., 2005).
2.7 Clarification
Clarification is one of the main methods of water treatment. Clarification refers to the removal of solids or liquid particles in water by using gravity or centrifugal force. The size of the particles to be removed varies from sizes of the colloidal particles. With clarifying the particles to be separated can be either naturally occurring in water or in the earlier treatment stages of the water by chemical or biological methods. Conventional clarification, i.e. post-clarification, will usually reduce 90% of solid particles generated during the coagulation-flotation process. Clarification can also remove heavy sediment particles in the water, whereby clarity will contribute to the success of the subsequent processing methods. At that case the term premarital clarification is used (Crittenden et al., 2005).
Vertical grafting is preceded by a normal coagulation-flocculation step, but during the clarification phase additional flakes also occur, whereby the rate of flocculation is increased. The advantages of the vertical clarification are a smaller space requirement than the horizontal drip and the ease of the sludge removal. The weaknesses are the depth of the structures, which in many places makes the construction of vertical clarification considerably expensive. In vertical clarification, the surface load value is the same as the rate of the rise of water and the floats descend those whose landing speed is higher than the rate of water rise. In vertical clarification, the care should be put specially for ensure that the value of the surface load does not exceed the floating rate of the floats (Crittenden et al., 2005).
The compounds formed from decomposing organic substances in debris, the dead bacterial mass and the precipitated phosphates form a sludge separating the purified water from the clarifiers. In this case, the floats fall to the surface and the cleansing result declines significantly (Crittenden et al., 2005).
Confidential Page 16 of 53 15/12/2017
2.8 Disinfection
2.8.1 Chlorination
Chlorine is a powerful disinfectant, that is, a substance which may kill or inactivate microorganisms. Chlorination is a process where chlorine is added to drinking-water to kill or inactivate microorganisms including the possible pathogens. Although chlorine is an effective disinfectant, chlorine does not kill all harmful microorganisms (WHO 2017).
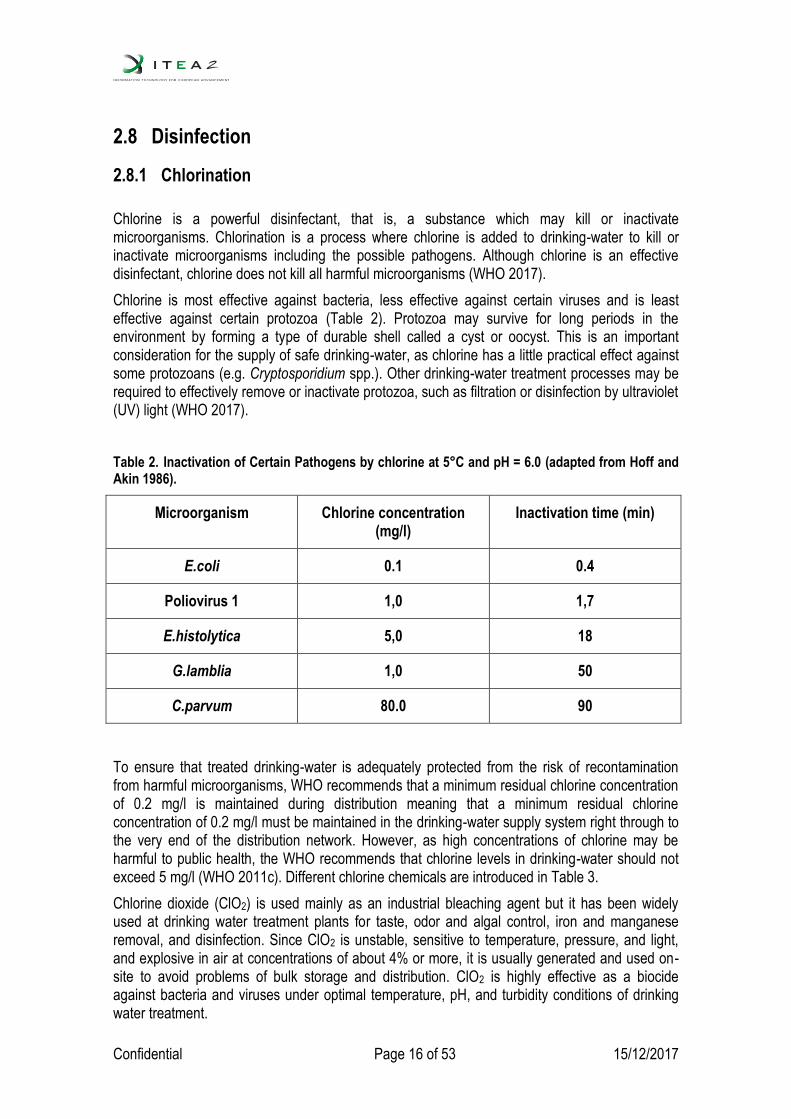
Chlorine is most effective against bacteria, less effective against certain viruses and is least effective against certain protozoa (Table 2). Protozoa may survive for long periods in the environment by forming a type of durable shell called a cyst or oocyst. This is an important consideration for the supply of safe drinking-water, as chlorine has a little practical effect against some protozoans (e.g. Cryptosporidium spp.). Other drinking-water treatment processes may be required to effectively remove or inactivate protozoa, such as filtration or disinfection by ultraviolet (UV) light (WHO 2017).
Table 2. Inactivation of Certain Pathogens by chlorine at 5°C and pH = 6.0 (adapted from Hoff and Akin 1986).
Microorganism Chlorine concentration (mg/l)
Inactivation time (min)
E.coli 0.1 0.4
Poliovirus 1 1,0 1,7
E.histolytica 5,0 18
G.lamblia 1,0 50
C.parvum 80.0 90
To ensure that treated drinking-water is adequately protected from the risk of recontamination from harmful microorganisms, WHO recommends that a minimum residual chlorine concentration of 0.2 mg/l is maintained during distribution meaning that a minimum residual chlorine concentration of 0.2 mg/l must be maintained in the drinking-water supply system right through to the very end of the distribution network. However, as high concentrations of chlorine may be harmful to public health, the WHO recommends that chlorine levels in drinking-water should not exceed 5 mg/l (WHO 2011c). Different chlorine chemicals are introduced in Table 3.
Chlorine dioxide (ClO2) is used mainly as an industrial bleaching agent but it has been widely used at drinking water treatment plants for taste, odor and algal control, iron and manganese removal, and disinfection. Since ClO2 is unstable, sensitive to temperature, pressure, and light, and explosive in air at concentrations of about 4% or more, it is usually generated and used on-site to avoid problems of bulk storage and distribution. ClO2 is highly effective as a biocide against bacteria and viruses under optimal temperature, pH, and turbidity conditions of drinking water treatment.

Confidential Page 17 of 53 15/12/2017
Chloramines are less effective than free chlorine as disinfectant but they are more persistent and do not react to form trihalomethanes. Concerns about disinfection by-products and the regulation level of trihalomethanes (0.10 mg/l) in EU and also in US. This has caused treatment facilities in several states in US to increase or switch to chloramination (Hack 1985).
Table 3. Different chlorination chemicals and their pros and cons (WHO 2011c).
Chlorine chemical Pros + Cons -
Chlorine gas - Inexpensive - Chemically stable - Availability is good - Excellent for big waterplants
- Includes risks in health and safety while working with it - Demanding technic - Demands educated staff - Demands effective control and alarm system - Formation of the THM -byproducts
Sodium hypochlorite - Relatively easy to use - Can be fed directly to the transport(ation) container - Good availability - Excellent for small water plants
- Decomposes over time with storage - It`s alkaline and corrosive - Formation of the THM-byproducts
Calcium hypochlorite - Stable in a closed container - Safe to use - It is best for the on -time chlorination
- Requires dissolution before the usement - more complicated to use - Safer to use than sodium hypochlorite solution. - Danger of fire and explosion - THM formation
Chloramine - It`s stable in the drinking water network - It`s used mainly for the controlling the bacterial growth in drinking water - Doesn`t form easily THM -agents
- Bad disinfection power, doesn`t work on viruses - Precise adjustment - Allows nitrite formation and - May cause odor and taste disturbances
Chlorine dioxide
- Very effective - Simple reaction, easy to control - Doesn`t depend on a acidity - Doesn`t form THM-substances - Doesn`t cause taste - It is ready to use in prechlorination
- Must be prepared on site - Simple reactor, easy to control - Operations and management require accuracy - Does not depend on acidity • Does not cause chlorite formation - Does not form THM • - Risky chemical
CT-values are an important part of calculating disinfectant dosage for the chlorination of drinking water. A CT-value is the product of the concentration of a disinfectant (e.g. free chlorine) and the contact time with the water being disinfected. It is typically expressed in units of mg-min/L and it varies for different pathogenic microbes (Table 4.) (WHO 2004).
2.9.2 Ultraviolet (UV) disinfection
These units may destroy bacteria and inactivate viruses, without leaving a taste or odor in the water. UV units cannot remove most chemical pollutants. UV doses for different microorganisms in shown in Table 5.
As with all water treatment units, UV disinfection units must be properly maintained. Dissolved and suspended solids from the water may build up on the unit, blocking the ultraviolet light from reaching the running water. To ensure that the water is adequately exposed to the light, UV units must be cleaned periodically.

Confidential Page 18 of 53 15/12/2017
Table 4. The CT-value for the inactivation of some bacteria at 9 ° C for different temperatures and pHs (WHO 2004).
E.coli Heterotrophic Plate Count
Compound pH Temperature oC
CT mg min l-1
pH Temperature oC CT mg min l-1
Chlorous acid, Dioxochloric(III) acid, Hydrogen dioxochlorate(III)
6.0 5 0.04 7,0 1-2 0.08±0.02
Hypochlorite-ion 10.0 5 0.92 8,5 1-2 3,3±1,0
Chlorine dioxide 6.5
6.5
7.0
20
15
25
0.18
0.38
0.28
7,0
8,5
1-2
1-2
0.13±0.02
0.19±0.06
Monochloramine 9.0 15 64 7,0
8,5
1-2
1-2
94±7,0
278±46
2.8.2 Other disinfection methods
Ozone (O3) is an allotrope of oxygen with three oxygen atoms. It is a strong oxidizing gas and it does not produce a disinfecting residual, so a second disinfectant must usually be added to the treated water to furnish the necessary protection in the distribution system. Ozone is used as the primary disinfectant in many drinking water treatment plants, mostly in Europe and Canada. Ozone is an efficient biocide that appears to attack the double bonds of fatty acids in bacterial cell walls and the protein capsid of viruses (Crittenden et al., 2005, NRC 1980).

Confidential Page 19 of 53 15/12/2017
Table 5. The UV fluence (mJ/cm2) requirements for an microbial inactivation credits (MIC) of 1up to 4 log by UV radiation for viruses, bacteria, bacterial spores and protozoan (oo)cysts (Adapted from Hijnen et al. (2006)).
Required fluence (mJ/cm2)
Required log10 removal 1 2 3 4
Bacillus subtilisa 56 111 167 222
Adenovirus type 40 56 111 167 -b
Clostridium perfringensa 45 95 145 - b
Adenovirus type 2, 15, 40. 41 42 83 125 167
Acanthamoebac 40 71 119 167
Adenovirusa (no type 40) 25 50 - b - b
Calicivirus canine 10 21 31 41
Rotavirus SA-11 10 20 29 39
Calicivirus feline 9 19 28 38
Coxsackie virus B5 8 17 25 34
Streptococcus faecalisa 9 16 23 30
Legionella pneumophilad 8 15 23 30
Poliovirus type 1 7 15 22 30
Shigella sonneid 6 13 19 26
Salmonella typhia 6 12 17 51
Hepatitis A 6 11 17 22
Calicivirus bovine 5 11 16 21
E. coli O157d 5 9 14 19
E. colia 5 9 14 18
Cryptosporidium USEPAc 3 6 12 - e
Giardia USEPAc 2 5 11 - e
Campylobacter jejunid 3 7 10 14
Yersinia enterocoliticad 3 7 10 13
Legionella pneumophilad 3 6 8 11
Shigella dysenteriaed 3 5 8 11
Vibrio choleraed 2 4 7 9
a Environmental spp. b MICmax < 4 log. c No correction for environmental spp. (research needed). d corrected for environmental spp. e No value due to tailing.
Confidential Page 20 of 53 15/12/2017
3 Health risks in drinking water
3.1 Microbiological health risks
Faecal origin microbes (bacteria, viruses and protozoans) cause the most important acute risk to drinking water consumers around the world. Microbiological quality of drinking water is monitored based on the European drinking water directive (98/83/EC) and quality needs to meet demands set in directive. Table 4 presents the indicator microbes used in drinking water quality monitoring and the most important pathogenic microbes threatening the health of water consumers including bacteria such as Campylobacter, viruses like Norovirus and Hepatitis A, and protozoans like Giardia and Cryptosporidium. Threats can originate from raw water or possible contamination can happen during water treatment or in the drinking water distribution network. As an example it is common for sewage to be discharged into surface waters, without adequate treatment and also wastes from domestic and wild animals can pose a danger when surface water is used as raw water in drinking water production. Leaking septic tanks and inadequate latrines may contaminate nearby drinking water sources when microbes seep through soils for long distances until they can reach a body of groundwater. Some soils, such as sand, are effective at filtering microorganisms, but coarser and fractured soils may allow transport of pathogenic microbes for long distances and depths. Many microorganisms in faecal origin waste materials pose a real threat to human health because many of the illnesses that they cause can be fatal (WHO, 2004; WHO, 2011).
Microorganisms like heterotrophs grow in drinking water distribution systems, especially in the absence of a residual disinfectant. They also require an external source of carbon, and they grow in water, on particulates and on surfaces in contact with water as biofilms. Most heterotrophs are not harmful to healthy persons, but they can cause esthetic inconvenience by generating tastes and odors. Legionella species and Pseudomonas aeruginosa are examples of pathogenic microbes, which can grow in distribution networks under optimal circumstances and are problematic especially in hospital environment. Pseudomonas aeruginosa cause a range of infections but rarely cause serious illness in healthy individuals (WHO, 2004; WHO, 2011).
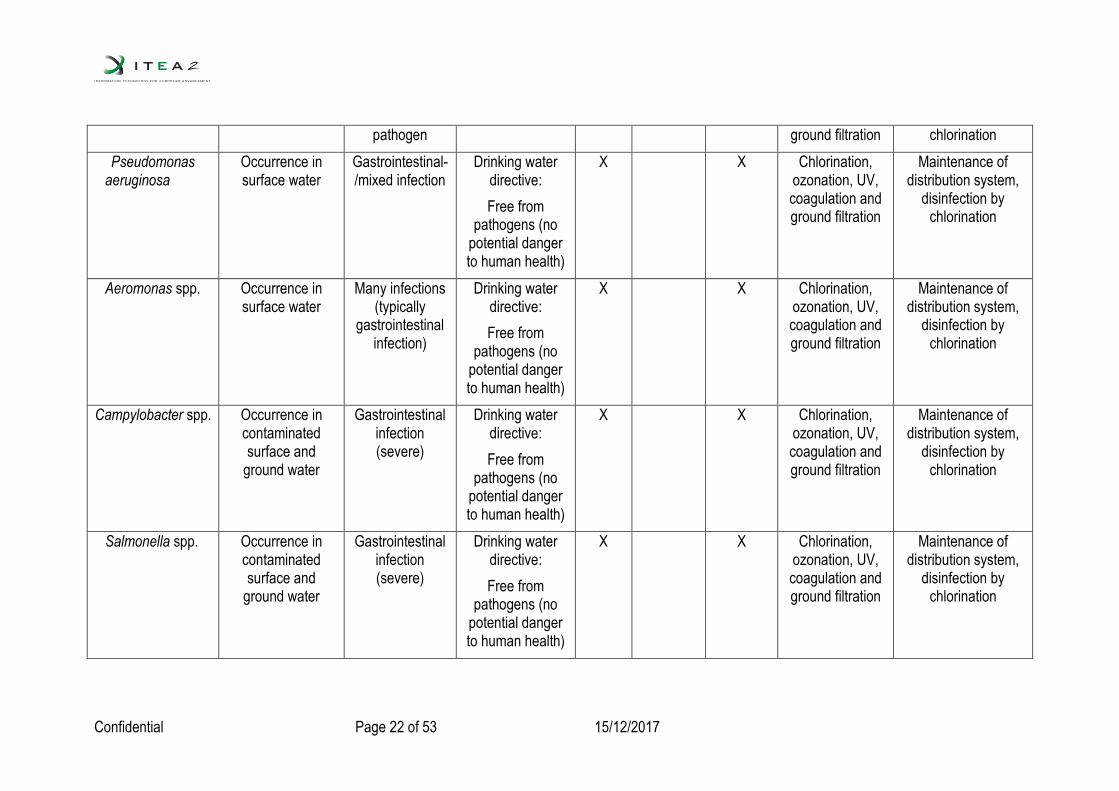
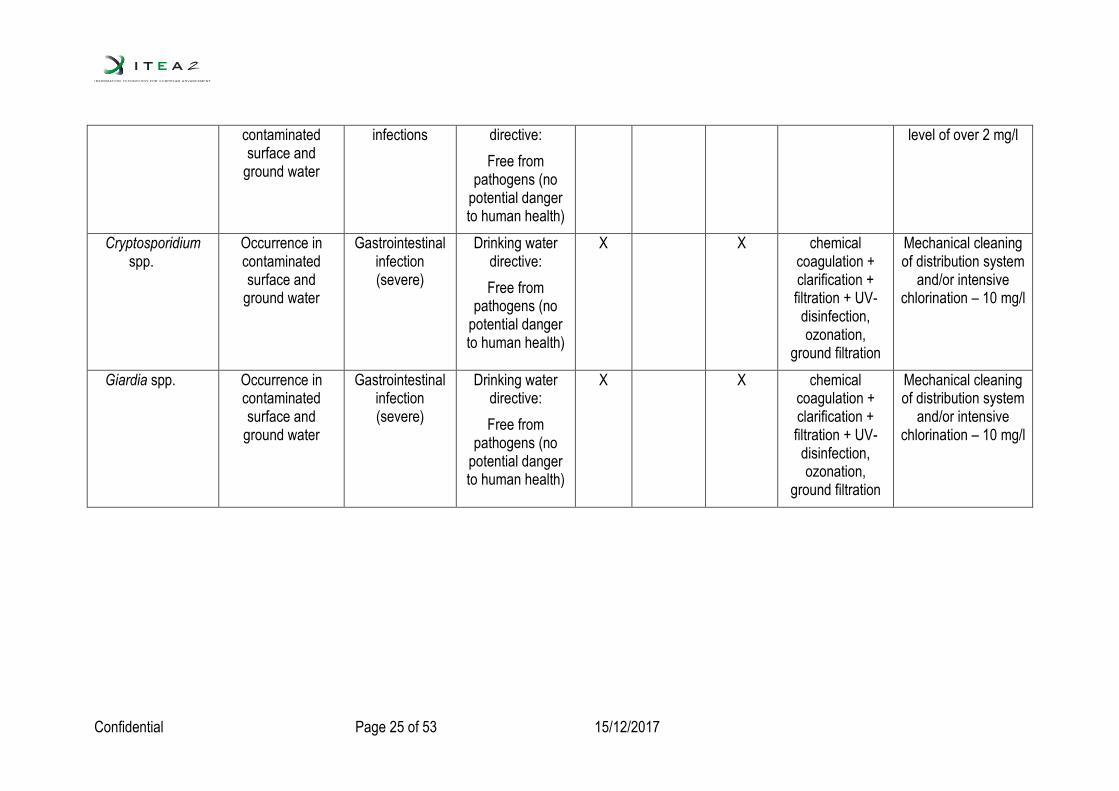
In addition to health threatening microbes, also different risk management options in the case of contamination are collected in Table 6. If the microbiological contamination ends up in the distribution network careful disinfection is needed. Disinfection can be divided chemical and non-chemical. E. coli are relatively easily disinfected, but viruses and protozoa are usually much more resistant to chemical disinfection with chlorine and chloramines. Ultraviolet (UV) irradiation and membrane processes are alternatives to chemical disinfection. UV is particularly effective at inactivating Cryptosporidium, which is extremely resistant to chlorination (WHO, 2004; WHO, 2011).
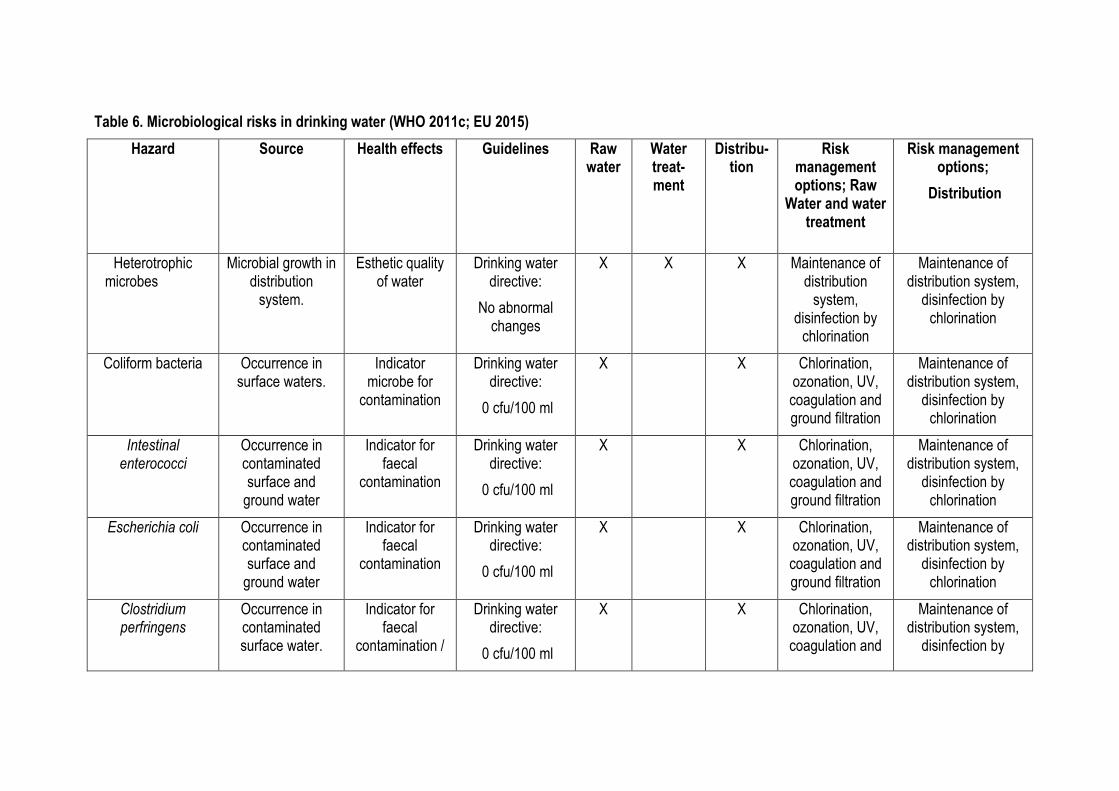
Table 6. Microbiological risks in drinking water (WHO 2011c; EU 2015)
Hazard Source Health effects Guidelines
Raw water
Water treat-ment
Distribu-tion
Risk management options; Raw
Water and water treatment
Risk management options;
Distribution
Heterotrophic microbes
Microbial growth in distribution
system.
Esthetic quality of water
Drinking water directive:
No abnormal changes
X X X Maintenance of distribution
system, disinfection by
chlorination
Maintenance of distribution system,
disinfection by chlorination
Coliform bacteria Occurrence in surface waters.
Indicator microbe for
contamination
Drinking water directive:
0 cfu/100 ml
X X Chlorination, ozonation, UV, coagulation and ground filtration
Maintenance of distribution system,
disinfection by chlorination
Intestinal enterococci
Occurrence in contaminated surface and
ground water
Indicator for faecal
contamination
Drinking water directive:
0 cfu/100 ml
X X Chlorination, ozonation, UV, coagulation and ground filtration
Maintenance of distribution system,
disinfection by chlorination
Escherichia coli Occurrence in contaminated surface and
ground water
Indicator for faecal
contamination
Drinking water directive:
0 cfu/100 ml
X X Chlorination, ozonation, UV, coagulation and ground filtration
Maintenance of distribution system,
disinfection by chlorination
Clostridium perfringens
Occurrence in contaminated surface water.
Indicator for faecal
contamination /
Drinking water directive:
0 cfu/100 ml
X X Chlorination, ozonation, UV, coagulation and
Maintenance of distribution system,
disinfection by
Confidential Page 22 of 53 15/12/2017
pathogen ground filtration chlorination
Pseudomonas aeruginosa
Occurrence in surface water
Gastrointestinal-/mixed infection
Drinking water directive:
Free from pathogens (no
potential danger to human health)
X X Chlorination, ozonation, UV, coagulation and ground filtration
Maintenance of distribution system,
disinfection by chlorination
Aeromonas spp. Occurrence in surface water
Many infections (typically
gastrointestinal infection)
Drinking water directive:
Free from pathogens (no
potential danger to human health)
X X Chlorination, ozonation, UV, coagulation and ground filtration
Maintenance of distribution system,
disinfection by chlorination
Campylobacter spp.
Occurrence in contaminated surface and
ground water
Gastrointestinal infection (severe)
Drinking water directive:
Free from pathogens (no
potential danger to human health)
X X Chlorination, ozonation, UV, coagulation and ground filtration
Maintenance of distribution system,
disinfection by chlorination
Salmonella spp. Occurrence in contaminated surface and
ground water
Gastrointestinal infection (severe)
Drinking water directive:
Free from pathogens (no
potential danger to human health)
X X Chlorination, ozonation, UV, coagulation and ground filtration
Maintenance of distribution system,
disinfection by chlorination

Confidential Page 23 of 53 15/12/2017
Legionella spp. Occurrence in different water
systems. Warming of (cold) water
promotes growth.
Severe pneumonia
Drinking water directive:
Free from pathogens (no
potential danger to human health)
X X X X Temperature of warm water should
be more than +55 °C
Yersinia spp. Occurrence in surface water and
contaminated ground water
Gastrointestinal infection (severe)
Drinking water directive:
Free from pathogens (no
potential danger to human health)
X X Chlorination, ozonation, UV
Maintenance of distribution system,
disinfection by chlorination
Shigella spp. Occurrence in contaminated surface water
Gastrointestinal infection (severe)
Drinking water directive:
Free from pathogens (no
potential danger to human health)
X X Chlorination, ozonation, UV
Maintenance of distribution system,
disinfection by chlorination
Noroviruses
Occurrence in contaminated surface and
ground water
Gastrointestinal infection
Drinking water directive:
Free from pathogens (no
potential danger to human health)
X X UV, ozonation (chlorination at the level of over
2 mg/l), coagulation, long enough ground
filtration
Chlorination at the level of over 2 mg/l
Hepatitis-A virus Occurrence in Severe infection Drinking water X X UV, ozonation Chlorination at the

Confidential Page 24 of 53 15/12/2017
contaminated surface and
ground water
(hepatitis) directive:
Free from pathogens (no
potential danger to human health)
(chlorination at the level of over
2 mg/l), coagulation, long enough ground
filtration
level of over 2 mg/l
Adenoviruses Occurrence in contaminated surface and
ground water
Many differerent infections,
typically mild
Drinking water directive:
Free from pathogens (no
potential danger to human health)
X X UV, ozonation (chlorination at the level of over
2 mg/l), coagulation, long enough ground
filtration
Chlorination at the level of over 2 mg/l
Rotaviruses Occurrence in contaminated surface and
ground water
Gastrointestinal infection (children)
Drinking water directive:
Free from pathogens (no
potential danger to human health)
X X UV, ozonation (chlorination at the level of over
2 mg/l), coagulation, long enough ground
filtration
Chlorination at the level of over 2 mg/l
Astroviruses Occurrence in contaminated surface and
ground water
Gastrointestinal infection (children)
Drinking water directive:
Free from pathogens (no
potential danger to human health)
X X Chlorination at the level of over 2 mg/l
Enteroviruses Occurrence in Many different Drinking water X X Chlorination at the
Confidential Page 25 of 53 15/12/2017
contaminated surface and
ground water
infections directive:
Free from pathogens (no
potential danger to human health)
level of over 2 mg/l
Cryptosporidium spp.
Occurrence in contaminated surface and
ground water
Gastrointestinal infection (severe)
Drinking water directive:
Free from pathogens (no
potential danger to human health)
X X chemical coagulation + clarification + filtration + UV-disinfection, ozonation,
ground filtration
Mechanical cleaning of distribution system
and/or intensive chlorination – 10 mg/l
Giardia spp. Occurrence in contaminated surface and
ground water
Gastrointestinal infection (severe)
Drinking water directive:
Free from pathogens (no
potential danger to human health)
X X chemical coagulation + clarification + filtration + UV-disinfection, ozonation,
ground filtration
Mechanical cleaning of distribution system
and/or intensive chlorination – 10 mg/l

3.2 Chemical health risks
When assessing chemical health risks of drinking water, the first thing to do is to prioritize chemicals in a drinking water supply. There are a number of sources of naturally occurring chemicals in drinking water in addition to those manmade, which originate from industry and municipal waste water effluents. A few chemical contaminants have been shown to cause adverse health effects in humans as a consequence of prolonged exposure through drinking-water. However, this is only a very small proportion of the chemicals that may reach drinking-water from various sources (WHO 2011a). In the Guidelines for the Drinking-water Quality (WHO, 2011a) all the contaminants in drinking water that may pose a risk to human health are listed (Table 7).
It is highly important that chemical contaminants are prioritized so that the most important in the country or local region are considered for inclusion in national standards and monitoring programmes. Guideline values for chemical contaminants in drinking water provide a benchmark for the development of local water quality targets for chemicals (usually a national standard expressing a maximum allowable concentration) (WHO 2011a). Guideline values for chemicals may not directly reflect the target of 10−6 disability-adjusted life year (DALY), as these are frequently derived based on evidence indicating a no-adverse-effect or negligible risk level. In fact, some guideline values are based on extrapolation of the risk of cancer from exposures at which this can be measured to low exposures where measurement is currently not possible (WHO 2011a).
Chemical contaminants are derived from multiple sources, such as naturally occurring chemicals which may be derived from rocks, soils and the effects of the geological settings and climate, eutrophic water bodies (also influenced by sewage inputs and agricultural runoffs). Industrial sources and human dwellings are the main source of contaminants that public is concerned about. These chemicals are derived from mining (extractive industries) and manufacturing and processing industries, sewage (including a number of contaminants of emerging concern), solid waste, urban runoff, fuel leakages. Agricultural activities such as manures, fertilizers, intensive animal practices and pesticides are one important source. Water treatment, or materials that are in contact with drinking-water may introduce coagulants, DBPs, piping materials into drinking water. Pesticides used in water for public health include larvicides used in the control of insect vectors of disease in aquaculture (WHO 2011a).

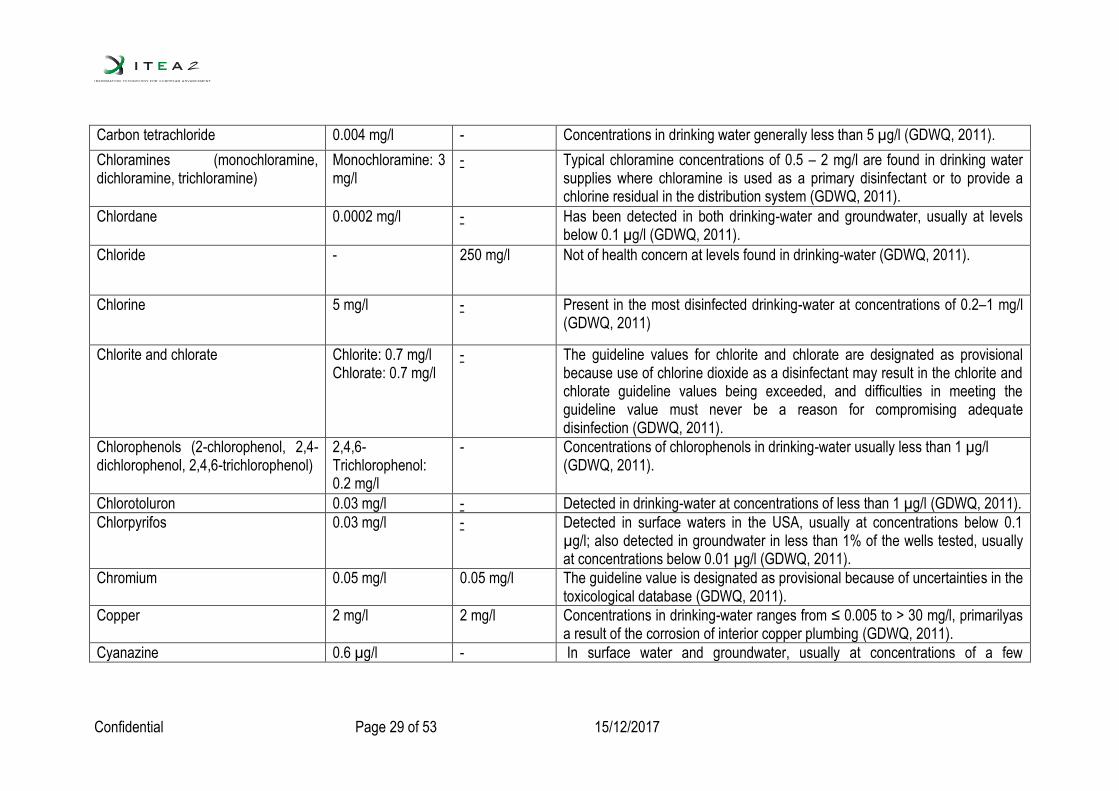
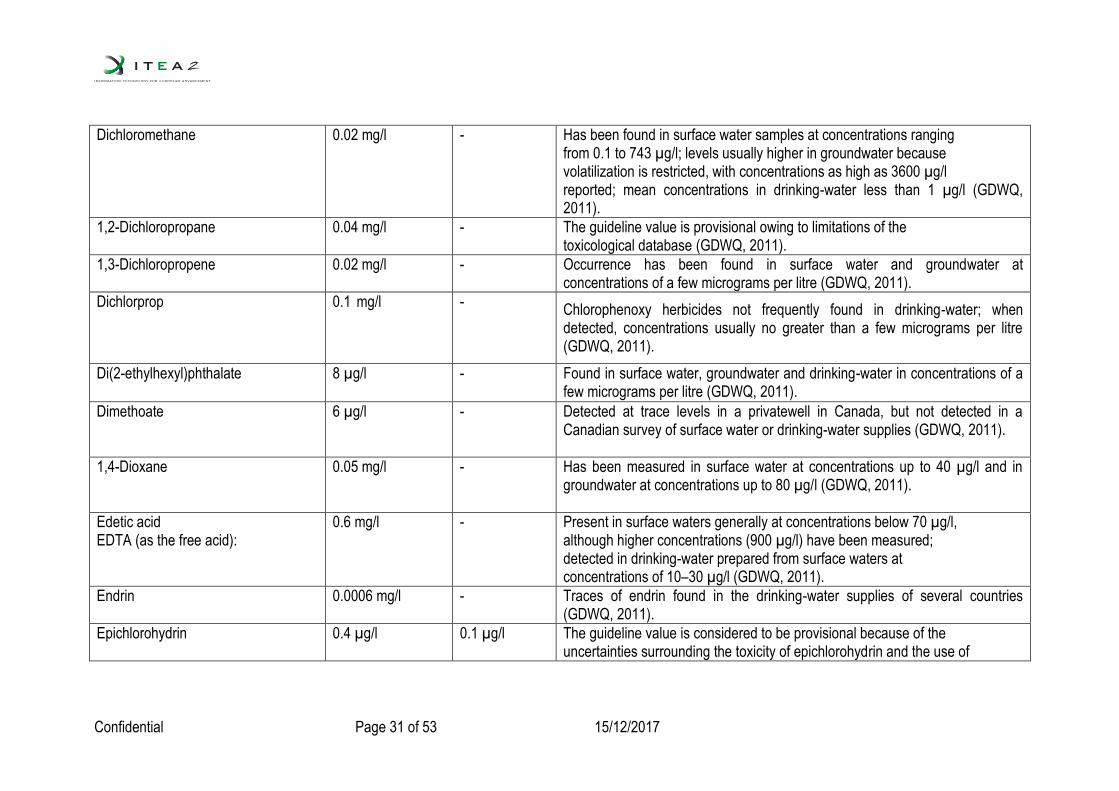
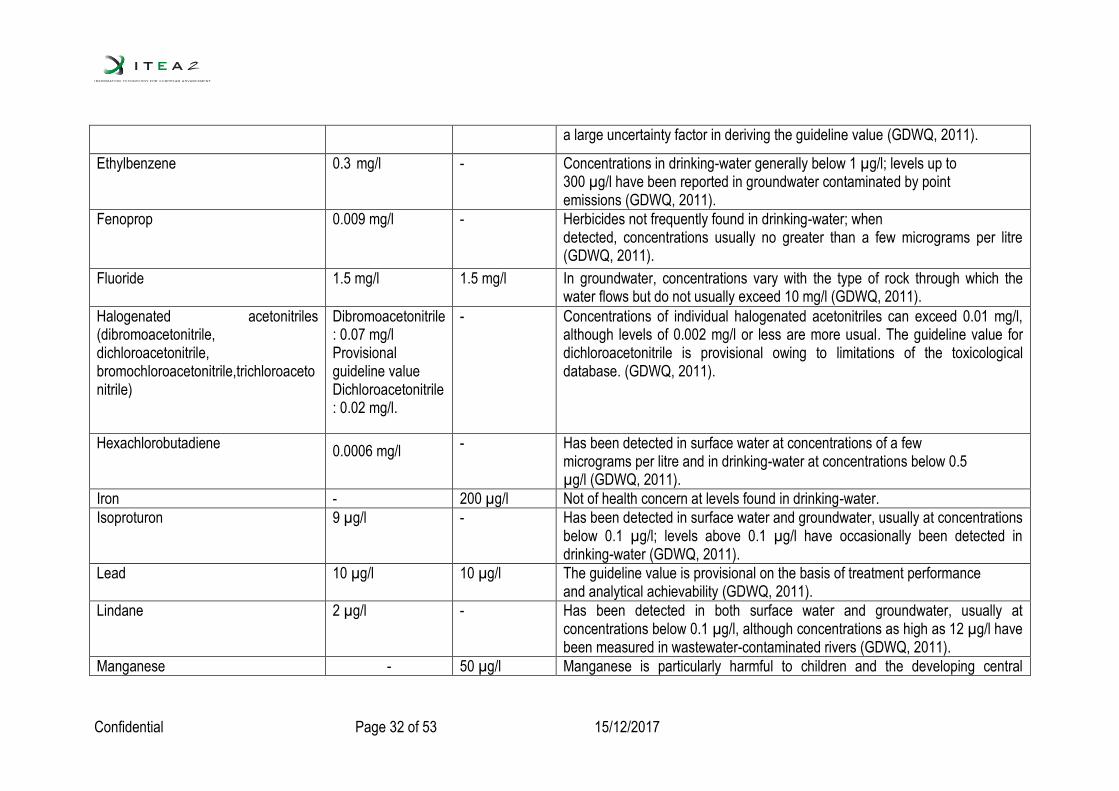
Table 7. Chemical occurring in drinking water: Their guidelines for GDWQ (Guidelines for drinking water quality given by WHO (WHO 2011a) and EU drinking water directive (DWD) guidelines (Council Directive 98/83/EC of 3 November 1998 on the quality of water intended for human consumption).
Substance GDWQ DWD Comments
Acrylamide 0.5 µg/l
0.1 µg/l Detected in tap water concentrations up to few µg/l (GDWQ, 2011).
Alachlor 0.02 mg/l
- Detected in groundwater and surface water; has also been detected in drinking-water at levels below 0.002 mg/l (GDWQ, 2011).
Aldicarb 0.01 mg/l
- Found as a contaminant in groundwater in the vicinity of application areas, particularly when associated with sandy soil (GDWQ, 2011).
Aldrin and dieldrin 0.03 µg/l - Seldom detected in drinking-water; concentrations of aldrin and dieldrin in drinking-water normally less than 0.01 µg/l; rarely present in groundwater (GDWQ, 2011).
Aluminium not established 0.2 mg/l Health-based value of 0.9 mg/l could be derived. Aluminium is the most abundant metallic element and constitutes about 8% of the Earth’s crust. Aluminium salts are widely used in water treatment as coagulants to reduce organic matter, colour, turbidity and microorganism levels (GDWQ, 2011).
Ammonium - 0.5 mg/l -
Antimony 20 µg/l 5 µg/l Concentration in groundwater is less than 0.001µg/l; concentrations in surface water less than 0.2µg/l; concentrations in drinking-water appear to be less than 5µg/l (GDWQ, 2011).
Arsenic 0.01 mg/l 0.01 mg/l -
Levels in natural waters generally range between 1 and 2 µg/l, although concentrations may be elevated (up to 12 mg/l) in areas containing natural sources (GDWQ, 2011).

Confidential Page 28 of 53 15/12/2017
Atrazine and its metabolites Atrazine and its chloro-s-triazine metabolites: 0.1 mg/l (100 µg/l) Hydroxyatrazine: 0.2 mg/l (200 µg/l)
- Concentrations rarely exceed 2 µg/l and are commonly well below 0.1 µg/l (GDWQ, 2011).
Barium 0.7 mg/l
-
Concentrations in drinking-water generally below 100 µg/l, although concentrations above 1 mg/l have been measured in drinking-water derived from groundwater (GDWQ, 2011).
Benzene 0.01 mg/l 0.001 mg/l Concentrations in drinking-water, when present, generally much less than 5 µg/l (GDWQ, 2011).
Bentso(a)pyreeni (Polynuclear aromatic hydrocarbons)
Benzo[a]pyrene: 0.7 µg/l
0.010 µg/l PAH levels in uncontaminated groundwater usually in range 0–5 ng/l; concentrations in contaminated groundwater may exceed 10 µg/l; typical concentration range for sum of selected PAHs in drinking-water is from about 1 ng/l to 11 µg/l (GDWQ, 2011).
Boron 2,4 mg/l 1,0 mg/l Concentrations in drinking-water, when present, generally much less than 5 µg/l (GDWQ, 2011).
Bromate 0.01 mg/l 0.01 mg/l Has been reported in drinking-water with a variety of source water characteristics after ozonation at concentrations ranging from less than 2 to 293 µg/l, depending on bromide ion concentration, ozone dosage, pH, alkalinity and dissolved organic carbon; can also be formed in the electrolytic generation of chlorine and hypochlorite from brine with a high level of bromide contamination (GDWQ, 2011).
Cadmium 0.003 mg/l
0.005mg/l Levels in drinking-water usually less than 1 µg/l (GDWQ, 2011).
Carbofuran 0.007 mg/l - Has been detected in surface water, groundwater and drinking-water, generally at levels of a few micrograms per litre or lower; highest concentration (30 µg/l) measured in groundwater (GDWQ, 2011).
Confidential Page 29 of 53 15/12/2017
Carbon tetrachloride 0.004 mg/l - Concentrations in drinking water generally less than 5 µg/l (GDWQ, 2011).
Chloramines (monochloramine, dichloramine, trichloramine)
Monochloramine: 3 mg/l
- Typical chloramine concentrations of 0.5 – 2 mg/l are found in drinking water supplies where chloramine is used as a primary disinfectant or to provide a chlorine residual in the distribution system (GDWQ, 2011).
Chlordane 0.0002 mg/l - Has been detected in both drinking-water and groundwater, usually at levels below 0.1 µg/l (GDWQ, 2011).
Chloride - 250 mg/l Not of health concern at levels found in drinking-water (GDWQ, 2011).
Chlorine 5 mg/l - Present in the most disinfected drinking-water at concentrations of 0.2–1 mg/l (GDWQ, 2011)
Chlorite and chlorate Chlorite: 0.7 mg/l Chlorate: 0.7 mg/l
- The guideline values for chlorite and chlorate are designated as provisional because use of chlorine dioxide as a disinfectant may result in the chlorite and chlorate guideline values being exceeded, and difficulties in meeting the guideline value must never be a reason for compromising adequate disinfection (GDWQ, 2011).
Chlorophenols (2-chlorophenol, 2,4-dichlorophenol, 2,4,6-trichlorophenol)
2,4,6-Trichlorophenol: 0.2 mg/l
- Concentrations of chlorophenols in drinking-water usually less than 1 µg/l (GDWQ, 2011).
Chlorotoluron 0.03 mg/l - Detected in drinking-water at concentrations of less than 1 µg/l (GDWQ, 2011).
Chlorpyrifos 0.03 mg/l - Detected in surface waters in the USA, usually at concentrations below 0.1 µg/l; also detected in groundwater in less than 1% of the wells tested, usually at concentrations below 0.01 µg/l (GDWQ, 2011).
Chromium 0.05 mg/l 0.05 mg/l The guideline value is designated as provisional because of uncertainties in the toxicological database (GDWQ, 2011).
Copper 2 mg/l 2 mg/l Concentrations in drinking-water ranges from ≤ 0.005 to > 30 mg/l, primarilyas a result of the corrosion of interior copper plumbing (GDWQ, 2011).
Cyanazine 0.6 µg/l - In surface water and groundwater, usually at concentrations of a few

Confidential Page 30 of 53 15/12/2017
micrograms per litre, although levels as high as 1.3 and 3.5 mg/l have been measured in surface water and groundwater, respectively (GDWQ, 2011).
Cyanide - 0.05 mg/l -
Cyanobacterialtoxin: Microcystin-LR Total microcystin-LR (free plus cell-bound): 0.001 mg/l (1 µg/l). The guideline value is provisional, as it covers only microcystin-LR, the database is limited and new data for the toxicity of cyanobacterial toxins are being generated (GDWQ, 2011).
2,4-D
0.03 mg/l - Levels in water usually below 0.5 µg/l, although concentrations as high as 30 µg/l have been measured (GDWQ, 2011)
2,4-DB 0.09 mg/l - Chlorophenoxy herbicides not frequently found in drinking-water; when detected, concentrations usually no greater than a few micrograms per litre (GDWQ, 2011)
DDT and metabolites 0.001 mg/l - Detected in surface water at concentrations below 1 µg/l; also detected in drinking-water at 100-fold lower concentrations (GDWQ, 2011).
1,2-Dibromo-3-chloropropane 0.001 mg/l - Limited survey found levels of up to a few micrograms per litre in drinking water (GDWQ, 2011).
1,2-Dibromoethane 0.0004 mg/l - The guideline value is provisional owing to serious limitations of the critical studies (GDWQ, 2011).
Dichloroacetic acid 0.05 mg/l - The guideline value is designated as provisional on the basis of technical achievability (GDWQ, 2011).
Dichlorobenzenes(1,2 dichlorobenzene, 1,3-dichlorobenzene, 1,4-dichlorobenzene)
1,2-Dichlorobenzene: 1 mg/l 1,4-Dichlorobenzene: 0.3 mg/l
- Have been found in raw water sources at levels as high as 10 µg/l and in drinking-water at concentrations up to 3 µg/l; much higher concentrations (up to 7 mg/l) present in contaminated groundwater (GDWQ, 2011).
1,2-Dichloroethane 0.03 mg/l 0.003µg/l
In drinking-water at levels of up to a few micrograms per litre (GDWQ, 2011).
Confidential Page 31 of 53 15/12/2017
Dichloromethane 0.02 mg/l - Has been found in surface water samples at concentrations ranging from 0.1 to 743 µg/l; levels usually higher in groundwater because volatilization is restricted, with concentrations as high as 3600 µg/l reported; mean concentrations in drinking-water less than 1 µg/l (GDWQ, 2011).
1,2-Dichloropropane 0.04 mg/l - The guideline value is provisional owing to limitations of the toxicological database (GDWQ, 2011).
1,3-Dichloropropene 0.02 mg/l - Occurrence has been found in surface water and groundwater at concentrations of a few micrograms per litre (GDWQ, 2011).
Dichlorprop 0.1 mg/l - Chlorophenoxy herbicides not frequently found in drinking-water; when detected, concentrations usually no greater than a few micrograms per litre (GDWQ, 2011).
Di(2-ethylhexyl)phthalate 8 µg/l - Found in surface water, groundwater and drinking-water in concentrations of a few micrograms per litre (GDWQ, 2011).
Dimethoate 6 µg/l - Detected at trace levels in a privatewell in Canada, but not detected in a Canadian survey of surface water or drinking-water supplies (GDWQ, 2011).
1,4-Dioxane 0.05 mg/l - Has been measured in surface water at concentrations up to 40 µg/l and in groundwater at concentrations up to 80 µg/l (GDWQ, 2011).
Edetic acid EDTA (as the free acid):
0.6 mg/l - Present in surface waters generally at concentrations below 70 µg/l, although higher concentrations (900 µg/l) have been measured; detected in drinking-water prepared from surface waters at concentrations of 10–30 µg/l (GDWQ, 2011).
Endrin 0.0006 mg/l - Traces of endrin found in the drinking-water supplies of several countries (GDWQ, 2011).
Epichlorohydrin 0.4 µg/l 0.1 µg/l The guideline value is considered to be provisional because of the uncertainties surrounding the toxicity of epichlorohydrin and the use of
Confidential Page 32 of 53 15/12/2017
a large uncertainty factor in deriving the guideline value (GDWQ, 2011).
Ethylbenzene 0.3 mg/l - Concentrations in drinking-water generally below 1 µg/l; levels up to 300 µg/l have been reported in groundwater contaminated by point emissions (GDWQ, 2011).
Fenoprop 0.009 mg/l - Herbicides not frequently found in drinking-water; when detected, concentrations usually no greater than a few micrograms per litre (GDWQ, 2011).
Fluoride 1.5 mg/l 1.5 mg/l In groundwater, concentrations vary with the type of rock through which the water flows but do not usually exceed 10 mg/l (GDWQ, 2011).
Halogenated acetonitriles (dibromoacetonitrile, dichloroacetonitrile, bromochloroacetonitrile,trichloroacetonitrile)
Dibromoacetonitrile: 0.07 mg/l Provisional guideline value Dichloroacetonitrile: 0.02 mg/l.
- Concentrations of individual halogenated acetonitriles can exceed 0.01 mg/l, although levels of 0.002 mg/l or less are more usual. The guideline value for dichloroacetonitrile is provisional owing to limitations of the toxicological database. (GDWQ, 2011).
Hexachlorobutadiene 0.0006 mg/l
- Has been detected in surface water at concentrations of a few micrograms per litre and in drinking-water at concentrations below 0.5 µg/l (GDWQ, 2011).
Iron - 200 µg/l Not of health concern at levels found in drinking-water.
Isoproturon 9 µg/l - Has been detected in surface water and groundwater, usually at concentrations below 0.1 µg/l; levels above 0.1 µg/l have occasionally been detected in drinking-water (GDWQ, 2011).
Lead 10 µg/l 10 µg/l The guideline value is provisional on the basis of treatment performance and analytical achievability (GDWQ, 2011).
Lindane 2 µg/l - Has been detected in both surface water and groundwater, usually at concentrations below 0.1 µg/l, although concentrations as high as 12 µg/l have been measured in wastewater-contaminated rivers (GDWQ, 2011).
Manganese - 50 µg/l Manganese is particularly harmful to children and the developing central
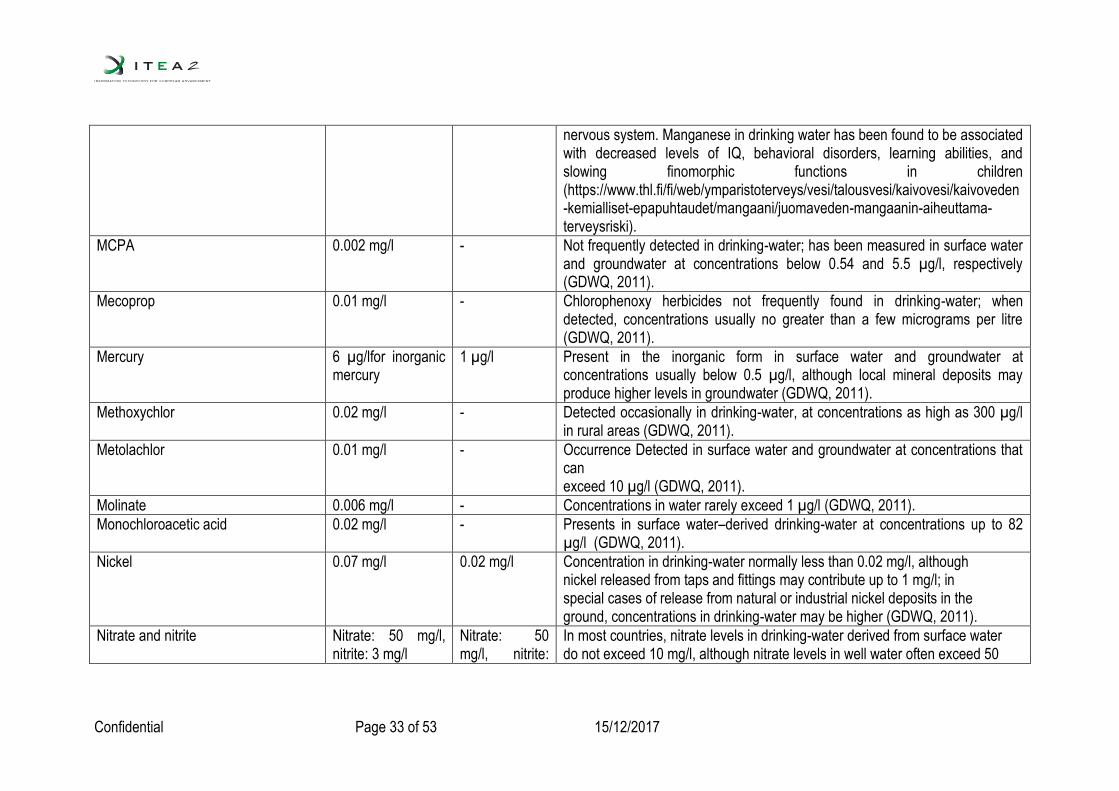
Confidential Page 33 of 53 15/12/2017
nervous system. Manganese in drinking water has been found to be associated with decreased levels of IQ, behavioral disorders, learning abilities, and slowing finomorphic functions in children (https://www.thl.fi/fi/web/ymparistoterveys/vesi/talousvesi/kaivovesi/kaivoveden-kemialliset-epapuhtaudet/mangaani/juomaveden-mangaanin-aiheuttama-terveysriski).
MCPA 0.002 mg/l - Not frequently detected in drinking-water; has been measured in surface water and groundwater at concentrations below 0.54 and 5.5 µg/l, respectively (GDWQ, 2011).
Mecoprop 0.01 mg/l - Chlorophenoxy herbicides not frequently found in drinking-water; when detected, concentrations usually no greater than a few micrograms per litre (GDWQ, 2011).
Mercury 6 µg/lfor inorganic mercury
1 µg/l Present in the inorganic form in surface water and groundwater at concentrations usually below 0.5 µg/l, although local mineral deposits may produce higher levels in groundwater (GDWQ, 2011).
Methoxychlor 0.02 mg/l - Detected occasionally in drinking-water, at concentrations as high as 300 µg/l in rural areas (GDWQ, 2011).
Metolachlor 0.01 mg/l - Occurrence Detected in surface water and groundwater at concentrations that can exceed 10 µg/l (GDWQ, 2011).
Molinate 0.006 mg/l - Concentrations in water rarely exceed 1 µg/l (GDWQ, 2011).
Monochloroacetic acid 0.02 mg/l - Presents in surface water–derived drinking-water at concentrations up to 82 µg/l (GDWQ, 2011).
Nickel 0.07 mg/l 0.02 mg/l Concentration in drinking-water normally less than 0.02 mg/l, although nickel released from taps and fittings may contribute up to 1 mg/l; in special cases of release from natural or industrial nickel deposits in the ground, concentrations in drinking-water may be higher (GDWQ, 2011).
Nitrate and nitrite Nitrate: 50 mg/l, nitrite: 3 mg/l
Nitrate: 50 mg/l, nitrite:
In most countries, nitrate levels in drinking-water derived from surface water do not exceed 10 mg/l, although nitrate levels in well water often exceed 50

Confidential Page 34 of 53 15/12/2017
0.5 mg/l mg/l; nitrite levels are normally lower, less than a few milligrams per litre (GDWQ, 2011).
Nitrilotriacetic acid 0.2 mg/l - Concentrations in drinking-water usually do not exceed a few micrograms per litre, although concentrations as high as 35 µg/l have been measured (GDWQ, 2011).
N-nitrosodimethylamine 0.0001 mg/l - Chloramination is used, distribution system samples can have much higher levels of NDMA than the finished water at the treatment plant; levels as high as 0.16 µg/l have been measured in the distribution system, but concentrations in water at the treatment plant are generally less than 0.01 µg/l (GDWQ, 2011).
Pendimethalin 0.02 mg/l - Rarely found in drinking-water in the limited studies available (GDWQ, 2011).
Pentachlorophenol 0.009 mg/l - The guideline value is considered provisional because of the variations in metabolism between experimental animals and humans (GDWQ, 2011).
Polynuclear aromatic hydrocarbons (PAHs), Benzo[a]pyrene
0.0007 mg/l 0.0001 mg/l
PAH levels in uncontaminated groundwater usually in range 0–5 ng/l; concentrations in contaminated groundwater may exceed 10 µg/l; typical concentration range for sum of selected PAHs in drinking-water is from about 1 ng/l to 11 µg/l (GDWQ, 2011).
Selenium 0.04 mg/l 0.01mg/l The guideline value is designated as provisional because of the uncertainties inherent in the scientific database (GDWQ, 2011).
Simazine 0.002 mg/l - Frequently detected in groundwater and surface water at concentrations of up to a few micrograms per litre (GDWQ, 2011).
Sodium - 200 mg/l Not of health concern at levels found in drinking-water (GDWQ, 2011).
Sodium dichloroisocyanurate Sodium dichloroisocyanurate: 50 mg/l Cyanuric acid: 40 mg/l.
- Sodium dichloroisocyanurate is used for the disinfection of drinking-water, exposure will be to both the chlorinated species and residual cyanuric acid (GDWQ, 2011).
Styrene 0.02 mg/l - Has been detected in drinking-water and surface water at concentrations below 1 µg/l (GDWQ, 2011).
Sulphate - 250 mg/l -

Confidential Page 35 of 53 15/12/2017
2,4,5-T 0.009 mg/l - Concentrations, if detected are usually no greater than a few micrograms per litre (GDWQ, 2011).
Terbuthylazine 0.007 mg/l - Concentrations in water seldom exceed 0.2 µg/l, although higher concentrations have been observed (GDWQ, 2011).
Tetrachloroethene 0.04 mg/l 0.01µg/l Concentrations in drinking-water are generally below 3 µg/l, although much higher concentrations have been detected in well water (23 mg/l) and in contaminated groundwater (1 mg/l) (GDWQ, 2011).
Toluene 0.7 mg/l - Concentrations of a few micrograms per litre have been found in surface water, groundwater and drinking-water; point emissions can lead to higher concentrations in groundwater (up to 1 mg/l); it may also penetrate plastic pipes from contaminated soil (GDWQ, 2011).
Trichloroacetic acid 0.2 mg/l - Detected in groundwater and surface water distribution systems in the USA at mean concentrations of 5.3 µg/l (up to a maximum of 80 µg/l) and 16 µg/l (up to a maximum of 174 µg/l), respectively; maximum concentration (200 µg/l) measured in chlorinated water in Australia (GDWQ, 2011).
Trichloroethene 0.02 mg/l 0.01 mg/l The guideline value is designated as provisional because of deficiencies in the toxicological database (GDWQ, 2011).
Trifluralin 0.02 mg/l - Not detected in the small number of drinking-water samples analysed; has been detected in surface water at concentrations above 0.5 µg/l and rarely in groundwater (GDWQ, 2011).
Trihalomethanes (bromoform, bromodichloromethane, chloroform, dibromochloromethane)
bromoform: 0.1 mg/l chloroform: 0.3 mg/l dibromochloromethane (DBCM): 0.1 mg/l bromodichlorometh
100 µg/l (in total)
THMs are not expected to be found in raw water (unless near a pollution source), but are usually present in finished or chlorinated water; concentrations are generally below 100 µg/l; in most circumstances, chloroform is the dominant compound (GDWQ, 2011).
Confidential Page 36 of 53 15/12/2017
ane (BDCM): 0.06 mg/l
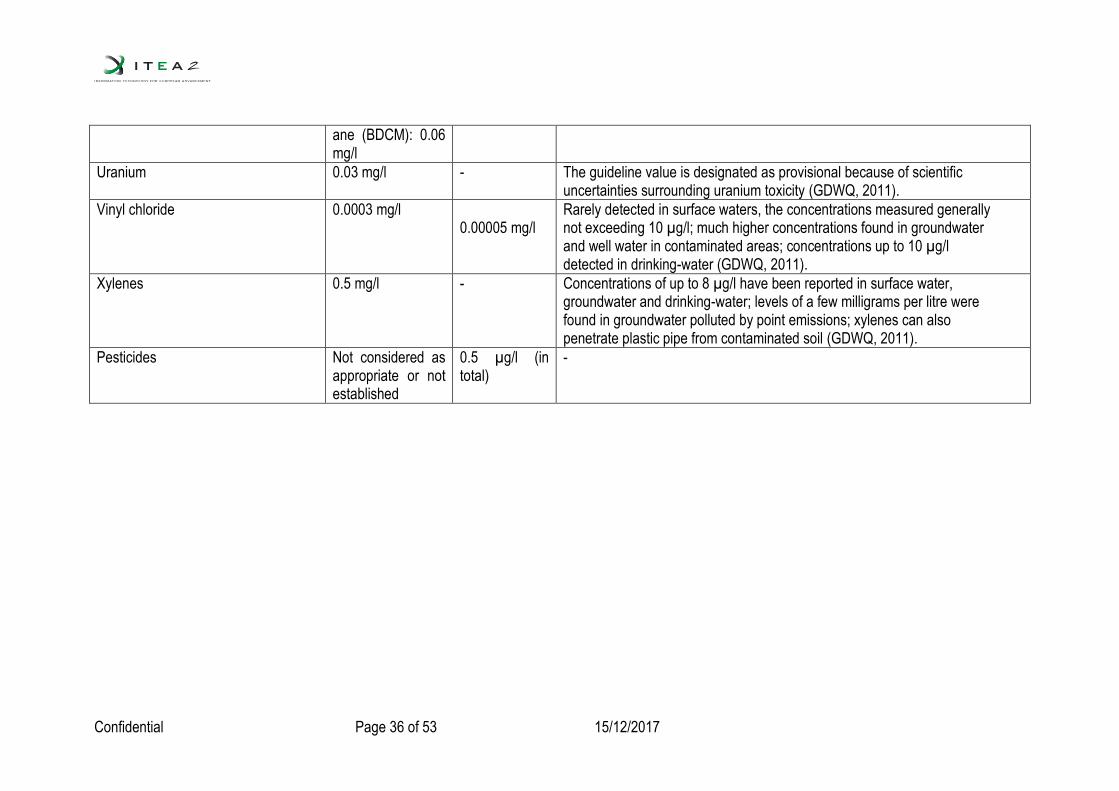
Uranium 0.03 mg/l - The guideline value is designated as provisional because of scientific uncertainties surrounding uranium toxicity (GDWQ, 2011).
Vinyl chloride 0.0003 mg/l 0.00005 mg/l
Rarely detected in surface waters, the concentrations measured generally not exceeding 10 µg/l; much higher concentrations found in groundwater and well water in contaminated areas; concentrations up to 10 µg/l detected in drinking-water (GDWQ, 2011).
Xylenes 0.5 mg/l - Concentrations of up to 8 µg/l have been reported in surface water, groundwater and drinking-water; levels of a few milligrams per litre were found in groundwater polluted by point emissions; xylenes can also penetrate plastic pipe from contaminated soil (GDWQ, 2011).
Pesticides
Not considered as appropriate or not established
0.5 µg/l (in total)
-
There is a list of the chemicals that can occur in a drinking-water supply system. It is important to identify those chemicals of concern according to local circumstances in each waterworks. It should be noted that chemical contaminants in drinking-water should be prioritized to ensure scarce resources. And that they are not directed towards management of chemicals that pose no threat to health and do not affect the acceptability of drinking-water. Due to high price of chemical testing, it is not feasible to test for all chemical constituents in drinking-water on an equal basis.
Water supply utilities should identify those chemicals that may cause a potential public health risk in collaboration with public health authorities. When identifying such chemicals, the end result is achieved by developing and understanding of the characteristics of the drinking-water catchment, including natural influences on groundwater and surface water, the types and sizes of industrial and agricultural activities, and human settlements within a catchment. Treatment process and distribution of drinking-water also influences to the final quality of water. In addition, chemicals, materials and processes used in the production and distribution of water will influence the chemical quality of drinking-water.
In assessing the chemical quality of a water supply, it is important to include the four priority chemicals (arsenic, fluoride, nitrate and selenium) first, before assessing the water supply system for chemicals of local concern. Extensive international experience has shown that these four chemicals produce adverse health effects as a consequence of exposure through numerous water supplies around the world. Two other commonly occurring constituents, iron and manganese, are of high priority because they can give rise to significant discolouration of drinking-water, making it unusable to consumers. Iron and manganese are also typically found in northern soil and therefore pose a risk in Finnish ground waters (Komulainen 2014).
3.2.1 Arsenic
Arsenic is one of the most dangerous inorganic pollutants present in drinking water. It is released from certain human activities and naturally from the Earth’s crust (Víctor-Ortega & Ratnaweera 2017). Arsenic is naturally present at high levels in the groundwater of a number of countries. It has been found to be positively associated with very low birth weight and preterm birth in a population where nearly all (>99%) of the population was exposed under the current maximum contaminant level of 10 µg/L (Almberg et al., 2017). Drinking water contaminated with arsenic poses the greatest threat to public health. Exposure with arsenic can happen with water used for drinking, food preparation and irrigation of food crops.Long-term exposure to arsenic from drinking-water and food can cause cancer and skin lesions. Arsenic is one of WHO’s 10 chemicals of major public health concern (WHO 2001). In one estimate, arsenic-contaminated drinking-water in Bangladesh alone was attributed 9,100 deaths and 125,000 Disability Adjusted Life Years (DALYs) in 2001 (Lokuge et al., 2004). It has also been associated with developmental effects, cardiovascular disease, neurotoxicity and diabetes. WHO recommends 10 µg/l level for arsenic provisional guideline value, in view of scientific uncertainties surrounding the risk assessment for arsenic carcinogenicity (WHO 2008).
3.2.2 Fluoride
Large, nationwide cohort study of Swedish residents chronically exposed to various fluoride levels in the drinking water did not reveal any overall increased risks for myocardial infarction due to drinking water fluoride exposure (Näsman et al., 2016). The acute toxic dose of fluoride has been believed to be 2 to 5 mg or 8 mg/kg of body weight. However, acute fluoride poisonings have occurred at doses of 0.1 to 0.8 mg/kg of body weight in the USA (Akiniwa,K., 1997). The presence of fluoride in drinking water is known to reduce dental cavities among consumers, but

Confidential Page 38 of 53 15/12/2017
an excessive intake of this anion might leads to dental and skeletal fluorosis (Guissouma et al., 2017).
1.1.1 Iron
Iron causes unwanted taste and odour in drinking water and it can also stain surfaces. Concentrations of iron in drinking-water are normally less than 0.3 mg/litre but may be higher in countries where various iron salts are used as coagulating agents in water-treatment plants and where iron pipes are used for water distribution (WHO 2003). Anaerobic groundwaters may contain iron(II) at concentrations up to several milligrams per litre without discoloration or turbidity. Taste is not usually noticeable at iron concentrations below 0.3 mg/litre, although turbidity and colour may develop in piped systems at levels above 0.05–0.1 mg/litre. Laundry and sanitary ware will stain at iron concentrations above 0.3 mg/litre. Iron is an essential trace element in living organisms. Estimates of the minimum daily requirement depends on age, sex, physiological status, and iron bioavailability and range from about 10 to 50 mg/day. The average lethal dose of iron is 200–250 mg/kg of body weight, but death has occurred following the ingestion of much lower doses (40 mg/kg of body weight) (WHO 2003).
1.1.1 Manganese
Manganese in the household water is considered an aesthetic problem (taste, smell, coloring). But there is an evidence that drinking water manganese is also associated with health risk, especially for children, even during pregnancy (WHO 2011a). In Finland high levels of manganese is a problem in drill well waters (Komulainen 2014).
Manganese is an essential trace element for humans. We need small amounts of manganese every day. Nutritional manganese does not cause any health hazards. We get enough manganese from the diet without any additional measures or supplements. Adults receive manganese in the diet from 0.7 to 10.9 mg per day (WHO 2011a). Potassium manganese is more harmful. The reason for this is unknown. Apparently, other nutrition components reduce the absorption of manganese into the body (bioavailability). If manganese in drinking water exceeds 100 μg / l (micrograms per liter), it is a health risk (Komulainen 2014).
Epidemiologic studies have shown connection of high manganese level in drinking water with negative health impacts in children such as learning difficulties, behavioural effects and lowered IQ (Bouchard et al. 2011, Khan et al. 2011, Wasserman et al. 2011). Effects are similar to those caused by lead. Exposure to manganese during pregnancy is also found to cause developmental effects in children. There are no health guideline values for manganese in EU, only recommendation for quality guideline of 50 µg/l for larger waterworks, max 100 µg/l in private wells. However there is ongoing discussion about the health safety level of manganese, for example according to WHO assessment, 400 µg/l of manganese in drinking water is considered as harmless (WHO 2011a).
3.2.3 Nitrate
Nitrate is used mainly in inorganic fertilizers. It is also used as an oxidizing agent and in the production of explosives, and purified potassium nitrate is used for glass making. Sodium nitrite is used as a food preservative, especially in cured meats. Nitrate occurs naturally in plants, for which it is a key nutrient. Nitrate and nitrite are also formed endogenously in mammals, including humans. Nitrate is secreted in saliva and then converted to nitrite by oral microflora.

Confidential Page 39 of 53 15/12/2017
Nitrate can reach both surface water and groundwater as a consequence of agricultural activity (including excess application of inorganic nitrogenous fertilizers and manures), from wastewater treatment and from oxidation of nitrogenous waste products in human and animal excreta, including septic tanks. Nitrite can also be formed chemically in distribution pipes by Nitrosomonas bacteria during stagnation of nitrate-containing and oxygen-poor drinking-water in galvanized steel pipes or if chloramination is used to provide a residual disinfectant and the process is not sufficiently well controlled (WHO 2011b).
3.2.4 Selenium
The trace element selenium (Se) in its various chemical species continues to attract strong interest in environmental health, due to the broad and varying effects suggested by laboratory studies, ranging from toxic to beneficial (Jablonska and Vinceti, 2015). Epidemiologic studies that investigated the effects of selenate, an inorganic selenium species commonly found in drinking water, together with evidence of toxicity of inorganic selenium at low levels in vitro and animal studies, indicate that health risks may occur at exposures below the current European Union and World Health Organization upper limit and guideline of 10 and 40 μg/l, respectively, and suggest reduction to 1 μg/l in order to adequately protect human health (Vinceti et al., 2016). Although it is currently know that drinking water in some areas have selenium concentrations exceeding this level, the public health importance of this issue should not be overlooked, and further epidemiologic research is critically needed in these areas (Vinceti et al., 2013).
3.2.5 Organic contaminants
A number of organic chemical contaminants have been identified in drinking water. There are several sources of organic chemical contaminants in drinking water supply chain, including municipal and industrial discharges, urban and rural run-offs, drinking water distribution materials and the drinking water treatment process. Surface water systems are more exposed than groundwater systems to weather and runoffs and therefore they may be more susceptible to contamination. Chemical contaminants for which epidemiologic studies have reported associations include disinfection by-product and pesticides (Calderon 2000).
Disinfection by-products are formed when disinfectants (chlorine, ozone, chlorine dioxide, chloramines) react with naturally occurring organic matter, anthropogenic contaminants, bromide, and iodide during the production of drinking water. Alternative disinfection practices result in drinking water which is less mutagenic than extracts of chlorinated water. However, the levels of many emerging DBPs are increased by alternative disinfectants (primarily ozone or chloramines) compared to chlorination, and many emerging DBPs are more genotoxic than some of the regulated DBPs (Richardson et al. 2007).
Pesticides enter surface and ground water primarily as runoff from crops and are most prevalent in agricultural areas. Pesticides are also used on golf courses, forested areas, along roadsides, and in suburban and urban landscape areas. Largest groups of pesticides are organophosphates, carbamates and chlorinated pesticides. Since pesticide groups are so diverse, health assessment must be done separately for each compound. Organophosphates and carbamane effect on central nervous system, other pesticides may cause skin or eye irritation. Chlorinated pesticides are carcinogenic, may affect hormonal systems and disturb fertility. Newest research has found evidence on the effect of chlorinated pesticides to obesity and type 2 diabetes (THL 2017)

Confidential Page 40 of 53 15/12/2017
Pharmaceuticals and personal care products (PPCP), often referred as emerging contaminants, are increasingly being detected at low levels in surface water, and there is concern that these compounds may have an impact on human health. Emerging contaminants include a wide array of different compounds and their transformation products such as pharmaceuticals, personal care products, pesticides, veterinary products, industrial compounds/by-products, food additives, and engineered nano-materials (Murray et al., 2010; Pal et al., 2010). There are many PPCPs that act as so-called endocrine disruptors (EDCs). EDCs are compounds that alter the normal functions of hormones resulting in a variety of health effects.
Due to water shortage, there are growing demands for freshwater sources in Africa and other dry areas. Shallow groundwater sources are particularly important as local sources of drinking water, however they are also potentially very vulnerable to anthropogenic contamination (Howard et al., 2003; Hunter et al., 2010). There is a need to understand all potential risks to groundwater resources, including understanding the occurrence and sources of emerging contaminants worldwide.
Information on chemical health risk in drinking water are available by WHO (WHO 2011c) and US EPA (US EPA 2017). Integrated Risk Information System (IRIS) provides information for hazardous chemicals. European chemical agency (ECHA) provides also database on chemicals used and sold in EU (ECHA 2017).

Confidential Page 41 of 53 15/12/2017
4 Risk assessment methods
4.1 Water safety plans
The WSP approach has been developed to organize and systematize the whole history of water practices applied to drinking-water production. Furthermore it is developed to ensurethe applicability of these practices to the management of drinking-water quality for waterworks, consumers and regulators (Figure 2). A WSP is built with three key components, which are guided by health-based targets set by the authorities by the local administration and overseen through drinking-water supply monitoring (Figure 3) (WHO 2011c):
1. System assessment to determine whether the drinking-water supply chain (up to the point of consumption) as a whole can deliver water of a quality that meets health-based targets. This also includes the assessment of design criteria of new systems;
2. Identifying control measures in a drinking-water production and distribution system that will collectively control identified risks and ensure that the health-based targets are meet. For each control measure identified, an appropriate means of operational monitoring should be defined that will ensure that any deviation from required performance is rapidly detected in a timely manner; and
3. Management plans describing actions to be taken account during normal operation or incident conditions and documenting the system assessment (including upgrade and improvement), monitoring and communication plans and supporting programmes.
Figure 3. WSP protocol takes into account waterworks, consumers and regulators (WHO 2011c).

Confidential Page 42 of 53 15/12/2017
WSP is a step-by-step risk management procedure for drinking water suppliers aiming consistently to ensure safe and acceptable water quality during drinking water production. WSP requires assembling the WSP team among the staff workers of water utility, description of the water supply system assessments including describing the water supply system, identifying the hazardous events and assessing the risks among it. Also determination and validation of the control measures and reassessing and prioritizing the detected risks are included. It also contains development, implementation and maintaining as well as improvement of water treatment systems. Operational monitoring systems will be developed based on the control measures and it will verify the effectiveness of WSP. Management and communication, including preparing the management procedures and developing the supporting programs with feedback from the system users will be utilized and with that, WSP will be more developed. There are some key components that are involved in the WSP, such as health based targets based on an evaluation of health concerns, system assessment to determine whether the water supply chain (from source through treatment to the point of consumption) as a whole can deliver water of a quality that meets the health-based targets. WSP is an independent surveillance system which verifies proper operating. In addition to the microbial risks to drinking-watersafety may also be compromised by chemical and radiological constituents (WHO 2011c).
Figure 4. The key elements in water safety plan (WHO 2011c).
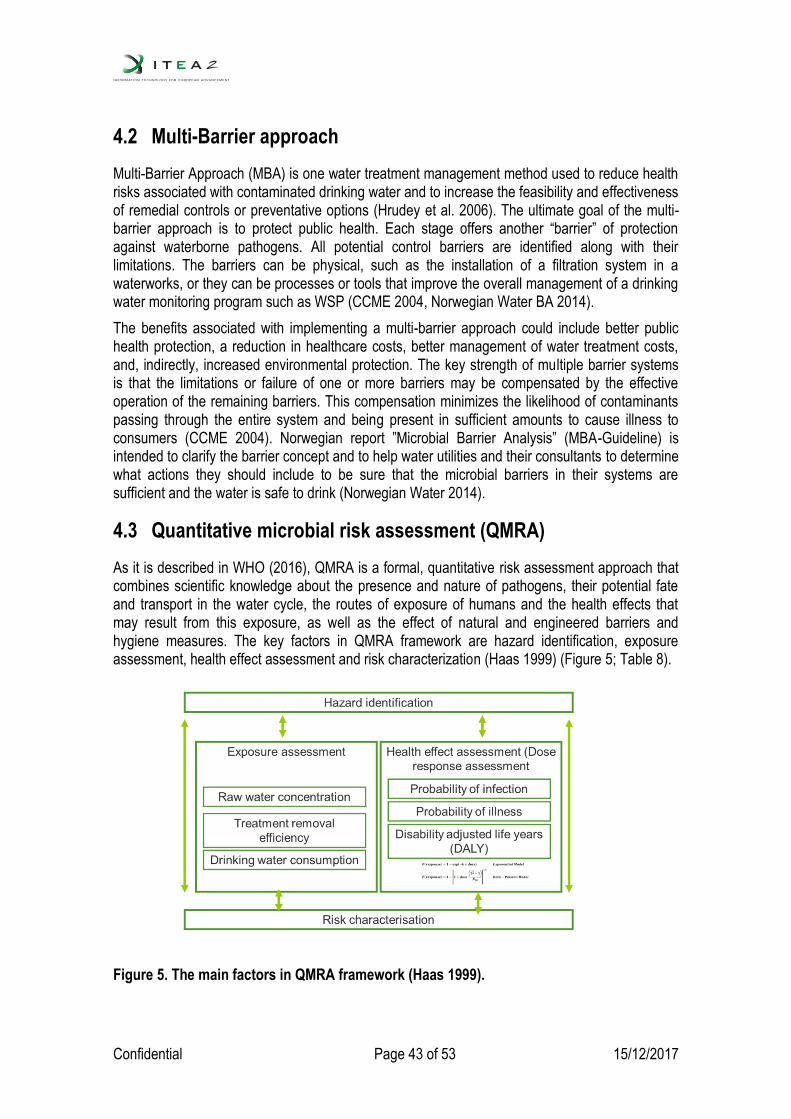
Confidential Page 43 of 53 15/12/2017
4.2 Multi-Barrier approach
Multi-Barrier Approach (MBA) is one water treatment management method used to reduce health risks associated with contaminated drinking water and to increase the feasibility and effectiveness of remedial controls or preventative options (Hrudey et al. 2006). The ultimate goal of the multi-barrier approach is to protect public health. Each stage offers another “barrier” of protection against waterborne pathogens. All potential control barriers are identified along with their limitations. The barriers can be physical, such as the installation of a filtration system in a waterworks, or they can be processes or tools that improve the overall management of a drinking water monitoring program such as WSP (CCME 2004, Norwegian Water BA 2014).
The benefits associated with implementing a multi-barrier approach could include better public health protection, a reduction in healthcare costs, better management of water treatment costs, and, indirectly, increased environmental protection. The key strength of multiple barrier systems is that the limitations or failure of one or more barriers may be compensated by the effective operation of the remaining barriers. This compensation minimizes the likelihood of contaminants passing through the entire system and being present in sufficient amounts to cause illness to consumers (CCME 2004). Norwegian report ”Microbial Barrier Analysis” (MBA-Guideline) is intended to clarify the barrier concept and to help water utilities and their consultants to determine what actions they should include to be sure that the microbial barriers in their systems are sufficient and the water is safe to drink (Norwegian Water 2014).
4.3 Quantitative microbial risk assessment (QMRA)
As it is described in WHO (2016), QMRA is a formal, quantitative risk assessment approach that combines scientific knowledge about the presence and nature of pathogens, their potential fate and transport in the water cycle, the routes of exposure of humans and the health effects that may result from this exposure, as well as the effect of natural and engineered barriers and hygiene measures. The key factors in QMRA framework are hazard identification, exposure assessment, health effect assessment and risk characterization (Haas 1999) (Figure 5; Table 8).
Figure 5. The main factors in QMRA framework (Haas 1999).
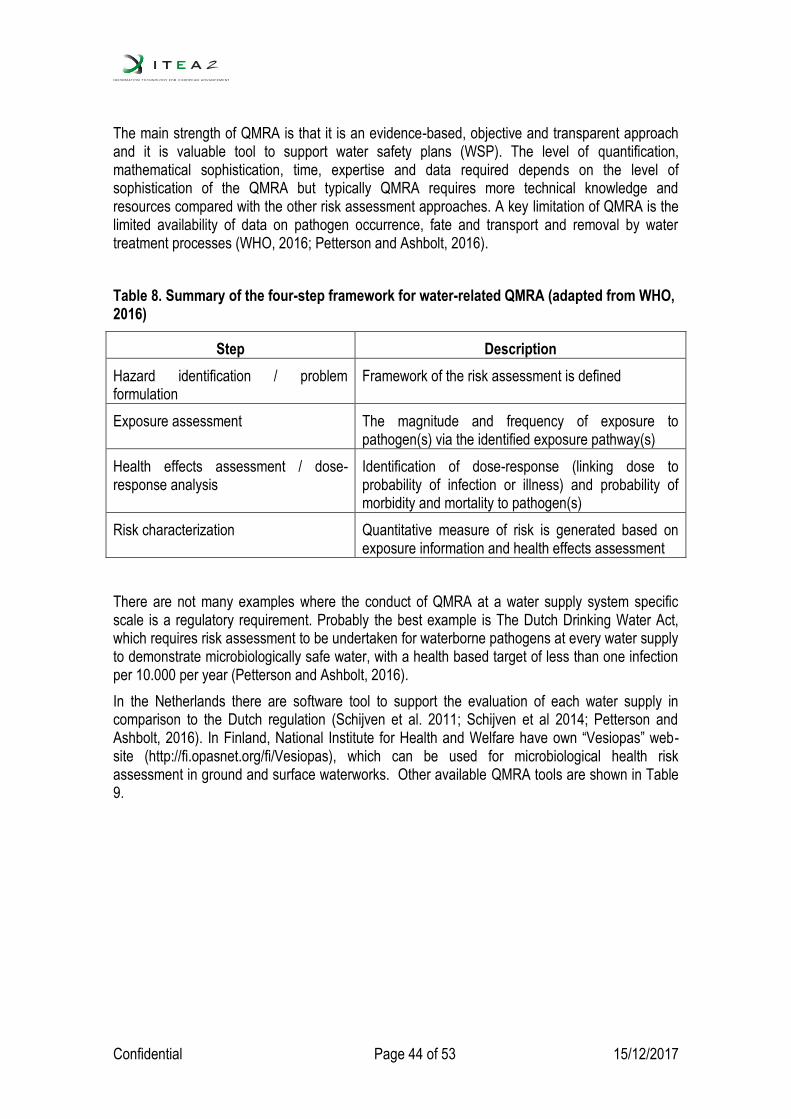
Confidential Page 44 of 53 15/12/2017
The main strength of QMRA is that it is an evidence-based, objective and transparent approach and it is valuable tool to support water safety plans (WSP). The level of quantification, mathematical sophistication, time, expertise and data required depends on the level of sophistication of the QMRA but typically QMRA requires more technical knowledge and resources compared with the other risk assessment approaches. A key limitation of QMRA is the limited availability of data on pathogen occurrence, fate and transport and removal by water treatment processes (WHO, 2016; Petterson and Ashbolt, 2016).
Table 8. Summary of the four-step framework for water-related QMRA (adapted from WHO, 2016)
Step Description
Hazard identification / problem formulation
Framework of the risk assessment is defined
Exposure assessment The magnitude and frequency of exposure to pathogen(s) via the identified exposure pathway(s)
Health effects assessment / dose-response analysis
Identification of dose-response (linking dose to probability of infection or illness) and probability of morbidity and mortality to pathogen(s)
Risk characterization Quantitative measure of risk is generated based on exposure information and health effects assessment
There are not many examples where the conduct of QMRA at a water supply system specific scale is a regulatory requirement. Probably the best example is The Dutch Drinking Water Act, which requires risk assessment to be undertaken for waterborne pathogens at every water supply to demonstrate microbiologically safe water, with a health based target of less than one infection per 10.000 per year (Petterson and Ashbolt, 2016).
In the Netherlands there are software tool to support the evaluation of each water supply in comparison to the Dutch regulation (Schijven et al. 2011; Schijven et al 2014; Petterson and Ashbolt, 2016). In Finland, National Institute for Health and Welfare have own “Vesiopas” web-site (http://fi.opasnet.org/fi/Vesiopas), which can be used for microbiological health risk assessment in ground and surface waterworks. Other available QMRA tools are shown in Table 9.

Confidential Page 45 of 53 15/12/2017
Table 9. QMRA tools available with respective website and short description of the tool.
Name Website Description
Vesiopas
(Water guide)
http://fi.opasnet.org/fi/Vesiopas Open QMRA tool in Finnish (R-based)
QMRAspot http://www.rivm.nl/en/Topics/W/WHO_Collaborating_Centre_Risk_Assessment_of_Pathogens_in_Food_and_Water/Tools/QMRAspot
Open QMRA tool in English (for drinking water produced from surface water)
QMRAcatch http://www.rivm.nl/en/Topics/W/WHO_Collaborating_Centre_Risk_Assessment_of_Pathogens_in_Food_and_Water/Tools/QMRAcatch
Open QMRA tool in English (required treatment of river water for drinking water production)
QMRAwiki http://qmrawiki.canr.msu.edu/index.php/Quantitative_Microbial_Risk_Assessment_(QMRA)_Wiki
The QMRA Wiki is a community portal for current quantitative information and knowledge developed for the Quantitative Microbial Risk Assessment (QMRA) field.
A swift Quantitative Microbiological Risk Assessment (sQMRA)
http://foodrisk.org/default/assets/File/sQMRA%20tool%20[Evers%20and%20Chardon%20(2010),%20Food%20Control,%2021,%20319-330].xls
Open tool calculates the public health risk of pathogens in food
FDA-iRISK https://irisk.foodrisk.org/ A web-based system, which can be used to analyze data concerning microbial and chemical hazards in food and calculate an estimate of health burden.
Risk Ranger http://www.foodsafetycentre.com.au/riskranger.php
Food safety risk calculation tool intended as an aid to determining relative risks from different product, pathogen and processing combinations.
Confidential Page 46 of 53 15/12/2017
5 Risk Management protocols in water security
Monitoring of drinking water quality is an important phase when ensuring water safety. Drinking water quality monitoring is based on both EU and national legislation.Unfortunately, the “routine” monitoring system, that gives minimum requirements for the quality monitoring is able to test only a small fraction of all distributed drinking water. By the time monitoring results show that contaminants are present, something has already gone wrong and a hazard is already present in the water and customer safety is endangered. In worst case, a DW contamination can lead to a waterborne outbreak.
Figure 6. presents the protocol of risk assessment, decision making process and risk management in relation to detection of water quality changes. On option for enhancing water safety concerns the usage of on-line water quality sensors, which enables creating a real-time picture of water quality changes. The critical factor in risk management is the information of the observed change in water quality (or other physical abnormal situation), which creates a signal thatwill be transferred through the ICT systems to the monitoring room of water works causing an alarm.Then the staff of water works should use their knowledge (risk assessment) which should lead either ignore the observation or to launch of corrective mitigations actions.
One approach to risk management might be the prevention of contaminations and preplanning of counter-measures should a DW contamination occur. A comprehensive risk assessment and management protocol concerning the whole drinking water production systems starting from raw water sources ending to consumer’s taps could be an answer to “complete” safe drinking water. An option to achieve comprehensive risk assessment and risk management system for safe drinking water system is to apply Water Safety Planning (WSP) protocol. Water safety plans for drinking-water supplies provide an additional benefit of reducing the risks, e.g. the likelihood of contaminants entering supplies in the first place. Water safety plans are used for risk-management during treatment and distribution so that monitoring is not the only water quality management technique used and further reducing the risk of contamination. To help you create and operate a water safety plan for your drinking-water supply a set of tools and WSP protocols have been gathered in section 5. In Figure 6 it is shown how an incident, e.g. a contamination in raw water, is detected, how risks are assessed followed by decision making process and management action, e.g. from WSP, resulting new improved change in water quality.
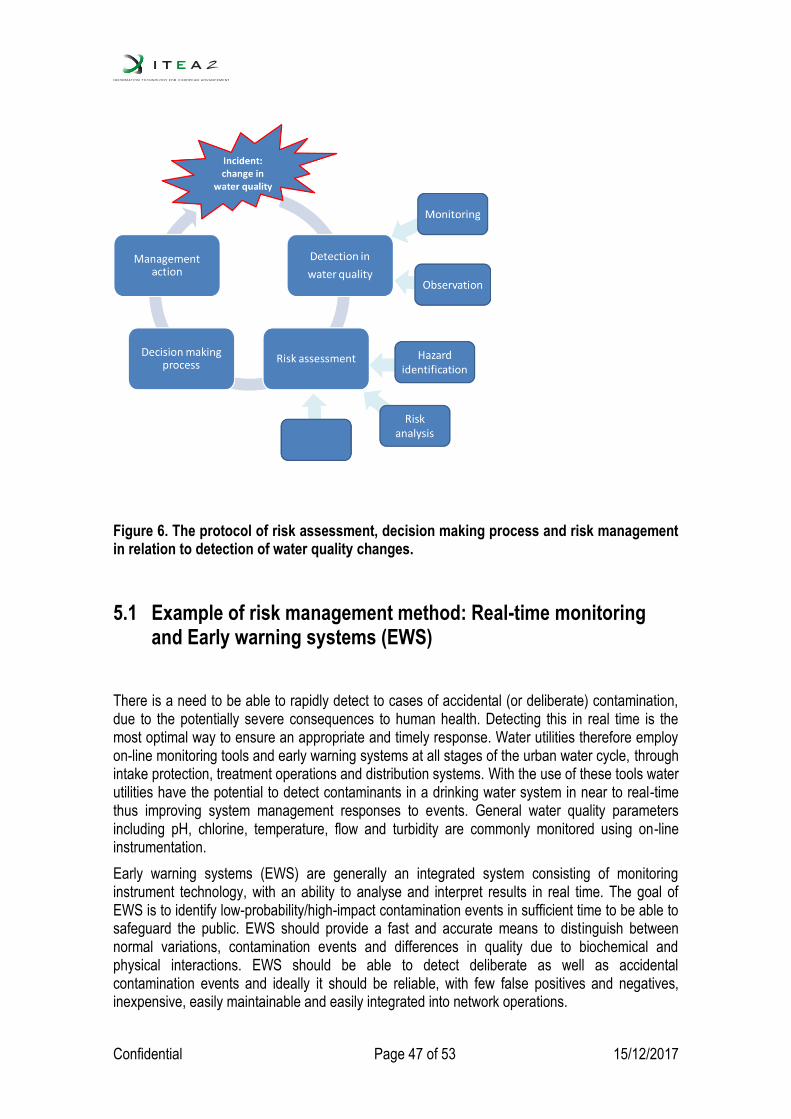
Confidential Page 47 of 53 15/12/2017
Figure 6. The protocol of risk assessment, decision making process and risk management in relation to detection of water quality changes.
5.1 Example of risk management method: Real-time monitoring and Early warning systems (EWS)
There is a need to be able to rapidly detect to cases of accidental (or deliberate) contamination, due to the potentially severe consequences to human health. Detecting this in real time is the most optimal way to ensure an appropriate and timely response. Water utilities therefore employ on-line monitoring tools and early warning systems at all stages of the urban water cycle, through intake protection, treatment operations and distribution systems. With the use of these tools water utilities have the potential to detect contaminants in a drinking water system in near to real-time thus improving system management responses to events. General water quality parameters including pH, chlorine, temperature, flow and turbidity are commonly monitored using on-line instrumentation.
Early warning systems (EWS) are generally an integrated system consisting of monitoring instrument technology, with an ability to analyse and interpret results in real time. The goal of EWS is to identify low-probability/high-impact contamination events in sufficient time to be able to safeguard the public. EWS should provide a fast and accurate means to distinguish between normal variations, contamination events and differences in quality due to biochemical and physical interactions. EWS should be able to detect deliberate as well as accidental contamination events and ideally it should be reliable, with few false positives and negatives, inexpensive, easily maintainable and easily integrated into network operations.
Confidential Page 48 of 53 15/12/2017
A new generation of on-line monitoring tools based on sensor technology has emerged in recent years and development work towards the new sensors continues currently in many companies and universities. Effective implementation of these tools however has not been realized for a number of reasons, least of which (i) they do not meet practical utility needs, (ii) their cost, reliability and maintenance are unsatisfactory, and (iii) data handling and management and an ability to produce meaningful operational information is yet to be realized.
Although operations and technology go hand-in-hand, it is likely that technology in terms of monitoring will need to evolve to meet the many operational constraints. Ultimately it will be a balance between cost and ease of implementation. To ensure their survival in network operations, early warning systems must furthermore demonstrate operational benefits (such as better water quality, decreased operating costs or reduced customer complaints). A focus on water security alone does not provide sufficient grounds for its survival in operations, given the maintenance, technical expertise and cost required, and the number of false alarms often associated with them. One way to validate any technology (either existing or emerging) is for water companies to make data available for research, and there is thus a need to build an information platform that could be provided by automated meter reading (AMR) and wireless technologies. AMR has an added benefit in that it is dual purpose, given its intended use in billing and potential use in leak detection. Solid-state instrumentation that measures traditional water quality parameters including pH, chlorine, temperature, flow and turbidity continues to provide the most reliable information and should form the focus of water utility attention. There is a need for predictive models that better describe distribution system dynamics and contaminant transport within a distribution system. Furthermore, there is a need for improved incident management strategies to restore operations and public confidence in the event of contamination of source waters and distribution systems.
Confidential Page 49 of 53 15/12/2017
6 Conclusion
Drinking water safety can be compromised by several key points such as the water supply safety, quality issues regarding raw water source as well as certainty and fluency of the water treatment process. Prevention of contaminants entering the raw water supply, the removal of particles from the water, inactivation of the microorganisms in the water, and maintenance of the water quality during distribution are the main steps in water safety framing the base for assessing vulnerable contamination scenarios in health based water risk assessment. Several hazardous situations may disturb these steps and should be taken into account and valuated in risk assessment process such as WSP.
The outcome of the assessment, the probability of risk (health risk) consists of the magnitude (severity) of the possible adverse consequence such as the raw water contamination of process malfunction, and the likelihood (probability) of occurrence of each consequence. Therefore the probability of a water security related risk depends upon not only the likelihood but the severity of such risks.
Hazards and risks related to drinking water production can be evaluated and minimized with the different risk assessment tools and frameworks. Different types of risks include: health based risks (chemical, microbial), physical risks, hazardous risks, damage containment and cyber security risks.
Most common tools for securing drinking water safety are Water Safety Plan (WSP), Multi-barrier Analysis (MBA), and Quantitative Microbial Risk Assessment (QMRA). In EU legislation, risk assessment has been introduced in the Drinking Water Directive (EU COMMISSION DIRECTIVE (EU) 2015/1787) wheremonitoring of drinking water may be based on the risk assessment. The WSP can be used to identify the potential hazards in water, assess significance and probability of the risks, and determine the necessary risk management measures to reduce the risks. In briefly: minimizing the dangers and ensuring the water quality. In complex issues this may not always directly mean removal of the threaths but only inactivating them. For example usage of disinfection against to detected microbial hazards or use of activated carbon filtration to remove organic compounds like pesticides.
In health risk management of drinking water the water treatment process is essential. Technology used in waterworks is aimed mainly to remove nutrients and microbes from water and therefore removal of harmfull chemicals is constantly under discussion due to limited knowledge and selection of treatment methods available.
There are several in-depth risk assessment and management methods available for free to water supply needs. QMRA is one of the most used methods in recent decade and there are several examples available online, e.g. Finnish tool Vesiopas and Dutch tool QMRAspot. For MBA-method the Norwegian guide is available in English. Outside Europe US EPA has a comprehensive database on water contaminants and QMRA tool.
Early warning systems tested in the Water-M project in WP show an example of early warning signal which trigger the process for ensuring water safety and security by sampling for laboratory
Confidential Page 50 of 53 15/12/2017
analyses followed by risk assessment focusing on observed hazards. The risk assessment process should initiate to risk management actions for mitigation of health risks originating from the detected hazards.

Confidential Page 51 of 53 15/12/2017
References
Almberg, K.S., Turyk, M.E., Jones, R.M., Rankin, K., Freels, S., Graber, J.M. and Stayner, L.T. 2017 Arsenic in drinking water and adverse birth outcomes in Ohio. Environmental Research 157 (2017) 52–59.
Akiniwa, K. (1997). Re -examination of acute toxicity of fluoride. Fluoride 30: 89-104.Almberg, K.S., Turyk, M.E., Jones, R.M., Rankin, K., Freels, S.Graber, Stayner, L.T., 2017. Arsenic in drinking water and adverse birth outcomes in Ohio. 2017.
Bouchard M.F. ym. 2011. Intellectual impairment in school-age children exposed to manganese in drinking water. Env. Health. Perpect., 119:138-143.
Canadian Council of Ministers of the Environment (CCME) 2004. From Source to Tap: Guidance on the Multi-Barrier Approach to Safe Drinking Water. http://www.ccme.ca/files/Resources/water/source_tap/mba_guidance_doc_e.pdf
Cheremisinoff, N.P. Handbook of Water and Wastewater Treatment Technologies
ECHA 2017. Information on chemicals. https://echa.europa.eu/fi/information-on-chemicals
EU 2015. EU COMMISSION DIRECTIVE (EU) 2015/1787. Commission Directive (EU) 2015/1787 of 6 October 2015 amending Annexes II and III to Council Directive 98/83/EC on the quality of water intended for human consumption. http://eur-lex.europa.eu/legal-content/EN/TXT/?uri=uriserv%3AOJ.L_.2015.260.01.0006.01.ENG
Crittenden, J.C., Trussell, R.R., Hand D.W. Howe, K.J., Tchobanoglous G.T. (2005) Water Treatment: Principles and Design. Second edition John Wiley&Sons Inc.
Guissouma W, Hakami O, Al-Rajab AJ, Tarhouni J. 2017. Risk assessment of fluoride exposure in drinking water of Tunisia. Chemosphere 177:102-108.Guissouma W, Hakami O, Al-Rajab AJ, Tarhouni J. 2017. Risk assessment of fluoride exposure in drinking water of Tunisia. Chemosphere 177:102-108.
Hoff,J.C. and Akin, E.W., 1986. Microbial resistance to disinfectants: mechanisms and significance, Environ. Health Perspect., 69,7.
Howard,G. Pedley, S. Barrett, M. Nalubega, M. Johal, K. 2003. Risk factors contributing to microbiological contamination of shallow groundwater in Kampala, Uganda. Water Res., 37(14): 3421-3429.
Hrudey, SE., Hrudey, EJ., Pollard, SJT. 2006. Risk management for assuring safe drinking water, In Environment International, 32 (8): 948-957.
Hunter PR, MacDonald AM, Carter RC (2010) Water Supply and Health. PLoS Med 7(11): e1000361. https://doi.org/10.1371/journal.pmed.1000361.
Jablonska E, Vinceti M. 2015: Selenium and Human Health: Witnessing a Copernican Revolution? J Environ Sci Health C Environ Carcinog Ecotoxicol Rev. 33(3):328-68.

Confidential Page 52 of 53 15/12/2017
Ji, Y. Yanli, J. Weijie, Q., Yawei, Y., Quanfu, A., Liu, L. Zhon, Y. Gao, C. (2017) Recent developments in nanofiltration membranes based on nanomaterials. Chinese Journal of Chemical Engineering, Article in press.
Khan K. ym. 2011. Manganese exposure from drinking water and children´s classroom behavior in Bangladesh. Env. Health. Perpect., 119:1501-1506.
LeChevallier, M. W. and Kwok-Keung Au. (2004). Water treatment and pathogen control. Process efficiency in achieving safe drinking water. IWA Publishing, London. WHO ISBN 92-4-156255-2
Lokuge KM et al. 2004. The effect of arsenic mitigation interventions on disease burden in Bangladesh. Environmental Health Perspectives, 112(11):1172–1177 (http://www.ncbi.nlm.nih.gov/pmc/articles/PMC1247477/pdf/ehp0112-001172.pdf).
Morris, E.J. 1972. The practical use of ultraviolet radiation for disinfection purposes. Med. Lab. Technol. 29:41-47.
Murray, SE., Thomas, Bodour, 2010. Prioritizing research for trace pollutants and emerging contaminants in the freshwater environment, In Environmental Pollution, 158(12):3462-3471.
Norwegian Water BA. 2014. Microbial barrier analysis (MBA) – a guideline. Norwegian Water report 202/2014. Eds. Ødegaard H., Østerhus SW and Pott B-M. , 74 pages, Hamar, Norway. ISBN 978-82-414-0352-1
NRC 1980. Drinking Water and Health: Volume 2. National Research Council (US) Safe Drinking Water Committee. Washington (DC): National Academies Press (US).
Näsman, P., Granath, F., Ekstrand, A., Ekbom, G., Sandborgh-Englund, C. M. Fored 2016. Natural fluoride in drinking water and myocardial infarction: A cohort study in Sweden. Sci.Total Environ. 562-305.
Pal, A., Gin, KYH., Lin, AYC., Reinhard M. 2010.Impacts of emerging organic contaminants on freshwater resources: review of recent occurrences, sources, fate and effects. Sci. Total Environ., 408: 6062-6069.Petterson, S. R., & Ashbolt, N. J. 2016. QMRA and water safety management: review of application in drinking water systems. Journal of water and health, 14(4), 571 -589.
Richardson SD1, Plewa MJ, Wagner ED, Schoeny R, Demarini DM. 2007: Occurrence, genotoxicity, and carcinogenicity of regulated and emerging disinfection by-products in drinking water: a review and roadmap for research. Mutat Res. 636(1-3):178-242.
Schijven, J. F., Teunis, P. F., Rutjes, S. A., Bouwknegt, M., & de Roda Husman, A. M. 2011. QMRAspot: a tool for quantitative microbial risk assessment from surface water to potable water. Water research, 45(17), 5564-5576.
Schijven, J., Rutjes, S., Smeets, P., & Teunis, P. 2014. QMRAspot: a tool for quantitative microbial risk assessment for drinking water: Manual QMRAspot version 2.0. RIVM report 2014-0020.
Smethurst, G., 1988, Basic Water treatment 2nd ed.Thomas Telford, London.
THL 2017. https://www.thl.fi/fi/web/ymparistoterveys/ymparistomyrkyt/tarkempaa-tietoa-ymparistomyrkyista/torjunta-aineet
US EPA 2017. Drinking Water Contaminant Human Health Effects Information. https://www.epa.gov/dwstandardsregulations/drinking-water-contaminant-human-health-effects-informationUS EPA 2017b. Integrated Risk Information System (IRIS), https://www.epa.gov/iris
Confidential Page 53 of 53 15/12/2017
Wasserman G.A. ym. 2011. Arsenic and manganese exposure and children`s intellectual function. Neurotoxicology, 32:450-457.
Víctor-Ortega, MD., Ratnaweera, HC 2017: Double filtration as an effective system for removal of arsenate and arsenite from drinking water through reverse osmosis. Process Safety and Environmental Protection 111: 399–408.
Vinceti M, Crespi CM, Bonvicini F, Malagoli C, Ferrante M, Marmiroli S, Stranges S. 2013: The need for a reassessment of the safe upper limit of selenium in drinking water. Sci Total Environ 443:633-42.
Vinceti M, Ballotari P, Steinmaus C, Malagoli C, Luberto F, Malavolti M, Giorgi Rossi P.2016: Long-term mortality patterns in a residential cohort exposed to inorganic selenium in drinking water. Environ Res.150:348-56
WHO 2001. Arsenic in drinking-water. Geneva, World Health Organization (WHO Fact Sheet No. 210; http://www.who.int/mediacentre/factsheets/fs210/en/print.html).
WHO 2003. Chlorine in Drinking-water Background document for development of WHO Guidelines for Drinking-water Quality.WHO 2005. Water Safety Plans: Managing drinking-water quality from catchment to consumer http://www.who.int/water_sanitation_health/dwq/wsp170805.pdf accessed in 7.11.2016.
WHO 2008. Guidelines for drinking-water quality, 3rd edition incorporating 1st and 2nd addenda. Vol. 1. Recommendations. Geneva, World Health Organization, pp. 306–308b (http://www.who.int/water_sanitation_health/dwq/GDW12rev1and2.pdf).
WHO 2011a. Guidelines for Drinking water quality. Fourth edition. World Health Organization, Geneva. http://apps.who.int/iris/bitstream/10665/44584/1/9789241548151_eng.pdf
WHO 2011b. Nitrate and nitrite in drinking-water Background document for development of WHO Guidelines for Drinking-water. Accessed 1-12-2016: Qualityhttp://www.who.int/water_sanitation_health/dwq/chemicals/nitratenitrite2ndadd.pdf
WHO 2011c. Water Safety Plans Managing drinking-water quality from catchment to consumer http://www.who.int/water_sanitation_health/dwq/wsp170805.pdf
WHO. 2016. Quantitative Microbial Risk Assessment: Application for Water Safety Management. Geneva, Switzerland. http://www.who.int/water_sanitation_health/publications/qmra/en/
WHO 2017. Principles and practices of drinking-water chlorination: a guide to strengthening chlorination practices in small-to medium sized water supplies. World Health Organization, Regional Office for South-East Asia. http://apps.who.int/iris/handle/10665/255145