Embed Size (px)
Citation preview
CITYkeys
Co-funded by the European Commission within the H2020 Programme. Grant Agreement no: 646440. 2015-02-01…2017-01-31 (24 months).
Dissemination level PU Public X PP Restricted to other programme participants (including the Commission Services) RE Restricted to a group specified by the consortium (including the Commission Services) CO Confidential, only for members of the consortium (including the Commission Services)
Deliverable 1.2 Overview of the Current State of the Art
Revision ........................................ 4 Preparation date ........................... 2015-10-28 Due date ....................................... 2015-08-31 (m7) Lead contractor ............................. AIT
Authors: Hans-Martin Neumann .................. AIT Daiva Jakutyte-Walangitang ......... AIT Stefan Vielguth ............................. AIT Johann Züger................................ AIT Miimu Airaksinen .......................... VTT Aapo Huovila ................................ VTT Peter Bosch .................................. TNO Vera Rovers .................................. TNO Sophie Jongeneel ......................... TNO Eva Pangerl .................................. VIE
CITYkeys ● D1.2 Overview of the Current State of the Art Page 2 of 56
2015-10-28
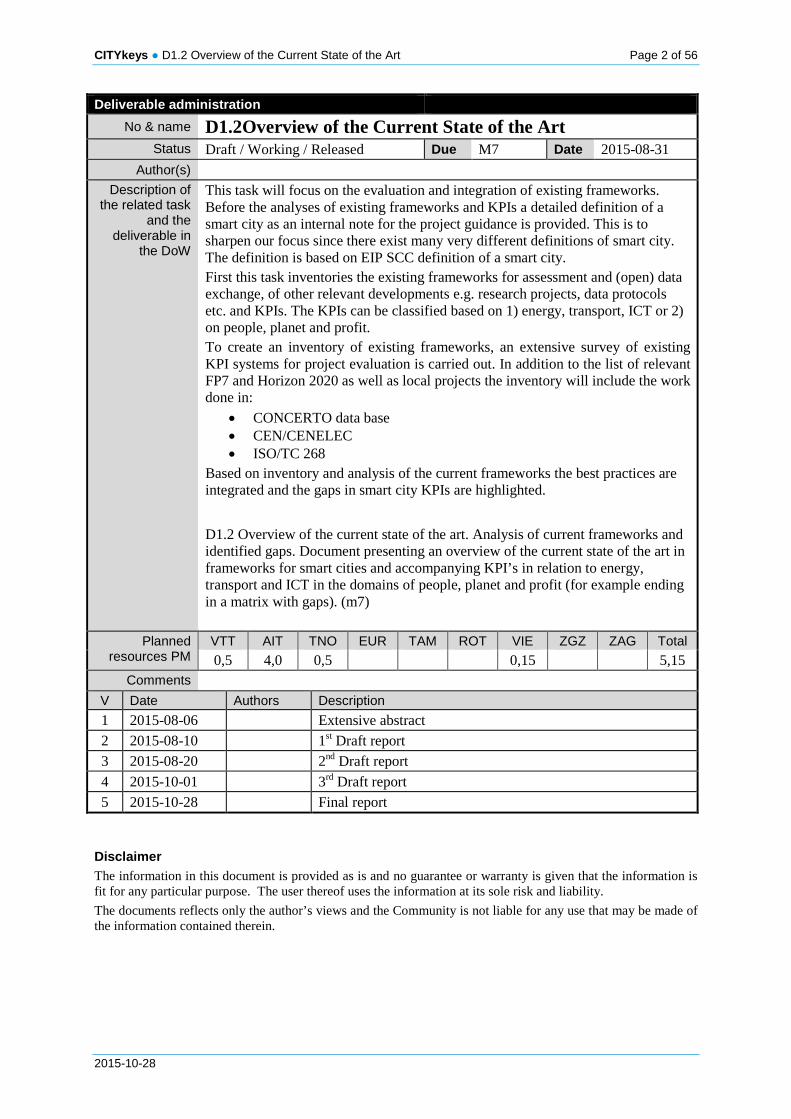
Deliverable administration No & name D1.2Overview of the Current State of the Art
Status Draft / Working / Released Due M7 Date 2015-08-31 Author(s)
Description of the related task
and the deliverable in
the DoW
This task will focus on the evaluation and integration of existing frameworks. Before the analyses of existing frameworks and KPIs a detailed definition of a smart city as an internal note for the project guidance is provided. This is to sharpen our focus since there exist many very different definitions of smart city. The definition is based on EIP SCC definition of a smart city. First this task inventories the existing frameworks for assessment and (open) data exchange, of other relevant developments e.g. research projects, data protocols etc. and KPIs. The KPIs can be classified based on 1) energy, transport, ICT or 2) on people, planet and profit. To create an inventory of existing frameworks, an extensive survey of existing KPI systems for project evaluation is carried out. In addition to the list of relevant FP7 and Horizon 2020 as well as local projects the inventory will include the work done in:
• CONCERTO data base • CEN/CENELEC • ISO/TC 268
Based on inventory and analysis of the current frameworks the best practices are integrated and the gaps in smart city KPIs are highlighted.
D1.2 Overview of the current state of the art. Analysis of current frameworks and identified gaps. Document presenting an overview of the current state of the art in frameworks for smart cities and accompanying KPI’s in relation to energy, transport and ICT in the domains of people, planet and profit (for example ending in a matrix with gaps). (m7)
Planned resources PM
VTT AIT TNO EUR TAM ROT VIE ZGZ ZAG Total 0,5 4,0 0,5 0,15 5,15
Comments V Date Authors Description 1 2015-08-06 Extensive abstract 2 2015-08-10 1st Draft report 3 2015-08-20 2nd Draft report 4 2015-10-01 3rd Draft report 5 2015-10-28 Final report
Disclaimer The information in this document is provided as is and no guarantee or warranty is given that the information is fit for any particular purpose. The user thereof uses the information at its sole risk and liability. The documents reflects only the author’s views and the Community is not liable for any use that may be made of the information contained therein.

CITYkeys ● D1.2 Overview of the Current State of the Art Page 3 of 56
2015-10-28
Table of contents
1. Publishable executive summary .......................................................................... 6
2. Introduction ............................................................................................................ 7 2.1 Purpose and target group ........................................................................................ 7 2.2 Contributions of partners ......................................................................................... 8 2.3 Baseline .................................................................................................................. 8 2.4 Relations to other activities ...................................................................................... 8 2.5 Overall approach ..................................................................................................... 9
3. Smart City: Definition and Understanding ........................................................ 10 3.1 Currently used definitions ...................................................................................... 10
3.1.1 International definitions ............................................................................................ 10 3.1.2 European definitions ................................................................................................ 11 3.1.3 The definitions of Smart City by cities ...................................................................... 12
3.2 CITYkeys working definitions ................................................................................. 16
4. Scientific basis .................................................................................................... 17 4.1 Triple Bottom Line ................................................................................................. 17 4.2 DPSIR ................................................................................................................... 18 4.3 Indicator frameworks for reporting on sustainability/CSR ....................................... 18 4.4 Triple Helix ............................................................................................................ 20 4.5 City Anatomy ......................................................................................................... 20 4.6 Non-theory driven frameworks ............................................................................... 21
5. Analysis and Evaluation of Relevant Frameworks ........................................... 22 5.1 Scope .................................................................................................................... 22
5.1.1 European Frameworks ............................................................................................. 22 5.1.2 International and European Standards .................................................................... 23 5.1.3 Neighbourhood Certification Schemes .................................................................... 24 5.1.4 Relevant FP7 and H2020 Projects .......................................................................... 25 5.1.5 Selected Country Frameworks................................................................................. 27 5.1.6 Other International Frameworks .............................................................................. 27
5.2 Database development .......................................................................................... 28 5.3 Data analysis and classification ............................................................................. 28
5.3.1 Types of frameworks ................................................................................................ 28 5.3.2 Themes .................................................................................................................... 31 5.3.3 End users ................................................................................................................. 32
6. CITYkeys Evaluation Framework ....................................................................... 33 6.1 Main Structure of the Framework .......................................................................... 33 6.2 Subthemes of the Framework ................................................................................ 34
6.2.1 Evaluation of subthemes at city level ....................................................................... 34 6.2.2 Evaluation of the subthemes at project level ........................................................... 35 6.2.3 Preliminary selection of subthemes ......................................................................... 36
6.3 Definitions ............................................................................................................. 37 6.3.1 People ...................................................................................................................... 37 6.3.2 Planet ....................................................................................................................... 38 6.3.3 Prosperity ................................................................................................................. 38 6.3.4 Governance ............................................................................................................. 39 6.3.5 Propagation .............................................................................................................. 39

CITYkeys ● D1.2 Overview of the Current State of the Art Page 4 of 56
2015-10-28
7. Gap Analysis ........................................................................................................ 40 7.1 Method .................................................................................................................. 40 7.2 Identified Gaps ...................................................................................................... 40
7.2.1 City indicators .......................................................................................................... 40 7.2.2 Project indicators ..................................................................................................... 47
8. Conclusions ......................................................................................................... 52 8.1 Summary of achievements .................................................................................... 52 8.2 Next steps in T1.3 ................................................................................................. 53
9. Literature .............................................................................................................. 54
10. Appendices ........................................................................................................ 56
CITYkeys ● D1.2 Overview of the Current State of the Art Page 5 of 56
2015-10-28
List of Figures Figure 1: SIP SCC – Overarching goals and enabling factors..............................................12
Figure 2: Number of mentions in cities' definitions ...............................................................15
Figure 3: The Triple Bottom Line .........................................................................................17
Figure 4: The DPSIR Framework consists of Drivers, Pressures, States, Impacts and Responses ...........................................................................................................18
Figure 5: Mapping of City- and project related frameworks ..................................................29
Figure 6: End user groups ...................................................................................................32
Figure 7: CITYkeys principles ..............................................................................................34
Figure 8 Preliminary structure of the CITYkeys framework .................................................37
Figure 9: City indicators in existing frameworks by themes. ................................................40
Figure 10 City indicators in existing frameworks by categories ............................................41
Figure 11: City indicators in existing frameworks by subthemes. ..........................................42
Figure 12: Project indicators of existing frameworks by themes ............................................47
Figure 13 Project indicators by existing frameworks by categories ......................................47
Figure 14 Project indicators by subthemes ..........................................................................48 List of Tables Table 1: European Initiatives ..............................................................................................23
Table 2: International and European Standards..................................................................24
Table 3: Neighborhood certification scheme .......................................................................24
Table 4: Relevant FP7 and H2020 projects ........................................................................26
Table 5: Relevant Initiatives from Austria, Finland, the Netherlands, Switzerland and the UK ...........................................................................................................27
Table 6: Other relevant indicator frameworks .....................................................................28
Table 7 Comparison between themes included in the analysed frameworks and the themes of the CITYkeys framework ...................................................................................31
Table 8: Number of city indicators by categories ................................................................41
Table 9: City indicators by themes and subthemes .............................................................46
Table 10: Number of project indicators by themes ................................................................48
Table 11: Project indicators by themes and subthemes ........................................................51
CITYkeys ● D1.2 Overview of the Current State of the Art Page 6 of 56
2015-10-28
1. PUBLISHABLE EXECUTIVE SUMMARY This report summarizes the outcomes of T1.2 “Evaluation and integration of existing frameworks1 and gaps to smart city requirements”. T1.2 has focused on the evaluation and integration of existing frameworks.
Before the analysis of existing frameworks and KPIs, a detailed definition of a smart city as an internal note for the project guidance is provided. This is to sharpen our focus since there are many different definitions of the smart city.
T1.2 conducts an inventory of the existing frameworks for assessment, e.g. of research projects, of data sets and related protocols etc. and the derived KPIs. The KPIs are classified based on 1) energy, transport, ICT (i.e. sectors) addressing technological dimensions and on 2) people, planet, profit, addressing the sustainability as well as social inclusion dimensions.
To create an inventory of existing frameworks, an extensive survey of existing KPI systems for project evaluation is carried out. The inventory includes relevant H2020 and FP7projects, as well as relevant projects from the countries of the three research organizations involved: Finland, the Netherlands and Austria. In addition, the given report summarizes the status of relevant initiatives currently under development, like the smart city framework of CEN/CENELEC and the Smart City Information System.
Based on the inventory and the analysis of the current frameworks, the gaps in smart city KPIs are highlighted.
In general terms, the analysed frameworks convey the impression that the status quo regarding the availability of the Key Performance Indicators is fairly saturated. Numerous indicators exist and have been used across different sectors in cities and districts in Europe as well as globally. Nevertheless, the following gaps in terms of indicator availability were identified:
For city indicators:
• Multilevel governance For project indicators:
• Education • Employment • Scalability • Replicability
1 The definition of framework in our context of this report is to be understood as a set of indicators which is used
in real life for monitoring of performance by cities and others.
CITYkeys ● D1.2 Overview of the Current State of the Art Page 7 of 56
2015-10-28
2. INTRODUCTION
2.1 Purpose and target group CITYkeys aims to accelerate the transition towards low carbon, resource-efficient cities by facilitating and enabling stakeholders in smart city projects and cities to learn from each other, create trust in solutions, and monitor progress, by means of a common performance measurement framework.
The general goal is to support the wide-scale deployment of smart city solutions and services in order to create impact on major societal challenges related to urban development and the Union's 20/20/20 energy and climate targets.
The main expected result of CITYkeys shall be a validated, holistic performance measurement framework for monitoring smart city performance and comparing the implementation of Smart City solutions. To achieve that goal this report documents existing smart and sustainable city KPIs and associated performance evaluation frameworks, analyses, evaluates and integrates those and finally identifies gaps with regard to the needs identified in D1.1.
As a starting point for the evaluation and integration of existing frameworks this task uses the traditional sustainability categories People, Profit and Planet. We will show that many smart city definitions and frameworks make reference to these three dimensions of sustainability. Other frameworks are structured by sectors (e.g energy, transport, ICT) which is also taken into account in the analysis of this task.
The transparent and flexible CITYkeys performance measurement framework will be able to handle cities in different smart city transformation stages and different city scales and thereby supporting different smart cities development strategies and initiatives over a wide range of characteristics. The main assessment purposes are the evaluation of smart city and smart city project performances. The scope of smart city projects is very wide, ranging from improved governance and improved living conditions to stimulating the local economy and conserving the environment. Therefore, the CITYkeys performance measurement framework will also include specific smart city KPIs that go beyond the traditional division into categories.
The main users of the CITYkeys framework are cities, but the needs of smart city solution providers and other industrial stakeholders shall be addressed as well. Cities shall benefit from the outcomes of the CITYkeys project by a means to support their strategic planning and implementation of measures contributing to achievement of smart city goals. Additional benefits are created through the enhanced collaboration within and between cities providing the possibility to compare solutions and find best practices. Solution providers will benefit from better insight into business opportunities and potential replication of existing solutions in a different city or context. Industrial stakeholders will benefit from access to the open data and information, also serving as potential recommendations for the needed new business. Smart city indicators can also provide opportunities for companies to market their smart solutions or for branding their Corporate Social Responsibility. These will bring environmental benefits such as reduction of CO2 emissions, increased energy efficiency, increased share of renewables, as well as improved quality of life, through better mobility services, better communication between local authorities and their citizens, and empowerment of citizens (i.e. smart citizens). This report summarizes the outcomes of T1.2 ”Evaluation and integration of existing frameworks and gaps to smart city requirements”. The report mainly informs the CITYkeys

CITYkeys ● D1.2 Overview of the Current State of the Art Page 8 of 56
2015-10-28
Task 1.3 which develops the indicator-based CITYkeys smart city performance measurement system. The results are, however, also of wider interest for cities, researchers and companies who want to have an overview of the state-of-the-art on existing smart city performance assessment systems and KPIs suiting different needs and contexts.
2.2 Contributions of partners This report was produced by the project partners contributing to T1.2:
• AIT (Task Leader) • VTT • TNO • City of Vienna (VIE)
As task leader AIT defined the structure of the report, provided content, compiled content provided by the partners and took care of the editing. The AIT team mapped 19 smart city frameworks with associated indicators and created a database to store and analyse the indicators. VTT mapped 7 frameworks, conducted a review of the given report and commented on the different drafts of the report as well as contributed to chapters 2, 3 and 4. TNO mapped 14 frameworks, conducted a review of the given report and commented on the different drafts of it as well as contributed to chapters 3, 4, 5 and 8. VIE mapped 3 frameworks and contributed to chapter 3. Based on the mapping of the frameworks, all partners involved worked iteratively on the integration of the frameworks and development of the CITYkeys framework structure. The entire project consortium worked jointly on the CITYkeys smart city and smart city project definitions.
2.3 Baseline Several indicator frameworks for the performance measurement of urban systems have already been developed within projects funded by the European Framework programs FP6, FP7, and H2020, as well as part of other European initiatives, such as the Covenant of Mayors, the Reference Framework for Sustainable Cities, or the Green Digital Charter. Also, several standardization bodies, such as ITU, ISO and CEN/CENELEC, are working on the topic of smart city KPIs. However, there is no European Framework so far, that fully addresses the topic of smart cities, as described in the Strategic Implementation Plan and the Operational Implementation Plan on Smart Cities and Communities.
Within this, T1.2 looks for the potential contributions that the existing European and international Frameworks can make to an integrated performance measurement framework. An extensive survey of existing KPI systems for project and city evaluation is carried out. Based on the inventory and the analysis of the current frameworks the gaps in smart city KPIs are highlighted.
2.4 Relations to other activities T1.2 relates to other tasks of WP1, on the input as well as on the output side:
• T1.2 takes into account the results of the survey on cities carried out in T1.1 “Requirements of cities / citizens”.
• T1.2 also analyses the state of the art of performance measurement; For this, a large number of already existing indicator frameworks and their related indicators are mapped and analysed.

CITYkeys ● D1.2 Overview of the Current State of the Art Page 9 of 56
2015-10-28
• All indicators of the frameworks mapped in T1.2 are stored in a database. From this database, the indicators of the CITYkeys framework will be selected in T1.3 “Smart City KPIs”.
• The selection of these indicators will be based on the definitions of a Smart City and of Smart City Projects developed in T1.2.
CITYkeys deliverable D1.1 identified the needs of cities and citizens for smart city performance measurement. The aim of this report is to analyze and evaluate existing smart city KPIs, integrate existing smart city frameworks and identify gaps with regard to the identified needs. The following task T1.3 will then compare cities’/citizens’ needs identified in D1.1 with the state-of-the-art of existing smart city KPI frameworks analysed in D1.2 and thereby develop the missing indicators and ultimately the CITYkeys performance measurement framework.
2.5 Overall approach This section summarizes the approach and methods selected with the goal the give a condensed overview on the current state of the art regarding city and project indicators.
The approach was done as follows:
1. Studying of smart city definitions 2. Studying indicator typologies and frameworks 3. Data collection about indicator systems and indicators on city and project level (see
also 2.3 Baseline) 4. Grouping of indicators of these systems under chosen themes and assessment of the
frequency of occurrence 5. Interviewing of representatives of cities to understand the importance of the themes
(input from D1.1) 6. Combination of the information/results done in point 4 and 5 and analyzing of the
gaps 7. Selection of preliminary subthemes for CityKeys based on the results done in point 6
and creation of the definition for these themes
A database was developed, for the purpose of collecting, grouping and analyzing the existing frameworks and indicators. This database makes it possible to do a systematic analysis of indicators and systems (see chapter 4, section 5.2).

CITYkeys ● D1.2 Overview of the Current State of the Art Page 10 of 56
2015-10-28
3. SMART CITY: DEFINITION AND UNDERSTANDING
3.1 Currently used definitions Despite of the wide literature on practical and philosophical characteristics of the smart city concept, no common and agreed understanding exists yet. There is a wide variety of different definitions available. Their focus depends on the stakeholder perspective, geographical aspects and other factors.
The two extremes of the different definitions are, on one end of the spectrum, the ICT and technology oriented definitions, and, on the other end, people oriented definitions (which highlight bottom-up initiatives, citizen engagement, co-creative approaches etc.).
Many smart city definitions do not only explain the term “Smart City” itself, but also specify the goals of smart city development, or describe topics (e.g. infrastructures, information, citizen involvement), that are to be addressed by smart city development.
In essence, the broad variety of goals, which smart cities aim to achieve, could be summarised as follows: the provision of better and/or more efficient services (using smart means and technologies) in order to tackle the environmental, economic and/or social challenges of cities.
3.1.1 International definitions The term Smart City has a number of precursors. “Smart growth” was already a frequently used term in 1992, first stated by the United Nation in context of the adopted Agenda 21 programme at the UN Conference on Environment and Development. Furthermore it was used in 1997 within the “Growing Smart Legislative Guidebook”, a regulatory framework, written by the American Planning Association (Ryser 2014, p. 11).
“Smart communities”, which might be the origin of the Smart City idea, first appeared in 1997 in California. The World Foundation of Smart Communities (WFSC) was founded at the International Center of Communications and defined a “smart community as ‘a community that has made a conscious effort to use information technology to transform life and work within its region in significant and fundamental rather than incremental ways. The goal of such an effort is more than the mere deployment of technology. Rather it is about preparing one’s community to meet the challenges of a global, knowledge economy.” (WFSC, cited in Ryer 2014, p. 11).
Smart communities were also mentioned in 1997 in the Global Forum “in its tri-partite events bringing together industry, regulators and users in the field of telecommunications.” (Ryser 2014, p. 11).
In the new millennium, “smart” has become more common and widely used in the ICT technology with respect to usability within the EU. While it has been primarily used to describe the integration of ICT into communities, European definitions often chose a wider scope when defining the term Smart City.
An early and still well-known European smart city characterization is that Vienna University of Technology’s study (Giffinger et al., 2007) “Smart cities: ranking of European medium-sized cities”. It presents a model of a smart city with the following components: smart economy, smart environment, smart governance, smart living, smart mobility and smart people.
CITYkeys ● D1.2 Overview of the Current State of the Art Page 11 of 56
2015-10-28
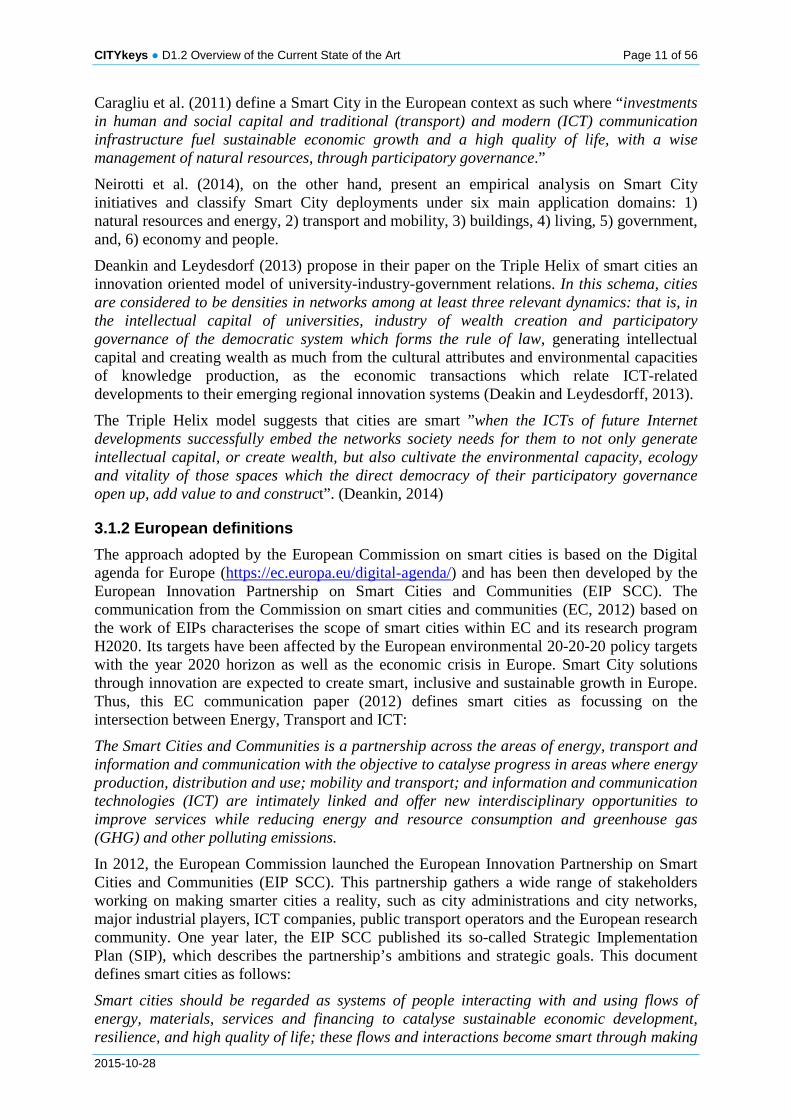
Caragliu et al. (2011) define a Smart City in the European context as such where “investments in human and social capital and traditional (transport) and modern (ICT) communication infrastructure fuel sustainable economic growth and a high quality of life, with a wise management of natural resources, through participatory governance.”
Neirotti et al. (2014), on the other hand, present an empirical analysis on Smart City initiatives and classify Smart City deployments under six main application domains: 1) natural resources and energy, 2) transport and mobility, 3) buildings, 4) living, 5) government, and, 6) economy and people.
Deankin and Leydesdorf (2013) propose in their paper on the Triple Helix of smart cities an innovation oriented model of university-industry-government relations. In this schema, cities are considered to be densities in networks among at least three relevant dynamics: that is, in the intellectual capital of universities, industry of wealth creation and participatory governance of the democratic system which forms the rule of law, generating intellectual capital and creating wealth as much from the cultural attributes and environmental capacities of knowledge production, as the economic transactions which relate ICT-related developments to their emerging regional innovation systems (Deakin and Leydesdorff, 2013).
The Triple Helix model suggests that cities are smart ”when the ICTs of future Internet developments successfully embed the networks society needs for them to not only generate intellectual capital, or create wealth, but also cultivate the environmental capacity, ecology and vitality of those spaces which the direct democracy of their participatory governance open up, add value to and construct”. (Deankin, 2014)
3.1.2 European definitions The approach adopted by the European Commission on smart cities is based on the Digital agenda for Europe (https://ec.europa.eu/digital-agenda/) and has been then developed by the European Innovation Partnership on Smart Cities and Communities (EIP SCC). The communication from the Commission on smart cities and communities (EC, 2012) based on the work of EIPs characterises the scope of smart cities within EC and its research program H2020. Its targets have been affected by the European environmental 20-20-20 policy targets with the year 2020 horizon as well as the economic crisis in Europe. Smart City solutions through innovation are expected to create smart, inclusive and sustainable growth in Europe. Thus, this EC communication paper (2012) defines smart cities as focussing on the intersection between Energy, Transport and ICT:
The Smart Cities and Communities is a partnership across the areas of energy, transport and information and communication with the objective to catalyse progress in areas where energy production, distribution and use; mobility and transport; and information and communication technologies (ICT) are intimately linked and offer new interdisciplinary opportunities to improve services while reducing energy and resource consumption and greenhouse gas (GHG) and other polluting emissions. In 2012, the European Commission launched the European Innovation Partnership on Smart Cities and Communities (EIP SCC). This partnership gathers a wide range of stakeholders working on making smarter cities a reality, such as city administrations and city networks, major industrial players, ICT companies, public transport operators and the European research community. One year later, the EIP SCC published its so-called Strategic Implementation Plan (SIP), which describes the partnership’s ambitions and strategic goals. This document defines smart cities as follows:
Smart cities should be regarded as systems of people interacting with and using flows of energy, materials, services and financing to catalyse sustainable economic development, resilience, and high quality of life; these flows and interactions become smart through making

CITYkeys ● D1.2 Overview of the Current State of the Art Page 12 of 56
2015-10-28
strategic use of information and communication infrastructure and services in a process of transparent urban planning and management that is responsive to the social and economic needs of society. (European Innovation Partnership on Smart Cities and Communities 2013, S. 5)
The definition comprises several elements: It describes the smart city as system of systems, defines sustainable economic development, resilience and a high quality of life as overarching goals for the development of smart cities, and identifies information and communication infrastructure and transparent urban planning and management as enabling factors. Obviously, the three overarching goals (high quality of life, sustainable economic development, resilience,) are very similar to the triple bottom line of sustainable development (people, profit, planet).
Figure 1: SIP SCC – Overarching goals and enabling factors
The EIP SCC has also developed an Operational Implementation Plan (EIP SCC, 2014), which characterizes the following priority areas: 1) Sustainable urban mobility, 2) Districts and built environment, 3) Integrated infrastructures, 4) Citizen focus, 5) Policy and regulation, 6) Integrated planning and management, 7) Knowledge sharing, 8) Baselines, performance indicators and metrics, 9) Open data, 10) Standards, and, 11) Business models, finance and procurement.
3.1.3 The definitions of Smart City by cities Many cities have developed their own working definitions of a Smart City. CITYkeys Deliverable 1.1 provides an overview of these working definitions used by cities which are project partners or supporters of the CITYKEYS project. Among 19 cities who participated in the survey in T1.1, 14 cities provided at least a working definition (Kontinakis 2015). The following list provides some examples:
Amsterdam states: “A city is smart when investments in capital and communication infrastructure fuel sustainable economic growth and a high quality of life, in combination with an efficient use of natural resources. A smart city is a city where social and technological infrastructures and solutions will improve the quality of life.”
Barcelona, argued that their city’s Mantra would describe the term “Smart City” most accurately: “To become a city of productive neighbourhoods, at human speed, interconnected, eco-efficient, re-naturalized, energetically self-sufficient and regenerated at zero emissions, inside a high-speed interconnected Metropolitan Area”
CITYkeys ● D1.2 Overview of the Current State of the Art Page 13 of 56
2015-10-28
Burgas defines the Smart City as “Using/employing ICT to facilitate performance and well-being enhancement, costs reduction, resources optimisation, minimising inefficiencies and maximizing synergies to add value to public sectors and citizens.”
Heraklion uses the Smart City definition of the before mentioned study “Smart cities: ranking of European medium-sized cities” (Giffinger et al., 2007), with its components smart economy, smart environment, smart governance, smart living, smart mobility and smart people. According to the definition of Heraklion, a Smart City has adopted at least one of the above initiatives.
Manchester states, that “a Smart City should enable every citizen to engage with all the services on offer, public as well as private, in a way best suited to his or her needs. It brings together hard infrastructure, social capital including local skills and community institutions, and (digital) technologies to fuel sustainable economic development and provide an attractive environment for all.”
Preston’s City council does not provide a shared definition of a Smart City, but acknowledges the need of "providing well run value for money services, demonstrating good governance, openness and transparency", and sets a vision for the city to "secure investment to improve assets, facilities and infrastructure; attracting high quality jobs, and promoting vibrant diverse city living"
Rzeszów has defined the term within the "Strategy of Rzeszów Brand and Programme for the Promotion of Rzeszów”: “Smart and usable solutions are attributes of modern cities. The city of Rzeszów is implementing and making use solutions in the area of ecology, which brands its position in line with the Capital of Innovation scheme. Undertaken actions should be continued, taking into account the dynamic profile of users’ needs. More clear, suggestive and efficient visibility of goals’ realization in materials promoting the brand is highly recommended.”
Siracusa names three key words: sharing, participation and accessibility. The attention lies on the “harmonisation of the potentialities of the city through the use of ICT tool and innovating the value of human capital in the process of City development”.
Tampere does not have an official definition of the term. The people involved in this topic do however share a common understanding on the city of the future, which was stated in the presentation “Intelligent construction in Tampere” by Kari Kankaala, Executive Director of the City of Tampere:
“The city of the future • enables innovative ways to build a city, • opens city operations so that they become a platform for expertise and different ways to
organise services, • operates with less energy and resource consumption, • produces continuously a smaller ecological footprint, and • operates through networks and looks openly for partnerships”. Terrassa has approved a strategic plan of Smart Cities. Within this plan, they implemented a diagnosis about their Smart City “level”. “This level depends of our ripeness over seven technological points of view or enablers: instrumentation and control, connectivity, interoperability, security, information management, technological resources and analytical systems.”
Thessaloníki describes the term Smart City as “a sustainable city for its citizens with the use of new, efficient and user-friendly technologies and services in the areas of energy, transport and ICT.”
CITYkeys ● D1.2 Overview of the Current State of the Art Page 14 of 56
2015-10-28
Utrecht does not have a shared definition and even states, that the term “Smart City” is not frequently used, aside from the objectives of the European Horizon 2020 Smart Cities and Communities program. However they do describe their understanding of the word “smart”: “In Utrecht ‘smart’ is increasingly interpreted as governance that uses open data, social media and ICT for service innovation based on public-private co-creation and community engagement, in order to better address societal challenges and meet citizens' needs. 'Smart' can be for example: • data-driven governance (open data, big data for policy support and community
engagement); • integral, cross-sectoral approaches to societal challenges and teams; • new coalitions / ecosystems for public-private co-creation of innovative products and
services; • new business models; • uptake of emerging tech, media and the related culture (IoT, social media, game-based
learning) to better address societal challenges. The above being applicable to virtually all societal challenges (employment, healthy urban living, participative democracy and social inclusion, efficient and effective public administrative services, safety and security, etc).”
Vienna defines the development of a city that assigns priority to, and interlinks, the issues of energy, mobility, buildings and infrastructure. In this, the following premises apply: “Radical resource preservation, development and productive use of innovations/new technologies, and a high and socially balanced quality of living. This is to safeguard the city’s ability to withstand future challenges in a comprehensive fashion. The elementary trait of Smart City Wien lies in the holistic approach pursued, which comprises novel mechanisms of action and co-ordination in politics and administration as well as a wider leeway of action assigned to citizens.” (Vienna City Administration 2014, 2)
Zagreb declares that its concept of Smart City “involves strategic planning, transparency and efficient management processes of the city which contributes to faster and better delivery of services / products oriented to the needs of citizens / clients. Creating an environment for innovation and creative industries, the implementation of the strategy of developing a competitive economy and knowledge-based economy, to create jobs, to improve the existing and development of new services / products, and faster growth and development of the city and the region.” As these examples show, the definitions are as diverse as they are broad, ranging from developing a competitive and knowledge-based economy (Zagreb) to efficient exploitation of natural energy sources (Rzeszów). However, there are goals and incentives, which are stated in a high number of definitions. Sustainability in its various forms is the most frequently mentioned topic, closely followed by the topics ICT, open government & governance, education & social capital, and innovation (see Figure 2

CITYkeys ● D1.2 Overview of the Current State of the Art Page 15 of 56
2015-10-28
Figure 2: Number of mentions in cities' definitions
Energy and resource efficiency is stated as one of the main goals of the majority of definitions, although wording and focus are diversified: e.g. resource efficiency, use of renewable resources and energy self-sufficiency. ICT and open government & governance are often mentioned in the same context, describing ICT as one way of enhancing and enabling open government as well as governance. Another application of ICT is stated in the Smart City definition of the city of Burgas addressing the facilitation of “performance and well-being enhancement”. Education and social capital includes an enhanced integration of technology and “modern faculties in high schools and universities” (Rzsezów), “attracting high quality jobs” (Preston) as well as the general term “smart people” (Heraklion), identical to the Smart City definition of the before mentioned study “Smart cities: ranking of European medium-sized cities” (Giffinger et al., 2007).
The general term innovation is used in two different ways: innovation, as an impulse for economy and development and necessity to reach the goal of becoming a smart city (eg. Vienna), and innovation in the context of building and producing innovative goods, which for instance Utrecht states as an example of the word “smart”.
Other mentioned key words are mobility & transport, other infrastructure (such as sewage treatment systems), user needs (ranging from the strategic planning to meet (Zagreb) and adapt to the “dynamic profile of users’ needs” (Rzeszów) to the user friendliness of new technologies (Thessaloníki)), economy (mainly in the context of enabling the development of a sustainable economy (eg. Amsterdam). Other addressed topics, which describe a Smart City, according to the given work definitions, are efficiency in general (including workflows, processes, etc.), the enhancement of quality of life, mostly named as one of the overall goals (often implied, but not specifically mentioned), as well as synergies and partnerships as a potential, which a city has to create and make use of in order to be a smart city.
012345678
Sustainability*
ICT
Open government &governance
Education & social capital
Innovation
Mobility & Transport
Other infrastructureUser needs
Economy
Efficiency**
Quality of life
Synergies & Partnerships
Number of mentions
* Resource efficiency, renewable energy,...

CITYkeys ● D1.2 Overview of the Current State of the Art Page 16 of 56
2015-10-28
Thus, a general definition of smart city cannot be extracted out of the given answers, since the scope of the definitions is too broad. However there are similarities and nuclei to be noted, the two central key words being sustainability and ICT.
3.2 CITYkeys working definitions As we have seen, there are significant differences in the Smart City understanding by cities in Europe. Therefore, the definition should start from the “essence” of the Smart City definitions, i.e. it should include those aspects on which many cities can agree. As we have discussed above, reducing the consumption of resources and associated greenhouse gas emissions, improving the quality of life in cities, stimulating innovation and sustainable economic growth are goals shared by the vast majority of Smart City initiatives. These common goals are related to the three basic dimensions of the triple bottom line of sustainability: people, planet and prosperity (sometimes also called “profit”). One of the many frameworks referencing these three basic dimensions (in a slightly modified) way is the SIP Smart Cities and Communities. The project consortium therefore decided to use these three basic dimensions as a starting point for the CITYkeys framework. Later in the process, “governance” and “propagation” were added as fourth and fifth dimensions, in alignment with suggestions that arrived from several partner cities.
As European cities differ significantly in size, economic performance, climatic conditions, governance and many other aspects, they start their Smart City development on different levels. Looking at the “smartness” from the end point of the development would certainly frustrate many cities that are working hard on making progress, but have unfavourable starting conditions. The project consortium therefore agreed that the CITYkeys framework should rather focus on measuring progress than on the describing the state of an urban system. Furthermore, it was agreed that the framework should focus on outcomes (i.e. improved performance of urban systems) than on output (i.e. the deployment of technologies), because Smart City technologies are means to an end: improving quality of life, reducing resource consumption and stimulating innovation leading to sustainable economic growth. Based on these considerations, the project consortium developed the following working definition of a Smart City:
“A Smart City is a city that • is improving the quality of life of its inhabitants [people] • is significantly reducing its resource consumption [planet] • is building an innovation-driven and green economy [prosperity] • and is fostering a well-developed local democracy [governance]”
As the CITYkeys framework shall be suitable for monitoring and comparing the implementation of Smart City Projects, also the term ”Smart City Project” has to be defined. Considering the diversity of Smart City definitions and goals, the project team developed a pragmatic and rather flexible working definition, enabling applications in many different contexts:
“A Smart City Project is a project that • has a significant impact in helping a city to become a Smart City • is an integrated project combining multiple sectors”
These working definitions were first presented in a teleconference on May 8th 2015. Updated versions were discussed in the project consortium in a consecutive telco on May 27th. and at the project meeting in Rotterdam on June 11th. Then, the working definitions were also presented to and discussed with the project advisory board. The working definition will be used in chapter 6 to develop a first draft of the CITYkeys evaluation framework. Still, the working definitions might be modified, amended or narrowed as the project progresses.

CITYkeys ● D1.2 Overview of the Current State of the Art Page 17 of 56
2015-10-28
4. SCIENTIFIC BASIS Several of the analyzed frameworks were derived from scientific models, such as the already mentioned Triple Bottom Line, the DPSIR framework, the Triple Helix or the City Anatomy. In this chapter, these underlying models are discussed, and the frameworks are classified according to these models, where possible.
The frameworks have been assessed within limited time and resources. Thus, some metadata about the frameworks was gathered, such as who is the intended end-user and whether there is a scientific theory behind it, but the main focus was on mapping the themes and indicators in the frameworks. Therefore we stress that just because the scientific theory behind the framework is not indicated, does not necessarily mean that there is none.
4.1 Triple Bottom Line The Triple Bottom Line is a well-known scientific model. It has been applied in a wide spectrum of contexts, ranging from national sustainability strategies to CSR frameworks. Of the 43 indicator frameworks analysed in CITYkeys, 3 are based on the Triple Bottom Line: EURBANLAB, the Smart City Planner, and ISO 37120.
The phrase “the triple bottom line” was first coined in 1994 by John Elkington. His argument was that companies should be preparing three different (and quite separate) bottom lines. One is the traditional measure of corporate profit—the “bottom line” of the profit and loss account. The second is the bottom line of a company's “people account”—a measure in some shape or form of how socially responsible an organisation has been throughout its operations. The third is the bottom line of the company's “planet” account—a measure of how environmentally responsible it has been. The triple bottom line (TBL) thus consists of three Ps: profit, people and planet. It aims to measure the financial, social and environmental performance of the corporation over a period of time. Only a company that produces a TBL is taking account of the full cost involved in doing business.
Figure 3: The Triple Bottom Line
(Source : http://www.examiner.com/images/blog/EXID41999/images/triple_bottom_line.jpg)
CITYkeys ● D1.2 Overview of the Current State of the Art Page 18 of 56
2015-10-28
In some sense the TBL is a particular manifestation of the balanced scorecard. Behind it lies the same fundamental principle: What you measure is what you get, because what you measure is what you are likely to pay attention to. Only when companies measure their social and environmental impact will we have socially and environmentally responsible organisations. (http://www.economist.com/node/14301663)
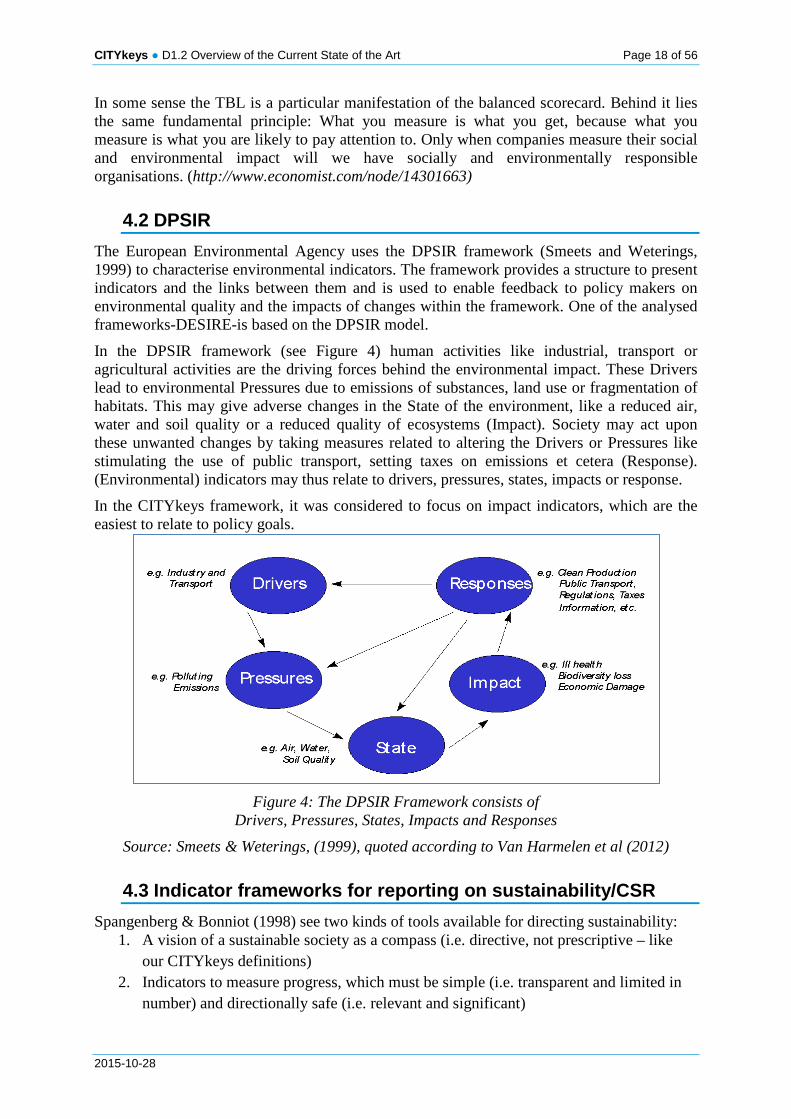
4.2 DPSIR The European Environmental Agency uses the DPSIR framework (Smeets and Weterings, 1999) to characterise environmental indicators. The framework provides a structure to present indicators and the links between them and is used to enable feedback to policy makers on environmental quality and the impacts of changes within the framework. One of the analysed frameworks-DESIRE-is based on the DPSIR model.
In the DPSIR framework (see Figure 4) human activities like industrial, transport or agricultural activities are the driving forces behind the environmental impact. These Drivers lead to environmental Pressures due to emissions of substances, land use or fragmentation of habitats. This may give adverse changes in the State of the environment, like a reduced air, water and soil quality or a reduced quality of ecosystems (Impact). Society may act upon these unwanted changes by taking measures related to altering the Drivers or Pressures like stimulating the use of public transport, setting taxes on emissions et cetera (Response). (Environmental) indicators may thus relate to drivers, pressures, states, impacts or response.
In the CITYkeys framework, it was considered to focus on impact indicators, which are the easiest to relate to policy goals.
Figure 4: The DPSIR Framework consists of Drivers, Pressures, States, Impacts and Responses
Source: Smeets & Weterings, (1999), quoted according to Van Harmelen et al (2012)
4.3 Indicator frameworks for reporting on sustainability/CSR Spangenberg & Bonniot (1998) see two kinds of tools available for directing sustainability:
1. A vision of a sustainable society as a compass (i.e. directive, not prescriptive – like our CITYkeys definitions)
2. Indicators to measure progress, which must be simple (i.e. transparent and limited in number) and directionally safe (i.e. relevant and significant)
CITYkeys ● D1.2 Overview of the Current State of the Art Page 19 of 56
2015-10-28
They address several questions regarding the indicator set in relation to the number of indicators and the goals of the evaluation.
Their recommendations include (among others) to focus on ex-ante measures for proactive policy, for which indicators need to match communicative and steering needs as well as academic criteria and have to be linked to policy targets. Therefore, a broader group of societal stakeholders needs to be involved. The goal is to develop indicators that help to identify policy options best suited to counteract some of the key driving forces towards non-sustainability.. Combined with economic and social targets and indicators, they could be developed into a holistic system of proactive sustainability indicators which target pressures instead of responses and puts measures into a policy perspective.
Summarizing, indicator systems should alert policy makers to priority issues; guide policy information; simplify and improve communication; and foster a common understanding of key trends (Spangenberg & Bonniot 1998).
O’Connor & Spangenberg (2008) have investigated the requirements for a CSR framework based on a multi-site case in the European aluminum sector, going into a ‘‘bottom-up/top-down’’ process with several layers to which it can be applied and stakeholder groups can be involved. It considers indicator development as a deeply social decision-making process for which a diversity of viewpoints must be brought together in order to furnish a comprehensive representation of the direct and indirect impacts, including several groups of stakeholders (internal and external). This dialogue process can do much more than merely achieve a selection of indicators and a signaling of the performance assessment associated with the chosen indicators. It creates an opportunity for exchange and debate between stakeholders who will learn about what matters to the others and why. The lessons that can be drawn from this case however, may very well apply to other multi-level indicator frameworks, including CITYkeys.
Four distinct and complementary sources of indicators were investigated: through a stakeholder process; indicators commonly used by related external parties; indicators used by the company for other reporting; and indicators used in other related locations.
The framework consists of four components: 1) Identification of performance and communication goals: define the full spectrum of sustainability concerns and of relevant stakeholder dialogue contexts; 2) Exploitation of a database: create or mobilize a relevant ‘‘data bank’’ which makes an inventory and provides a profile of candidate indicators; 3) Construction of an evaluation matrix: exploit a selection of the ‘‘candidate indicators’’ in a reporting process engaging stakeholder dialogue with a full spectrum of target stakeholder groups; and 4) A balanced multi-scale interface: harmonize or ‘‘optimize’’ lower levels of evaluation and reporting process in relation to higher-level coordination requirements and, as required, for comparisons.
A standard set (i.e. the CITYkeys framework)
It is suggested to first map issues that are common across all levels and groups (“generic” issues). Then, the usefulness of indicators at the different levels must be considered, to come to a standard set. This standard set has several purposes: it works as a bridge between ‘‘bottom-up’’ and ‘‘top-down’’ perspectives, allowing stakeholders at site-level (including company management) to see how their particular concerns are examples of categories of social responsibility addressed by the international community, and vice versa; it helps to build a common understanding within and between stakeholder groups, about reporting objectives; and it helps to achieve a consensus about appropriate indicators in each category of reporting.

CITYkeys ● D1.2 Overview of the Current State of the Art Page 20 of 56
2015-10-28
An integrated framework for reporting needs to be based on three main principles: 1) Recognition of level specificities: what are the social, geographical, technological (etc.) factors that can have a bearing on the range of sites at which a proposed indicator can meaningfully be applied? 2) Stakeholder diversity: reporting must include procedures for stakeholder dialogues that build up a shared understanding of the different stakeholders’ concerns, permitting an appropriate balance of level-specific as well as generic indicators. And 3) Full spectrum of performance issues: a common ground for stakeholder dialogues and for reporting at the different levels is assured through use of a standardized set of indicator categories based on sustainability considerations.
Emphasis was placed more on the reporting categories to be retained than on the individual indicator(s) that might be used. This is because level comparisons cannot always be based on using identical operational indicators, but they can be achieved in a meaningful way by assuring that the same set of discursively established issues or ‘‘categories’’ are addressed. Stakeholders in this study proposed limiting the indicator set (social and environmental) to not more than about 30. Evaluation involves comparisons but (for most people) loses quality, if the number of items being compared at the same level exceeds a small number. In this study, a framework is provided for assessing and mobilizing existing categories of information. Indeed a ‘‘First Best’’ situation can be imagined where a system of reporting is based very largely on existing information categories available in known external sources (local community, regulatory authorities, national or sector-wide statistics).
The database (i.e. the CITYkeys development of indicators)
The Indicator database profile for an indicator should start with a profile of the scientific status and quality of the indicator, e.g., sources of the information, units of measure, considerations of uncertainty, underlying hypotheses for measurement and interpretation. Since indicators are selected with reference to one or more specific performance issues, the indicator profiles should highlight the insight that each indicator is thought to offer on the relevant issues. The Indicator database profile should specify at what level(s) the indicator is considered to be pertinent (O’Connor & Spangenberg 2008).
4.4 Triple Helix The Triple Helix Model framework was written based on the idea of Etzkowitz (Etzkowitz & Zhou 2006). Its thesis “is that the potential for innovation and economic development in a Knowledge Society lies in a more prominent role of the university and in the hybridisation of elements from university, industry and government to generate new institutional and social formats for the production, transfer and application of knowledge.” (http://triplehelix.stanford.edu/3helix_concept). One of the analysed frameworks is based on the Triple Helix Model.
4.5 City Anatomy The so-called ”City Anatomy” was developed by the City Protocol Society and serves as the foundation for the activities of the society, such as building a collaborative platform and tools to support effective city governance, evaluation and transformation (City Protocol Society 2015).
The City Anatomy has three system elements: The physical structure (Structure), the people who live in it and occupy this physical space while carrying out functions (Society) and the Interactions through which the Society engages the Structure. The three system elements themselves contain several layers. In the case of the Structure, these layers are Environment, Infrastructures, and Built Domain. The Society consists of the layers Citizens and City
CITYkeys ● D1.2 Overview of the Current State of the Art Page 21 of 56
2015-10-28
Government. Interactions comprises the layers Urban Functions, Economy, Culture and the City Operation System. (City OS) (City Protocol Society).
The CITY Anatomy indicator framework is modelled after the above model, allowing benchmarking across cities collaborating with the City Protocol Society. Many of the indicators of the framework are identical with indicators used by ISO 37120.
4.6 Non-theory driven frameworks The majority of frameworks does apparently not have a scientific theory underlying their studies. Some of the frameworks do however base their indicator system on previous indicator frameworks or international standards such as ISO 37120.

CITYkeys ● D1.2 Overview of the Current State of the Art Page 22 of 56
2015-10-28
5. ANALYSIS AND EVALUATION OF RELEVANT FRAMEWORKS
Large varieties of indicator sets has already been developed and are being used for city benchmarking, for the monitoring of urban development processes, and for the evaluation of projects. In this chapter, 43 indicator sets from different sources potentially applicable for assessing Smart City projects and Smart Cities are analyzed, providing an overview over the current state of the art. The 43 indicator sets were selected according to certain criteria, which are described in chapter 5.1. In order to compare the sets of indicators along comparative criteria, a uniform screening template was used. All of the gathered information was imported into a PostgreSQL database, allowing to summarize or unite indicators in an efficient way, and to carry out statistical analyses. This methodology is described in chapter 5.2. Chapter 5.3 classifies the analyzed frameworks according to their goals, geographical scales, themes, end users and their theoretical foundation.
5.1 Scope Due to the limited time frame and resources, the analysis of existing sets of indicators had to be concentrated to a selection of the most relevant frameworks. The project consortium regards frameworks as ”most relevant” for the CITYkeys project if they fall in one of the following categories:
• European frameworks • International and European Standards • Neighborhood certification schemes • Relevant FP7 and H2020 projects • Selected country frameworks • Other international frameworks
Most of these categories are either mentioned in the project proposal or in the Strategic Implementation Plan on Smart Cities and Communities (EIP SCC).
5.1.1 European Frameworks The subcategory ”European Initiatives” includes several indicator frameworks developed to support city-related initiatives of the European Commission, such as the Covenant Mayors or the Green Digital Charter. With the noteworthy exceptions of the Reference Frameworks for Sustainable Cities and the European Green Capital Award, the initiatives are sectorial, i.e. they focus on selected aspects of urban development and city administration. The indicators of the Smart City Information System (SCIS) were not included in the database, as this framework is still being developed. Table 1 provides an overview of the European Frameworks analysed in this task.
Name of initiative Type of initiative Database entry
Other
Civitas European initiative yes Concerto European initiative yes Covenant of Mayors European initiative yes European Green Capital Award European initiative yes Green Digital Charter European initiative yes
CITYkeys ● D1.2 Overview of the Current State of the Art Page 23 of 56
2015-10-28
Reference Framework for Sustainable Cities
European initiative yes
Smart City Information System European initiative no The framework is in development; Indicators are not yet available.
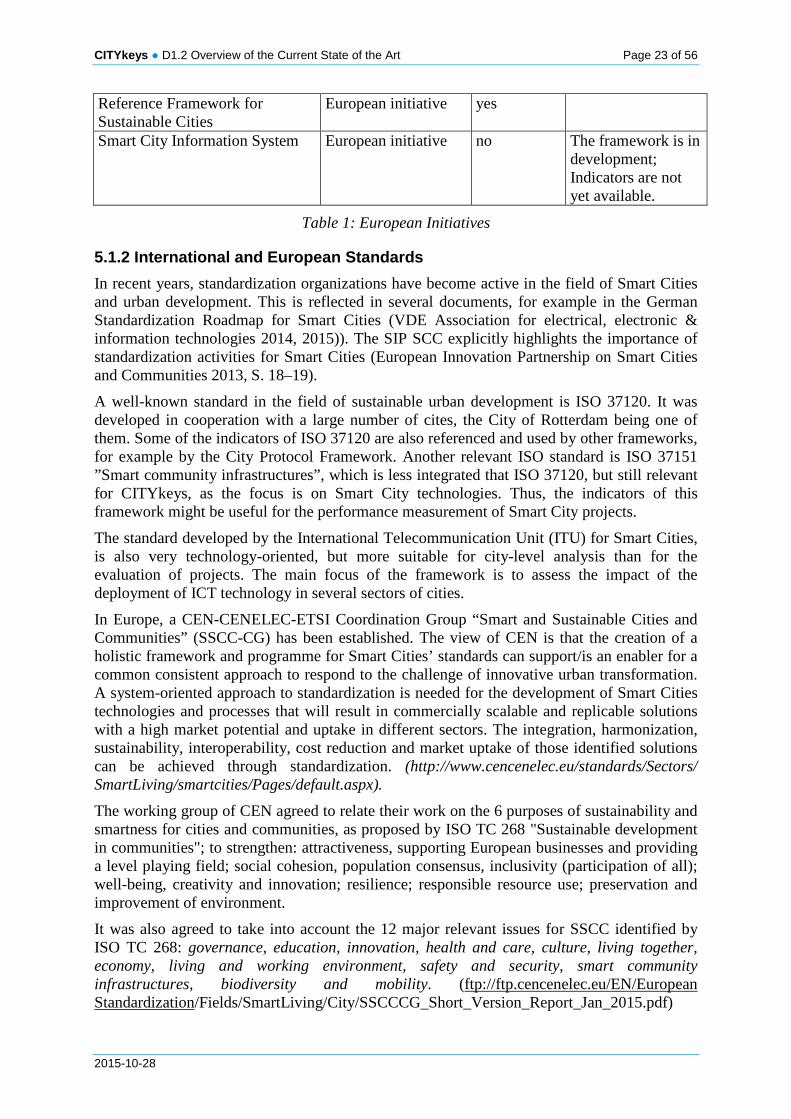
Table 1: European Initiatives
5.1.2 International and European Standards In recent years, standardization organizations have become active in the field of Smart Cities and urban development. This is reflected in several documents, for example in the German Standardization Roadmap for Smart Cities (VDE Association for electrical, electronic & information technologies 2014, 2015)). The SIP SCC explicitly highlights the importance of standardization activities for Smart Cities (European Innovation Partnership on Smart Cities and Communities 2013, S. 18–19).
A well-known standard in the field of sustainable urban development is ISO 37120. It was developed in cooperation with a large number of cites, the City of Rotterdam being one of them. Some of the indicators of ISO 37120 are also referenced and used by other frameworks, for example by the City Protocol Framework. Another relevant ISO standard is ISO 37151 ”Smart community infrastructures”, which is less integrated that ISO 37120, but still relevant for CITYkeys, as the focus is on Smart City technologies. Thus, the indicators of this framework might be useful for the performance measurement of Smart City projects.
The standard developed by the International Telecommunication Unit (ITU) for Smart Cities, is also very technology-oriented, but more suitable for city-level analysis than for the evaluation of projects. The main focus of the framework is to assess the impact of the deployment of ICT technology in several sectors of cities.
In Europe, a CEN-CENELEC-ETSI Coordination Group “Smart and Sustainable Cities and Communities” (SSCC-CG) has been established. The view of CEN is that the creation of a holistic framework and programme for Smart Cities’ standards can support/is an enabler for a common consistent approach to respond to the challenge of innovative urban transformation. A system-oriented approach to standardization is needed for the development of Smart Cities technologies and processes that will result in commercially scalable and replicable solutions with a high market potential and uptake in different sectors. The integration, harmonization, sustainability, interoperability, cost reduction and market uptake of those identified solutions can be achieved through standardization. (http://www.cencenelec.eu/standards/Sectors/ SmartLiving/smartcities/Pages/default.aspx). The working group of CEN agreed to relate their work on the 6 purposes of sustainability and smartness for cities and communities, as proposed by ISO TC 268 "Sustainable development in communities"; to strengthen: attractiveness, supporting European businesses and providing a level playing field; social cohesion, population consensus, inclusivity (participation of all); well-being, creativity and innovation; resilience; responsible resource use; preservation and improvement of environment. It was also agreed to take into account the 12 major relevant issues for SSCC identified by ISO TC 268: governance, education, innovation, health and care, culture, living together, economy, living and working environment, safety and security, smart community infrastructures, biodiversity and mobility. (ftp://ftp.cencenelec.eu/EN/European Standardization/Fields/SmartLiving/City/SSCCCG_Short_Version_Report_Jan_2015.pdf)
CITYkeys ● D1.2 Overview of the Current State of the Art Page 24 of 56
2015-10-28
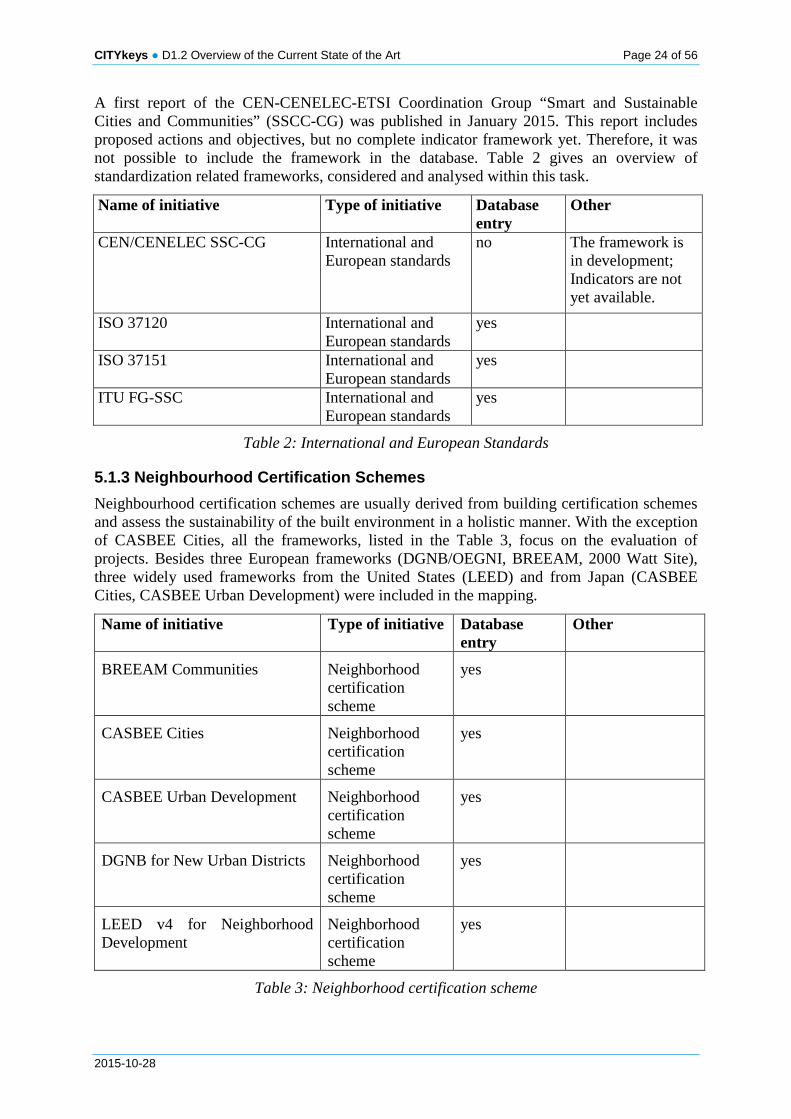
A first report of the CEN-CENELEC-ETSI Coordination Group “Smart and Sustainable Cities and Communities” (SSCC-CG) was published in January 2015. This report includes proposed actions and objectives, but no complete indicator framework yet. Therefore, it was not possible to include the framework in the database. Table 2 gives an overview of standardization related frameworks, considered and analysed within this task.
Name of initiative Type of initiative Database entry
Other
CEN/CENELEC SSC-CG International and European standards
no The framework is in development; Indicators are not yet available.
ISO 37120 International and European standards
yes
ISO 37151 International and European standards
yes
ITU FG-SSC International and European standards
yes
Table 2: International and European Standards
5.1.3 Neighbourhood Certification Schemes Neighbourhood certification schemes are usually derived from building certification schemes and assess the sustainability of the built environment in a holistic manner. With the exception of CASBEE Cities, all the frameworks, listed in the Table 3, focus on the evaluation of projects. Besides three European frameworks (DGNB/OEGNI, BREEAM, 2000 Watt Site), three widely used frameworks from the United States (LEED) and from Japan (CASBEE Cities, CASBEE Urban Development) were included in the mapping.
Name of initiative Type of initiative Database entry
Other
BREEAM Communities Neighborhood certification scheme
yes
CASBEE Cities Neighborhood certification scheme
yes
CASBEE Urban Development Neighborhood certification scheme
yes
DGNB for New Urban Districts Neighborhood certification scheme
yes
LEED v4 for Neighborhood Development
Neighborhood certification scheme
yes
Table 3: Neighborhood certification scheme
CITYkeys ● D1.2 Overview of the Current State of the Art Page 25 of 56
2015-10-28
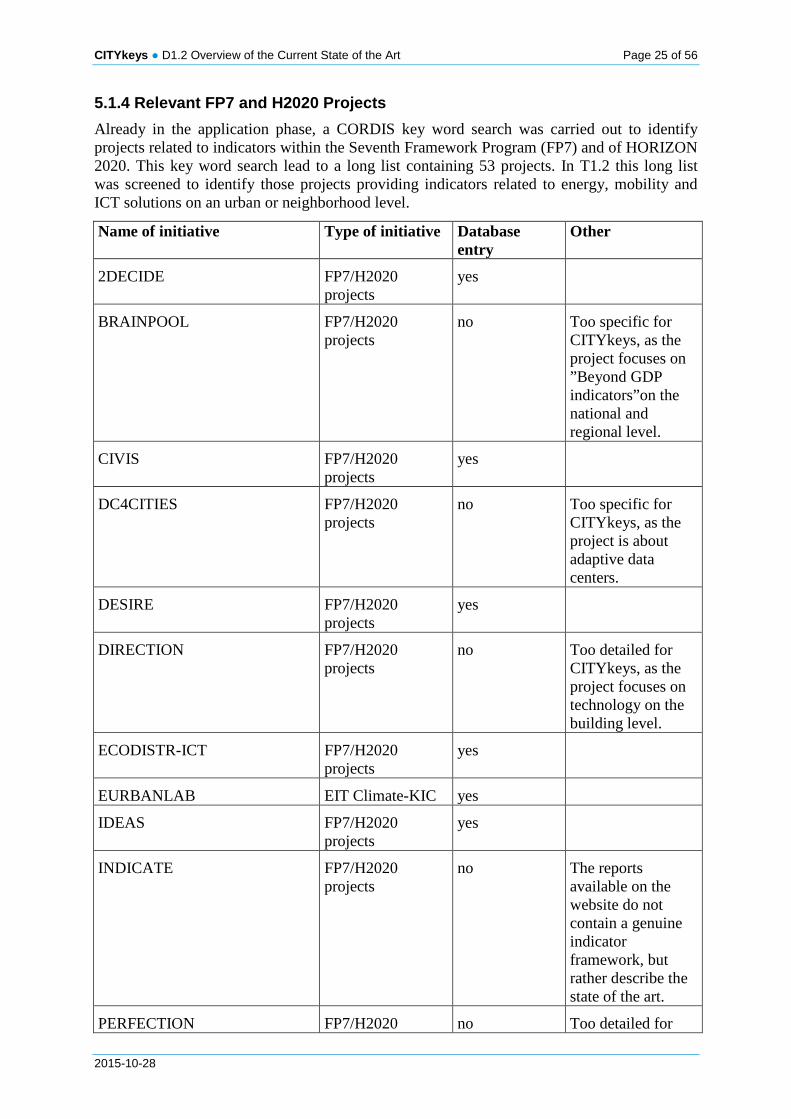
5.1.4 Relevant FP7 and H2020 Projects Already in the application phase, a CORDIS key word search was carried out to identify projects related to indicators within the Seventh Framework Program (FP7) and of HORIZON 2020. This key word search lead to a long list containing 53 projects. In T1.2 this long list was screened to identify those projects providing indicators related to energy, mobility and ICT solutions on an urban or neighborhood level.
Name of initiative Type of initiative Database entry
Other
2DECIDE FP7/H2020 projects
yes
BRAINPOOL FP7/H2020 projects
no Too specific for CITYkeys, as the project focuses on ”Beyond GDP indicators”on the national and regional level.
CIVIS FP7/H2020 projects
yes
DC4CITIES FP7/H2020 projects
no Too specific for CITYkeys, as the project is about adaptive data centers.
DESIRE FP7/H2020 projects
yes
DIRECTION FP7/H2020 projects
no Too detailed for CITYkeys, as the project focuses on technology on the building level.
ECODISTR-ICT FP7/H2020 projects
yes
EURBANLAB EIT Climate-KIC yes
IDEAS FP7/H2020 projects
yes
INDICATE FP7/H2020 projects
no The reports available on the website do not contain a genuine indicator framework, but rather describe the state of the art.
PERFECTION FP7/H2020 no Too detailed for
CITYkeys ● D1.2 Overview of the Current State of the Art Page 26 of 56
2015-10-28
projects CITYkeys, as PERFECTION looks at the indoor environment of buildings.
PLEEC FP7/H2020 projects
yes
READY FP7/H2020 projects
yes
RENAISSANCE FP7/H2020 projects
no RENAISSANCE uses the CONCERTO indicators
SATIE FP7/H2020 projects
no The focus of the project is on scenario development, not on indicators
SUPERRBUILDINGS FP7/H2020 projects
no Too detailed for CITYkeys, as the project focuses on individual buildings
TRANSFORM FP7/H2020 projects
yes
URBES FP7/H2020 projects
yes
URB-GRADE FP7/H2020 projects
yes
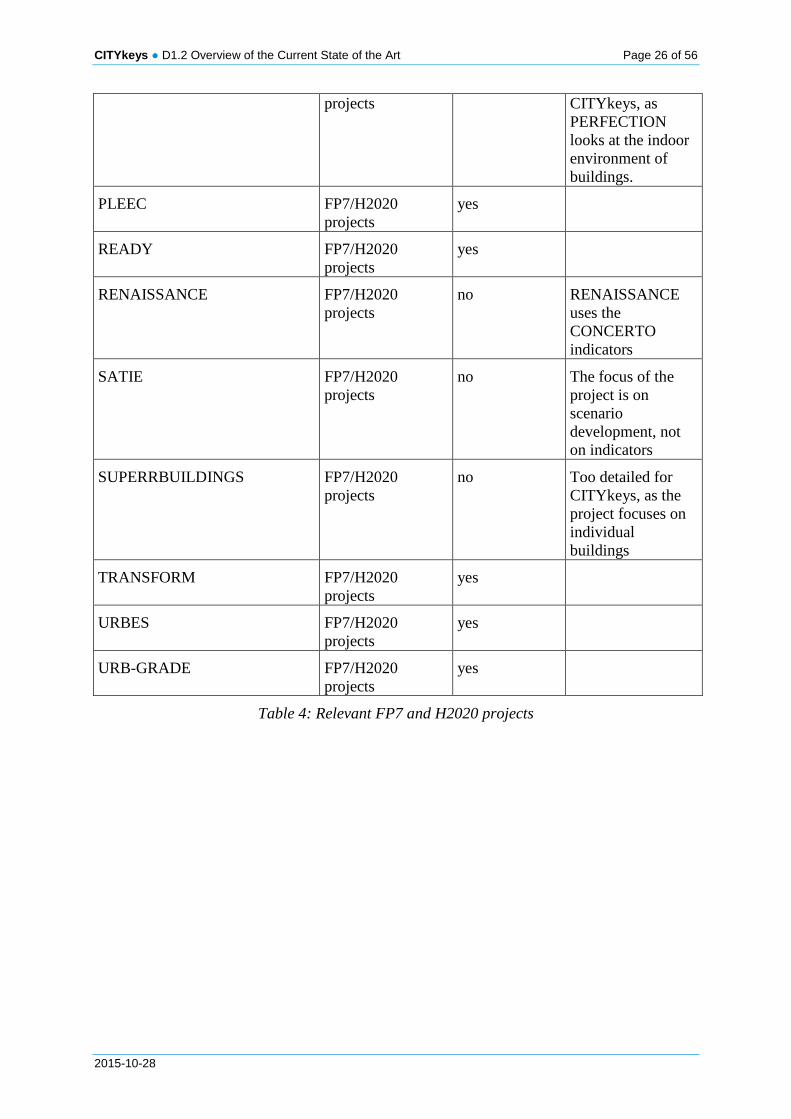
Table 4: Relevant FP7 and H2020 projects
CITYkeys ● D1.2 Overview of the Current State of the Art Page 27 of 56
2015-10-28
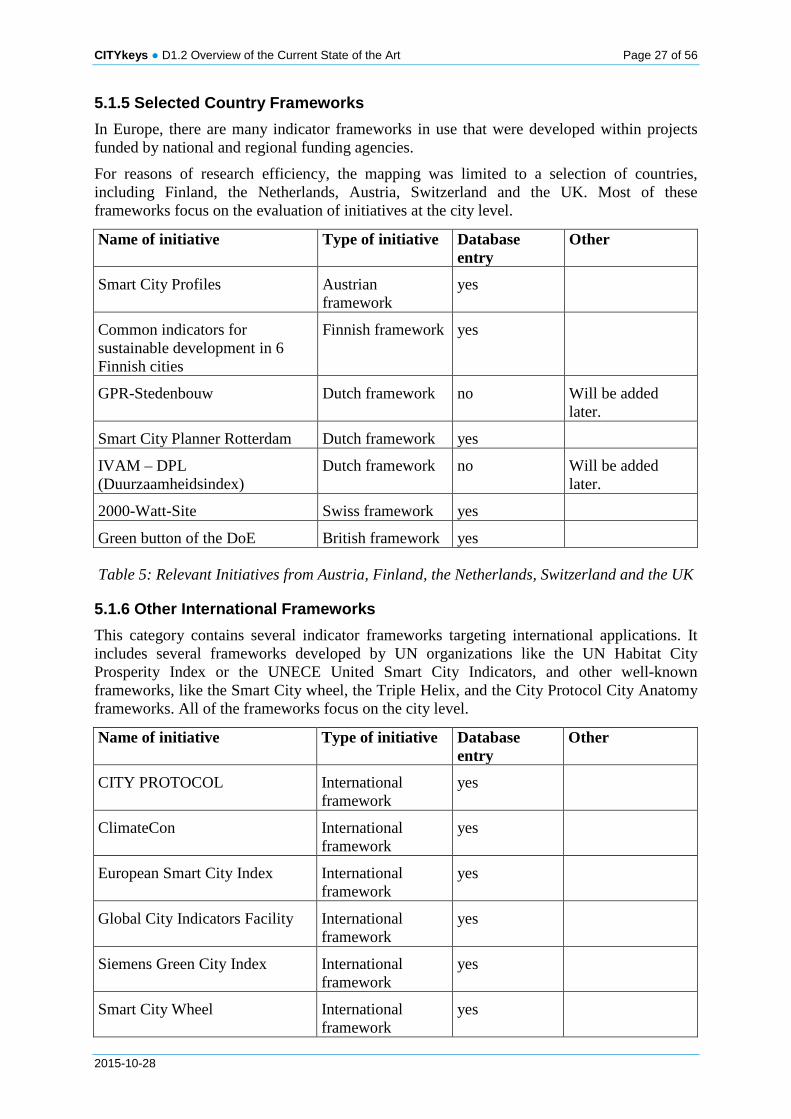
5.1.5 Selected Country Frameworks In Europe, there are many indicator frameworks in use that were developed within projects funded by national and regional funding agencies.
For reasons of research efficiency, the mapping was limited to a selection of countries, including Finland, the Netherlands, Austria, Switzerland and the UK. Most of these frameworks focus on the evaluation of initiatives at the city level.
Name of initiative Type of initiative Database entry
Other
Smart City Profiles Austrian framework
yes
Common indicators for sustainable development in 6 Finnish cities
Finnish framework yes
GPR-Stedenbouw Dutch framework no Will be added later.
Smart City Planner Rotterdam Dutch framework yes
IVAM – DPL (Duurzaamheidsindex)
Dutch framework no Will be added later.
2000-Watt-Site Swiss framework yes
Green button of the DoE British framework yes
Table 5: Relevant Initiatives from Austria, Finland, the Netherlands, Switzerland and the UK
5.1.6 Other International Frameworks This category contains several indicator frameworks targeting international applications. It includes several frameworks developed by UN organizations like the UN Habitat City Prosperity Index or the UNECE United Smart City Indicators, and other well-known frameworks, like the Smart City wheel, the Triple Helix, and the City Protocol City Anatomy frameworks. All of the frameworks focus on the city level.
Name of initiative Type of initiative Database entry
Other
CITY PROTOCOL International framework
yes
ClimateCon International framework
yes
European Smart City Index International framework
yes
Global City Indicators Facility International framework
yes
Siemens Green City Index International framework
yes
Smart City Wheel International framework
yes
CITYkeys ● D1.2 Overview of the Current State of the Art Page 28 of 56
2015-10-28
Triple Helix International framework
yes
UN Habitat City Prosperity index
International framework
yes
UNECE United Smart Cities International framework
yes
Table 6: Other relevant indicator frameworks
5.2 Database development In order to compare the individual frameworks along same criteria, a uniform screening template, containing the following three spreadsheets was developed and used:
• Spreadsheet 1: Meta information • Spreadsheet 2: City level indicators • Spreadsheet 3: Indicators on the level of a neighborhood/district/project
Spreadsheet 1 contains mainly qualitative information, addressing the following questions:
• Who are the end users of the framework? • Has it been used, if yes, where? • Is there a structure in place for the communication of the outcomes/reporting? • Is the primary focus of the framework on the macro or micro level? City or project? • What overall goal is the indicator system pursuing? • Is the given framework based on a particular scientific theory? • Was the given framework developed in a specific political context/ backed by a
political setting or support?
Spreadsheet 2 contains all city level indicators and spreadsheet 3 all project level indicators of the respective framework. For each of the indicators, the following features are provided:
• Overarching theme, to which the indicator is associated • Indicator title • Indicator unit • Definition and extensive description of the indicators • Source
All of the spreadsheets were then imported into a database allowing to summarize or merge indicators in an efficient way, and to carry out statistical analysis, such as totals, groups and counts which will be used in the gap analysis. Later the model will be normalized to avoid redundancy and to facilitate the use of additional indicators.
5.3 Data analysis and classification The 43 indicator frameworks can be classified in different ways. They vary significantly according to their goals and geographical scales.
5.3.1 Types of frameworks Some major clusters of frameworks could be identified and mapped along the following axes:
• Frameworks, attempting to measure the progress/change in a systemic – holistic manner, across different sectors on a city level

CITYkeys ● D1.2 Overview of the Current State of the Art Page 29 of 56
2015-10-28
• Frameworks, attempting to measure the progress/change in a systemic – holistic manner, across different sectors on a district/neighborhood/project level
• Frameworks targeting a measuring of progress/change on both city and district/ neighborhood/project level following a systemic - holistic approach
• Frameworks targeting a measuring of progress/change on both city and district/ neighborhood/project level following a sectoral approach
• Frameworks focused on a single or a few sectors, attempting to measure the progress in these areas only, detached from other factors
Figure 5 provides an overview of the first clustering of the mapped frameworks along the described axes. It stands out, that a good majority of mapped frameworks targets the scale of the entire city by using an integrated-holistic methodology and relevant indicators. In particular, the frameworks developed in a global context (e.g. Global City Indicators Facility) as well as national frameworks belong to this cluster.
Eight of the analyzed frameworks cover both: city as well as neighborhood/district/project scales of assessment. Some of the European Initiatives and Horizon 2020 as well as FP7 projects belong as well to this cluster.
Figure 5: Mapping of City- and project related frameworks

CITYkeys ● D1.2 Overview of the Current State of the Art Page 30 of 56
2015-10-28
Figure 5 - continued: Framework categories
This clustering visualizes the fact that frameworks, which provide sufficient assessment of the progress on the level of project while using a holistic-integrated approach are underrepresented in comparison to the city level.
The main goals are almost as diverse as the matters. Some frameworks are used for rankings concerning the respective topic (e.g. Smart City Wheel, Siemens Green City Index and Green Capital Award).
Others were implemented as a way of self-assessment to enable cities and their authorities to examine their region, city or district (e.g. UNECE). This was often followed by supporting the concerning city authorities in the development process of creating suitable policies or solution strategies.
Furthermore, frameworks were frequently implemented to evaluate running or conducted projects or policies, in order to either further adapt them or to raise awareness about weaknesses to be avoided in future projects and policies.
CITYkeys ● D1.2 Overview of the Current State of the Art Page 31 of 56
2015-10-28
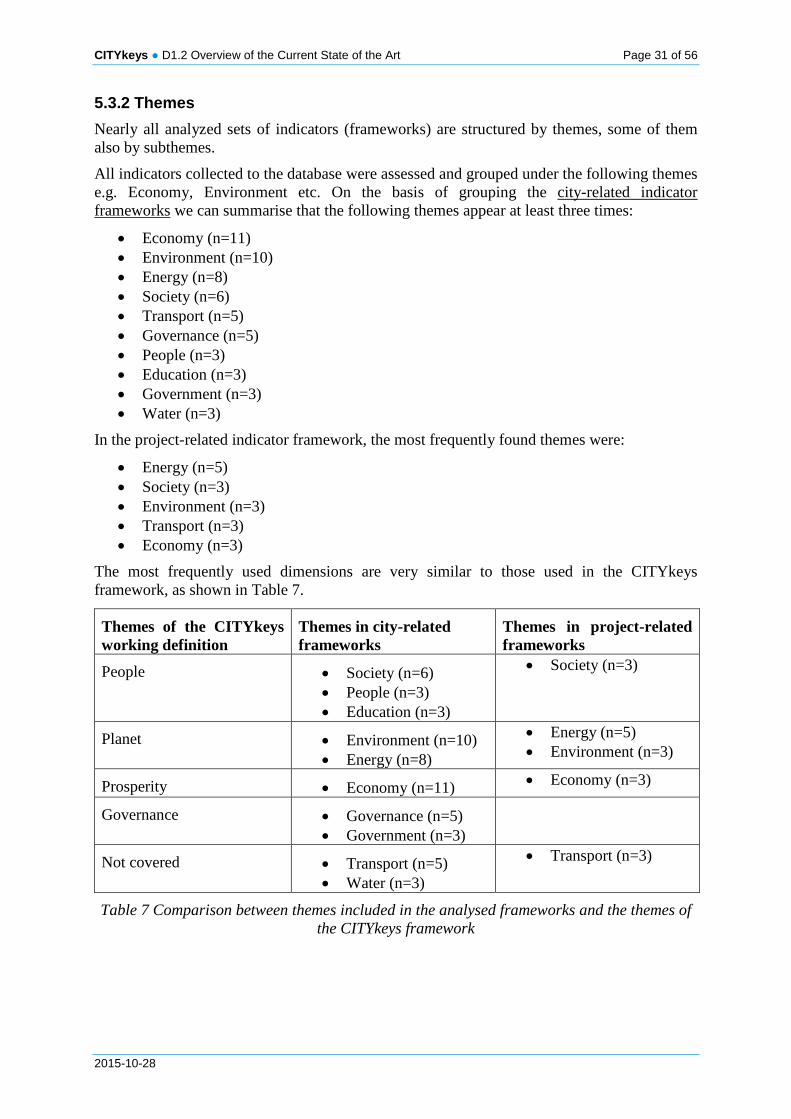
5.3.2 Themes Nearly all analyzed sets of indicators (frameworks) are structured by themes, some of them also by subthemes.
All indicators collected to the database were assessed and grouped under the following themes e.g. Economy, Environment etc. On the basis of grouping the city-related indicator frameworks we can summarise that the following themes appear at least three times:
• Economy (n=11) • Environment (n=10) • Energy (n=8) • Society (n=6) • Transport (n=5) • Governance (n=5) • People (n=3) • Education (n=3) • Government (n=3) • Water (n=3)
In the project-related indicator framework, the most frequently found themes were:
• Energy (n=5) • Society (n=3) • Environment (n=3) • Transport (n=3) • Economy (n=3)
The most frequently used dimensions are very similar to those used in the CITYkeys framework, as shown in Table 7.
Themes of the CITYkeys working definition
Themes in city-related frameworks
Themes in project-related frameworks
People • Society (n=6) • People (n=3) • Education (n=3)
• Society (n=3)
Planet • Environment (n=10) • Energy (n=8)
• Energy (n=5) • Environment (n=3)
Prosperity • Economy (n=11) • Economy (n=3)
Governance • Governance (n=5) • Government (n=3)
Not covered • Transport (n=5) • Water (n=3)
• Transport (n=3)
Table 7 Comparison between themes included in the analysed frameworks and the themes of the CITYkeys framework
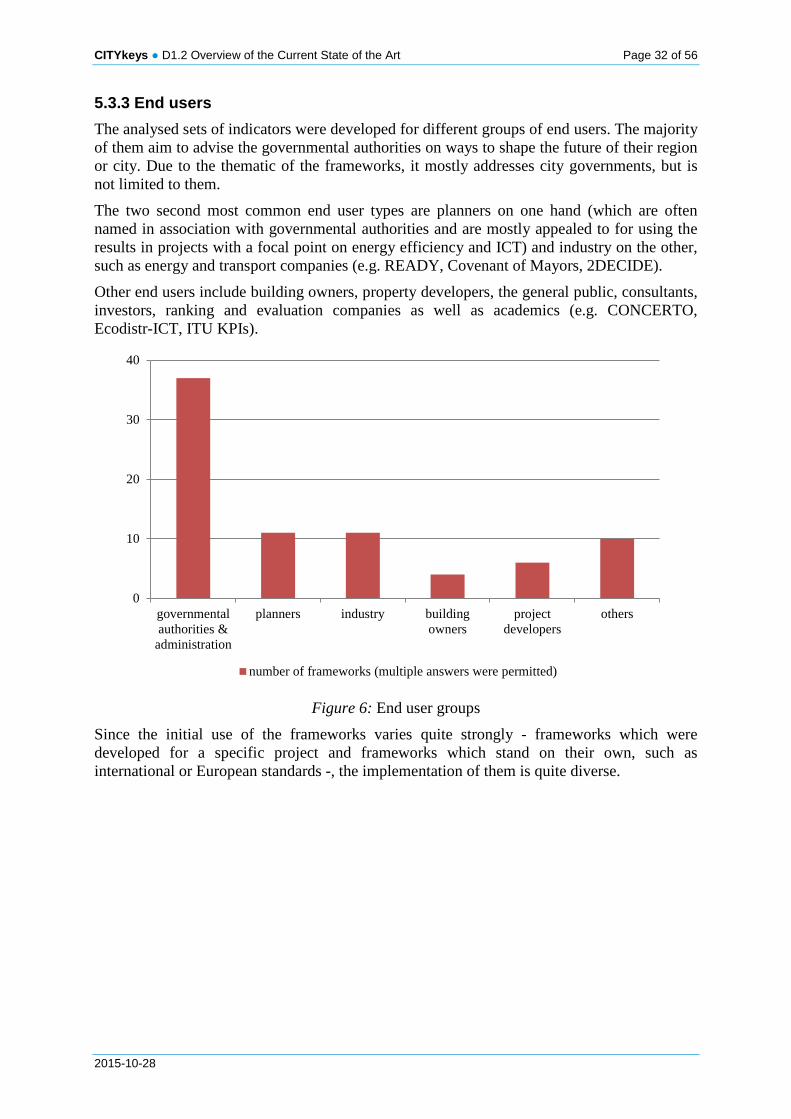
CITYkeys ● D1.2 Overview of the Current State of the Art Page 32 of 56
2015-10-28
5.3.3 End users The analysed sets of indicators were developed for different groups of end users. The majority of them aim to advise the governmental authorities on ways to shape the future of their region or city. Due to the thematic of the frameworks, it mostly addresses city governments, but is not limited to them.
The two second most common end user types are planners on one hand (which are often named in association with governmental authorities and are mostly appealed to for using the results in projects with a focal point on energy efficiency and ICT) and industry on the other, such as energy and transport companies (e.g. READY, Covenant of Mayors, 2DECIDE).
Other end users include building owners, property developers, the general public, consultants, investors, ranking and evaluation companies as well as academics (e.g. CONCERTO, Ecodistr-ICT, ITU KPIs).
Figure 6: End user groups
Since the initial use of the frameworks varies quite strongly - frameworks which were developed for a specific project and frameworks which stand on their own, such as international or European standards -, the implementation of them is quite diverse.
0
10
20
30
40
governmentalauthorities &
administration
planners industry buildingowners
projectdevelopers
others
number of frameworks (multiple answers were permitted)

CITYkeys ● D1.2 Overview of the Current State of the Art Page 33 of 56
2015-10-28
6. CITYKEYS EVALUATION FRAMEWORK While chapter 5 provides a general analysis of the state of the art, chapter 6 focuses on the integration of current good practice into a CITYkeys evaluation framework. This framework will support Smart Cities in strengthening their strategic planning and measure their progress. An important feature of this framework is that it not only will focus on the city as well as the project level, but most importantly, it will establish a link between the two. It will show the progress of the city as a whole towards smart city goals, comparing the year under study with a reference year. In addition, it will evaluate the impact of a Smart City project comparing before and after situations or comparing expected impact with a reference situation. And finally, it will assess how the project has contributed to the objectives at city level. The structure of the framework in themes and subthemes is, therefore, similar for the project and city level, making it easier to indicate the relation between project impacts and city performance.
6.1 Main Structure of the Framework The understanding of the general CITYkeys objectives, mentioned in the Description of Action (DoA), are essential for the setup of the evaluation framework. The ultimate goal of CITYkeys is to support the speeding up of wide-scale deployment of smart city solutions and services in
order to create impact on major societal challenges around the cities fast growth and the Union's 20/20/20 energy and climate targets. Therefore, CITYkeys aims to facilitate and
enable stakeholders in projects or cities to learn from each other, create trust in solutions, and monitor progress, by means of a common performance measurement framework.
Together with the working definitions of a Smart City and a Smart City project (chapter 3) and other important aspects defined by partner cities during CITYkeys workshops and
teleconferences, they form the basic principles for the structure of the framework. Figure 7 provides a clear overview of these CITYkeys principles.
The main themes of the CITYkeys evaluation framework follow naturally from the four goals of a Smart City: People, Planet, Prosperity and Governance, which together allow for a cross-sectoral and integrated approach. In addition to these themes, the CITYkeys DoA also emphasizes the importance of evaluating the openness of technological solutions. Therefore, a fifth theme, Propagation, has been added which concerns the replicability and scalability of a solution within the city and outside. The exact definitions of these five themes that constitute the foundation of the framework are discussed in 5.3.

CITYkeys ● D1.2 Overview of the Current State of the Art Page 34 of 56
2015-10-28
Figure 7: CITYkeys principles
6.2 Subthemes of the Framework To make the framework practical and applicable, each theme was divided further in subthemes that determine and influence it. Below, a list of possible subthemes is presented. These subthemes originate from the studied frameworks2 (chapter 5) and are regrouped under the CITYkeys main framework. In this overview the needs of cities and citizens (resulting from D1.1) are integrated as well. The survey for T1.1 was conducted separately for the city and project level, which is why this overview is divided in two paragraphs for both levels.
6.2.1 Evaluation of subthemes at city level Below subthemes (bullets) are relevant themes from existing frameworks grouped under the new CITYkeys themes. Text in red is (also) recognized as important and/or necessary by at least 50% of the cities participating in the survey of T1.1 (figure 9 and 10, DT1.1). Text in green is considered important by citizens (DT1.1, issues listed in 4.2.1).
2 In this overview, the following frameworks are included: Civitas, GDC, Eco-District, Eurbanlab, Civis, Desire,
Siemens Green City, Smart City Profiles, Smart City Wheel, Transform, Triple Helix, Urbgrade, Finnish Sustainability City Indicators, Smart City planner Rotterdam, Ecodistr-ICT, RFSC, ISO37120, Concerto, European Smart Cities v1, European Smart City Index v3 (PLEEN), LEED, CASBEE 2012 and 2014, Reference Framework for Sustainable Cities.

CITYkeys ● D1.2 Overview of the Current State of the Art Page 35 of 56
2015-10-28
People - Quality of life • Health (eg heat stress; noise; air quality; sanitation, access to health services) • Safety • Access to services/resources/amenities/networks • Culture and leisure (later included in “access to services) • Education & skills (high level education; early classes of technology) • Creativity (later included in “education”) • Diversity & Social inclusion • Land Use (later rephrased as “Quality of housing and of the built environment”)
Planet - Resource efficiency • Energy and mitigation (performance, savings, efficiency, renewable energy,
CO2/GHG emission / savings) • Climate resilience • Resources • Water (later included in “resources”) • Environment (later rephrased as “Pollution and Waste”) • Ecosystems
Prosperity • Economic Performance / GDP • Equity • Employment • City attractiveness • Innovation
Governance • Policy & Organisation (later rephrased as “Organisation”) • Community engagement • Citizen participation (later rephrased as “Co-creation”) • Multilevel governance
Propagation This theme was not supposed to be used for the evaluation on the City level, but added later in the process.
6.2.2 Evaluation of the subthemes at project level Below subthemes (bullets) are relevant themes from existing frameworks grouped under the new CITYkeys themes. Text in red is (also) recognized as important and/or necessary by at least 50% of the cities participating in the survey of T1.1 (figure 13 and 14, DT1.1). Text in green is (also) considered priority by citizens (DT1.1, figures 30-33) (top 3 per graph).
People - Quality of life • Health (eg heat stress; noise; air quality; sanitation, access to health services) • Safety • Access to services/resources/amenities/networks • Culture and leisure (later included in “access to services)
CITYkeys ● D1.2 Overview of the Current State of the Art Page 36 of 56
2015-10-28
• Education & skills (high level education; early classes of technology) • Creativity (later included in “education”) • Diversity & Social inclusion • Quality of housing and of the built environment
Planet - Resource efficiency • Energy and mitigation (performance, savings, efficiency, renewable energy,
CO2/GHG emission / savings) • Climate resilience • Resources • Water (later included in “resources”) • Environment (later rephrased as “Pollution and Waste”) • Ecosystems
Prosperity • Economic Performance / GDP • Equity • Employment • City attractiveness • Innovation
Process • Policy & Organisation (later rephrased as “Organisation”) • Community engagement • Citizen participation (later rephrased as “Co-creation”) • Multilevel governance
Propagation • Scalability • Replicability
6.2.3 Preliminary selection of subthemes The above lists in paragraph 5.2.1 and 5.2.2 formed the starting point for the discussion with partner institutions and cities in CITYkeys to develop a framework that suits the needs of Smart Cities. Several videoconferences/teleconferences and workshops have been held to elaborate the structure. Among other things, it was finally agreed that the same themes and subthemes should be used for the city and the project level.
In Figure 8 the preliminary structure of the CITYkeys evaluation framework is presented. This structure is still being debated and can be adjusted according to ongoing discussions in T1.3. The exact definitions of these subthemes are described in 6.3.

CITYkeys ● D1.2 Overview of the Current State of the Art Page 37 of 56
2015-10-28
Figure 8 Preliminary structure of the CITYkeys framework
It should be noted that the categorisation in themes (and subthemes) does not concentrate on economic sectors like transport, ICT and infrastructure. Within the CITYkeys consortium it was agreed that this framework should focus on the impact of projects and strategies, regardless of the type or origin of the project. Firstly, because this structure prevents focusing on isolated, sector specific solutions and facilitates cross-sectoral solutions. Secondly, because it makes the framework applicable to all kind of projects. For instance, an indicator in the framework could be ‘the reduction in greenhouse gas emissions’, whether by e.g. introducing electric vehicles or by insulating dwellings. The number of electric vehicles introduced or houses insulated, is then less relevant, making the indicator framework suitable for evaluation of many types of projects.
6.3 Definitions It is important to agree on clear definitions of the (sub)themes early in the process, thereby avoiding different interpretations and providing focus. The (sub)themes can be seen as policy objectives and one should define what it is a city wants to achieve exactly and in what sense it can influence the process. During the consortium meeting in Rotterdam in June 2015 it rapidly became clear that many partner cities regarded the main function of the evaluation framework to improve projects. All definitions are therefore described as ‘improving’ the situation, whether increasing something you want to stimulate, or decreasing something less favourable.
6.3.1 People Definition of People: Improving the quality of life for everyone, especially for the most vulnerable citizens, and creating opportunities for education and health improvement.
Subtheme definitions
• Diversity and social cohesion; promoting diversity, community engagement and social cohesion to increase the sense of community.
• Education: improving accessibility and quality of education for everyone
• Safety: lowering the rate of crime and accidents
• Health: improving the quality and accessibility of the public health system for everyone and encouraging a healthy lifestyle
CITYkeys ● D1.2 Overview of the Current State of the Art Page 38 of 56
2015-10-28
• Quality of housing and the built environment: encourage mixed-income areas, ensure high quality and quantity of public spaces and recreational areas, and improve the affordability and accessibility to good housing for everyone.
• Access to (other) services: providing better access for everyone to amenities and affordable services in physical and virtual space
6.3.2 Planet Definition of Planet: Contributing to a ‘cleaner’ city with a higher resource efficiency and biodiversity and being better adapted to future climate change.
Subtheme definitions
• Energy and mitigation: Reduce energy consumption, use waste energy and produce renewable energy
• Other resources: Creating a society that treats its resources (materials, water, food and land) more efficiently and sustainably, among others by decreasing consumption and increasing recycling and renewable production (thereby considering ‘spill-overs’ to other resources).
• Climate resilience: Adapting to climate change by increasing the resilience of vulnerable areas/elements.
• Pollution and waste: Decreasing the emissions to the environment (in the city or elsewhere) (e.g. waste, noise and pollution to air, water and soil).
• Ecosystem: stimulating biodiversity and nature conservation
6.3.3 Prosperity Definition of Prosperity: Contributing to a prosperous and equal society and supporting affordable, green and smart solutions.
Subtheme definitions
• Employment: Improving local employment opportunities
• Equity: decreasing poverty and income inequality
• Green economy: improving the circular and sharing economy and sustainable/local consumption and production.
• Economic performance: increasing GDP and project performance (internal performance)
• Competitiveness and attractiveness: Improving the appeal of the city for residents and businesses.
• Innovation: facilitates innovation and creativity (through e.g. open data, knowledge sharing and cyber resilience).
CITYkeys ● D1.2 Overview of the Current State of the Art Page 39 of 56
2015-10-28
6.3.4 Governance Definition of Governance: Contributes to a successful process of implementation as well as to a city with an efficient administration and a well-developed local democracy, thereby engaging citizens proactively in innovative ways.
Subtheme definitions
• Multilevel governance: Increasing support for SC initiatives by providing SC policies and budget at different government levels.
• Organization: Facilitate the implementation of (integrated) SC policies by improving the organization of the project/city with regards to;
o The composition, structure and quality of the project team/city administration;
o The quality of the implementation process;
o Sound leadership by the project leader(s) and city politicians;
o Transparency of the organisation.
• Co-creation: enhancing the active involvement of end-users, the community and professional stakeholders in city developments.
• Community engagement: increasing citizen participation in planning, decision making and politics.
6.3.5 Propagation Definition of Propagation: Improving the replicability and scalability of smart city project solutions at wider city scale.
Subtheme definitions
• Scalability: Increasing the potential for scaling up successful SC solutions (considering both geographic scale and thematic integration potential) to achieve wider impact in the city.
• Replicability: Increasing the potential for replicating successful SC solutions in other cities.
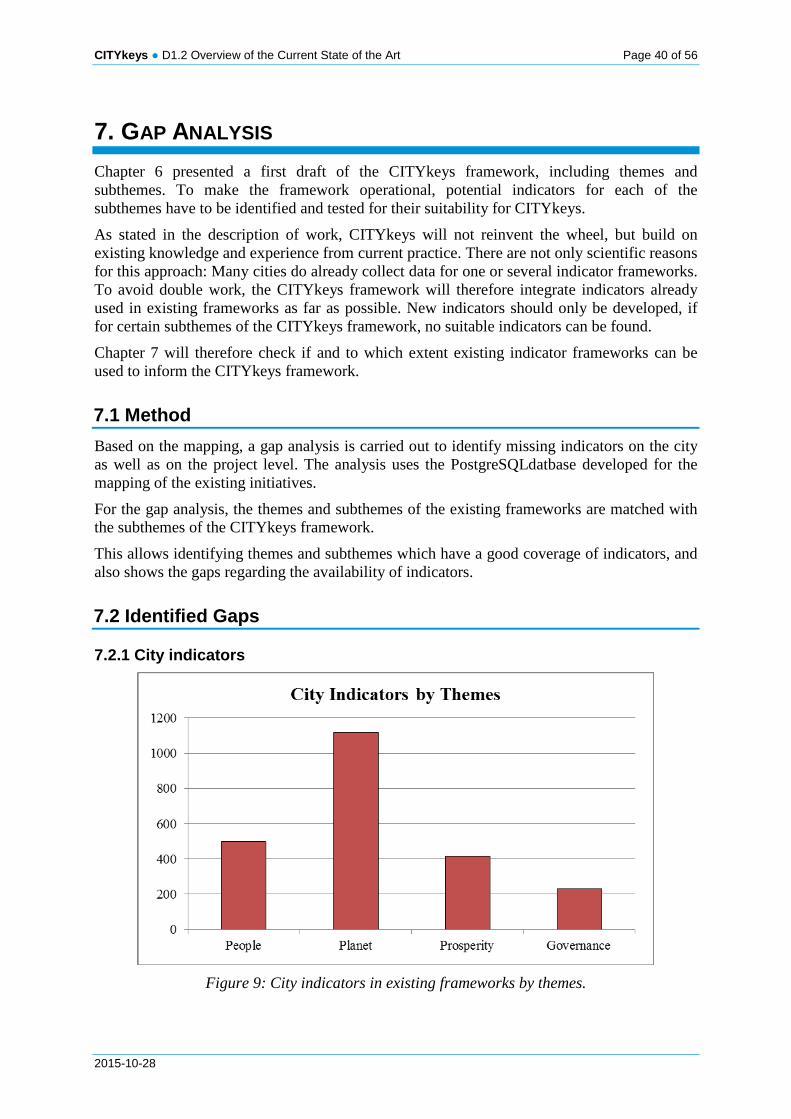
CITYkeys ● D1.2 Overview of the Current State of the Art Page 40 of 56
2015-10-28
7. GAP ANALYSIS Chapter 6 presented a first draft of the CITYkeys framework, including themes and subthemes. To make the framework operational, potential indicators for each of the subthemes have to be identified and tested for their suitability for CITYkeys.
As stated in the description of work, CITYkeys will not reinvent the wheel, but build on existing knowledge and experience from current practice. There are not only scientific reasons for this approach: Many cities do already collect data for one or several indicator frameworks. To avoid double work, the CITYkeys framework will therefore integrate indicators already used in existing frameworks as far as possible. New indicators should only be developed, if for certain subthemes of the CITYkeys framework, no suitable indicators can be found.
Chapter 7 will therefore check if and to which extent existing indicator frameworks can be used to inform the CITYkeys framework.
7.1 Method Based on the mapping, a gap analysis is carried out to identify missing indicators on the city as well as on the project level. The analysis uses the PostgreSQLdatbase developed for the mapping of the existing initiatives.
For the gap analysis, the themes and subthemes of the existing frameworks are matched with the subthemes of the CITYkeys framework.
This allows identifying themes and subthemes which have a good coverage of indicators, and also shows the gaps regarding the availability of indicators.
7.2 Identified Gaps
7.2.1 City indicators
Figure 9: City indicators in existing frameworks by themes.

CITYkeys ● D1.2 Overview of the Current State of the Art Page 41 of 56
2015-10-28
Figure 9 shows the availability of city level indicators for the themes “People”, “Planet”, “Prosperity”, and “Process”.3 As it can be seen, the theme “Planet” is covered best. For “People” and “Prosperity” 500 respectively 415 indicators were found. For “Process”, the coverage is lower, but also for this theme 230 indicators are available.
Figure 10 City indicators in existing frameworks by categories
Figure 10 shows the availability of city level indicators for the categories “Energy”, “Mobility” and “ICT”. The category “Energy” is covered best in that case and counts to 732 items. For the categories “Mobility” and “ICT” the number of found indicators refers to 279 and 378 respectively. The following table summarizes the number of indicators per category:
Theme/Category Number of indicators
People 500
Planet 1100
Prosperity 415
Governance 230
Energy 732
Mobility 279
ICT 378
Table 8: Number of city indicators by categories
3 The theme “Propagation” was not taken into account, as it was not part of the evaluation framework on the city
level when the gap analysis was carried out.

CITYkeys ● D1.2 Overview of the Current State of the Art Page 42 of 56
2015-10-28
Figure 11: City indicators in existing frameworks by subthemes.
Looking at the indicators on the subtheme level tells a slightly different story, as the indicator availability varies significantly.

CITYkeys ● D1.2 Overview of the Current State of the Art Page 43 of 56
2015-10-28
Figure 11 shows the distribution of core areas of city level subthemes in a spider web diagram. It can be derived that the focus of indicators is on the subthemes “Energy and mitigation”, “Environment”, “Accessibility”, “Access to services”, “Quality of housing and the built environment” and “Resources”. As shown in Table 9: City indicators by themes and subthemes, there is one subtheme for which no indicators are available.
The subthemes can be ranked according to the availability of indicators as follows:
Gap (no indicators available)
• Multilevel Governance Fairly covered subthemes (number of indicators below or equal to the median value)
• Diversity and Social Cohesion (n=3) • Economic Sustainability (n= 5) • Co-creation (n=6) • Climate Resilience (n=7) • Community Engagement (n=11) • Ecosystem (n=16) • Innovation (n=22) • Process (n=32) • Equity (n=35) • Employment (n=43) • Community (n=45)
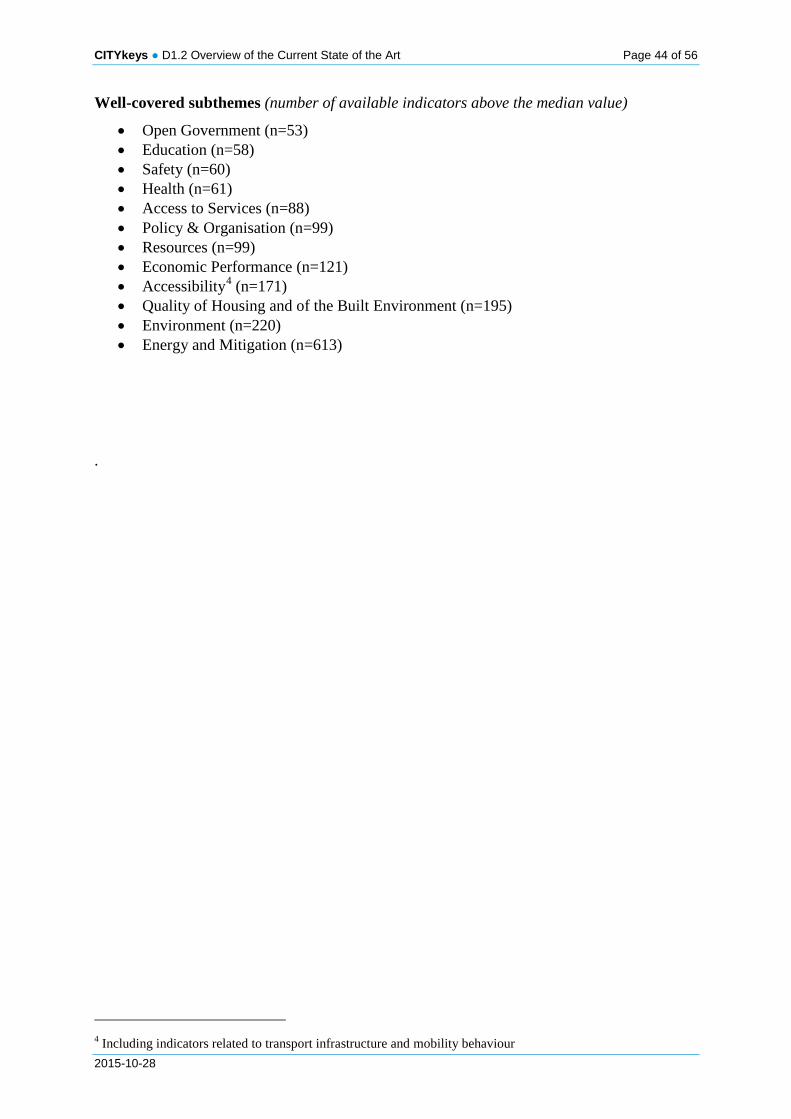
CITYkeys ● D1.2 Overview of the Current State of the Art Page 44 of 56
2015-10-28
Well-covered subthemes (number of available indicators above the median value)
• Open Government (n=53) • Education (n=58) • Safety (n=60) • Health (n=61) • Access to Services (n=88) • Policy & Organisation (n=99) • Resources (n=99) • Economic Performance (n=121) • Accessibility4 (n=171) • Quality of Housing and of the Built Environment (n=195) • Environment (n=220) • Energy and Mitigation (n=613)
.
4 Including indicators related to transport infrastructure and mobility behaviour

CITYkeys ● D1.2 Overview of the Current State of the Art Page 45 of 56
2015-10-28
PEOPLE PLANET PROSPERITY GOVERNANCE na ∑
Edu
catio
n D
iver
sity
&
Soc.
Coh
esio
n A
cces
s to
serv
ices
Safe
ty
Hea
lth
Qua
lity
of
hous
ing
and
of th
e bu
ilt
envi
ronm
ent
Ene
rgy
and
miti
gatio
n
Clim
ate
resi
lienc
e
Env
iron
men
t
Res
ourc
es
Eco
syst
em
Em
ploy
men
t
Equ
ity
Gre
en
Eco
nom
y
Eco
nom
ic
perf
orm
ance
Acc
essi
bilit
y
Inno
vatio
n
Org
anis
atio
n
Com
mun
ity
enga
gem
ent
Co-
crea
tion
Mul
tilev
el
Gov
erna
nce
Proc
ess
Ope
n go
vern
men
t
2000 Watt 1 3 4 1 1 3 2 5 20
BREEAM 10 3 1 8 11 3 14 10 2 1 63
CASBEE 2012
5 4 6 2 1 1 4 1 2 26
CASBEE 2014 2 3 3 1 2 2 2 2 17
City protocol 12
20 13 9 26 10 27 15 1 2 7 13 13 8 13 6 1 196
Civitas 1 1 2 2 8 5 8 1 28
Climate con
8 10 2 16 5 1 2 13 1 6 12 66
Concerto 7 1 14 1 13
DESIRE 1 2 10 9 5 7 1 1 4 40
Eurbanlab
3 6 3 2 1 2 2 1 2 22
European smart city index 8
8 4 3 5 5 2 2 2 6 9 3 12 1 70
FIN SCIF 7 2 18 7 5 3 1 1 44
GCIF 7 1 1 6 5 11 5 17 7 2 5 16 7 6 1 13 3 1 1 115
Green capital award 7 4 4 8 10 2 9 3 6 2 6 7 2 2 72
Green digital charter 249 249
IDEAS 13 13
ISO 37120 7 1 3 11 11 7 6 24 1 3 3 9 8 1 5 100
ITU 2 3 3 8
OECD 1 1 5 10 8 18 4 1 1 3 9 1 1 2 15 80
PLEEC 2 4 21 3 3 16 49
READY 54 2 56
RFSC 2 3 1 3 2 1 1 2 2 2 1 1 1 3 3 28
SCP Rotterdam 3 5 3 6 25 10 10 6 4 8 7 10 97

CITYkeys ● D1.2 Overview of the Current State of the Art Page 46 of 56
2015-10-28
PEOPLE PLANET PROSPERITY GOVERNANCE na ∑
Edu
catio
n D
iver
sity
&
Soc.
Coh
esio
n A
cces
s to
serv
ices
Safe
ty
Hea
lth
Qua
lity
of
hous
ing
and
of th
e bu
ilt
envi
ronm
ent
Ene
rgy
and
miti
gatio
n
Clim
ate
resi
lienc
e
Env
iron
men
t
Res
ourc
es
Eco
syst
em
Em
ploy
men
t
Equ
ity
Gre
en
Eco
nom
y
Eco
nom
ic
perf
orm
ance
Acc
essi
bilit
y
Inno
vatio
n
Org
anis
atio
n
Com
mun
ity
enga
gem
ent
Co-
crea
tion
Mul
tilev
el
Gov
erna
nce
Proc
ess
Ope
n go
vern
men
t
Siemens Green city index 1 10 13 3 3 30
Smart city index 2 3 9 2 5 2 3 4 1 31
Smart city profiles 1 12 9 2 2 1 10 8 5 50
Smart city wheel 1 4 1 1 2 1 5 1 1 4 5 1 2 29
Transform 2 11 152 2 22 34 3 30 68 6 11 21 362
Triple helix 2 8 4 2 1 1 8 1 6 1 4 2 4 44
URBES 7 7 6 5 13 1 7 5 4 1 1 2 2 3 1 6 1 72
Total 58 3 88 60 61 195 613 7 220 101 16 43 35 5 121 171 22 100 56 6 0 32 53 24 2090
Median value = 56 Blue column: No indicator available.
Orange columns: Number of available indicators equal or below median value. Green columns: Number of available indicators above median value.
Grey column: Indicators not matching the CityKeys subthemes
Table 9: City indicators by themes and subthemes

CITYkeys ● D1.2 Overview of the Current State of the Art Page 47 of 56
2015-10-28
7.2.2 Project indicators
Figure 12: Project indicators of existing frameworks by themes
The distribution of the project indicators shows a similar pattern as the distribution of the city indicators. As it can be seen in , “People”, “Process” and “Prosperity” have only one third of the number of indicators compared to “Planet”. For the fifth theme, “Propagation”, only 29 indicators could be found, even though the scalability and replicability is considered very important in many European projects.
Figure 13 Project indicators by existing frameworks by categories
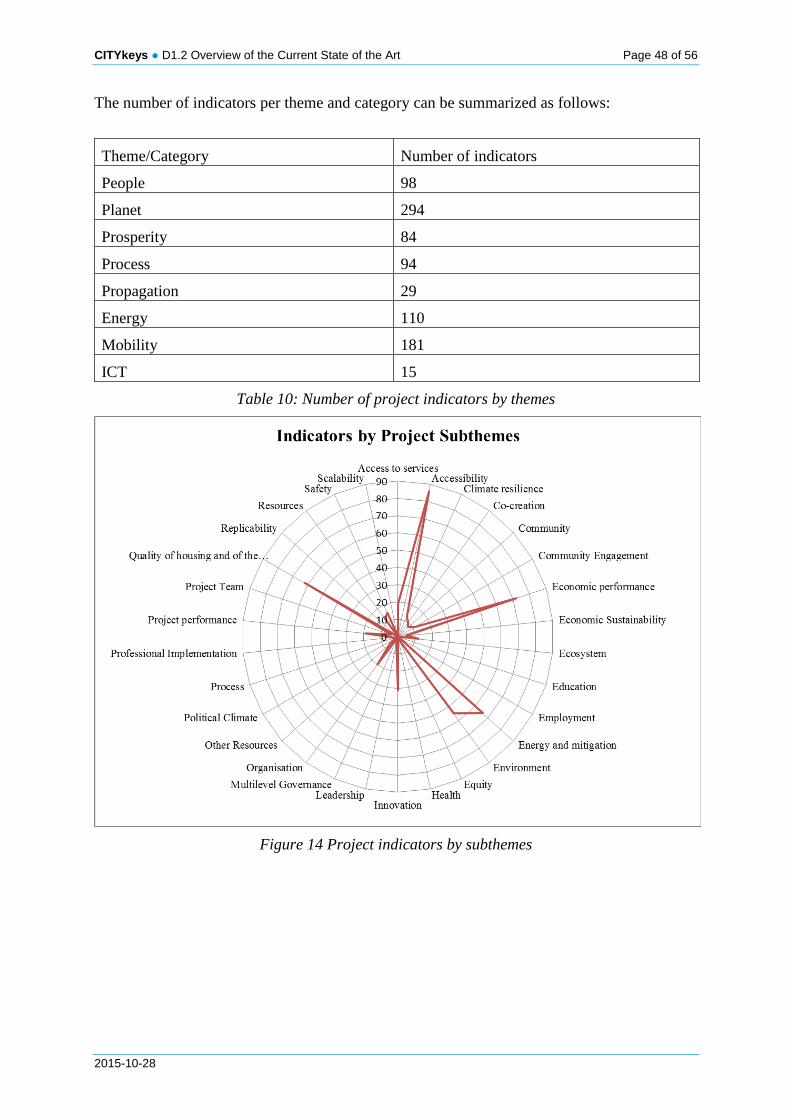
CITYkeys ● D1.2 Overview of the Current State of the Art Page 48 of 56
2015-10-28
The number of indicators per theme and category can be summarized as follows:
Theme/Category Number of indicators
People 98
Planet 294
Prosperity 84
Process 94
Propagation 29
Energy 110
Mobility 181
ICT 15
Table 10: Number of project indicators by themes
Figure 14 Project indicators by subthemes
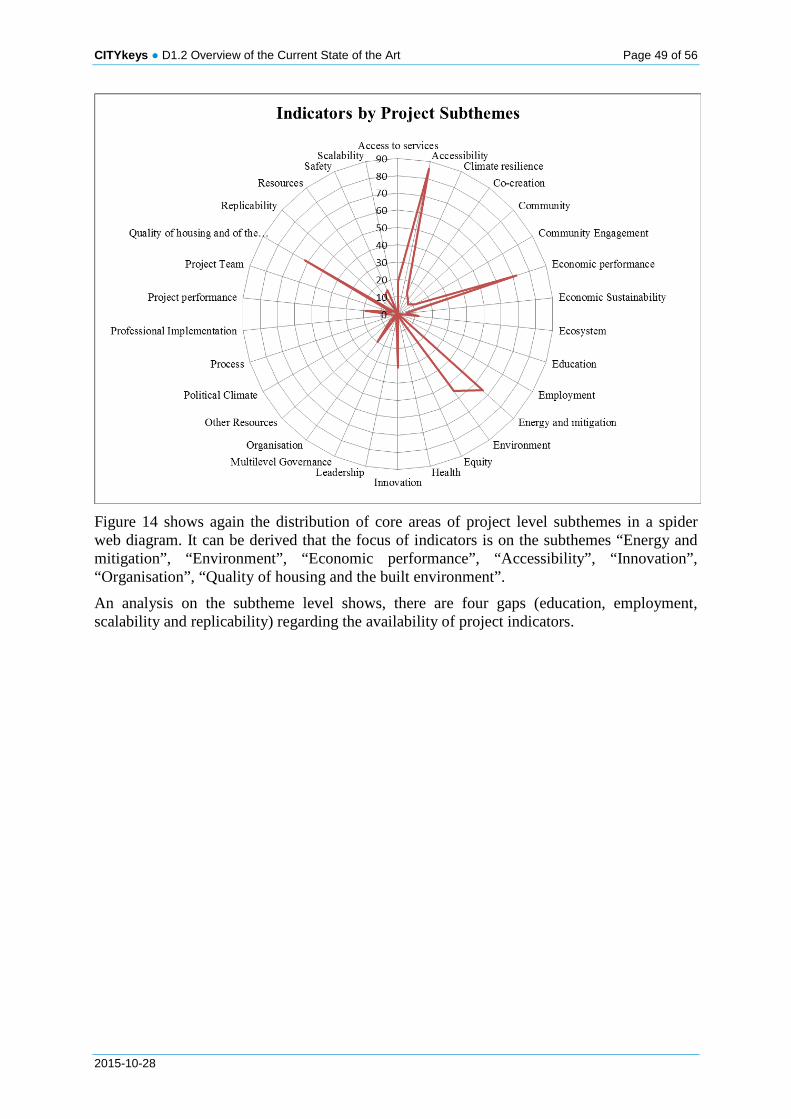
CITYkeys ● D1.2 Overview of the Current State of the Art Page 49 of 56
2015-10-28
Figure 14 shows again the distribution of core areas of project level subthemes in a spider web diagram. It can be derived that the focus of indicators is on the subthemes “Energy and mitigation”, “Environment”, “Economic performance”, “Accessibility”, “Innovation”, “Organisation”, “Quality of housing and the built environment”.
An analysis on the subtheme level shows, there are four gaps (education, employment, scalability and replicability) regarding the availability of project indicators.

CITYkeys ● D1.2 Overview of the Current State of the Art Page 50 of 56
2015-10-28
Gap (no indicators available)
• Education • Employment • Scalability • Replicability
Fairly covered subthemes (number of indicators below or equal to the median value)
• Health (n=1) • Multilevel Governance (n=1) • Political Climate (n=1) • Equity (n=3) • Process (n=3) • Leadership (n=4) • Professional Implementation (n=4) • Project Team (n=4) • Economic Sustainability (n=5) • Other Resources (n=6) • Community (n=8) • Co-creation (n=10) • Community Engagement (n=11) • Ecosystem (n=12)
Well-covered subthemes (number of available indicators above the median value)
• Climate resilience (n=13) • Resources (n=13) • Safety (n=15) • Access to services (n=19) • Project performance (n=19) • Organisation (n=20) • Innovation (n=31) • Environment (n=55) • Quality of housing and of the built environment (n=62) • Energy and mitigation (n=66) • Economic performance (n=72) • Accessibility5 (n=86)
5 Including indicators related to transport infrastructure and mobility behaviour
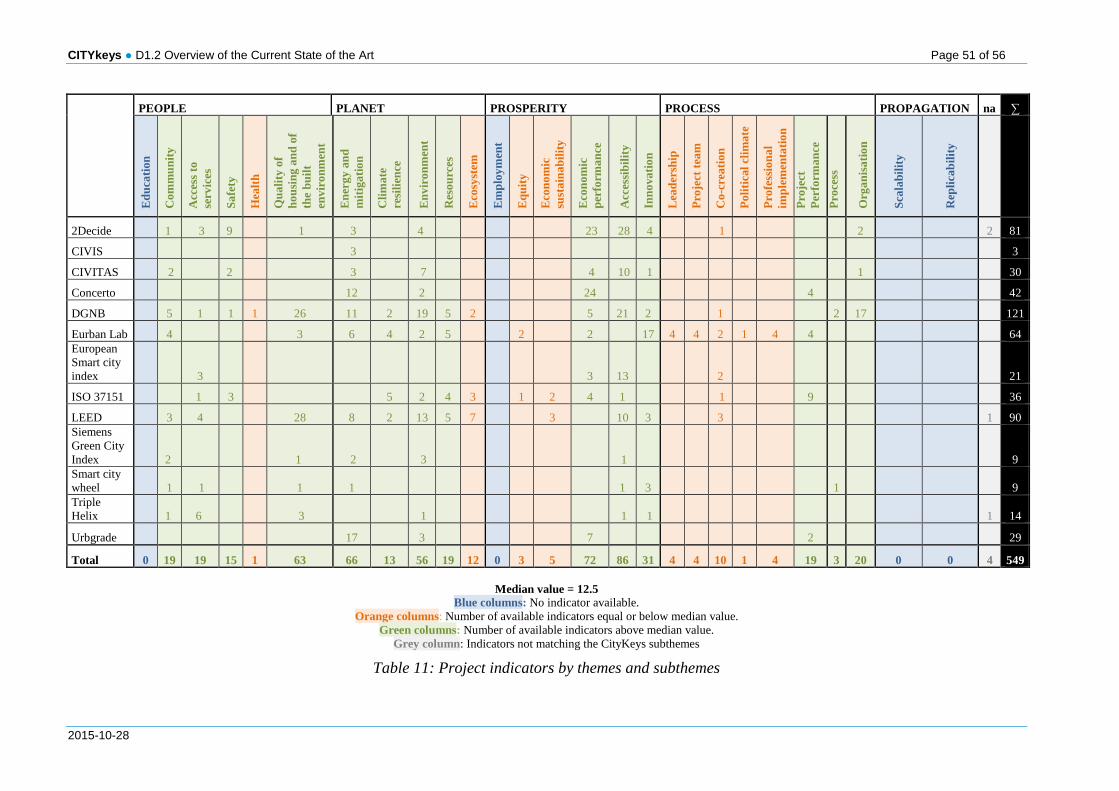
CITYkeys ● D1.2 Overview of the Current State of the Art Page 51 of 56
2015-10-28
PEOPLE PLANET PROSPERITY PROCESS PROPAGATION na ∑
Edu
catio
n
Com
mun
ity
Acc
ess t
o se
rvic
es
Safe
ty
Hea
lth
Qua
lity
of
hous
ing
and
of
the
built
en
viro
nmen
t
Ene
rgy
and
miti
gatio
n
Clim
ate
resi
lienc
e
Env
iron
men
t
Res
ourc
es
Eco
syst
em
Em
ploy
men
t
Equ
ity
Eco
nom
ic
sust
aina
bilit
y
Eco
nom
ic
perf
orm
ance
Acc
essi
bilit
y
Inno
vatio
n
Lea
ders
hip
Proj
ect t
eam
Co-
crea
tion
Polit
ical
clim
ate
Prof
essi
onal
im
plem
enta
tion
Pr
ojec
t Pe
rfor
man
ce
Proc
ess
Org
anis
atio
n
Scal
abili
ty
Rep
licab
ility
2Decide 1 3 9 1 3 4 23 28 4 1 2 2 81
CIVIS 3
3
CIVITAS 2 2 3 7 4 10 1 1
30
Concerto 12 2 24 4 42
DGNB 5 1 1 1 26 11 2 19 5 2 5 21 2 1 2 17 121
Eurban Lab 4 3 6 4 2 5 2 2 17 4 4 2 1 4 4 64 European Smart city index 3 3 13 2 21
ISO 37151 1 3 5 2 4 3 1 2 4 1 1 9
36
LEED 3 4 28 8 2 13 5 7 3 10 3 3 1 90 Siemens Green City Index 2 1 2 3 1
9
Smart city wheel 1 1 1 1 1 3 1
9
Triple Helix 1 6 3 1 1 1
1 14
Urbgrade 17 3 7 2
29
Total 0 19 19 15 1 63 66 13 56 19 12 0 3 5 72 86 31 4 4 10 1 4 19 3 20 0 0 4 549
Median value = 12.5 Blue columns: No indicator available.
Orange columns: Number of available indicators equal or below median value. Green columns: Number of available indicators above median value.
Grey column: Indicators not matching the CityKeys subthemes
Table 11: Project indicators by themes and subthemes
CITYkeys ● D1.2 Overview of the Current State of the Art Page 52 of 56
2015-10-28
8. CONCLUSIONS
8.1 Summary of achievements This report examined the state of the art regarding smart city definitions and smart-city-related indicator frameworks. Based on a discussion of several smart city definitions and taking into account the needs of the partner cities expressed in the survey of D1.1, a CITYkeys evaluation framework was developed. This included developing working definitions, themes and subthemes. As a next step, 43 existing indicator frameworks were scanned for indicators that could be related to the CITYkeys subthemes and thus potentially be used for the CITYkeys framework.
In general terms, the analysed frameworks convey the impression that the status quo regarding the availability of the Key Performance Indicators is fairly saturated in the themes “People”, “Planet” and “Prosperity”. Numerous indicators exist and have been used across different sectors in cities and districts in Europe as well as globally. Nevertheless, the following gaps regarding the availability of indicators were identified:
• On the city level • Multilevel governance
On the project veö
• Education • Employment • Scalability • Replicability
Also there are significant variations in the coverage of the subthemes.
• On the city level, the themes ”Planet” with its subthemes ”Energy and Mitigation”, ”Environment” and ”Resources” and ”People” with the subthemes ”Quality of Housing and of the Built Environment”, ”Health”, ”Safety”, ”Education” and ”Access to Services” have the best coverage. The theme ”Governance” includes a well-covered subtheme ”organisation”, while there are only few indicators available for the subthemes ”co-creation”, ”community engagement”, “process” and “open governance are available. The theme ”Prosperity” is well covered regarding the subthemes ”Economic Performance” and ”Accessibility”, while the subthemes ”Equity”, “Employment”, ”Green Economy” and ”Innovation” are only fairly covered.
• On the project level, the ”Prosperity” theme with its subthemes ”Accessibility” and ”Economic Performance” and ”Innovation” is better covered than on the city level, but the theme ”Planet” (especially the subthemes ”Energy and Mitigation”, ”Environment”, ”Resources” and ”Climate Resilience”) and ”People” (especially the subthemes ”Quality of Housing and of the Built Environment”, ”Safety”, “Community” and “Accesss to services”) still have a good coverage. The theme ”Process” is not so well covered. Many of its subthemes like ”Leadership”, ”Co-creation”, ”Project Team”, ”Professional Implementation” and ”Political Climate” have very low scores.
It should be noted that the gap analysis was carried out by linking subthemes (and their associated indicators) of existing frameworks with the subthemes of the CITYkeys framework. This has provided us with a pool of potential indicators per CITYkeys subthemes

CITYkeys ● D1.2 Overview of the Current State of the Art Page 53 of 56
2015-10-28
and first insights regarding gaps. Due to limited time and resources we were however not able to look at each indicator of the existing indicators individually.
8.2 Next steps in T1.3 T1.2 has clustered indicators of existing indicator frameworks according to the themes and subthemes of the newly developed CITYkeys framework. In T1.3, a qualitative evaluation of the indicator will be carried out, leading to a final selection the most suitable indicators per subtheme.
CITYkeys ● D1.2 Overview of the Current State of the Art Page 54 of 56
2015-10-28
9. LITERATURE Caragliu A., Del Bono C & Nijkamp P (2011): Smart Cities in Europe, Journal of Urban Technology,Volume 18, Issue 2, 2011, Special Issue: Creating Smart-er Cities
City Protocol Society (2015): City Anatomy - Definition. Online available at www.cityprotocol.org/protocol/city-anatomy-definition/, 20.09.2015.
Deakin M, Leydesdorff L (2013) The triple helix of smart cities: a neo-evolutionist perspective. In: Deakin M (ed) Smart cities: governing, modelling and analysing the transition. Routledge, Oxon
Deankin, M. (2014) Smart cities: the state-of-the-art and governance challenge. In Triple Helix 2014, 1:7, http://link.springer.com/article/10.1186/s40604-014-0007-9
Etzkowitz H. & Zhou C (2006). Triple Helix twins: innovation and sustainability, Science and PublicPolicy, vol. 33, n°. 1, pp. 77 – 83
European Innovation Partnership on Smart Cities and Communities (2013): Strategic Implementation Plan. Brussels. Online available at http://ec.europa.eu/eip/smartcities/ files/sip_final_en.pdf.
European Innovation Partnership on Smart Cities and Communities (2014): Operational Implementation Plan. Brussels. Online available at http://ec.europa.eu/eip/smartcities/files/operational-implementation-plan-oip-v2_en.pdf
Giffinger R.. et al. (2007): Ranking of European medium-sized cities. Final report, Vienna.: http://www.smart-cities.eu/model.html
Giffinger R, Haindlmaier G & Kramar H (2010) 'The role of rankings in growing city competition', Urban Research & Practice, 3: 3, 299-312: DOI: 10.1080/17535069. 2010.524420
Kontinakis N & DeCunto A (2015): Deliverable 1.1 Overview of the needs of cities and citizens. CITYkeys project. Brussels: Eurocities
Neirotti P et al. (2014): Current trends in Smart City initiatives: Some stylised facts, 06/2014; 38:25–36. DOI: 10.1016/j.cities.2013.12.010
O’Connor M & Spangenberg J (2008): A methodology for CSR reporting: assuring a representative diversity of indicators across stakeholders, scales, sites and performance issues. Journal of Cleaner Production. 09/2008; 16(13):1399-1415. DOI: 10.1016/j.jclepro. 2007.08.005
Ryser J (2014): Planning Smart Cities..Sustainable, Healthy, Liveable, Creative Cities... Or Just Planning Cities? dérive, Zeitschrift für Stadtforschung, no. 56, pp. 10-18
Smeets E & Weterings R. (1999): Environmental Indicators: Typology and Overview. Report No. 25, Copenhagen: European Environment Agency.
Spangenberg J & Bonniot O (1998) Sustainability indicators – A compass on the road towards sustainability. Wuppertal Paper No . 8 1 , February 1998. Wuppertal: Wuppertal Institute
Van Harmelen, Van Horssen, Jongeneel, Keijzer & Ligthart (2012). Development of additional impact categories for environmental assessment of bio-based product systems. TNO report.
VDE Association for electrical, electronic & information technologies (Hg.) (2014): The German Standardization Roadmap Smart City. v1.0. Concept. Frankfurt am Main: VDE

CITYkeys ● D1.2 Overview of the Current State of the Art Page 55 of 56
2015-10-28
VDE Association for electrical, electronic & information technologies (Hg.) (2015): The German Standardization Roadmap Smart City. v1.1. Update. Frankfurt am Main: VDE
Vienna City Administration (2014): Smart City Wien Framework Strategy. Overview. Vienna.
WFSC, cited in Ryer 2014, p. 11
https://ec.europa.eu/digital-agenda http://www.cencenelec.eu/standards/Sectors/SmartLiving/smartcities/Pages/default.aspx
http://www.economist.com/node/14301663
ftp://ftp.cencenelec.eu/EN/EuropeanStandardization/Fields/SmartLiving/City/SSCC-CG_Short_Version_Report_Jan_2015.pdf http://triplehelix.stanford.edu/3helix_concept http://www.examiner.com/images/blog/EXID41999/images/triple_bottom_line.jpg

CITYkeys ● D1.2 Overview of the Current State of the Art Page 56 of 56
2015-10-28
10. APPENDICES Further information is described in related background documents:
Appendix 1: Inventory of Mapped initiatives (D1.2-A1; available to partners in the project intranet).
Appendix 2: Long list of mapped indicators (D1.2-A2; available to partners in the project intranet).