Embed Size (px)
Citation preview

Delineating BorderingVegetated WetlandsUnder the MassachusettsWetlands Protection Act
MA Department of Environmental ProtectionDivision of Wetlands and Waterways

The Commonwealth of MassachusettsWilliam F. Weld, GovernorExecutive Office of Environmental AffairsTrudy Coxe, SecretaryDepartment of Environmental ProtectionThomas B. Powers, Acting CommissionerArleen O’Donnell, Acting Deputy CommissionerEd Kunce, Deputy CommissionerBureau of Resource ProtectionDean Spencer, Acting Assistant CommissionerDivision of Wetlands & WaterwaysCarl F. Dierker, Acting DirectorRobert W. Golledge, Jr., Acting Deputy Director
Delineating Bordering Vegetated WetlandsUnder the Massachusetts Wetlands Protection Act
A Handbook
March 1995
Produced by:Massachusetts Department of Environmental Protection
Division of Wetlands and Waterways
Dept. of EnvironmentalProtectionDivision of Wetlands andWaterwaysOne Winter StreetBoston, MA 02108
Page Design and Layout: Karen Walsh PetersonHandbook Illustrations: Nancy Haver
Marah Loft
Edited by:Karen Walsh Peterson, Project Coordinator
Robert W. Golledge, Jr.Richard Tomczyk
Massachusetts Department of Environmental ProtectionDivision of Wetlands and Waterways
Written by:Scott Jackson
University of MassachusettsDepartment of Forestry and Wildlife Management
Plant illustrations courtesy of Abigail Rorer, from Freshwater Wetlands: A Guide to Common IndicatorPlants of the Northeast by D.W. Magee. 1981. University of Massachusetts Press, Amherst, MA andField Guide to Nontidal Wetland Identification by Ralph Tiner, Jr. 1988. Maryland Department of NaturalResources, Annapolis, MD and USFWS.

The Department of Environmental Protection acknowledges the contributions of themembers of the Wetlands Delineation Advisory Committee in the development of thewetlands protection regulatory revisions, BVW policy, and this handbook:
The Department also acknowledges the contributions of the following reviewers in theproduction of this handbook:
From the Massachusetts Association of Conservation Commissions:Sally Zielinski
From the U.S. Natural Resources Conservation Service:Peter C. Fletcher
From the University of Massachusetts:Curtice Griffin and Peter L.M. Veneman
From the Department of Environmental Protection, Division of Wetlandsand Waterways:
Amy Burke, Charles Costello, Tena Davies, Dan Gilmore,Elizabeth Kouloheras, Nancy Lin, Robert McCollum, GaryMakuch, Phil Nadeau, Ralph Perkins, Wendy Robinson,Elizabeth Sabounjian, James Sprague, Marielle Stone,Michael Stroman, Michael Turgeon, and Lenore White.
Wetlands Delineation Advisory CommitteeGary R. Sanford - Sanford Ecological ServicesPeter L.M. Veneman - University of MassachusettsElizabeth Colburn - Massachusetts Audubon SocietyGarrett Hollands - Frugo East, Inc.Matthew Schweisberg - U.S. Environmental Protection AgencyRobert Gray - Massachusetts Association of Conservation CommissionsMichael Marcus - Massachusetts Association of Conservation CommissionsFrank T. Smigelski - U.S. Army Corps of EngineersMonica Stillman - U.S. Army Corps of EngineersRobert W. Golledge, Jr. - Department of Environmental ProtectionRichard Tomczyk - Department of Environmental ProtectionRobert McCollum - Department of Environmental ProtectionPamela Harvey - Department of Environmental Protection/Office of
General Counsel
This publication is made possible by a grant from the U.S. Environmental ProtectionAgency (Region One), Section 104(b)(3) of the Federal Clean Water Act.

Sources of Information Used in this HandbookThe following sources were used in the compilation of this handbook:
Hydric Soils of New England by R.W. Tiner, Jr. and P.L.M. Veneman. 1987. University ofMassachusetts Cooperative Extension, Amherst, MA. Bulletin C-183.
“Field Recognition and Delineation of Wetlands” and “Problem Wetlands forDelineation” by R.W. Tiner, Jr., in Wetland: Guide to Science, Law, and Technologyby M.S. Dennison and J.F. Berry. 1993. Noyes Publications, Park Ridge, NJ.
National List of Plant Species that Occur in Wetlands: Massachusetts by P.B. Reed, Jr., 1988.U.S. Fish and Wildlife Service, Washington, DC.
The Concept of a Hydrophyte for Wetland Identification by R.W. Tiner, Jr. 1991. BioScience41(4):236-247.
Field Guide for Delineating Wetlands: Unified Federal Method. 1989. Wetland TrainingInstitute, WTI 89-1.
Corps of Engineers Wetlands Delineation Manual by Environmental Laboratory. 1987. U.S.Army Corps of Engineers Waterways Experiment Station, Vicksburg, MS. TechnicalReport Y-87-1.
Hydrologic cycle diagram (page 4) from An Introduction to Groundwater and Aquifers.Groundwater Information Flyer #1. 1983. Massachusetts Audubon Society, Lincoln,MA.
Publication No. 17668 - 102 2000 - 2/95 - 2.75 - C.R.Approved by: Philmore Anderson III, State Purchasing Agent

Delineating Bordering Vegetated Wetlands
Table of Contents
INTRODUCTION ..........................................................................................1
CHAPTER ONE/Hydrology .........................................................................4Surface Water ..................................................................................................................4Groundwater ....................................................................................................................4Anaerobic Conditions .......................................................................................................5Indicators of Hydrology ....................................................................................................5
CHAPTER TWO/Wetland Vegetation .........................................................6Plant Classification ..........................................................................................................6Wetland Indicator Plants ..................................................................................................8Assessing Vegetative Communities .................................................................................9Measuring Plant Abundance ..........................................................................................10Vegetative Community Analysis: The Dominance Test ..................................................14The Dominance Test Procedure (with examples) ..........................................................15The Dominance Test Procedure Summary ....................................................................19
CHAPTER THREE/Delineation Criteria ...................................................20When vegetation alone may be used for delineating BVWs (and hydrology is presumed to be present) ..............................................................20When vegetation and hydrology should be used for delineating BVWs.......................................................................21
CHAPTER FOUR/Indicators of Wetland Hydrology ...............................22Soils Introduction ...........................................................................................................22Hydric Soil ......................................................................................................................27Hydric Soil Indicators .....................................................................................................29Soils that are Difficult to Analyze ...................................................................................30Procedure for Evaluating Soils ......................................................................................32Other Indicators of Hydrology ........................................................................................34

Delineating Bordering Vegetated Wetlands
CHAPTER FIVE/Delineating and Reviewing BVW Boundaries ............38Preparing for the Site Visit .............................................................................................38Delineating BVW Boundaries .........................................................................................40Procedure where vegetation alone is presumed to yield an accurate boundary (hydrology presumed to be present) ......................................41Procedure for using vegetation and hydrology (soil as an indicator of hydrology) to determine the BVW boundary.......................................44Delineating BVWs where hydrology or vegetation has been altered .............................48Winter Delineations ........................................................................................................49Reviewing Boundary Delineations .................................................................................50
APPENDIX A .............................................................................................52Wetland Indicator Plants Identified in the MAWetlands Protection Act (M.G.L. c. 131, §40)
APPENDIX B .............................................................................................53Measuring Basal Area
APPENDIX C .............................................................................................55Additional Examples of VegetationAnalysis Using the Dominance Test
APPENDIX D .............................................................................................69Glossary
APPENDIX E .............................................................................................75Resources
APPENDIX F..............................................................................................78Wetlands Conservancy Program Mapping Products
APPENDIX G .............................................................................................79DEP Field Data Form and Instructions
APPENDIX H .............................................................................................83Contact Information
Appendix I .................................................................................................87Wetlands Protection Regulations (310 CMR 10.55)
* Note: Appendix I is not included in this version of the Delineating Bordering Vegetated Wetlands. 310CMR 10.55 can be found in our Wetlands Protection Regulations at www.state.ma.us/dep

Introduction
Delineating Bordering Vegetated Wetlands 1
INTRODUCTION
Conservation commissioners in Massachusetts have a unique knowledge of the locallandscape and the important functions that wetlands provide in their community, such asflood control and wildlife habitat. As a result, commissioners play an important role inprotecting these wetland resource areas because their knowledge is incorporated into thepermitting process at the local level.
In fact, the majority of permitting requirements under the Wetlands Protection Act (“TheAct,” Massachusetts General Laws, Chapter 131, Section 40) are administered byconservation commissions. For this reason, the Department of Environmental Protection(DEP) and its Division of Wetlands and Waterways (DWW) are committed to providingcommissions with the training and tools necessary to implement the Act. The first andoften the most important step in protecting wetlands is identifying their location in thefield.
Freshwater wetlands bordering on creeks, rivers, streams, ponds, or lakes are protected bythe Act. Four wetland types are identified in the Act: bogs, swamps, marshes, and wetmeadows. Generally, these are areas where groundwater is at or near the surface, orwhere surface water frequently collects for a significant part of the growing season, andwhere a significant part of the vegetative community is made up of plants adapted to lifein saturated soil. The ground and surface water conditions and plant communities whichoccur in each of these wetland types are specified in the Act. Hydrology (water) andvegetation (plants) are the two characteristics that define freshwater wetlands protectedby the Act.
Bogs, swamps, marshes, and wet meadows that border on water bodies are defined in theWetlands Protection Act regulations (310 Code of Massachusetts Regulations 10.55) asBordering Vegetated Wetlands (BVWs). The regulations define BVWs as areas wherethe soils are saturated or inundated such that they support plants that are adapted toperiodically wet conditions.
BVWs provide important benefits to landowners and the general public. These benefitsinclude: protection of public and private water supply, protection of groundwater supply,flood control, storm damage prevention, prevention of pollution, protection of fisheries,and protection of wildlife habitat. Proper identification and delineation of BVWs areessential to preserve the important functions and values they provide.

Introduction
2 Delineating Bordering Vegetated Wetlands
BVW Regulation & PolicyIn 1995, DEP revised its regulations to provide a more scientifically-based definition anddelineation procedure for BVWs that incorporates hydrology into the boundary determi-nation. The revised definition and procedures contained in this handbook are consistentwith the Act. The new regulations define wetland indicator plants, specify when delinea-tions may be based on vegetation alone, and clarify when vegetation and indicators ofhydrology should be used to delineate the BVW boundary. The new regulations alsoprovide greater consistency between the state’s Wetlands Protection Program and 401Water Quality Certification Program, which is administered by the Division of Wetlandsand Waterways using regulations at 314 CMR 9.00. The BVW regulatory revisions (310CMR 10.55) become effective June 30, 1995.
Wetlands Protection Program Policy: Bordering Vegetated Wetlands Delineation Criteriaand Methodology recommends a procedure for vegetation analysis and provides guidanceto applicants and conservation commissions on how to delineate the boundary of a BVW.The definitions and procedures provided in the new regulations and policy are intended toprovide greater consistency in BVW delineation statewide.
Handbook ContentsSince the overall success of wetlands protection efforts relies on accurately identifyingwetlands, DEP has developed this handbook. The handbook provides backgroundinformation on wetland processes and the regulatory framework, procedures for delineat-ing BVW boundaries, and recommendations for reviewing boundary delineationspresented to conservation commissions. This handbook also provides a field data formfor delineations (see Appendix G).
Chapter One introduces wetland hydrology as the driving force that creates and main-tains wetlands. The physical and chemical conditions that are caused by frequentsaturation are discussed. The characteristics of wetland soils and vegetation that makethem important wetland indicators also are presented.
Chapter Two discusses wetland vegetation. This chapter covers plant classification,methods of measuring plant abundance, and procedures for assessing vegetative commu-nities, primarily the dominance test.
Chapter Three presents delineation criteria. In particular, information is provided onwhen vegetation alone may be used to delineate BVWs and when vegetation and hydrol-ogy should both be used.
Chapter Four discusses various indicators of hydrology and how to recognize them inthe field. A large part of this chapter deals with soils - a reliable indicator of wetlandhydrology. Procedures for evaluating soils are included. Other indicators of hydrology,such as water marks and water-stained leaves, also are discussed.
Chapter Five describes procedures for delineating BVWs in the field. Procedures areprovided for boundary delineations based on vegetation alone, as well as delineations thatuse vegetation and hydrology (with soils as a reliable indicator of hydrology). Thischapter also provides recommendations for reviewing delineations.
Appendices are included at the end of this handbook, providing resource information andexamples of how vegetation analyses are used to evaluate plant communities. Alsoincluded is a glossary of terms.

Introduction
Delineating Bordering Vegetated Wetlands 3
In many cases, BVW delineation is relatively simple, and can be accomplished withoutdetailed measurements and calculations. Where an abrupt change in plant communitiesand slope occurs, delineations may be done visually, using vegetation and topography todetermine the BVW boundary. More complex sites may require the use of soil indicatorsor other evidence of hydrology, along with an analysis of vegetative communities, todetermine BVW boundaries. To select delineation procedures that are appropriate for aparticular site, it is important to become familiar with wetland indicators and how they
are used to delineate BVWs.
This handbook provides a great deal of information about BVW delineation. Much of itis background information intended to help foster greater understanding of the processesthat produce wetland indicators and how those indicators may be used to determine BVWboundaries. Procedures are presented as step-by-step instructions with numerousgraphics and examples. The best way to become familiar with these procedures is to usethem in the field.
Summary

Hydrology
4 Delineating Bordering Vegetated Wetlands
CHAPTER ONEHydrology
The properties, distribution, and circulation of water is commonly referred to as hydrol-ogy. Wetland hydrology refers to the movement of water within and through a wetland.Hydrologic features such as the frequency, timing, depth and duration of inundation,water table fluctuations, and the movement of ground and surface water are the drivingforces behind all wetland systems.
Water in a wetland may be surface water, groundwater, or a combination of the two.Both surface water and groundwater may lead to saturated conditions that after a lengthof time will create wetlands. Saturation occurs when the soil has all or most of its poreswithin the root zone filled with water.
Surface WaterInundation is the ponding of surface water runoff or flooding from adjacent waterbodies. The surface water may infiltrate into the ground, a process called percolation.Periodic and lengthy inundation creates saturated conditions.
GroundwaterGroundwater is often found at or near the ground surface during the wetter seasons ofthe year. The water table is a term that is commonly used to describe the upper limit ordepth below the surface of the ground that is completely saturated with water. Thewater table can fluctuate throughout the year so that saturated conditions may beseasonally present.
Groundwater also occurs in areas of soil above the water table due to capillary action, aprocess where water is drawn up through pores in the soil. This area of nearly saturatedsoil above the water table (which is a couple of inches thick or thicker) is called thecapillary fringe. Wetland conditions may develop in areas where groundwater occurs ator near the surface during the growing season, even if water is not visible at the surface.
The hydrologic cycle Source: Massachusetts Audubon Society, 1983.

Hydrology
Delineating Bordering Vegetated Wetlands 5
Anaerobic ConditionsSoils that are saturated during the growing season, either due to a high water table orinundation by surface water, develop conditions where no oxygen is readily available foruse by plants and microbes. These are known as anaerobic conditions. Under saturatedconditions, plants and microbes use available oxygen faster than it is replaced. The rateat which oxygen is depleted depends on the amount of biological activity in the soil.Biological activity, in turn, is affected by soil temperature and the amount of organicmatter in the soil. The presence of anaerobic conditions is essential for wetland devel-opment.
Growing SeasonIt is not just the presence of saturation and anaerobic conditions, but the presence ofthese conditions during the growing season, that is important. The growing season isthe part of the year when soil temperatures are high enough to support biologicalactivity (above biological zero or 41 degrees Fahrenheit, 4 degrees centigrade). InMassachusetts, the growing season generally extends from March to November.
Water can be present for relatively long periods of time during the winter withouthaving a significant impact on plants or soils. This is because there is little biologicalactivity in the soil during the colder months of the year. Soils that are saturated orinundated during the winter may never become anaerobic; or if they do, plants may bedormant and therefore not affected by anaerobic conditions. During the growing season,however, wetland soils can become anaerobic after a relatively brief period of saturationor inundation.
Length of SaturationThe length of saturation needed to produce anaerobic conditions varies among wetlandsand is dependent, in part, on soil type. As a general rule, anaerobic conditions candevelop in as little as 7 to 21 days of saturation during the growing season. Theseanaerobic conditions during the growing season produce plant communities and soilcharacteristics in wetlands that differ from plants and soils in uplands. Plants that areable to tolerate anaerobic conditions in the soil generally grow in wetlands. Differentplants are adapted to longer or shorter periods of inundation or saturation, but all haveadaptations that allow them to cope with regular periods of saturation. These plantsmay be referred to as hydrophytes.
Indicators of HydrologyAlthough water is the driving force behind wetlands, it is not always possible to directlyobserve hydrology or use it to delineate BVW boundaries. Inundated or saturatedconditions may only be present in a wetland for a short period of time during the year,and even this pattern is subject to climatic conditions that can produce very wet or verydry years. Even if hydrology is monitored in an area, it can be difficult to equate thepatterns of inundation or saturation with the presence or absence of anaerobic condi-tions. Soil characteristics and plant communities generally are present throughout theyear and are the most reliable indicators of hydrologic conditions.
Since the presence of wetland plants (hydrophytes) and wetland soils (hydric soils) arethe most reliable indicators of the hydrology of an area, under natural conditions theyare more useful for delineating BVW boundaries than hydrology itself. Other features,such as water marks on trees and water-stained leaves, also are indicators of hydrology.However, it is often difficult to determine the duration or frequency of saturation fromthese indicators. DEP recommends that all available information be used when evaluat-ing hydrology.

Wetland Vegetation
6 Delineating Bordering Vegetated Wetlands
CHAPTER TWOWetland Vegetation
Wetlands range in wetness from areas that are permanently flooded to those that areonly saturated or inundated for relatively brief times during the growing season. Plantshave evolved adaptations for life in a wide range of wet conditions resulting in plantspecies that demonstrate varying degrees of affinity for wet habitats. Although somespecies grow only in habitats that are wet year-round, most wetland plants are able totolerate a range of hydrologic conditions and may occur in uplands as well as wetlands.Plant species that typically occur in wetlands and generally are good indicators ofwetland hydrology are considered “wetland indicator plants.”
Plant ClassificationAll plants, whether wetland or upland, are classified according to their natural relation-ships and genealogy, and are organized into various groups (Kingdom, Division,Subdivision, Order, Family, Genus, Species). These groups range from broad (King-dom) to narrow (Species). A scientific name is given to plants that would producesimilar offspring. The scientific name includes the genus name and the species name.In the case of the plant winterberry, Ilex is the genus name and verticillata is the speciesname. Plants also have common names. However, a common name is not as reliable alabel to use since one plant may have more than one common name, or a common namemay be used to identify different plants. For example, a plant that has one scientificname, Ilex verticillata, may have more than one common name; in this case, winter-berry also may be called black alder. Under this classification system, plants also aregrouped into families. Ilex verticillata is a member of the holly family (Aquifoliaceae).To avoid confusion, the scientific name of a plant should be used when describing theplants present at a site.
The U.S. Fish and Wildlife Service’s National List of Plant Species That Occur inWetlands (Reed, 1988) is a comprehensive list that was assembled by scientists from theU.S. Fish and Wildlife Service (USFWS), Environmental Protection Agency (EPA),Army Corps of Engineers (COE), and Natural Resources Conservation Service (NRCS),with the help of regional botanists and ecologists. The National List uses a commonname and the scientific name for each plant and classifies each plant based on thefrequency or the percentage of time that it is found in wetland versus upland conditions.The plants are assigned to one of five major categories (called indicator category) basedon their frequency of occurrence in wetlands versus uplands. According to the wetlandsregulations (310 CMR 10.55), any plant in the National List with an indicator categoryof Obligate, Facultative Wetland, or Facultative are wetland indicator plants. Plants inthe National List also are categorized according to their national and regional indicatorcategory. For delineating BVWs in Massachusetts, the indicator category from theMassachusetts list should be used.
Plants species that almost always grow in saturated or inundated conditions during thegrowing season (>99% of the time) are classified as obligate wetland species (alsocalled “obligate” species and abbreviated OBL). Examples include skunk cabbage(Symplocarpus foetidus), broadleaf cattail (Typha latifolia), and buttonbush(Cephalanthus occidentalis).
Skunk cabbage(Symplocarpus foetidus)OBL

Wetland Vegetation
7Delineating Bordering Vegetated Wetlands
multiflora rose(Rosa multiflora)FACU
Species that are tolerant of flooding or saturation during the growing season and areadapted to live in a variety of wet or dry conditions are assigned to one of three faculta-tive categories, depending on how frequently they are observed in wetlands.
Facultative wetland plants usually occur in wetlands (67-99% of the time), but areoccasionally found in uplands. These are typically referred to as “fac-wet” species(abbreviated FACW). Examples include silver maple (Acer saccharinum), speckledalder (Alnus rugosa), and sensitive fern (Onoclea sensibilis).
Facultative plants sometimes occur in wetlands (34-66% of the time), although theymay be equally likely to occur in uplands. These are typically referred to as “fac”species (abbreviated FAC). Examples include yellow birch (Betula alleghaniensis),sheep laurel (Kalmia angustifolia), and interrupted fern (Osmunda claytoniana).
Facultative upland plants usually occur in uplands and are seldom found in wetlands(1-33% of the time). These are typically referred to as “fac-up” species (abbreviatedFACU). Examples include red oak (Quercus rubra), princess pine (Lycopodiumobscurum), and multiflora rose (Rosa multiflora).
Plants that rarely occur in wetlands (have less than a one percent probability of occur-ring in wetlands) are considered upland species (abbreviated UPL). Any plants notincluded in the National List are considered upland plants.
The FACW, FAC, and FACU categories are further refined by the addition of a “+” or“-” sign to more specifically define the regional frequency of occurrence in wetlands. A“+” sign indicates a frequency toward the wetter end of the category (more frequentlyfound in wetlands). A “-” sign indicates a frequency toward the drier end of thecategory (less frequently found in wetlands).
USFWS Indicator Categories
Occurrence In Wetlands
Category Abbreviation Descriptor Frequency in Wetlands
Obligate wetland OBL almost always > 99%Facultative wetland FACW usually 67-99%Facultative FAC equally likely to occur 34-66%Facultative Upland FACU seldom 1-33%Upland UPL rarely < 1%
sheep laurel(Kalmiaangustifolia)FAC
speckled alder(Alnus rugosa)FACW+

Wetland Vegetation
8 Delineating Bordering Vegetated Wetlands
Wetland Indicator PlantsAs previously described, plant species that typically occur in wetlands and generally aregood indicators of wetland hydrology are considered “wetland indicator plants.” Wetlandindicator plants are defined in the wetlands protection regulations as any of the following:
1. Plant species listed in the Wetlands Protection Act (see Appendix A).The Wetlands Protection Act lists plants by a common name and one of the follow-ing: family name, genus name, or species name. (Note: the species name, also knownas the scientific name, is made up of the genus and species.) The list in the Act isgeneral and is not meant to include all plants that occur in wetlands. Also, someplants are listed only by family or genus. These are broad categories that includewetland plants as well as non-wetland plants. For instance, the family Juncaceae iscomprised of many rushes of which only some are wetland indicator plants. Also,the genus Fraxinus (ashes) includes wetland plant species (green ash, Fraxinuspennsylvanica; black ash, Fraxinus nigra), as well as a non-wetland plant (whiteash, Fraxinus americana). As a result, DEP has determined that the plants listed inthe Act only by scientific name (plants with a genus and species name) are consid-ered wetland indicator plants. Plants listed in the Act by family or genus only mustalso meet criterion #2 below to be considered wetland indicator plants. In addition,all plants in the genus Sphagnum are considered wetland indicator plants(species in this genus have not yet been categorized by indicator category).
2. Plants listed in the National List with an indicator category of OBL, FACW+,FACW, FACW-, FAC+, and FAC.
3. Individual plants that exhibit morphological or physiological adaptations to lifein saturated or inundated conditions. Morphological adaptations are evident inthe form or shape of a plant, such as shallow root systems (see page 36). Physi-ological adaptations are related to a plant’s metabolism and generally are notobservable without the use of specific equipment or tests. Plants with indicatorcategories of UPL, FACU, or FAC- that exhibit adaptations to life in saturatedconditions can be considered wetland indicator plants (i.e., White pine, Pinusstrobus, FACU, with buttressed trunks and shallow roots).
Only plants that meet these criteria should be considered wetland indicator plants.
Plant IdentificationPlant identification is an important aspect of reviewing or delineating BVW boundaries.In addition to being able to identify a number of wetland indicator plants, it is alsoimportant to be able to recognize them at different times of the year. In winter, twigsand buds possess important characteristics that aid in the identification of woody plants.Many herbaceous plants die back during the winter and are unavailable for identifica-tion. In the spring, it is important to be able to identify the early growth stages ofplants, such as the fiddleheads of ferns or the flowers of skunk cabbage (Symplocarpusfoetidus). During the growing season, leaves, flowers, fruits, nuts, catkins, and seedsare available for inspection. Some plants, such as grassesand sedges, can only be identified when they are in floweror when seeds are present.
A variety of field guides are available to help with identifi-cation. Some focus on particular plant groups, such asferns, grasses, trees, or shrubs. Others contain keys(identification guides) to various characteristics of plants(twigs, fruit, leaves, flowers). Although it is useful to beable to recognize common plants in the field, it is also important to learn how to usefield guides to identify plants (see Appendix E for a list of recommended field guides).

Wetland Vegetation
9Delineating Bordering Vegetated Wetlands
Assessing Vegetative CommunitiesAlthough the ability to identify individual plant species is an important skill, it is alsoimportant to consider the plant community when reviewing or delineating BVWboundaries. The Wetlands Protection Act specifies that a “significant part of thevegetational community” must be made up of wetland plants. The wetlands protectionregulations define Bordering Vegetated Wetlands as areas where 50 percent or more ofthe vegetative community consists of wetland indicator plants. Therefore, “significantpart” means “50 percent or more.” In order to evaluate whether there are 50 percent ormore wetland plants in an area, it is necessary either to estimate or measure theirabundance.
In many cases, vegetative communities can be assessed without using a specific assess-ment methodology. If the wetland/upland boundary is abrupt or discrete, a simple walkthrough a site may be used to characterize communities as either wetland or upland. Inother cases, such as where there are large transition zones or gently sloping topography,the use of a more detailed delineation procedure, including a method for assessingvegetative communities, will be needed.
DEP uses the following methodology in reviewing delineations, and recommends its useby applicants and conservation commissioners when detailed measurements andcalculations are needed. DEP also has developed a field data form to document siteinformation when determining a BVW boundary.
DEP Field Data FormThe DEP field data form should be submitted with a Request for Determination ofApplicability or Notice of Intent. The field data form and instruction sheet are includedin Appendix G. The form is compatible with the methodologies described in thishandbook. Information on the site’s vegetation and hydrology can be recorded. Thesection on vegetation allows the delineator to document plants that make up a significantportion of the vegetative community and whether any of the non-wetland indicatorplants have special adaptations that would make them wetland indicator plants.
The field data form also includes a section on hydrology. In this section, informationabout observed hydrologic conditions (flooded conditions or groundwater) and any otherindicators of hydrology, such as hydric soils, can be recorded.
By using the data form, site information can be presented in a standard format. Thedelineator can describe the conditions which led to his or her conclusion that the site isa BVW or not. The reviewer can use the form to prepare to inspect the boundary in thefield. For instance, if a reviewer is unfamiliar with a plant or an indicator of hydrology,reference materials such as field guides can be consulted before the field assessment.

Wetland Vegetation
10 Delineating Bordering Vegetated Wetlands
Measuring Plant Abundance
Vegetative LayersPlants within vegetative communities are divided into strata, or layers, for analysis.Five layers are used in this assessment: ground cover, shrub, sapling, climbing woodyvine, and tree.
The ground cover layer includes woody vegetationless than 3 feet in height (seedlings), non-climbingwoody vines less than 3 feet in height, and all non-woody vegetation (herbs and mosses) of any height.(See dark areas in illustration.)
Shrubs are woody vegetation greater than or equal to3 feet, but less than 20 feet in height. (See dark areasin illustration.)
The sapling layer includes woody vegetation over 20feet in height with a diameter at breast height (dbh)greater than or equal to 0.4 inches to less than 5inches. Diameter at breast height is measured 4.5 feetfrom the ground. (See dark areas in illustration.)
Trees are woody plants with a dbh of 5 inches orgreater and a height of 20 feet or more. (See darkareas in illustration.)
Note: climbing woody vines are a separate vegetative layer.

Wetland Vegetation
11Delineating Bordering Vegetated Wetlands
Observation PlotsObservation plots are used for measuring or estimating plant abundance. The number ofplots should be based on the complexity of the site. Plots generally should be located invegetative communities that are not clearly wetland or upland. Plot locations should bechosen so that the vegetation within the plot is representative of the vegetation within thecommunity as a whole. Circular plots with the following dimensions are recommended:
Circular plot dimensions:
Ground cover: 5 foot radiusShrubs: 15 foot radiusSaplings: 15 foot radiusClimbing woody vines: 30 foot radiusTrees: 30 foot radius
However, plot size and shape may be varied when site conditions warrant. Plot locationsmay need to be adjusted to ensure that the vegetative layer being sampled is representa-tive of the plant community.
At the site, do a quick check of the vegetation and identify the layers involved. Whenchoosing your plots, be sure that the vegetation in your sample is representative of thevegetation in that layer as a whole. From a central location (using a tape measure),measure circular plots to the size noted for each layer. Tie flags in the vegetation tomark the boundaries of your circular plots.
As you become more comfortable and experienced doing this analysis, you will be ableto estimate plot sizes. You should begin your assessment with the ground cover layer (ifpresent) before you trample the vegetation. With the observation plots marked, you cannow evaluate plant abundance for each layer and species in the plot using percent cover.
Plot locations may need to be adjustedto reflect site conditions, such as in thecase of an oblong wetland.
Standard circular plots
15’ 30’5’
Ground Cover
Saplings,Shrubs
Trees
Climbing Woody Vines
Wetland Vegetation
12 Delineating Bordering Vegetated Wetlands
Percent CoverPercent cover is a simple method for evaluating plant abundance and can be used for alllayers (ground cover, shrub, sapling, climbing woody vine, and tree). Basal area alsomay be used to evaluate tree abundance (see Appendix B). Percent cover is the percentof the ground surface that would be covered if the foliage from a particular species orlayer were projected onto the ground, ignoring small gaps between the leaves andbranches. Foliage from different individual plants in the same layer can overlap, and asa result, total percent cover may exceed 100 percent.
Percent cover can be estimated visually or it can be measured using techniques such asthe point-intercept or quadrat sampling methods (for more information about thesetechniques, consult the 1989 Federal Manual for Identifying and Delineating Jurisdic-tional Wetlands). For many sites, however, a visual estimation of percent cover mayyield an accurate result. The accuracy should improve as you become more familiarwith the method.
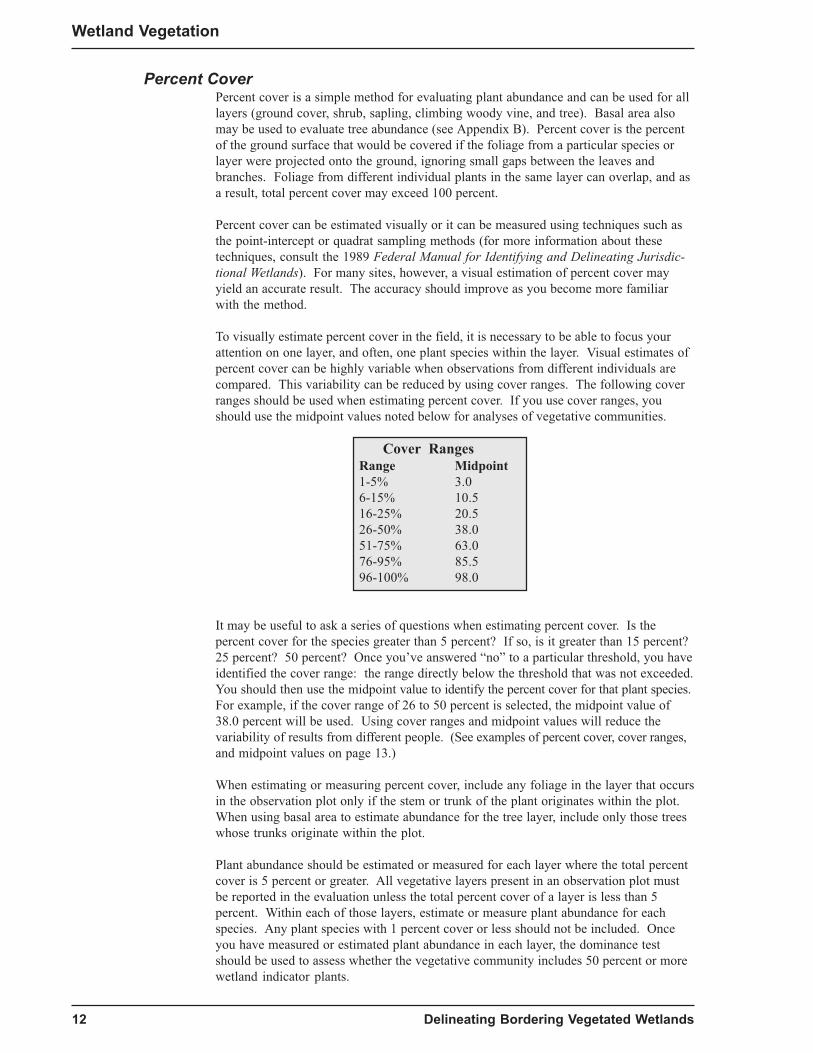
To visually estimate percent cover in the field, it is necessary to be able to focus yourattention on one layer, and often, one plant species within the layer. Visual estimates ofpercent cover can be highly variable when observations from different individuals arecompared. This variability can be reduced by using cover ranges. The following coverranges should be used when estimating percent cover. If you use cover ranges, youshould use the midpoint values noted below for analyses of vegetative communities.
Cover RangesRange Midpoint1-5% 3.06-15% 10.516-25% 20.526-50% 38.051-75% 63.076-95% 85.596-100% 98.0
It may be useful to ask a series of questions when estimating percent cover. Is thepercent cover for the species greater than 5 percent? If so, is it greater than 15 percent?25 percent? 50 percent? Once you’ve answered “no” to a particular threshold, you haveidentified the cover range: the range directly below the threshold that was not exceeded.You should then use the midpoint value to identify the percent cover for that plant species.For example, if the cover range of 26 to 50 percent is selected, the midpoint value of38.0 percent will be used. Using cover ranges and midpoint values will reduce thevariability of results from different people. (See examples of percent cover, cover ranges,and midpoint values on page 13.)
When estimating or measuring percent cover, include any foliage in the layer that occursin the observation plot only if the stem or trunk of the plant originates within the plot.When using basal area to estimate abundance for the tree layer, include only those treeswhose trunks originate within the plot.
Plant abundance should be estimated or measured for each layer where the total percentcover is 5 percent or greater. All vegetative layers present in an observation plot mustbe reported in the evaluation unless the total percent cover of a layer is less than 5percent. Within each of those layers, estimate or measure plant abundance for eachspecies. Any plant species with 1 percent cover or less should not be included. Onceyou have measured or estimated plant abundance in each layer, the dominance testshould be used to assess whether the vegetative community includes 50 percent or morewetland indicator plants.

Wetland Vegetation
13Delineating Bordering Vegetated Wetlands
Examples of Percent Cover, Cover Ranges, and Midpoint Values
3% cover or1-5% cover range(use 3.0 midpoint value)
12% cover or6-15% cover range(use 10.5 midpoint value)
32% cover or26-50% cover range(use 38.0 midpoint value)
58% cover or51-75% cover range(use 63.0 midpoint value)
68% cover or51-75% cover range(use 63.0 midpoint value)
83% cover or76-95% cover range(use 85.5 midpoint value)
The following are examples of percent cover estimates with the associated coverrange and midpoint value noted.

Wetland Vegetation
14 Delineating Bordering Vegetated Wetlands
Vegetative Community Analysis:The Dominance Test
DEP recommends the use of the dominance test to verify or delineate BVW boundaries.The dominance test should be used to determine whether wetland indicator plants makeup 50 percent or more of the vegetative community. The dominance test is a samplingtechnique that uses dominant plants within an observation plot to determine if the plot isa wetland or an upland. The test uses only the dominant plants in an observation plotsince the dominant plants directly influence the composition of the remainder of thevegetation. However, the dominance test can be used to characterize the entire plantcommunity in an observation plot. By identifying the dominant plants and whether theyare wetland indicator plants, the vegetative community within an observation plot canbe determined to be wetland or upland. If the number of wetland indicator plants isequal to or greater than the number of non-wetland indicator plants, the observation plotis in a wetland plant community.
The dominance test determines a plant species' dominance by evaluating percent cover.Information on percent cover is recorded for all plant species in each vegetative layer(ground cover, shrub, sapling, climbing woody vine, tree) present in the observationplot, but only for those layers with total percent cover greater than 5 percent. Basal areamay be used instead of percent cover for identifying dominant plants in the tree layer(see Appendix B). Once dominant plants have been identified in each layer, they can becombined for purposes of the dominance test even if basal area is used for trees andpercent cover is used for the other layers (see Example #1 in Appendix C). Dominantplants within each layer are recorded and classified as being either wetland indicatorplants or non-wetland indicator plants.
The dominance test is less rigorous than other sampling techniques and can be per-formed fairly rapidly with practice. It is a method that generally yields good results.Conservation commissioners can apply the dominance test as a quick check in the fieldby visually identifying dominant plants in an area (without detailed estimates ormeasurements) and then determining whether 50 percent or more of the dominantplants are wetland indicator plants.
Other methods of vegetative community analysis are available and may be appropriatefor use where site conditions are atypical or when rigorous documentation is required.In situations where reliance on dominant species would not adequately characterize thevegetation of an area, or where the dominance test yields inconclusive results, use of amore rigorous analysis may be advisable. At the discretion of the conservation commis-sion or DEP, other methods may be used instead of the dominance test. Applicants whouse methods other than the one recommended by DEP should provide a written explana-tion for using an alternative method and a description of how the methodology is used.
Wetland Vegetation
15Delineating Bordering Vegetated Wetlands
The Dominance Test Procedure (with examples)
1. Evaluate percent cover: For each observation plot do the following (basal areaalso may be used for the tree layer):
a. Determine how many of the vegetative layers (ground cover, shrub, sapling,climbing woody vine, tree) have a total percent cover of 5 percent or morewithin the observation plot. Only those layers with a total percent cover of 5percent or greater are to be used.
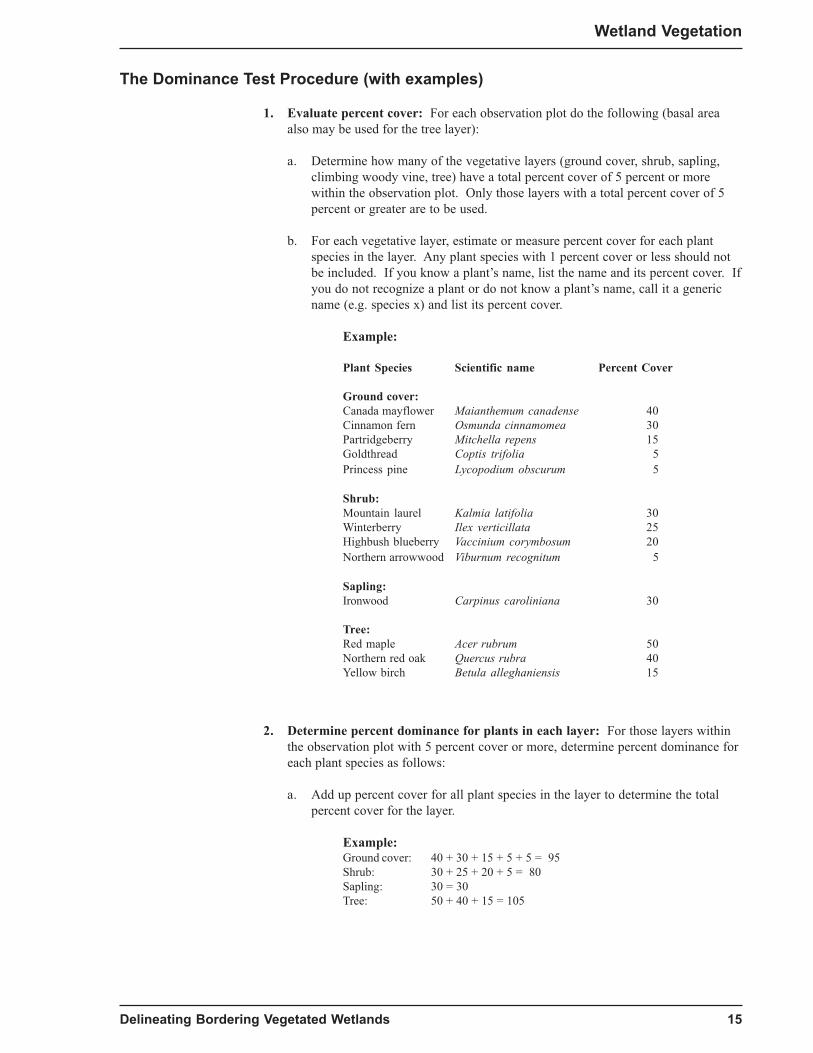
b. For each vegetative layer, estimate or measure percent cover for each plantspecies in the layer. Any plant species with 1 percent cover or less should notbe included. If you know a plant’s name, list the name and its percent cover. Ifyou do not recognize a plant or do not know a plant’s name, call it a genericname (e.g. species x) and list its percent cover.
Example:
Plant Species Scientific name Percent Cover
Ground cover:Canada mayflower Maianthemum canadense 40Cinnamon fern Osmunda cinnamomea 30Partridgeberry Mitchella repens 15Goldthread Coptis trifolia 5Princess pine Lycopodium obscurum 5
Shrub:Mountain laurel Kalmia latifolia 30Winterberry Ilex verticillata 25Highbush blueberry Vaccinium corymbosum 20Northern arrowwood Viburnum recognitum 5
Sapling:Ironwood Carpinus caroliniana 30
Tree:Red maple Acer rubrum 50Northern red oak Quercus rubra 40Yellow birch Betula alleghaniensis 15
2. Determine percent dominance for plants in each layer: For those layers withinthe observation plot with 5 percent cover or more, determine percent dominance foreach plant species as follows:
a. Add up percent cover for all plant species in the layer to determine the totalpercent cover for the layer.
Example:Ground cover: 40 + 30 + 15 + 5 + 5 = 95Shrub: 30 + 25 + 20 + 5 = 80Sapling: 30 = 30Tree: 50 + 40 + 15 = 105
Wetland Vegetation
16 Delineating Bordering Vegetated Wetlands
Dominance Procedure (continued)
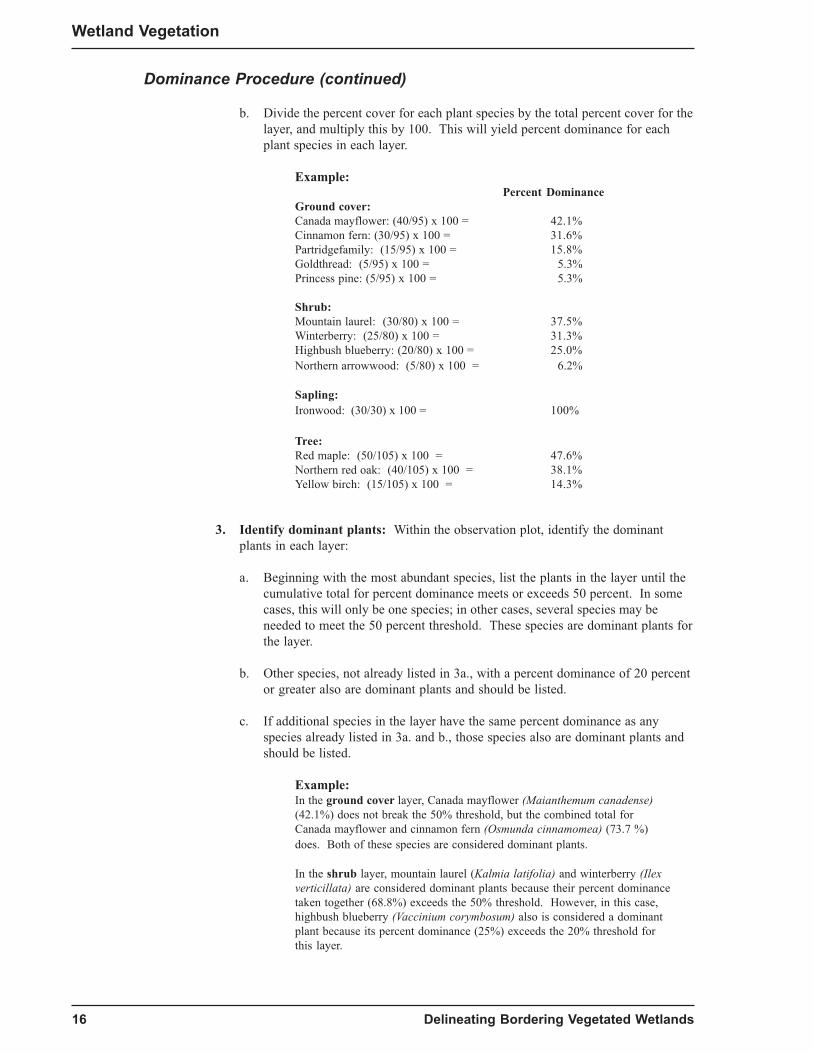
b. Divide the percent cover for each plant species by the total percent cover for thelayer, and multiply this by 100. This will yield percent dominance for eachplant species in each layer.
Example:Percent Dominance
Ground cover:Canada mayflower: (40/95) x 100 = 42.1%Cinnamon fern: (30/95) x 100 = 31.6%Partridgefamily: (15/95) x 100 = 15.8%Goldthread: (5/95) x 100 = 5.3%Princess pine: (5/95) x 100 = 5.3%
Shrub:Mountain laurel: (30/80) x 100 = 37.5%Winterberry: (25/80) x 100 = 31.3%Highbush blueberry: (20/80) x 100 = 25.0%Northern arrowwood: (5/80) x 100 = 6.2%
Sapling:Ironwood: (30/30) x 100 = 100%
Tree:Red maple: (50/105) x 100 = 47.6%Northern red oak: (40/105) x 100 = 38.1%Yellow birch: (15/105) x 100 = 14.3%
3. Identify dominant plants: Within the observation plot, identify the dominantplants in each layer:
a. Beginning with the most abundant species, list the plants in the layer until thecumulative total for percent dominance meets or exceeds 50 percent. In somecases, this will only be one species; in other cases, several species may beneeded to meet the 50 percent threshold. These species are dominant plants forthe layer.
b. Other species, not already listed in 3a., with a percent dominance of 20 percentor greater also are dominant plants and should be listed.
c. If additional species in the layer have the same percent dominance as anyspecies already listed in 3a. and b., those species also are dominant plants andshould be listed.
Example:In the ground cover layer, Canada mayflower (Maianthemum canadense)(42.1%) does not break the 50% threshold, but the combined total forCanada mayflower and cinnamon fern (Osmunda cinnamomea) (73.7 %)does. Both of these species are considered dominant plants.
In the shrub layer, mountain laurel (Kalmia latifolia) and winterberry (Ilexverticillata) are considered dominant plants because their percent dominancetaken together (68.8%) exceeds the 50% threshold. However, in this case,highbush blueberry (Vaccinium corymbosum) also is considered a dominantplant because its percent dominance (25%) exceeds the 20% threshold forthis layer.

Wetland Vegetation
17Delineating Bordering Vegetated Wetlands
Dominance Procedure (continued)
Example continued:In the sapling layer, ironwood (Carpinus caroliniana) is the only speciespresent. The total percent cover for the layer (30%) exceeds 5%, thereforethe layer is included. Ironwood is considered a dominant plant since itspercent dominance (100%) exceeds the 50% threshold.
In the tree layer, the two most abundant species are considered dominantplants, red maple (Acer rubrum) and Northern red oak (Quercus rubra).The most abundant plant alone, red maple (47.6%), does not meet or exceedthe 50% threshold, but the combined percent dominance of the two mostabundant species does, red maple and Northern red oak (85.7%).
d. Those plants that meet a., b., and c. above are dominant plants for the layer.Identify the scientific name and indicator category for all dominant plants. Theindicator category is taken from the National List of Plant Species That Occurin Wetlands: 1988 - Massachusetts.
Example:
Dominant Plants Scientific name Wetland IndicatorCategory
Ground cover:Canada mayflower Maianthemum canadense FAC-Cinnamon fern Osmunda cinnamomea FACW
Shrub:Mountain laurel Kalmia latifolia FACUWinterberry Ilex verticillata FACW+Highbush blueberry Vaccinium corymbosum FACW-
Sapling:Ironwood Carpinus caroliniana FAC
Tree:Red maple Acer rubrum FACNorthern red oak Quercus rubra FACU-
4. Determine whether the plant community is wetland or upland:
a. List the dominant plants (from 3a., 3b., and 3c. above) for all layers beingevaluated. A given species may appear more than once on this list, if it is adominant plant in more than one layer.
Example:
Dominant Plants Layer IndicatorCategory
Canada mayflower ground cover FAC-(Maianthemum canadense)
Cinnamon fern (Osmunda cinnamomea) ground cover FACWMountain laurel (Kalmia latifolia) shrub FACUWinterberry (Ilex verticillata) shrub FACW+Highbush blueberry shrub FACW-
(Vaccinium corymbosum)Ironwood (Carpinus caroliniana) sapling FACRed maple (Acer rubrum) tree FACNorthern red oak (Quercus rubra) tree FACU-

Wetland Vegetation
18 Delineating Bordering Vegetated Wetlands
Dominance Procedure (continued)
b. Determine how many of the dominant plants are wetland indicator plantsaccording to the wetlands protection regulations. (Wetland indicator plants =plant species listed in the Wetlands Protection Act (see Appendix A); plants inthe genus Sphagnum; plants in the National List classified as OBL, FACW+,FACW, FACW-, FAC+, and FAC; or any plants demonstrating morphologicalor physiological adaptations to life in saturated or inundated conditions.)
Example:
Canada mayflower Maianthemum canadense FAC-Cinnamon fern Osmunda cinnamomea FACW *Mountain laurel Kalmia latifolia FACUWinterberry Ilex verticillata FACW+ *Highbush blueberry Vaccinium corymbosum FACW- *Ironwood Carpinus caroliniana FAC *Red maple Acer rubrum FAC *Northern red oak Quercus rubra FACU-
Wetland Indicator Plants (*)
c. Determine the total number of wetland indicator plants and the total number ofnon-wetland indicator plants.
Example:Total number of wetland indicator plants (*) = 5Total number of non-wetland indicator plants = 3
d. If the number of wetland indicator plants is equal to or greater than the numberof non-wetland indicator plants, the wetland vegetation criterion has been met.If vegetation alone is presumed adequate for the delineation, the plot is in aBVW. If vegetation alone is not presumed adequate, or to overcome thepresumption, other indicators of hydrology also should be used to delineate theBVW boundary (see Chapter Three).
Example:
The area used for this example has eight dominant plants. The total numberof wetland indicator plants (5) is greater than the total number of non-wetland indicator plants (3), therefore, the wetland vegetation criterion hasbeen met.
SummaryAdditional examples of the dominance test are provided in Appendix C.
Evaluating vegetative communities is an important step toward locating a BVWboundary. In some cases, reliance on vegetation alone will yield an accurate BVWboundary. In other cases, hydrology and vegetation should both be used to locate theBVW line. Chapter Three provides information on when vegetation alone may be usedand when hydrology should be used in addition to vegetation. Procedures for delineat-ing BVW boundaries are described in Chapter Five.

Wetland Vegetation
19Delineating Bordering Vegetated Wetlands
The Dominance Test Procedure Summary
1. Evaluate percent cover: For each observation plot do the following (basal areamay be used for the tree layer):a. Determine how many of the vegetative layers (ground cover, shrub, sapling, climbing
woody vine, tree) have a total percent cover of 5 percent or more within the observationplot. Only those layers with a total percent cover of 5 percent or greater are to be used.
b. For each vegetative layer, estimate or measure percent cover for each plant species inthe layer. Any plant species with 1 percent cover or less should not be included. If youknow a plant species’ name, list the name and its percent cover. If you do not recognizea plant or do not know a plant’s name, call it a generic name (e.g. species x) and list itspercent cover.
2. Determine percent dominance for plants in each layer: For those layers withinthe observation plot with 5 percent cover or more, determine percent dominance foreach plant species as follows:a. Add up percent cover for all plant species in the layer to determine the total percent
cover for the layer.
b. Divide the percent cover for each plant species by the total percent cover for thelayer, and multiply this by 100. This will yield percent dominance for each plantspecies in each layer.
3. Identify dominant plants: Within the observation plot, identify the dominantplants in each layer:a. Beginning with the most abundant species, list the plants in the layer until the cumula-
tive total for percent dominance meets or exceeds 50 percent. In some cases, this willonly be one species; in other cases, several species may be needed to meet the 50percent threshold. These species are dominant plants for the layer.
b. Other species, not already listed in 3a., with a percent dominance of 20 percent orgreater also are dominant plants and should be listed.
c. If additional species in the layer have the same percent dominance as any speciesalready listed in 3a. and b., those species also are dominant plants and should be listed.
d. Those plants that meet a., b., and c. above are dominant plants for the layer. Identifythe scientific name and indicator category for all dominant plants. The indicatorcategory is taken from the National List of Plant Species That Occur in Wetlands: 1988- Massachusetts.
4. Determine whether the plant community is wetland or upland:a. List the dominant plants (from 3a., b., and c. above) for all layers being evaluated. A
given species may appear more than once on this list, if it is a dominant plant in morethan one layer.
b. Determine how many of the dominant plants are wetland indicator plants according tothe wetlands protection regulations. (Wetland indicator plants = plant species listed inthe Wetlands Protection Act (see Appendix A); plants in the genus Sphagnum; plants inthe National List classified as OBL, FACW+, FACW, FACW-, FAC+, and FAC; or anyplants demonstrating morphological or physiological adaptations to life in saturated orinundated conditions.)
c. Determine total number of wetland indicator plants and total number of non-wetlandindicator plants.
d. If the number of wetland indicator plants is equal to or greater than the number of non-wetland indicator plants, the wetland vegetation criterion has been met. If vegetationalone is presumed adequate for the delineation, the plot is in a BVW. If vegetationalone is not presumed adequate or to overcome the presumption, other indicators ofhydrology also should be used to delineate the BVW boundary (see Chapter Three).

Delineation Criteria
20 Delineating Bordering Vegetated Wetlands
CHAPTER THREEDelineation Criteria
The Wetlands Protection Act defines a wetland as an area with a significant portion ofwetland indicator plants and subject to certain hydrologic conditions (surface water orgroundwater). Wetland indicator plants are often accurate indicators of wetlandhydrology. Under certain site conditions, such as where there is an abrupt change intopography, the use of plants alone generally will yield an accurate BVW boundary. Inother cases, such as when the transition zone is gradual, other indicators of wetlandhydrology, together with vegetation, may be used to determine the BVW boundary. Thewetlands protection regulations describe those situations where vegetation alone ispresumed to be sufficient for delineating BVW boundaries, and when vegetation andhydrology should both be used.
When vegetation alone may be used for delineating BVWs(and hydrology is presumed to be present)
The wetlands protection regulations presume that the delineation of BVWs based onvegetation alone is accurate under any one of the following circumstances:
1. All dominant species in the vegetative community have an indicator category ofOBL, FACW+, FACW or FACW- and the slope is distinct or abrupt betweenthe upland plant community and the wetland plant community.
2. The area where the work will occur is clearly limited to the buffer zone.
3. The issuing authority (conservation commission or DEP) determines that solereliance on wetland indicator plants will yield an accurate delineation. (Note:if information on indicators of hydrology is submitted, it must be evaluated by theissuing authority.)
Vegetation may be used as the sole criteria for delineating BVWs in the vast majority ofcases. Where activities are proposed in areas that are clearly outside wetland resourceareas (in buffer zones), BVW delineations based on vegetation alone are generallysufficient. In other cases, such as where BVWs have abrupt or distinct boundaries orwhere the conservation commission or DEP determines that reliance on vegetation aloneis sufficient for determining the BVW boundary, information about soils or otherindicators of hydrology do not have to be submitted. However, when information onindicators of wetland hydrology is submitted (such as long-term hydrologic data or thepresence or absence of hydric soils), it must be evaluated for accuracy and used by theissuing authority to establish the BVW boundary.
In determining whether reliance on vegetation alone will yield an accurate delineation,the following factors should be considered:
w Facultative plant species commonly occur in uplands as well as in wetlands (e.g.sweet pepperbush (Clethra alnifolia), cottonwood (Populus deltoides), sheep laurel(Kalmia angustifolia), New York fern (Thelypteris noveboracensis)).
w Several plants with an indicator category of FAC- or drier are not uncommon inwetlands, such as white pine (Pinus strobus), pitch pine (Pinus rigida), and Ameri-can beech (Fagus grandifolia).

Delineation Criteria
Delineating Bordering Vegetated Wetlands 21
w Extended droughts can produce changes in vegetation in herbaceous plant
communities.
w Many species in the ground cover layer may not be detectable or identifiable inwinter or early spring.
w In areas where the vegetation has been altered (wetlands violations, lawns, golfcourses, cultivated areas), hydric soils and other indicators of hydrology areparticularly useful for identifying and delineating BVWs.
In these situations, the issuing authority has the discretion to request additional informa-tion to document the presence of wetland hydrology, such as whether hydric soils arepresent.
When vegetation and hydrologyshould be used for delineating BVWs
When the BVW boundary based on vegetation alone is not presumed accurate, or toovercome the presumption, vegetation and hydrology should both be used to establishthe BVW boundary. This generally will occur when:
1. the wetland area is not dominated by plants with an indicator category ofFACW- or wetter,
2. the BVW boundary is not abrupt or discrete, or
3. the plant community has been altered.
In these cases, the applicant should submit information on vegetation and other indica-tors of hydrology (such as hydric soils) to document the presence of wetland hydrology.The issuing authority should review all the information, evaluate its accuracy, and use itto establish or verify the BVW boundary.

Delineating Bordering Vegetated Wetlands22
Indicators of Wetland Hydrology
CHAPTER FOURIndicators of Wetland Hydrology
As discussed in Chapter One, hydrology is the driving force behind wetland systems.There are a number of ways to determine whether wetland hydrology is present at a site.Wetland plants (discussed in Chapter Two) generally are very reliable indicators oflong-term hydrology. However, the wetlands regulations specify that at certain sites,additional indicators of hydrology may be used to determine a BVW boundary. Wetlandsoils (hydric soils) also are considered very reliable indicators of long-term wetlandhydrology. Other indicators, such as water marks on trees and water-stained leaves,may be used to determine the presence of wetland hydrology. However, due to theseasonal or temporal nature of these features, they should be carefully considered withother indicators.
Soils IntroductionMost people come into contact with soils through routine activities such as gardeningand general yard work. In these situations, soils and their important influence onvegetation and the landscape are often overlooked. The following is a description anddiscussion of the thin layer of the earth’s surface that is referred to as soil.
Soil is the unconsolidated material on the earth’s surface that supports or is capable ofsupporting plants. It is an essential component of most ecosystems. Soils are mixturesof mineral components (sand, silt, clay, gravel), organic matter, air, and water. Charac-teristics of soil (pH, chemical composition, texture, depth, amount of organic matter)have a large influence on plant communities and on animals that live in the soil.However, most soil characteristics are not evident on the surface; you have to dig a holeto observe and evaluate them.
Soil Survey MapsThe U.S. Natural Resources Conservation Service (NRCS) - formerly called the SoilConservation Service (SCS) - has mapped soils throughout Massachusetts and soilsurveys are available for most areas in the state. (Soil surveys may be obtained fromNRCS offices; see contact information in Appendix H.) Each soil survey has an indexmap that allows you to determine which soils map to use for a given area. (See samplebelow).
A section of an index map from the Worcester County Soil Survey. A portion ofMap 4 is shown on page 23.

23Delineating Bordering Vegetated Wetlands
Indicators of Wetland Hydrology
The soils map itself is an aerial photograph over which soil types have been delineatedand labeled. Codes on the map can be used to identify soil type (see sample below) anddescriptions of each soil type are included in the soil survey report. Soils are describedin terms of their slope, texture (sand, silt, clay, gravel), color, horizonation, and drain-age (see samples on page 24).
Soil surveys are important tools that can be used to familiarize yourself with an areabefore going out to the site. In addition, the soil survey maps show general locations ofwaterways, water bodies, and wetlands. Other features, such as certain roads andbuildings, also may be shown. Reviewing the soil survey will give you an idea of thelandscape features of the area and whether the area may contain wetlands.
Soil descriptions provide useful information about the drainage characteristics of soils,with classifications ranging from excessively drained to very poorly drained. Wetlandsoils are typically classified as poorly drained or very poorly drained. Additionalinformation about seasonally high water tables and the frequency and duration offlooding also are provided. Information on the suitability of the soil to support variousactivities such as agriculture, sanitary facilities, and building site development isincluded.
A portion of soils map # 4 from the WorcesterCounty Soil Survey. Areas of Woodbridge (WrB)and Scarboro (Sc) soils can be found in the circledareas at center and right, respectively.Descriptions of these two types of soil from the soilsurvey report are shown on page 24.

Delineating Bordering Vegetated Wetlands24
Indicators of Wetland Hydrology
The soil descriptions identify smaller areas within the area of mapped soil type that maybe found within the soil. These smaller areas, which are called inclusions, generally areless than three acres in size and are not shown on the soil survey map. They are,however, described in the third paragraph of each soil description. (Examples of theseinclusions are found in the narrative samples highlighted below.) All of this informa-tion is helpful in preparing for the site investigation.
WrB---Woodbridge fine sandy loam, 3 to 8 percentslopes. This soil is very deep, gently sloping, andmoderately well drained. It is on the tops of drumlins onglacial till uplands. The areas of this soil are irregularlyshaped or rectangular. They range from 5 to 30 acres,but most are about 10 acres. Typically, the surface layer is very dark grayish brownfine sandy loam about 9 inches thick. The subsoil is darkyellowish brown and light olive brown sandy loam about13 inches thick. The substratum is very firm, grayishbrown sandy loam to a depth of 60 inches or more. Included with this soil in mapping are small areas,mainly less than 3 acres each, of Paxton and Ridgeburysoils. Also included are areas of soils that are friable to adepth of 30 inches or more. Included areas make upabout 15 percent of this unit. The permeability of this Woodbridge soil is moderatein the subsoil and slow or very slow in the substratum.Available water capacity is moderate. Reaction rangesfrom very strongly acid to moderately acid throughout.The seasonal high water table is at a depth of 1 1/2 to 3feet.
Sc---Scarboro mucky fine sandy loam. This soil isvery deep, nearly level, and very poorly drained. It is inlow-lying areas and depressions on outwash plains. Theareas of this soil are irregular in shape. They range from5 to 50 acres, but most are about 10 acres. Slopesrange from 0 to 3 percent. Typically, the surface layer is covered with about 8inches of organic material. The surface layer is blackmucky fine sandy loam about 6 inches thick. Thesubstratum is grayish brown and extends to a depth of60 inches or more. The upper part is loamy sand, themiddle part is sand, and the lower part is gravelly sand. Included with this soil in mapping are small areas,mainly less than 3 acres each, of Swansea and Walpolesoils. Also included are poorly drained, sandy soils.Included areas make up about 20 percent of this unit. The permeability of this Scarboro soil is rapid or veryrapid throughout. Available water capacity is high.Reaction ranges from very strongly acid to moderatelyacid. The water table is between the surface and a depthof 1 foot during most of the year. Most areas of this soil are covered with brush andtrees.
Soil description forScarboro soil. This is awetland (hydric) soil. Note inthe description that it is verypoorly drained, which isgenerally indicative ofwetland soil. Note also thedescription of the soil coloras grayish brown, which mayindicate wetland soil.
Soil description forWoodbridge soil. This is anupland soil. Note in thedescription that it ismoderately well-drained,which is generally indicativeof upland soil. Note also theinclusion in the thirdparagraph which indicatessmaller areas of Ridgeburysoil, which is classified as awetland (hydric) soil.
25Delineating Bordering Vegetated Wetlands
Indicators of Wetland Hydrology
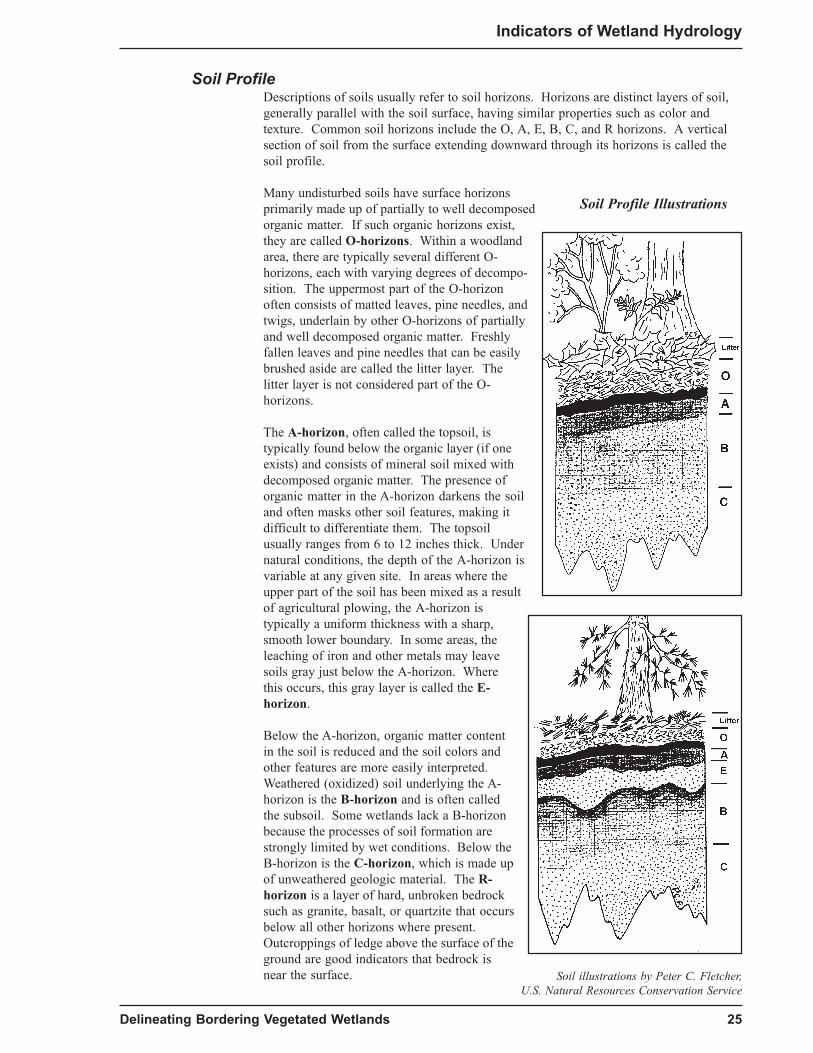
Soil ProfileDescriptions of soils usually refer to soil horizons. Horizons are distinct layers of soil,generally parallel with the soil surface, having similar properties such as color andtexture. Common soil horizons include the O, A, E, B, C, and R horizons. A verticalsection of soil from the surface extending downward through its horizons is called thesoil profile.
Many undisturbed soils have surface horizonsprimarily made up of partially to well decomposedorganic matter. If such organic horizons exist,they are called O-horizons. Within a woodlandarea, there are typically several different O-horizons, each with varying degrees of decompo-sition. The uppermost part of the O-horizonoften consists of matted leaves, pine needles, andtwigs, underlain by other O-horizons of partiallyand well decomposed organic matter. Freshlyfallen leaves and pine needles that can be easilybrushed aside are called the litter layer. Thelitter layer is not considered part of the O-horizons.
The A-horizon, often called the topsoil, istypically found below the organic layer (if oneexists) and consists of mineral soil mixed withdecomposed organic matter. The presence oforganic matter in the A-horizon darkens the soiland often masks other soil features, making itdifficult to differentiate them. The topsoilusually ranges from 6 to 12 inches thick. Undernatural conditions, the depth of the A-horizon isvariable at any given site. In areas where theupper part of the soil has been mixed as a resultof agricultural plowing, the A-horizon istypically a uniform thickness with a sharp,smooth lower boundary. In some areas, theleaching of iron and other metals may leavesoils gray just below the A-horizon. Wherethis occurs, this gray layer is called the E-horizon.
Below the A-horizon, organic matter contentin the soil is reduced and the soil colors andother features are more easily interpreted.Weathered (oxidized) soil underlying the A-horizon is the B-horizon and is often calledthe subsoil. Some wetlands lack a B-horizonbecause the processes of soil formation arestrongly limited by wet conditions. Below theB-horizon is the C-horizon, which is made upof unweathered geologic material. The R-horizon is a layer of hard, unbroken bedrocksuch as granite, basalt, or quartzite that occursbelow all other horizons where present.Outcroppings of ledge above the surface of theground are good indicators that bedrock isnear the surface.
Soil Profile Illustrations
Soil illustrations by Peter C. Fletcher, U.S. Natural Resources Conservation Service
Delineating Bordering Vegetated Wetlands26
Indicators of Wetland Hydrology
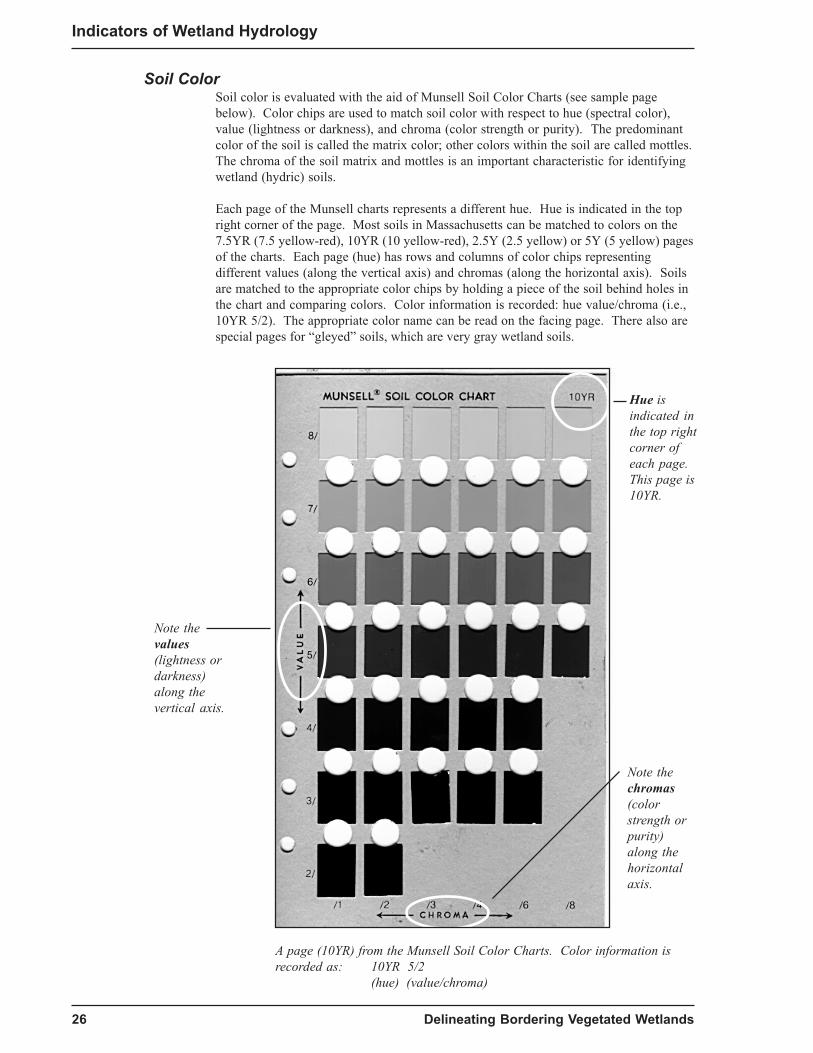
Soil ColorSoil color is evaluated with the aid of Munsell Soil Color Charts (see sample pagebelow). Color chips are used to match soil color with respect to hue (spectral color),value (lightness or darkness), and chroma (color strength or purity). The predominantcolor of the soil is called the matrix color; other colors within the soil are called mottles.The chroma of the soil matrix and mottles is an important characteristic for identifyingwetland (hydric) soils.
Each page of the Munsell charts represents a different hue. Hue is indicated in the topright corner of the page. Most soils in Massachusetts can be matched to colors on the7.5YR (7.5 yellow-red), 10YR (10 yellow-red), 2.5Y (2.5 yellow) or 5Y (5 yellow) pagesof the charts. Each page (hue) has rows and columns of color chips representingdifferent values (along the vertical axis) and chromas (along the horizontal axis). Soilsare matched to the appropriate color chips by holding a piece of the soil behind holes inthe chart and comparing colors. Color information is recorded: hue value/chroma (i.e.,10YR 5/2). The appropriate color name can be read on the facing page. There also arespecial pages for “gleyed” soils, which are very gray wetland soils.
A page (10YR) from the Munsell Soil Color Charts. Color information isrecorded as: 10YR 5/2
(hue) (value/chroma)
Hue isindicated inthe top rightcorner ofeach page.This page is10YR.
Note thechromas(colorstrength orpurity)along thehorizontalaxis.
Note thevalues(lightness ordarkness)along thevertical axis.

27Delineating Bordering Vegetated Wetlands
Indicators of Wetland Hydrology
Hydric SoilSoils found in wetlands are called hydric soils. Hydric soil is a relatively new termdeveloped in the mid-1970s by wetland scientists working for the U.S. Fish and WildlifeService with help from the Natural Resources Conservation Service. Hydric soil isdefined as “a soil that is saturated, ponded, or flooded long enough during the growingseason to cause anaerobic conditions in the upper part.” Anaerobic conditions producephysical and chemical changes in the soil that are readily observable and serve as hydricsoil indicators. Hydric soil indicators generally require many years to develop. As aresult, soils are good indicators of the long-term hydrology of an area. Once developed,the physical indicators of saturated conditions persist even after the hydrology of an areahas been altered. Hydric soil indicators are especially useful for delineating wetlandswhere the vegetation has been altered.
The NRCS has developed local lists (by county) of soil series that are considered hydric.It is important to note, however, that boundaries shown on soil survey maps are approxi-mate. A site visit is essential to verify the information contained in the soil survey andto accurately delineate the BVW boundary.
Hydric soils can be divided into two groups based on characteristics that can be observedin the field using soil test holes. These are organic soils and hydric mineral soils.
Organic SoilsOrganic soils are made up of partially to well decomposed plant material mixed withmineral elements. Generally, organic matter makes up 20-30 percent or more of the soil(depending on the amount of clay present). Organic soils form in certain wetlands(especially bogs, fens, and marshes) where anaerobic conditions slow the rate of decom-position and organic matter accumulates over time. They generally can be recognized inthe field by their dark color, slippery or fibrous texture, and tendency to stain fingerswhen handled. Organic soils also are less resistant than mineral soils to probing with aknife or shovel. When walking across these soil areas, they often feel spongy underfoot.
Soils with at least 16 inches of organic material measured from the ground surface arehydric soils and are referred to as histosols. Histosols are classified as fibrists (peats),saprists (mucks), and hemists (mucky-peats and peaty-mucks). Soils with 8 to 16inches of organic material measured from the ground surface also are hydric soils andare referred to as having a histic epipedon (thick organic surface layer). Histosols andsoils with a histic epipedon are always hydric soils.
Hydric Mineral SoilsMineral soils contain less than 20-30 percent organic matter and are made up primarilyof sand, silt, and clay, with varying amounts of gravel, cobbles, and stones. Hydricmineral soils are typically characterized by low-chroma colors (0-2 on the Munsell SoilColor Charts) that result from gleization.
Gleization occurs when iron is reduced and becomes mobile due to anaerobic soilconditions. Chemical change resulting from the presence of oxygen is called oxidation.Many of the bright colors (brown, orange, and red) found in upland soils are the resultof oxidized iron on the surface of soil grains. Chemical change that results from theabsence of oxygen (anaerobic conditions) is called reduction. When soils are saturatedor inundated long enough to produce anaerobic conditions, iron is reduced. Unlikeoxidized iron, reduced iron is soluble in water and may move a short distance, or issometimes entirely leached out of saturated sandy soils. This leaching process oftencreates soils that are dull-colored (low-chroma) or gray. These are hydric soils and areknown as gleyed soils. They are typically neutral gray or occasionally bluish, orgreenish-gray in color. The Munsell Soil Color Charts have special pages for gleyedsoils.

Delineating Bordering Vegetated Wetlands28
Indicators of Wetland Hydrology
Some mineral soils may not readily show hydric soil characteristics due to texture(sandy soils), high iron contents (red soils), or floodplain dynamics. (See the section onSoils that are Difficult to Analyze.)
Under conditions of prolonged saturation, sulfur may become reduced and is convertedby bacteria into sulfur gas (hydrogen sulfide), giving some wetland soils a smell like“rotten eggs.”
In areas where the water table fluctuates, leading to alternating periods of oxidation andreduction, iron often accumulates in brightly colored mottles or concretions (hardnodules). In areas of fluctuating water tables, oxidized iron also may accumulate alongthe living roots of plants, forming oxidized rhizospheres.
Oxidized RhizospheresRoots and other underground plant structures growing in saturated soil conditions mayproduce brightly colored areas in the soil called oxidized rhizospheres. Roots needoxygen in order to survive and function. Under anaerobic soil conditions, oxygen movesto the roots from other parts of the plant. Leakage of this oxygen results in the oxida-tion of iron in the soil surrounding the roots. In areas of fluctuating water tables, thisprocess creates brightly colored root channels (oxidized rhizospheres) in the soil.Oxidized rhizospheres are often evident within the topsoil and can be especially usefulfor confirming the presence of saturated soil conditions just below the ground’s surface.
29Delineating Bordering Vegetated Wetlands
Indicators of Wetland Hydrology
Hydric Soil IndicatorsMost hydric soils have a soil horizon with a chroma of 0, 1, or 2 below the A-horizon.These are referred to as low-chroma colors. (Reminder: the Munsell Soil Color Chartsare used to determine soil colors.) Generally, when evaluating mineral soils for low-chroma colors or other evidence of saturation, look for indicators directly below the A-horizon and within the top 12 inches of the soil surface. In areas where the O-horizon isless than 8 inches thick, soil depths are measured from the bottom of the O-horizon.When the O-horizon is 8 inches or greater (for histosols and soils with histicepipedons), such depths are measured from the soil surface. The soil surface is the topof the mineral soil; or, for soils with an O-horizon, the soil surface is measured from thetop of the O-horizon. Fresh leaf or needle fall that has not undergone observabledecomposition (the litter layer) is excluded from soil and may be separately described.
The following is a list of some hydric soil indicators - any of which can be used toidentify the presence of wetland hydrology:
w Histosols (organic soils). Histosols are soils with at least 16 inches of organicmaterial measured from the soil surface.
w Histic epipedons. These are soils with 8 to 16 inches of organic material measured
from the soil surface.
w Sulfidic material. A strong “rotten egg” smell generally is noticed immediatelyafter the soil test hole is dug.
w Gleyed soils. Soils that are predominantly neutral gray, or occasionally greenish orbluish gray in color within 12 inches from the bottom of the O-horizon. (TheMunsell Soil Color Charts have special pages for gleyed soils.)
w Soils with a matrix chroma of 0 or 1 and values of 4 or higher within 12 inchesfrom the bottom of the O-horizon.
w Within 12 inches from the bottom of the O-horizon, soils with a chroma of 2 or lessand values of 4 or higher in the matrix, and mottles with a chroma of 3 or higher.
w Within 12 inches from the bottom of the O-horizon, soils with a matrix chroma of 3and values of 4 or higher, with 10 percent or more low-chroma mottles, as well asindicators of saturation (i.e., mottles, oxidized rhizospheres, concretions, nodules)within 6 inches of the soil surface.

Delineating Bordering Vegetated Wetlands30
Indicators of Wetland Hydrology
Soils that are Difficult to AnalyzeIn most cases, the hydric soil indicators previously listed are sufficient to identifywetland soils. However, certain soils are more difficult to assess, making it harder todetermine whether hydric conditions exist. When these situations are encountered, adelineator or reviewer must evaluate all of the information that is available at the siteand make a determination. At some sites, more weight should be given to otherindicators of hydrology and vegetation if the soils information is inconclusive. Inparticularly difficult cases, consultation with the Natural Resources ConservationService is recommended. The following is a list and discussion of soils that are difficultto analyze:
w Sandy soils. Soil colors often are not distinctive in most sandy soils. Instead, lookfor these indicators of hydric sandy soils:
a) high organic content in the surface layer (typically darker colors with values less than 3 and chroma of 2 or less) with mottles or other indicators of saturation directly below;
b) organic streaking directly below the A-horizon; or
c) matrix chroma of 3 (from the Munsell Soil Color Charts) in the top 12 inches of soil measured from the bottom of the O-horizon, with distinct or prominent mottling.
Indicators of hydric soils may be lacking altogether in the soil of newly formed sandbars and interdunal depressions.
w Floodplain soils. These soils usually are characterized by distinctly layered soilmaterial. The layers form when new sediment is deposited during flood events. Asa result of this pattern of deposition, hydric soil indicators may never form, or maybe buried even though saturated or inundated conditions are present long enough tocreate wetland hydrology.
w Soil from highly colored parent material. Some soils derived from highly coloredparent material have strong red, brown, or black colors. As a result, the gray colorsindicative of hydric soils may not be obvious. Red soils generally are confined tocertain areas within the Connecticut River Valley. Brown soils derived fromBrimfield schists generally are found in and around the town of Brimfield. Blacksoils generally are confined to southeastern Massachusetts (principally BristolCounty).
wwwww A-horizons that are thick and very dark. A-horizons greater than or equal to 12inches thick with values less than 3 and chroma of 2 or less are difficult to analyzebecause indicators of saturation are difficult to see. Therefore, look directly belowthe A-horizon for a matrix chroma of 1 or less and values of 4 or higher. If thematrix color directly below the thick and dark A-horizon is chroma 2 and value 4 orhigher, other indicators of saturation need to be present in the soil directly belowthe A-horizon. In uncommon situations, it may be necessary to dig deeper toevaluate colors below the A-horizon.

31Delineating Bordering Vegetated Wetlands
Indicators of Wetland Hydrology
w Evergreen forest soils. Sandy soils on Cape Cod and other areas dominated byevergreen trees may possess gray colored E-horizons just beneath the surface.These colors are not necessarily the result of saturation or inundation, but form as aresult of the leaching of organic material and aluminum and iron oxides by organicacids. These soils are called spodosols and the gray layer that forms below thesurface is known as the E-horizon. Organic material and aluminum and iron oxidesare deposited in a layer below the E-horizon called the spodic horizon.
Hydric indicators in spodosols include a combination of two or more of thefollowing features, with one occurring within the upper 12 inches of the soilsurface and others documented below the soil surface:
a) a thick, black, sandy surface layer;
b) organic streaking in the E-horizon;
c) mottles within the E-horizon;
d) oxidized rhizospheres within the A or E-horizon;
e) iron concretions/nodules within the E-horizon or spodic horizon;
f) a partially or wholly cemented spodic horizon usually within 18 inches of the surface measured from the bottom of the O-horizon; and
g) mottling within the spodic horizon.
Non-hydric spodosols can be recognized by brightly colored soil material belowthe E-horizon and without mottles or other indicators of saturation.
w Areas where the hydrology has been recently altered. In areas where thehydrology has been recently altered, hydric soil indicators may not accurately reflectthe current hydrology of the site. Areas that have been recently flooded - or wherethe water table has risen due to flooding or some other change in hydrologicconditions - may not exhibit hydric soil characteristics. These areas may not havebeen saturated long enough to develop hydric characteristics. Conversely, areas thathave been effectively drained and wetland hydrology is no longer present may stillpossess hydric soil indicators. Where there is evidence that the hydrology has beensubstantially altered at a site, careful evaluation of vegetation, soils, and otherindicators of hydrology should be made before making a final delineation. Alteredareas are particularly difficult to evaluate and require special attention.

Delineating Bordering Vegetated Wetlands32
Indicators of Wetland Hydrology
Procedure for Evaluating SoilsThe following is the recommended procedure for evaluating soils. While conductingthese steps, record information on the DEP field data form (see Appendix G). See page29 for a list of some hydric soil indicators.
1. Consult topographic maps, soil survey maps, and other available informationbefore heading out to the site. Check to see whether soils in the area are on thelist of hydric soils for the region. Familiarize yourself with the general soil charac-teristics (color, texture, drainage class) that you expect to encounter at the site.
2. In the field, check the site for signs that the hydrology may have been altered(drainage ditches, drainage tiles, dams, etc.).
3. Evaluate the plant communities using the dominance test to identify wetlandand upland communities (see procedure, pages 15-19).
4. Choose locations for soil test holes. Soil test holes should be located in areas thatare representative of each vegetative community (wetland and upland) within theobservation plots. In areas where the topography is characterized by a combinationof small mounds and depressions, several test holes may be needed to accuratelycharacterize an area. Locate the test holes within whichever feature (mound ordepression) is most abundant.
5. Use a pointed shovel or spade to dig a hole approximately 1 foot by 1 foot to adepth of 20 inches. Note: A shovel or spade should be used for digging soil testholes and sampling soils. Shovels or spades are recommended because augersoften mix soil from different horizons and may disturb or obliterate soil characteris-tics. However, a soil auger may be used to quickly check soil conditions or to refineyour boundary determination by checking between soil test holes.
6. Note whether a strong odor of hydrogen sulfide (“rotten egg”) is present. Astrong hydrogen sulfide odor identifies a hydric soil.
7. After digging the test hole, use a knife to probe the upper part of the soil profileto determine the bottom of the litter layer (where the knife does not go into thesoil easily). This will indicate the soil surface, which generally is the level fromwhich depths are measured.
8. Use the shovel to remove a clean slice (cross section) of the soil profile approxi-mately 6 inches wide and 20 inches deep. It is easiest to evaluate the horizons byremoving a clean slice from the hole and laying it on the ground.
9. Feel or probe the soil to determine if there is an O-horizon (see organic soils,page 27). If the O-horizon is at least 8 inches deep, then the soil is hydric and hasa histic epipedon. When the O-horizon has a thickness greater than 16 inches, thesoil is hydric and classified as a histosol.
10. If the organic layer is less than 8 inches deep, use the Munsell Soil ColorCharts to determine the color of the soil matrix and mottles (if present) within20 inches of the mineral surface or just below the A-horizon. To evaluate color,break off a representative chunk of moist soil material and compare it to the colorchips on the Munsell charts. Use a spray bottle to moisten the chunk of soil, if thesoil is not moist. Color comparisons should be made in good light, preferably directsunlight (no sunglasses). Refer to the hydric soil indicators listed on page 29 todetermine whether hydric indicators are present.

33Delineating Bordering Vegetated Wetlands
Indicators of Wetland Hydrology
Procedure for Evaluating Soils (continued)
11. Look for oxidized rhizospheres (root channels) and note their depth andabundance. Oxidized rhizospheres within the A-horizon together with low-chromacolors right below the A-horizon are indicators of hydric soil.
12. Observe to see if standing water gathers in the hole and note the depth. Freewater may take a while to gather in the soil test hole. You may want to leave thehole to continue your delineation steps and then go back later to see if water ispresent. Also note the depth at which water weeps from the sides of the test hole.Free water or weeping within 12 inches of the surface measured from the bottom ofthe O-horizon is a good indicator of wetland hydrology.
13. Flag the location of the test hole(s) and note their location on the plans.

Delineating Bordering Vegetated Wetlands34
Indicators of Wetland Hydrology
Other Indicators of HydrologyVegetation and soils are considered the most reliable indicators of long-term wetlandhydrology because they generally are observable throughout the year. However, otherindicators also may be used to confirm the presence of wetland hydrology. These otherindicators are presented in three categories: evidence of surface water, evidence of soilsaturation, and morphological plant adaptations.
When delineating or reviewing a BVW boundary, note the presence of any of these otherindicators and consider them in the evaluation. At many sites, these indicators can beused to refine the boundary delineation. When encountering difficult sites, it may benecessary to actively seek these other indicators to make the determination. Keep inmind, however, that some of these hydrologic indicators can be affected by recent heavyrain or seasons with above average amounts of precipitation. Conversely, these indica-tors may not be present during the entire year or may be absent during prolongedperiods of drought.
Evidence of Surface WaterThe following indicators may be used as evidence of surface water. Professionaljudgment should be used in deciding whether the presence of one or more of theseindicators in an area is sufficient for establishing that wetland hydrology is present.
w Hydrological records, such as those from U.S. Geological Survey (USGS) streamgauging stations, U.S. Army Corps of Engineers data for major water bodies, stateand local flood data, or NRCS state offices, can provide information on floodelevations, as well as the frequency and duration of flooding. Hydrological recordsthat provide evidence of periods of continuous flooding from 7 to 21 days during thegrowing season are indicators of wetland hydrology.
w Direct observation of inundation during the growing season is an obvious indica-tion of the presence of water. Observations over a period of days or weeks willprovide a more reliable indication that the area has wetland hydrology. Recentweather conditions should be taken into consideration when using this indicator toestablish the presence of wetland hydrology.
w Water marks on trees, boulders, bridge abutments, or other objects are goodindicators of extended periods of inundation. Water marks can be stained or siltcovered areas, or an abrupt change in plant or lichen growth that is present onseveral objects at a consistent elevation.
w Water-stained leaves on the ground are an indicator of inundation. Water-stainedleaves are usually dull gray or black in color, and are flattened compared with thosein surrounding (upland) areas.
w Sediment deposits on plants, leaves, or the ground are indicators of surface water,but generally do not provide much information about the timing or duration ofinundation.
w Drift lines are accumulations of plant material or debris that are deposited, usuallyin lines parallel to the stream flow, during flood events. Drift deposits may beevident on the ground or occasionally in the branches of trees and shrubs. They aregood indicators of surface water, but do not provide much information about thetiming or duration of flooding.
35Delineating Bordering Vegetated Wetlands
Indicators of Wetland Hydrology
w Scoured areas are good indicators of flowing water. These generally can berecognized by the relative absence of leaf litter and other debris on the ground, orwhere fine soils have been washed away, leaving gravel and cobble. Scoured areasare good indicators of flowing conditions, but do not provide much informationabout the timing or duration of flowing water.
w Drainage patterns left by flowing water indicate the presence of surface water.These can be water-induced patterns on the ground (washboard or braided patternsin the sediments), channels in the leaf litter, or where vegetation has been bent inone direction by the force of running water. Although these patterns do serve asindicators of surface water, they also may occur in upland areas.
w Fingernail clam and aquatic snail shells can occasionally be found in dry depres-sions and are good indicators of extended periods of inundation during the growingseason. Be aware, however, that there are terrestrial snails in Massachusetts; theirpresence is not an indicator of wetland hydrology. Freshwater mussels, unlikefingernail clams, only occur in areas that are permanently flooded. The presence ofmussel shells in areas other than aquatic habitats are not good indicators of wetlandhydrology because they often are transported by predators.
w Caddisfly cases can occasionally be found in dry pools or intermittent streams.Caddisflies are insects that are aquatic as larvae and winged as adults. The larvaeof many species construct tubelike cases around themselves, made of leaf fragments,twigs, pine needles, or sand. These cases often persist long after the water has driedup and serve as good indicators of extended periods of inundation during thegrowing season.
Evidence of Soil SaturationThe following indicators of hydrology may be used as evidence of soil saturation.
w Free water in a soil test hole indicates depth to the water table at that particulartime. The depth at which water is observed weeping out of the soil into the holealso is an indicator of water table depth. Free water or weeping within 12 inches ofthe surface is a good indicator of wetland hydrology. However, recent weatherconditions should be considered when using this indicator.
w Saturated soil usually occurs in areas above the water table due to capillary actionwithin the soil. Saturated soils will yield water when squeezed. Saturated soilwithin 12 inches of the surface generally is a good indicator of wetland hydrology.However, recent weather conditions should be considered when using this indicator.
w Oxidized rhizospheres within the A-horizon together with low-chroma colors rightbelow the A-horizon are good indicators of soil saturation during the growingseason. Look for orange-stained channels along living plant roots in the soil (seepage 28 for more information).

Delineating Bordering Vegetated Wetlands36
Indicators of Wetland Hydrology
Morphological Plant AdaptationsMorphological adaptations are evident in the form or shape of a plant. Adaptations thatresult from inundation or saturation during the growing season are good indicators ofwetland hydrology. In addition, plants demonstrating morphological adaptations areconsidered wetland indicator plants.
w Shallow root systems are probably the most usefuladaptations that indicate wetland hydrology inareas near the wetland/upland boundary. Thisindicator can be just as useful with shrubs,saplings, and herbs as it is with trees. Forinstance, look for swollen trunks or roots along thesurface of the ground as evidence of shallow rootsystems, or observe them directly on overturnedtrees. The key is to compare the root structures oflike or similar species growing further upslope inan upland setting. Be aware that shallow rootsystems also form in upland areas where bedrockis close to the surface or in very stony soils. Usesoil maps and topography to confirm that shallowroot systems are the result of wetland hydrologyand not stony soils or bedrock.
w Buttressed or fluted trunks are good indicators of hydrology that are often cited inpublications about wetland delineation. In Massachusetts, however, trees andsaplings rarely demonstrate the exaggerated, swollen bases typical of this adapta-tion. The moderately swollen bases typically found in Massachusetts usuallyindicate the presence of shallow root systems.
w Adventitious roots are roots that form on plantstems in positions where roots normally do notoccur. This adaptation is most common on activefloodplains and may be found on box elder (Acernegundo), sycamore (Platanus occidentalis), pinoak (Quercus palustris), green ash (Fraxinuspennsylvanica), cottonwood (Populus deltoides),and willows (Salix spp.).
w Enlarged (hypertrophied) lenticels on woody plants are indicators of inundated orsaturated growing conditions. Lenticels are small pores, usually resembling dots orthin horizontal lines on the stems and twigs of woody plants. In response tosaturated or inundated growing conditions, these pores can become swollen orenlarged. Enlarged lenticels can occasionally be found on red maple (Acerrubrum), silver maple (Acer saccharinum), and willows (Salix spp.).
Shallow root systems
Adventitious roots

37Delineating Bordering Vegetated Wetlands
Indicators of Wetland Hydrology
w Polymorphic leaves form on certain plant species whenportions of the plant are submerged while other portionsextend above water. Plants like mermaidweed(Proserpinaca palustris), water parsnip (Sium suave), andarrowheads (Sagittaria latifolia) have different leaf formsdepending on whether they grow above or below the watersurface. Underwater leaves tend to be narrow or finelydivided; leaves above the water surface tend to be broaderand less divided. Where both forms occur on the same plant(polymorphic leaves), these are good evidence of surfacewater for an extended period during the growing season.
w Air-filled tissue (aerenchyma) forms in the roots and stems of many plants inresponse to prolonged periods of saturation or inundation. These specialized tissueshelp move oxygen from plant structures above water to those that are underwater orin saturated soil. Plants that possess these air-filled tissues are spongy whensqueezed and the air cells are obvious when the plants are cut.
Plant with polymorphicleaves: mermaidweed(Proserpinaca palustris)

Delineating Bordering Vegetated Wetlands38
Delineating and Reviewing BVW Boundaries
CHAPTER FIVEDelineating and Reviewing BVW Boundaries
The delineation of a BVW boundary is critical because it ultimately influences bothproject design and the effectiveness of wetland protection efforts. In the Request forDetermination of Applicability (RDA) process, a boundary delineation decision iseffective for three years. In the Notice of Intent (NOI) process, a delineation is requiredto evaluate whether performance standards are being met. BVW boundaries may beappealed in either of these permitting processes. For these reasons, the accuracy of thedelineation is important to successful wetlands protection.
Wetlands often occur as transitional areas between water bodies (and waterways) anduplands. Where the transition is gradual, it can be difficult to determine exactly wherethe BVW ends and the upland begins. The analyses of vegetation and hydrology areuseful for determining whether a particular area is a BVW, but they will not yield aBVW delineation unless they are incorporated into procedures for locating the wetland/upland boundary.
The level of analysis used to delineate the BVW boundary should reflect the complexityof the site. Some wetlands have abrupt and obvious boundaries and rigorous analysesmay not be necessary. Other areas may require detailed analysis of vegetation andhydrology in order to locate accurate boundaries. Moreover, the wetlands protectionregulations establish criteria to determine when vegetation alone may be used todelineate the BVW boundary and when vegetation and hydrology should both be used(see Chapter Three).
Preparing for the Site VisitPreparation before visiting the site is an important first step in the delineation or reviewprocess. Maps and other materials that can provide information about an area should bereviewed before you make a site visit. These data sources may include importantinformation about the topography and soils of a site, water bodies, floodplains, and areasthat may already have been mapped as wetlands. This preparation may improve yourefficiency at the site by highlighting difficult areas where you can focus your attention,such as disturbed areas or gradual slopes. Also, be sure to secure permission from thelandowner before entering private property.
Useful Data Sourcesw USGS topographic maps. Topographic maps prepared by the U.S. Geological
Survey are essential sources of information about site conditions. They provideinformation about the topography of a site and many wetlands and water bodies areshown as well. It is important to note, however, that some wetlands and intermit-tent streams are not shown on the maps. In many cases, topographic features on themap can be used to identify areas that may contain wetlands and streams not shownon the map.
w NRCS soil survey maps and hydric soils lists. Soil surveys published by the U.S.Natural Resources Conservation Service (formerly called the Soil ConservationService) contain important information about site conditions. When using soilsurveys, consult the list of hydric soils for the county. Both soil surveys and hydricsoils lists are available from the NRCS.

39Delineating Bordering Vegetated Wetlands
Delineating and Reviewing BVW Boundaries
w DEP Wetlands Conservancy maps (where available). DEP’s Wetlands Conser-vancy Program is mapping wetlands statewide using aerial photography. Theselarge-scale (1" = 417'), black-and-white maps (orthophotos) provide more detailthan most other maps. See Appendix F for a list of maps that are available as ofJanuary 1, 1995, and how to receive updated information.
w National Wetlands Inventory maps. The U.S. Fish and Wildlife Service hasmapped wetlands in Massachusetts as part of the National Wetlands Inventory (alsoknown as NWI). NWI maps were developed from aerial photography taken in the1970s and 1980s. They are available at the same scale and have the same quad-rangle names as USGS topographic maps. It is important to note that many smallwetlands are not shown on the maps, and that wetland boundaries on the maps areapproximate. In cases where wetlands have been altered or destroyed, NWI mapscan indicate the extent and location of previously existing BVWs for the purposes ofenforcement.
w Aerial photographs. NWI and Wetlands Conservancy maps are based on aerialphotography. Other aerial photography also may be available for some areas of thestate. Infrared photography, taken in the spring before leaves are out, is useful foridentifying wetlands. Aerial photographs can be used to document wetland viola-tions; however, an experienced photointerpreter generally is required. See Appen-dix F for information about color infrared photography available from the WetlandsConservancy Program.
w Local wetlands and/or topographic maps (city or town). In some towns andcities, local topographic or wetlands maps are available. These maps may providedetails about a site not found on other maps.
w Floodplain maps (National Flood Insurance Program). Floodplain maps areavailable from the Federal Emergency Management Agency (FEMA). Developedfor the National Flood Insurance Program, these maps provide useful informationon flood prone areas and may indicate the presence of floodplain soils which may bedifficult to analyze for hydric soil indicators. One hundred and 500-year flood-plains are delineated for rivers and larger streams and some water bodies.
w Site plans prepared by the applicant. Before goingout to a site, it is important to review site plans for thearea. Applicants are required to submit informationthat describes conditions at a project site. This includesidentification of all wetland resource areas. The BVWboundary should be marked in the field by numberedflags that correspond with the project plan.
w Field data forms. Field data forms prepared for thesite should be reviewed in the office. The form should list the types of plant speciesfound at various locations on the site. Reviewing the form prior to the site visitgives you an opportunity to check field guides for species with which you are notfamiliar, check the wetland indicator category of particular species, and consultrelated soils information, if necessary.

Delineating Bordering Vegetated Wetlands40
Delineating and Reviewing BVW Boundaries
Tools to Bring to the Site:
w 100-foot measuring tapew compassw flagging tapew site plansw field data formw permanent marking penw USFWS plant listw plant identification guidesw Munsell Soil Color Chartsw shovel (spade)w soil augerw spray bottlew knifew hand lensw calculator
Delineating BVW BoundariesBordering Vegetated Wetlands must border on a creek, river, stream (including anintermittent stream), pond, or lake. Bordering means that the wetland touches the bankof a water body, is contiguous with wetlands that touch the bank, or is connected viasurface water (or culvert) to wetlands that touch the bank. Use topographic maps, siteplans, or other sources of information to locate water bodies that may be associated withwetlands and then verify them in the field.
Once at the site, establish some general reference points such as property boundaries,stone walls, fences, or other field markers. This will help keep you oriented. Begin atthe water body or an obvious wetland that borders the water body, and walk the site todetermine whether it is an area where vegetation alone is adequate to delineate theboundary or whether vegetation and hydrology should both be used. (See Chapter Threefor delineation criteria.)
Several methods of delineation are outlined in the following pages:w Vegetation alone
w Vegetation along with indicators of hydrology
w Altered sites
w Winter delineations

41Delineating Bordering Vegetated Wetlands
Delineating and Reviewing BVW Boundaries
Procedure where vegetation alone is presumed to yieldan accurate boundary (hydrology presumed to be present)
At sites where vegetation alone ispresumed to yield an accurate boundary(and hydrology is presumed to bepresent), the following procedure shouldbe used to delineate the BVW boundary.The diagrams that accompany thisprocedure are based on a site illustratedby the cross-section diagram at right.While conducting these steps, siteinformation should be recorded on theDEP field data form (see Appendix G).
1. Establish one or more transects from an obvious wetland to an obvious uplandarea. A transect is an imaginary line that bisects a parcel of land. The transect(s)should generally run perpendicular to slope or topographic changes. The number oftransects should reflect the complexity of the site and may range from one toseveral. Mark the beginning and end of each transect with a flag (use a differentcolor than the one used for the boundary line or make a note on the flag).
2. Observe plant communities along the transect line(s). Starting at the wetter endof the transect line, walk towards the upland. Observe obvious characteristics of theplant communities, such as types of plants and abundance.
Swamp Azalea
Leatherleaf
Sphagnum
Swamp White Oak
Witherod
Skunk Cabbage
White Pine
Gray Birch
Multi-FloraRose
Vegetation alone is presumed to yield anaccurate boundary at this site because thevegetation is FACW- or wetter and there is anabrupt slope between upland and wetland plantcommunities.
1. Establish one or more transects.2. Observe plant communities along transect(s).
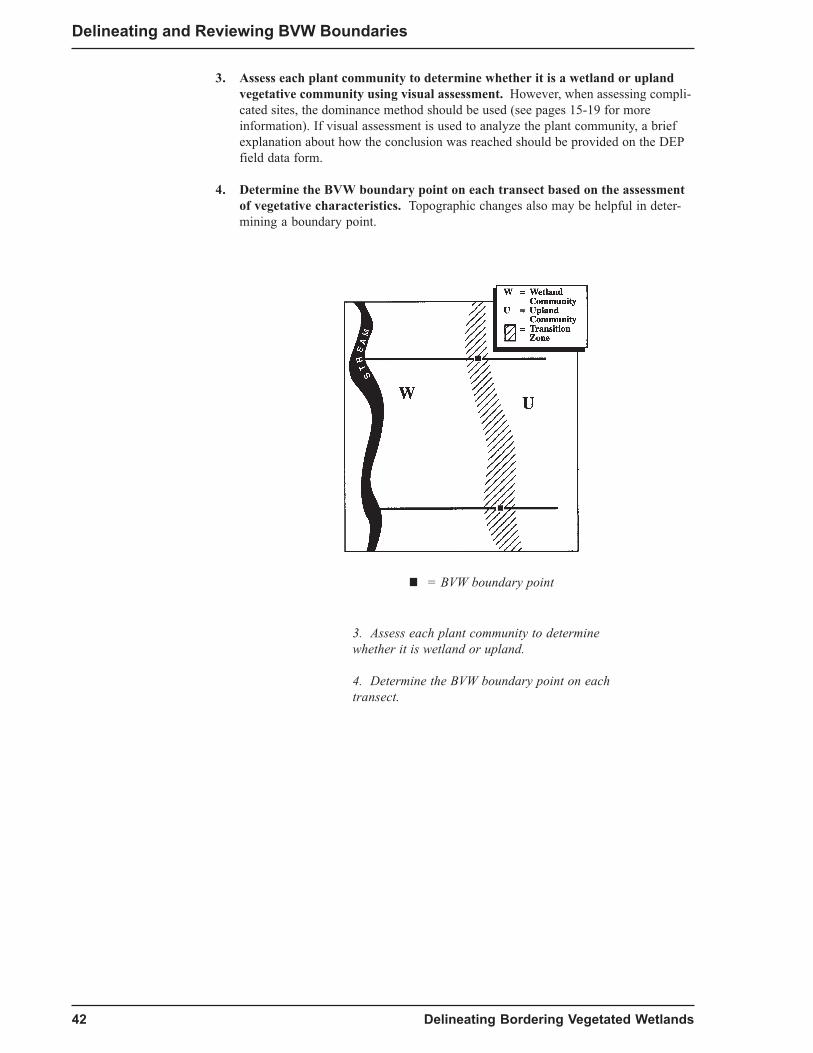
Delineating Bordering Vegetated Wetlands42
Delineating and Reviewing BVW Boundaries
3. Assess each plant community to determine whether it is a wetland or uplandvegetative community using visual assessment. However, when assessing compli-cated sites, the dominance method should be used (see pages 15-19 for moreinformation). If visual assessment is used to analyze the plant community, a briefexplanation about how the conclusion was reached should be provided on the DEPfield data form.
4. Determine the BVW boundary point on each transect based on the assessmentof vegetative characteristics. Topographic changes also may be helpful in deter-mining a boundary point.
3. Assess each plant community to determinewhether it is wetland or upland.
4. Determine the BVW boundary point on eachtransect.
= BVW boundary point

43Delineating Bordering Vegetated Wetlands
Delineating and Reviewing BVW Boundaries
5. Once all transects have been completed, use topographic and vegetativefeatures to establish a line connecting the boundary points. If only one transectis completed, use topographic and vegetative features to establish a boundary fromthat transect. Topography, vegetation, and other site features may signal changesfrom wetland to upland conditions. The following are examples of site conditionsthat may be useful to consider when determining the BVW boundary. These arejust a few of the visual cues to look for at a site:
A change in topography, such as a change in slope over a shortdistance, may indicate a boundary point.
Variations in the herbaceous plant community, such as an obviousdecrease in abundance of a specific wetland indicator plant likecinnamon fern (Osmunda cinnamomea, FACW), or an increase inabundance of a specific non-wetland plant such as princess pine(Lycopodium obscurum, FACU), may reflect a change in conditions atthat location.
Variations in the shrub plant community also may signal a boundarypoint, such as when a non-wetland shrub like mountain laurel (Kalmialatifolia, FACU) starts to become more abundant in an area with adecrease of a wetland shrub like highbush blueberry (Vacciniumcorymbosum, FACW-).
The presence or absence of hydrologic indicators also may be usefulwhen establishing a boundary. One example would be shallow rootsystems indicated by wind-thrown trees and roots coming out of theground.
6. Use numbered flags (or stakes in disturbed areas or meadows) to mark theBVW boundary. You should be able to see one flag while standing at another flag.
7. Identify the location of BVW boundary flags or stakes on the site plans.
5. Usetopographicandvegetativefeatures toconnect theboundarypoints.

Delineating Bordering Vegetated Wetlands44
Delineating and Reviewing BVW Boundaries
Procedure for using vegetation and hydrology (soil asan indicator of hydrology) to determine the BVW boundary
If using vegetation alone to delineatea BVW boundary is not appropriate,then the following procedure usingvegetation and hydrology (e.g. hydricsoils) should be used. The diagramsthat accompany this procedure arebased on a site illustrated by thecross-section diagram at right.While conducting these steps, siteinformation should be recorded onthe DEP field data form (see Appen-dix G).
1. Establish one or more transects from an obvious wetland to an obvious uplandarea. A transect is an imaginary line that bisects a parcel of land. The transect(s)should generally run perpendicular to slope or topographic changes. The number oftransects should reflect the complexity of the site and may range from one toseveral. Mark the beginning and end of each transect with a flag (use a differentcolor than the one used for the boundary line or make a note on the flag).
2. Observe plant communities along the transect line(s). Starting at the wetter endof the transect line, walk towards the upland. Observe obvious characteristics of theplant communities, such as types of plants and abundance.
Red Maple
Winterberry
Sensitive Fern
Red Maple
Arrowwood
Cinnamon Fern
Red Oak
Pink Azalea
CanadaMayflower
1. Establish one or more transects.2. Observe plant communities along transect(s).
Vegetation and hydrology should both be used todetermine an accurate boundary at this sitebecause the vegetation is not FACW- or wetterand there is a gradual slope between upland andwetland plant communities.

45Delineating Bordering Vegetated Wetlands
Delineating and Reviewing BVW Boundaries
3. Assess each plant community to determine whether it is a wetland or uplandvegetative community using the dominance test. (See pages 15-19 for details.)
4. Choose locations for soil test holes. Soil test holes should be located in areas thatrepresent each vegetative community (wetland and upland) within the observationplots used for vegetative analyses.
5. Dig soil test holes and examine the soil characteristics to determine whetherhydric soils are present. (See pages 32-33 for soil evaluation procedure.)
6. Use additional soil test holes, as needed, to determine the boundary betweenhydric and non-hydric soils.
7. Use vegetative and soil characteristics to determine the BVW boundary pointon each transect. Topographic changes also may be helpful in determining aboundary point.
3. Assess eachplant communityto determinewhether it iswetland orupland.
= BVW boundary point
5. Dig soil test holesand examine soilcharacteristics.
6. Use additional soiltest holes, as needed,to determine theboundary betweenhydric and non-hydricsoils.
7. Use vegetative andsoil characteristics todetermine the BVWboundary point oneach transect.

Delineating Bordering Vegetated Wetlands46
Delineating and Reviewing BVW Boundaries
8. Once all transects have been completed, use topographic and vegetativefeatures and soil characteristics to establish a line connecting boundary points.If only one transect is completed, use topographic and vegetative features and soilcharacteristics to establish a boundary from that transect. Topography, vegetation,and other site features may signal changes from wetland to upland conditions. Thefollowing are examples of site conditions that may be useful to consider whendetermining the BVW boundary. These are just a few of the visual cues to look forat a site:
A change in topography, such as a change in slope over a shortdistance, may indicate a boundary point.
Variations in the herbaceous plant community, such as an obviousdecrease in abundance of a specific wetland indicator plant likecinnamon fern (Osmunda cinnamomea, FACW), or an increase inabundance of a specific non-wetland plant like princess pine (Lycopo-dium obscurum, FACU), may reflect a change in conditions at thatlocation.
Variations in the shrub plant community also may signal a boundarypoint, such as when a non-wetland shrub like mountain laurel (Kalmialatifolia, FACU) starts to become more abundant in an area with adecrease of wetland shrub like highbush blueberry (Vacciniumcorymbosum, FACW-).
Soil characteristics also may be used to locate the BVW boundarybetween transect points. Use a soil auger or spade to check soilcharacteristics and identify hydric and non-hydric soils to establish theboundary.
The presence or absence of other hydrologic indicators also may beuseful when establishing a boundary. One example would be shallowroot systems indicated by wind-thrown trees and roots coming out ofthe ground.
8. Use topographic and vegetative featuresand soil characteristics to connectboundary points.

47Delineating Bordering Vegetated Wetlands
Delineating and Reviewing BVW Boundaries
9. At complex sites, use periodic soil test holes, with visual assessment of vegeta-tion, to verify or adjust the BVW boundary.
10. Use numbered flags (or stakes in altered areas or meadows) to mark the BVWboundary and the location of soil test holes. You should be able to see one flagwhile standing at another flag.
11. Identify the location of BVW boundary flags or stakes and soil test holes on thesite plans.
9. Use periodic soiltest holes to verifyor adjust the BVWboundary.

Delineating Bordering Vegetated Wetlands48
Delineating and Reviewing BVW Boundaries
Delineating BVWs where hydrology or vegetation has been alteredIn areas where either hydrology or vegetation has been altered, additional investigationof site conditions will be needed to locate the BVW boundary. The procedure is basi-cally the same as that previously outlined for using vegetation and soils to determine theBVW boundary. However, site conditions may require modifications that emphasizesome indicators over others.
w In areas where hydrology has been recently altered, creating flooded conditions,hydric soils may not have formed. As a result, indicators of hydric soils may not bepresent even if wetland hydrology exists. In these areas, use vegetation andindicators of hydrology other than soils (e.g. hydrological records, water marks,water-stained leaves) to delineate the BVW boundary.
w Areas that have been recently drained will usually possess hydric soil indicators butlack other indicators of hydrology. Wetland plants may be present or absentdepending on how recently and how extensively the hydrology has been altered.Hydric soils are often the best indicators for delineating recently drained wetlands.
w Areas where vegetation has been altered or removed - such as golf courses, lawns,and agricultural fields - require the use of soils and other indicators of hydrology todelineate BVW boundaries. In some cases, such as where vegetation has been cutor removed (e.g. ongoing forestry activity), remnant vegetation should be consid-ered, but other indicators of hydrology also should be used to establish the BVWboundary.
w Areas where fill has been placed in wetlands require the analysis of soils directlybeneath the fill. A hole must be dug through the fill until the original soil isexposed. Look for evidence of a buried surface horizon and evidence of normalhorizonation (topsoil and subsoil layers). Soil surveys may be useful as a referencefor distinguishing between the original soil and fill material. Once you have dugthrough the fill, analyze the original soils and determine whether they are hydricsoils or not. Look for evidence of soil saturation (see page 35). If the fill is recent,there also may be identifiable plant parts beneath the fill that can be used to helpdelineate the BVW boundary.
w Areas where soil and vegetation have been removed often are the most difficult sitesto evaluate. In these cases, historical records, such as NWI maps and aerialphotographs, and visual assessments of adjacent sites may be useful in establishingthe BVW boundary.

49Delineating Bordering Vegetated Wetlands
Delineating and Reviewing BVW Boundaries
Winter DelineationsDelineating or verifying BVW boundaries during the winter months, especially withdeep snow cover or frozen soil conditions, is difficult and under some extreme circum-stances virtually impossible. Vegetation and other indicators of hydrology that are usedto determine BVW boundaries are not readily observable or may be misleading duringthese times.
Herbaceous vegetation or remnant vegetation (nuts, fruits, leaves) may be present butnot visible if covered with snow. An example is the fertile frond of the sensitive fern(Onoclea sensibilis), which is persistent throughout the year, but may be hidden by deepsnow.
Indicators of hydrology may be misleading or covered with snow. An example would bepockets or channels of ice on the ground surface. This condition may appear to indicatethe presence of wetland hydrology, but also may be due to a number of different factors,such as snow melt that quickly freezes or a quick temperature drop after a brief rain thatoccurred with frozen soil conditions. As a practical matter, frozen soil conditions makedigging holes and accurately observing the soil profile difficult or nearly impossible.Morphological adaptations (such as swollen trunks) and subtle changes in topographyalso are difficult to observe when deep snow conditions are present.
For these reasons, DEP recommends that BVW delineations be avoided if possible whendeep snow cover or “deep freeze” conditions exist. It is best for applicants and conser-vation commissions to agree upon a reasonable time period for continuing the RDA orNOI processes in order to conduct or review the boundary delineation when frozen orsnow covered conditions are likely to change. Because winter delineations are moredifficult to do, disagreements - and subsequent appeals - may arise. Avoiding lengthyappeals and disagreements will benefit all parties involved.
When deep snow conditions do not exist, it may be possible to delineate BVW bound-aries during the winter by using twigs, buds, leaf scars, and other vegetative indicators.
Fertile frond ofthe sensitivefern (Onocleasensibilis)
Winter Wetland Site

Delineating Bordering Vegetated Wetlands50
Delineating and Reviewing BVW Boundaries
Reviewing Boundary DelineationsReviewing boundary delineations is usually the first step, and quite often the mostimportant part, in effectively administering the Wetlands Protection Act. In the Requestfor Determination of Applicability (RDA) process, a boundary delineation decision iseffective for three years. In the Notice of Intent (NOI) process, a delineation is requiredto evaluate whether performance standards are being met. The accurate delineation ofthe BVW boundary is critical to wetlands protection because what may appear to beminor differences in delineation can translate to a substantial amount of wetlands loss(e.g. 20 feet wide x 500 feet long = 10,000 square feet of wetlands loss). Much of theinformation included in this handbook, especially the procedures, can be applied to thereview of proposed BVW boundary delineations.
Information about the BVW boundary delineation should be submitted in NOI or RDAapplications. For complex or large sites, applicants should submit plans with a surveyedwetlands line showing the location of numbered flags. The DEP field data form or anexplanation of the assessment method used to determine the boundary should always besubmitted for complex sites.
For small projects within (or beyond) the 100-foot buffer zone - such as construction of ahouse where work is limited to the buffer zone - surveyed plans, detailed assessments,and field data forms may not be necessary. In these cases, an assessors map or plot planwith the house location and BVW boundary noted on the plan may be sufficient. In allcases, however, the BVW boundary should be marked in the field.
Conservation commissions are responsible for reviewing the accuracy of an applicant'sflagged BVW boundary. In reviewing BVW boundary delineations, conservationcommissioners should review all the information that is submitted by the applicant orthat is available. Therefore, vegetation must always be reviewed, and indicators ofwetlands hydrology must be reviewed as well in those situations where that additionalinformation is submitted. It may be helpful to have the applicant or the applicant’srepresentative present during the site visit to answer questions about the delineation.
There is often much interpretation involved in BVW delineation. In some cases, it maynot be possible to precisely locate the wetland/upland boundary and experiencedprofessionals may differ in where they choose to put the line. However, these differencesshould not be large. Conservation commissions may want to hire a consultant to reviewdelineations in difficult situations. The following are some procedures for reviewingdelineations:
1. Before going to the site, review topographicmaps, NRCS soils maps, site plans, andother available information so that you arefamiliar with the site. In particular, look forareas on the maps that might be wetlandsbut are not included on the site plansprovided by the applicant. Make notes ofany questions or concerns based on yourreview of the maps and plans, and ask themat the site visit. Determine which procedurethe applicant used to analyze the vegetation.If the dominance test was not used, famil-iarize yourself with the basic principles andprocedures of the methodology that wasused to perform the analysis. Review theDEP field data form, when submitted, tobecome familiar with the vegetation and soils information.

51Delineating Bordering Vegetated Wetlands
Delineating and Reviewing BVW Boundaries
2. Go to the site to review the BVW boundary delineation. Once at the site, walkaround the area using the site plans to orient yourself. Is there any evidence thatthe vegetation or hydrology of the site has been altered? If so, use information inthe previous section on delineating BVWs where the hydrology or vegetation hasbeen altered to review the BVW boundary.
3. Once you are well-oriented to the site, walk the BVW boundary as delineated by theapplicant. The boundary should be flagged so that when standing at one flaglocation, the next one is always visible. These flags should be numbered and thenumbered flags identified on the site plans.
4. Determine if the BVW boundary in the field matches the plans. If the plans weredrawn incorrectly, they should be adjusted accordingly.
5. Determine if the BVW boundary is accurately delineated:
w If the delineation is based on vegetation alone, review the vegeta-tive community to determine if 50 percent or more of the domi-nant plants are wetland indicator plants. In addition, look fortopographic changes, variations in the herbaceous plant commu-nity, or an obvious change in the presence or absence of a specificplant species that is present in the adjacent wetland or upland. Ifnecessary, use other indicators of hydrology.
w If the delineation is based on vegetation and indicators of hydrol-ogy, review the vegetative community to determine if 50 percentor more of the dominant plants are wetland indicator plants.Determine whether hydric soils (or other indicators of hydrology)are present. You can examine the applicant’s soil test holes or dignew ones. In addition, look for topographic changes, variations inthe herbaceous plant community, or an obvious change in thepresence or absence of a specific plant species that is present inthe adjacent wetland or upland.
6. If there are questions about the location of the BVW boundary:
w Ask the person who delineated the boundary to explain theirdecision in areas where you have questions. Requestadditional data forms and transects in areas that are disputedbased on an on-site assessment. If additional field workis requested for a certain area, the conservation commissionshould indicate why it has questions or concerns about thatportion of the delineation (e.g. the boundary does not appear toreflect a change in the vegetative community in a specific area).
w If a consensus cannot be reached, the conservation commissionmay need to decide the location of the BVW boundary. In thesecircumstances, the commission should adjust the delineation byhanging flags in the field or making notes on the plans (eg. flag#A-12, move 15 feet upgradient). The applicant should show theconservation commission’s boundary on the plan.

Delineating Bordering Vegetated Wetlands52
Appendix A
APPENDIX AWetland Indicator Plants Identified in theMassachusetts Wetlands Protection Act(M.G.L. c. 131, §40)
The Wetlands Protection Act lists plants by a common name and one of the following:family name, genus name, or species name. (Note: the species name, also known as thescientific name, is made up of the genus and species.) The list in the Act is general andis not meant to include all plants that occur in wetlands. Also, some plants are listedonly by family or genus. These are broad categories that include wetland plants as wellas non-wetland plants. For instance, the family Juncaceae is comprised of many rushesof which only some are wetland indicator plants. Also, the genus Fraxinus includeswetland plant species (green ash, Fraxinus pennsylvanica; black ash, Fraxinus nigra),as well as a non-wetland plant (white ash, Fraxinus americana). As a result, DEP hasdetermined that the plants listed in the Act only by scientific name (plants with a genusand species name) are considered wetland indicator plants. Plants listed in the Act byfamily or genus only must also be listed in the National List as OBL, FACW+, FACW,FACW-, FAC+ or FAC species to be considered wetland indicator plants. In addition,all plants in the genus Sphagnum are considered wetland indicator plants (species in thisgenus have not yet been categorized by indicator category).
The following plants are listed by scientific name in the Act. (Note: the National Listindicator category is included here for reference.)
American or white elm (Ulmus americana) FACW-aster (Aster nemoralis) FACW+azalea (Rhododendron canadense) FACWazalea (Rhododendron viscosum) OBLblack alder (Ilex verticillata) FACW+black gum tupelo (Nyssa sylvatica) FACblack spruce (Picea mariana) FACW-buttonbush (Cephalanthus occidentalis) OBLcowslip (Caltha palustris) OBLcranberry (Vaccinium macrocarpon) OBLhemlock (Tsuga canadensis) FACUhighbush blueberry (Vaccinium corymbosum) FACW-larch (Larix laricina) FACWlaurel (Kalmia angustifolia) FAClaurel (Kalmia polifolia) OBLleatherleaf (Chamaedaphne calyculata) OBLmarsh fern (Dryopteris thelypteris) FACW+pitcher plants (Sarracenia purpurea) OBLpoison sumac (Toxicodendron vernix) OBLred maple (Acer rubrum) FACsensitive fern (Onoclea sensibilis) FACWskunk cabbage (Symplocarpus foetidus) OBLspicebush (Lindera benzoin) FACW-sweet gale (Myrica gale) OBLsweet pepper bush (Clethra alnifolia) FAC+water willow (Decodon verticillatus) OBLwhite cedar (Chamaecyparis thyoides) OBLwhite Hellebore (Veratrum viride) FACW+

53Delineating Bordering Vegetated Wetlands
Appendix B
APPENDIX BMeasuring Basal Area
Basal area may be used to estimate percent dominance of trees for vegetative analysis.Trees are woody plants with a diameter at breast height (dbh) of 5 inches or greater anda height of 20 feet or more. Basal area is the cross-sectional area of a tree trunk at
breast height (measured 4.5 feet from theground). To visualize basal area, imagine atree trunk cut off 4.5 feet above the ground;basal area is the surface area of the top of thestump. Basal area can be added for a numberof trees and used like any other unit ofmeasure in analyses of vegetative communi-ties. Trees with multiple trunks that originatebelow 4.5 feet should be counted as two ormore trees (depending on the number oftrunks). Each trunk of a multiple trunk treeshould be counted separately when determin-ing total basal area for a plant species. Forinstance, each trunk of a three-trunk redmaple would be measured individually todetermine basal area for that species.
One method for calculating basal areainvolves measuring diameter at breast height (dbh) for each tree in a sampling plot andthen using a formula for the area of a circle to calculate basal area (basal area = π d2 ÷4). (Note: π = 3.1416.) Diameter at breast height is measured using a diameter tape orcalipers or is calculated from measurements of circumference at breast height (d =circumference ÷ π). Each conversion of circumference to dbh, or dbh to basal area,must be done separately for each tree trunk before basal areas are added for analysis.See page 54 for a Basal Area Conversion Table that converts circumference (in inches)or dbh (in inches) to basal area (in square inches) for use in vegetative analyses.
Example:Calculating Basal Area for Trees When theCircumference at Breast Height is Measured
Tree 1 with circumference of 42 inchesdiameter = circumference ÷ πdiameter = 42 ÷ 3.1416 = 13.37 inchesbasal area = π d2 ÷ 4basal area = 3.1416 x (13.37)2 ÷ 4 = 140.4 square inches (sq. in.)
Tree 2 with circumference of 31 inchesdiameter = 31 inches ÷ 3.1416 = 9.87 inchesbasal area = 3.1416 x (9.87)2 ÷ 4 = 76.5 sq. in.
Tree 3 with circumference of 27 inchesdiameter = 27 ÷ 3.1416 = 8.59 inchesbasal area = 3.1416 x (8.59)2 ÷ 4 = 58 sq. in.
Basal area of all three trees:140.4 sq. in. + 76.5 sq. in. + 58 sq. in. = 274.9 or 275 sq. in.
See Example #1 in Appendix C to use basal area calculations in a dominance testanalysis.

Appendix B
Delineating Bordering Vegetated Wetlands54
Basal Area Conversion Table(converts circumference or dbh in inches to basal area in square inchesfor use in vegetative analyses; note: π = 3.1416 for these calculations)
Circumferencein Inches
15.716.017.018.019.020.021.022.023.024.025.026.027.028.029.030.031.032.033.034.035.036.037.038.039.040.041.042.043.044.045.046.047.048.049.050.051.052.053.054.055.056.057.058.059.060.061.062.063.064.065.066.067.068.069.070.0
Basal AreaSq. Inches
19.620.423.025.828.731.835.138.542.145.849.753.858.062.466.971.676.581.586.792.097.5103.1108.9114.9121.0127.3133.8140.4147.1154.1161.1168.4175.8183.3191.1198.9207.0215.2223.5232.0240.7249.6258.5267.7277.0286.5296.1305.9315.8325.9336.2346.6357.2368.0378.9389.9
Diameterin Inches
5.05.15.45.76.06.46.77.07.37.68.08.38.68.99.29.59.910.210.510.811.111.511.812.112.412.713.113.413.714.014.314.615.015.315.615.916.216.616.917.217.517.818.118.518.819.119.419.720.120.420.721.021.321.622.022.3
Circumferencein Inches
Basal AreaSq. Inches
Diameterin Inches
71.072.073.074.075.076.077.078.079.080.081.082.083.084.085.086.087.088.089.090.091.092.093.094.095.096.097.098.099.0100.0101.0102.0103.0104.0105.0106.0107.0108.0109.0110.0111.0112.0113.0114.0115.0116.0117.0118.0119.0120.0121.0122.0123.0124.0125.0126.0
22.622.923.223.623.924.224.524.825.125.525.826.126.426.727.127.427.728.028.328.629.029.329.629.930.230.630.931.231.531.832.132.532.833.133.433.734.134.434.735.035.335.736.036.336.636.937.237.637.938.238.538.839.239.539.840.1
401.1412.5424.1435.8447.6459.6471.8484.1496.6509.3522.1535.1548.2561.5574.9588.6602.3616.2630.3644.6659.0673.5688.3703.1718.2733.4748.7764.3779.9795.8811.8827.9844.2860.7877.3894.1911.1928.2945.5962.9980.5998.21016.11034.21052.41070.81089.31108.01126.91145.91165.11184.41203.91223.61243.41263.4

Appendix C
55Delineating Bordering Vegetated Wetlands
AP
PE
ND
IX C
Ad
ditio
nal E
xamp
les of V
egetatio
nA
nalysis U
sing
the D
om
inan
ce Test
Do
min
ance T
est Exam
ple #1
(usin
g b
asal area for th
e tree layer and
percen
t cover fo
r all oth
er layers; species d
om
inan
t in m
ore th
an o
ne layer)
Plant species
Scientific name
% C
over%
Dom
inanceD
ominant plant
Wetland
(yes or no)indicatorcategory*
Ground C
overInterrupted fern
Osm
unda claytoniana 60
46.2yes
FAC
*W
hite pineP
inus strobus 45
34.6yes
FAC
UL
owbush blueberry
Vaccinium angustifolium
20 15.4
noTeaberry
Gaultheria procum
bens 5
3.8no
Total percent cover:130
Shrub
Sweet pepperbush
Clethra alnifolia
15 42.9
yesFA
C+
*G
lossy buckthornR
hamnus frangula
15 42.9
yesFA
C*
Gray-stem
dogwood
Cornus foem
ina 5
14.3no
Total percent cover: 35
Sapling
Red m
apleA
cer rubrum 25
83.3yes
FAC
*W
hite pineP
inus strobus 5
16.7no
Total percent cover: 30
Layers continued, next page
* = Wetland indicator plant

Appendix C
56 Delineating Bordering Vegetated Wetlands
Plant species
Scientific name
Basal area
% D
ominance
Dom
inant plantW
etland(sq. in.)
(yes or no)indicatorcategory*
Tree
Red m
apleA
cer rubrum403
48.6yes
FAC
*W
hite pineP
inus strobus365
44.0yes
FAC
UG
ray birchB
etula populifolia 61
7.4no
Total basal area:829 sq. in.
* = Wetland indicator plant
Dom
inant plantsL
ayerW
etland indicator plant
Interrupted fernO
smunda claytoniana
ground coveryes
White pine
Pinus strobus
ground coverno
Sweet pepperbush
Clethra alnifolia
shrubyes
Glossy buckthorn
Rham
nus frangulashrub
yesR
ed maple
Acer rubrum
saplingyes
Red m
apleA
cer rubrumtree
yesW
hite pineP
inus strobustree
no
Total number of w
etland indicator plants = 5Total num
ber of non-wetland indicator plants = 2
In this example, percent cover w
as measured for plant species in the ground cover, shrub, and sapling layers and basal area w
as calculated for species inthe tree layer. Percent dom
inance was calculated for each species by dividing each species’ percent cover by total percent cover for the layer, or basal
area by total basal area.
In the ground cover layer, interrupted fern (% dom
inance = 46.2) does not meet the 50 percent threshold, but the com
bined total for interrupted fern andw
hite pine does (% dom
inance = 80.8). Both of these species are considered dom
inant plants.
Sweet pepperbush and glossy buckthorn are considered dom
inant plants in the shrub layer because their percent dominance taken together (85.8%
),im
mediately exceeds the 50 percent threshold (neither species exceeds the threshold on its ow
n).

Appendix C
57Delineating Bordering Vegetated Wetlands
Red m
aple is the only dominant plant in the sapling layer because its percent dom
inance (83.3%) exceeds the 50 percent threshold and the other species
present in the layer (white pine) has a percent dom
inance of less than 20 percent.
In the tree layer, the two m
ost abundant species are dominant plants. T
he most abundant plant alone, red m
aple, does not have a percent dominance
(48.6%) that equals or exceeds 50 percent. H
owever, the com
bined percent dominance for the tw
o most abundant species does (red m
aple and white
pine).
Red m
aple is a dominant plant in the tree and sapling layers and w
hite pine is dominant in the tree and ground cover layers. A
s a result, red maple and
white pine are each listed tw
ice in the list of dominant plants.
Even though basal area w
as used for the tree layer and percent cover for the other three layers, dominant plants from
all layers are combined to determ
inew
hether 50 percent of the species are wetland indicator plants. In this exam
ple, there are seven dominant plants. Five of the seven dom
inant plants arew
etland indicator plants and two are non-w
etland indicator plants. Therefore, under the dom
inance test procedure, the wetland vegetation criterion has
been met.
If vegetation alone is presumed adequate for the delineation, the plot is in a B
VW
. If vegetation alone is not presumed adequate, or to overcom
e thepresum
ption, other indicators of hydrology also should be used to delineate the BV
W boundary. (See C
hapter Three.)

Appendix C
58 Delineating Bordering Vegetated Wetlands
Do
min
ance T
est Exam
ple #2
(usin
g p
ercent co
ver rang
es and
mid
po
int valu
es; on
e layer with
total p
ercent co
ver less than
5 percen
t)
Plant species
Scientific name
% C
over%
Dom
inanceD
ominant plant
Wetland
(yes or no)indicatorcategory*
Ground C
overO
strich fernM
atteuccia struthiopteris 38.0
30.9yes
FAC
W*
False nettleB
oehmeria cylindrica
38.0 30.9
yesFA
CW
+*D
evil’s beggar-ticksB
idens frondosa 20.5
16.7no
Silver maple
Acer saccharinum
20.5 16.7
noFringed sedge
Carex crinita
3.0 2.4
noC
ardinal flower
Lobelia cardinalis 3.0
2.4no
Total percent cover:123.0
Shrub
Silky dogwood
Cornus am
omum
20.5100.0
yesFA
CW
*
Total percent cover:20.5
Sapling
Silver maple
Acer saccharinum
3.0100.0
no
Total percent cover: 3.0
Tree
Silver maple
Acer saccharinum
38.0 42.5
yesFA
CW
*E
astern cottonwood
Populus deltoides
38.0 42.5
yesFA
C*
Am
erican elmU
lmus am
ericana10.5
11.7no
Pin oakQ
uercus palustris 3.0
3.4no
Total percent cover:89.5
* = Wetland indicator plant

Appendix C
59Delineating Bordering Vegetated Wetlands
Dom
inant plantsL
ayerW
etland indicator plant
Ostrich fern
Matteuccia struthiopteris
ground coveryes
False nettleB
oehmeria cylindrica
ground coveryes
Silky dogwood
Cornus am
omum
shrubyes
Silver maple
Acer saccharinum
treeyes
Eastern cottonw
oodP
opulus deltoidestree
yes
Total number of w
etland indicator plants = 5Total num
ber of non-wetland indicator plants = 0
Plant species were identified and percent cover estim
ated for each species in each of four layers. Percent cover was visually estim
ated, therefore, them
idpoint values of cover ranges were used to calculate dom
inance (see page 12 for discussion of cover ranges and midpoints). Percent dom
inance was
calculated for each species by dividing percent cover (midpoints) by total percent cover.
In the ground cover layer, ostrich fern and false nettle are considered dominant plants because their percent dom
inance taken together (61.8%),
imm
ediately exceeds the 50 percent threshold (neither species exceeds the threshold on its own).
Silky dogwood is the only plant species in the shrub layer. T
he total percent cover for the layer (20.5%) exceeds 5 percent, therefore, the layer is
included. Silky dogwood is considered a dom
inant plant since its percent dominance (100%
) exceeds the 50 percent threshold.
Silver maple is the only plant species in the sapling layer. H
owever, the total percent cover for the layer (3%
) is less than 5 percent, therefore, thesapling layer is not included in the dom
inance test.
For the tree layer, silver maple and eastern cottonw
ood are considered dominant plants because their percent dom
inance taken together (85%), im
medi-
ately exceeds the 50 percent threshold (neither species exceeds the threshold on its own).
The area used for this exam
ple has five dominant plants. Since all five dom
inant plants are wetland indicator plants, under the dom
inance testprocedure, the w
etland vegetation criterion has been met.
If vegetation alone is presumed adequate for the delineation, the plot is in a B
VW
. If vegetation alone is not presumed adequate, or to overcom
e thepresum
ption, other indicators of hydrology also should be used to delineate the BV
W boundary. (See C
hapter Three.)
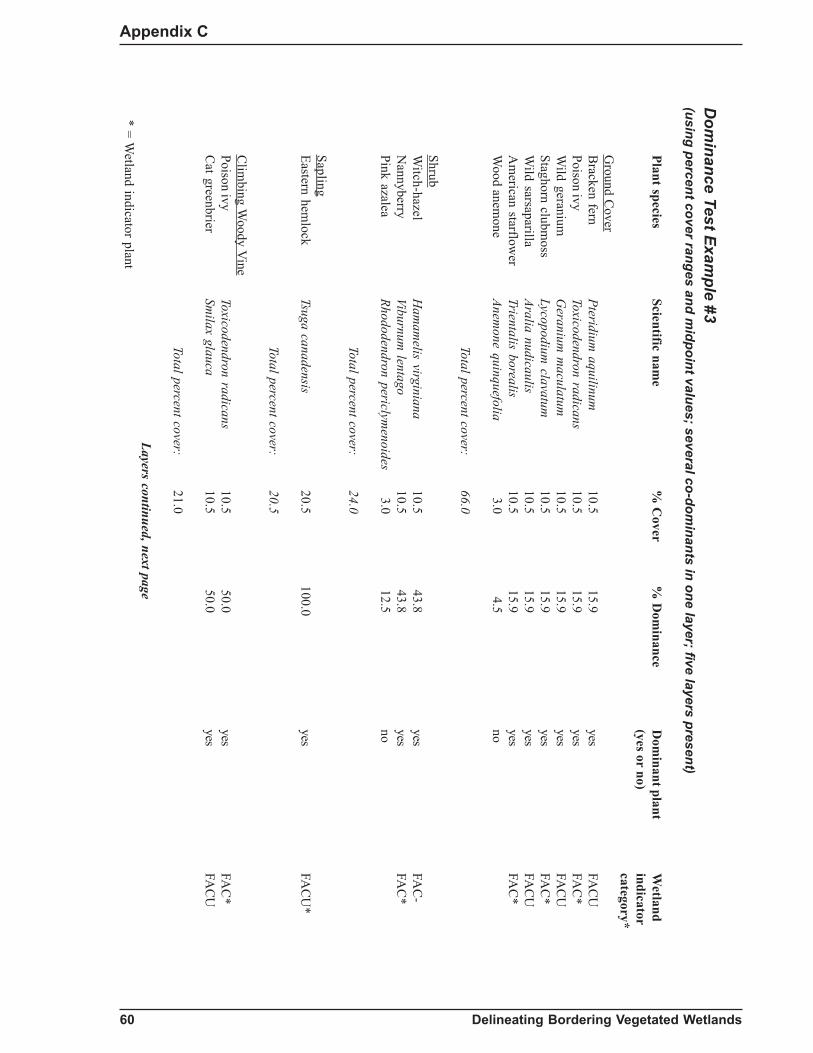
Appendix C
60 Delineating Bordering Vegetated Wetlands
Do
min
ance T
est Exam
ple #3
(usin
g p
ercent co
ver rang
es and
mid
po
int valu
es; several co-d
om
inan
ts in o
ne layer; five layers p
resent)
Plant species
Scientific name
% C
over%
Dom
inanceD
ominant plant
Wetland
(yes or no)indicatorcategory*
Ground C
overB
racken fernP
teridium aquilinum
10.5 15.9
yesFA
CU
Poison ivyToxicodendron radicans
10.5 15.9
yesFA
C*
Wild geranium
Geranium
maculatum
10.5 15.9
yesFA
CU
Staghorn clubmoss
Lycopodium clavatum
10.5 15.9
yesFA
C*
Wild sarsaparilla
Aralia nudicaulis
10.5 15.9
yesFA
CU
Am
erican starflower
Trientalis borealis10.5
15.9yes
FAC
*W
ood anemone
Anem
one quinquefolia 3.0
4.5no
Total percent cover:66.0
Shrub
Witch-hazel
Ham
amelis virginiana
10.5 43.8
yesFA
C-
Nannyberry
Viburnum lentago
10.5 43.8
yesFA
C*
Pink azaleaR
hododendron periclymenoides
3.0 12.5
no
Total percent cover:24.0
Sapling
Eastern hem
lockTsuga canadensis
20.5100.0
yesFA
CU
*
Total percent cover:20.5
Clim
bing Woody V
inePoison ivy
Toxicodendron radicans10.5
50.0yes
FAC
*C
at greenbrierSm
ilax glauca10.5
50.0yes
FAC
U
Total percent cover:21.0
Layers continued, next page
* = Wetland indicator plant

Appendix C
61Delineating Bordering Vegetated Wetlands
Plant species
Scientific name
% C
over%
Dom
inanceD
ominant plant
Wetland
(yes or no)indicatorcategory*
Tree
Red m
apleA
cer rubrum38.0
42.5yes
FAC
*B
lack birchB
etula lenta20.5
22.9yes
FAC
UW
hite ashF
raxinus americana
20.522.9
yesFA
CU
White oak
Quercus alba
10.511.7
no
Total percent cover:89.5
* = Wetland indicator plant
Dom
inant Plants
Layer
Wetland indicator plant
Bracken fern
Pteridium
aquilinumground cover
noPoison ivy
Toxicodendron radicansground cover
yesW
ild geraniumG
eranium m
aculatumground cover
noStaghorn clubm
ossLycopodium
clavatumground cover
yesW
ild sarsaparillaA
ralia nudicaulisground cover
noA
merican starflow
erTrientalis borealis
ground coveryes
Witch-hazel
Ham
amelis virginiana
shrubno
Nannyberry
Viburnum lentago
shrubyes
Eastern hem
lockTsuga canadensis
saplingyes
Poison ivyToxicodendron radicans
climbing w
oody vineyes
Cat greenbrier
Smilax glauca
climbing w
oody vineno
Red m
apleA
cer rubrumtree
yesB
lack birchB
etula lentatree
noW
hite ashF
raxinus americana
treeno
Total number of w
etland indicator plants = 7Total num
ber of non-wetland indicator plants = 7
Plant species were identified and percent cover estim
ated for each species in each of five layers. Percent cover was visually estim
ated, therefore,m
idpoint values for the cover ranges were used to calculate dom
inance (see page 12 for discussion of cover ranges and midpoints). Percent dom
inancew
as calculated for each species by dividing percent cover (midpoints) by total percent cover.

Appendix C
62 Delineating Bordering Vegetated Wetlands
In the ground cover layer, six species are co-equal as the most abundant plants in the layer, each w
ith a percent dominance of 15.9 percent. A
lthoughonly four of these species are required to exceed the 50 percent threshold, all six species are considered dom
inant plants because they are equallyabundant.
In the shrub layer, witch-hazel and nannyberry are considered dom
inant plants because their percent dominance taken together (87.6%
), imm
ediatelyexceeds the 50 percent threshold (neither species exceeds the threshold on its ow
n).
Eastern hem
lock is the only plant species in the sapling layer. Since the total percent cover for the layer (20.5%) exceeds 5 percent, the layer is
included. Eastern hem
lock is considered a dominant plant since its percent dom
inance (100%) exceeds the 50 percent threshold. It is also considered
a wetland indicator plant since it is a plant species listed in the W
etlands Protection Act.
In the climbing w
oody vine layer, poison ivy and cat greenbrier are considered dominant plants because each has a percent dom
inance of 50 percent.
For the tree layer, the most abundant plant alone (red m
aple) does not exceed the 50 percent threshold. Black birch and w
hite ash are co-equal as thenext m
ost abundant species, therefore, both are required to exceed the 50 percent threshold. As a result, red m
aple, black birch, and white ash are
dominant plants in the tree layer.
The area used for this exam
ple has 14 dominant plants. Since the num
ber of dominant w
etland indicator plants (7) equals the number of dom
inantnon-w
etland indicator plants (7), under the dominance test procedure, the w
etland vegetation criterion has been met.
If vegetation alone is presumed adequate for the delineation, the plot is in a B
VW
. If vegetation alone is not presumed adequate, or to overcom
e thepresum
ption, other indicators of hydrology also should be used to delineate the BV
W boundary. (See C
hapter Three.)

Appendix C
63Delineating Bordering Vegetated Wetlands
Do
min
ance T
est Exam
ple #4
(usin
g p
ercent co
ver rang
es and
mid
po
int valu
es; plan
ts with
ph
ysiolo
gical o
r mo
rph
olo
gical ad
aptatio
ns)
Plant species
Scientific name
% C
over%
Dom
inanceD
ominant plant
Wetland
(yes or no)indicatorcategory*
Ground C
overSensitive fern
Onoclea sensibilis
38.0100
yesFA
CW
*
Total percent cover:38.0
Shrub
Highbush blueberry
Vaccinium corym
bosum38.0
78.4yes
FAC
W-*
Witch-hazel
Ham
amelis virginiana
10.521.6
yesFA
C-
Total percent cover:48.5
Sapling
Red m
apleA
cer rubrum20.5
50yes
FAC
*W
hite pineP
inus strobus20.5
50yes
FAC
U
Total percent cover:41.0
Tree
Red m
apleA
cer rubrum20.5
66yes
FAC
*W
hite pineP
inus strobus10.5
33.9yes
FAC
U*
(shallowroots/ sw
ollenTotal percent cover:
31.0trunks)
* = Wetland indicator plant

Appendix C
64 Delineating Bordering Vegetated Wetlands
Dom
inant plantsL
ayerW
etland indicator plant
Sensitive fernO
noclea sensibilisground cover
yesH
ighbush blueberryVaccinium
corymbosum
shrubyes
Witch-hazel
Ham
amelis virginiana
shrubno
Red m
apleA
cer rubrumsapling
yesW
hite pineP
inus strobussapling
noR
ed maple
Acer rubrum
treeyes
White pine
Pinus strobus
treeyes
Total number of w
etland indicator plants = 5Total num
ber of non-wetland indicator plants = 2
Plant species were identified and percent cover estim
ated for each species in each of four layers. Percent cover was visually estim
ated, therefore, them
idpoint values of cover ranges were used to calculate dom
inance (see page 12 for discussion of cover ranges and midpoints). Percent dom
inance was
calculated for each species by dividing percent cover (midpoints) by total percent cover.
Sensitive fern is the only plant in the ground cover layer. Since the total percent cover of the layer (38%) exceeds 5 percent, sensitive fern is a dom
i-nant plant.
The shrub layer has tw
o plants, highbush blueberry and witch-hazel. H
ighbush blueberry is a dominant plant since its percent dom
inance (78.4%)
exceeds 50 percent. Witch-hazel also is a dom
inant plant since its percent dominance (21.6%
) exceeds 20 percent.
In the sapling layer, both red maple and w
hite pine have a percent dominance of 50%
, therefore each are considered dominant plants.
The tree layer has red m
aple with percent dom
inance of 66% and w
hite pine with percent dom
inance of 33.9%. E
ach are dominant plants.
In this example, w
hite pine in the tree layer has been identified as a wetland indicator plant since the plants w
ere observed to have shallow roots and
swollen trunks. Since these adaptations to w
et conditions were observed, these plant species can be considered w
etland indicator plants.
The area used for this exam
ple has seven dominant plants. Since the num
ber of dominant w
etland indicator plants (5) is greater than the number of
dominant non-w
etland indicator plants (2), under the dominance test procedure, the w
etland vegetation criterion has been met.
If vegetation alone is presumed adequate for the delineation, the plot is in a B
VW
. If vegetation alone is not presumed adequate, or to overcom
e thepresum
ption, other indicators of hydrology also should be used to delineate the BV
W boundary. (See C
hapter Three.)

Appendix C
65Delineating Bordering Vegetated Wetlands
Do
min
ance T
est Exam
ple # 5
(usin
g p
ercent co
ver rang
es and
mid
po
int valu
es; several co-d
om
inan
ts in o
ne layer)
Plant species
Scientific name
% C
over%
Dom
inanceD
ominant plant
Wetland
(yes or no)indicatorcategory*
Ground cover
Bracken fern
Pteridium
aquilinum10.5
15.9yes
FAC
UPoison ivy
Toxicodendron radicans10.5
15.9yes
FAC
*W
ild geraniumG
eranium m
aculatum10.5
15.9yes
FAC
UStaghorn clubm
ossLycopodium
clavatum10.5
15.9yes
FAC
*W
ild sarsaparillaA
ralia nudicaulis10.5
15.9yes
FAC
UA
merican starflow
erTrientalis borealis
10.515.9
yesFA
C*
Wood anem
oneA
nemone quinquefolia
3.0 4.5
no
Total percent cover:66.0
Shrub
Witch-hazel
Ham
amelis virginiana
10.543.8
yesFA
C-
Nannyberry
Viburnum lentago
10.543.8
yesFA
C*
Pink azaleaR
hododendron periclymenoides
3.012.5
no
Total percent cover:24.0
Sapling
White oak
Quercus alba
20.5100
yesFA
CU
-
Total percent cover:20.5
Tree
Red m
apleA
cer rubrum38.0
42.5yes
FAC
*B
lack birchB
etula lenta20.5
22.9yes
FAC
UW
hite ashF
raxinus americana
20.522.9
yesFA
CU
White oak
Quercus alba
10.511.7
no
Total percent cover:89.5
* = Wetland indicator plant

Appendix C
66 Delineating Bordering Vegetated Wetlands
Dom
inant plantsL
ayerW
etland indicator plantB
racken fernP
teridium aquilinum
ground coverno
Poison ivyToxicodendron radicans
ground coveryes
Wild geranium
Geranium
maculatum
ground coverno
Staghorn clubmoss
Lycopodium clavatum
ground coveryes
Wild sarsaparilla
Aralia nudicaulis
ground coverno
Am
erican starflower
Trientalis borealisground cover
yesW
itch-hazelH
amam
elis virginianashrub
noN
annyberryViburnum
lentagoshrub
yesW
hite oakQ
uercus albasapling
noR
ed maple
Acer rubrum
treeyes
Black birch
Betula lenta
treeno
White ash
Fraxinus am
ericanatree
no
Total number of w
etland indicator plants = 5Total num
ber of non-wetland plants = 7
Plant species were identified and percent cover estim
ated for each species in each of four layers. Percent cover was visually estim
ated, therefore, them
idpoint values for the cover ranges were used to calculate dom
inance (see page 12 for discussion of cover ranges and midpoints). Percent dom
inancew
as calculated for each species by dividing percent cover (midpoints) by total percent cover.
In the ground cover layer, six species are co-equal as the most abundant plants in the layer, each w
ith a percent dominance of 15.9 percent. A
lthoughonly four of these species are required to exceed the 50 percent threshold, all six species are considered dom
inant plants because they are equallyabundant.
In the shrub layer, witch-hazel and nannyberry are considered dom
inant plants because their percent dominance taken together (87.6%
), imm
ediatelyexceeds the 50 percent threshold (neither species exceeds the threshold on its ow
n).
White oak is the only plant species in the sapling layer. Since the total percent cover for the layer (20.5%
) exceeds 5 percent, the layer is included.W
hite oak is a dominant plant since its percent dom
inance (100%) exceeds the 50 percent threshold.
For the tree layer, the most abundant plant alone (red m
aple) does not exceed the 50% threshold. B
lack birch and white ash are co-equal as the next
most abundant species, therefore, both are required to exceed the 50 percent threshold. A
s a result, red maple, black birch, and w
hite ash are domi-
nant plants in the tree layer.
The area used for this exam
ple has 12 dominant plants. Five of the 12 dom
inant plants are wetland indicator plants, and 7 dom
inants are non-wetland
indicator plants. Since the number of dom
inant wetland indicator plants is less than the num
ber of dominant non-w
etland indicator plants, thew
etland vegetation criterion has not been met.

Appendix C
67Delineating Bordering Vegetated Wetlands
Do
min
ance T
est Exam
ple #6
(usin
g p
ercent co
ver rang
es and
mid
po
int valu
es; on
e layer with
total p
ercent co
ver less than
5 percen
t; with
un
iden
tified p
lant sp
ecies)
Plant species
Scientific name
% C
over%
Dom
inanceD
ominant plant
Wetland
(yes or no)indicatorcategory*
Ground cover
Ostrich fern
Matteuccia struthiopteris
38.0 30.9
yesFA
CW
*False nettle
Boehm
eria cylindrica 38.0
30.9yes
FAC
W+*
Species A?
20.5 16.7
noSpecies B
? 20.5
16.7no
Species C?
3.0 2.4
noSpecies D
? 3.0
2.4no
Total percent cover:123.0
Shrub
Silky dogwood
Cornus am
omum
20.5100.0
yesFA
CW
*
Total percent cover: 20.5
Sapling
Species X?
3.0100.0
no
Total percent cover : 3.0
Tree
Silver maple
Acer saccharinum
38.0 42.5
yesFA
CW
*E
astern cottonwood
Populus deltoides
38.0 42.5
yesFA
C*
Am
erican elmU
lmus am
ericana 10.5
11.7no
Species Y?
3.0 3.3
no
Total percent cover: 89.5
* = Wetland indicator plant
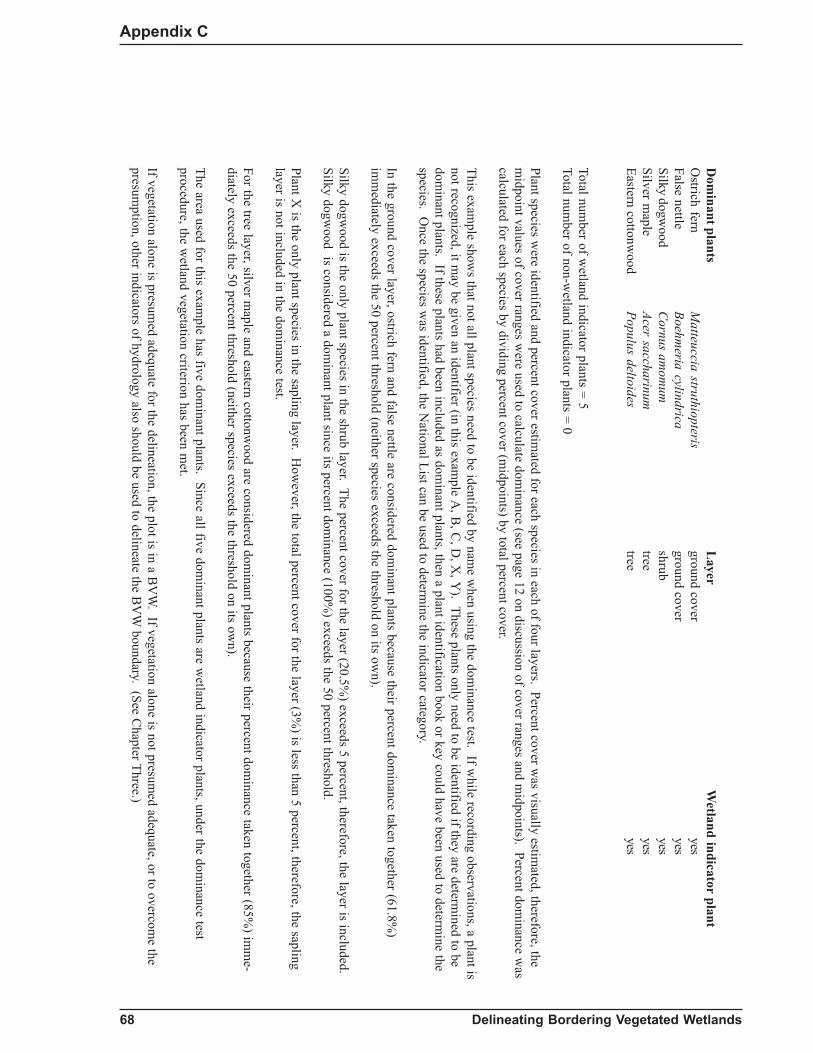
Appendix C
68 Delineating Bordering Vegetated Wetlands
Dom
inant plantsL
ayerW
etland indicator plantO
strich fernM
atteuccia struthiopterisground cover
yesFalse nettle
Boehm
eria cylindricaground cover
yesSilky dogw
oodC
ornus amom
umshrub
yesSilver m
apleA
cer saccharinumtree
yesE
astern cottonwood
Populus deltoides
treeyes
Total number of w
etland indicator plants = 5Total num
ber of non-wetland indicator plants = 0
Plant species were identified and percent cover estim
ated for each species in each of four layers. Percent cover was visually estim
ated, therefore, them
idpoint values of cover ranges were used to calculate dom
inance (see page 12 on discussion of cover ranges and midpoints). Percent dom
inance was
calculated for each species by dividing percent cover (midpoints) by total percent cover.
This exam
ple shows that not all plant species need to be identified by nam
e when using the dom
inance test. If while recording observations, a plant is
not recognized, it may be given an identifier (in this exam
ple A, B
, C, D
, X, Y
). These plants only need to be identified if they are determ
ined to bedom
inant plants. If these plants had been included as dominant plants, then a plant identification book or key could have been used to determ
ine thespecies. O
nce the species was identified, the N
ational List can be used to determ
ine the indicator category.
In the ground cover layer, ostrich fern and false nettle are considered dominant plants because their percent dom
inance taken together (61.8%)
imm
ediately exceeds the 50 percent threshold (neither species exceeds the threshold on its own).
Silky dogwood is the only plant species in the shrub layer. T
he percent cover for the layer (20.5%) exceeds 5 percent, therefore, the layer is included.
Silky dogwood is considered a dom
inant plant since its percent dominance (100%
) exceeds the 50 percent threshold.
Plant X is the only plant species in the sapling layer. H
owever, the total percent cover for the layer (3%
) is less than 5 percent, therefore, the saplinglayer is not included in the dom
inance test.
For the tree layer, silver maple and eastern cottonw
ood are considered dominant plants because their percent dom
inance taken together (85%) im
me-
diately exceeds the 50 percent threshold (neither species exceeds the threshold on its own).
The area used for this exam
ple has five dominant plants. Since all five dom
inant plants are wetland indicator plants, under the dom
inance testprocedure, the w
etland vegetation criterion has been met.
If vegetation alone is presumed adequate for the delineation, the plot is in a B
VW
. If vegetation alone is not presumed adequate, or to overcom
e thepresum
ption, other indicators of hydrology also should be used to delineate the BV
W boundary. (See C
hapter Three.)

69Delineating Bordering Vegetated Wetlands
Appendix D
APPENDIX DGlossary
A-horizon: a surface layer of mineral soil darkened by the presence of organic matter;also known as topsoil.
Adventitious roots: roots found on plant stems in positions where roots do not nor-mally occur. These roots may or may not form in response to inundation or saturation.
Aerenchyma: plant tissue that contains large air cells, resulting in a spongy texture.
Aerobic: a condition where free oxygen is present.
Anaerobic: a condition where free oxygen is unavailable.
B-horizon: a zone of weathered mineral soil below the O, A, or E-horizon.
Basal area: the cross-sectional area of a tree trunk measured at breast height (4.5 feetabove the ground).
Bordering Vegetated Wetland (BVW): a freshwater wetland that borders a creek,river, stream, pond, or lake; a wetland resource area defined in the MassachusettsWetlands Protection Regulations (310 CMR 10.55).
Buttressed trunks: the swollen or enlarged bases of trees that develop in response toprolonged inundation.
Capillary fringe: a zone just above the water table that is nearly saturated with waterdue to capillary action.
C-horizon: A zone of unweathered soil below the A-horizon and, if present, the B-horizon.
Chroma: the relative purity of a color; one of three variables of color.
Climbing woody vine: a vegetative layer that includes woody vines that are attached,rooted, or climbing on trees, saplings, or shrubs.
Concretion: a cemented body of material with internal symmetry such as iron ormanganese formed by precipitation of dissolved material; can be removed from the soilintact.
Cover range: a category into which plant species would fit based upon their percentcover.
Diameter at breast height (dbh): the width of a tree trunk as measured at breast height(4.5 feet above the ground).
Dominant plant: based on calculations in the dominance test, a plant determined to bedominant in a particular vegetative layer.
Dominance test: a method of vegetative community assessment based on the number ofdominant plants that are wetland indicator plants.
Drift line: an accumulation of water-borne debris often deposited in lines that areroughly parallel to the direction of water flow.

Delineating Bordering Vegetated Wetlands70
Appendix D
E-horizon: a layer below the O or A-horizon where iron and aluminum oxides andorganic matter have been leached out of the soil by organic acids.
Evaporation: loss of water from surface water bodies.
Facultative species (FAC): classification of plants that occur in wetlands 34-66 percentof the time; also known as “fac” species (U.S. Fish and Wildlife Service).
Facultative upland species (FACU): classification of plants that occur in wetlands1-33 percent of the time; also known as “fac-up” species (U.S. Fish and WildlifeService).
Facultative wetland species (FACW): classification of plants that occur in wetlands67-99 percent of the time; also known as “fac-wet” species (U.S. Fish and WildlifeService).
Fibrist: an organic soil (peat) in which plant remains show very little decompositionand retain their original shape; more than two-thirds of the fibers remain after rubbingthe materials between fingers.
Flooded: a condition in which an area is temporarily covered with flowing or standingwater.
Gleization: a process in saturated and/or nearly saturated soils which involves thereduction of iron, its segregation into mottles and concretions, or its removal by leach-ing from the gleyed horizon.
Gleyed: a soil condition resulting from gleization which is characterized by thepresence of neutral gray, bluish, or greenish colors in the soil matrix or in mottlesamong other colors.
Ground cover: a vegetative layer that includes woody vegetation less than 3 feet inheight, non-climbing woody vines less than 3 feet in height, and all non-woody vegeta-tion (including mosses) of any height.
Growing season: the portion of the year when soil temperatures are above biologic zero(41 degrees Fahrenheit, 4 degrees centigrade); generally March to November in Massa-chusetts.
Hemist: organic soils (peaty-mucks and mucky-peats) in which the plant remains showa fair amount of decomposition; between one-third and two-thirds of the fibers are stillvisible upon rubbing.
Herb: non-woody (herbaceous) plants.
Histic epipedon: contained in a hydric soil with 8-16 inches of organic soil measuredfrom the ground surface.
Histosols: a type of hydric soil with at least 16 inches or more of organic materialmeasured from the ground surface; histosols include fibrists (peats), saprists (mucks)and hemists (peaty-mucks and mucky-peats).
Horizon: a distinct layer of soil generally parallel with the soil surface having similarproperties such as color and texture.
Hue: a characteristic of color related to one of the main spectral colors (red, yellow,green, blue, or purple), or various combinations of these principle colors; one of thethree variables of color.

71Delineating Bordering Vegetated Wetlands
Appendix D
Hydric soil: a soil that is saturated, ponded, or flooded long enough during the growingseason to cause anaerobic conditions at or near the surface.
Hydrology: the properties, distribution, and circulation of water.
Hydrophyte: any plant that generally grows in water or is adapted to wet conditions;generally the same as wetland indicator plant.
Hypertrophied lenticels: pores on the stem of woody plants which can become swollenor enlarged in response to saturated or inundated conditions.
Inundation: a condition in which water temporarily or permanently covers an area,such as flooding.
Litter: a layer of recently deposited leaves and/or pines needles; may be found abovethe O-horizon on the forest floor.
Matrix: the undisturbed soil material composed of both mineral and organic matter;matrix color refers to the predominant color of the soil in a particular horizon.
Mineral soil: any soil consisting primarily of mineral material (sand, silt, clay, andgravel) rather than organic matter.
Morphological adaptation: an adaptation that is evident in the form or shape of aplant, such as adventitious roots and aerenchymous tissues.
Mottles: spots or blotches of different color or shades of color interspersed within thedominant matrix color in a soil horizon.
Mucks: organic soils (saprists) in which most of the plant material is decomposed andthe original constituents cannot be recognized; less than one-third of the fibers remainvisible upon rubbing the materials between fingers.
National List: the U.S. Fish and Wildlife Service's National List of Plant Species ThatOccur in Wetlands (Reed, 1988).
Nodule: same as concretion but without internal symmetry.
Non-hydric soil: a soil that has developed under predominantly aerobic soil conditions.
O-horizon: a layer of organic soil usually at the surface.
Obligate wetland species (OBL): classification of plants that occur in wetlands greaterthan 99 percent of the time; also known as “obligate” species (U.S. Fish and WildlifeService).
Observation plot: a sampling point at which a wetland determination is made.
Organic soil: soil that contains a minimum of 20 percent organic matter when no clayis present or a minimum of 30 percent organic matter when 60 percent or more clay ispresent.
Oxidation: chemical changes resulting from the presence of oxygen.
Oxidized rhizospheres: oxidized channels and soil surrounding living roots and otherunderground plant structures.

Delineating Bordering Vegetated Wetlands72
Appendix D
Parent material: the unconsolidated and more or less weathered mineral or organicmatter from which the soil profile is developed.
Peats: organic soils (fibrists) in which plant remains show very little decompositionand retain their original shape; more than two-thirds of the fibers remain after rubbingthe materials between fingers.
Percent cover: the percent of the ground surface that would be covered if foliage from aparticular species or vegetative layer were projected on the ground, ignoring small gapsbetween the leaves and branches.
Percent dominance: a measurement calculated by dividing the percent cover for aspecies by the total percent cover for all species in that layer; a value used in thedominance test.
Percolation: the infiltration of surface water into the ground.
Physiological adaptation: an adaptation of the basic physical and chemical activitiesthat occur in cells and tissues of an organism; generally not observable without the useof specific equipment or tests.
Plant community: the plant populations existing in a shared habitat or environment.
Polymorphic leaves: two or more different types of leaves that form on plants.
Precipitation: water droplets or ice particles condensed from atmospheric water thatfall to the earth's surface, such as rain, sleet, or snow.
R-horizon: a layer of hard, unbroken bedrock such as granite, basalt, and quartzite;occurs below all other horizons where present or may have outcroppings of ledge abovethe surface of the ground.
Reduction: chemical changes resulting from the absence of oxygen.
Sandy: a soil texture of loamy fine sand or coarser that is dominant within 20 inches ofthe soil surface.
Sapling: a vegetative layer that includes woody vegetation over 20 feet in height with adiameter at breast height (dbh) greater than or equal to 0.4 inches to less than 5 inches.
Saprists: organic soils (mucks) in which most of the plant material is decomposed andthe original constituents cannot be recognized; less than one-third of the fibers remainvisible upon rubbing the materials between fingers.
Saturated: a condition in which the soil has all or most of its pores within the rootzone filled with water.
Scientific name: the name of a plant or animal that is comprised of a genus name and aspecies name.
Seedling: woody vegetation that is less than 3 feet in height.
Shrub: a vegetative layer that includes woody vegetation greater than or equal to 3 feetbut less than 20 feet in height.
Soil: unconsolidated material on the earth’s surface that supports or is capable ofsupporting plants.

73Delineating Bordering Vegetated Wetlands
Appendix D
Soil profile: vertical section of the soil through all its horizons.
Soil series: a group of soils similar in characteristics and arrangements in the soilprofile.
Soil taxonomy: a classification system for soils developed by the U.S. Natural Re-sources Conservation Service (NRCS).
Soil texture: the relative proportions of the various sizes of particles (silt, sand, andclay) in a soil.
Species name: a Latin form of the name of a plant made up of genus and species; alsoknown as scientific name.
Spodic horizon: in a spodosol, a subsurface layer of soil characterized by the accumula-tion of aluminum oxides (with or without iron oxides) and organic matter.
Spodosols: soils that possess an E-horizon and spodic horizon due to the leaching ofiron and aluminum oxides and organic matter by organic acids.
Stratum: a layer of vegetation used to determine dominant species in a plant commu-nity.
Surface water: water present above the substrate or soil surface.
Topography: the position in a landscape, including elevation and change in slope.
Transect: an imaginary line on the ground that bisects a parcel of land along whichobservations are made or plots established for collecting data (e.g. runs perpendicular toslope or topographic changes in wetland or upland communities).
Transpiration: loss of water from plant surfaces.
Tree: a vegetative layer that includes woody plants greater than or equal to 20 feet inheight and with a diameter at breast height (dbh) of 5 inches or greater.
Uplands: non-wetlands.
Upland species (UPL): classification of plants that occur in wetlands less than onepercent of the time (U.S. Fish and Wildlife Service).
Value (soil color): the relative lightness or intensity of color; one of the three variablesof color.
Vegetative community: the plant populations existing in a shared habitat or environ-ment.
Water mark: a line on vegetation or other upright structures that represent the maxi-mum height reached in an inundation event.
Water table: the upper limit or depth below the surface of the ground that is com-pletely saturated with water.
Wetlands: areas that under normal circumstances have hydrophytic vegetation, hydricsoils, and wetland hydrology.

Delineating Bordering Vegetated Wetlands74
Appendix D
Wetland boundary: a line between an upland and a BVW (as defined at 310 CMR10.55).
Wetland hydrology: in general terms, permanent or periodic inundation or prolongedsaturation sufficient to create anaerobic conditions in the soil.
Wetland indicator category: the frequency with which a plant species occurs inwetlands; categories include obligate wetland, facultative wetland, facultative, faculta-tive upland, and upland (U.S. Fish and Wildlife Service).
Wetland indicator plants: as defined in the Massachusetts Wetlands ProtectionRegulations: plant species listed in the Wetlands Protection Act; plants in the genusSphagnum; plants in the National List classified as OBL, FACW+, FACW, FACW-,FAC+ and FAC; or any plants demonstrating morphological or physiological adapta-tions to life in saturated or inundated conditions.

75Delineating Bordering Vegetated Wetlands
Appendix E
APPENDIX EResources
Field Guides
Wetland PlantsCommon Marsh, Underwater and Floating-leaved Plants of the United States andCanada by Neil Hotchkiss. 1972. Dover Publications, Inc., New York, NY.
Freshwater Wetlands: A Guide to Common Indicator Plants of the Northeast by D.W.Magee. 1981. University of Massachusetts Press, Amherst, MA.
A Field Guide to Coastal Wetland Plants of the Northeastern United States by R.W.Tiner, Jr. 1987. University of Massachusetts Press, Amherst, MA.
Field Guide to Nontidal Wetland Identification by Ralph W. Tiner, Jr. 1988. MarylandDepartment of Natural Resources, Annapolis, MD and USFWS.
Plants in Wetlands by Charles B. Redington. 1994. Kendall Hunt Publishing.
Wetlands, Audubon Society Nature Guides by William Neiring. 1987. Alfred A. Knopf,New York, NY.
Trees and ShrubsA Field Guide to the Trees and Shrubs by G.A. Petrides. 1972. Houghton Mifflin Co.,Boston, MA.
The Audubon Society Field Guide to North American Trees: Eastern Region by E.L.Little. 1985. Alfred A. Knopf, Inc., New York, NY.
The Tree Identification Book by G.W.D. Symonds. 1958. Quill, New York, NY.
Trees and Shrubs of New England by Marilyn J. Dwelley. 1980. Down East Books,Camden, ME.
Winter Keys to Woody Plants of Maine by Christopher Campbell and Fay Hyland.University Maine Press, Orno, ME.
Trees of the Eastern and Central U.S. and Canada by W. H. Harlow. 1957. DoverPublications, Inc., New York, NY.
The Shrub Identification Book by G.W.D. Symonds. 1963. William Morrow & Co.,New York, NY.
Fruit Key and Twig Key to Trees and Shrubs by W.H. Harlow. 1946. Dover Publica-tions, Inc., New York, NY.
Winter Botany: An Identification Guide to Native Trees and Shrubs by W. Trelease.1931. Dover Publications, Inc., New York, NY.

Delineating Bordering Vegetated Wetlands76
Appendix E
Ferns, Clubmosses and HorsetailsA Field Guide to the Ferns and Their Related Families of Northeastern and CentralNorth America by B. Cobb. 1963. Houghton Mifflin Co., Boston, MA.
WildflowersNewcomb’s Wildflower Guide by L. Newcomb. 1977. Little, Brown & Co., Boston,MA.
A Field Guide to Wildflowers of Northeastern and North Central North America by R.T.Peterson and M. McKenny. 1968. Houghton Mifflin Co., Boston, MA.
The Illustrated Book of Wildflowers and Shrubs by William Carey Grimm. 1993.Stackpole Books, Harrisburg, PA.
The Audubon Society Field Guide to North American Wildflowers: Eastern Region byW.A. Niering and N.C. Olmstead. 1979. Alfred A. Knopf, Inc., New York, NY.
Weeds in Winter by Lauren Brown. 1976. W.W. Norton and Co., New York, NY.
SoilsMunsell Soil Color Charts by Munsell Color. 1975. Macbeth Division of KollmorgenCorporation, Baltimore, MD. (Available from mail order supply companies.)
Hydric Soils of New England by R.W. Tiner, Jr. and P.L.M. Veneman. 1987. Universityof Massachusetts Cooperative Extension, Amherst, MA. Bulletin C-183.
Hydric Soils of the United States by U.S.D.A. Natural Resources Conservation Service.1985. Washington, DC. (Regional and county lists available from NRCS offices, seeAppendix H).)
General ReferencesNational List of Plant Species that Occur In Wetlands: Massachusetts by P.B. Reed, Jr.,1988. U.S. Fish and Wildlife Service, Washington, DC. (Available from the Massachu-setts Association of Conservation Commissions.)
The Concept of a Hydrophyte for Wetland Identification by R.W. Tiner, Jr. 1991.BioScience 41(4):236-247.
“Field Recognition” and “Delineation of Wetlands and Problem Wetlands for Delinea-tion” by R.W. Tiner, Jr., in Wetlands: Guide to Science, Law, and Technology by M.S.Dennison and J.F. Berry. 1993. Noyes Publications, Park Ridge, NJ.
Corps of Engineers Wetlands Delineation Manual by Environmental Laboratory. 1987.U.S. Army Corps of Engineers Waterways Experiment Station, Vicksburg, MS. Techni-cal Report Y-87-1. (Available from the National Technical Information Service,Springfield, VA, 22161.)
Federal Interagency Committee for Wetland Delineation. 1989. Federal Manual forIdentifying and Delineating Jurisdictional Wetlands. U.S. Army Corps of Engineers,U.S. Environmental Protection Agency, U.S. Fish and Wildlife Service, and U.S.D.A.Soil Conservation Service, Washington, D.C. Cooperative technical publication.

77Delineating Bordering Vegetated Wetlands
Appendix E
Use of Vegetation for the Designation of Wetlands by T.R. Wentworth and G.P. Johnson.1986. U.S. Fish and Wildlife Service, Washington, DC.
Wetland Site Index for Summarizing Botanical Studies by M.C. Michener. 1983.Wetlands 3:180-191.
Estimating Wildlife Habitat Variables by R.L. Hays and W. Seitz. 1981. U.S. Fish andWildlife Service, Washington, DC. FWS/OBS-81/47.
MapsDEP Wetlands Conservancy Maps (see Appendix F for contact information).
Soil Surveys: available from U.S.D.A. Natural Resources Conservation Service Offices(formerly Soil Conservation Service Offices) throughout Massachusetts (see Appendix Hfor contact information).
U.S.G.S. Topographic Maps: available from some bookstores, camping supply stores,and University of Massachusetts Cartographic Information Center.
The following maps and resources are available from Cartographic Information Center,Blaisdell House, University of Massachusetts, Amherst, MA 01003, (phone: 413/545-0359), (fax: 413/545-2304):
w U.S.G.S. Topographic Maps
w National Wetlands Inventory Maps
w DEP Wetlands Conservancy Maps
w Aerial Photographs
EquipmentSome equipment for conducting BVW delineations is available from hardware anddepartment stores. Other items are available from mail order supply companies.

Delineating Bordering Vegetated Wetlands78
Appendix F
APPENDIX FWetlands Conservancy Program Mapping Products
The Department of Environmental Protection’s Wetlands Conservancy Program (WCP)is mapping wetlands statewide using aerial photography and photointerpretation. Thephotos used in this process are color infrared (CIR) aerial photos at the 1" = 1,000'scale. The map upon which the wetland delineations are displayed is an orthophotomap at the 1" = 417' scale. This extremely accurate map is photo-based and shows allthe features of the natural and human-made landscape. The delineations from the CIRsare transferred onto the orthophoto maps.
Wetlands Conservancy Program Map Product Availability
Area CIR Photos OrthophotosAvailable Available
Metro/Suburban Boston now now
Buzzards Bay (West Shore) now now
MDC Watersheds now Spring 1995 (Sudbury, Quabbin, Wachusett)
North Shore now 1996*
Merrimack Area now 1996*
Cape Cod Area now Fall 1995*
The Islands now 1995*
Plymouth County now 1996*
Bristol County now 1996*
*(Projected availability is subject to change.)
Costs
w orthophoto map: $10 each (on average 5-7 per town)
w color infrared photo (CIR): $15 each (on average 10-12 per town)
For More InformationCharles T. Costello, Section ChiefWetlands Conservancy ProgramDivision of Wetlands and WaterwaysDepartment of Environmental ProtectionOne Winter Street, 8th floorBoston, MA 02108-4746Telephone: 617/292-5907

Appendix G
79Delineating Bordering Vegetated Wetlands
AP
PE
ND
IX G
: DE
P F
ield D
ata Fo
rm an
d In
structio
ns
Shrubs: woody vegetation betw
een 3 feet and 20 feet in height within a 15-foot radius plot;
Saplings: woody vegetation over 20 feet in height w
ith a diameter at breast height (dbh)
greater than or equal to 0.4 inches to less than 5 inches within a 15-foot radius plot; (note:
dbh is measured 4.5 feet from
the ground);
Clim
bing woody vines: w
oody vines that are attached, rooted, or climbing on trees,
saplings, or shrubs within a 30-foot radius plot; and
Trees: w
oody vegetation with a dbh of 5 inches or greater and over 20 feet in height w
ithina 30-foot radius plot.
If you do not recognize a plant species or do not know a plant's nam
e, call it a genericnam
e. Unknow
n plants need to be identified only if they are determined to be dom
inantplants. In that case, a plant identification book or key m
ay be used to determine the
species.
B. P
ercent Cover
Determ
ine percent cover (or basal area for trees) for each plant species in each layer byvisual analysis or m
easurement. (See handbook for inform
ation about determining percent
cover, page 12.)
C. P
ercent Dom
inanceD
etermine percent dom
inance for each plant species by dividing the percent cover or basalarea for each plant species by the total percent cover or basal area for the layer. (Seehandbook for inform
ation about the dominance test, pages 15-19.)
D. D
ominant P
lants1. Identify the dom
inant plants. Dom
inant plants are:
w plants w
ith a percent dominance of 50 percent or greater, or plants w
hose percent dom
inance add up to imm
ediately exceed 50 percent;
w plants w
ith a percent dominance of 20 percent or greater;
w plants w
ith a percent dominance equal to a plant already listed as a dom
inant species.
2. Determ
ine comm
on and scientific names for any unknow
n plants identified as dominant
plants.
The D
epartment of E
nvironmental Protection's field data form
should be used when
delineating the boundary of a Bordering V
egetated Wetland (B
VW
) under the Massachusetts
Wetlands Protection A
ct (M.G
.L. C
hapter 131, Section 40) and regulations (310 CM
R10.55). It should be used w
hether the boundary is delineated by vegetation alone or byvegetation and other indicators of w
etland hydrology. Note: if detailed vegetative assess-
ment is not necessary for the site, m
ake a note on the data form and subm
it it. The field
data form should be subm
itted with a R
equest for Determ
ination of Applicability or a N
oticeof Intent. D
etails on the criteria for delineating a BV
W boundary and the term
inology usedin this field data form
are described in the handbook, Delineating B
ordering VegetatedW
etlands Under the M
assachusetts Wetlands P
rotection Act (M
A D
epartment of E
nviron-m
ental Protection, Division of W
etlands and Waterw
ays, 1995).
INST
RU
CT
ION
ST
he data form includes a section on project identification, including the applicant’s nam
e,the nam
e of the person performing the delineation, project location, and the D
EP file
number, if available.
If vegetation alone is presumed adequate to delineate the B
VW
boundary, mark the first box,
complete Section I of the data form
, and submit the docum
ent. If vegetation and otherindicators of hydrology are used to delineate the B
VW
boundary, mark the second box,
complete Sections I and II of the form
, and submit the docum
ent.
DE
P has selected the dominance test as the preferred m
ethod of vegetation analysis atsam
ple plot locations. The inform
ation gathered for that method should be recorded on the
form. If a m
ethod other than the dominance test is used, m
ark the third box and explainthe m
ethod and why it w
as used.
Section I: Vegetation
Section I should be used to record information about the vegetation w
ithin an observationplot and on a transect used to delineate the B
VW
boundary. Note the date of the delinea-
tion. Submit a separate data form
for each observation plot. Attach supplem
entalsheets if m
ore space is needed.
A. Sam
ple Layer and P
lant SpeciesR
ecord each plant species using comm
on and scientific names for the follow
ing layers:
Ground C
over: woody vegetation less than 3 feet in height (seedlings), non-clim
bing woody
vines less than 3 feet in height, and non-woody vegetation (including m
osses) of any heightw
ithin a 5-foot radius plot;

Appendix G
80 Delineating Bordering Vegetated Wetlands
E. W
etland Indicator Category
1. Identify the Wetland Indicator C
ategory for all dominant plant species using the
National List of P
lant Species That Occur in W
etlands: Massachusetts.
2. Use an asterisk to m
ark the wetland indicator plants. W
etland indicator plants are any ofthe follow
ing:
w
plant species listed in the Wetlands Protection A
ct;w
plants in the genus Sphagnum;
w
plants listed as Facultative (FAC
), Facultative+ (FAC
+), Facultative Wetland-
(FAC
W-), Facultative W
etland (FAC
W), Facultative W
etland+ (FAC
W+) or
Obligate (O
BL
);w
plants with m
orphological or physiological adaptations (such as buttressed or fluted trunks, shallow
roots, or adventitious roots).
If any plants are identified as wetland indicator plants due to physiological or m
orphologicaladaptations, describe the adaptation next to the asterisk (e.g. W
hite pine, Pinus strobus,
FacU*/shallow
roots, buttressed trunks).
Vegetation C
onclusionL
ist the number of dom
inant wetland indicator plants and the num
ber of dominant
non-wetland indicator plants. If the num
ber of dominant w
etland indicator plants is equal toor greater than the num
ber of non-wetland indicator plants, and vegetation alone is pre-
sumed adequate for the delineation, the plot is located in a B
VW
.
If vegetation alone has been chosen for the delineation at this site, complete only Section I
and submit the form
with a R
equest for Determ
ination of Applicability or a N
otice of Intent.O
therwise, continue the delineation process and record inform
ation for Section II on thesecond page of the form
.
Section II: Indicators of Hydrology
Section II should be used to record information on indicators of hydrology in those areas
where vegetation alone is not presum
ed adequate to delineate the BV
W boundary, or to
overcome the presum
ption that vegetation alone is adequate.
Hydric Soil Interpretation
1. Soil Survey: Record inform
ation about the site from the Soil Survey R
eport prepared bythe U
.S. Natural R
esources Conservation Service (N
RC
S) - formerly called the Soil
Conservation Service.
2. Soil Description: R
ecord information based on observations at a soil test hole located
within the vegetation observation plot. D
escribe the soil profile of each soil horizon, notingthe depth. Identify the m
atrix and mottles colors by hue, value, and chrom
a (information
from M
unsell Soil Color C
harts). For example, 10Y
R 5/2. N
otes on soil texture and othersoil characteristics m
ay be recorded in the Rem
arks section.
3. Other: note any additional inform
ation used to determine if hydric soil is present, such
as regional field indicator guides.
Conclusion: Indicate w
hether the soil is hydric based on information observed in the field.
(See list of Hydric Soil Indicators in the handbook, page 29.)
Other Indicators of H
ydrologyR
ecord observations of other indicators of hydrology. Check and describe all that apply.
Due to their seasonal or tem
poral nature, these other indicators generally are used inconjunction w
ith vegetation and soils to determine the location of the B
VW
boundary.
Vegetation and H
ydrology Conclusion
Determ
ine if the observation plot is in a BV
W. T
he observation plot is in a BV
W if the
number of dom
inant wetland indicator plants is equal to or greater than the num
ber ofdom
inant non-wetland indicator plants, and if hydric soil or other indicators of hydrology
are present.
For an observation plot located in a disturbed area, any one of the three indicators issufficient to determ
ine that the sample location is in a B
VW
. In that case, make a note on
the form about that conclusion.
Submit the com
pleted form w
ith a Request for D
etermination of A
pplicability or a Notice of
Intent.

Appendix G
81Delineating Bordering Vegetated Wetlands
DE
P B
ordering Vegetated W
etland (310 CM
R 10.55) D
elineation Field D
ata Form
Applicant:_________________________
Prepared by:__________________________
Project location:________________________ D
EP
File #:_______________
If vegetation
alone is
presumed
adequate to
delineate the
BVW
boundary, subm
it this
form
with
the R
equest for
Determ
ination of
Applicability
or N
otice of
Intent.
Is the number of dom
inant wetland plants equal to or greater than the num
ber of dominant non-w
etland plants?yes
no
Vegetation conclusion:
* U
se an asterisk to
mark w
etland indicator
plants: plant
species listed
in the
Wetlands
Protection
Act
(MG
L c.131, s.40);
plants in
the genus
Sphagnum;
plants listed
asFA
C, FA
C+, FA
CW
-, FAC
W, FA
CW
+, or O
BL; or
plants w
ith physiological
or m
orphological adaptations.
If any plants
are identified
as wetland
indicator plants
due tophysiological
or m
orphological adaptations,
describe the
adaptation next
to the
asterisk.
MA
DE
P; 3/95
A. S
ample Layer and P
lant Species
B. P
ercent Cover
C
. Percent
D.
Dom
inant Plant
E
. W
etland (by com
mon/scientific nam
e)
(or basal
area)
Dom
inance
(yes or
no)Indicator
Category
*
Check all
that apply:
oVegetation
alone presum
ed adequate
to delineate
BVW
boundary: fill
out Section
I only
oVegetation
and other indicators
of hydrology
used to
delineate BVW
boundary: fill
out Sections
I and II
oM
ethod other
than dom
inance test
used (attach
additional inform
ation)
Section I.
Vegetation
Observation P
lot Num
ber:____________ Transect Num
ber:______________ Date of D
elineation:___________
Num
ber of dominant w
etland indicator plants:N
umber of dom
inant non-wetland indicator plants:

Appendix G
82 Delineating Bordering Vegetated Wetlands
Sam
ple location is in a BV
W
Subm
it this
form
with
the R
equest for
Determ
ination of
Applicability
or N
otice of
Intent.
Horizon
Depth
Matrix
Color
Mottles
Color
Section II.
Indicators of Hydrology
Conclusion:
Is soil
hydric?yes
no
3. O
ther:
Rem
arks:
2. Soil
Description
Rem
arks:
Hydric
Soil Interpretation
1. Soil
Survey
Is there
a published soil
survey for
this site?
yesno
title/date:
map num
ber:
hydric soil
inclusions:
Are field
observations consistent
with
soil survey?
yesno
Wetland
hydrology present:
hydric soil
present
other indicators
of hydrology
present
Num
ber of w
etland indicator
plants> num
ber of
non-wetland
indicator plants
yesno
Vegetation and H
ydrology Conclusion
Other
Indicators of
Hydrology
: (check all
that apply
and describe)
o
Recorded
data (stream
, lake,
or tidal
gauge; aerial
photo; other)
:________________________________________________________
o
Water-stained leaves:
____________________________________
o
Oxidized rhizospheres:
___________________________________
o
Drainage patterns in B
VW
:________________________________
o
Sedim
ent deposits:______________________________________
o
Drift lines:
____________________________________________
o
Depth
to soil
saturation in
observation hole
:____________________
o
Depth to free w
ater in observation hole:_______________________
o
Site inundated:
_________________________________________
o
Oth
er:
_______________________________________________
soil type
mapped:
o
Wate
r marks:
__________________________________________

83Delineating Bordering Vegetated Wetlands
Appendix H
APPENDIX HContact Information
Department of Environmental Protection/Division of Wetlands andWaterways
Questions about the Wetlands Protection Act and regulations can be directed to wetlandsstaff in DEP's Boston office and four regional offices.
Boston OfficeOne Winter Street8th floorBoston, MA 02108(617) 292-5695Fax (617) 556-1049
Carl Dierker, Acting DirectorRobert Golledge, Acting Deputy DirectorMichael Stroman, Asst. Program Chief, Wetlands Protection ProgramRichard Tomczyk, Regional Coordinator, Wetlands Protection Program
Central Regional Office75 Grove StreetWorcester, MA 01605(508) 792-7650Fax (508) 792-7651Philip Nadeau, Section Chief, Wetlands Protection Program
Northeast Regional Office10 Commerce WayWoburn, MA 01801(617) 932-7600Fax (617) 932-7615James Sprague, Section Chief, Wetlands Protection Program
Southeast Regional Office20 Riverside DriveLakeville, MA 02347(508) 946-2800Fax (508) 947-6557Elizabeth Kouloheras, Section Chief, Wetlands Protection Program
Western Regional OfficeState House West, 4th Floor436 Dwight StreetSpringfield, MA 01103(413) 784-1100Fax (413) 784-1149Robert McCollum, Section Chief, Wetlands Protection Program
Wetlands Conservancy Program (for map information)One Winter St., 8th floor, Boston, MA 02108Charles Costello, Section Chief(617) 292-5907

Delineating Bordering Vegetated Wetlands84
Appendix H
Department of Environmental Management
Department of Environmental ManagementDivision of Water ResourcesFlood ManagementLeverett Saltonstall Building100 Cambridge StreetBoston, MA 02202(617) 727-3268
Federal Emergency Management Agency
Federal Emergency Management AgencyNatural and Technological Hazards DivisionRoom 462J.W. McCormack BuildingBoston, MA 02109(617) 223-9561
Massachusetts Association of Conservation Commissions (MACC) andMACC West
Massachusetts Association of Conservation Commissions (MACC): Main OfficeSally A. Zielinski, Executive Director10 Juniper RoadBelmont, MA 02178(617) 489-3930
Massachusetts Association of Conservation Commissions: Western Outreach OfficeAlexandra D. Dawson, Esq., Coordinator2 West StreetHadley, MA 01035(413) 584-2724
Massachusetts Society of Municipal Conservation Professionals
Massachusetts Society of Municipal Conservation ProfessionalsBrian Monahan, PresidentP.O. Box 274Concord, MA 01742(617) 270-1656
U.S. Army Corps of Engineers
United States Army Corps of EngineersNew England DivisionRegulatory Division424 Trapelo RoadWaltham, MA 02254-9149(800) 362-4367 (from within Massachusetts)(800) 647-8862 (from outside Massachusetts)

85Delineating Bordering Vegetated Wetlands
Appendix H
U.S. Environmental Protection Agency
United States Environmental Protection AgencyRegion 1 (Northeast)Wetlands Protection SectionJFK Federal BuildingBoston, MA 02203(617) 565-4868
U.S. Natural Resources Conservation Service Field Offices andDistrict Conservationists(formerly called the Soil Conservation Service)
State Headquarters451 West StreetAmherst, MA 01002-2927(413) 253-4350Cecil Currin, State Conservationist
Barnstable Field Office (serving the Cape Cod, Dukes, and Nantucket Conservation Districts)Flintrock RoadP.O. Box 709Barnstable, MA 02630(508) 362-9332Donald W. Liptack, District Conservationist
Greenfield Field Office (serving the Franklin Conservation District)55 Federal StreetHayburne Building, Room 270Greenfield, MA 01301(413) 772-0384Diane Leone, District Conservationist
Holden Field Office (serving the Northeastern, Northwestern, and Southern WorcesterConservation Districts)
The Medical Arts Center Building52 Boyden RoadHolden, MA 01520-2587(508) 829-6628Ronald E. Thompson, District Conservationist
Northampton Field Office (serving the Hampden and Hampshire Conservation Districts)Potpourri Mall243 King Street, Room 39Northampton, MA 01060(413) 586-5440Angel Figueroa, District Conservationist
Pittsfield Field Office (serving the Berkshire Conservation District)Silvio Conte Federal Building78 Center Street (Arterial)Pittsfield, MA 01201(413) 443-6867Mark W. Grennan, District Conservationist

Delineating Bordering Vegetated Wetlands86
Appendix H
West Wareham Field Office (serving the Bristol, Norfolk, and Plymouth ConservationDistricts)
15 Cranberry HighwayWest Wareham, MA 02576(508) 295-7962Leonard R. Reno, Jr., District Conservationist
Westford Field Office (serving the Essex, Middlesex, and Suffolk Conservation Districts)319 Littleton Road, Room 205Westford, MA 01886(508) 692-1904Daniel J. Lenthall, District Conservationist
University of Massachusetts, Cooperative Extension System
University of Massachusetts Cooperative Extension212 Stockbridge HallUniversity of MassachusettsAmherst, MA 01003-0099(413) 545-4800
(Please call this number for all agent and departmental referrals.)