Embed Size (px)
Citation preview
Delft University of Technology
Influence of fluvial sandstone architecture on geothermal energy production
Willems, Cees; Nick, H.M.; Weltje, Gert Jan; Donselaar, Rick; Bruhn, David
Publication date2015Document VersionPublisher's PDF, also known as Version of recordPublished inProceedings World Geothermal Congress 2015
Citation (APA)Willems, C., Maghami Nick, H., Weltje, G. J., Donselaar, R., & Bruhn, D. (2015). Influence of fluvialsandstone architecture on geothermal energy production. In Proceedings World Geothermal Congress2015: Melbourne, Australia
Important noteTo cite this publication, please use the final published version (if applicable).Please check the document version above.
CopyrightOther than for strictly personal use, it is not permitted to download, forward or distribute the text or part of it, without the consentof the author(s) and/or copyright holder(s), unless the work is under an open content license such as Creative Commons.
Takedown policyPlease contact us and provide details if you believe this document breaches copyrights.We will remove access to the work immediately and investigate your claim.
This work is downloaded from Delft University of Technology.For technical reasons the number of authors shown on this cover page is limited to a maximum of 10.
Proceedings World Geothermal Congress 2015
Melbourne, Australia, 19-25 April 2015
1
Influence of fluvial sandstone architecture on geothermal energy production
Cees J. L. Willems, Hamidreza M. Nick, Gert Jan Weltje, M.E(Rick). Donselaar, David. F. Bruhn
Technical University of Delft, Dept. of Geoscience&Engineering, The Netherlands
Keywords: reservoir modelling, fluvial reservoir architecture
ABSTRACT
Fluvial sandstone reservoirs composed of stacked meander belts are considered as potential geothermal resources in the
Netherlands. Net-to-gross, orientation and stacking pattern of the channel belts is of major importance for the connectivity between
the injection and production well in such reservoirs. Understanding the influence of the fluvial sandstone architecture on the heat
recovery is necessary for designing geothermal doublet projects in fluvial reservoirs. A detailed outcrop study of the Huesca fluvial
fan is used as an analogue for fluvial reservoir architecture. The study shows meandering fluvial sandstone bodies, laterally
amalgamated and vertically stacked within the meander belts. Meander belts in the outcrop have a width of 1 to 1.5 km and are up
to 4 km long. Sandstone bodies are surrounded by impermeable floodplain deposits and poorly permeable crevasse splay
sandstones (Donselaar & Overeem, 2008). The floodplain deposits decrease the net-to-gross and connectivity in the meander belt.
In order to identify the most influential geological features controlling the flow and heat transfer in geothermal aquifers, several
reservoir models of fluvial sandstones are constructed with increasing geological detail. These models are based on the results of
geological fieldwork on the Huesca fluvial fan in Miocene, Ebro Basin, Spain. Several models with different geometry of the
fluvial sandstone bodies, orientation of the channel belts and stacking patterns of the channel bodies are considered. A finite-
element approach is utilized to study the geothermal energy production. The effects of different levels of architectural complexity
on the geothermal energy production, by conducting several accurate numerical simulations, are discussed. The results show that
utilizing simplified reservoir models can lead to a significant error in predictability of the heat recovery from deep fluvial sandstone
formations.
1. INTRODUCTION
Currently six geothermal doublets are realized in the West Netherlands Basin (WNB) for district heating purposes. The main
application for geothermal heat production in the Netherlands is currently heating in horticulture. From fluvial sandstone reservoirs
at depths between 2-3 km 70-90°C water is produced from a production well. After the heat is extracted ~30°C water is re-injected
in the injection well of the doublet. The injection and production well are drilled deviated from the same well-head location to
~1.5km spacing at the reservoir level. In 2012 nine doublets were installed in the Netherlands with a total capacity of approximately
40 MWthermal and the yearly production of roughly 200 GWh (heat) (Van Heekeren & Bakema, 2013).
Five of the doublets in the WNB target the same fluvial sandstone: the Delft Sandstone Member. This member is part of the Lower
Cretaceous Nieuwerkerk Formation as defined by Adrichem Boogaert & Kouwe (1993-1997). DeVault & Jeremiah (2002) did not
recognize this member as a separate stratigraphic unit because thick, stacked channel complexes occur throughout the Nieuwerkerk
Formation. Distribution of the sandstone bodies in the Nieuwerkerk Formation is still uncertain. Nevertheless about 40 geothermal
exploration licenses are granted in the WNB and owned by different operators. Many of them target the same formation. Possible
temperature- and pressure interference risks between the licenses are therefore a hot topic in the development of geothermal energy
in the Netherlands at the moment. To efficiently produce geothermal energy from the Nieuwerkerk Formation, the distribution and
internal architecture of the sandstone bodies must be better understood. For this reason this paper assesses the effect of the 3D
fluvial reservoir architecture on the cold-water plumes formation with varying permeability contrasts between geological features.
Figure 1: West Netherlands Basin geothermal license locations. Purple: production licence; solid green: exploration
license; dashed green: requested exploration license.
20km
Willems, Nick, Weltje, Donselaar and Bruhn
2
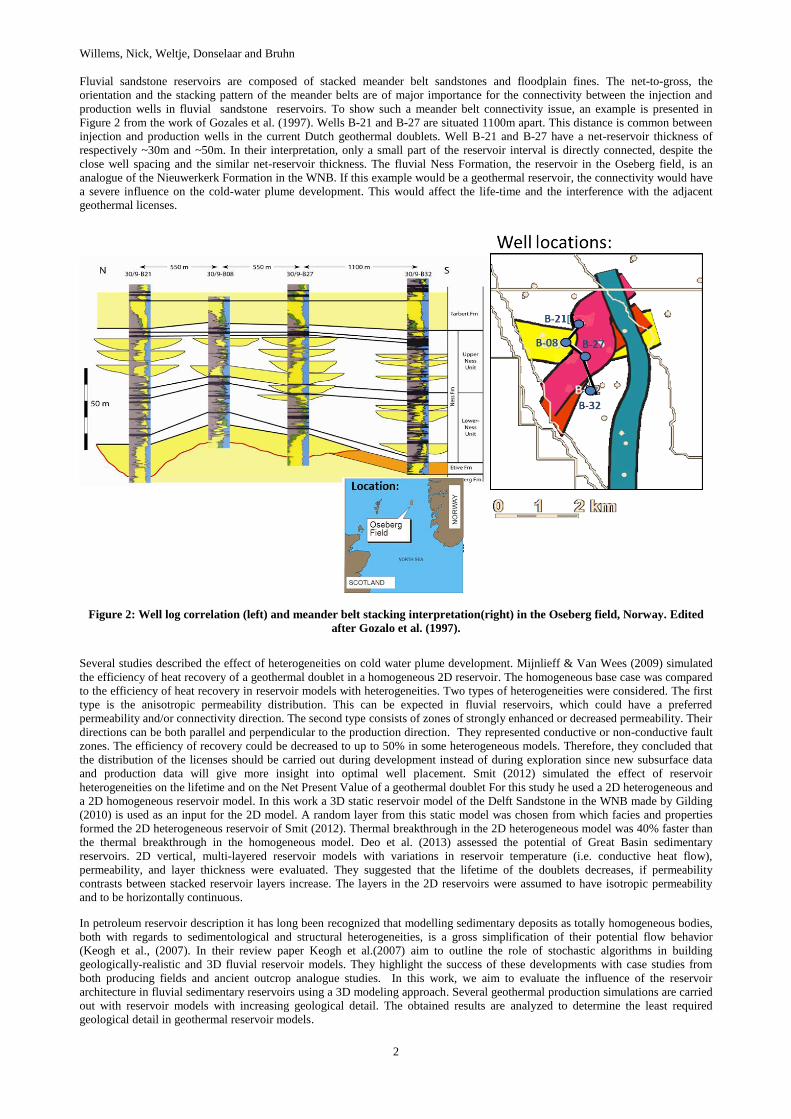
Fluvial sandstone reservoirs are composed of stacked meander belt sandstones and floodplain fines. The net-to-gross, the
orientation and the stacking pattern of the meander belts are of major importance for the connectivity between the injection and
production wells in fluvial sandstone reservoirs. To show such a meander belt connectivity issue, an example is presented in
Figure 2 from the work of Gozales et al. (1997). Wells B-21 and B-27 are situated 1100m apart. This distance is common between
injection and production wells in the current Dutch geothermal doublets. Well B-21 and B-27 have a net-reservoir thickness of
respectively ~30m and ~50m. In their interpretation, only a small part of the reservoir interval is directly connected, despite the
close well spacing and the similar net-reservoir thickness. The fluvial Ness Formation, the reservoir in the Oseberg field, is an
analogue of the Nieuwerkerk Formation in the WNB. If this example would be a geothermal reservoir, the connectivity would have
a severe influence on the cold-water plume development. This would affect the life-time and the interference with the adjacent
geothermal licenses.
Figure 2: Well log correlation (left) and meander belt stacking interpretation(right) in the Oseberg field, Norway. Edited
after Gozalo et al. (1997).
Several studies described the effect of heterogeneities on cold water plume development. Mijnlieff & Van Wees (2009) simulated
the efficiency of heat recovery of a geothermal doublet in a homogeneous 2D reservoir. The homogeneous base case was compared
to the efficiency of heat recovery in reservoir models with heterogeneities. Two types of heterogeneities were considered. The first
type is the anisotropic permeability distribution. This can be expected in fluvial reservoirs, which could have a preferred
permeability and/or connectivity direction. The second type consists of zones of strongly enhanced or decreased permeability. Their
directions can be both parallel and perpendicular to the production direction. They represented conductive or non-conductive fault
zones. The efficiency of recovery could be decreased to up to 50% in some heterogeneous models. Therefore, they concluded that
the distribution of the licenses should be carried out during development instead of during exploration since new subsurface data
and production data will give more insight into optimal well placement. Smit (2012) simulated the effect of reservoir
heterogeneities on the lifetime and on the Net Present Value of a geothermal doublet For this study he used a 2D heterogeneous and
a 2D homogeneous reservoir model. In this work a 3D static reservoir model of the Delft Sandstone in the WNB made by Gilding
(2010) is used as an input for the 2D model. A random layer from this static model was chosen from which facies and properties
formed the 2D heterogeneous reservoir of Smit (2012). Thermal breakthrough in the 2D heterogeneous model was 40% faster than
the thermal breakthrough in the homogeneous model. Deo et al. (2013) assessed the potential of Great Basin sedimentary
reservoirs. 2D vertical, multi-layered reservoir models with variations in reservoir temperature (i.e. conductive heat flow),
permeability, and layer thickness were evaluated. They suggested that the lifetime of the doublets decreases, if permeability
contrasts between stacked reservoir layers increase. The layers in the 2D reservoirs were assumed to have isotropic permeability
and to be horizontally continuous.
In petroleum reservoir description it has long been recognized that modelling sedimentary deposits as totally homogeneous bodies,
both with regards to sedimentological and structural heterogeneities, is a gross simplification of their potential flow behavior
(Keogh et al., (2007). In their review paper Keogh et al.(2007) aim to outline the role of stochastic algorithms in building
geologically-realistic and 3D fluvial reservoir models. They highlight the success of these developments with case studies from
both producing fields and ancient outcrop analogue studies. In this work, we aim to evaluate the influence of the reservoir
architecture in fluvial sedimentary reservoirs using a 3D modeling approach. Several geothermal production simulations are carried
out with reservoir models with increasing geological detail. The obtained results are analyzed to determine the least required
geological detail in geothermal reservoir models.
Willems, Nick, Weltje, Donselaar and Bruhn
3
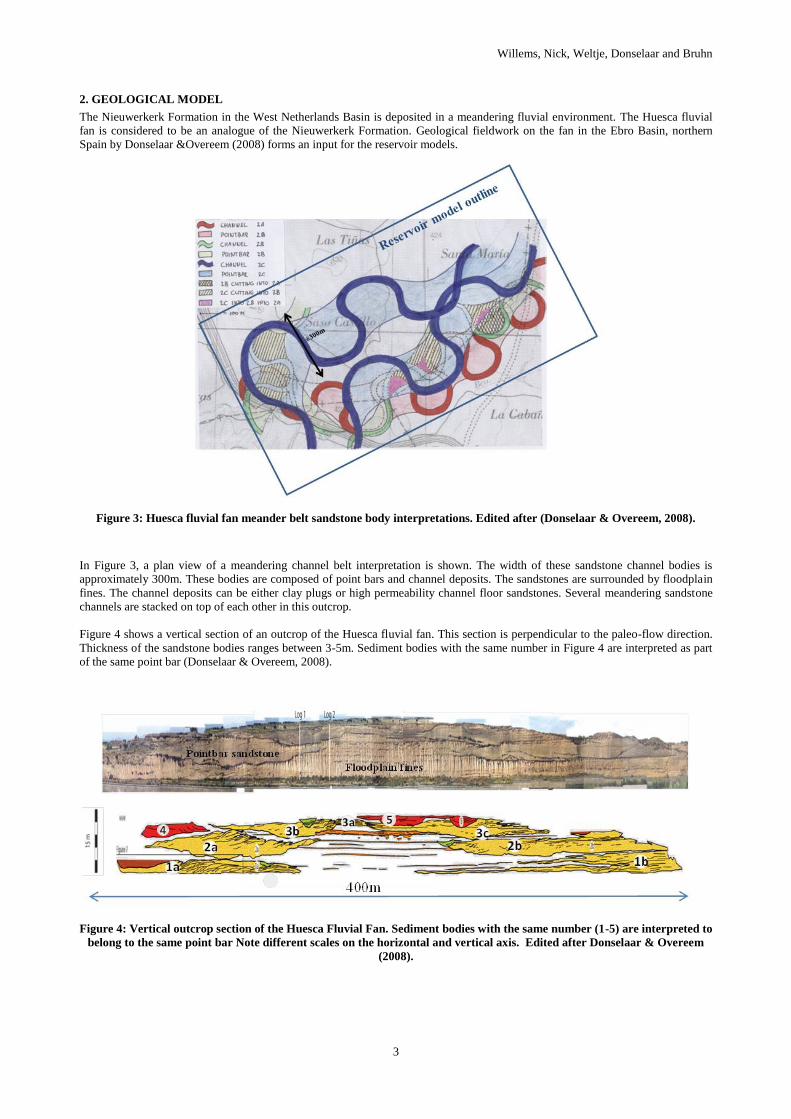
2. GEOLOGICAL MODEL
The Nieuwerkerk Formation in the West Netherlands Basin is deposited in a meandering fluvial environment. The Huesca fluvial
fan is considered to be an analogue of the Nieuwerkerk Formation. Geological fieldwork on the fan in the Ebro Basin, northern
Spain by Donselaar &Overeem (2008) forms an input for the reservoir models.
Figure 3: Huesca fluvial fan meander belt sandstone body interpretations. Edited after (Donselaar & Overeem, 2008).
In Figure 3, a plan view of a meandering channel belt interpretation is shown. The width of these sandstone channel bodies is
approximately 300m. These bodies are composed of point bars and channel deposits. The sandstones are surrounded by floodplain
fines. The channel deposits can be either clay plugs or high permeability channel floor sandstones. Several meandering sandstone
channels are stacked on top of each other in this outcrop.
Figure 4 shows a vertical section of an outcrop of the Huesca fluvial fan. This section is perpendicular to the paleo-flow direction.
Thickness of the sandstone bodies ranges between 3-5m. Sediment bodies with the same number in Figure 4 are interpreted as part
of the same point bar (Donselaar & Overeem, 2008).
Figure 4: Vertical outcrop section of the Huesca Fluvial Fan. Sediment bodies with the same number (1-5) are interpreted to
belong to the same point bar Note different scales on the horizontal and vertical axis. Edited after Donselaar & Overeem
(2008).
Willems, Nick, Weltje, Donselaar and Bruhn
4
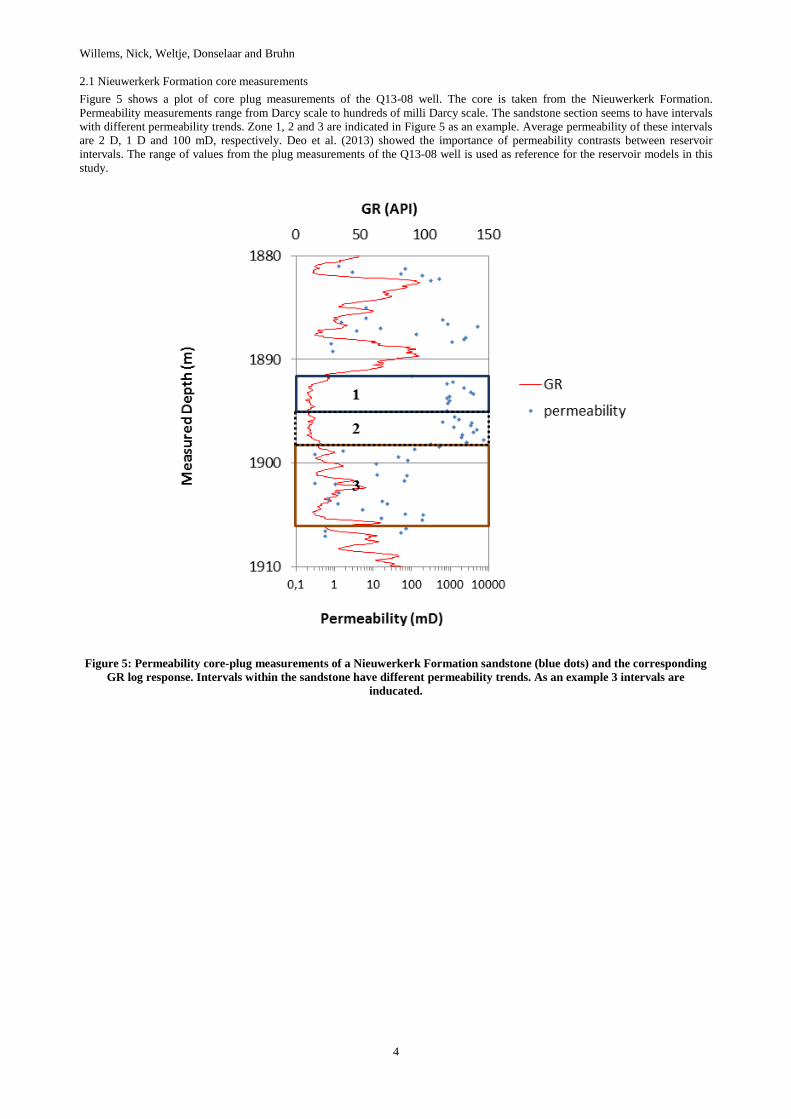
2.1 Nieuwerkerk Formation core measurements
Figure 5 shows a plot of core plug measurements of the Q13-08 well. The core is taken from the Nieuwerkerk Formation.
Permeability measurements range from Darcy scale to hundreds of milli Darcy scale. The sandstone section seems to have intervals
with different permeability trends. Zone 1, 2 and 3 are indicated in Figure 5 as an example. Average permeability of these intervals
are 2 D, 1 D and 100 mD, respectively. Deo et al. (2013) showed the importance of permeability contrasts between reservoir
intervals. The range of values from the plug measurements of the Q13-08 well is used as reference for the reservoir models in this
study.
Figure 5: Permeability core-plug measurements of a Nieuwerkerk Formation sandstone (blue dots) and the corresponding
GR log response. Intervals within the sandstone have different permeability trends. As an example 3 intervals are
inducated.
Willems, Nick, Weltje, Donselaar and Bruhn
5
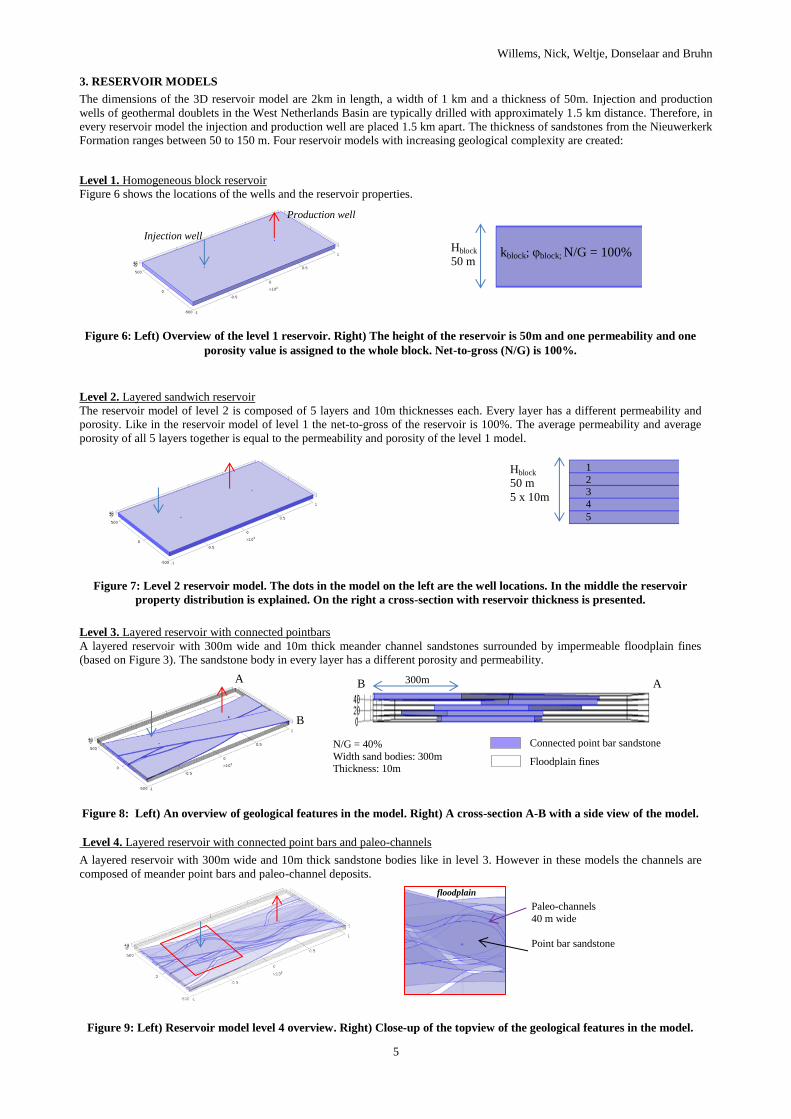
3. RESERVOIR MODELS
The dimensions of the 3D reservoir model are 2km in length, a width of 1 km and a thickness of 50m. Injection and production
wells of geothermal doublets in the West Netherlands Basin are typically drilled with approximately 1.5 km distance. Therefore, in
every reservoir model the injection and production well are placed 1.5 km apart. The thickness of sandstones from the Nieuwerkerk
Formation ranges between 50 to 150 m. Four reservoir models with increasing geological complexity are created:
Level 1. Homogeneous block reservoir
Figure 6 shows the locations of the wells and the reservoir properties.
Figure 6: Left) Overview of the level 1 reservoir. Right) The height of the reservoir is 50m and one permeability and one
porosity value is assigned to the whole block. Net-to-gross (N/G) is 100%.
Level 2. Layered sandwich reservoir
The reservoir model of level 2 is composed of 5 layers and 10m thicknesses each. Every layer has a different permeability and
porosity. Like in the reservoir model of level 1 the net-to-gross of the reservoir is 100%. The average permeability and average
porosity of all 5 layers together is equal to the permeability and porosity of the level 1 model.
Figure 7: Level 2 reservoir model. The dots in the model on the left are the well locations. In the middle the reservoir
property distribution is explained. On the right a cross-section with reservoir thickness is presented.
Level 3. Layered reservoir with connected pointbars
A layered reservoir with 300m wide and 10m thick meander channel sandstones surrounded by impermeable floodplain fines
(based on Figure 3). The sandstone body in every layer has a different porosity and permeability.
Figure 8: Left) An overview of geological features in the model. Right) A cross-section A-B with a side view of the model.
Level 4. Layered reservoir with connected point bars and paleo-channels
A layered reservoir with 300m wide and 10m thick sandstone bodies like in level 3. However in these models the channels are
composed of meander point bars and paleo-channel deposits.
Figure 9: Left) Reservoir model level 4 overview. Right) Close-up of the topview of the geological features in the model.
kblock; φblock; N/G = 100%
Hblock
50 m
Injection well
Production well
Hblock
50 m
5 x 10m
1
2 3
4
5
N/G = 40%
Width sand bodies: 300m Thickness: 10m
A
B
B A 300m
Connected point bar sandstone
Floodplain fines
Paleo-channels
40 m wide
Point bar sandstone
floodplain
Willems, Nick, Weltje, Donselaar and Bruhn
6
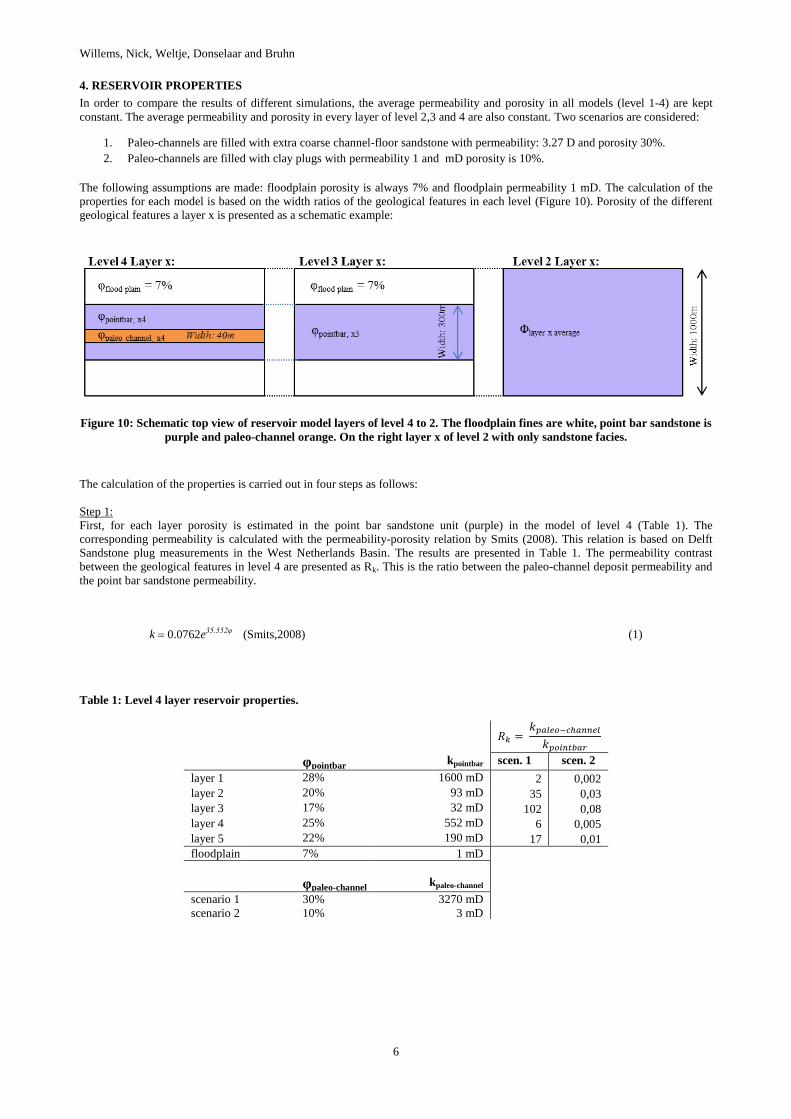
4. RESERVOIR PROPERTIES
In order to compare the results of different simulations, the average permeability and porosity in all models (level 1-4) are kept
constant. The average permeability and porosity in every layer of level 2,3 and 4 are also constant. Two scenarios are considered:
1. Paleo-channels are filled with extra coarse channel-floor sandstone with permeability: 3.27 D and porosity 30%.
2. Paleo-channels are filled with clay plugs with permeability 1 and mD porosity is 10%.
The following assumptions are made: floodplain porosity is always 7% and floodplain permeability 1 mD. The calculation of the
properties for each model is based on the width ratios of the geological features in each level (Figure 10). Porosity of the different
geological features a layer x is presented as a schematic example:
Figure 10: Schematic top view of reservoir model layers of level 4 to 2. The floodplain fines are white, point bar sandstone is
purple and paleo-channel orange. On the right layer x of level 2 with only sandstone facies.
The calculation of the properties is carried out in four steps as follows:
Step 1:
First, for each layer porosity is estimated in the point bar sandstone unit (purple) in the model of level 4 (Table 1). The
corresponding permeability is calculated with the permeability-porosity relation by Smits (2008). This relation is based on Delft
Sandstone plug measurements in the West Netherlands Basin. The results are presented in Table 1. The permeability contrast
between the geological features in level 4 are presented as Rk. This is the ratio between the paleo-channel deposit permeability and
the point bar sandstone permeability.
k 0.0762e35.552φ (Smits,2008) (1)
Table 1: Level 4 layer reservoir properties.
φpointbar kpointbar scen. 1 scen. 2
layer 1 28% 1600 mD 2 0,002
layer 2 20% 93 mD 35 0,03
layer 3 17% 32 mD 102 0,08
layer 4 25% 552 mD 6 0,005
layer 5 22% 190 mD 17 0,01
floodplain 7% 1 mD
φpaleo-channel kpaleo-channel
scenario 1 30% 3270 mD
scenario 2 10% 3 mD
Willems, Nick, Weltje, Donselaar and Bruhn
7
Step2:
Second, the average permeability and the average porosity (φlayer average) are calculated for each layer in the level 4 model using
equation 2 for scenario 1 and 2:
(2)
φlayer x average in the level 4 model is equal to the φlayer average of the level 3 and 2 model layer x.
Step 3:
In the third step the average porosity (φpointbar, x3) and permeability of the point bar sandstone body are calculated in the level 3
model for every layer using equation 3 in scenario 1 and 2.
(3)
Step 4:
The average permeability and porosity in the level 1 model are calculated in both scenarion 1 and 2 using equation 4 for scenarion 1
and 2:
(4)
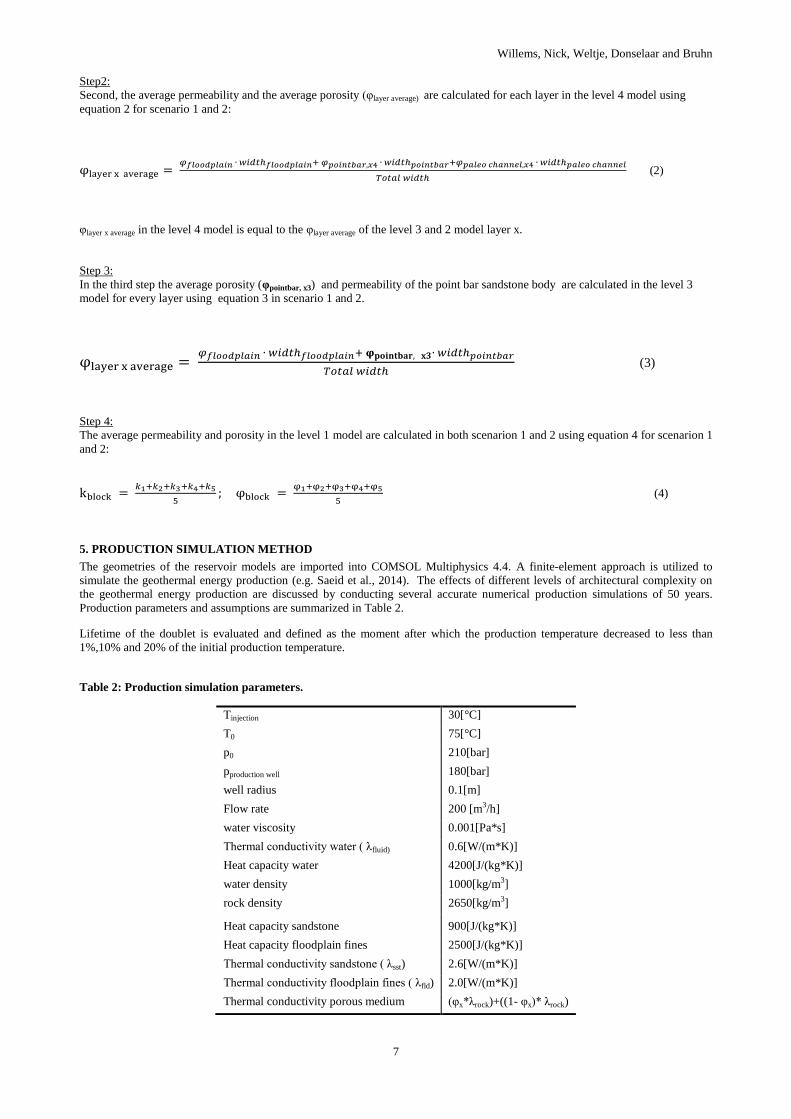
5. PRODUCTION SIMULATION METHOD
The geometries of the reservoir models are imported into COMSOL Multiphysics 4.4. A finite-element approach is utilized to
simulate the geothermal energy production (e.g. Saeid et al., 2014). The effects of different levels of architectural complexity on
the geothermal energy production are discussed by conducting several accurate numerical production simulations of 50 years.
Production parameters and assumptions are summarized in Table 2.
Lifetime of the doublet is evaluated and defined as the moment after which the production temperature decreased to less than
1%,10% and 20% of the initial production temperature.
Table 2: Production simulation parameters.
Tinjection 30[°C]
T0 75[°C]
p0 210[bar]
pproduction well 180[bar]
well radius 0.1[m]
Flow rate 200 [m3/h]
water viscosity 0.001[Pa*s]
Thermal conductivity water ( λfluid) 0.6[W/(m*K)]
Heat capacity water 4200[J/(kg*K)]
water density 1000[kg/m3]
rock density 2650[kg/m3]
Heat capacity sandstone 900[J/(kg*K)]
Heat capacity floodplain fines 2500[J/(kg*K)]
Thermal conductivity sandstone ( λsst) 2.6[W/(m*K)]
Thermal conductivity floodplain fines ( λfld) 2.0[W/(m*K)]
Thermal conductivity porous medium (φx*λrock)+((1- φx)* λrock)
Willems, Nick, Weltje, Donselaar and Bruhn
8
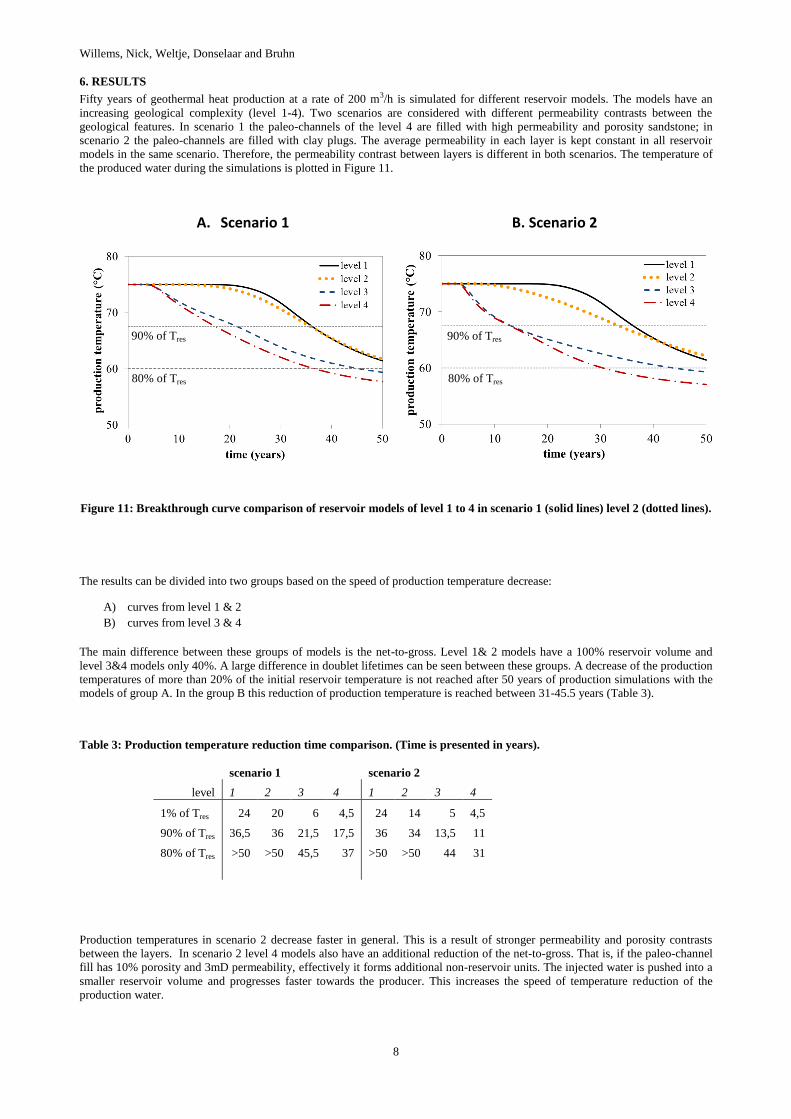
6. RESULTS
Fifty years of geothermal heat production at a rate of 200 m3/h is simulated for different reservoir models. The models have an
increasing geological complexity (level 1-4). Two scenarios are considered with different permeability contrasts between the
geological features. In scenario 1 the paleo-channels of the level 4 are filled with high permeability and porosity sandstone; in
scenario 2 the paleo-channels are filled with clay plugs. The average permeability in each layer is kept constant in all reservoir
models in the same scenario. Therefore, the permeability contrast between layers is different in both scenarios. The temperature of
the produced water during the simulations is plotted in Figure 11.
A. Scenario 1
B. Scenario 2
Figure 11: Breakthrough curve comparison of reservoir models of level 1 to 4 in scenario 1 (solid lines) level 2 (dotted lines).
The results can be divided into two groups based on the speed of production temperature decrease:
A) curves from level 1 & 2
B) curves from level 3 & 4
The main difference between these groups of models is the net-to-gross. Level 1& 2 models have a 100% reservoir volume and
level 3&4 models only 40%. A large difference in doublet lifetimes can be seen between these groups. A decrease of the production
temperatures of more than 20% of the initial reservoir temperature is not reached after 50 years of production simulations with the
models of group A. In the group B this reduction of production temperature is reached between 31-45.5 years (Table 3).
Table 3: Production temperature reduction time comparison. (Time is presented in years).
scenario 1
scenario 2
level 1 2 3 4 1 2 3 4
1% of Tres 24 20 6 4,5 24 14 5 4,5
90% of Tres 36,5 36 21,5 17,5 36 34 13,5 11
80% of Tres >50 >50 45,5 37 >50 >50 44 31
Production temperatures in scenario 2 decrease faster in general. This is a result of stronger permeability and porosity contrasts
between the layers. In scenario 2 level 4 models also have an additional reduction of the net-to-gross. That is, if the paleo-channel
fill has 10% porosity and 3mD permeability, effectively it forms additional non-reservoir units. The injected water is pushed into a
smaller reservoir volume and progresses faster towards the producer. This increases the speed of temperature reduction of the
production water.
90% of Tres
80% of Tres 80% of Tres
90% of Tres
Willems, Nick, Weltje, Donselaar and Bruhn
9
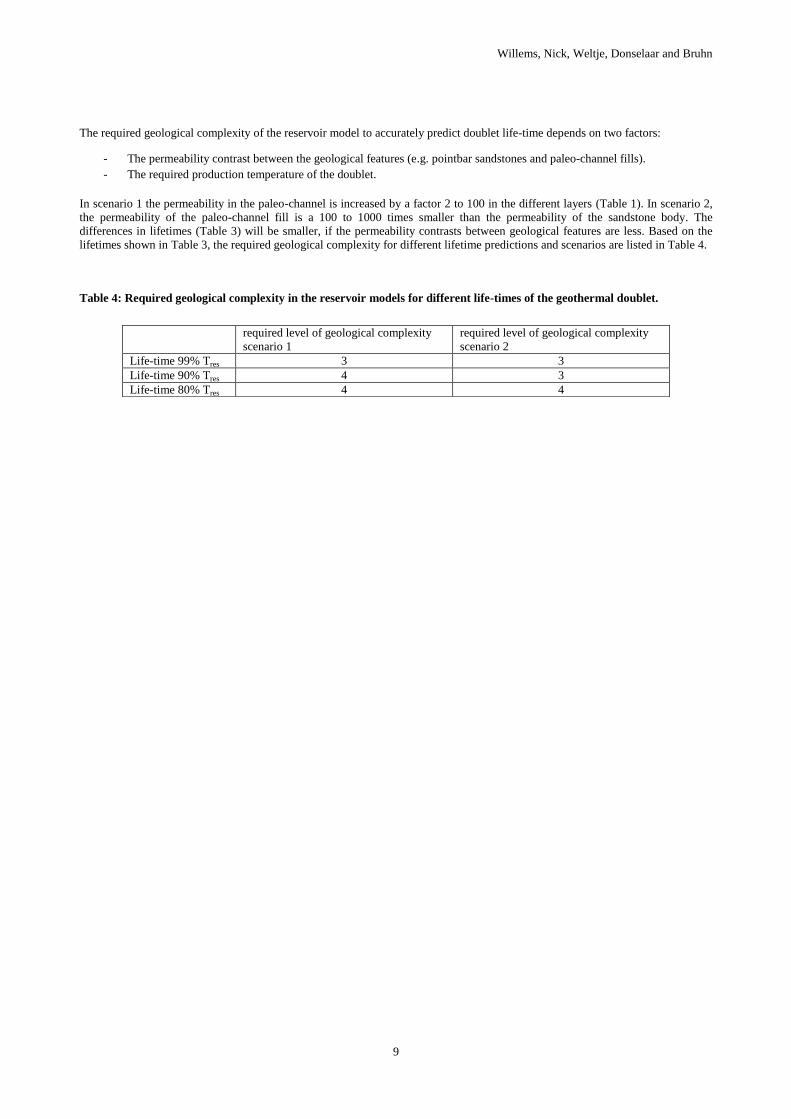
The required geological complexity of the reservoir model to accurately predict doublet life-time depends on two factors:
- The permeability contrast between the geological features (e.g. pointbar sandstones and paleo-channel fills).
- The required production temperature of the doublet.
In scenario 1 the permeability in the paleo-channel is increased by a factor 2 to 100 in the different layers (Table 1). In scenario 2,
the permeability of the paleo-channel fill is a 100 to 1000 times smaller than the permeability of the sandstone body. The
differences in lifetimes (Table 3) will be smaller, if the permeability contrasts between geological features are less. Based on the
lifetimes shown in Table 3, the required geological complexity for different lifetime predictions and scenarios are listed in Table 4.
Table 4: Required geological complexity in the reservoir models for different life-times of the geothermal doublet.
required level of geological complexity
scenario 1
required level of geological complexity
scenario 2
Life-time 99% Tres 3 3
Life-time 90% Tres 4 3
Life-time 80% Tres 4 4
Willems, Nick, Weltje, Donselaar and Bruhn
10
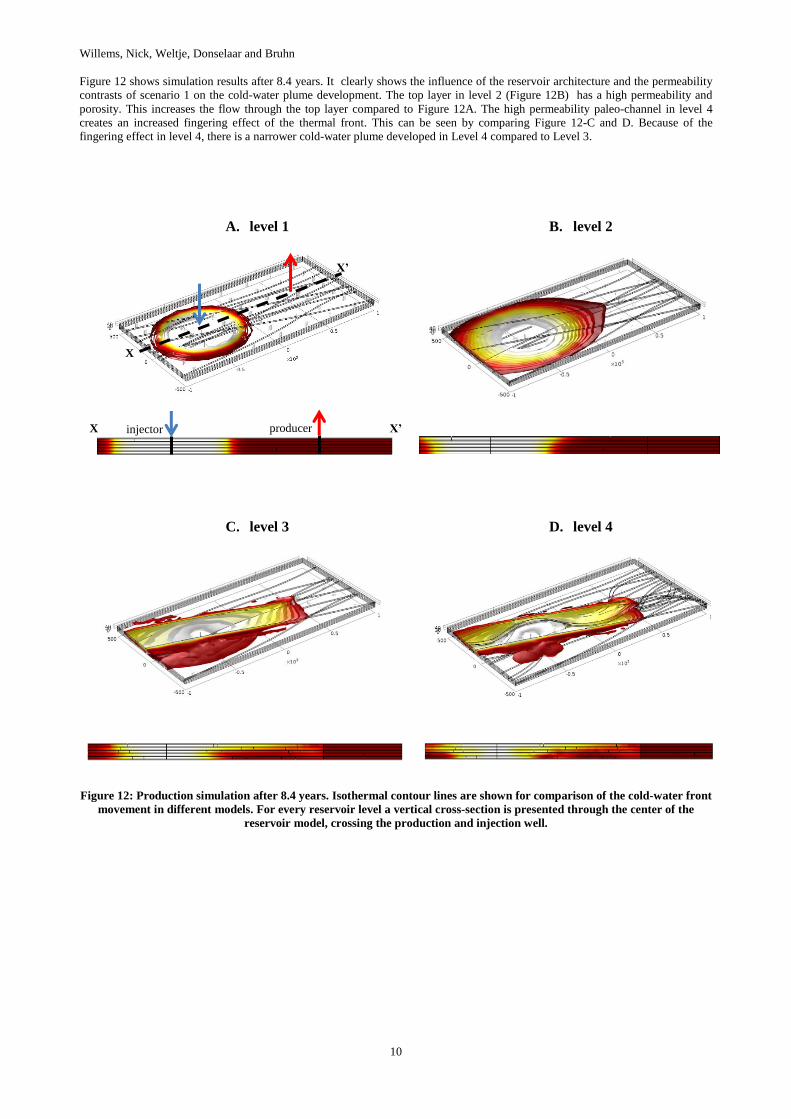
Figure 12 shows simulation results after 8.4 years. It clearly shows the influence of the reservoir architecture and the permeability
contrasts of scenario 1 on the cold-water plume development. The top layer in level 2 (Figure 12B) has a high permeability and
porosity. This increases the flow through the top layer compared to Figure 12A. The high permeability paleo-channel in level 4
creates an increased fingering effect of the thermal front. This can be seen by comparing Figure 12-C and D. Because of the
fingering effect in level 4, there is a narrower cold-water plume developed in Level 4 compared to Level 3.
Figure 12: Production simulation after 8.4 years. Isothermal contour lines are shown for comparison of the cold-water front
movement in different models. For every reservoir level a vertical cross-section is presented through the center of the
reservoir model, crossing the production and injection well.
A. level 1 B. level 2
C. level 3 D. level 4
producer X X’
X
X’
injector
Willems, Nick, Weltje, Donselaar and Bruhn
11
7. DISCUSSION
Cross-flow between stacked reservoir intervals is enhanced by permeability contrasts between the intervals. Deo et al. (2013)
showed the effect of permeability contrasts in stacked layered reservoirs. Further investigation is required by taking the 3D facies
and property distribution into account. Results show that not only vertical heterogeneities, but also reservoir architecture, influence
the cold-water plume movement and lifetime of geothermal doublets.
In this study the sandstone bodies currently have one permeability and one porosity in every geological feature. If permeability and
porosity are randomly distributed in the bodies, cold-water breakthrough will be faster. However, this will also diffuse the thermal
front and decrease the slope of the production temperature. Although adding more geological detail in the level 4 models affects the
lifetime of the doublet, geological models of level 3 are sufficient to predict flow and heat transfer behaviors, particularly, for the
cases with smaller permeability contrasts between geological features within each layer.
Further work is required:
To investigate the effect of well placement with respect to the paleo-flow direction of the fluvial sedimentary bodies. In the
reservoir models of this project the injection and production wells are placed parallel to the paleo-flow direction. This
increases the chance of high connectivity and shortening the lifetime.
To study models with an increased level of geological complexity. For example, Level 5 reservoir models can be created by
process-based facies modelling software. These models are geologically more realistic. In the current models the reservoir
architecture is simplified by assuming the sandstone bodies to be constant in thickness and width. Erosion by younger
meandering channels is ignored in these models.
To study the reservoir pressure responses for different scenarios. Next to a temperature, pressure distribution in the reservoirs
with increasing geological detail can be studied. Mijnlieff &Van Wees (2009) evaluated pressure interference of adjacent
doublets in tramline and in checker-board configuration. This was carried out in a homogeneous 2D reservoir. Pressure
interference can have a negative or positive effect on the productivity or injectivity in adjacent doublets. The magnitude of the
effect depends on the distance between the wells. Geological heterogeneities and geological architecture in the reservoir
model, however, will affect the pressure interference.
8. CONCLUSIONS
In this work, the effects of different levels of architectural complexity on the geothermal energy production, by conducting several
accurate numerical simulations, are discussed. Reservoir models with increasing geological complexity for two different scenarios
are compared. Based on the simulation results the following conclusions can be made:
The net-to-gross and hence the reservoir volume is the most important parameter. It determines the connectivity of the
sandstone bodies. In lower net-to-gros reservoir models, the injected water is forced into a smaller reservoir volume and
therefore progresses faster horizontally towards the production well in the level 3 and 4 models. This effect is enhanced
by permeability and porosity contrasts between the layers.
An overestimation of the net-reservoir volume (models of level 1&2) leads to overestimation of the lifetime of a doublet.
The higher geological detail of level 4 models influences the simulation results compared to level 3 models. High
permeability streaks of the channel sandstones in scenario 1 create short-circuit flow paths. Clay plugs in scenario 2
reduce the net reservoir volume. Therefore, the life-time of the doublet is decreased in scenario 2.
The required geological complexity is dependent on the permeability contrasts between geological features in the
reservoir models. In scenario 1 and 2 high permeability contrasts are present between geological features. Therefore, in
these scenarios, explicit representation of geological features is essential in order to have accurate life-time predictions.
The results are very sensitive to net-to-gross and stacking pattern of the channels (for level 3&4). In the current modelling
of these models sandstone bodies have good connectivity. If this is decreased by for example changing the paleo-flow
direction of one of the stacked channels, production temperature will decrease faster. This because of the lower net-
reservoir volume.
Willems, Nick, Weltje, Donselaar and Bruhn
12
REFERENCES
Gozalo, C., M.C., Donselaar, M.E. and Geel C.R.: Data acquisition and analysis: Assessment and analysis of depositional
architecture (chapter 2). In: van Kruijsdijk, C.P.J.W. and Elewaut, E.F.M. (eds.); Reservoir Engineering and Geoscience,
Final report, EC Joule II, Reservoir Engineering Project, JOU2-0182. NITG-TNO Report (1997), Delft, 3-57.
Deo, M., Roehner, R., Allis, R., Moore, J: Reservoir modelling of geothermal energy production from stratigraphic reservoirs in the
great basin, Proceedings, Thirty-Eighth Workshop on Geothermal Reservoir Engineering Stanford University, Stanford,
California, (2013).
DeVault, B. & Jeremiah, J.: Tectonostratigraphy of the Nieuwerkerk Formation (Delfland Subgroup), West Netherlands Basin,
American Association of Petroleum Geologists Bulletin, 8, (2002), 1679–1707.
Donselaar, M.E., Overeem, I.: Connectivity of fluvial point-bar deposits: An example from the Miocene Huesca fluvial fan, Ebro
Basin, Spain. AAPG Bulletin, 92(9), (2008), 1109-1129.
Keogh, K.J., Martinius, A.W., Osland, R.: The development of fluvial stochastic modelling in the Norwegian oil industry: A
historical review, subsurface implementation and future directions, Sedimentary Geology, 202, (2007), 249–268.
Mijnlieff, H., Van Wees, J.D.: Rapportage Ruimtelijke Ordening Geothermie, TNO report, (2007).
Saeid, S., Al-Khoury, R., Nick, H. M., & Barends, F.: Experimental–numerical study of heat flow in deep low-enthalpy geothermal
conditions. Renewable Energy, 62, (2014), 716-730.
Smit, R.C.A.: Optimization of geothermal well doublet placement, MSc Thesis, Delft University of Technology, (2012).
Smits, P.F. Construction of an integrated reservoir model using the Moerkapelle field for geothermal development of the Delft
sandstone, MSc Thesis, Delft University of Technology, (2008).
Van Adrichem Boogaert, H. A., and W. F. P. Kouwe, comps.,: Stratigraphic nomenclature of the Netherlands, revision and update
by Rijks Geologische Dienst (RGD) and Netherlands Oil and Gas Exploration and Production Association (NOGEPA).
Mededelingen Rijks Geologische Dienst , 50, (1993), 1–180.
Van Heekeren, E.V., Bakema, G.: Geothermal Energy Use, 2013 Country Update for the Netherlands, European Geothermal
Congress 2013 Pisa, Italy, (2013).