Embed Size (px)
Citation preview
Delft University of Technology
Analysis of landing gear noise during approach
Merino Martinez, Roberto; Snellen, Mirjam; Simons, Dick
DOI10.2514/6.2016-2769Publication date2016Document VersionPeer reviewed versionPublished inProceedings of the 22nd AIAA-CEAS Aeroacoustics Conference
Citation (APA)Merino Martinez, R., Snellen, M., & Simons, D. (2016). Analysis of landing gear noise during approach. InProceedings of the 22nd AIAA-CEAS Aeroacoustics Conference: Lyon, France DOI: 10.2514/6.2016-2769
Important noteTo cite this publication, please use the final published version (if applicable).Please check the document version above.
CopyrightOther than for strictly personal use, it is not permitted to download, forward or distribute the text or part of it, without the consentof the author(s) and/or copyright holder(s), unless the work is under an open content license such as Creative Commons.
Takedown policyPlease contact us and provide details if you believe this document breaches copyrights.We will remove access to the work immediately and investigate your claim.
This work is downloaded from Delft University of Technology.For technical reasons the number of authors shown on this cover page is limited to a maximum of 10.
Analysis of landing gear noise during approach
Roberto Merino-Martınez∗
Delft University of Technology, 2629 HS Delft, the Netherlands
Lothar Bertsch†
German Aerospace Center (DLR), 37073 Gottingen, Germany
Mirjam Snellen‡and Dick G. Simons§
Delft University of Technology, 2629 HS Delft, the Netherlands
Airframe noise is becoming increasingly important during approach, even reachinghigher noise levels than the engines in some cases. More people are affected due to lowflight altitudes and fixed traffic routing associated with typical approaches. For most air-craft types, the landing gear system is a dominant airframe noise source. However, thiselement can only be modeled in an approximate manner in wind tunnel experiments. In thisresearch, flyovers of landing aircraft were recorded using a 32 microphone array. Functionalbeamforming was applied to analyze the noise emissions from the landing gear system. Itwas confirmed that for some aircraft types, such as the Airbus A320 and the Fokker 70, thenose landing gear is a dominant noise source during approach. The correlation betweenthe noise levels generated by the landing gear and the aircraft velocity was found to besignificant, explaining about 70% of the variability found in the noise levels, which is ingood agreement with all known theory. Moreover, the experimental results for the AirbusA320 measurements were compared with those obtained using the DLR system noise pre-diction tool PANAM. Whereas the total aircraft noise levels were in good agreement, themeasurements indicate a higher contribution from the nose landing gear noise comparedto the predictions.
I. Introduction
For decades, aircraft noise has been a continuous nuisance for residents living in the surroundings ofairports. This problem also affects the aerospace industry, because noise regulations are becoming stricter
leading to the limitation of the capacity of airports, night curfews and penalties to the airlines. All thesefacts occur in a situation with a continuous growth of air traffic (around a 5% rate per year up to 2013[1]),which is expected to aggravate the problem even more in the near future.
Engine noise has been reduced significantly on modern aircraft thanks to the implementation of highbypass ratio turbofan engines and acoustic lining around the 1970s [2, 3]. The reduction is such that, duringlanding, engines are not always the dominant noise source anymore and airframe noise, namely the noiseproduced by the interaction of the aerodynamic surfaces with the surrounding turbulent flow [4], is becomingmore relevant, generating in some cases higher Sound Pressure Level (SPL) values than the engines. Thedominant airframe noise source in most cases is the landing gear system [3, 5], followed by the leading edgeand trailing edge devices, if deployed.
To determine the relative noise contributions of the aircraft elements, microphone arrays can be employed.Beamforming algorithms are applied to the array acoustic data to estimate the location and amplitude of
∗PhD candidate, Aircraft Noise & Climate Effects section, Faculty of Aerospace Engineering, Kluyverweg 1. AIAA StudentMember. E-mail: [email protected]†Research Engineer, Institute of Aerodynamics and Flow Technology, Bunsenstraße 10. E-mail: [email protected]‡Associate professor, Aircraft Noise & Climate Effects section, Faculty of Aerospace Engineering, Kluyverweg 1. E-mail:
[email protected]§Full professor, Aircraft Noise & Climate Effects section, Faculty of Aerospace Engineering, Kluyverweg 1. E-mail:
1 of 12
American Institute of Aeronautics and Astronautics
sound sources at a selected frequency. Flyover tests with microphone arrays are the only feasible methodto accurately measure the sound sources of an aircraft in real flight conditions, which are very difficult torepresent in a precise way in wind tunnel experiments or numerical simulations [6]. For the case of landinggear noise, the study of small scale models in wind tunnels is usually not accurate enough due to the lackof geometrical detail in these models and the violation of the Reynolds similarity condition [3, 5, 7]. Forinstance, the presence of parasitic noise sources, which can contribute significantly to the overall airframenoise signature, may be overlooked [3].
In this research, 115 flyovers were recorded using a 32 microphone array to determine the main aircraftnoise sources and their relative contributions for a variety of aircraft types under operational conditions.This paper focuses on 7 Airbus A320 and 23 Fokker 70 flyover measurements. Special emphasis was placedon the nose landing gear noise, studying its behavior in terms of frequency and aircraft velocity. Moreover,a correlation analysis was performed as an attempt to relate the observed variations in the noise levels fromthe landing gear to other factors, such as the aircraft velocity.
In addition, the experimental frequency spectra were compared with the results provided by an aircraftsystem noise prediction tool.
II. Experimental setup
The experimental campaign took place at Amsterdam Airport Schiphol, where 115 landing flyover mea-surements were recorded using a 32 microphone array arranged in a spiral distribution, see Fig. 1(a). Thearray has an effective diameter of 1.7 m and uses band filters for the frequency range from 45 Hz to 11,200Hz. The sampling frequency employed was 40 kHz. Moreover, an optical camera was integrated in thecenter of the array at a fixed angle facing straight up, allowing the use of video footage synchronised withthe acoustic data. The measurements were taken during two days with similar weather conditions and lowwind speed [8].
Flight trajectories during landing are usually more regular than the ones for take-off, because all aircraftfollow the Instrument Landing System (ILS) approach. In addition, the main reason for recording landingaircraft is because the engines are usually at approach idle or low fan rotational speed, so engine noise is lessdominant and, thus, it is more likely to identify airframe noise sources. Hence, the microphone array waslocated 1240 m to the South of the threshold of the Aalsmeerbaan runway (36R), mainly used for landing,as illustrated in Fig. 1(b).
(a) (b)
Figure 1: (a) 32 Microphone array configuration, (b) Experimental setup located 1240 m to the South of thethreshold of the Aalsmeerbaan (36R) Schiphol airport runway.
To be able to properly correct the propagation and Doppler effects, the trajectories of the aircraft needto be precisely determined. To that end, three different approaches [9] were used: The ADS-B (AutomaticDependent Surveillance-Broadcast), the ground radar from air traffic control, and the extrapolation of theoptical camera images. The agreement between the results from the three methods is satisfactory. Theoptical camera data are preferred due to its availability and because it is easier to overlay the beamformingsource plots to the optical frames. The other methods were used as a validation for the trajectory estimations.The average flight altitude and average aircraft velocity above the array were determined to be 67 m and
2 of 12
American Institute of Aeronautics and Astronautics
271 km/h, respectively. For such close distances to the threshold, small variations of velocity and altitudecan be expected along the standard ILS approach.
The recorded acoustic data correspond to 13 different aircraft families, depending on the type of engineinstalled, see table 1. For this paper, only the Airbus A320 (7 flyovers) and Fokker 70 (23 flyovers) casesare further investigated. The Airbus A320 type was separated in two different categories because they wereequipped with different engines. However, because this research focuses on airframe noise, both categorieswere analyzed together.
Table 1: Aircraft types with their correspondent engine and the number of recorded measurements for eachtype. The measurements analyzed in this paper are shown in bold.
Aircraft type Amount Engine type
Airbus 300 1 CF6-80C2A5
Airbus 320 (CFM) 4 CFM56-5B5/P
Airbus 320 (IAE) 3 IAE V2500-A1
Airbus 380 1 GP7270
Boeing 737 (series 300, 400 and 500) 9 CFM56-3C1
Boeing 737 (series 700, 800 and 900) 50 CFM56-7B
Boeing 747 4 CF6-80C2B1F
Boeing 767 1 PW 4060
Boeing 777 6 GE90-94B
Embraer 145 1 RR AE3007A1
Embraer 190 11 GE CF34-10E5
Fokker 70 23 RR TAY 620
McDonnell Douglas 81 1 PW JT8D-217C
III. Beamforming method
A. Data preprocessing
Several preprocessing considerations need to be taken into account for the case of flyover measurements. Toperform these corrections, the aircraft flight trajectories need to be accurately estimated, as was mentionedin Sec. II.
1. First of all, to avoid amplification errors, the background noise needs to be considered, such as thenoise generated by the microphone array electronics or the ambient noise. Thus, all the SPL values inthe spectrograms under a 30 dB threshold value were neglected [8].
2. Secondly, the Doppler effect due to the relative motion of the aircraft with respect to the observerneeds to be corrected to determine the emitted frequencies. A resampling of the data is required, asstated by Howell et. al. [10]. Moreover, the effect of the moving source also affects the time delaysconsidered for the beamforming algorithms [6, 9].
3. Lastly, the propagation effects (namely the geometrical spreading and the atmospheric absorption)have to be considered for obtaining the actual SPL values at the source location [2, 8].
B. Functional beamforming
Functional beamforming is a novel technique recently developed (2014) by Dougherty [11, 12]. This methodis based on the conventional frequency domain beamforming (CFDBF) algorithm, also known as delay-and-sum, which is the most widely used method for aeroacoustic experiments [6, 13–18]. The performance offunctional beamforming depends on an exponent parameter ν which needs to be set by the user.
3 of 12
American Institute of Aeronautics and Astronautics
The source autopower (Aν) expression for the functional beamformer is based on the eigenvalue decom-position of the cross-spectral matrix C. For the general case of a N -microphone array and for a general gridpoint ξj in the scan plane:
Aν (ξj) =[w∗jC
1νwj
]ν=
[w∗jUΣ
1νU∗wj
]ν(1)
where an asterisk (·)∗ denotes the complex conjugate transpose, U is a unitary matrix whose columns are theeigenvectors of C, Σ is a diagonal matrix whose diagonal elements are the eigenvalues of C, and wj ∈ CN×1
is the normalized steering vector, gj ∈ CN×1, for that grid point ξj . The steering vector accounts forthe phase shifts and change in amplitude between the source and each microphone [6, 9, 19]. Differentsteering vector normalizations are found in the literature [20], but none of them is able to provide the exactsource location and the correct source strength at the same time, although the errors are typically small foracoustic sources close to nadir, as considered in this paper. In this research, two different normalizationswere employed. The first one provides the correct source position [Eq. (2)] and the second one the correctsource strength [Eq. (3)].
wjpos =gj‖gj‖
(2)
wjstr =gj
‖gj‖2(3)
A compromise solution is to first calculate the source plot with the correct source positions using Eq. (2)in Eq. (1) and later correct the SPL values of the whole source plot according to the ones obtained whenusing Eq. (3) in Eq. (1). In this way, a satisfactory combination of estimating both source strength andlocation is achieved.
With functional beamforming, the Point Spread Function (PSF) factor is now powered to the exponentν [11]. Therefore, powering the PSF at a sidelobe will lower its level, leaving the true source value identical.For ideal conditions, the dynamic range (the difference in decibels between the main lobe and the highestsidelobe [6]) for the functional beamforming should increase linearly with the exponent value, ν [11]. Thus,for an appropriate exponent value the dynamic range is significantly increased. The beamforming peak willalso be sharpened, improving the array spatial resolution (width of the main lobe 3 dB under the peak [21])to some extent. The computational time for the functional beamforming is basically identical to the CFDBF,because the only relevant operation added is the eigenvalue decomposition of C, which is typically fasterthan the rest of steps involved in the beamforming process. Notice that the case with ν = 1 corresponds tothe CFDBF formula.
In previous work, functional beamforming has been applied for numerical simulations [9, 11, 12], ideal-ized cases with speakers as experimental noise sources, and controlled experiments with components in alaboratory [11, 12]. This algorithm was also tested recently [9, 19] for practical aeroacoustic experiments onfull-scale aircraft during operational conditions indicating a dynamic range (in decibels) approximately 30times larger and an array spatial resolution 6 times better than the CFDBF. Thus, this algorithm is moresuitable for flyover measurements.
IV. Experimental results
Henceforth, all the presented results refer to emission angles of 90◦, i.e., the direction perpendicular tothe aircraft, pointing down and at the source position. The azimuthal angle was considered to be 0◦, i.e.,within the aircraft symmetry plane.
A. Analysis of the Airbus A320 nose landing gear noise
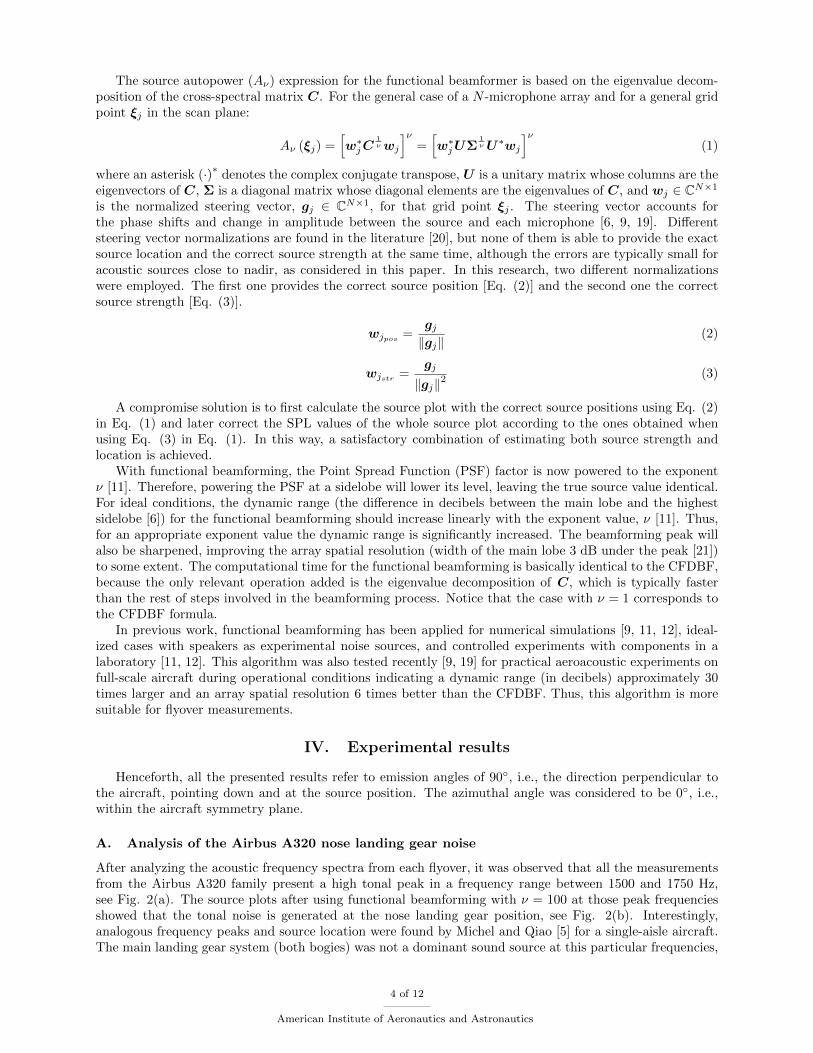
After analyzing the acoustic frequency spectra from each flyover, it was observed that all the measurementsfrom the Airbus A320 family present a high tonal peak in a frequency range between 1500 and 1750 Hz,see Fig. 2(a). The source plots after using functional beamforming with ν = 100 at those peak frequenciesshowed that the tonal noise is generated at the nose landing gear position, see Fig. 2(b). Interestingly,analogous frequency peaks and source location were found by Michel and Qiao [5] for a single-aisle aircraft.The main landing gear system (both bogies) was not a dominant sound source at this particular frequencies,
4 of 12
American Institute of Aeronautics and Astronautics
but it usually has a similar contribution than the nose landing gear [3, 22], as will be shown later in Sec. IV.B.However, it is more difficult to isolate the noise coming from the main landing gear, due to the proximityto the engines in most aircraft types, which can obscure the beamforming source plots. This is a problemespecially at low frequencies, due to the Rayleigh criterion [5, 23].
1 2 3 4 5 6 7 8 9 10Frequency, [kHz]
75
80
85
90
95
100
105
110
115
120
125
SPL
[dB
]
1719 Hz
(a)
-20 -10 0 10 20x [m]
-40
-30
-20
-10
0
10
20
30
y [m
]
93
95
97
99
101
103
105
107
109
111
SPL
[dB
]
(b)
Figure 2: (a) Frequency spectrum at the source position for an Airbus A320 flyover during the time overhead,(b) Beamforming source plot for the same Airbus A320 flyover at the peak frequency of 1719 Hz. Functionalbeamforming was applied with ν = 100.
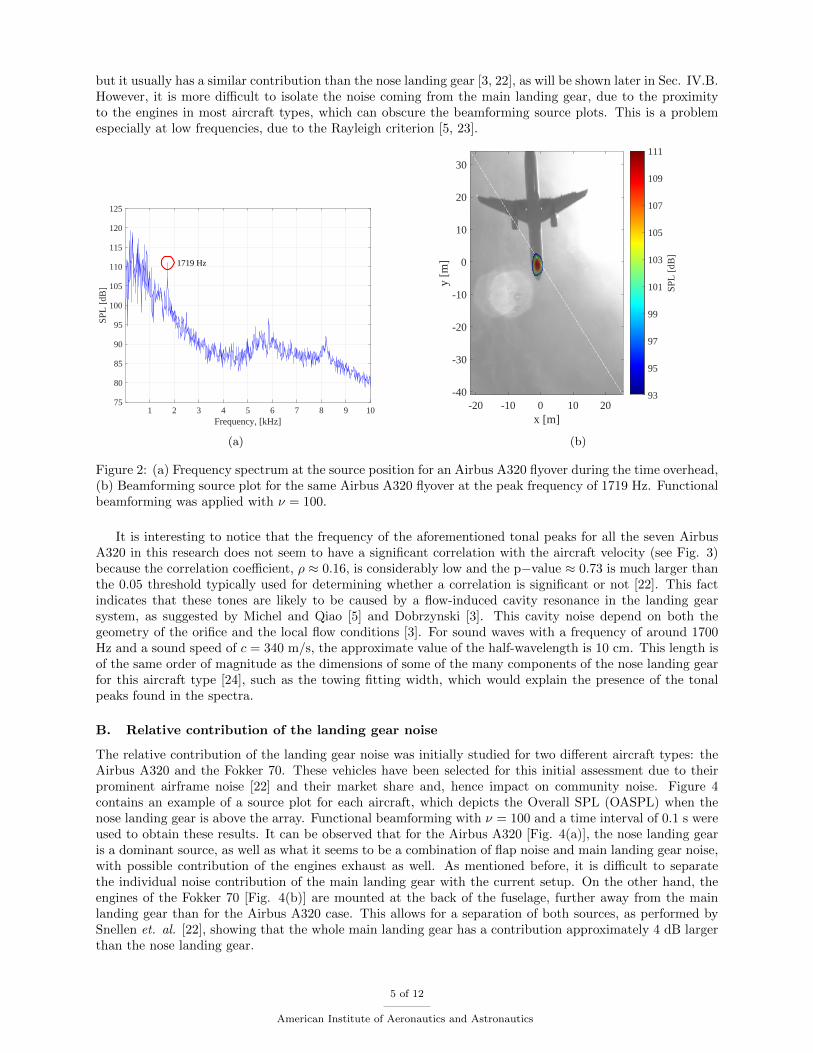
It is interesting to notice that the frequency of the aforementioned tonal peaks for all the seven AirbusA320 in this research does not seem to have a significant correlation with the aircraft velocity (see Fig. 3)because the correlation coefficient, ρ ≈ 0.16, is considerably low and the p−value ≈ 0.73 is much larger thanthe 0.05 threshold typically used for determining whether a correlation is significant or not [22]. This factindicates that these tones are likely to be caused by a flow-induced cavity resonance in the landing gearsystem, as suggested by Michel and Qiao [5] and Dobrzynski [3]. This cavity noise depend on both thegeometry of the orifice and the local flow conditions [3]. For sound waves with a frequency of around 1700Hz and a sound speed of c = 340 m/s, the approximate value of the half-wavelength is 10 cm. This length isof the same order of magnitude as the dimensions of some of the many components of the nose landing gearfor this aircraft type [24], such as the towing fitting width, which would explain the presence of the tonalpeaks found in the spectra.
B. Relative contribution of the landing gear noise
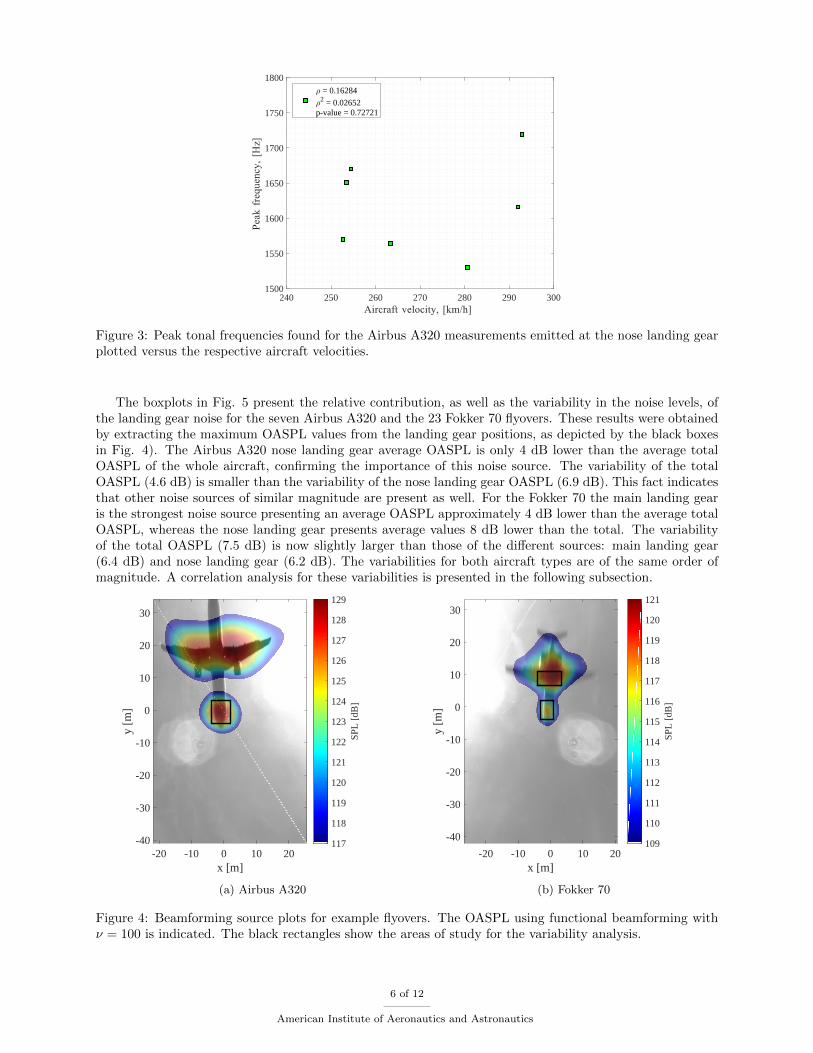
The relative contribution of the landing gear noise was initially studied for two different aircraft types: theAirbus A320 and the Fokker 70. These vehicles have been selected for this initial assessment due to theirprominent airframe noise [22] and their market share and, hence impact on community noise. Figure 4contains an example of a source plot for each aircraft, which depicts the Overall SPL (OASPL) when thenose landing gear is above the array. Functional beamforming with ν = 100 and a time interval of 0.1 s wereused to obtain these results. It can be observed that for the Airbus A320 [Fig. 4(a)], the nose landing gearis a dominant source, as well as what it seems to be a combination of flap noise and main landing gear noise,with possible contribution of the engines exhaust as well. As mentioned before, it is difficult to separatethe individual noise contribution of the main landing gear with the current setup. On the other hand, theengines of the Fokker 70 [Fig. 4(b)] are mounted at the back of the fuselage, further away from the mainlanding gear than for the Airbus A320 case. This allows for a separation of both sources, as performed bySnellen et. al. [22], showing that the whole main landing gear has a contribution approximately 4 dB largerthan the nose landing gear.
5 of 12
American Institute of Aeronautics and Astronautics
240 250 260 270 280 290 300Aircraft velocity, [km/h]
1500
1550
1600
1650
1700
1750
1800
Peak
fre
quen
cy, [
Hz]
ρ = 0.16284
ρ2 = 0.02652
p-value = 0.72721
Figure 3: Peak tonal frequencies found for the Airbus A320 measurements emitted at the nose landing gearplotted versus the respective aircraft velocities.
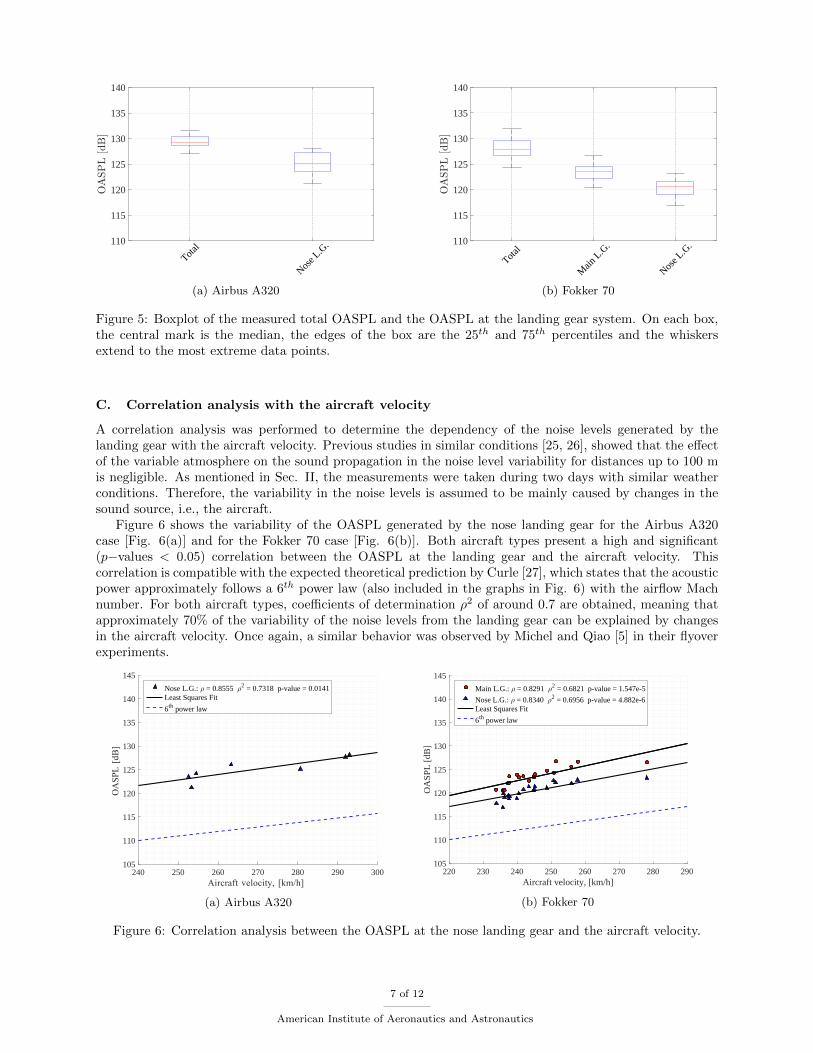
The boxplots in Fig. 5 present the relative contribution, as well as the variability in the noise levels, ofthe landing gear noise for the seven Airbus A320 and the 23 Fokker 70 flyovers. These results were obtainedby extracting the maximum OASPL values from the landing gear positions, as depicted by the black boxesin Fig. 4). The Airbus A320 nose landing gear average OASPL is only 4 dB lower than the average totalOASPL of the whole aircraft, confirming the importance of this noise source. The variability of the totalOASPL (4.6 dB) is smaller than the variability of the nose landing gear OASPL (6.9 dB). This fact indicatesthat other noise sources of similar magnitude are present as well. For the Fokker 70 the main landing gearis the strongest noise source presenting an average OASPL approximately 4 dB lower than the average totalOASPL, whereas the nose landing gear presents average values 8 dB lower than the total. The variabilityof the total OASPL (7.5 dB) is now slightly larger than those of the different sources: main landing gear(6.4 dB) and nose landing gear (6.2 dB). The variabilities for both aircraft types are of the same order ofmagnitude. A correlation analysis for these variabilities is presented in the following subsection.
-20 -10 0 10 20x [m]
-40
-30
-20
-10
0
10
20
30
y [m
]
117
118
119
120
121
122
123
124
125
126
127
128
129
SPL
[dB
]
(a) Airbus A320
-20 -10 0 10 20x [m]
-40
-30
-20
-10
0
10
20
30
y [m
]
109
110
111
112
113
114
115
116
117
118
119
120
121
SPL
[dB
]
(b) Fokker 70
Figure 4: Beamforming source plots for example flyovers. The OASPL using functional beamforming withν = 100 is indicated. The black rectangles show the areas of study for the variability analysis.
6 of 12
American Institute of Aeronautics and Astronautics
110
115
120
125
130
135
140
OA
SPL
[dB]
Total
Nose L
.G.
(a) Airbus A320
110
115
120
125
130
135
140
OA
SPL
[dB]
Total
Main
L.G
.
Nose L
.G.
(b) Fokker 70
Figure 5: Boxplot of the measured total OASPL and the OASPL at the landing gear system. On each box,the central mark is the median, the edges of the box are the 25th and 75th percentiles and the whiskersextend to the most extreme data points.
C. Correlation analysis with the aircraft velocity
A correlation analysis was performed to determine the dependency of the noise levels generated by thelanding gear with the aircraft velocity. Previous studies in similar conditions [25, 26], showed that the effectof the variable atmosphere on the sound propagation in the noise level variability for distances up to 100 mis negligible. As mentioned in Sec. II, the measurements were taken during two days with similar weatherconditions. Therefore, the variability in the noise levels is assumed to be mainly caused by changes in thesound source, i.e., the aircraft.
Figure 6 shows the variability of the OASPL generated by the nose landing gear for the Airbus A320case [Fig. 6(a)] and for the Fokker 70 case [Fig. 6(b)]. Both aircraft types present a high and significant(p−values < 0.05) correlation between the OASPL at the landing gear and the aircraft velocity. Thiscorrelation is compatible with the expected theoretical prediction by Curle [27], which states that the acousticpower approximately follows a 6th power law (also included in the graphs in Fig. 6) with the airflow Machnumber. For both aircraft types, coefficients of determination ρ2 of around 0.7 are obtained, meaning thatapproximately 70% of the variability of the noise levels from the landing gear can be explained by changesin the aircraft velocity. Once again, a similar behavior was observed by Michel and Qiao [5] in their flyoverexperiments.
240 250 260 270 280 290 300Aircraft velocity, [km/h]
105
110
115
120
125
130
135
140
145
OA
SPL
[dB
]
Nose L.G.: ρ = 0.8555 ρ2 = 0.7318 p-value = 0.0141Least Squares Fit
6th power law
(a) Airbus A320
220 230 240 250 260 270 280 290Aircraft velocity, [km/h]
105
110
115
120
125
130
135
140
145
OA
SPL
[dB
]
Main L.G.: ρ = 0.8291 ρ2 = 0.6821 p-value = 1.547e-5
Nose L.G.: ρ = 0.8340 ρ2 = 0.6956 p-value = 4.882e-6Least Squares Fit
6th power law
(b) Fokker 70
Figure 6: Correlation analysis between the OASPL at the nose landing gear and the aircraft velocity.
7 of 12
American Institute of Aeronautics and Astronautics
D. Comparison with aircraft system noise prediction
In this section, the measured frequency spectra and OASPL values are compared with simulation results. Inprevious studies [30], the predictions from the methods of Fink [31] and Guo [32] were compared with windtunnel measurements using a scaled-model Boeing 777 main landing gear. However, as it was mentionedbefore, it is difficult to scale these results to obtain accurate full-scale predictions, since, for example, parasiticnoise sources may not be detected in wind tunnel experiments [3]. Therefore, the comparison of the predictionmodels with flyover data of aircraft under operational conditions is of great interest.
The simulations are carried out with a so-called scientific prediction tool. The German Aerospace Center(DLR) has developed this aircraft system noise prediction tool, i.e., the Parametric Aircraft Noise AnalysisModule (PANAM) [28]. PANAM models the overall aircraft noise as a sum of individual noise componentson-board and their interactions. Specific noise source models are applied to simulate the major noise sources,i.e., airframe and engine contributions, and ultimately to obtain the ground noise impact of the whole aircraft.These noise source models are parametrical, hence allow to modify the underlying parameters of each source.As a consequence, the parameters which refer to the operational and geometrical data can be optimized forminimal noise contribution (within predefined limits). This tool is mainly used to assess the impact of low-noise modifications to individual components on-board of existing aircraft or for the design of new low-noiseaircraft [29].
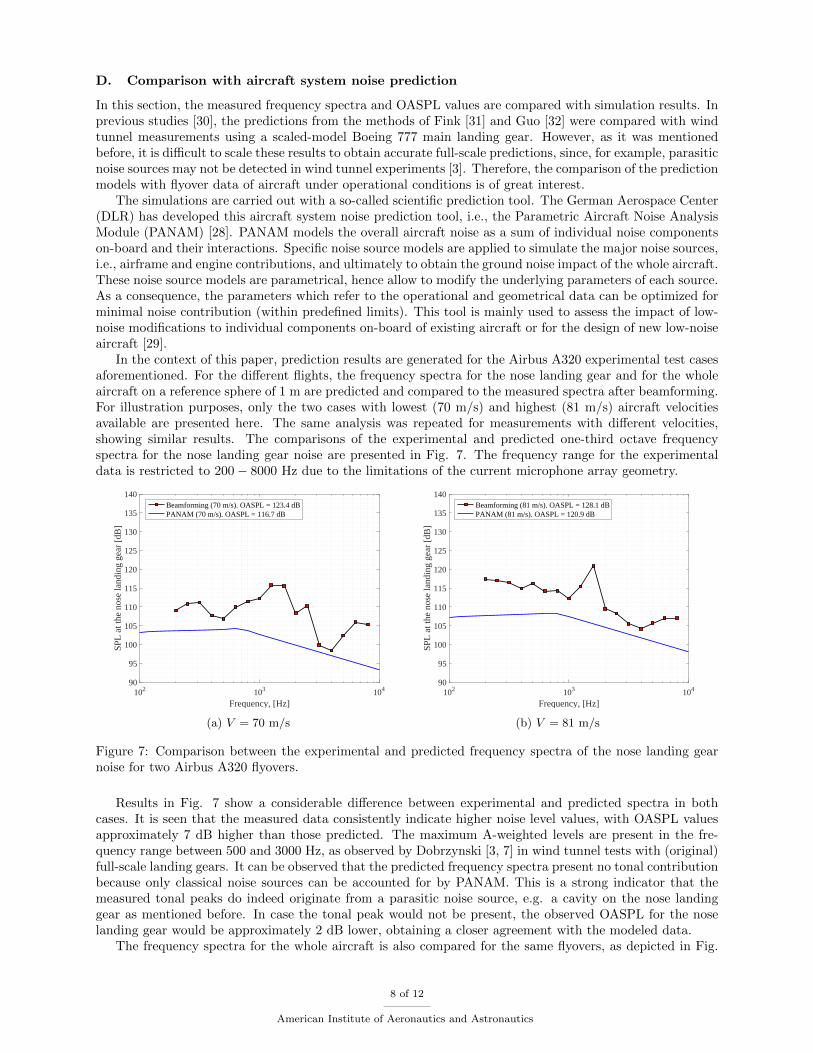
In the context of this paper, prediction results are generated for the Airbus A320 experimental test casesaforementioned. For the different flights, the frequency spectra for the nose landing gear and for the wholeaircraft on a reference sphere of 1 m are predicted and compared to the measured spectra after beamforming.For illustration purposes, only the two cases with lowest (70 m/s) and highest (81 m/s) aircraft velocitiesavailable are presented here. The same analysis was repeated for measurements with different velocities,showing similar results. The comparisons of the experimental and predicted one-third octave frequencyspectra for the nose landing gear noise are presented in Fig. 7. The frequency range for the experimentaldata is restricted to 200− 8000 Hz due to the limitations of the current microphone array geometry.
102 103 104
Frequency, [Hz]
90
95
100
105
110
115
120
125
130
135
140
SPL
at t
he n
ose
land
ing
gear
[dB
]
Beamforming (70 m/s). OASPL = 123.4 dBPANAM (70 m/s). OASPL = 116.7 dB
(a) V = 70 m/s
102 103 104
Frequency, [Hz]
90
95
100
105
110
115
120
125
130
135
140
SPL
at t
he n
ose
land
ing
gear
[dB
]
Beamforming (81 m/s). OASPL = 128.1 dBPANAM (81 m/s). OASPL = 120.9 dB
(b) V = 81 m/s
Figure 7: Comparison between the experimental and predicted frequency spectra of the nose landing gearnoise for two Airbus A320 flyovers.
Results in Fig. 7 show a considerable difference between experimental and predicted spectra in bothcases. It is seen that the measured data consistently indicate higher noise level values, with OASPL valuesapproximately 7 dB higher than those predicted. The maximum A-weighted levels are present in the fre-quency range between 500 and 3000 Hz, as observed by Dobrzynski [3, 7] in wind tunnel tests with (original)full-scale landing gears. It can be observed that the predicted frequency spectra present no tonal contributionbecause only classical noise sources can be accounted for by PANAM. This is a strong indicator that themeasured tonal peaks do indeed originate from a parasitic noise source, e.g. a cavity on the nose landinggear as mentioned before. In case the tonal peak would not be present, the observed OASPL for the noselanding gear would be approximately 2 dB lower, obtaining a closer agreement with the modeled data.
The frequency spectra for the whole aircraft is also compared for the same flyovers, as depicted in Fig.
8 of 12
American Institute of Aeronautics and Astronautics
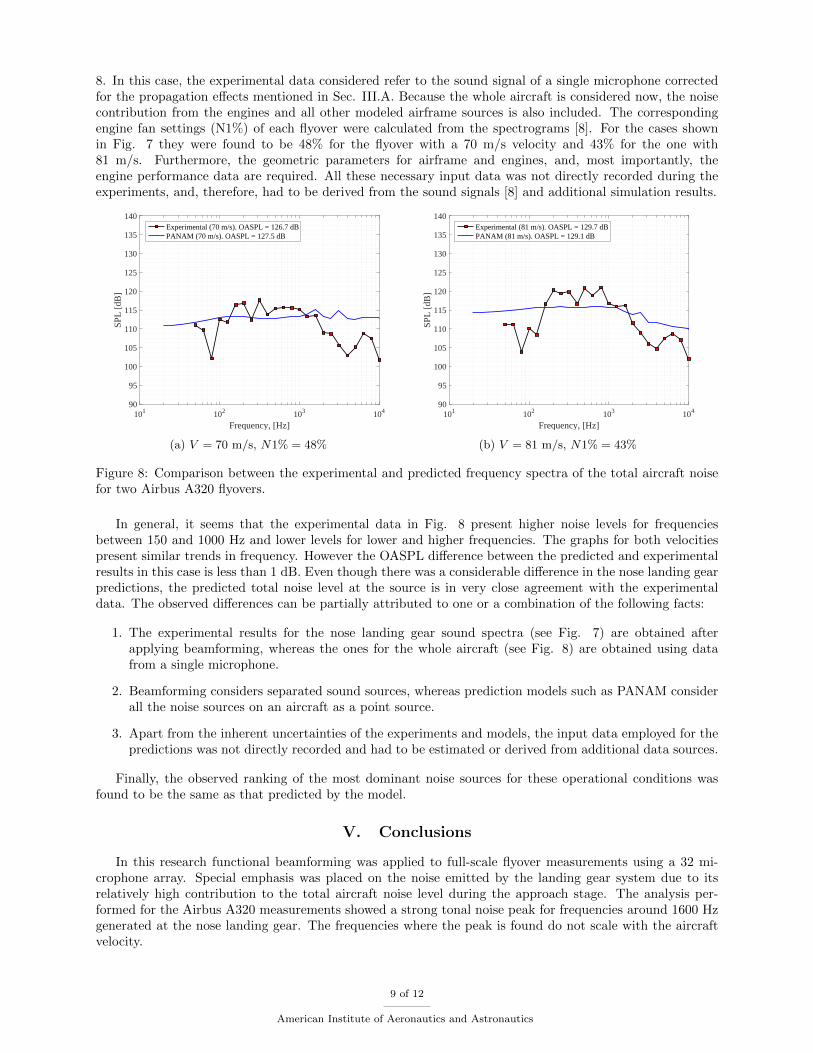
8. In this case, the experimental data considered refer to the sound signal of a single microphone correctedfor the propagation effects mentioned in Sec. III.A. Because the whole aircraft is considered now, the noisecontribution from the engines and all other modeled airframe sources is also included. The correspondingengine fan settings (N1%) of each flyover were calculated from the spectrograms [8]. For the cases shownin Fig. 7 they were found to be 48% for the flyover with a 70 m/s velocity and 43% for the one with81 m/s. Furthermore, the geometric parameters for airframe and engines, and, most importantly, theengine performance data are required. All these necessary input data was not directly recorded during theexperiments, and, therefore, had to be derived from the sound signals [8] and additional simulation results.
101 102 103 104
Frequency, [Hz]
90
95
100
105
110
115
120
125
130
135
140
SPL
[dB
]
Experimental (70 m/s). OASPL = 126.7 dBPANAM (70 m/s). OASPL = 127.5 dB
(a) V = 70 m/s, N1% = 48%
101 102 103 104
Frequency, [Hz]
90
95
100
105
110
115
120
125
130
135
140
SPL
[dB
]
Experimental (81 m/s). OASPL = 129.7 dBPANAM (81 m/s). OASPL = 129.1 dB
(b) V = 81 m/s, N1% = 43%
Figure 8: Comparison between the experimental and predicted frequency spectra of the total aircraft noisefor two Airbus A320 flyovers.
In general, it seems that the experimental data in Fig. 8 present higher noise levels for frequenciesbetween 150 and 1000 Hz and lower levels for lower and higher frequencies. The graphs for both velocitiespresent similar trends in frequency. However the OASPL difference between the predicted and experimentalresults in this case is less than 1 dB. Even though there was a considerable difference in the nose landing gearpredictions, the predicted total noise level at the source is in very close agreement with the experimentaldata. The observed differences can be partially attributed to one or a combination of the following facts:
1. The experimental results for the nose landing gear sound spectra (see Fig. 7) are obtained afterapplying beamforming, whereas the ones for the whole aircraft (see Fig. 8) are obtained using datafrom a single microphone.
2. Beamforming considers separated sound sources, whereas prediction models such as PANAM considerall the noise sources on an aircraft as a point source.
3. Apart from the inherent uncertainties of the experiments and models, the input data employed for thepredictions was not directly recorded and had to be estimated or derived from additional data sources.
Finally, the observed ranking of the most dominant noise sources for these operational conditions wasfound to be the same as that predicted by the model.
V. Conclusions
In this research functional beamforming was applied to full-scale flyover measurements using a 32 mi-crophone array. Special emphasis was placed on the noise emitted by the landing gear system due to itsrelatively high contribution to the total aircraft noise level during the approach stage. The analysis per-formed for the Airbus A320 measurements showed a strong tonal noise peak for frequencies around 1600 Hzgenerated at the nose landing gear. The frequencies where the peak is found do not scale with the aircraftvelocity.
9 of 12
American Institute of Aeronautics and Astronautics
A detailed analysis of the noise emissions of the Airbus A320 and the Fokker 70 confirmed that the landinggear noise is a dominant source for both aircraft types during approach. Variations in the landing gear noiseof around 6 dB were observed for flyovers of the same aircraft type. Around 70% of these variations can beexplained by changes in the aircraft velocity, following the expected 6th power law.
Finally, a comparison of the measured Airbus A320 frequency spectra with the results of the aircraftsystem noise prediction tool PANAM was performed. The measurements indicate higher noise levels forthe nose landing gear, presenting OASPL values around 7 dB higher than those predicted. This differencemay be partially explained due to the fact that the tonal peak found for the Airbus A320 is not modeledin the predictions, which provides evidence that this noise source may be generated by a cavity in the noselanding gear. On the other hand, the difference between the predicted and measured noise levels for thewhole aircraft is less than 1 dB and the ranking of the dominant sources is the same for both cases.
This study will hopefully improve the insight of landing gear noise in terms of frequency and aircraftvelocity. For the tonal peak example, a careful analysis should be performed to eliminate this kind of airframenoise, e.g. by closing any unnecessary cavity with pin-hole caps or the installation of vortex generators.
The observed differences between the flyover measurements and the predictions emphasize the necessityof recorded flight data for such comparisons. Further research is recommended, including the study of otheraircraft components from different aircraft types under a wider variety of operational conditions, allowing amore detailed comparison with the current prediction models.
References
1 Boeing Commercial Airplanes. Current Market Outlook 2013-2032. USA 2013.
2 Ruijgrok, G.J.J., Elements of aviation acoustics. Second edition 2007. VSSD. Delft, The Netherlands.ISBN-10 90-6562-155-5.
3 Dobrzynski, W.. “Almost 40 Years of Airframe Noise Research: What Did We Achieve?,” Journal ofAircraft, Vol. 47, No. 2, pp 353−367. March−April 2010. DOI: 10.2514/1.44457.
4 Lighthill, M. J., “On sound generated aerodynamically, I. General theory,” Proceedings of the RoyalSociety of London. Series A, Mathematical and Physical Sciences, Vol. 221, No. 1107, pp 564−587. 1952.DOI: 10.1098/rspa.1952.0060.
5 Michel, U. and Qiao,W., “Directivity of Landing-Gear Noise Based on Flyover Measurements,” 5th
AIAA/CEAS Aeroacoustics Conference, May 10−12 1999, Bellevue, Greater Seattle, WA, USA.DOI:10.2514/6.1999-1956. AIAA Paper 1999-1956.
6 Sijtsma, P., “Phased array beamforming applied to wind tunnel and fly-over tests,” National AerospaceLaboratory (NLR), NLR-TP-2010-549. December 2010.
7 Dobrzynski, W. and Buchholz, H. “Full-scale noise testing on Airbus landing gears in the German DutchWind Tunnel,” 3rd AIAA/CEAS Aeroacoustics Conference, May 12−14 1997, Atlanta, Georgia, USA.DOI: 10.2514/6.1997-1597. AIAA Paper 1997-1597.
8 Snellen, M., Merino-Martinez, R., and Simons D.G., “Assessment of aircraft noise sources variability usingan acoustic camera,” 5th CEAS Air & Space Conference. Challenges in European Aerospace. September7−11 2015, Delft, Netherlands.
9 Merino-Martinez, R., Snellen, M., and Simons D.G., “Functional beamforming applied to imaging offlyover noise on landing aircraft,” Journal of Aircraft, June 2016. DOI: 10.2514/1.C033691.
10 Howell, G.P., Bradley, A.J., McCormick M.A., and Brown J.D., “De-Dopplerization and acoustic imagingof aircraft flyover noise measurements,” Journal of Sound and Vibration, Vol. 105, No. 1, pp 151−167.1986. DOI: 10.1016/0022-460X(86)90227-0.
11 Dougherty, R.P., “Functional Beamforming,” Proceedings of the 5th Berlin Beamforming Conference,BeBeC 2014-01, February 2014.
10 of 12
American Institute of Aeronautics and Astronautics
12 Dougherty, R.P., “Functional Beamforming for Aeroacoustic Source Distributions,” 20th AIAA/CEASAeroacoustics Conference, June 16−20 2014, Atlanta, GA, USA. DOI: 10.2514/6.2014-3066. AIAA Paper2014-3066.
13 Camier, C., Padois, T., Provencher, J., Gauthier, P.A., Berry, A., Blais, J.F., Patenaude-Dufour, M., andLapointe, R., “Fly-over source localization on civil aircraft,” 20th AIAA/CEAS Aeroacoustics Conference,May 27−29 2013, Berlin, Germany. DOI: 10.2514/6.2013-2261. AIAA Paper 2013-2261.
14 Dougherty, R.P., Ramachandran, R.C., and Raman, G., “Deconvolution of Sources in Aeroacoustic Im-ages from Phased Microphone Arrays Using Linear Programming,” 20th AIAA/CEAS AeroacousticsConference, May 27−29 2013, Berlin, Germany. DOI: 10.2514/6.2013-2210. AIAA Paper 2013-2210.
15 Sijtsma, P. and Stoker, R.W., “Determination of Absolute Contributions of Aircraft Noise Componentsusing Fly-Over Array Measurements,” 10th AIAA/CEAS Aeroacoustics Conference, May 10−12 2004,Manchester, Great Britain. DOI: 10.2514/6.2004-2958. AIAA Paper 2004-2958.
16 Sijtsma, P. and van der Wal, H.M.M., “Identification of Noise Sources on Civil Aircraft in Approach usinga Phased Array of Microphones,” National Aerospace Laboratory (NLR), NLR-TP-2004-166. April 2004.
17 Michel, U., Barsikow, B., Helbig, J., Hellmig, M., and Schuttpelz, M., “Flyover noise measurements onlanding aircraft with a microphone array,” 4th AIAA/CEAS Aeroacoustics Conference, 1998, Toulouse,France. DOI: 10.2514/6.1998-2336. AIAA Paper 1998-2336.
18 Sijtsma, P., “Experimental techniques for identification and characterisation of noise sources,” NationalAerospace Laboratory (NLR), NLR-TP-2004-165. April 2004.
19 Merino-Martinez, R., Snellen, M., and Simons D.G., “Functional beamforming applied to full scale landingaircraft,” Proceedings of the 6th Berlin Beamforming Conference, BeBeC 2016-D12, February 2016.
20 Sarradj, E., “Three-dimensional acoustic source mapping with different beamforming steering vec-tor formulations,” Advances in Acoustics and Vibration. Vol. 2012, Article ID 292695. DOI:10.1155/2012/292695.
21 Mueller, T. J. (Ed.), Aeroacoustic Measurements. First edition 2002. Springer-Verlag Berlin Heidelberg.ISBN-978-3-642-07514-8.
22 Snellen, M., Merino-Martinez, R., and Simons, D.G. Assessment of noise level variability on landingaircraft using a microphone array, Paper submitted for publication in the Journal of Aircraft (2016).
23 Lord Rayleigh, F.R.S., “XXXI. Investigations in Optics, with special reference to the Spectroscope,” Philo-sophical Magazine Series 5, Vol. 8, No. 49, pp 261−274. October 1879. DOI: 10.1080/14786447908639684.
24 Airbus S.A.S. Airbus A320 Aircraft Characteristics. Airport and Maintenance Planning. Blagnac, France.2005.
25 Simons, D.G., Snellen, M., Midden, B., Arntzen, M., and Bergmans D.H.T., “Assessment of noise levelvariations of aircraft fly-overs using acoustic arrays,” Journal of Aircraft, Vol. 52, No. 5, pp 1625−1633.September−October 2015. DOI: 10.2514/1.C033020.
26 Bergmans, D., Arntzen, M., and Lammen, W., “Noise attenuation directly under the flight path,” NationalAerospace Laboratory (NLR), NLR-TP-2011-262. November 2011.
27 Curle, N., “The influence of solid boundaries upon aerodynamic sound,” Proceedings of Royal Society ofLondon A, Vol. 231, No. 1187, pp 505−514. September 1955. DOI: 10.1098/rspa.1955.0191.
28 Bertsch, L., Dobrzynski, W., and Guerin, S., “Tool Development for Low-Noise Aircraft Design,” Journalof Aircraft, Vol. 47, No. 2, pp 694−699, March - April 2010. DOI: 10.2514/1.43188.
29 Bertsch, L., Heinze, W., and Lummer, M., “Application of an Aircraft Design-To-Noise Simulation Pro-cess,” 14th AIAA Aviation Technology, Integration, and Operations Conference, 16−20 June 2014, At-lanta, Georgia, USA. DOI: 10.2514/6.2014-2169. AIAA Paper 2014−2169.
11 of 12
American Institute of Aeronautics and Astronautics
30 Burley, C.L., Brooks, T.F., Humphreys Jr., W.M., and Rawls Jr. J.W, “ANOPP Landing Gear NoisePrediction Comparisons to Model-Scale Data,” 13th AIAA/CEAS Aeroacoustics Conference, 21−23 May2007, Rome, Italy. DOI: 10.2514/6.2007-3459. AIAA Paper 2007−3459.
31 Fink, M.R., “Noise component method for airframe noise,” 4th AIAA Aeroacoustics Conference, October3−5 1977, Atlanta, Georgia, USA. DOI: 10.2514/6.1977-1271. AIAA Paper 1977−1271.
32 Guo, Y., “A Semi-Empirical Model for Aircraft Landing Gear Noise Prediction,” 12th AIAA/CEASAeroacoustics Conference, 8−10 May 2006, Cambridge, Massachusetts, USA. DOI: 10.2514/6.2006-2627.AIAA Paper 2006−2627.
12 of 12
American Institute of Aeronautics and Astronautics


![arXiv:1407.0927v1 [cs.SE] 3 Jul 2014Landing-Gear Extended Landing-Gear Retracted Landing-Gear Box Landing Wheel Door Figure 1: Landing Gear System such as airport runways [11]. Three](https://img.pdfslide.us/doc/110x75/5e9397289f16a23cdf089611/arxiv14070927v1-csse-3-jul-2014-landing-gear-extended-landing-gear-retracted.jpg)


![Landing Gear Accessories - goldlinequalityparts.com€¦ · 12 Landing Gear Accessories Landing Gear Accessories 13 [254.0mm] 10.00" [254.0mm] 10.00" [111.3mm] 4.38" [304.8mm] 12.00"](https://img.pdfslide.us/doc/110x75/5f42201687106b11477aac9b/landing-gear-accessories-12-landing-gear-accessories-landing-gear-accessories.jpg)