Embed Size (px)
Citation preview

RESEARCH ARTICLE
Delayed neurogenesis with respect to eye growth shapes thepigeon retina for high visual acuityTania Rodrigues1, Michal Krawczyk2, Dorota Skowronska-Krawczyk1,*, Lidia Matter-Sadzinski1 andJean-Marc Matter1,‡
ABSTRACTThe macula and fovea located at the optical centre of the retina makeprimate visual perception unique among mammals. Our currentunderstanding of retina ontogenesis is primarily based on animalmodels having no macula and no fovea. However, the pigeon retinaand the human macula share a number of structural and functionalproperties that justify introducing the former as a new model systemfor retina development. Comparative transcriptome analysis of pigeonand chicken retinas at different embryonic stages reveals that thegenetic programmes underlying cell differentiation are postponed inthe pigeon until the end of the period of cell proliferation.We show thatthe late onset of neurogenesis has a profound effect on thedevelopmental patterning of the pigeon retina, which is at odds withthe current models of retina development. The uncoupling of tissuegrowth and neurogenesis is shown to result from the fact that thepigeon retinal epithelium is inhibitory to cell differentiation. The sum ofthese developmental features allows the pigeon to build a retina thatdisplays the structural and functional traits typical of primate maculaand fovea.
KEY WORDS: Avian transcriptome, Retinal ganglion cell,Photoreceptor, Notch signalling, Atonal homolog 7, Fibroblastgrowth factor 3, Neurogenin 2
INTRODUCTIONPrimate retinas are characterised by a specialised central region, themacula, while their periphery resembles that of other mammals. Themacula is subdivided into different areas, including the fovea andthe foveola. The latter is located in the centre of the fovea, is devoidof rods and contains only cones. The neuronal composition of thefovea favours neurons of the midget pathway, a circuit essential forhigh visual acuity and colour vision, consisting of one cone thatforms synapses with two bipolar cells, which in turn makeconnections with two retinal ganglion cells (RGCs). About half ofthe 1.2×10⁶ RGCs in the human retina are located in the fovea,which represents less than 1% of the total retinal surface (Kolb,1995). The macula and fovea make primate visual perceptionunique among mammals. An understanding of the genetic networkunderlying the development and maintenance of this highly
specialised region is instrumental to addressing issues abouthuman macula-related retinopathies, yet our current knowledge ofretina ontogenesis is primarily based on animal models that have nomacula and no fovea. With a RGC:rod ratio of ∼1:100, the mouseretina resembles the peripheral retina of primates. The ratio of RGCsto photoreceptors is higher in the chicken retina but the density ofRGCs in the area centralis is still much lower than at the foveal rimin the human macula (∼14×103 versus ∼60×103 RGCs/mm2 inchicken versus human).
The transcription factor (TF) atonal homolog 7 (ATOH7; alsoknown as ATH5) is required for the production of RGCs invertebrates (Brown et al., 2001; Del Bene et al., 2007; Kanekaret al., 1997; Kay et al., 2001; Liu et al., 2001; Matter-Sadzinskiet al., 2001; Wang et al., 2001) and the transcriptional networkunderlying the production of RGCs is well conserved betweenmouse, chicken and fish (Brown et al., 1998, 2001; Hufnagel et al.,2010; Kay et al., 2001; Matter-Sadzinski et al., 2001, 2005; Sinnet al., 2014; Skowronska-Krawczyk et al., 2004, 2009). However,whereas the majority of the ATOH7-expressing cells enter the RGClineage in the chick, only a few percent produce RGCs in the mouse(Prasov and Glaser, 2012; Skowronska-Krawczyk et al., 2009; Yanget al., 2003). Sustained expression of ATOH7 is required during thelast cell cycle for cells to enter the RGC lineage. In chick, efficientNGN2-mediated activation of Atoh7 transcription, Atoh7autostimulation and HES5.3-mediated lengthening of the cellcycle increase the proportion of cells that enter this lineage(Chiodini et al., 2013; Skowronska-Krawczyk et al., 2009).However, this still does not result in numbers of RGCs as high asin the macula and fovea (Fig. 1).
The retinas of flying birds have high acuity regions, with one andsometimes two foveae. The pigeon has two regions of high RGCdensity and one fovea (Fig. 1) (Galifret, 1968; Querubin et al.,2009) and the visual acuity of the pigeon and human eyes arecomparable (Hodos and Leibowitz, 1977; Williams, 1985). Thisprompted us to introduce the pigeon as a new model system foranalysing retina development. Our study uncovers that by deferringneurogenesis to the end of the period of cell proliferation, thepigeon has developed an effective way to expand the pool ofprogenitor cells that enter the RGC lineage, thereby increasing thedensity of RGCs and the number of optic nerve axons in the adulteye. We further show that, although neurogenesis proceedsaccording to different schedules in pigeon and chick, retinasgrow at a similar pace in both species. Moreover, the developmentalpatterning of the pigeon retina differs from the current models ofretina development, which are largely based on studies performedwith chick, mouse and fish embryos. Our study reveals thatmechanisms exist for the eye of vertebrates to disconnect tissuegrowth and cell differentiation, allowing the pigeon to develop aretina that displays structural and functional features of maculaand fovea.Received 18 April 2016; Accepted 1 November 2016
1Department of Molecular Biology and Department of Biochemistry, Sciences III,University of Geneva, 30 quai Ernest-Ansermet, 1211 Geneva 4, Switzerland.2Shiley Eye Institute, Department of Ophthalmology, University of California, SanDiego, La Jolla, CA 92093, USA.*Present address: Shiley Eye Institute, Department of Ophthalmology, University ofCalifornia, San Diego, La Jolla, CA 92093, USA.
‡Author for correspondence ([email protected])
J.-M.M., 0000-0002-2906-2462
4701
© 2016. Published by The Company of Biologists Ltd | Development (2016) 143, 4701-4712 doi:10.1242/dev.138719
DEVELO
PM
ENT

RESULTSEye growth and retina development in pigeon and chickAnalysis of pigeon (Columba livia) and chick (Gallus gallus) atequivalent embryonic developmental stages (Fig. S1A) revealed nostriking difference in eye development. Measuring the surface of theretina (Fig. 2A), the number of retinal cells (Fig. 2B) and the numberof cell divisions per day (Fig. 2C) indicated that pigeon and chickretinas grow and expanded at a similar pace. The cell division rateswere remarkably close in both species from embryonic day (E) 4 to8. The average rate of cell division during this period (Fig. 2C) isconsistent with cell cycles that last 11-15 h (Chiodini et al., 2013).By E8, the majority of cells had been produced in pigeon and chick,and the number of cells increased modestly in both species betweenE8 and E10 (Fig. 2B).Despite the fact that the retinas grew at a similar pace in the two
species, we noted significant differences in the histology of theretinas at equivalent embryonic ages (Fig. 2D). Whereas at E9 theouter nuclear layer (ONL) bearing the cone and rod photoreceptors,the inner nuclear layer (INL) bearing the bipolar, amacrine andhorizontal cells, and the ganglion cell layer (GCL) bearing RGCsand displaced amacrine cells, were already well developed in thecentral and peripheral chick retina, these layers were indiscernible inthe E9 pigeon retina (Fig. 2D). Retinal lamination became visible inthe pigeon central retina at ∼E10 and the retinas of both specieslooked similar at ∼E12, with some notable differences. In pigeon,the nerve fibre layer (NFL) that contains RGC axons is much thickerand the ratio of GCL cells to ONL cells is ∼4-fold higher than inchick (Fig. S1B, Fig. S2).
Comparative transcriptome analysis reveals delayed celldifferentiation in the pigeon retinaIntrigued by the 3-day delay in the development of the retinal layersin pigeon, wewondered whether it reflected a delay in neurogenesis.In the current animal models, RGCs are the first neurons to be born
and they appear shortly after the formation of the optic cup. In chick,the first Atoh7-expressing cells and the first RGCs with growingaxons are detected at E2 and E2.5, respectively (Goldberg andCoulombre, 1972; Matter-Sadzinski et al., 2005; McCabe et al.,1999; Prada et al., 1991), whereas in pigeon they were detected atE5 and E5.5, respectively (Fig. 3A). Axon counting in thedeveloping optic nerve is a direct and unequivocal method tomonitor the dynamics of RGC differentiation. Whereas axonnumber peaks in chick at E10 (Rager, 1980), only∼20% of the finalnumber of axons were counted at this stage in pigeon (Fig. 3B). Theexpression profile of Atoh7 was analysed by northern blot and real-time quantitative PCR (RT-qPCR). In pigeon, Atoh7 mRNA wasfirst detected at E6 and transcript accumulation peaked between E8and E10, 3 days later than in the chick (Fig. 3C,D). Consistent withthe fact that NGN2 activates transcription of the Atoh7 gene(Hufnagel et al., 2010; Matter-Sadzinski et al., 2005; Skowronska-Krawczyk et al., 2009), Ngn2 expression was also delayed in pigeon(Fig. 3E). The observation that Ngn2 and Atoh7 expression peakedat the end of the period of cell proliferation in pigeon, whereas itculminated when cells were still rapidly dividing in chick (Fig. 2C),suggests that proneural gene expression is not coordinated with therate of cell division.
Since the timing of RGC differentiation differs between pigeonand chick, we examined the extent to which the development of thewhole retina varies between the two species. We compared thediversity and dynamics of the pigeon and chick RNA-Seqtranscriptomes at three critical stages: (1) E3-E3.5 (referred to asE3), encompassing the onset of neuronal differentiation in chick; (2)E5-E5.5 (referred to as E5), encompassing the onset of neuronaldifferentiation in pigeon and the peak of Atoh7 expression in chick;(3) and E8-E8.5 (referred to as E8), which encompasses theupregulation of Atoh7 in pigeon. RNA samples were isolated intriplicate at each stage and the 18 samples were processed fortranscriptome analysis by RNA-Seq. In order to organise the large
x 103 RGC/mm2Human x 103 RGC/mm2Mouse
Pigeonx 103 RGC/mm2
Chickx 103 RGC/mm2
macula
Fig. 1. Topographic maps showing RGC densities inflat-mount retinas. The variations in RGC densitiesthroughout the central and peripheral areas of adultpigeon, chicken, mouse and human retinas are colourcoded. In pigeon, the central perifoveal area and thedorso-peripheral area (red field) are two regions of highRGC density. In chicken, there is an area centralis(Bruhn and Cepko, 1996). The RGC density is ∼8-foldhigher in the pigeon fovea than in the chicken areacentralis (Chen and Naito, 1999; Querubin et al., 2009).In human, the RGC density in the tiny perifoveal regionis comparable to that of the pigeon, whereas the verylow RGC density outside this region is in a rangecomparable to that of mouse. The pigeon and chick datawere redrawn from Querubin et al. (2009) and Chen andNaito (1999), respectively. Human and mouse data arefrom Conradi and Sjostrand (1993) and Jeon et al.(1998), respectively. Scale bars: 2 mm.
4702
RESEARCH ARTICLE Development (2016) 143, 4701-4712 doi:10.1242/dev.138719
DEVELO
PM
ENT

amount of data, we ordered genes according to their expressionprofiles in chick using the three paired embryonic stagecomparisons: E3-E5, E5-E8 and E3-E8. Because our aim was toidentify genes that participate in early retina development, weselected among the transcripts and the corresponding genes thosethat displayed significant fold changes (≥1 and ≤−1 in log2) inchick between E3 and E5. This set represents ∼36% of thecompendium of chicken genes that we selected and is referred to as1/N/N. About 75% of these genes showed different expressionprofiles in pigeon and chick (Table S1). A heat map generated withclustered genes upregulated or downregulated between E3 and E5 inchick revealed that ∼64% of the corresponding genes in pigeon didnot show significant variation in expression during this early period;instead, their expression changed between E5 and E8 (Fig. S3A).To determine whether this delay reflected the late onset of RGC
differentiation in pigeon, we focused our analysis on genesregulated by ATOH7 (Fig. S3B). About 95% of such genes wereupregulated between E3 and E5 in chick. By contrast, pigeonorthologues were activated or displayed stronger activation betweenE5 and E8. The delayed onset of expression of ATOH7-regulatedgenes in pigeon and, in particular, of the ATOH7 target genesinvolved in axonal outgrowth and neuronal activity (Fig. S3C; e.g.
Stmn2, Chrnb3, Ptn) (Chiodini et al., 2013; Skowronska-Krawczyket al., 2009), indicates that neuronal differentiation is delayed inpigeon. Deferred expression of TFs that exert control overphotoreceptor, amacrine, horizontal and bipolar cell specification(Fig. S3C) is reflected in the delayed development of the ONL andINL (Fig. 2D). Taken together, our data suggest that celldifferentiation into most types of retinal neurons is postponed inpigeon.
The genetic programme underlying retina growth unfolds atthe same pace in pigeon and chickAbout 25% of the selected 1/N/N set of genes displayed the sameexpression profiles in the three paired embryonic stage comparisonsof the two species. These included the core cell cycle regulatorscyclin A1 and cyclin D2, the TFs Sox2, Klf5 and c-Myc and thetumour suppressor p63 (Tp63) (Fig. 4E, Table S1), providingfurther evidence that cell cycle progression and the dynamics ofprogenitor cell expansion proceeded at the same pace in pigeon andchick up to E8. Moreover, 12 genes encoding TFs andtranscriptional regulators displayed identical expression profiles inboth species, suggesting that they regulate aspects of retinamorphogenesis that develop independently of neurogenesis and
0
10
20
30
40
50
60
70
E4 E5 E6 E7 E8 E9 E10 E11 E12 E13 E14 E15 E16 E17
ezis tluda fo %
Pigeon ChickA
B C
D
0
100
200
300
E4 E6 E8 E10
rebmun lle
Cno
rmal
ized
to E
4
Pigeon Chick
0
0.5
1
1.5
2
2.5
E4-E6 E6-E8 E8-E10
cell
divi
sion
per
24h
Pigeon Chick
cellnumberx 106 per
retina
Pigeon 0.059 0.558 8.18 16.5
Chick 0.198 1.72 23.5 29.6
Pigeon E9 Chick E9
ONL
INL
IPLGCLNFLNFL
Fig. 2. Growth rates and development of the pigeonand chick retinas. (A-C) Comparative measurements ofretina surface area (A), cell number per retina (B) andnumber of cell divisions per 24 h (C). In B and C, cellcounting is from independent experiments (n≥4)performed in parallel on the pigeon and chick retinas. Ateach developmental stage, data are from three biologicalreplicates and presented as mean±s.d. In B, s.d. ≤13%.(D) Semi-thin tissue sections from the central retina. Inchick, retinal lamination is already well developed. Inpigeon, the nuclear and plexiform layers are not yetvisible, except for the NFL. ONL, outer nuclear layer; INL,inner nuclear layer; IPL, inner plexiform layer; GCL,ganglion cell layer; NFL, nerve fibre layer. Scale bars:50 µm.
4703
RESEARCH ARTICLE Development (2016) 143, 4701-4712 doi:10.1242/dev.138719
DEVELO
PM
ENT

cell differentiation (Fig. 4E). Comparative morphological analysis(Fig. 4A-D) indicated that the curvature of the retinal epithelium, theclosure of the optic fissure and the formation of the optic discdeveloped at a similar pace in both species.Cell adhesion, matrix and matrix-associated proteins help
establish the static aspects of epithelial architecture and arethought to participate in epithelial cell dynamics, driving themorphogenetic events that shape the retina. Genes encoding celladhesion and matrix proteins and displaying the same expressionprofiles in pigeon and chick (Fig. 4F) could be driving thoseepithelial morphogenesis processes that are independent of celldifferentiation. By contrast, other genes encoding matrix or celladhesion components displayed early variations in expression inchick, but not in pigeon, suggesting that they might play a role incell differentiation (Fig. 4G). In sum, our transcriptome comparisonrevealed that parts of the genetic programme underlying retinadevelopment progress independently of cell differentiation.
Delaying neuronal differentiation as an adaptation forincreasing RGC numbersWe asked whether the delayed neuronal differentiation had an effecton the total number of RGCs produced in pigeon. At the peak ofAtoh7 expression,∼5% and ∼50% of the total number of progenitor
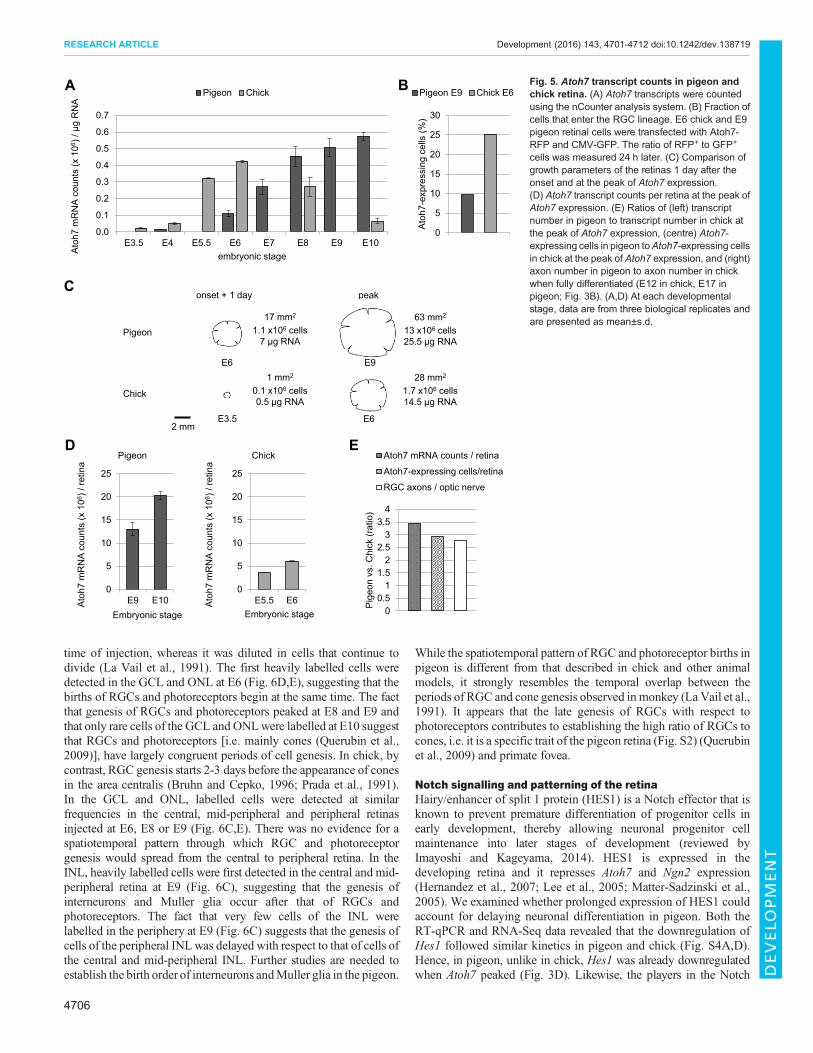
cells had been generated in chick and pigeon retinas, respectively(Fig. 2B), while the RT-qPCR analysis indicated that theaccumulation of Atoh7 transcripts was similar in both species(Fig. 3D). To improve the accuracy of this estimate, wemeasured thenumber of Atoh7 transcripts per microgram of total RNA using acounter analysis system from NanoString Technologies. The countsof Atoh7 transcripts were remarkably similar in E5.5 to E6 chick andin E8 to E10 pigeon retinas (Fig. 5A), suggesting that theaccumulation of Atoh7 transcripts depends neither on the numberof cell divisions nor on the size of the retina. Taking into account thedifferences in RNA content at the peak of Atoh7 expression(Fig. 5C), the number of Atoh7 transcripts per retina was ∼3-foldhigher in pigeon (Fig. 5D,E).
To compare the proportions of cells that entered the RGC lineageat the peak of Atoh7 expression, E6 chick and E9 pigeon retinal cellswere transfected with the Atoh7-RFP and CMV-GFP reporters andfluorescent cells were counted 24 h later (Fig. 5B). Atoh7-RFPidentifies cells expressing Atoh7 at high level and that enter theRGC lineage (Chiodini et al., 2013). We calculated the fractions ofAtoh7-expressing cells, and we estimated that in pigeon three timesas many cells entered the RGC lineage during this 24-h period(∼1.26×10⁶ versus ∼0.43×10⁶ cells/retina in pigeon versus chick;Fig. 5C,E). This difference matches the 2- to 3-fold higher cell
0
0.5
1
1.5
2
E3.
5
E4.5
E5.
5 E7
E8.5
E10
E11
E12
E13
trans
crip
tlev
el
Chick Atoh7
0
0.5
1
1.5
2
E4 E5 E6 E7 E8 E9 E10
E11
E12
E13
trans
crip
tlev
el
Pigeon Atoh7
0
0.5
1
1.5
2
E3.5
E4.5
E5.
5 E7
E8.5
E10
E11
E12
E13
trans
crip
tlev
el
Chick Ngn2
0
0.5
1
1.5
2
E4 E5 E6 E7 E8 E9 E10
E11
E12
E13
trans
crip
tlev
el
Pigeon Ngn2
4.5 5.5 7 8E: 3.5
28S
18S ChickAtoh7 mRNA
5 6 7 8 9E: 4
28S
18SPigeonAtoh7 mRNA
012345678
E10 E17
axon
num
ber (
x 10
6 )
Pigeon ChickA B
E
C
Pigeon E5.5 Atoh7 Atoh7
D
Fig. 3. Delayed onset of RGC differentiation in thepigeon. (A) E5 pigeon retinas co-electroporated withAtoh7-GFP and Atoh7-RFP. Atoh7-RFP specificallyidentifies newborn RGCs (Chiodini et al., 2013). Thefirst double-labelled RGCs and axons were detectedin the central and peripheral retina 12 h afterelectroporation. (B) Axon numbers in pigeon andchick optic nerves. For pigeon, mean valuesobtained with two optic nerves at each stage areshown. The chick data are from Rager (1980).(C) Accumulation of Atoh7 mRNA detected bynorthern blot. (D,E) Accumulation of Atoh7 andNgn2transcripts measured by RT-qPCR analysis. At eachdevelopmental stage, data are from three biologicalreplicates and presented as mean±s.d.
4704
RESEARCH ARTICLE Development (2016) 143, 4701-4712 doi:10.1242/dev.138719
DEVELO
PM
ENT

density in the pigeon GCL at E12 (Fig. S2) and the 3-fold differencein the number of optic nerve axons between the two species at E17(Fig. 3B, Fig. 5E). Likewise, in the days following the peak of Atoh7expression, the density of RGCs reached ∼70×103 cells/mm2 andthese neurons were uniformly distributed throughout the retina,except for modest increases in density in the central area (Fig. S2).After cessation of mitotic activity, the retinal surface area increasedby a factor of two (∼110 mm2 at E12 versus ∼250 mm2 1 year posthatching). We suppose that the different RGC densities (7-10×104
cells/mm2 in the perifoveal and red field areas versus 1-3×10⁴ cellsat the periphery; Fig. 1) are established during this period ofexpansion.
In pigeon, RGCs and photoreceptors have congruent periodsof genesis and there is no central-to-peripheral gradient intheir emergenceBoth species displayed the same high rate of cell division from E4 toE8, followed by a rapid decrease in cell divisions between E8 andE10 (Fig. 2C). However, analysis of the distribution of cells pulsedwith BrdU for 1 h at E9 revealed a remarkable difference in thespatial distribution of dividing cells between the pigeon and chickretinas. According to the classical model, which is mostly based on
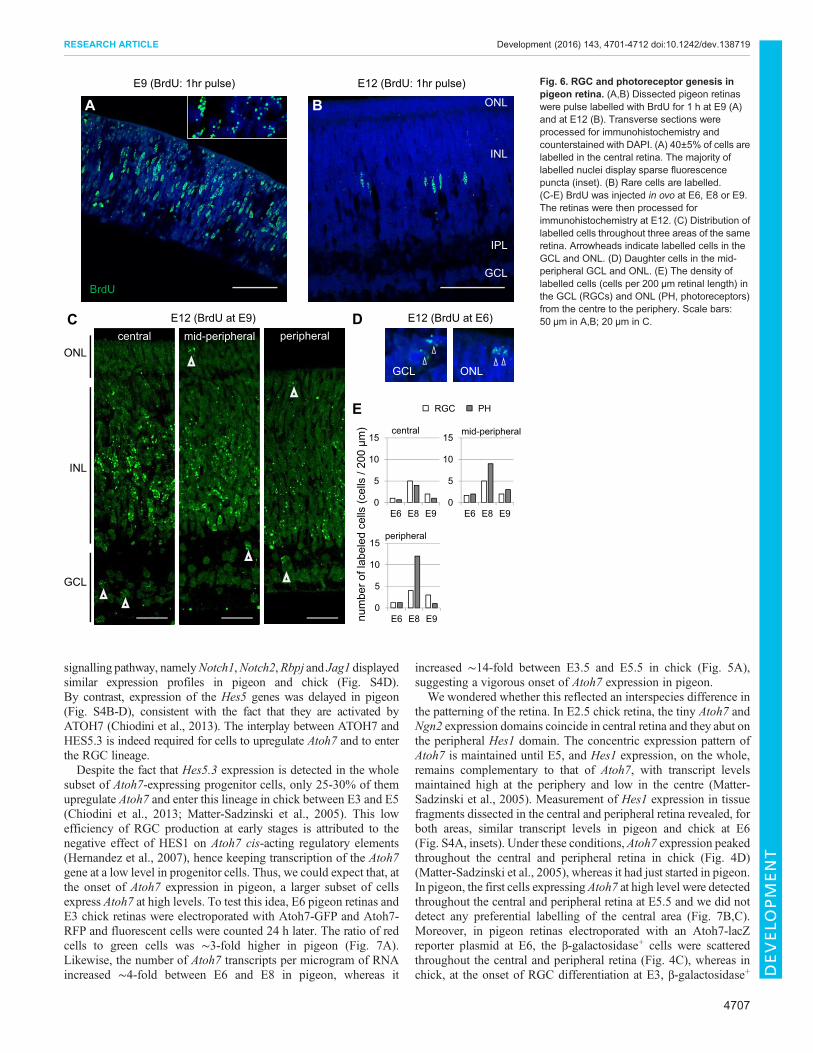
chicken and mouse studies, the retina develops in a centro-peripheral sequence; that is, cessation of cell division occurs firstin the central area and then extends to the periphery (Hufnagel andBrown, 2013; Prada et al., 1991). It appears that this model does notapply to the pigeon retina, where dividing cells are evenlydistributed throughout the central and peripheral areas up to E9.The fact that the total number of cells doubled in the pigeon retinabetween E8 and E10 (∼8.2×10⁶ at E8 versus ∼16.5×10⁶ at E10;Fig. 2B) and that 40±5% of cells were in S phase in the central andperipheral retina at E9 (Fig. 6A; data not shown) suggest that thevast majority of cells did progress through cell cycles that lastedmore than 24 h at this stage of development. In line with this idea,the majority of BrdU-labelled nuclei displayed sparse fluorescencepuncta (Fig. 6A, inset), suggesting that they had a decreased numberof replication foci and that cells progressed through a long S phase(Duronio, 2012). At E12, <1% of pigeon cells were in S phase(Fig. 6B) and 35±3×10⁶ cells per retina were counted.
To determine whether the pigeon retina displays a class-specificsequence of birth dates and a central-to-peripheral gradient ingenesis, BrdUwas injected in ovo at E6, E8, E9 or E10 and the retinaswere processed for immunohistochemistry analysis at E12. The labelwas detected in the nuclei of cells that were about to be born at the
F
E
G
ChickPigeon
E3-E5 E5-E8 E3-E8 E3-E5 E5-E8 E3-E8
ALX1HHEXPAX2GATA3ISL1TFAP2CZIC1ZNF536FOXN4TP63KLF5SOX2
MYCCCNA1CCND2
SOX5
-13.97 13.970Fold change in log2
ChickPigeon
E3-E5 E5-E8 E3-E8 E3-E5 E5-E8 E3-E8
IMPG2
DCN
IGDCC3
RELN
DSP
RHBDL3
MXRA5
MATN4
TINAGL1
-7.41 7.410Fold change in log2
ChickPigeon
E3-E5 E5-E8 E3-E8 E3-E5 E5-E8 E3-E8
CDHR2
CDH8
NCAM1
OPCLM
LAMA2
COL5A1
COL27A1
EMILIN3
PERP
ITGA1
ITGA11
-4.76 4.760Fold change in log2
Atoh7Atoh7
of
lens
of
ofof
lens
lens
lens
ChickPigeon
E6E3
.5
A B
C D
Fig. 4. The genetic programme underlyingretina growth progresses independently ofcell differentiation. (A-D) Comparison of theshape of the retina and of the closure of theoptic fissure (of ) at E3.5 (A,B) and E6 (C,D).(C,D) E6 retinas were electroporated withAtoh7-lacZ and stained for β-galactosidase24 h later. In pigeon, rare blue cells arescattered throughout mid-peripheral areas.Boxed regions are magnified in the insets. Theeye lens and retinal pigmented epitheliumfragments are apparent by retina transparency.Scale bars: 500 µm. (E-G) Heat mapsgenerated from RNA-Seq data with genesencoding TFs and cell cycle regulators (E),cell adhesion, matrix and matrix-associatedproteins (F,G) that display the same (E,F) ordifferent (G) expression profiles in pigeon andchick.
4705
RESEARCH ARTICLE Development (2016) 143, 4701-4712 doi:10.1242/dev.138719
DEVELO
PM
ENT
time of injection, whereas it was diluted in cells that continue todivide (La Vail et al., 1991). The first heavily labelled cells weredetected in the GCL and ONL at E6 (Fig. 6D,E), suggesting that thebirths of RGCs and photoreceptors begin at the same time. The factthat genesis of RGCs and photoreceptors peaked at E8 and E9 andthat only rare cells of the GCL and ONLwere labelled at E10 suggestthat RGCs and photoreceptors [i.e. mainly cones (Querubin et al.,2009)], have largely congruent periods of cell genesis. In chick, bycontrast, RGC genesis starts 2-3 days before the appearance of conesin the area centralis (Bruhn and Cepko, 1996; Prada et al., 1991).In the GCL and ONL, labelled cells were detected at similarfrequencies in the central, mid-peripheral and peripheral retinasinjected at E6, E8 or E9 (Fig. 6C,E). There was no evidence for aspatiotemporal pattern through which RGC and photoreceptorgenesis would spread from the central to peripheral retina. In theINL, heavily labelled cells were first detected in the central and mid-peripheral retina at E9 (Fig. 6C), suggesting that the genesis ofinterneurons and Muller glia occur after that of RGCs andphotoreceptors. The fact that very few cells of the INL werelabelled in the periphery at E9 (Fig. 6C) suggests that the genesis ofcells of the peripheral INLwas delayed with respect to that of cells ofthe central and mid-peripheral INL. Further studies are needed toestablish the birth order of interneurons andMuller glia in the pigeon.
While the spatiotemporal pattern of RGC and photoreceptor births inpigeon is different from that described in chick and other animalmodels, it strongly resembles the temporal overlap between theperiods of RGC and cone genesis observed in monkey (La Vail et al.,1991). It appears that the late genesis of RGCs with respect tophotoreceptors contributes to establishing the high ratio of RGCs tocones, i.e. it is a specific trait of the pigeon retina (Fig. S2) (Querubinet al., 2009) and primate fovea.
Notch signalling and patterning of the retinaHairy/enhancer of split 1 protein (HES1) is a Notch effector that isknown to prevent premature differentiation of progenitor cells inearly development, thereby allowing neuronal progenitor cellmaintenance into later stages of development (reviewed byImayoshi and Kageyama, 2014). HES1 is expressed in thedeveloping retina and it represses Atoh7 and Ngn2 expression(Hernandez et al., 2007; Lee et al., 2005; Matter-Sadzinski et al.,2005). We examined whether prolonged expression of HES1 couldaccount for delaying neuronal differentiation in pigeon. Both theRT-qPCR and RNA-Seq data revealed that the downregulation ofHes1 followed similar kinetics in pigeon and chick (Fig. S4A,D).Hence, in pigeon, unlike in chick, Hes1 was already downregulatedwhen Atoh7 peaked (Fig. 3D). Likewise, the players in the Notch
0
5
10
15
20
25
30
Ato
h7-e
xpre
ssin
g ce
lls (%
)
Pigeon E9 Chick E6
00.5
11.5
22.5
33.5
4
Pig
eon
vs. C
hick
(rat
io)
Atoh7 mRNA counts / retina
Atoh7-expressing cells/retina
RGC axons / optic nerve
0
5
10
15
20
25
E9 E10
01 x( stnuoc A
NR
m 7hotA
6aniter / )
Embryonic stage
Pigeon
0
5
10
15
20
25
E5.5 E6Ato
h7 m
RN
A c
ount
s (x
106
) / re
tina
Embryonic stage
Chick
A
D E
0.0
0.1
0.2
0.3
0.4
0.5
0.6
0.7
E3.5 E4 E5.5 E6 E7 E8 E9 E10
01 x( stnuoc A
NR
m 7hotA
6A
NR gµ / )
embryonic stage
Pigeon Chick B
Conset + 1 day peak
Chick
Pigeon
28 mm2
1.7 x10⁶ cells14.5 µg RNA
63 mm2
13 x106 cells25.5 µg RNA
E3.5
E61 mm2
0.1 x10⁶ cells0.5 µg RNA
E6
E9
17 mm2
1.1 x10⁶ cells7 µg RNA
2 mm
Fig. 5. Atoh7 transcript counts in pigeon andchick retina. (A) Atoh7 transcripts were countedusing the nCounter analysis system. (B) Fraction ofcells that enter the RGC lineage. E6 chick and E9pigeon retinal cells were transfected with Atoh7-RFP and CMV-GFP. The ratio of RFP+ to GFP+
cells was measured 24 h later. (C) Comparison ofgrowth parameters of the retinas 1 day after theonset and at the peak of Atoh7 expression.(D) Atoh7 transcript counts per retina at the peak ofAtoh7 expression. (E) Ratios of (left) transcriptnumber in pigeon to transcript number in chick atthe peak of Atoh7 expression, (centre) Atoh7-expressing cells in pigeon toAtoh7-expressing cellsin chick at the peak of Atoh7 expression, and (right)axon number in pigeon to axon number in chickwhen fully differentiated (E12 in chick, E17 inpigeon; Fig. 3B). (A,D) At each developmentalstage, data are from three biological replicates andare presented as mean±s.d.
4706
RESEARCH ARTICLE Development (2016) 143, 4701-4712 doi:10.1242/dev.138719
DEVELO
PM
ENT
signalling pathway, namelyNotch1,Notch2,Rbpj and Jag1 displayedsimilar expression profiles in pigeon and chick (Fig. S4D).By contrast, expression of the Hes5 genes was delayed in pigeon(Fig. S4B-D), consistent with the fact that they are activated byATOH7 (Chiodini et al., 2013). The interplay between ATOH7 andHES5.3 is indeed required for cells to upregulate Atoh7 and to enterthe RGC lineage.Despite the fact that Hes5.3 expression is detected in the whole
subset of Atoh7-expressing progenitor cells, only 25-30% of themupregulate Atoh7 and enter this lineage in chick between E3 and E5(Chiodini et al., 2013; Matter-Sadzinski et al., 2005). This lowefficiency of RGC production at early stages is attributed to thenegative effect of HES1 on Atoh7 cis-acting regulatory elements(Hernandez et al., 2007), hence keeping transcription of the Atoh7gene at a low level in progenitor cells. Thus, we could expect that, atthe onset of Atoh7 expression in pigeon, a larger subset of cellsexpress Atoh7 at high levels. To test this idea, E6 pigeon retinas andE3 chick retinas were electroporated with Atoh7-GFP and Atoh7-RFP and fluorescent cells were counted 24 h later. The ratio of redcells to green cells was ∼3-fold higher in pigeon (Fig. 7A).Likewise, the number of Atoh7 transcripts per microgram of RNAincreased ∼4-fold between E6 and E8 in pigeon, whereas it
increased ∼14-fold between E3.5 and E5.5 in chick (Fig. 5A),suggesting a vigorous onset of Atoh7 expression in pigeon.
We wondered whether this reflected an interspecies difference inthe patterning of the retina. In E2.5 chick retina, the tiny Atoh7 andNgn2 expression domains coincide in central retina and they abut onthe peripheral Hes1 domain. The concentric expression pattern ofAtoh7 is maintained until E5, and Hes1 expression, on the whole,remains complementary to that of Atoh7, with transcript levelsmaintained high at the periphery and low in the centre (Matter-Sadzinski et al., 2005). Measurement of Hes1 expression in tissuefragments dissected in the central and peripheral retina revealed, forboth areas, similar transcript levels in pigeon and chick at E6(Fig. S4A, insets). Under these conditions, Atoh7 expression peakedthroughout the central and peripheral retina in chick (Fig. 4D)(Matter-Sadzinski et al., 2005), whereas it had just started in pigeon.In pigeon, the first cells expressing Atoh7 at high level were detectedthroughout the central and peripheral retina at E5.5 and we did notdetect any preferential labelling of the central area (Fig. 7B,C).Moreover, in pigeon retinas electroporated with an Atoh7-lacZreporter plasmid at E6, the β-galactosidase+ cells were scatteredthroughout the central and peripheral retina (Fig. 4C), whereas inchick, at the onset of RGC differentiation at E3, β-galactosidase+
0
5
10
15
E6 E8 E9
peripheral
E12 (BrdU: 1hr pulse)
B
GCL
ONL
IPL
INL
E9 (BrdU: 1hr pulse)
A
BrdU
C D
num
ber o
f lab
eled
cel
ls (c
ells
/ 20
0 µm
)
E
E12 (BrdU at E6)
GCL ONL
PH RGC
E12 (BrdU at E9)
GCL
INL
ONLperipheralcentral mid-peripheral
0
5
10
15
E6 E8 E9
mid-peripheral
0
5
10
15
E6 E8 E9
central
Fig. 6. RGC and photoreceptor genesis inpigeon retina. (A,B) Dissected pigeon retinaswere pulse labelled with BrdU for 1 h at E9 (A)and at E12 (B). Transverse sections wereprocessed for immunohistochemistry andcounterstained with DAPI. (A) 40±5% of cells arelabelled in the central retina. The majority oflabelled nuclei display sparse fluorescencepuncta (inset). (B) Rare cells are labelled.(C-E) BrdU was injected in ovo at E6, E8 or E9.The retinas were then processed forimmunohistochemistry at E12. (C) Distribution oflabelled cells throughout three areas of the sameretina. Arrowheads indicate labelled cells in theGCL and ONL. (D) Daughter cells in the mid-peripheral GCL and ONL. (E) The density oflabelled cells (cells per 200 µm retinal length) inthe GCL (RGCs) and ONL (PH, photoreceptors)from the centre to the periphery. Scale bars:50 µm in A,B; 20 µm in C.
4707
RESEARCH ARTICLE Development (2016) 143, 4701-4712 doi:10.1242/dev.138719
DEVELO
PM
ENT
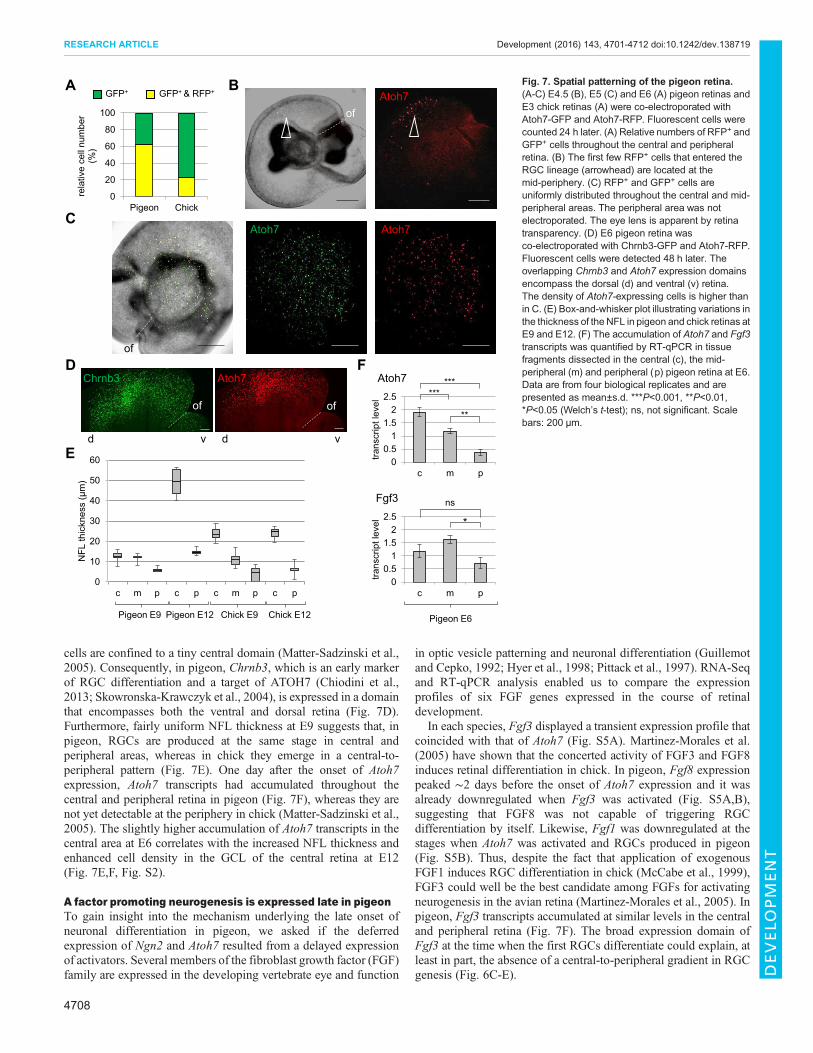
cells are confined to a tiny central domain (Matter-Sadzinski et al.,2005). Consequently, in pigeon, Chrnb3, which is an early markerof RGC differentiation and a target of ATOH7 (Chiodini et al.,2013; Skowronska-Krawczyk et al., 2004), is expressed in a domainthat encompasses both the ventral and dorsal retina (Fig. 7D).Furthermore, fairly uniform NFL thickness at E9 suggests that, inpigeon, RGCs are produced at the same stage in central andperipheral areas, whereas in chick they emerge in a central-to-peripheral pattern (Fig. 7E). One day after the onset of Atoh7expression, Atoh7 transcripts had accumulated throughout thecentral and peripheral retina in pigeon (Fig. 7F), whereas they arenot yet detectable at the periphery in chick (Matter-Sadzinski et al.,2005). The slightly higher accumulation of Atoh7 transcripts in thecentral area at E6 correlates with the increased NFL thickness andenhanced cell density in the GCL of the central retina at E12(Fig. 7E,F, Fig. S2).
A factor promoting neurogenesis is expressed late in pigeonTo gain insight into the mechanism underlying the late onset ofneuronal differentiation in pigeon, we asked if the deferredexpression of Ngn2 and Atoh7 resulted from a delayed expressionof activators. Several members of the fibroblast growth factor (FGF)family are expressed in the developing vertebrate eye and function
in optic vesicle patterning and neuronal differentiation (Guillemotand Cepko, 1992; Hyer et al., 1998; Pittack et al., 1997). RNA-Seqand RT-qPCR analysis enabled us to compare the expressionprofiles of six FGF genes expressed in the course of retinaldevelopment.
In each species, Fgf3 displayed a transient expression profile thatcoincided with that of Atoh7 (Fig. S5A). Martinez-Morales et al.(2005) have shown that the concerted activity of FGF3 and FGF8induces retinal differentiation in chick. In pigeon, Fgf8 expressionpeaked ∼2 days before the onset of Atoh7 expression and it wasalready downregulated when Fgf3 was activated (Fig. S5A,B),suggesting that FGF8 was not capable of triggering RGCdifferentiation by itself. Likewise, Fgf1 was downregulated at thestages when Atoh7 was activated and RGCs produced in pigeon(Fig. S5B). Thus, despite the fact that application of exogenousFGF1 induces RGC differentiation in chick (McCabe et al., 1999),FGF3 could well be the best candidate among FGFs for activatingneurogenesis in the avian retina (Martinez-Morales et al., 2005). Inpigeon, Fgf3 transcripts accumulated at similar levels in the centraland peripheral retina (Fig. 7F). The broad expression domain ofFgf3 at the time when the first RGCs differentiate could explain, atleast in part, the absence of a central-to-peripheral gradient in RGCgenesis (Fig. 6C-E).
A B
0
20
40
60
80
100
Pigeon Chick
rebmun llec evitaler
(%)
GFP+ GFP+ & RFP+ Atoh7of
of
Atoh7 Atoh7C
0
10
20
30
40
50
60
c m p c p c m p c p
)mµ( ssenkciht LF
N
Pigeon E9 Chick E9Pigeon E12 Chick E12
D
00.5
11.5
22.5
c m p
trans
crip
t lev
el
Fgf3
*
Pigeon E6
ns
F
E0
0.51
1.52
2.5
c m p
trans
crip
t lev
elAtoh7
**
******
of of
d v
Chrnb3 Atoh7
d v
Fig. 7. Spatial patterning of the pigeon retina.(A-C) E4.5 (B), E5 (C) and E6 (A) pigeon retinas andE3 chick retinas (A) were co-electroporated withAtoh7-GFP and Atoh7-RFP. Fluorescent cells werecounted 24 h later. (A) Relative numbers of RFP+ andGFP+ cells throughout the central and peripheralretina. (B) The first few RFP+ cells that entered theRGC lineage (arrowhead) are located at themid-periphery. (C) RFP+ and GFP+ cells areuniformly distributed throughout the central and mid-peripheral areas. The peripheral area was notelectroporated. The eye lens is apparent by retinatransparency. (D) E6 pigeon retina wasco-electroporated with Chrnb3-GFP and Atoh7-RFP.Fluorescent cells were detected 48 h later. Theoverlapping Chrnb3 and Atoh7 expression domainsencompass the dorsal (d) and ventral (v) retina.The density of Atoh7-expressing cells is higher thanin C. (E) Box-and-whisker plot illustrating variations inthe thickness of the NFL in pigeon and chick retinas atE9 and E12. (F) The accumulation of Atoh7 and Fgf3transcripts was quantified by RT-qPCR in tissuefragments dissected in the central (c), the mid-peripheral (m) and peripheral (p) pigeon retina at E6.Data are from four biological replicates and arepresented as mean±s.d. ***P<0.001, **P<0.01,*P<0.05 (Welch’s t-test); ns, not significant. Scalebars: 200 µm.
4708
RESEARCH ARTICLE Development (2016) 143, 4701-4712 doi:10.1242/dev.138719
DEVELO
PM
ENT

The pigeon retinal epithelium is inhibitory to RGCdifferentiationIn pigeon, RGCs are produced, much like in the primate perifovealarea, at the end of the period of cell proliferation, whereas in thechick retina and in the primate peripheral retina, RGCs are produceddays and weeks, respectively, ahead of the cessation of cell division(La Vail et al., 1991; Provis et al., 1985). In this context, weexamined whether the pigeon retinal epithelium develops specialfeatures during the period that precedes the onset of neurogenesis.To address this issue, we selected 49 genes that were activated inpigeon (≥1/N/N) but not in chick (<1/N/N), between E3 and E5.This group includes 13 genes that were upregulated between E3 andE5 and downregulated between E5 and E8 (set 1; Fig. 8A,Table S2). We wondered whether their downregulation was relatedto the onset of neurogenesis. A ChIP-Chip analysis revealed thatATOH7 protein was bound to sequences upstream of fibulin 7(Fbln7) in E3.5 chick retina (Fig. 8B, top). Electroporation of Atoh7siRNAs in chick E3.5 retinas led to the upregulation of Fbln7(Fig. 8B, bottom), suggesting that, in pigeon, ATOH7 could repressFbln7 between E5 and E8.FBLN7 is a cell adhesion protein that interacts with extracellular
matrix molecules (de Vega et al., 2007). Several other genesencoding matrix, cell adhesion or cytoskeleton components belong
to set 1 and we asked if cell-cell interactions in the pigeon retinalepithelium could inhibit cell differentiation. E3.5 pigeon and chickretinas were enzymatically disaggregated, and acutely dissociatedcells were co-transfected with Atoh7-RFP and Atoh7-GFP andplated at low density on plastic slides. Similar proportions of pigeonand chick double-labelled cells were detected 24 h after transfection(Fig. 8C), whereas there were no RFP+ cells in E5 pigeon retinas(Fig. 8D). To verify that cell dissociation abolished the inhibitoryeffect of the pigeon retinal epithelium on RGC differentiation, E3.5pigeon and chick dissociated retina cells were plated on plasticdishes and RNAwas isolated 24 h later. RT-qPCR analysis revealedthat Atoh7, Ngn2 and Fgf3 transcripts accumulated at the samelevels in the pigeon and chick cells (Fig. 8E).
Among the 49 genes that we selected, 23 were activated in pigeonbetween E3 and E8 (set 2; Fig. 8A, Table S2). None of these genes isinvolved in retina growth; rather, they might set the ground for thedevelopment of retinas of increased complexity resulting from highRGC density, i.e. that bear structural and functional similarities tothe primate macula. The fact that genes associated with humanretinopathies, such as Leber congenital amaurosis (Rd3, Crb1) orretinitis pigmentosa (Cerkl), belong to this set strengthens the ideathat development of the primate macula and pigeon retina sharespecificities.
00.20.40.60.8
11.2
Atoh7 Fgf3 Ngn2
level A
NR evitaler
Pigeon Chick
C
A B
D
CERKL
CRB1
RD3
ChickPigeon
E3-E5 E5-E8 E3-E8 E3-E5 E5-E8 E3-E8
-11.26 11.260Fold change in log2
set 1
set 2
FBLN7
-0.4-0.3-0.2-0.1
00.10.20.3
Fbln
7re
lativ
e R
NA
leve
l
nt siRNA Atoh7 siRNA
Atoh7-GFP
Atoh7-RFP
Pigeon cell
E
Atoh7-GFP
Atoh7-RFP
GFP+ & RFP+GFP+
012345678
Pigeon Chick
Ato
h7-
gnisserpxece
lls(%
)
Fbln7
ATOH7
Chr3
Fig. 8. The pigeon retinal epithelium isinhibitory to RGC differentiation. (A) Heatmaps generated from RNA-Seq data showingclustered pigeon genes that display positive foldchanges (≥1 in log2) between E3 and E5 and forwhich changes in expression of chickenorthologues are not significant during this period.(B) (Top) The chromatin region upstream ofFbln7 is bound by ATOH7 in E3.5 chick retina. A∼2 kb sequence upstream of Fbln7 was tiled at100 bp intervals and the probe coordinates wereprocessed through the UCSC genome browser.(Bottom) E3.5 retinas were electroporated withAtoh7 siRNAs or non-targeting (nt) siRNAs.Retina fragments were dissected 36 h later andRNA was isolated. The microarray analysis wasrun in quadruple for each species of siRNAs.ChIP-Chip and microarray data are fromexperiments reported by Chiodini et al. (2013).(C) E3.5 pigeon and chick retina dissociatedcells were transfected with Atoh7-RFP andAtoh7-GFP. (Left) The ratios of RFP+ and GFP+
cells to total cell number were calculated 24 hafter plating. (Right) A double-labelled pigeoncell. (D) The central and mid-peripheral pigeonretina was co-electroporated with Atoh7-GFPand Atoh7-RFP at E4. No RFP+ cells weredetected 24 h later. (E) E3.5 pigeon and chickretinas were dissociated into single cells thatwere plated on plastic dishes; RNA was isolated24 h later and the levels of Atoh7,Ngn2 and Fgf3transcripts measured by RT-qPCR. (C,E) Dataare from two biological replicates and arepresented as the mean. Scale bars: 200 µm.
4709
RESEARCH ARTICLE Development (2016) 143, 4701-4712 doi:10.1242/dev.138719
DEVELO
PM
ENT

DISCUSSIONIn chick and mouse embryos, the onset of retinal neurogenesis starts1 day after the formation of the optic cup. Neurogenesis is initiatedin a tiny domain and proceeds in a wave from the central to theperipheral retina that correlates with the central-to-peripheralappearance of postmitotic cells (reviewed by Agathocleous andHarris, 2009). Here we show that neurogenesis in pigeon starts 4days after the formation of the optic cup and that cells entering theRGC lineage are scattered throughout the central and peripheralretina. Contrary to what has been observed in animal species studiedso far, the onset of neuronal differentiation in pigeon is not restrictedto the central domain and the genesis of RGCs and photoreceptorsdoes not propagate to the periphery in a wave-like manner. HES1controls aspects of the patterning of progenitors in chick and mouseretinas and is required for the closure of the optic cup and stalk (Leeet al., 2005; Matter-Sadzinski et al., 2005; Tomita et al., 1996), alandmark in eye morphogenesis that develops at a similar pace inpigeon and chick. The fact that Hes1 has already beendownregulated throughout the retina at the onset of RGCdifferentiation could explain, at least in part, the absence of aneurogenic wave in pigeon. Hes1 and other participants of theNotch signalling pathway display similar expression kinetics inpigeon and chick, suggesting that late neurogenesis in pigeon retinadoes not result from the prolonged inhibition of Ngn2 and Atoh7 byHES1, but rather from a time lag in the expression of activators and,in particular, of FGF3 (Martinez-Morales et al., 2005).The fact that the pigeon eye is already well developed when
ATOH7 induces RGC differentiation indicates that the onset of celldifferentiation does not keep pace with overall retinal growth. Thatretinal growth and cell differentiation may proceed according toseparate schedules has not been observed previously because of theearly onset of neurogenesis in the retinas of the animal modelsstudied so far. This finding challenges the idea that an increase in thenumber of cells or in the length of the cell cycle during the course ofretinal development may act as a biological clock that coordinatesthe timing of cell differentiation with tissue growth (reviewed byCepko, 2014). We note that, although the lengthening of the cellcycle is essential for the production of RGCs in chick, themechanism underlying this process is initiated by ATOH7 andtherefore depends on neurogenesis (Chiodini et al., 2013). Bypostponing neurogenesis to the end of the period of cellproliferation, while maintaining the peak of Atoh7 expression atthe same level as in chick, the pigeon has developed an effectiveway of expanding the pool of progenitors out of which cells areselected to enter the RGC lineage.The development of the pigeon retina might represent the rule,
rather than the exception, among birds. Phylogenomic studiesindicate that one node at the base of the avian tree splitsthe neognaths between the Galloanserae (e.g. chicken) and theNeonaves, which regroup 95% of avian species and include theorders Columbiformes (e.g. pigeon) and Passeriformes (Hackettet al., 2008; Prum et al., 2015). Although more than half of all birdspecies are classified in these two orders, only a handful of passerineretinas have been studied so far. It appears that these birds have afovea and two rod-free areas with high densities of RGCs, much likein pigeon (Coimbra et al., 2009, 2015).Heterochrony between neurogenesis and growth has a profound
effect on the patterning of the retina and on the ratios of cell types. Inpigeon, it results in a high ratio of RGCs to cones (Querubin et al.,2009) and high visual acuity (Coletta et al., 2003; Hodos andLeibowitz, 1977). Delaying neurogenesis in the developing CNSmight serve different purposes. For instance, the onset of
neurogenesis in the telencephalon is delayed in primatescompared with rodents, allowing for greater expansion of thefounder neural cell pool before neurogenesis begins (reviewed byFlorio and Huttner, 2014). In the same manner, most of the post-hatching brain growth in parrots and songbirds is due to a lateexpansion of the telencephalon, which is associated with a generaldelay of neurogenesis (Charvet and Striedter, 2011).
Cell proliferation, the expansion and folding of the retinalepithelium, the closure of the optic fissures and the formation of theoptic disc all proceed at similar paces in pigeon and chick, in sharpcontrast with the respective timings of neuronal differentiation.Twelve TFs and transcriptional regulators that we examined displaythe same expression profiles in pigeon and chick, suggesting thattheir role in retinal growth and morphogenesis is independent of celldifferentiation. The fact that Pax2 and Hes1 belong to this setstrengthens the idea that the closure of the optic fissure and opticdisc formation are regulated independently of cell differentiation. Inhumans, the loss of ALX1 or mutations in SOX2 lead to craniofacialdysplasia characterised, among other defects, by microphthalmia(Fantes et al., 2003; Taranova et al., 2006; Uz et al., 2010), while inbirds the Alx1 haplotype contributes to diversification of beakshapes among Darwin’s finches (Lamichhaney et al., 2015). Similarexpression dynamics of Alx1 and Sox2 in pigeon and chickhighlights how the growth of the retina is coordinated with theincrease in eye size and face development irrespective of the time ofonset of neurogenesis.
Our study raises two intriguing questions. First, the nature of thesignal that lies upstream of the earliest known activators ofneurogenesis and how this signal is acting independently of theretinal growth stage. We show that in pigeon the retinal epitheliumexerts an inhibitory effect on cell differentiation until the end of theperiod of cell proliferation and we identified genes encoding matrix,cell adhesion or cytoskeleton components that may participate inthis inhibition. Future studies should clarify how these componentsaffect signalling and how they influence the onset of neurogenesis.In optic cups developing in vitro from mouse or human embryonicstem cells, RGCs have been identified after 9 and 24 days,respectively, in culture (Eiraku et al., 2011; Nakano et al., 2012).The late onset of cell differentiation in the human optic cup isconsistent with the fact that in the primate embryonic retina, RGCsdifferentiate in the incipient perifoveal area at the end of the periodof cell proliferation (Hendrickson, 2016; La Vail et al., 1991; Proviset al., 1985). It remains to be seen whether, in the central area of theprimate retina, the epithelium exerts, as in pigeon, an inhibitoryeffect on neuronal differentiation.
That genes associated with human retinopathies are activatedbefore the onset of cell differentiation in pigeon is intriguing. Verylittle is known about the function of the proteins that these genesencode, nor do we know whether they are expressed early in foetalhuman retina. The fact that variants of ATOH7 could be associatedwith glaucoma (reviewed by Sakurada and Mabuchi, 2015)highlights how early variations in retina development mayeventually lead to retinal diseases later in life. In this context, thepigeon retina could prove to be a useful new model system withwhich to uncover some of the intricate mechanisms underlyinggrowth and neurogenesis in the macula of primates.
MATERIALS AND METHODSAnimalsFertilised chicken eggs were from a White Leghorn strain (UNIGE AnimalResources Centre). Fertilised pigeon eggs were supplied by PhilippeDelaunay (Pigeonneau de la Suisse Normande, Croisilles, France).
4710
RESEARCH ARTICLE Development (2016) 143, 4701-4712 doi:10.1242/dev.138719
DEVELO
PM
ENT

Experimental procedures were carried out in accordance with Federal SwissVeterinary Regulations.
Molecular cloningAtoh7 (Atoh7-RFP, Atoh7-GFP, Atoh7-lacZ), Chrnb3 (Chrnb3-GFP) andCMV-GFP reporter plasmids are described in the supplementary Materialsand Methods.
RNA-SeqRNA samples were isolated in triplicate from pigeon and chick retinas at E3-E3.5, E5-E5.5 and E8-E8.5 and the 18 samples were processed fortranscriptome analysis by RNA-Seq. mRNA library preparation andsequencing were performed under contract with Fasteris (Plan-les-Ouates,Switzerland). Stranded-mRNA libraries were prepared from 1 μg total RNAusing the TruSeq Stranded mRNA Library Preparation Kit (Illumina)following the manufacturer’s instructions. Libraries were sequenced on anIllumina HiSeq 2500 using the TruSeq Rapid SBS Kit (Illumina) and HiSeqRapid Run (RR) mode, with 150 bp single-end reads. The runs generated14-24 million reads per sample, of which 69±8% were mappable toreference genomes. Mapping raw reads to reference chick and pigeongenomes was performed using TopHat 2/Bowtie 2 (Kim et al., 2013).Chicken genome reference (WASHUC2 assembly) was obtained fromEnsembl.org. Pigeon genome and transcript annotation reference files(assemblies from 2014-02-18) were obtained from the (GIGA)n database(gigadb.org). Scoring transcript abundances and identification ofdifferentially expressed transcripts was performed using Cufflinks andCuffdiff scripts from the Cufflinks package (Trapnell et al., 2012). Fordifferential expression, each comparison included data from three biologicalreplicates of either developmental stage.
Northern blot and RT-qPCRRNA isolated from pigeon and chicken whole and dissected retinas wassubject to northern blot analysis with Hes5.3 and Atoh7 riboprobes. RT-qPCR was performed using the primers listed in Table S3. For details, seethe supplementary Materials and Methods.
NanoString nCounterTo estimate Atoh7 transcript number, total RNAwas subject to NanoStringanalysis using the probes listed in Table S3. Details are provided in thesupplementary Materials and Methods.
Retina morphometric measurementsRetinas from E4 to E17 embryos were dissected, unfixed flat-mounts werephotographed and surfaces were measured with ImageJ (NIH). For cellcounting, retinas were dissociated as described by Matter-Sadzinski et al.(2005). Cells were counted in a Neubauer chamber. For histology, theretinas and optic nerves were fixed overnight in Trump’s 4F:1G fixative(McDowell and Trump, 1976) and embedded in an epoxy resin. Semi-thinsections (1 µm) were stained with Toluidine Blue. Ultra-thin sections(100 nm) at a distance of 0.5-1.0 mm from the optic disc were processed forelectron microscopy on an FEI Tecnai G2 Sphera. We used a grid scanningstrategy, moving the picture field from the centre of a mesh to the centre ofthe next to take representative pictures of the whole axon section. Twentypictures were taken for E10 optic nerve and 46 for E17. Axons were countedin randomly selected 10.76 µm×10.76 µm fields (n≥30). The number ofaxons was related linearly to the optic nerve surface (∼0.28 mm2 at E10,∼0.59 mm2 at E17). Confocal microscopy of retina and single cells isdescribed in the supplementary Materials and Methods.
Retina electroporation and lipofection assayThe electroporation of pigeon and chick retinas with reporters or siRNA, andthe transfection of single cells dissociated from chick and pigeon retinas,were performed as detailed in the supplementary Materials and Methods.
BrdU and lacZ stainingCell proliferation was assessed by in ovo injection or pulse labelling withBrdU as described in the supplementary Materials and Methods. Atoh7-
lacZ reporter activity was assessed as described in the supplementaryMaterials and Methods.
AcknowledgementsWeare grateful to P. Delaunay for theweekly supply of pigeon eggs and for access toembryonic (E14, E15, E16, E17) and adult retinas; and M. Ballivet, T. Halazonetis,B. Galliot and D. Picard for inspiring discussions and critical reading of themanuscript. Confocal and electron microscopy were performed at the BioimagingPlatform of the Faculty of Sciences, University of Geneva. RT-qPCR andNanoStringnCounter experiments were performed at the iGE3 Genomics Platform of theUniversity of Geneva.
Competing interestsThe authors declare no competing or financial interests.
Author contributionsT.R., L.M.-S. and J.-M.M. carried out experiments. T.R., M.K. and J.-M.M. processedand analysed the data. D.S.-K. provided the ChIP data and participated in dataanalysis. T.R. and J.-M.M. conceived the study. J.-M.M. and L.M.-S. wrote themanuscript.
FundingThe Swiss National Science Foundation (Schweizerischer Nationalfonds zurForderung der Wissenschaftlichen Forschung) [grant 31003A-149458], the GelbertFoundation, the Velux Foundation (Velux Stiftung), the Fonds Suisse pour laprevention et la lutte contre la cecite, and the state of Geneva support our laboratory.
Data availabilityUnpublished histological data concerning the pigeon retina and optic nerve areavailable at http://www.genes-vision.ch/pigeon. RNA-Seq data have been depositedat Gene Expression Omnibus under accession number GSE89541.
Supplementary informationSupplementary information available online athttp://dev.biologists.org/lookup/doi/10.1242/dev.138719.supplemental
ReferencesAgathocleous, M. and Harris, W. A. (2009). From progenitors to differentiated cells
in the vertebrate retina. Annu. Rev. Cell Dev. Biol. 25, 45-69.Brown, N. L., Kanekar, S., Vetter, M. L., Tucker, P. K., Gemza, D. L. and Glaser,
T. (1998). Math5 encodes a murine basic helix-loop-helix transcription factorexpressed during early stages of retinal neurogenesis. Development 125,4821-4833.
Brown, N. L., Patel, S., Brzezinski, J. and Glaser, T. (2001). Math5 is required forretinal ganglion cell and optic nerve formation. Development 128, 2497-2508.
Bruhn, S. L. andCepko, C. L. (1996). Development of the pattern of photoreceptorsin the chick retina. J. Neurosci. 16, 1430-1439.
Cepko, C. (2014). Intrinsically different retinal progenitor cells produce specific typesof progeny. Nat. Rev. Neurosci. 15, 615-627.
Charvet, C. J. and Striedter, G. F. (2011). Developmental modes anddevelopmental mechanisms can channel brain evolution. Front. Neuroanat. 5, 4.
Chen, Y. and Naito, J. (1999). A quantitative analysis of cells in the ganglion celllayer of the chick retina. Brain Behav. Evol. 53, 75-86.
Chiodini, F., Matter-Sadzinski, L., Rodrigues, T., Skowronska-Krawczyk, D.,Brodier, L., Schaad, O., Bauer, C., Ballivet, M. and Matter, J.-M. (2013). Apositive feedback loop between ATOH7 and a Notch effector regulates cell-cycleprogression and neurogenesis in the retina. Cell Rep. 3, 796-807.
Coimbra, J. P., Trevia, N., Videira Marceliano, M. L., da Silveira Andrade-Da-Costa, B. L., Picanço-Diniz, C. W. and Yamada, E. S. (2009). Number anddistribution of neurons in the retinal ganglion cell layer in relation to foragingbehaviors of tyrant flycatchers. J. Comp. Neurol. 514, 66-73.
Coimbra, J. P., Collin, S. P. and Hart, N. S. (2015). Variations in retinalphotoreceptor topography and the organization of the rod-free zone reflectbehavioral diversity in Australian passerines. J. Comp. Neurol. 523, 1073-1094.
Coletta, N. J., Marcos, S., Wildsoet, C. and Troilo, D. (2003). Double-passmeasurement of retinal image quality in the chicken eye. Optom. Vis. Sci. 80,50-57.
Conradi, N. and Sjostrand, J. (1993). A morphometric and stereologic analysis ofganglion cells of the central human retina. Graefes Arch. Clin. Exp. Ophthalmol.231, 169-174.
de Vega, S., Iwamoto, T., Nakamura, T., Hozumi, K., McKnight, D. A., Fisher,L.W., Fukumoto, S. and Yamada, Y. (2007). TM14 is a newmember of the fibulinfamily (fibulin-7) that interacts with extracellular matrix molecules and is active forcell binding. J. Biol. Chem. 282, 30878-30888.
4711
RESEARCH ARTICLE Development (2016) 143, 4701-4712 doi:10.1242/dev.138719
DEVELO
PM
ENT

Del Bene, F., Ettwiller, L., Skowronska-Krawczyk, D., Baier, H., Matter, J.-M.,Birney, E. and Wittbrodt, J. (2007). In vivo validation of a computationallypredicted conserved Ath5 target gene set. PLoS Genet. 3, e159.
Duronio, R. J. (2012). Developing S-phase control. Genes Dev. 26, 746-750.Eiraku, M., Takata, N., Ishibashi, H., Kawada, M., Sakakura, E., Okuda, S.,Sekiguchi, K., Adachi, T. and Sasai, Y. (2011). Self-organizing optic-cupmorphogenesis in three-dimensional culture. Nature 472, 51-56.
Fantes, J., Ragge, N. K., Lynch, S.-A., McGill, N. I., Collin, J. R., Howard-Peebles, P. N., Hayward, C., Vivian, A. J., Williamson, K., van Heyningen, V.et al. (2003). Mutations in SOX2 cause anophthalmia. Nat. Genet. 33, 461-463.
Florio, M. and Huttner, W. B. (2014). Neural progenitors, neurogenesis and theevolution of the neocortex. Development 141, 2182-2194.
Galifret, Y. (1968). [The various functional areas of the retina of pigeons].Z. Zellforsch. Mikrosk. Anat. 86, 535-545.
Goldberg, S. and Coulombre, A. J. (1972). Topographical development of theganglion cell fiber layer in the chick retina. Awhole mount study. J. Comp. Neurol.146, 507-517.
Guillemot, F. and Cepko, C. L. (1992). Retinal fate and ganglion cell differentiationare potentiated by acidic FGF in an in vitro assay of early retinal development.Development 114, 743-754.
Hackett, S. J., Kimball, R. T., Reddy, S., Bowie, R. C. K., Braun, E. L., Braun,M. J., Chojnowski, J. L., Cox, W. A., Han, K.-L., Harshman, J. et al. (2008). Aphylogenomic study of birds reveals their evolutionary history. Science 320,1763-1768.
Hendrickson, A. (2016). Development of retinal layers in prenatal human retina.Am. J. Ophthalmol. 161, 29-35.e1.
Hernandez, J., Matter-Sadzinski, L., Skowronska-Krawczyk, D., Chiodini, F.,Alliod, C., Ballivet, M. and Matter, J.-M. (2007). Highly conserved sequencesmediate the dynamic interplay of basic helix-loop-helix proteins regulatingretinogenesis. J. Biol. Chem. 282, 37894-37905.
Hodos, W. and Leibowitz, R. W. (1977). Near-field visual acuity of pigeons: effectsof scotopic adaptation and wavelength. Vision Res. 17, 463-467.
Hufnagel, R. B. and Brown, N. L. (2013). Specification of retinal cell types. InPatterning and Cell Type Specification in the Developing CNS and PNS (ed. J.Rubenstein and P. Rakic), pp. 519-537. San Diego: Academic Press.
Hufnagel, R. B., Le, T. T., Riesenberg, A. L. and Brown, N. L. (2010). Neurog2controls the leading edge of neurogenesis in the mammalian retina. Dev. Biol.340, 490-503.
Hyer, J., Mima, T. and Mikawa, T. (1998). FGF1 patterns the optic vesicle bydirecting the placement of the neural retina domain. Development 125, 869-877.
Imayoshi, I. and Kageyama, R. (2014). Oscillatory control of bHLH factors in neuralprogenitors. Trends Neurosci. 37, 531-538.
Jeon, C. J., Strettoi, E. and Masland, R. H. (1998). The major cell populations ofthe mouse retina. J. Neurosci. 18, 8936-8946.
Kanekar, S., Perron, M., Dorsky, R., Harris, W. A., Jan, L. Y., Jan, Y. N. andVetter, M. L. (1997). Xath5 participates in a network of bHLH genes in thedeveloping Xenopus retina. Neuron 19, 981-994.
Kay, J. N., Finger-Baier, K. C., Roeser, T., Staub, W. and Baier, H. (2001). Retinalganglion cell genesis requires lakritz, a zebrafish atonal homolog. Neuron 30,725-736.
Kim, D., Pertea, G., Trapnell, C., Pimentel, H., Kelley, R. and Salzberg, S. L.(2013). TopHat2: accurate alignment of transcriptomes in the presence ofinsertions, deletions and gene fusions. Genome Biol. 14, R36.
Kolb, H. (1995). Midget pathways of the primate retina underlie resolution and redgreen color opponency. In Webvision: The Organization of the Retina and VisualSystem (ed. H. Kolb, E. Fernandez and R. Nelson). http://webvision.med.utah.edu.
La Vail, M. M., Rapaport, D. H. and Rakic, P. (1991). Cytogenesis in the monkeyretina. J. Comp. Neurol. 309, 86-114.
Lamichhaney, S., Berglund, J., Almen, M. S., Maqbool, K., Grabherr, M.,Martinez-Barrio, A., Promerova, M., Rubin, C.-J., Wang, C., Zamani, N. et al.(2015). Evolution of Darwin’s finches and their beaks revealed by genomesequencing. Nature 518, 371-375.
Lee, H. Y., Wroblewski, E., Philips, G. T., Stair, C. N., Conley, K., Reedy, M.,Mastick, G. S. and Brown, N. L. (2005). Multiple requirements for Hes1 duringearly eye formation. Dev. Biol. 284, 464-478.
Liu, W., Mo, Z. and Xiang, M. (2001). The Ath5 proneural genes function upstreamof Brn3 POU domain transcription factor genes to promote retinal ganglion celldevelopment. Proc. Natl. Acad. Sci. USA 98, 1649-1654.
Martinez-Morales, J.-R., Del Bene, F., Nica, G., Hammerschmidt, M., Bovolenta,P. and Wittbrodt, J. (2005). Differentiation of the vertebrate retina is coordinatedby an FGF signaling center. Dev. Cell 8, 565-574.
Matter-Sadzinski, L., Matter, J. M., Ong, M. T., Hernandez, J. and Ballivet, M.(2001). Specification of neurotransmitter receptor identity in developing retina: thechick ATH5 promoter integrates the positive and negative effects of several bHLHproteins. Development 128, 217-231.
Matter-Sadzinski, L., Puzianowska-Kuznicka, M., Hernandez, J., Ballivet, M.and Matter, J. M. (2005). A bHLH transcriptional network regulating thespecification of retinal ganglion cells. Development 132, 3907-3921.
McCabe, K. L., Gunther, E. C. and Reh, T. A. (1999). The development of thepattern of retinal ganglion cells in the chick retina: mechanisms that controldifferentiation. Development 126, 5713-5724.
McDowell, E. M. and Trump, B. F. (1976). Histologic fixatives suitable for diagnosticlight and electron microscopy. Arch. Pathol. Lab. Med. 100, 405-414.
Nakano, T., Ando, S., Takata, N., Kawada, M., Muguruma, K., Sekiguchi, K.,Saito, K., Yonemura, S., Eiraku, M. and Sasai, Y. (2012). Self-formation of opticcups and storable stratified neural retina from human ESCs. Cell Stem Cell 10,771-785.
Pittack, C., Grunwald, G. B. and Reh, T. A. (1997). Fibroblast growth factors arenecessary for neural retina but not pigmented epithelium differentiation in chickembryos. Development 124, 805-816.
Prada, C., Puga, J., Perez-Mendez, L., Lopez, R. and Ramirez, G. (1991). Spatialand temporal patterns of neurogenesis in the chick retina. Eur. J. Neurosci. 3,1187.
Prasov, L. and Glaser, T. (2012). Pushing the envelope of retinal ganglion cellgenesis: context dependent function of Math5 (Atoh7). Dev. Biol. 368, 214-230.
Provis, J. M., Van Driel, D., Billson, F. A. and Russell, P. (1985). Development ofthe human retina: patterns of cell distribution and redistribution in the ganglion celllayer. J. Comp. Neurol. 233, 429-451.
Prum, R. O., Berv, J. S., Dornburg, A., Field, D. J., Townsend, J. P., Lemmon,E. M. and Lemmon, A. R. (2015). A comprehensive phylogeny of birds (Aves)using targeted next-generation DNA sequencing. Nature 526, 569-573.
Querubin, A., Lee, H. R., Provis, J. M. andO’Brien, K. M. B. (2009). Photoreceptorand ganglion cell topographies correlate with information convergence and highacuity regions in the adult pigeon (Columba livia) retina. J. Comp. Neurol. 517,711-722.
Rager, G. H. (1980). Development of the retinotectal projection in the chicken. Adv.Anat. Embryol. Cell Biol. 63, I-VIII, 1-90.
Sakurada, Y. and Mabuchi, F. (2015). Advances in glaucoma genetics. Prog. BrainRes. 220, 107-126.
Sinn, R., Peravali, R., Heermann, S. and Wittbrodt, J. (2014). Differentialresponsiveness of distinct retinal domains to Atoh7. Mech. Dev. 133, 218-229.
Skowronska-Krawczyk, D., Ballivet, M., Dynlacht, B. D. andMatter, J.-M. (2004).Highly specific interactions between bHLH transcription factors and chromatinduring retina development. Development 131, 4447-4454.
Skowronska-Krawczyk, D., Chiodini, F., Ebeling, M., Alliod, C., Kundzewicz, A.,Castro, D., Ballivet, M., Guillemot, F., Matter-Sadzinski, L. and Matter, J.-M.(2009). Conserved regulatory sequences in Atoh7 mediate non-conservedregulatory responses in retina ontogenesis. Development 136, 3767-3777.
Taranova, O. V., Magness, S. T., Fagan, B. M.,Wu, Y., Surzenko, N., Hutton, S. R.and Pevny, L. H. (2006). SOX2 is a dose-dependent regulator of retinal neuralprogenitor competence. Genes Dev. 20, 1187-1202.
Tomita, K., Ishibashi, M., Nakahara, K., Ang, S.-L., Nakanishi, S., Guillemot, F.and Kageyama, R. (1996). Mammalian hairy and Enhancer of split homolog 1regulates differentiation of retinal neurons and is essential for eyemorphogenesis.Neuron 16, 723-734.
Trapnell, C., Roberts, A., Goff, L., Pertea, G., Kim, D., Kelley, D. R., Pimentel, H.,Salzberg, S. L., Rinn, J. L. and Pachter, L. (2012). Differential gene andtranscript expression analysis of RNA-seq experiments with TopHat and Cufflinks.Nat. Protoc. 7, 562-578.
Uz, E., Alanay, Y., Aktas, D., Vargel, I., Gucer, S., Tuncbilek, G., von Eggeling,F., Yilmaz, E., Deren, O., Posorski, N. et al. (2010). Disruption of ALX1 causesextreme microphthalmia and severe facial clefting: expanding the spectrum ofautosomal-recessive ALX-related frontonasal dysplasia. Am. J. Hum. Genet. 86,789-796.
Wang, S. W., Kim, B. S., Ding, K., Wang, H., Sun, D., Johnson, R. L., Klein, W. H.and Gan, L. (2001). Requirement for math5 in the development of retinal ganglioncells. Genes Dev. 15, 24-29.
Williams, D. R. (1985). Visibility of interference fringes near the resolution limit.J. Opt. Soc. Am. A 2, 1087.
Yang, Z., Ding, K., Pan, L., Deng, M. and Gan, L. (2003). Math5 determines thecompetence state of retinal ganglion cell progenitors. Dev. Biol. 264, 240-254.
4712
RESEARCH ARTICLE Development (2016) 143, 4701-4712 doi:10.1242/dev.138719
DEVELO
PM
ENT