Embed Size (px)
Citation preview
Delaware ReportYear 3: School Year 2012 – 2013
U.S. Department of Education Washington, DC 20202
March 19, 2014
Delaware Year 3: School Year 2012 – 2013Race to the Top 2
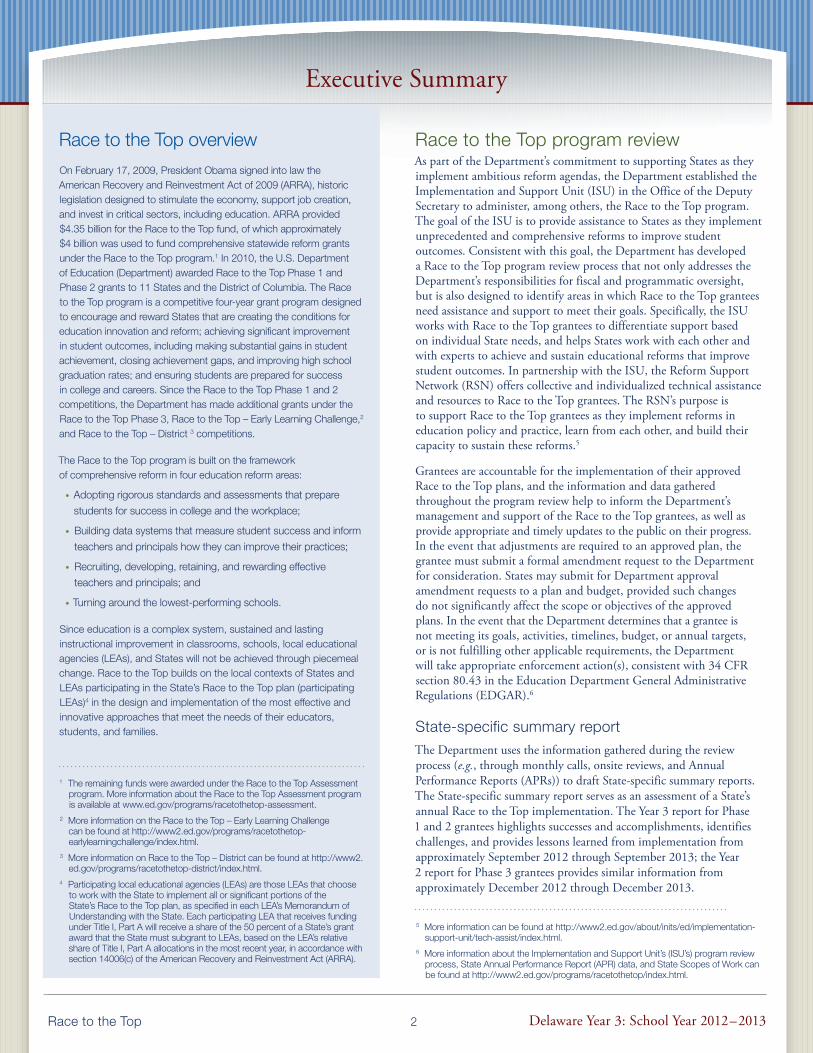
Executive Summary
Race to the Top overview
On February 17, 2009, President Obama signed into law the American Recovery and Reinvestment Act of 2009 (ARRA), historic legislation designed to stimulate the economy, support job creation, and invest in critical sectors, including education. ARRA provided $4.35 billion for the Race to the Top fund, of which approximately $4 billion was used to fund comprehensive statewide reform grants under the Race to the Top program.1 In 2010, the U.S. Department of Education (Department) awarded Race to the Top Phase 1 and Phase 2 grants to 11 States and the District of Columbia. The Race to the Top program is a competitive four-year grant program designed to encourage and reward States that are creating the conditions for education innovation and reform; achieving significant improvement in student outcomes, including making substantial gains in student achievement, closing achievement gaps, and improving high school graduation rates; and ensuring students are prepared for success in college and careers. Since the Race to the Top Phase 1 and 2 competitions, the Department has made additional grants under the Race to the Top Phase 3, Race to the Top – Early Learning Challenge,2 and Race to the Top – District 3 competitions.
The Race to the Top program is built on the framework of comprehensive reform in four education reform areas:
• Adopting rigorous standards and assessments that prepare
students for success in college and the workplace;
• Building data systems that measure student success and inform
teachers and principals how they can improve their practices;
• Recruiting, developing, retaining, and rewarding effective
teachers and principals; and
• Turning around the lowest-performing schools.
Since education is a complex system, sustained and lasting instructional improvement in classrooms, schools, local educational agencies (LEAs), and States will not be achieved through piecemeal change. Race to the Top builds on the local contexts of States and LEAs participating in the State’s Race to the Top plan (participating LEAs)4 in the design and implementation of the most effective and innovative approaches that meet the needs of their educators, students, and families.
1 The remaining funds were awarded under the Race to the Top Assessment program. More information about the Race to the Top Assessment program is available at www.ed.gov/programs/racetothetop-assessment.
2 More information on the Race to the Top – Early Learning Challenge can be found at http://www2.ed.gov/programs/racetothetop-earlylearningchallenge/index.html.
3 More information on Race to the Top – District can be found at http://www2.ed.gov/programs/racetothetop-district/index.html.
4 Participating local educational agencies (LEAs) are those LEAs that choose to work with the State to implement all or significant portions of the State’s Race to the Top plan, as specified in each LEA’s Memorandum of Understanding with the State. Each participating LEA that receives funding under Title I, Part A will receive a share of the 50 percent of a State’s grant award that the State must subgrant to LEAs, based on the LEA’s relative share of Title I, Part A allocations in the most recent year, in accordance with section 14006(c) of the American Recovery and Reinvestment Act (ARRA).
Race to the Top program reviewAs part of the Department’s commitment to supporting States as they implement ambitious reform agendas, the Department established the Implementation and Support Unit (ISU) in the Office of the Deputy Secretary to administer, among others, the Race to the Top program. The goal of the ISU is to provide assistance to States as they implement unprecedented and comprehensive reforms to improve student outcomes. Consistent with this goal, the Department has developed a Race to the Top program review process that not only addresses the Department’s responsibilities for fiscal and programmatic oversight, but is also designed to identify areas in which Race to the Top grantees need assistance and support to meet their goals. Specifically, the ISU works with Race to the Top grantees to differentiate support based on individual State needs, and helps States work with each other and with experts to achieve and sustain educational reforms that improve student outcomes. In partnership with the ISU, the Reform Support Network (RSN) offers collective and individualized technical assistance and resources to Race to the Top grantees. The RSN’s purpose is to support Race to the Top grantees as they implement reforms in education policy and practice, learn from each other, and build their capacity to sustain these reforms.5
Grantees are accountable for the implementation of their approved Race to the Top plans, and the information and data gathered throughout the program review help to inform the Department’s management and support of the Race to the Top grantees, as well as provide appropriate and timely updates to the public on their progress. In the event that adjustments are required to an approved plan, the grantee must submit a formal amendment request to the Department for consideration. States may submit for Department approval amendment requests to a plan and budget, provided such changes do not significantly affect the scope or objectives of the approved plans. In the event that the Department determines that a grantee is not meeting its goals, activities, timelines, budget, or annual targets, or is not fulfilling other applicable requirements, the Department will take appropriate enforcement action(s), consistent with 34 CFR section 80.43 in the Education Department General Administrative Regulations (EDGAR).6
State-specific summary reportThe Department uses the information gathered during the review process (e.g., through monthly calls, onsite reviews, and Annual Performance Reports (APRs)) to draft State-specific summary reports. The State-specific summary report serves as an assessment of a State’s annual Race to the Top implementation. The Year 3 report for Phase 1 and 2 grantees highlights successes and accomplishments, identifies challenges, and provides lessons learned from implementation from approximately September 2012 through September 2013; the Year 2 report for Phase 3 grantees provides similar information from approximately December 2012 through December 2013.
5 More information can be found at http://www2.ed.gov/about/inits/ed/implementation-support-unit/tech-assist/index.html.
6 More information about the Implementation and Support Unit’s (ISU’s) program review process, State Annual Performance Report (APR) data, and State Scopes of Work can be found at http://www2.ed.gov/programs/racetothetop/index.html.
Delaware Year 3: School Year 2012 – 2013Race to the Top 3
Executive Summary
State’s education reform agenda Delaware’s 2009 strategic plan, created with input from more than 150 educators, parents, community members, funders, and supporters, is the State’s blueprint for improving classroom instruction and ensuring that every student graduates from high school college- and career-ready. The State’s Race to the Top plan builds on this blueprint and leverages the State’s $119,122,128 grant to catalyze and accelerate implementation of the strategic plan.
Delaware’s broad goals under Race to the Top include setting high standards for college- and career-readiness; measuring progress with high-quality assessments and robust data systems; recruiting, retaining, developing and supporting great teachers and leaders who can help all students meet high standards; building core capabilities to promote great teaching and leadership; accelerating improvements in the State’s high-need schools; and building capacity at the State and local levels to deliver its goals. In July 2010, Delaware was one of the first two States to receive a Race to the Top grant.
State Years 1 and 2 summaryThe Delaware Department of Education (DDOE) built critical project management capacity to support LEAs and implement Race to the Top initiatives in Year 1. It created the Delivery Unit (DU), the Teacher and Leader Effectiveness Unit (TLEU), and the School Turnaround Unit (STU). In addition, it launched the LEA Support Program to help LEAs develop and implement their plans. In Year 2, DDOE focused on higher quality implementation of its plan through its performance management processes. The State established routines to help LEAs solve implementation challenges and continuously improve their work, while adapting its practices to better meet the needs of LEAs.
In Year 1, the State made key progress within each reform area, providing educators initial Common Core State Standards (CCSS) training, working to develop data system capabilities, and preparing for full implementation of support programs for teachers and principals. Delaware also launched the Partnership Zone (PZ) to turn around its lowest-achieving schools and selected four schools to implement PZ intervention plans in Year 2.
In Year 2, Delaware continued to progress within each reform area. The State continued use of Components I-IV of its evaluation system to inform decisions regarding educators in tested and non-tested grades and subjects, while implementing a revised Component V focused on student growth in tested grades and subjects. Additionally, to prepare for the roll-out of the CCSS in Year 3, DDOE developed curricular and training materials for educators, opened new pipelines for qualified teachers and principals seeking to teach in Delaware, and improved educator access to student data through the Education Insight Portal. In addition, the State also implemented PZ intervention plans in the four schools selected in Year 1 and selected six new schools to implement PZ intervention plans in Year 3.
State Year 3 summary Despite some implementation challenges and delays during the third year of the grant, Delaware has made significant strides toward accomplishing its Race to the Top goals.
AccomplishmentsDelaware made continued progress toward a consolidated, performance-based management approach to its work in Year 3. Seeking to sustain high-impact projects after the grant period, the State initiated a plan to align its other federal funds with Race to the Top projects. DDOE specifically began investigating how it could leverage existing resources, such as the Department formula funded program Title II, Part A, to support LEAs to sustain their projects after Year 4.
In Year 3 Delaware also moved forward with the plan to fully implement the assessments being developed by the Smarter Balanced Assessment Consortium (Smarter Balanced) during school year (SY) 2014-2015. To prepare for the implementation of the new assessments, approximately 70 schools participated in a pilot of Smarter Balanced test items in February 2013. This led to the identification of key next steps for the State, including the convening of a panel of experts to determine the remaining technological challenges for implementing Smarter Balanced assessments on time and with quality.
During Year 3, changes to Delaware’s progress and performance management system were also instrumental in building a culture of data analysis for all projects at the State, LEA, and classroom level. This has been particularly evident in DDOE’s work to ensure data are used to drive instruction and decision-making in schools and LEAs most in need of assistance. In Year 3, Delaware saw improvement in the implementation of its statewide professional learning communities (PLCs), which facilitate collaboration among educators and strengthen their ability to use data to inform instruction.
DDOE was able to fully implement the Delaware Performance Appraisal System (DPAS II) for all educators in kindergarten through twelfth grade (K-12) in Year 3. This was the first time teachers in both tested and non-tested grades received an evaluation using Components I-V of the DPAS II system. During the State’s first year of full implementation, it saw significant progress in implementing and institutionalizing appraisals of professional practice (Components I-IV) and measurement of student growth (Component V). See Great Teachers and Leaders for additional details on the DPAS II system.
DDOE also collaborated with the Harvard Strategic Data Project to analyze statewide human capital data during Year 3. Through this partnership, a Harvard Strategic Data Fellow worked with the State to produce a Human Capital Diagnostic report, which provided critical information to be used by the State to identify ways to improve its policies and practices in educator recruitment, placement, development, evaluation, and retention. In Year 4, the State plans to continue to analyze data to inform the way it improves the effectiveness of its teacher preparation programs.
Delaware Year 3: School Year 2012 – 2013Race to the Top 4
Executive Summary
In Year 3, Delaware decided to increase the size of its Teach For America (TFA) cohort to 30 corps members, up from 27 in the 2011 cohort. Seventy-nine percent of the 2011 cohort and 97 percent of the 2012 cohort are still teaching in Delaware schools, and DDOE plans to expand the program to additional LEAs in Year 4. The partnership with TFA and the recruitment of a third cohort for the Delaware Leadership Project allowed the State to experience continued success in its work to improve teacher and leader pipelines.
ChallengesSignificant turnover among senior DDOE leadership and staff was a challenge during Year 3, after the Governor appointed a new State Secretary of Education in spring 2012. Capacity challenges resulted in some uncertainty as project delays were associated with staff transitions in the Delivery Unit, School Turnaround Unit, and other key offices in the department. Routines continued and key deliverables were met in most areas; however, the transition made it difficult for the State to maintain some of its project timelines. DDOE has addressed a number of its staffing concerns and has prioritized filling other key vacancies early in Year 4.
DDOE anticipated full instructional implementation of CCSS for grade levels K-12 by the end of Year 3; however, the fidelity of implementation varied by LEA. To address this challenge the State kicked off its Common Ground for the Common Core program during Year 3, aiming to build school-level capacity for CCSS implementation through a network of carefully selected school guiding teams. During Year 3, these teams crafted two-year school implementation plans to ensure that their schools have the essential elements necessary to transition to the CCSS. According to the State, if implemented with fidelity, full, statewide CCSS instructional implementation will occur 12 months later than anticipated and only months before the roll-out of the Smarter Balanced assessments.
There were challenges to implementing some aspects of the DPAS II system in Year 3. The State implemented Component V across all K-12 grade levels; however, a meaningful level of differentiation was not evident in the traditional teacher evaluation metrics (Components I-IV), which resulted in ratings that showed little variation in overall teacher quality. Recognizing that the evaluation process for most educators in Year 3 was significantly revised from the previous school year, the State focused on providing training and resources to principals so that they are more capable evaluators in Year 4.
Several of the State’s projects supporting teachers and leaders had challenges in Year 3. Delaware decided to cancel the Science, Technology, Engineering, and Mathematics (STEM) Residency project due to low participation numbers and inadequate vendor project management. In Year 2, the Delaware Teaching Fellows
(DTF) project was discontinued for similar reasons. To continue to attract new talent to Delaware classrooms through alternative routes, the State proposes to amend these programs and expand other successful programs in Year 4.
In addition, DDOE’s Talent Transfer Initiative and Talent Retention Bonus Program had limited success attracting and retaining highly effective teachers in high-need schools. In Year 2, only 28 educators received retention bonuses. As a result, in Year 3 the State elected to merge the projects to form the Delaware Talent Cooperative and increase outreach to educators. The merger did not immediately have its intended impact, as three additional LEAs chose to join the Delaware Talent Cooperative and only two educators transferred to a high-need school, putting Delaware well short of its goal of 600 retention and 240 transfer bonuses by SY 2013-2014. DDOE has continued to solicit feedback from educators to improve the program and identified 155 new educators to join the retention arm of the Delaware Talent Cooperative in Year 4.
Looking ahead to Year 4 In Year 4, Delaware plans to introduce minor revisions to the DPAS II system in order to support principals to better evaluate teachers and support them in a manner consistent with their performance in the classroom. The State intends to gather feedback from educators to inform improvements to the Delaware Talent Cooperative, and to leverage data compiled in Year 3 and Year 4 to improve the effectiveness of its teacher preparation programs. The State also plans to expand its 2013 TFA and Delaware Leadership Project (DLP) cohorts to continue attracting new talent to Delaware classrooms and consider other ways to meet its Race to the Top goals in the area of alternate pathways for teachers and leaders.
Because the quality of implementation of CCSS varied across LEAs in Year 3, the success of DDOE’s Common Ground for the Common Core project in Year 4 will be crucial. In addition, the State will continue the transition from the Delaware Comprehensive Assessment System (DCAS) to Smarter Balanced assessments in Year 4, with a full Smarter Balanced assessments field test scheduled for spring 2014. This transition will require DDOE and LEAs to thoughtfully consider the technological and process changes required to make this shift as seamless as possible. Finally, as DDOE leadership seeks to sustain the gains achieved during the past three years and develop strategies to continue investments after the grant period ends, it is working to integrate the practices and processes put in place as a result of Race to the Top projects.
Delaware Year 3: School Year 2012 – 2013Race to the Top 5
State Success Factors
Building capacity to support LEAsA major goal of Delaware’s Race to the Top plan is to build DDOE capacity to support Delaware’s LEAs as they implement key initiatives. In Year 3, these efforts contributed to further improvements to DDOE’s performance management system. In particular, the implementation of a tiered support and accountability structure for LEAs, based on student growth and other indicators of continuous improvement, allowed DDOE to better allocate limited State resources to support LEAs. In order for this performance management system to function effectively, reliable and timely information is critical. Regular collection and analysis of such data is the product of Race to the Top funded projects, such as the Human Capital Analytics project. This has helped DDOE implement a more rigorous and timely LEA oversight process that results in individualized LEA support plans tailored to the unique problems each LEA faced.
Although the tiered support and accountability structure DDOE launched improved responsiveness based on LEA needs, implementation progress slowed at times during Year 3 while DDOE addressed senior leadership turnover. DDOE leaders were able to fill staffing gaps so that Race to the Top projects generally stayed on track during hiring, but the State reported that high levels of turnover at the Chief Officer level generated capacity challenges. Throughout these transitions, the State believed that LEA service interruptions were minimal, although some State project timelines were delayed.
Support and accountability for LEAs Through site visits, LEA liaisons, monthly Chiefs’ meetings, LEA progress reviews, and annual performance evaluations, DDOE provided support for LEAs and held them accountable in Year 3. Similar to previous years, these structures allowed DDOE to track LEA performance, support LEAs based on challenges faced and outcomes achieved, and ensure LEAs implemented Race to the Top projects as outlined in their plans. As featured in the RSN’s Performance Management: Achieving Results through Accountability publication7 and outlined in Delaware’s Elementary and Secondary Education Act (ESEA) flexibility request, a key shift in Year 3 was the adoption of a tiered support and accountability structure, that places LEAs in one of four categories (minimal, moderate, advanced, and intense) based on performance indicator progress and student growth.8 In Year 3, 5 of Delaware’s 19 traditional LEAs were assigned to the “intense” tier, receiving additional support and onsite visits from DDOE. For the 18 participating charter schools, parallel monitoring and support efforts were managed by Delaware’s Charter School Office. The State also developed a new Academic Performance Framework for charter school accountability, to be implemented in Year 4.
By varying the level of support and frequency of contact with LEAs, DDOE is better able to prioritize support and monitor project implementation for the LEAs most in need of assistance. As part of this change, DDOE revised the format of progress reviews and performance evaluations to allocate more time with LEA leadership teams to discuss and develop actions plans to correct identified deficiencies. Instead of simply providing data on student growth, DDOE now helps LEAs to analyze the data during progress and performance reviews and then partners with the LEA to craft a plan to address the challenges faced.
Through its support and accountability mechanisms, in Year 3, the State worked with one large LEA to uphold its district-level Race to the Top commitments and goals. The LEA’s leadership developed a Race to the Top Success Plan in consultation with teachers, principals, students, community members and partners; the plan was endorsed by the teachers’ union and approved by the State in Year 1. DDOE monitored the plan through a tiered support and accountability structure. Within its plan, the LEA committed to developing incentives that would encourage highly effective teachers and leaders to serve in its high-needs schools, and LEA leaders later agreed to either develop a plan or adopt a State-developed plan to attract and retain such talent to high-needs schools. During its regular monitoring, DDOE found the LEA’s progress toward their original goal to be insufficient. Therefore, in Year 3, DDOE took steps to hold the LEA accountable to the commitments and goals, and after providing numerous opportunities to address the concerns, the State ultimately decided to withhold a portion of the LEA’s Race to the Top funds.
In between progress reviews (held during the school year) and end of school year performance reviews, DDOE regularly interacts with LEA leadership through LEA liaisons and at monthly Chiefs’ meetings. DDOE uses the Chiefs’ meetings to discuss statewide performance successes and challenges with LEA leadership, often by reporting on school- and LEA-level student outcomes. In Year 3, these meetings focused heavily on data-driven conversations around statewide DCAS, Scholastic Assessment Test (SAT), and DPAS II results, as well as the Human Capital Diagnostic report, and graduation and college enrollment rates in Delaware. This approach has remained popular with Delaware superintendents, with over 80 percent indicating in the most recent annual superintendent survey that the meetings are beneficial. While Chiefs’ meetings remained valuable to LEA administrators in Year 3, the utility of LEA liaisons received mixed reviews from stakeholders (as it has in previous years). Although an assigned liaison served every LEA in Year 3, frequent turnover amongst liaisons seemed to limit their effectiveness, as the value of liaisons often depends on a close understanding of LEA context, including key local actors, historical circumstances, and their Race to the Top Success Plan, which is knowledge difficult to acquire in a short period of time.
7 See https://rtt.grads360.org/ for additional details. 8 On September 23, 2011, the U.S. Department of Education (Department) offered each interested State educational agency (SEA) the opportunity to request “Elementary and
Secondary Education Act (ESEA) flexibility” on behalf of itself, its local LEAs, and its schools, regarding specific requirements of the No Child Left Behind Act of 2001 (NCLB). This was in exchange for rigorous and comprehensive State-developed plans designed to improve educational outcomes for all students, close achievement gaps, increase equity, and improve the quality of instruction. For more information on ESEA flexibility, see www.ed.gov/esea/flexibility.
Delaware Year 3: School Year 2012 – 2013Race to the Top 6
State Success Factors
With the April 2013 launch of version 3.0 of Delaware’s consolidated grant system, Education Success Planning and Evaluation System (ESPES), DDOE started to bring together program offices, including the TLEU, Teaching & Learning, and the Education Supports & Innovative Practices Branch, which in previous years rarely interacted. Through ESPES, DDOE program areas jointly plan for and execute progress and performance reviews, ensuring the tiered support and accountability structure includes joint program area oversight of LEAs. Through this new approach DDOE will lessen LEA reporting burden while also marshaling evidence from all program offices when assessing LEA performance. Overall, the structural changes introduced in Year 3 are forward thinking and consistent with Delaware’s goal to better utilize data in their decision-making process. This type of change will be necessary in order for Delaware to successfully transition out of the Race to the Top program in a manner that preserves processes and practices implemented over the past three years.
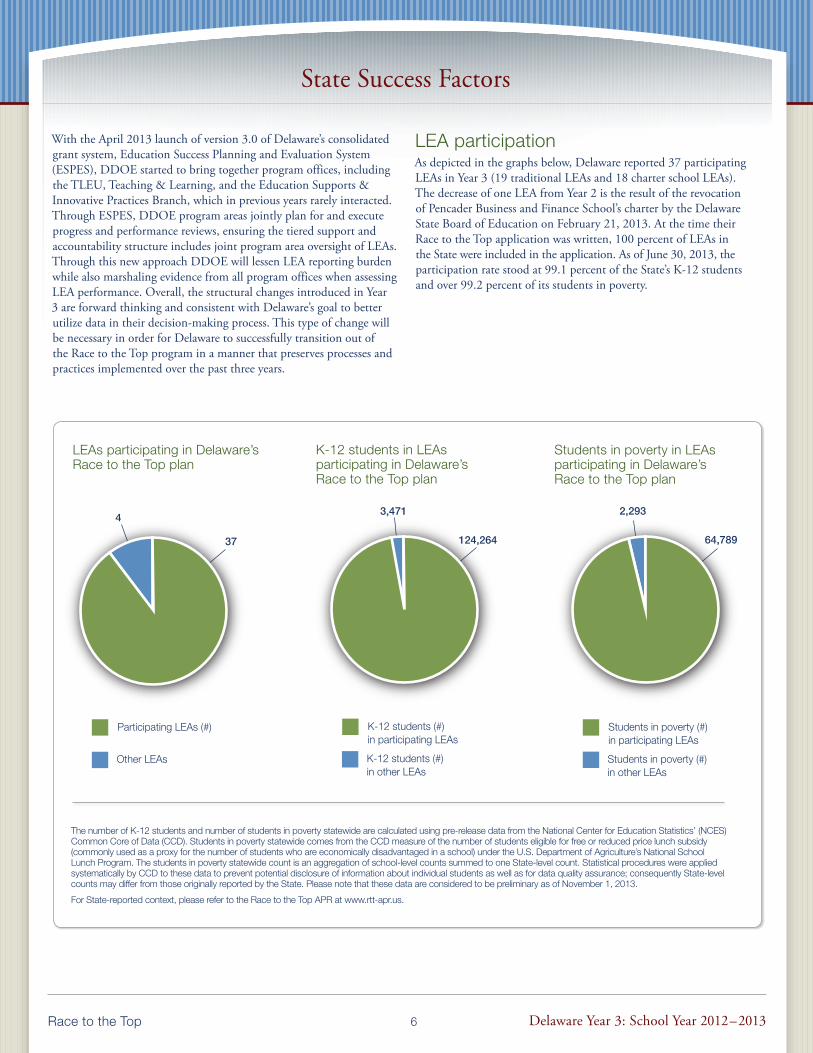
LEA participationAs depicted in the graphs below, Delaware reported 37 participating LEAs in Year 3 (19 traditional LEAs and 18 charter school LEAs). The decrease of one LEA from Year 2 is the result of the revocation of Pencader Business and Finance School’s charter by the Delaware State Board of Education on February 21, 2013. At the time their Race to the Top application was written, 100 percent of LEAs in the State were included in the application. As of June 30, 2013, the participation rate stood at 99.1 percent of the State’s K-12 students and over 99.2 percent of its students in poverty.
LEAs participating in Delaware’s Race to the Top plan
37
4
Participating LEAs (#)
Other LEAs
K-12 students in LEAs participating in Delaware’s Race to the Top plan
124,264
3,471
K-12 students (#) in participating LEAs
K-12 students (#) in other LEAs
Students in poverty in LEAs participating in Delaware’s Race to the Top plan
64,789
2,293
Students in poverty (#) in participating LEAs
Students in poverty (#) in other LEAs
The number of K-12 students and number of students in poverty statewide are calculated using pre-release data from the National Center for Education Statistics’ (NCES) Common Core of Data (CCD). Students in poverty statewide comes from the CCD measure of the number of students eligible for free or reduced price lunch subsidy (commonly used as a proxy for the number of students who are economically disadvantaged in a school) under the U.S. Department of Agriculture’s National School Lunch Program. The students in poverty statewide count is an aggregation of school-level counts summed to one State-level count. Statistical procedures were applied systematically by CCD to these data to prevent potential disclosure of information about individual students as well as for data quality assurance; consequently State-level counts may differ from those originally reported by the State. Please note that these data are considered to be preliminary as of November 1, 2013.
For State-reported context, please refer to the Race to the Top APR at www.rtt-apr.us.
Delaware Year 3: School Year 2012 – 2013Race to the Top 7
State Success Factors
Stakeholder engagementKey activities and stakeholdersDelaware’s leadership team, composed of the Governor, the State Secretary of Education, and other key leadership from the Delaware State Education Association, supported and were deeply engaged with the State’s Race to the Top plan in Year 3. Other key stakeholders were engaged by DDOE in their reform efforts, including leaders from the Rodel Foundation, the Delaware State Board of Education, and the State’s institutions of higher education (IHEs).
The State maintained frequent contact with LEAs, as described above. Evidence of continued school and LEA satisfaction with DDOE includes support for monthly Chief ’s meetings. Such support is measured through annual superintendent surveys, positive feedback from LEA administrators regarding progress and performance reviews expressed during the Department’s onsite progress review period, and generally supportive statements by teachers of the reform initiatives associated with Race to the Top, as indicated in the most recent statewide survey in winter 2013.
To improve stakeholder engagement, DDOE received individualized technical assistance from the RSN to enhance communications and engagement with teachers regarding the DPAS II evaluation system, particularly the implementation of Component V. As a result, RSN reviewed the State’s existing communications and outreach plans, engaged Delaware teachers in focus groups, and identified best practices from published research and protocols from other States. RSN’s recommendations helped Delaware revise their communication and implementation plans.
Continuous improvementWhether the assessment is based on survey data, project timeline adherence, student growth data, or informal findings, project managers and senior leadership at DDOE consistently show a willingness to address concerns from the field and to thoughtfully consider how to make mid-course corrections to improve Delaware’s education system. In Year 3, many types of feedback, such as superintendent surveys, Department progress review observations, project lead reports, the statewide educator survey, and student growth data, cumulatively provided DDOE leadership with timely status checks on key State initiatives. In response to the concerns identified, DDOE launched a new school-level CCSS support initiative to aid in the full implementation of CCSS (see Standards and Assessments). Further, the State has responded to concerns related to the implementation of a more rigorous teacher evaluation system by focusing principal professional development on appropriate goal-setting and meaningful observation and feedback; this will allow evaluators to better differentiate teaching practices, a necessary condition for rewards and support to be applied more accurately and readily by LEAs. The State also created a “hotline” to quickly answer DPAS II questions for educators.
Successes, challenges, and lessons learnedIn Year 3, Delaware continued to have strong performance management processes to monitor Race to the Top implementation. Across projects, DDOE is helping to build a culture of data analysis at the State, LEA, and classroom levels. Using data to drive instruction and decision-making is most evident in DDOE’s progress and performance management system, which helps concentrate limited DDOE resources on aid to schools and LEAs most in need of assistance. In Year 3, DDOE started to institutionalize these practices across the department, a transition slowed somewhat by staffing turnover. In Year 4, as these changes become standardized, DDOE plans to accelerate their impact by revising oversight procedures of funds allocated through Title II, Part A so that LEAs use these dedicated funds more strategically. As part of the SY 2012-2013 performance review, DDOE signaled to LEAs that use of SY 2014-2015 Title II, Part A funds would require LEAs to demonstrate how the use of these funds would directly increase the number of qualified and effective teachers serving students in their LEA.
Delaware Year 3: School Year 2012 – 2013Race to the Top 8
State Success Factors
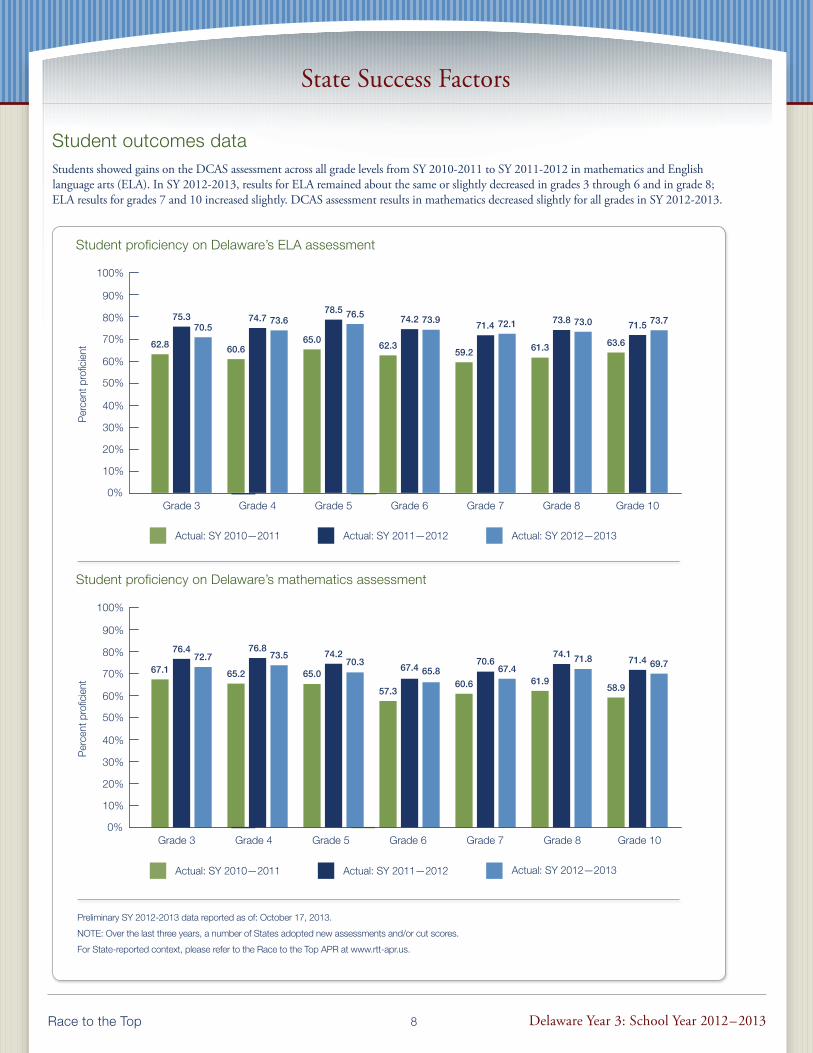
Student outcomes dataStudents showed gains on the DCAS assessment across all grade levels from SY 2010-2011 to SY 2011-2012 in mathematics and English language arts (ELA). In SY 2012-2013, results for ELA remained about the same or slightly decreased in grades 3 through 6 and in grade 8; ELA results for grades 7 and 10 increased slightly. DCAS assessment results in mathematics decreased slightly for all grades in SY 2012-2013.
Student proficiency on Delaware’s ELA assessment
Grade 3 Grade 4 Grade 5 Grade 6 Grade 7 Grade 8 Grade 10
75.3
62.8
70.574.7
60.6
73.678.5
65.0
76.5 74.2
62.3
73.971.4
59.2
72.1 73.8
61.3
73.0 71.5
63.6
73.7
0%
10%
20%
30%
40%
50%
60%
70%
80%
90%
100%
Per
cent
pro
ficie
nt
Actual: SY 2010—2011 Actual: SY 2011—2012 Actual: SY 2012—2013
Student proficiency on Delaware’s mathematics assessment
76.4
67.172.7
Grade 3
76.8
65.2
73.5
Grade 4
74.2
65.070.3
Grade 5
67.4
57.3
65.8
Grade 6
70.6
60.6
67.4
Grade 7
74.1
61.9
71.8
Grade 8
71.4
58.9
69.7
Grade 100%
10%
20%
30%
40%
50%
60%
70%
80%
90%
100%
Per
cent
pro
ficie
nt
Actual: SY 2010—2011 Actual: SY 2011—2012 Actual: SY 2012—2013
Preliminary SY 2012-2013 data reported as of: October 17, 2013.
NOTE: Over the last three years, a number of States adopted new assessments and/or cut scores.
For State-reported context, please refer to the Race to the Top APR at www.rtt-apr.us.
Delaware Year 3: School Year 2012 – 2013Race to the Top 9
State Success Factors
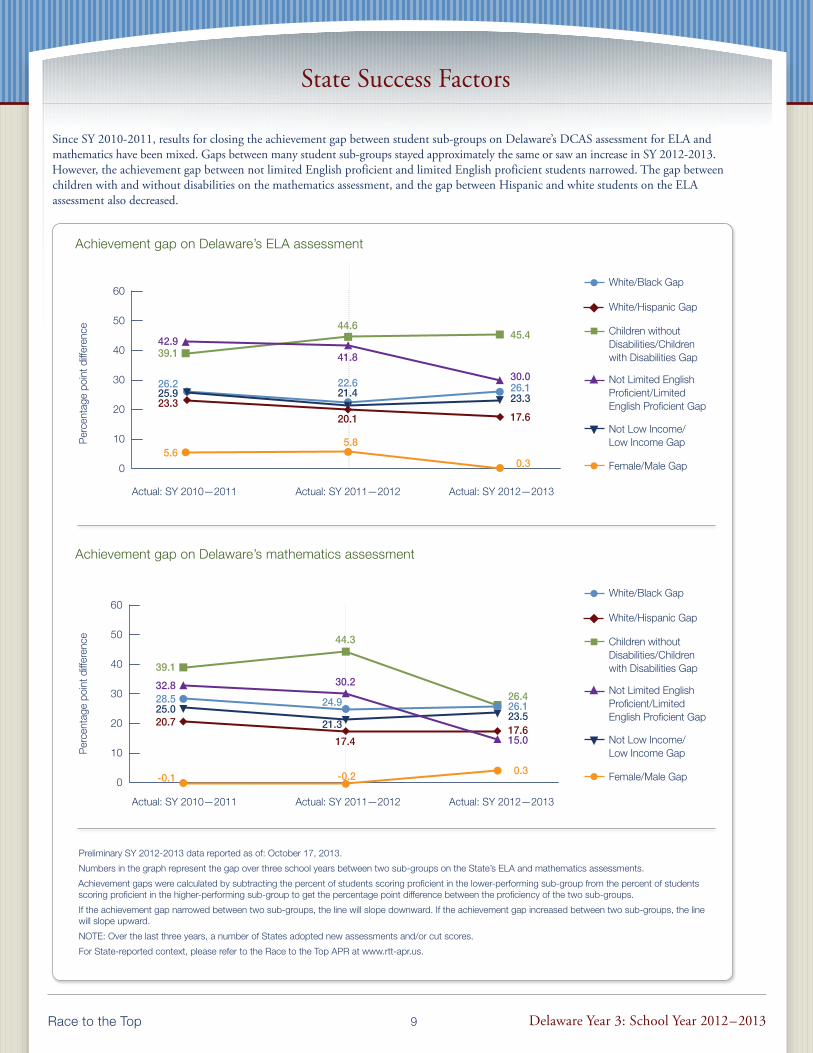
Since SY 2010-2011, results for closing the achievement gap between student sub-groups on Delaware’s DCAS assessment for ELA and mathematics have been mixed. Gaps between many student sub-groups stayed approximately the same or saw an increase in SY 2012-2013. However, the achievement gap between not limited English proficient and limited English proficient students narrowed. The gap between children with and without disabilities on the mathematics assessment, and the gap between Hispanic and white students on the ELA assessment also decreased.
Achievement gap on Delaware’s ELA assessment
30.026.1
45.4
17.6
23.3
0.3
42.939.1
23.3
26.225.9
5.6
41.8
44.6
20.1
21.422.6
5.8
0
10
30
20
50
40
60
Per
cent
age
poin
t diff
eren
ce
Actual: SY 2010—2011 Actual: SY 2011—2012 Actual: SY 2012—2013
White/Black Gap
Not Low Income/Low Income Gap
Children without Disabilities/Children with Disabilities Gap
Not Limited English Proficient/Limited English Proficient Gap
Female/Male Gap
White/Hispanic Gap
Achievement gap on Delaware’s mathematics assessment
15.0
26.126.4
17.623.5
0.3
32.8
39.1
20.725.028.5
-0.1
30.2
44.3
17.4
21.3
24.9
-0.20
10
30
20
50
40
60
Per
cent
age
poin
t diff
eren
ce
Actual: SY 2010—2011 Actual: SY 2011—2012 Actual: SY 2012—2013
White/Black Gap
Not Low Income/Low Income Gap
Children without Disabilities/Children with Disabilities Gap
Not Limited English Proficient/Limited English Proficient Gap
Female/Male Gap
White/Hispanic Gap
Preliminary SY 2012-2013 data reported as of: October 17, 2013.
Numbers in the graph represent the gap over three school years between two sub-groups on the State’s ELA and mathematics assessments.
Achievement gaps were calculated by subtracting the percent of students scoring proficient in the lower-performing sub-group from the percent of students scoring proficient in the higher-performing sub-group to get the percentage point difference between the proficiency of the two sub-groups.
If the achievement gap narrowed between two sub-groups, the line will slope downward. If the achievement gap increased between two sub-groups, the line will slope upward.
NOTE: Over the last three years, a number of States adopted new assessments and/or cut scores.
For State-reported context, please refer to the Race to the Top APR at www.rtt-apr.us.
Delaware Year 3: School Year 2012 – 2013Race to the Top 10
State Success Factors
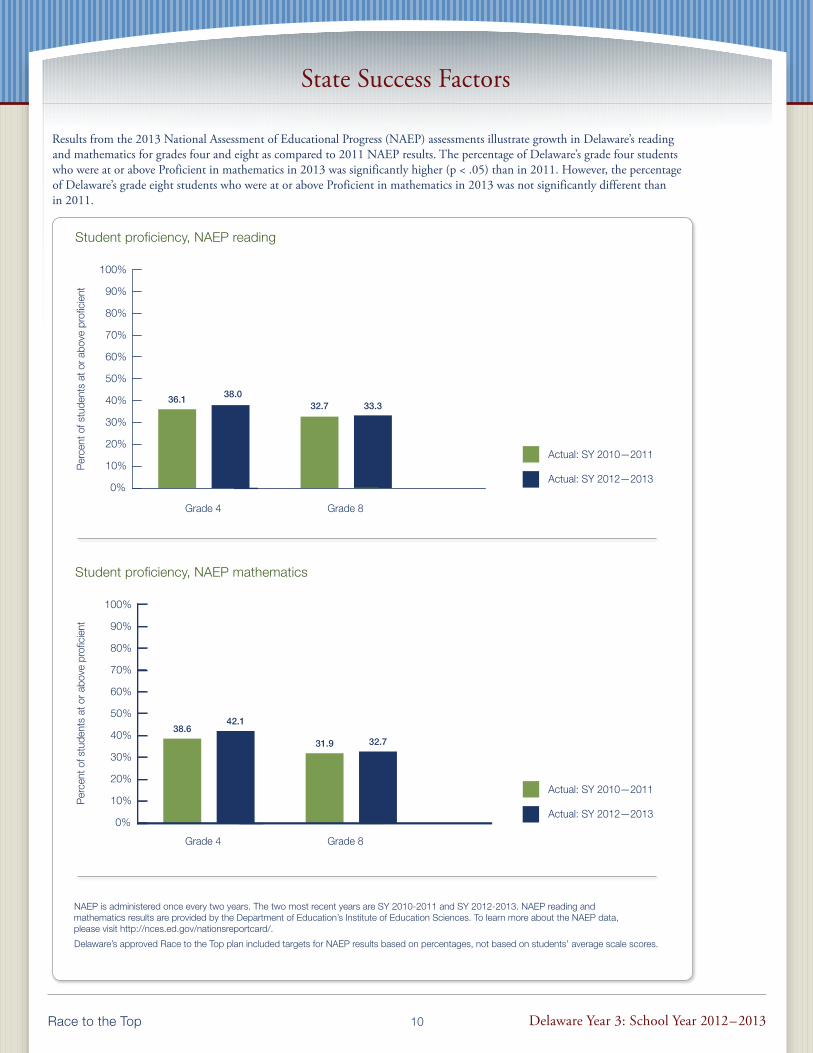
Results from the 2013 National Assessment of Educational Progress (NAEP) assessments illustrate growth in Delaware’s reading and mathematics for grades four and eight as compared to 2011 NAEP results. The percentage of Delaware’s grade four students who were at or above Proficient in mathematics in 2013 was significantly higher (p < .05) than in 2011. However, the percentage of Delaware’s grade eight students who were at or above Proficient in mathematics in 2013 was not significantly different than in 2011.
Student proficiency, NAEP reading
38.036.133.332.7
10%
0%
20%
30%
40%
50%
60%
70%
80%
90%
100%
Per
cent
of s
tude
nts
at o
r abo
ve p
rofic
ient
Grade 4 Grade 8
Actual: SY 2010—2011
Actual: SY 2012—2013
Student proficiency, NAEP mathematics
42.138.6
32.731.9
10%
0%
20%
30%
40%
50%
60%
70%
80%
90%
100%
Per
cent
of s
tude
nts
at o
r abo
ve p
rofic
ient
Grade 4 Grade 8
Actual: SY 2010—2011
Actual: SY 2012—2013
NAEP is administered once every two years. The two most recent years are SY 2010-2011 and SY 2012-2013. NAEP reading and mathematics results are provided by the Department of Education’s Institute of Education Sciences. To learn more about the NAEP data, please visit http://nces.ed.gov/nationsreportcard/.
Delaware’s approved Race to the Top plan included targets for NAEP results based on percentages, not based on students’ average scale scores.
Delaware Year 3: School Year 2012 – 2013Race to the Top 11
State Success Factors
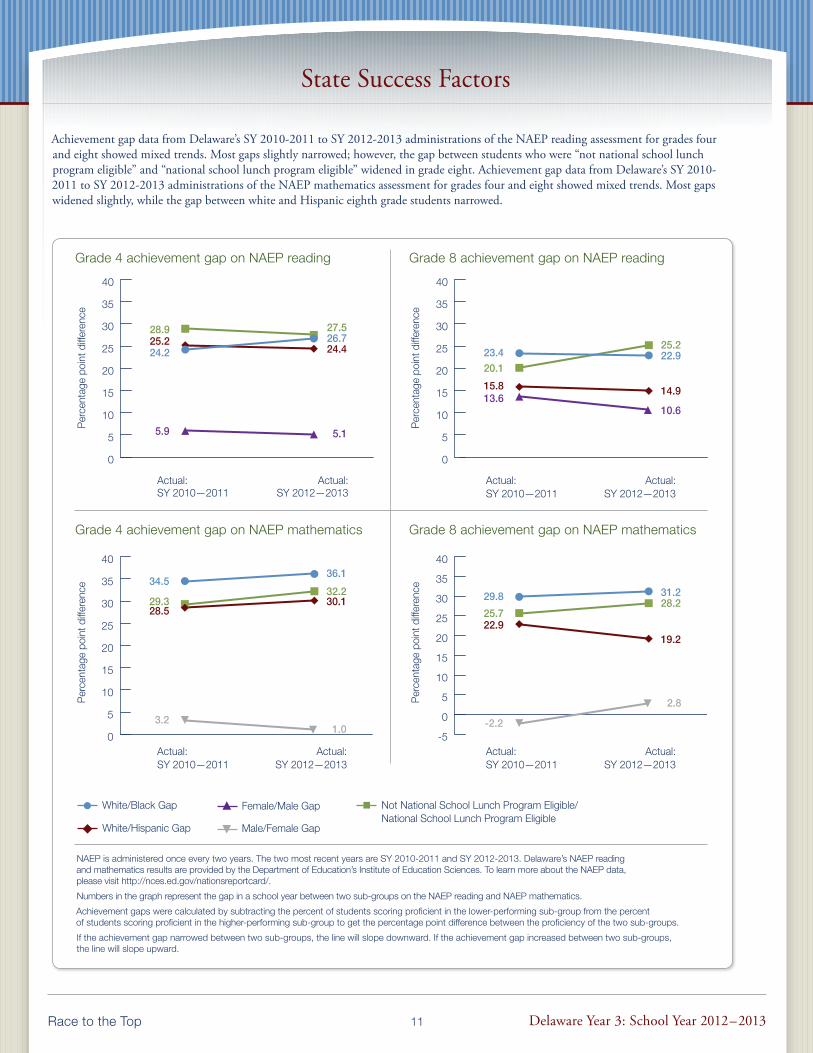
Achievement gap data from Delaware’s SY 2010-2011 to SY 2012-2013 administrations of the NAEP reading assessment for grades four and eight showed mixed trends. Most gaps slightly narrowed; however, the gap between students who were “not national school lunch program eligible” and “national school lunch program eligible” widened in grade eight. Achievement gap data from Delaware’s SY 2010-2011 to SY 2012-2013 administrations of the NAEP mathematics assessment for grades four and eight showed mixed trends. Most gaps widened slightly, while the gap between white and Hispanic eighth grade students narrowed.
Grade 4 achievement gap on NAEP reading
26.727.5
24.4
5.1
28.925.224.2
5.9
0
5
10
15
20
25
30
35
40
Per
cent
age
poin
t diff
eren
ce
SY 2010—2011 SY 2012—2013Actual: Actual:
Grade 8 achievement gap on NAEP reading
22.925.2
14.9
10.6
20.1
15.8
23.4
13.6
Per
cent
age
poin
t diff
eren
ce
Actual: SY 2010—2011
Actual: SY 2012—2013
0
5
10
15
20
25
30
35
40
Grade 4 achievement gap on NAEP mathematics
0
5
10
15
20
25
30
35
4036.1
32.230.1
1.0
29.328.5
34.5
3.2
Per
cent
age
poin
t diff
eren
ce
Actual: SY 2010—2011
Actual: SY 2012—2013
Grade 8 achievement gap on NAEP mathematics
31.228.2
19.2
2.8
25.722.9
29.8
-2.2-5
0
5
10
15
20
25
30
35
40
Per
cent
age
poin
t diff
eren
ce
Actual: SY 2010—2011
Actual: SY 2012—2013
White/Black Gap
White/Hispanic Gap
Female/Male Gap
Male/Female Gap
Not National School Lunch Program Eligible/ National School Lunch Program Eligible
NAEP is administered once every two years. The two most recent years are SY 2010-2011 and SY 2012-2013. Delaware’s NAEP reading and mathematics results are provided by the Department of Education’s Institute of Education Sciences. To learn more about the NAEP data, please visit http://nces.ed.gov/nationsreportcard/.
Numbers in the graph represent the gap in a school year between two sub-groups on the NAEP reading and NAEP mathematics.
Achievement gaps were calculated by subtracting the percent of students scoring proficient in the lower-performing sub-group from the percent of students scoring proficient in the higher-performing sub-group to get the percentage point difference between the proficiency of the two sub-groups.
If the achievement gap narrowed between two sub-groups, the line will slope downward. If the achievement gap increased between two sub-groups, the line will slope upward.
Delaware Year 3: School Year 2012 – 2013Race to the Top 12
State Success Factors
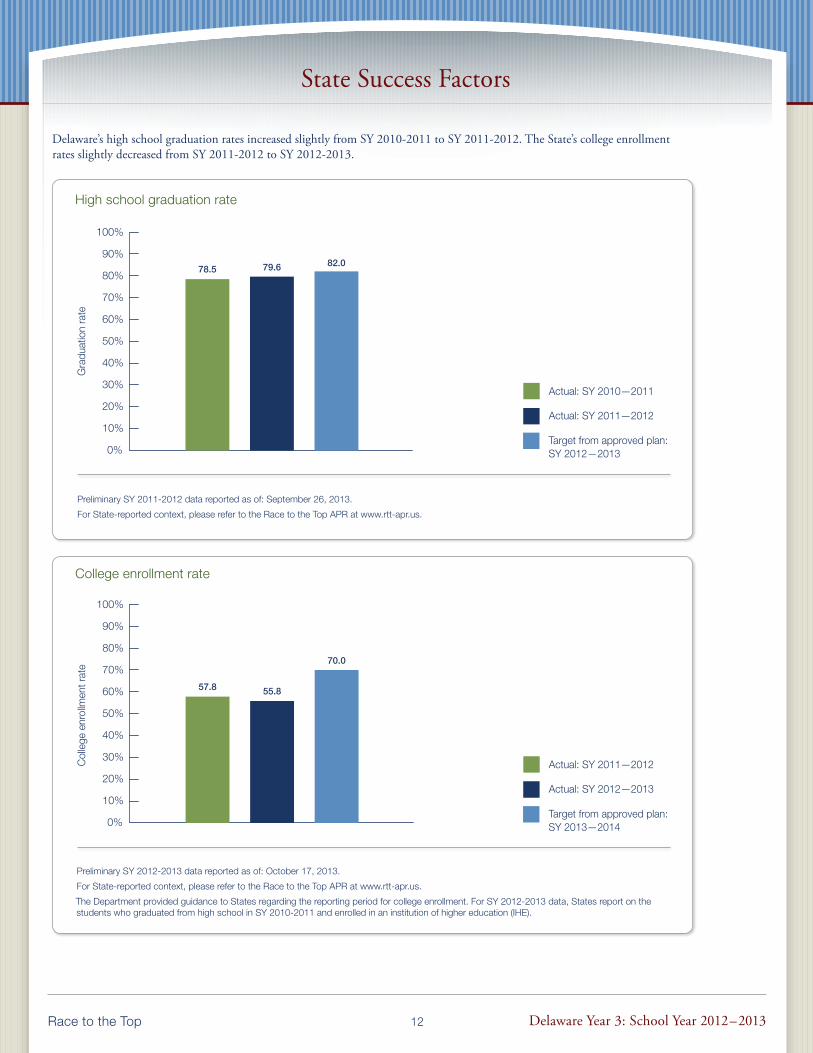
Delaware’s high school graduation rates increased slightly from SY 2010-2011 to SY 2011-2012. The State’s college enrollment rates slightly decreased from SY 2011-2012 to SY 2012-2013.
High school graduation rate
10%
0%
20%
30%
40%
50%
60%
70%
80%
90%
100%
79.678.582.0
Gra
duat
ion
rate
Target from approved plan: SY 2012—2013
Actual: SY 2010—2011
Actual: SY 2011—2012
Preliminary SY 2011-2012 data reported as of: September 26, 2013.
For State-reported context, please refer to the Race to the Top APR at www.rtt-apr.us.
College enrollment rate
10%
0%
20%
30%
40%
50%
60%
70%
80%
90%
100%
55.857.8
70.0
Col
lege
enr
ollm
ent r
ate
Actual: SY 2011—2012
Actual: SY 2012—2013
Target from approved plan: SY 2013—2014
Preliminary SY 2012-2013 data reported as of: October 17, 2013.
For State-reported context, please refer to the Race to the Top APR at www.rtt-apr.us.
The Department provided guidance to States regarding the reporting period for college enrollment. For SY 2012-2013 data, States report on the students who graduated from high school in SY 2010-2011 and enrolled in an institution of higher education (IHE).
Delaware Year 3: School Year 2012 – 2013Race to the Top 13
Standards and Assessments
Implementing rigorous college- and career-ready standards and assessments that prepare students for success in college and career is an integral aspect of education reform in all Race to the Top States.
Supporting the transition to college- and career-ready standards and high-quality assessmentsAdopting standards and developing assessmentsSince adopting the CCSS in ELA and mathematics in August 2010, the State has steadily progressed toward full implementation, focusing their efforts in Years 1 and 2 on providing model curriculum and developing resources to aid educator implementation. Due to the fact that 85 percent of Delaware superintendents identified CCSS professional development as a very high or high priority for DDOE and because LEAs were implementing the standards with uneven quality and rigor, in Year 3 the State elected to reallocate non-Race to the Top funds to reboot CCSS implementation statewide. Led by a CCSS Steering Committee composed of DDOE, LEAs, IHE, business, and parent representatives, the “reboot” called for school-based guiding teams to take a central role in the transition process, serving as the conduit for improved and targeted CCSS specific professional development. The newly created Common Ground for the Common Core program tasked the teams with the creation and submission of school plans by June 30, 2013 to DDOE, with plans approved by DDOE documenting how full instructional implementation for K-12 will occur in SY 2013-2014.
In Year 3, Delaware successfully conducted all DCAS and DCAS Alternate assessments on schedule and is on track for a transition to Smarter Balanced assessments in SY 2014-2015. Based on educator survey data, feedback on DCAS and DCAS Alternate assessments implementation remained generally positive across multiple elements (e.g., 76 percent of educators agreed or strongly agreed that the DCAS portal provides helpful information in Year 3, up from 67 percent in June 2011). While positive feedback was not universal, (e.g., only 58 percent of educators agreed or strongly agreed that information from the DCAS reporting system was useful to instruction in Year 3), overall survey data demonstrated educators either agreed or strongly agreed that elements of DCAS were being implemented with quality, or noted improvement in comparison to previous year performance.
DDOE, working in cooperation with its assessment vendor, has undertaken comprehensive item development plans intended to ease the transition to Smarter Balanced assessments. DDOE’s eventual goal is to populate the DCAS item pool so that all tests in ELA-reading and mathematics for grades 3 through 10 utilize CCSS aligned test items by SY 2014-2015. In SY 2011-2012, DCAS assessed roughly 25-40 percent of college- and career-ready standards. For SY 2012-2013, these percentages increased to 50-70 percent. The State’s goal for SY 2013-2014 is for the items in their assessment bank to be CCSS aligned by more than 90 percent in all grades.
In preparation for the implementation of Smarter Balanced assessments, approximately 70 schools participated in a Smarter Balanced pilot test of assessment items in February 2013. The pilot test helped identify the key next steps for the State, resulting in the State convening a panel of experts to comprehensively assess the remaining technological hurdles to ensure implementation of Smarter Balanced assessments on time and with quality.
Preparing districts and schools for the transition to the Common Core State Standards
Common Ground for the Common Core was kicked off in March 2013 with a convening of over 700 educators from 142 guiding teams comprised of principals and teachers. National CCSS experts, including representatives from organizations such as Student Achievement Partners, Expeditionary Learning, and Achieve, facilitated 11 sessions differentiated by content, grade level, and readiness level. The State reported that, as part of this effort, school teams crafted two-year implementation plans to:
• Identify and develop school structures to build and support a school-wide CCSS culture;
• Ensure teachers receive training;
• Provide expert knowledge of the CCSS–what they really imply for teaching and learning;
• Identify the characteristics of effective teaching and learning within the CCSS;
• Train teachers in the use of tools to identify materials supporting the teaching of CCSS;
• Translate standards into concrete instructional best practices; and
• Foster the development of local assessments to determine if students are on track and initiate intervention practices when they are not.
Supporting college readinessIn Year 3, Delaware continued programs attempting to expand student access to college readiness examinations and to provide teachers the tools to better prepare students to become college-ready. The State also sustained quarterly STEM Council meetings, continuing to promote and highlight STEM education in Delaware (see Emphasis on Science Technology, Engineering, and Mathematics (STEM)).
Delaware Year 3: School Year 2012 – 2013Race to the Top 14
Standards and Assessments
As a result of implementing these programs, all high school juniors were provided the opportunity to take the SAT during school hours at no cost to the student. In Year 3, the percent of high school juniors completing the SAT rose from 98 percent to 99 percent.9 The State plans to continue funding the program beyond the grant period, ensuring that the inability to pay for the SAT is not a barrier to college attendance.
DDOE continued programs intended to increase the percentage of college-ready students. By one measure of a student’s readiness for college, a score at or above 1550 on the SAT, Delaware’s performance has remained flat for the past two years (approximately 20 percent of Delaware test takers were at or above 1550). In fall 2012, the State launched the Middle School Preparation Program with LEAs selecting one of four vendors (Achieve 3000, Compass Learning, Carnegie Learning, and College Board) to implement a LEA-wide program to middle school students. The program provides services to all 9,145 Delaware middle school students, with a focus on better preparing high-need students to become college-ready. As of July 2013 the State had not provided a program evaluation protocol to measure whether high-need students are being served in any enhanced way through this program.
In Year 3, the State continued the Advanced Placement (AP) Summer Institute, a program for AP teachers to learn how to better develop and teach AP courses. The State determines which courses are taught over the summer, basing their course selection on AP Summer Institute enrollment from the previous year, AP student outcome data, and AP course redesign changes. To ease access to the four day AP Summer Institute, the State holds two geographically convenient sessions for attendees. Although these measures demonstrate the State’s attempt to adjust the program to better meet teacher needs, they have not led to increased attendance over the grant period, with 129 teachers attending in 2011, 79 in 2012, and 57 in 2013. Due to declining enrollment the State, with the assistance of the College Board, plans to use the AP Summer Institute as an anchor, building a year-round AP support program that organizes mentoring cadres by subject, gathers feedback via student and teacher surveys, and recognizes leading LEAs with formal Governor and Secretary of Education visits.
Dissemination of resources and professional developmentDelaware prepared its educators to implement the CCSS by developing instructional materials and providing professional development. The State disseminated these resources through a dedicated clearinghouse on its State website and tracked professional development registration through its Professional Development Management System.
DDOE uses Cadre Groups of ELA and mathematics practitioners, DDOE staff, and higher education personnel to develop professional development modules, which were delivered to educators through PLCs (see Data Systems to Support Instruction) and school-based workshops. In Year 3, both ELA and mathematics Cadre Groups developed professional development modules focused on the instructional shifts needed for implementation of the CCSS. Additionally, DDOE provided training on the CCSS to all 29 Data Coaches (see Data Systems to Support Instruction), who were deployed during fall 2012 to serve as “ambassadors” for CCSS implementation to educators statewide. Delaware Mathematics and ELA Education Associates also provided technical assistance to educators throughout the year.
DDOE’s instructional materials supported CCSS implementation. Prior to Year 3 DDOE created model lessons in both ELA and mathematics using the Literacy Concept Organizers and Math Learning Progressions frameworks. During Year 3, the Mathematics Cadres completed this work by providing Delaware educators mathematics learning progressions and mathematics model lessons.
In Year 3 DDOE was unable to have all LEAs complete the curriculum alignment process, a goal slated for accomplishment by the end of Year 2. Still lacking a clear method to determine how LEAs are refining curriculum using State provided resources, in Year 3 DDOE started to utilize LEA progress reviews to assess readiness, in the process uncovering inconsistent alignment of curricular materials to the CCSS across LEAs. Throughout the year DDOE continued to provide additional assistance to its LEAs, holding ELA Curriculum Alignment Content Framework and mathematics alignment initiative sessions for 19 LEAs during summer and fall 2012.
Successes, challenges, and lessons learnedDelaware also began implementation of the Common Ground for Common Core program, an effort to support schools in their implementation of the CCSS. Challenged by inconsistent LEA implementation and lacking a clear metric of implementation progress, DDOE now relies on engaged and skilled school guiding teams to train their colleagues through the Common Ground for Common Core program. In response to the need to further engage parents and key stakeholders in the roll out and implementation of CCSS and Smarter Balanced assessments, the Delaware Teaching & Learning program office plans to hold several targeted community events in Year 4.
9 In Year 3, the percentage of students scoring at advanced levels on mathematics and English language arts (ELA) Delaware Comprehensive Assessments (DCAS) assessments, an alternative measure of college readiness, increased for ELA advanced scorers, but remained at previous year levels for mathematics.
Delaware Year 3: School Year 2012 – 2013Race to the Top 15
Data Systems to Support Instruction
Statewide longitudinal data systems (SLDS) and instructional improvement systems (IIS) enhance the ability of States to effectively manage, use, and analyze education data to support instruction. Race to the Top States are working to ensure that their data systems are accessible to key stakeholders and that the data support educators and decision-makers in their efforts to improve instruction and increase student achievement.
Fully implementing a statewide longitudinal data systemThe fully operational SLDS allows data to be efficiently shared between all LEAs, State agencies, Delaware IHEs, and DDOE. This important connection was established in Year 3 with formalization of six Memorandums of Understanding (MOUs) between Delaware IHEs and the State.
Accessing and using state dataThe key component of the State’s longitudinal data system is the Education Insight Portal (Dashboard), a data portal through which user interfaces allow access to information based on stakeholder attributes. The Dashboard is Delaware’s technical answer to a problem Delaware educators regularly confronted prior to Race to the Top: how to access State and local student performance, assessment, and demographic data through a single sign-on system. In SY 2011-2012 three LEAs piloted the Dashboard and by spring 2013 DDOE had released their eleventh system update, Version 3.1 of the Dashboard, adding local assessment data to the existing suite of features. From initial roll-out in July 2012 the State has continuously improved the product, releasing Dashboard updates based on user feedback. This aspect of the project has been challenging for DDOE, which has struggled to solicit user feedback, recording comments from approximately half of the 500 stakeholders they anticipated to annually receive feedback. While the number of unique Dashboard users increased to 6,779 in Year 3, DDOE fell far short of its target of 17,500 unique Dashboard users by the end of SY 2012-2013. To continue expanded usage, DDOE convened multiple focus groups and evaluated commercial systems to determine necessary Dashboard enhancements.
In Year 3, Delaware also received RSN individualized technical assistance to develop an Enterprise Architecture Model, allowing DDOE and LEAs to better implement their organized set of instructional improvement data systems and processes. As a result of RSN assistance, DDOE developed a current State information system diagram (architecture map) and integration strategy through an Enterprise Architecture model focused on instructional improvement.
Using data to improve instructionManagement of data so that it arrives in the hands of educators in a timely and reliable fashion is a key component of Delaware’s plan, but even the most accurate data can be rendered ineffective if educators lack the capacity to understand, analyze, and act on the data. For that reason, in Year 3 Delaware relied on 29 Data Coaches to work with PLCs at 199 schools, adjusting the Data Coach models available to schools based on participant feedback from Year 2. PLCs are the venue for 90 minutes of collaborative work time during which school teams learn how to use data to inform instructional practice.
Successes, challenges, and lessons learnedOperationally, Delaware has accomplished most of the key objectives related to the creation of a robust longitudinal data system. The system has been built to the specifications described in the State’s Race to the Top application and provides educators access to data that previously were either unavailable or too burdensome to gather independently. The technical implementation of these projects has been well managed and completed in most cases, on time and with high quality. The most challenging aspect of the work relates to DDOE technical solutions that require educators and LEAs to adjust their normal pattern of accessing data. Delaware has regularly fallen short of goals related to annual users and site visits, in part because, according to the State, the products developed do not yet provide the same functionality as commercial alternatives. In Year 3, it remained challenging for DDOE to gather user feedback, as online surveys and focus groups have not generated the depth and breadth of suggestions necessary to make key product improvements.
In Year 3, Delaware saw improvement in the implementation of its statewide PLCs, which facilitate collaboration among educators and strengthen their ability to use data to inform instruction. Based on the most recent PLC survey data, educator confidence in making instructional decisions based on data as a result of their participation in PLCs increased from 59 percent in 2012 to 65 percent in 2013. The success of the Data Coach project resulted in the State allocating funds to continue providing Data Coaches to a smaller set of schools in Year 4, based on school capacity and LEA demand.

Delaware Year 3: School Year 2012 – 2013Race to the Top 16
Great Teachers and Leaders
Race to the Top States are developing comprehensive systems of educator effectiveness by supporting high-quality pathways for aspiring teachers and principals, ensuring equitable distribution of effective teachers and principals, improving the effectiveness of teacher and principal preparation programs, and providing effective supports to all educators. As part of these efforts, Race to the Top States are designing and implementing rigorous, transparent, and fair evaluation systems for teachers and principals; conducting annual evaluations that include timely and constructive feedback; and using evaluation information to inform professional development, compensation, promotion, retention, and tenure decisions.
Providing high-quality pathways for aspiring teachers and principalsOverall, the projects Delaware initiated to create high-quality pathways for aspiring teachers and principals have had mixed success. One project, TFA, has exceeded enrollment and retention goals. In Year 3, TFA expanded services to two new counties (Kent and Sussex), with a total of 30 corps members statewide. Two projects, the Delaware Talent Management Program (DTMP) and the DLP, have completed the associated tasks found in Delaware’s Scope of Work, but are unlikely to meet enrollment goals by the end of the grant period. The DTMP intends to combine a certified teacher talent pipeline with other human resource supports; and therefore provide human capital continuum management services to administrators. In Year 3, the DTMP partnered with seven charter schools, up from five in Year 2; however, this was three fewer schools than anticipated. Meanwhile, DLP selected five candidates for residency in Year 3 and placed six cohort 2 principals, deans, and teachers in high-need schools in SY 2012-2013, but will fall well short of the goal of placing 35-50 leaders in Delaware’s highest-need schools by SY 2013-2014. While not meeting its Race to the Top performance measures, the State believes the DLP is an important pipeline for the State’s highest-need schools. Finally, in the case of two projects in this area (STEM Residency Program and DTF), contracts have been terminated with the vendor. The Department anticipates receiving an amendment from the State on how it plans to meet the goals associated with these projects through alternative means. See Emphasis on Science, Technology, Engineering, and Mathematics (STEM) for additional details on the STEM Residency Program.
Improving teacher and principal effectiveness based on performance The State’s teacher and principal evaluation system, DPAS II, is built around five components: I) planning and preparation, II) classroom environment, III) instruction, IV) professional responsibilities, and V) student improvement. Educators are assessed annually on Components I-IV by evaluators who judge performance against standards of effective elements of practice, basing their classification of Satisfactory or Unsatisfactory on observable knowledge and skills. The number of satisfactory ratings - each educator receives either a Satisfactory or Unsatisfactory rating for each component (I-IV) - determines an
educator’s summative classification options (Highly-effective, Effective, Needs Improvement, or Ineffective), with Component V weighted so it determines the final summative rating. For instance, if an educator receives a satisfactory rating for each I-IV component, then they are eligible to receive a Highly-effective, Effective, or Needs Improvement rating, but not an Ineffective rating. In this scenario if an educator’s Component V rating was Unsatisfactory, their summative rating would be Needs Improvement. If they received a Satisfactory Component V rating, the educator’s summative rating would be Effective, while an Exceeds Component V rating would lead to a Highly-effective summative rating.
During Year 3, the State introduced three key policy changes related to DPAS II policy. Highly-effective summative ratings were utilized for the first time, educators earning an Exceeds Component V rating became eligible for a Highly-effective summative rating, and educators earning an Unsatisfactory Component V rating were eligible to receive a Needs Improvement/Ineffective summative rating. School year 2012-2013 was also the first time all evaluations included a Component V rating, whereas in Year 2 only educators from grades 3-10 ELA and mathematics received Component V ratings.
To assess LEA implementation of DPAS II during Year 3 the State audited all 19 LEAs by interviewing administrators and teachers, observing educators, and reviewing evaluator artifacts. The audits found that implementation varied by LEA, prompting the State to design “personalized support plans” for some LEAs. The plans are reviewed regularly throughout the school year, as a part of follow up visits, with extra attention provided to “intense” tier LEAs. In Year 3, the State continued to solicit feedback on DPAS II through multiple forums (e.g., Delaware Teacher of the Year Committee, Educator Focus Groups, Delaware State Education Association and Delaware Association of School Administrators Leadership Meetings, and the Delaware Principals Advisory Group). In addition, the State restructured the DPAS II Review Committee so that working groups now address areas of concern in between monthly meetings. Input from these sources led the Department, with the consent of the Delaware State Board of Education, to make amendments to Regulations 106A/107A. The revised regulations were formally adopted in July 2013 and provide evaluators more flexibility related to whether observations are announced or unannounced, while also allowing both SEAs and LEAs to certify educators as classroom observers.
Delaware Year 3: School Year 2012 – 2013Race to the Top 17
Great Teachers and Leaders
In April 2013 DDOE staff participated in RSN’s Promoting Evaluation Rating Accuracy Convening of the States, during which they analyzed their available educator evaluation rating results, drawing informed conclusions from the data sets. These findings led to the creation of an action plan to improve evaluation rating accuracy in Delaware, aided by feedback from peer States and the RSN’s Quality Evaluation Rollout (QER) Workgroup.
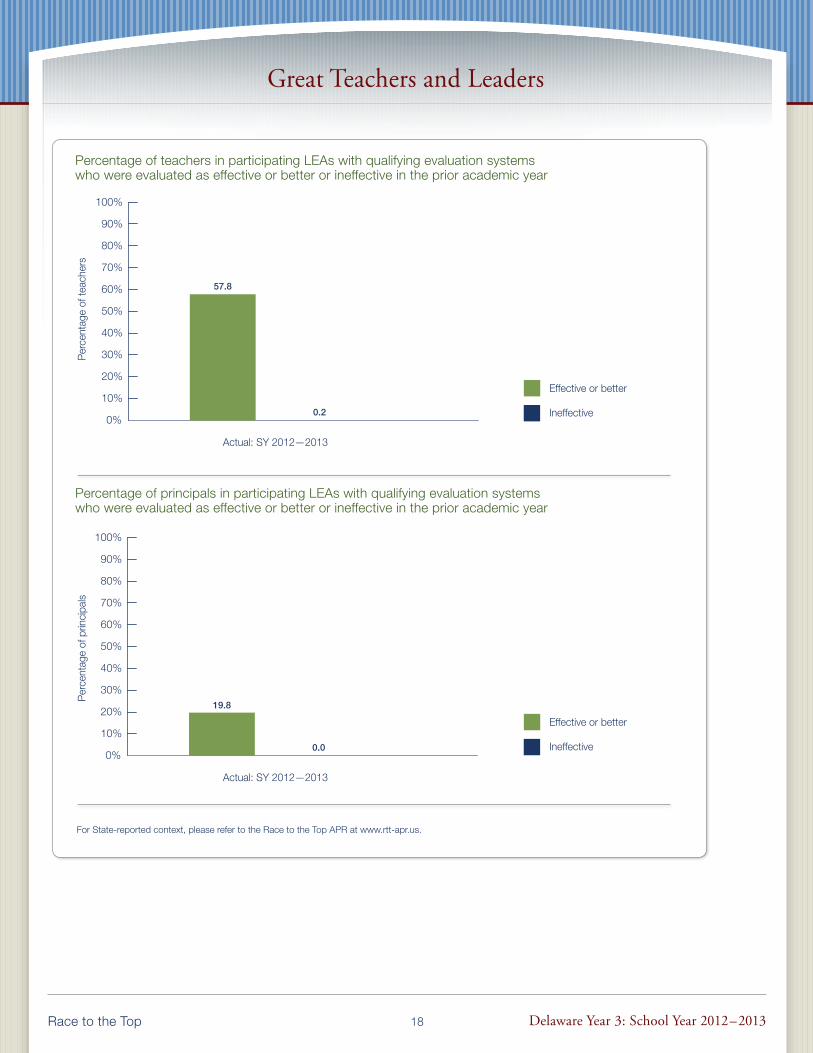
Moving into Year 4, DDOE believes principal calibration of DPAS II will be critical to accurately identify teachers and principals in need of differentiated support. In Years 2 and Year 3 of the grant, over 98 percent of teachers were rated effective or better, leaving the State and LEAs without the ability to differentiate and target support for educators based on their classroom practice. Because the process was novel for most educators in SY 2012-2013, in Year 3 the State focused on providing training and resources to principals so that they are better prepared to serve as evaluators. Some of that support of principals was realized through the deployment of 10 development coaches, who collectively supported nearly 75 schools with job-embedded coaching. Principals receiving support from development coaches have consistently shown growth in their technical usage of the DPAS II system, according to the coaches and LEA superintendents. The project will continue with seven coaches in Year 4, serving approximately 65 schools.
Ensuring equitable distribution of effective teachers and principalsThe Delaware Talent Cooperative10 was revamped by DDOE and key stakeholders during Year 3 and utilizes educator evaluation to make decisions around financial incentives and recognition in high-need schools. In fall of 2012, while no attraction bonuses were issued, DDOE recognized its first cohort of 28 educators with receipt of 50 percent of their award, based on student performance in SY 2011-2012 and their commitment to remain in their high-needs school for another two years. In Year 3, only two educators moved to a high-need school, putting Delaware well short of the SY 2014-2015 goal of 600 retention and 240 transfer bonuses issued by SY 2013-2014. While implementation has proven challenging, DDOE has continued to solicit feedback from educators to improve the program and in Year 4 plans to issue another 155 new retention bonuses in 18 participating schools who joined Cohort 2 of the Delaware Talent Cooperative.
During Year 3, DDOE made significant progress with its recruitment campaign and portal. The portal faced delays in the first two years of the grant due to a longer than expected process of gathering stakeholder feedback and the need to hire a new staff member to oversee the portal’s development. In Year 3, the State selected a vendor for the recruitment portal and hired a full time Deputy Officer of Recruitment and Selection to oversee the statewide campaign and recruitment portal. The first phase of the project launched March 1, 2013, with nine LEAs and 10 charter schools posting teaching jobs
on the portal. The State plans for the second phase to take place during Year 4 of the grant, opening the portal to another five LEAs and eight charter schools. By 2016, the State expects almost all Delaware LEAs to utilize this website, enabling prospective job candidates to use a common application and specify where they wish to pursue employment. While DDOE made significant progress in Year 3 on this project, they fell 450 users short of their SY 2012-2013 goal of 750 users.
In Year 3 Delaware continued to reward high-performing schools with 29 schools recognized through the Academic Achievement Program as of fall 2012. In response to stakeholder feedback, in Year 3 the State amended the Academic Achievement Program to align with Delaware’s ESEA flexibility request. The amendment aligned the State’s differentiated recognition, accountability, and support systems, changing the per school award amount from $150,000 to $50,000. Instead of recognizing five schools annually, up to two Reward schools and fifteen Recognition schools will now receive annual awards each fall. The determinant of both Reward and Recognition awards remains school-level achievement gap closure, although only Title I schools are eligible under the Reward category; while both Title I and non-Title I schools are now eligible under the Recognition category.
Educator recruitment portalAs a central hiring website, JoinDelawareSchools.org is designed to eliminate the need for educators to create separate applications to apply for positions in Delaware schools and LEAs. This website is part of a broader recruitment marketing campaign, which aims to attract the caliber of workforce necessary to realize Delaware’s vision of a world-class education system. Through this recruitment portal, the State intends to communicate Delaware’s K-12 vision, culture, and achievements, provide easy access to all vacancies in Delaware’s public education system, and simplify the application process so that educators who identify with the vision are compelled to join Delaware schools.
Improving the effectiveness of teacher and principal preparation programsIn Year 3, DDOE overcame delays and launched a Teacher Preparation Improvement grant program to support the expansion of successful programs. Grantees were selected in summer 2013, with pilot initiatives slated for SY 2013-2014. Seventy-five percent of Delaware programs applied for the expansion grant, exceeding the State’s goal of 50 percent. The timing of the grant program is advantageous for grantees, as it will allow them to more quickly adhere to the requirements of Senate Bill 51, signed by Delaware’s Governor in
10 Formerly the Talent Retention Bonus and Talent Attraction projects.
Delaware Year 3: School Year 2012 – 2013Race to the Top 18
Great Teachers and Leaders
Percentage of teachers in participating LEAs with qualifying evaluation systems who were evaluated as effective or better or ineffective in the prior academic year
10%
0%
20%
30%
40%
50%
60%
70%
80%
90%
100%
0.2
57.8
Per
cent
age
of te
ache
rs
Actual: SY 2012—2013
Effective or better
Ineffective
Percentage of principals in participating LEAs with qualifying evaluation systems who were evaluated as effective or better or ineffective in the prior academic year
10%
0%
20%
30%
40%
50%
60%
70%
80%
90%
100%
0.0
19.8
Per
cent
age
of p
rinci
pals
Actual: SY 2012—2013
Effective or better
Ineffective
For State-reported context, please refer to the Race to the Top APR at www.rtt-apr.us.
Delaware Year 3: School Year 2012 – 2013Race to the Top 19
Great Teachers and Leaders
June 2013 and amended under Title IV of the Delaware Code related to Educator Licensure, Certification, and Preparation Programs. The bill increases teacher preparation program standards for program admission and mandates that DDOE monitor the performance of program graduates in Delaware schools.
The need for reform in the area of teacher preparation was highlighted by DDOE’s Human Capital Analytics publications, which provided information to State educator leaders so they better understood the market for educators in Delaware, informing subsequent changes to Delaware’s teacher licensure and preparation systems in the State. Through a partnership with the Harvard Strategic Data Project, the State hosted a Harvard Strategic Data Fellow, who produced a Human Capital Diagnostic report that will help improve Delaware policies and practices in educator recruitment, placement, development, evaluation, and retention. In Year 4, the State will continue using the report findings to inform teacher preparation program policy. In addition, as part of the State’s Human Capital Analytics work, in Year 3, more than 6,000 Delaware educators responded to the Teaching, Empowering, Leading and Learning (TELL) Delaware survey.11
Providing effective support to teachers and principalsDDOE’s School Administration Managers (SAMs) initiative deployed SAMs in 28 schools in Year 3. This service provides school-based leadership with time-tracking software, feedback on time management, and administrative support to make their primary focus instructional leadership. Participating schools select one of two SAMs models. The most commonly selected model provides time-tracking software for the school, along with a stipend and training for the building’s existing administrative assistant. The other model funds a full-time position to take on operational responsibilities, allowing the principal to spend more time on instructional leadership activities. Overall, in Year 3, data on the principals’ use of time for instruction improved.
School Leadership Coaches provide support to school principals in high-need schools and novice principals through intensive research-based leadership training. School Leadership Coaches design the training and support for each of the identified areas of need, which could include financial management, instructional leadership, teacher observation, and/or time management practices. Two cohorts of 20 school leaders each work with coaches for 12 months onsite followed by six months of regional support. In Year 3, the coaches continued working with the first cohort of school leaders online, while providing onsite support to the second cohort of 17 schools. The State plans to continue supporting a subset of the second cohort for six months in SY 2013-2014. Survey results found that principals participating in this work felt strongly supported by their leadership coach and have gained confidence in their abilities as a leader as a result of coaching. However, DDOE found that the initiative did not deliver the type of focus that other school leadership coaching initiatives provided, such as Development Coaches that focus on DPAS-II implementation.
DDOE’s Professional Development Certification System is used to review LEA professional development plans to ensure that they are high-quality and high-impact. DDOE requires LEAs to submit professional development plans for approval each year through its consolidated grant application process. In addition to conducting the review and certification of professional development plans, during Year 3, the State planned to create an evaluation system to assess the delivery and outcomes of professional development offerings, using online evaluations, student achievement data, and educator evaluation data to demonstrate impact on participant behaviors and student achievement. This evaluation and analysis is in process but was not completed in Year 3. Currently the State depends on a less robust substitute for impact data. While the State has created an approval process and 100 percent of its professional development has been
“certified” through this process, DDOE has not created clear principles or performance metrics for this initiative and is not meeting its goal of measuring and tracking the impact of professional development on student and teacher outcomes. The State has also not determined areas where the type and/or quality of professional development implementation could be improved.
Successes, challenges, and lessons learnedDelaware has invested in revising its DPAS II system as an essential component of the State’s efforts to offer its students a quality education by ensuring educators and evaluators have ongoing, meaningful dialogue about classroom performance and student growth. During Year 3, DDOE focused on full implementation of the DPAS II system, particularly the newly reformed Component V. In studying the first year of full implementation of this system, DDOE found significant progress in implementing and institutionalizing appraisals of professional practice through student growth. At the same time, the results do not show a meaningful level of differentiation in the traditional teacher evaluation metrics (Components I-IV), which resulted in overall ratings that showed little variation in teacher quality. The State metric for Component V demonstrated more variation than in previous years, but DDOE is taking steps to improve DPAS II implementation in Year 4 and beyond.
Overall, the projects Delaware initiated to create high-quality pathways for aspiring teachers and principals, as well as those to address equitable distribution of effective teachers and principals, have had mixed success. The State has not yet amended its approach to meet its goals for creating alternative pathways for teachers and principals in light of the challenges faced in several of these projects. While the State has made progress in realizing the goals for its recruitment campaign and portal, timelines for the work in the Delaware Talent Cooperative have been substantially delayed due to competing priorities and other external factors, and participation goals have not been met. The State is working to address the delays, with a focus on raising awareness and access to the Delaware Talent Cooperative opportunity.
11 See http://www.telldelaware.org/results for Year 3 Teaching, Empowering, Leading and Learning (TELL) Delaware survey results.

Delaware Year 3: School Year 2012 – 2013Race to the Top 20
Great Teachers and Leaders
Delaware’s Race to the Top plan calls for significant investments in coaching for both teachers and school leaders. While implementation of these initiatives appears to be somewhat strong, DDOE reports it has not yet administered the appropriate survey tools or created the requisite data systems to accurately report on whether the State met its goals for providing effective support for its teachers and leaders. While professional development offerings are certified through the State’s process and the majority of principals have received coaching through the SAMs, Development Coaches, School Leadership Coaches or Vision Network initiatives, it remains unclear whether all participating LEAs show a coherent approach to professional development and which of the initiatives is improving the effectiveness of teachers and leaders in the State.
As part of the State’s Human Capital Analytics work, in Year 3 Delaware conducted the TELL Delaware survey, with 6,153 Delaware educators submitting responses, accounting for 59.2 percent of all Delaware educators. Of those responding, the majority of teachers feel their schools are a good place to work and learn, feel trusted and recognized for their expertise, have the time they need to collaborate with peers, and believe their school environments are safe. Delaware significantly exceeded its goal of 40 percent of respondents citing significant improvements in teaching and learning conditions. But the survey also revealed that more work is needed to improve teacher leadership opportunities, differentiate professional development to individual educator needs, reduce the amount of routine paperwork and improve educator induction and mentoring across the state. DDOE has committed to using this feedback alongside the State’s other data sources to examine and evaluate State policy and programs for improvement.
Turning Around the Lowest-Achieving Schools
Race to the Top States are supporting LEAs’ implementation of far-reaching reforms to turn around lowest-achieving schools by implementing one of four school intervention models.12
Partnership Zone schoolsDelaware based its intervention efforts in low-performing schools around its PZ. The PZ is composed of schools that the State identified as its lowest-achieving. The State funds the PZ through a combination of Race to the Top funds, School Improvement Grants (SIG), and State funding. With the assistance of the State’s STU, PZ schools are required to implement one of four intervention models.
The State approved 10 PZ school intervention plans and signed a MOU with each school—four in Cohort I in Year 1 and six in Cohort II in Year 2. Since being designated as a PZ school, the majority of these schools have shown improvement in reading and mathematics. All of the Cohort I schools made gains from 2011 (their planning year) to 2013 in reading and mathematics; however, between 2012 and 2013, three of the four schools showed regression in ELA performance, and two showed regression in mathematics performance. One PZ school showed no change from 2012 to 2013. Positive Outcomes Charter School (the fourth Cohort I PZ school) showed particularly strong gains in ELA; they increased by 18 percentage points from 2012 to 2013 and 31 percentage points from 2011 to 2013. Of the six
Cohort II schools, four showed gains in ELA from 2012 to 2013, one showed a significant decline (24 points), and one showed no change. Only two Cohort II schools showed gains in mathematics, three showed declines, and one showed no change.
Supporting school leadershipDDOE faced and addressed STU capacity concerns during Year 3, as every STU staff member departed DDOE. When the STU was reconstituted, new leadership started to evaluate the unit’s role at DDOE and how they could best support improvement of Delaware’s highest-need schools. This process resulted in a re-visioning of the STU, one that necessarily bound the commitments found in Delaware’s Race to the Top plan with the vision of new leadership. In this case, the RSN provided technical assistance so that STU leaders were able to incorporate knowledge from leading practitioners and States in the area of school intervention. The STU brought this knowledge to bear as they crafted a strategic plan aligned with both Delaware’s ESEA flexibility request and Race to the Top plans.
12 Race to the Top States’ plans include supporting their LEAs in turning around the lowest-achieving schools by implementing one of the four school intervention models:
• Turnaround model: Replace the principal and rehire no more than 50 percent of the staff and grant the principal sufficient operational flexibility (including in staffing, calendars/time and budgeting) to fully implement a comprehensive approach to substantially improve student outcomes.
• Restart model: Convert a school or close and reopen it under a charter school operator, a charter management organization, or an education management organization that has been selected through a rigorous review process.
• School closure: Close a school and enroll the students who attended that school in other schools in the district that are higher achieving.
• Transformation model: Implement each of the following strategies: (1) replace the principal and take steps to increase teacher and school leader effectiveness, (2) institute comprehensive instructional reforms, (3) increase learning time and create community-oriented schools, and (4) provide operational flexibility and sustained support.
Delaware Year 3: School Year 2012 – 2013Race to the Top 21
Turning Around the Lowest-Achieving Schools
In Year 3, the STU continued Comprehensive School Reviews (CSRs) for all 10 schools in the PZ. Through this process, the STU required each school to create a detailed project plan with clear targets and objectives for implementing its intervention model. As part of the CSR, in Year 3 the STU monitored the four Cohort I PZ schools through a bimonthly school reporting cycle and regular onsite DDOE monitoring. Each school report, monitoring visit, and subsequent STU report to school leaders, focused on eight elements of school performance (Leadership, Budget and Resources, Teacher and Student Class Assignment, Curriculum and Instruction, Assessment and Accountability, Professional Development, School Environment, and Parents and Community). The CSR process also included monthly STU onsite reviews for the six Cohort II PZ schools. These visits allowed the STU to review school plan progress, aligned to the eight elements of school performance, and provide technical assistance to school leaders based on the areas of need identified in previous CSRs. DDOE also used a PZ school dashboard to compare each PZ school’s performance with schools across the State. The dashboard also provided data to PZ schools, allowing school leaders to make informed decisions when attempting to adjust practices to improve student achievement.
Successes, challenges, and lessons learnedAs a result of its work with these PZ 10 schools, DDOE reported that the schools followed the agreed upon plans and provided the STU with the established status reports and other documentation indicated in the MOU. However, the STU has indicated that although school plan implementation has been somewhat strong, and some of the PZ schools have made adequate yearly progress for two years, they are concerned that the schools have not truly transformed. As the STU considered new success metrics, they have been supported by multiple types of RSN outreach, with STU leadership participating in the School Turnaround workgroups on Human Capital and Evaluating School Turnaround in fall 2012 and spring 2013 and the Performance Management for School Turnaround Programs workgroup in summer 2013. Additionally, through RSN’s Individualized Technical Assistance support the STU is developing a strategy to revise their monitoring and data collection protocols to allow for better monitoring of implementation benchmarks and student outcomes. In April 2013 the STU presented some of their early findings during the Evaluating Turnaround Efforts Work Group on Using Data to Support Turnaround Efforts webinar, sharing how they are interpreting data from leading indicators to engage in robust conversations with stakeholders.
Emphasis on Science, Technology, Engineering, and Mathematics (STEM)
Race to the Top States are committed to providing a high-quality plan with a rigorous course of study in STEM. In doing so, each State must cooperate with STEM-capable community partners in order to prepare and assist teachers in integrating STEM content across grades and disciplines, in promoting effective and relevant instruction, and in offering applied learning opportunities for students. A focus on STEM furthers the goal of preparing more students for an advanced study in sciences, technology, engineering, and mathematics, including among underrepresented groups such as female students.
State’s STEM initiativesThe STEM Council is a diverse group of stakeholders and educators from across the State that works to identify STEM priorities and recommend improvements in an effort to better STEM education statewide. During Year 3, the STEM Council has positioned itself as the facilitating body between the pre-K-12 system, the IHEs, and the Delaware business community. To support this transition the State appointed a new STEM Council co-chair in September 2012, allocated two supporting positions from the Governor’s office, and created a dedicated STEM Coordinator position at DDOE. In Year 3, the State also formed the STEM Business Network, led by seven founding companies and designed to connect businesses more directly with classroom teachers and their students. To promote these new resources, DDOE developed and launched a STEM Council website,
www.delawarestem.org, promoted by the STEM Council and through social media networks. The Council also published a SY 2012-2013 comprehensive report, which highlighted progress toward meeting their goals of expanding the number of Delaware students who ultimately pursue advanced degrees and careers in STEM fields and broaden the participation of women and minorities in these fields, expanding the STEM capable workforce to create, grow and attract STEM-related businesses to Delaware, and increasing STEM literacy for all Delaware students including those who pursue non-STEM related careers, but need STEM skills.
DDOE partnered with the University of Delaware to create the STEM Residency Program. This teacher preparation pathway for aspiring teachers included recruitment, pre-service training, and one-year residency placements. The program is intended to target candidates
Delaware Year 3: School Year 2012 – 2013Race to the Top 22
Emphasis on Science, Technology, Engineering, and Mathematics (STEM)
with strong content or professional backgrounds in STEM disciplines. Upon completing the program, residents receive a Masters of Arts in Teaching and are placed in traditionally hard-to-staff schools. In Year 3, due to low enrollment and inadequate vendor project implementation, DDOE discontinued the STEM Residency Program prior to a planned Cohort 4. Cohorts 1-3 will complete the program and the Department anticipates receiving an amendment from the State to meet the goals associated with this project through alternative routes.
Successes, challenges, and lessons learnedThe Year 3 highlights for the STEM Council include forming the STEM Business Network, publishing a SY 2012-2013 report
highlighting progress toward key goals, and developing and launching a STEM Council website. Although the creation of these resources is a positive step forward, the value of these tools to STEM educators remains to be seen, as DDOE has reported limited usage thus far.13
The STEM Residency Program was cancelled after three cohorts because enrollment was falling dramatically short of expectations, as only 28 non-traditional candidates were part of cohorts 1-3. DDOE believes a host of factors explain the outcome, including insufficient planning time, lack of LEA engagement, and inadequate vendor project administration.
Looking Ahead to Year 4
In Year 4, Delaware plans to stabilize recent advances in teacher pipeline reforms and to institutionalize PLCs, all while navigating the transition to Smarter Balanced assessments. Successful implementation of Smarter Balanced assessments will require LEAs to address technology capacity concerns as part of the SY 2013-2014 field test. DDOE also faces the continued challenge of effectively supporting teachers and leaders as they implement DPAS II, as SY 2013-2014 will be Delaware educators’ second year of full implementation. Instead of serving as a resource to educators seeking to understand the components of DPAS II, DDOE’s challenge in Year 4 will be to shift department resources so that educators are supported as they seek to utilize DPAS II feedback to improve their practice and student outcomes. This shift will include an increased emphasis on improving training and resources for principals so they can be more effective and
accurate evaluators. Concurrent with this shift will be the next phase of the Common Ground for the Common Core, a program that intends to help schools plan for and fully implement the CCSS. During the SY 2013-2014, schools participating in the Common Ground for the Common Core program are tasked with carrying out their CCSS implementation plans, with DDOE monitoring and evaluating their quality of implementation. Finally, in order for Delaware to sustain the reforms initiated through Race to the Top, DDOE will engage with RSN’s Sustainability Workgroup in Year 4 to identify how to solidify the changes initiated in Years 1 through 3. DDOE’s internal budget and policy planning processes will occur in parallel, as DDOE seeks to align best practices, performance management routines, and financial resources with Delaware’s ESEA flexibility request.
Budget
For the State’s expenditures through June 30, 2013, please see the APR Data Display at http://www.rtt-apr.us.
For State budget information, see http://www2.ed.gov/programs/racetothetop/state-scope-of-work/index.html.
For the State’s fiscal accountability and oversight report, see http://www2.ed.gov/programs/racetothetop/performance-fiscal-accountability.html.
13 As of March 1, 2013 the STEM website, stem.delaware.gov had not been updated since its initial launch, did not include any committee reports, and had announced the new STEM chair. As of August 14, 2013, an updated STEM website linked to a @delawarestem Twitter feed, which had 12 followers.
Delaware Year 3: School Year 2012 – 2013Race to the Top 23
Glossary
Alternative routes to certification: Pathways to certification that are authorized under the State’s laws or regulations that allow the establishment and operation of teacher and administrator preparation programs in the State, and that have the following characteristics (in addition to standard features such as demonstration of subject-matter mastery, and high-quality instruction in pedagogy and in addressing the needs of all students in the classroom including English learners and students with disabilities): (1) can be provided by various types of qualified providers, including both institutions of higher education (IHEs) and other providers operating independently from institutions of higher education; (2) are selective in accepting candidates; (3) provide supervised, school-based experiences and ongoing support such as effective mentoring and coaching; (4) significantly limit the amount of coursework required or have options to test out of courses; and (5) upon completion, award the same level of certification that traditional preparation programs award upon completion.
Amendment requests: In the event that adjustments are needed to a State’s approved Race to the Top plan, the grantee must submit an amendment request to the Department for consideration. Such requests may be prompted by an updated assessment of needs in that area, revised cost estimates, lessons learned from prior implementation efforts, or other circumstances. Grantees may propose revisions to goals, activities, timelines, budget, or annual targets, provided that the following conditions are met: the revisions do not result in the grantee’s failure to comply with the terms and conditions of this award and the program’s statutory and regulatory provisions; the revisions do not change the overall scope and objectives of the approved proposal; and the Department and the grantee mutually agree in writing to the revisions. The Department has sole discretion to determine whether to approve the revisions or modifications. If approved by the Department, a letter with a description of the amendment and any relevant conditions will be sent notifying the grantee of approval. (For additional information please see http://www2.ed.gov/programs/racetothetop/amendments/index.html.)
America COMPETES Act elements: The twelve indicators specified in section 6401(e)(2)(D) of the America COMPETES Act are: (1) a unique statewide student identifier that does not permit a student to be individually identified by users of the system; (2) student-level enrollment, demographic, and program participation information; (3) student-level information about the points at which students exit, transfer in, transfer out, drop out, or complete P–16 education programs; (4) the capacity to communicate with higher education data systems; (5) a State data audit system assessing data quality, validity, and reliability; (6) yearly test records of individual students with respect to assessments under section 1111(b) of the Elementary and Secondary Education Act (ESEA) (20 U.S.C. 6311(b)); (7) information on students not tested by grade and subject; (8) a teacher identifier system with the ability to match teachers to students; (9) student-level transcript information, including information on courses completed and grades earned; (10) student-level college-readiness test scores; (11) information regarding the extent to which students transition successfully from secondary
school to postsecondary education, including whether students enroll in remedial coursework; and (12) other information determined necessary to address alignment and adequate preparation for success in postsecondary education.
American Recovery and Reinvestment Act of 2009 (ARRA): On February 17, 2009, President Obama signed into law the ARRA, historic legislation designed to stimulate the economy, support job creation, and invest in critical sectors, including education. The Department of Education received a $97.4 billion appropriation.
Annual Performance Report (APR): Report submitted by each grantee with outcomes to date, performance against the measures established in its application, and other relevant data. The Department uses data included in the APRs to provide Congress and the public with detailed information regarding each State’s progress on meeting the goals outlined in its application. The annual State APRs are found at www.rtt-apr.us.
College- and career-ready standards: State-developed standards that build toward college and career readiness by the time students graduate from high school.
Common Core State Standards (CCSS): Kindergarten through twelfth grade (K-12) English language arts and mathematics standards developed in collaboration with a variety of stakeholders including governors, chief State school officers, content experts, teachers, school administrators, and parents. (For additional information, please see http://www.corestandards.org/).
The education reform areas for Race to the Top: (1) Standards and Assessments: Adopting rigorous college- and career-ready standards and assessments that prepare students for success in college and career; (2) Data Systems to Support Instruction: Building data systems that measure student success and support educators and decision-makers in their efforts to improve instruction and increase student achievement; (3) Great Teachers and Great Leaders: Recruiting, developing, retaining, and rewarding effective teachers and principals; and (4) Turning Around the Lowest-Achieving Schools: Supporting local educational agencies’ (LEAs’) implementation of far-reaching reforms to turn around lowest-achieving schools by implementing school intervention models.
Effective teacher: A teacher whose students achieve acceptable rates (e.g., at least one grade level in an academic year) of student growth (as defined in the Race to the Top requirements). States, LEAs, or schools must include multiple measures, provided that teacher effectiveness is evaluated, in significant part, by student growth (as defined in the Race to the Top requirements). Supplemental measures may include, for example, multiple observation-based assessments of teacher performance.
High-minority school: A school designation defined by the State in a manner consistent with its Teacher Equity Plan. The State should provide, in its Race to the Top application, the definition used.
Delaware Year 3: School Year 2012 – 2013Race to the Top 24
Glossary
High-poverty school: Consistent with section 1111(h)(1)(C)(viii) of the ESEA, a school in the highest quartile of schools in the State with respect to poverty level, using a measure of poverty determined by the State.
Highly effective teacher: A teacher whose students achieve high rates (e.g., one and one-half grade levels in an academic year) of student growth (as defined in the Race to the Top requirements). States, LEAs, or schools must include multiple measures, provided that teacher effectiveness is evaluated, in significant part, by student growth (as defined in the Race to the Top requirements). Supplemental measures may include, for example, multiple observation-based assessments of teacher performance or evidence of leadership roles (which may include mentoring or leading professional learning communities) that increase the effectiveness of other teachers in the school or LEA.
Instructional improvement systems (IIS): Technology-based tools and other strategies that provide teachers, principals, and administrators with meaningful support and actionable data to systemically manage continuous instructional improvement, including such activities as instructional planning; gathering information (e.g., through formative assessments (as defined in the Race to the Top requirements), interim assessments (as defined in the Race to the Top requirements), summative assessments, and looking at student work and other student data); analyzing information with the support of rapid-time (as defined in the Race to the Top requirements) reporting; using this information to inform decisions on appropriate next instructional steps; and evaluating the effectiveness of the actions taken. Such systems promote collaborative problem-solving and action planning; they may also integrate instructional data with student-level data such as attendance, discipline, grades, credit accumulation, and student survey results to provide early warning indicators of a student’s risk of educational failure.
Invitational priorities: Areas of focus that the Department invited States to address in their Race to the Top applications. Applicants did not earn extra points for addressing these focus areas, but many grantees chose to create and fund activities to advance reforms in these areas.
Involved LEAs: LEAs that choose to work with the State to implement those specific portions of the State’s plan that necessitate full or nearly-full statewide implementation, such as transitioning to a common set of K-12 standards (as defined in the Race to the Top requirements). Involved LEAs do not receive a share of the 50 percent of a State’s grant award that it must subgrant to LEAs in accordance with section 14006(c) of the ARRA, but States may provide other funding to involved LEAs under the State’s Race to the Top grant in a manner that is consistent with the State’s application.
No-Cost Extension Amendment Request: A no-cost extension amendment request provides grantees with additional time to spend their grants (until September 2015) to accomplish the reform goals, deliverables and commitments in its Race to the Top application and approved Scope of Work. A grantee may make a no-cost extension amendment request to extend work beyond the final project year, consistent with the Amendment Principles (http://www2.ed.gov/programs/racetothetop/grant-amendment-submission-process-oct-4-2011.pdf ) as well as the additional elements outlined in the Department Review section of the Amendment Requests with No Cost Extension Guidance and Principles document (http://www2.ed.gov/programs/racetothetop/no-cost-extenstion-submission-process.pdf).
Participating LEAs: LEAs that choose to work with the State to implement all or significant portions of the State’s Race to the Top plan, as specified in each LEA’s agreement with the State. Each participating LEA that receives funding under Title I, Part A will receive a share of the 50 percent of a State’s grant award that the State must subgrant to LEAs, based on the LEA’s relative share of Title I, Part A allocations in the most recent year at the time of the award, in accordance with section 14006(c) of the ARRA. Any participating LEA that does not receive funding under Title I, Part A (as well as one that does) may receive funding from the State’s other 50 percent of the grant award, in accordance with the State’s plan.
The Partnership for Assessment of Readiness for College and Careers (PARCC): One of two consortia of States awarded grants under the Race to the Top Assessment program to develop next-generation assessment systems that are aligned to common K-12 English language and mathematics standards and that will accurately measure student progress toward college and career readiness. (For additional information please see http://www.parcconline.org/.)
Persistently lowest-achieving schools: As determined by the State, (1) any Title I school in improvement, corrective action, or restructuring that (a) is among the lowest-achieving five percent of Title I schools in improvement, corrective action, or restructuring or the lowest-achieving five Title I schools in improvement, corrective action, or restructuring in the State, whichever number of schools is greater; or (b) is a high school that has had a graduation rate as defined in 34 CFR 200.19(b) that is less than 60 percent over a number of years; and (2) any secondary school that is eligible for, but does not receive, Title I funds that (a) is among the lowest-achieving five percent of secondary schools or the lowest-achieving five secondary schools in the State that are eligible for, but do not receive, Title I funds, whichever number of schools is greater; or (b) is a high school that has had a graduation rate as defined in 34 CFR 200.19(b) that is less than 60 percent over a number of years. To identify the lowest-achieving schools, a State must take into account both (1) the academic achievement of the “all students” group in a school in terms of proficiency on the State’s assessments under section 1111(b)(3) of the ESEA in reading/language arts and mathematics combined; and (2) the school’s lack of progress on those assessments over a number of years in the “all students” group. (For additional information please see http://www2.ed.gov/programs/sif/index.html.)
Delaware Year 3: School Year 2012 – 2013Race to the Top 25
Glossary
Qualifying evaluation systems: Educator evaluation systems that meet the following criteria: rigorous, transparent, and fair evaluation systems for teachers and principals that: (1) differentiate effectiveness using multiple rating categories that take into account data on student growth as a significant factor, and (2) are designed and developed with teacher and principal involvement.
Reform Support Network (RSN): In partnership with the Implementation and Support Unit (ISU), the RSN offers collective and individualized technical assistance and resources to grantees of the Race to the Top education reform initiative. The RSN’s purpose is to support the Race to the Top grantees as they implement reforms in education policy and practice, learn from each other and build their capacity to sustain these reforms.
The School Improvement Grants (SIG) program is authorized under section 1003(g) of Title I of the ESEA. Funds are awarded to States to help them turn around persistently lowest-achieving schools. (For additional information please see http://www2.ed.gov/programs/sif/index.html.)
School intervention models: A State’s Race to the Top plan describes how it will support its LEAs in turning around the lowest-achieving schools by implementing one of the four school intervention models:
• Turnaround model: Replace the principal and rehire no more than 50 percent of the staff and grant the principal sufficient operational flexibility (including in staffing, calendars/time and budgeting) to fully implement a comprehensive approach to substantially improve student outcomes.
• Restart model: Convert a school or close and reopen it under a charter school operator, a charter management organization, or an education management organization that has been selected through a rigorous review process.
• School closure: Close a school and enroll the students who attended that school in other schools in the district that are higher achieving.
• Transformation model: Implement each of the following strategies: (1) replace the principal and take steps to increase teacher and school leader effectiveness, (2) institute comprehensive instructional reforms, (3) increase learning time and create community-oriented schools, and (4) provide operational flexibility and sustained support.
Single sign-on: A user authentication process that permits a user to enter one name and password in order to access multiple applications.
The SMARTER Balanced Assessment Consortium (Smarter Balanced): One of two consortia of States awarded grants under the Race to the Top Assessment program to develop next-generation assessment systems that are aligned to common K-12 English language and mathematic standards and that will accurately measure student progress toward college and career readiness. (For additional information please see http://www.k12.wa.us/SMARTER/default.aspx.)
The State Scope of Work: A detailed document for the State’s projects that reflects the grantee’s approved Race to the Top application. The State Scope of Work includes items such as the State’s specific goals, activities, timelines, budgets, key personnel, and annual targets for key performance measures. (For additional information please see http://www2.ed.gov/programs/racetothetop/state-scope-of-work/index.html.) Additionally, all participating LEAs are required to submit Scope of Work documents, consistent with State requirements, to the State for its review and approval.
Statewide longitudinal data systems (SLDS): Data systems that enhance the ability of States to efficiently and accurately manage, analyze, and use education data, including individual student records. The SLDS help States, districts, schools, educators, and other stakeholders to make data-informed decisions to improve student learning and outcomes, as well as to facilitate research to increase student achievement and close achievement gaps. (For additional information please see http://nces.ed.gov/Programs/SLDS/about_SLDS.asp.)
Student achievement: For the purposes of this report, student achievement (1) for tested grades and subjects is (a) a student’s score on the State’s assessments under the ESEA; and, as appropriate, (b) other measures of student learning, such as those described in number (2) of this definition, provided they are rigorous and comparable across classrooms; and (2) for non-tested grades and subjects, alternative measures of student learning and performance such as student scores on pre-tests and end-of-course tests; student performance on English language proficiency assessments; and other measures of student achievement that are rigorous and comparable across classrooms.
Student growth: The change in student achievement (as defined in the Race to the Top requirements) for an individual student between two or more points in time. A State may also include other measures that are rigorous and comparable across classrooms.
Value-added models (VAMs): A specific type of growth model based on changes in test scores over time. VAMs are complex statistical models that generally attempt to take into account student or school background characteristics in order to isolate the amount of learning attributable to a specific teacher or school. Teachers or schools that produce more than typical or expected growth are said to “add value.”