Embed Size (px)
Citation preview
2013-2014 DPAS II Evaluation Report i June 2014
Delaware Performance Appraisal System Second Edition (DPAS II)
Year 7 Report June 2014
Submitted By: Dr. Donald E. Beers
Principal Investigator
228 S. La Grange Road La Grange, IL. 60525
www.progresseducation.com
2013-2014 DPAS II Evaluation Report i June 2014
TABLE OF CONTENTS Executive Summary ................................................................................... 1
Background .................................................................................................................1
Summary of Results ...................................................................................................2 Teachers....................................................................................................................2 Specialists..................................................................................................................2 Administrators............................................................................................................2
General Findings.........................................................................................................3
Introduction ................................................................................................ 5
Educator Recommendations .................................................................... 6
Focus Groups..............................................................................................................6
Recommendations ......................................................................................................7
Methods ...................................................................................................... 8
Methodology................................................................................................................8 Surveys......................................................................................................................8 Interviews.................................................................................................................11 Focus Groups ..........................................................................................................11
Results ...................................................................................................... 12
Teachers ....................................................................................................................12 Specialists Results ...................................................................................................25
Administrators and Evaluators................................................................................31
Appendix................................................................................................... 39
Teacher Interview Questions ...................................................................................39
Specialist Interview Items ........................................................................................40 Administrator Interview Items..................................................................................41
2013-2014 DPAS II Evaluation Report 1 June 2014
EXECUTIVE SUMMARY
Background
The Delaware State Department of Education presented a very clear expectation for the evaluation of DPAS II. The stated goals of DPAS II are equally specific as stated on the Department of Education’s website, the purpose of DPAS II is two-fold: Quality assurance Professional growth Quality assurance focuses on the collection of credible evidence about the performance of educators. Evaluators use this evidence to make important decisions: recognizing effective practice, recommending continued employment, recommending an improvement plan, or beginning dismissal proceedings. Professional growth focuses on enhancing the skills and knowledge of educators. Through self-assessment and goal-setting, working with colleagues, taking courses, attending workshops, designing new programs, piloting new programs or approaches, developing proficiency in test data analysis, and many other learning opportunities, educators improve their professional practice in ways that will contribute to improved student learning. Both purposes serve accountability: to assure that educators are performing at an acceptable level and to provide professional growth opportunities that improve skills and knowledge. The goal of this evaluation was to determine the reality of the current condition in meeting the stated goals. The majority of the findings center on the practices and processes of DPAS II. The practices provide an understanding of the quality of training, manuals, forms, and general deployment. The processes stem from fundamental policies and underlying theory about performance appraisal. This report is divided into four major sections: Executive Summary, Recommendations, Methods, and Results. Contained in these sections are the specific data collected and the methodologies used for analysis. The recommendations are very specific and tied to the major findings of the data collection process described under Results. The concept of “walk-throughs,” though not an official part of DPAS II, is common terminology for short duration, targeted and frequent observations. The term was used frequently in the interview and focus group sessions.
Summary of Results
Teachers • The majority of teachers gave the DPAS II process a grade of “C”. • The survey shows teachers are split (52% to 48%) on whether the system is fair
and equitable. • Interviews and focus groups indicated that DCAS testing and component V
carries too much weight in the process causing almost half the teachers to consider the process not fair when responding to the survey..
• A large majority of teachers hold a positive view of Components I-IV. • A large majority of the teachers believe planning and preparation, classroom
environment, and instruction are the key components. • Teachers responded (70%) on the survey that DPAS II should not be continued
in its current form. Interviews and focus group discussions indicated a continued need for streamlining the process.
• The majority believes the evaluation process should be differentiated based on an educator’s years of experience and role.
• Walk-throughs are beneficial to the practice of teaching according to 66% of teachers. 76% believe the feedback is beneficial.
• Teachers spoke positively of the attempt at providing flexibility to the “Student Performance” aspect of DPAS II by allowing multiple measures as an example.
• Quantitative and qualitative results both supported that teachers like the feedback they received from various aspects of the process.
Specialists • The majority of specialists do not like the DPAS process because they believe
student improvement is not relevant to their work. This is evidenced by 78% disagreeing that the process should be continued in its current form.
• Specialists believe good indicators of performance are “Planning and Preparation,” “Professional Practice and Delivery of Service,” “Professional Collaboration and Consultation, “Professional Responsibilities.”
• The website was informative according to the majority of specialists and resources were adequate.
• An overwhelming majority of specialists believe that the evaluation process should be based on their role.
Administrators • Administrators made positive statements during interviews and focus groups
concerning regulatory changes to DPAS II process.
• During interviews and focus groups, administrators voiced concerns with the weighting of component V.
• The five components, which they believe are good indicators of performance are, “Vision and Goals,” “Culture of Learning,” and “Management.”
• Administrators (over 70%) believe that conferencing is excellent and has contributed to improving practice.
• The majority (63%) of administrators responded that DPAS II does positively impact their practice. The qualitative results indicated that the walk-throughs, conferencing, and unannounced observations were the main reasons.
• Administrators believe that the evaluation process should be differentiated based on an educator’s years of experience (72%) and role (91%).
• Administrators are positive about Bloomboard and the potential to save time and provide timely feedback.
• During interviews and focus groups, administrators reported teachers under an improvement plan take 5-10 times the number of hours to manage than other staff.
General Findings
• A grade of “C” was given by a majority of the respondents. • Indicators of performance also are similar to previous years. Environment,
instruction, planning, culture, delivery of service, and management rank high on the survey by respondents.
• Unannounced observations were reported to have more value for all groups this year. This is a shift from last year where administrators saw more value in these types of observation. Teachers and specialists now see increased value in the unannounced and walk-through (51%) observations.
• Walk-through observations provide valuable feedback for 66% of teachers and 76% believe the written feedback is useful.
• The scope of unannounced observations is too broad. The majority of teachers (72%) and administrators (73%) believe the unannounced observations should focus on limited criteria.
• There is general agreement (surveys and interviews) Components I-IV add value to the practice of educating students.
• Professional Responsibilities component, favorable rating jumped 11% in the current survey
• Most respondents (focus groups and interviews) believe component V is weighted improperly and impacts the overall rating inappropriately. 26.9% of teachers responded on the survey that Component V can be judged fairly.
• The demands of improvement plans on administrators are costly in time and effort as it is currently implemented. Students may be exposed to poor practice for too long, risking student progress.
• Technology exists but is not being fully utilized to improve feedback, and streamline the process.
• During a teacher’s summative year evaluation, use data from previous as well as current year.
• During interviews and focus groups, many participants expressed their belief that the rating system and weight of component 5 on an individual’s rating, has negatively impacted the expressed desire for reflective practice.
• Over half of the administrators indicated on the survey that additional credentialed observers would improve the process.
2013-2014 DPAS II Evaluation Report 5 June 2014
INTRODUCTION
The purpose of the DPAS II annual process evaluation was to collect and compile data in order to make recommendations relating to the effectiveness and usability of the DPAS II process. The 2013-2014 school year was the sixth year of statewide implementation for DPAS II. Progress Education Corporation was contracted by the Delaware Department of Education as a third-party evaluator to conduct all aspects of the evaluation. Upon receiving notification of being selected as the evaluator, the staff at Progress Education Corporation immediately began gathering contextual information, studying current manuals, and researching historical and new documents. Progress Education staff held conference calls and visited the Delaware Department of Education to gain further insight into any new expectations for the evaluation. Due to changes with DPAS II, new survey items were created and vetted by key staff members of the evaluation team and Delaware Department of Education. Building upon the work that had already been done by the 1998 DPAS Revision Task Force and the DPAS II Advisory Committee, and following the evaluation questions as written in the original DPAS II evaluation RFP, Progress Education Corporation developed and administered surveys, conducted interviews, and facilitated focus groups for teachers, specialists, administrators, and evaluators. All data collection forms (i.e. surveys, interview guides, and focus group questions) were created to provide ample information related to the DPAS II system. This included gathering qualitative and quantitative data on the criteria used in the DPAS II system; the forms for evaluating teachers, specialists and administrators; the manageability of the total system; the accuracy and reliability of the data being used in the system; usefulness of the training sessions and manuals; needed modifications; and the efficacy of the DPAS II program in achieving quality assurance and professional growth. New items were added in the 2013-2014 evaluation specifically to gain insight on the implementation of changes with Component V – Student Improvement.
2013-2014 DPAS II Evaluation Report 6 June 2014
EDUCATOR RECOMMENDATIONS
The recommendations for the 2014 report are captured in three categories, “teachers,” “specialists,” and administrators. The recommendations are based on the information derived from the surveys and interviews. The focus groups, as in past years, contributed significantly to the final recommendations outlined in this report. The surveys provide a statistical basis for the invaluable clarity provided by the interviews and focus groups. Educators’ comments during the interviews and focus groups tended to focus predominantly on Component V. As consistent in the last two years, teachers and specialists on the survey, interviews and focus groups, believe test data may be used to unfairly judge their productivity. Again, this year teachers are particularly concerned that DCAS is weighted unfairly. Many teachers, specialists, and administrators are concerned that variables such as student transiency unfairly impact their outcomes. It is also clear that, as stated previously in the report, teachers describe DPAS II as an evaluation, rather than reflective practice and growth. It is apparent that a combination of actions has contributed to the lack of authenticity and a return to a checklist approach. Time remains a significant issue. Many educators do not realize the improvements that have been made in DPAS II during the past couple of years. All groups fully support recommendations from last year’s report including, expanded use of announced and unannounced walk-throughs, elimination of the yearly announced formal observations for well functioning staff, and including peers and specialists in the observation cycle. A new concern surfaced with teachers and administrators. Teachers on improvement plans take an extraordinary amount of time and effort for staff and may also be placing students in their classes at risk of making required growth.
Focus Groups
The six focus groups consisted of 26 participants. The conversations were lively and wide-ranging though Component V was a major focus. The implementation of Component V has produced a major impact on DPAS II and most agree, for a variety of reasons, the impact is negative. One theme was the almost total disregard for the work accomplished in Components I-IV when rating an individual. That domination is believed to be counter-productive to the expressed purposes of DPAS II. There remains concern about the workload of administrators. This is especially true when working with improvement plans. Why are ineffective professionals allowed to continue to be directly responsible for educating students? The workload these individuals create drags the DPAS II process down. It is also a moral dilemma for the placement of students. The focus groups were very creative in their approach to this issue. The following recommendations are derived directly from the results of the survey, interviews, and focus groups. They are not in rank order.

Recommendations
• Components I-IV are the heart of reflective practice and DPAS II. Component V should not override the value gained from the observations and conversations about a professional’s practice in the classroom or building. Consider adjusting the weighting of the five components.
• Component V should validate expectations discovered during the process of Components I-IV. If the measures are not consistent with what was expected through reflective practice, a thorough review of the practices and conditions of testing should be initiated. Component V should not stand alone in determining a professional’s rating.
• Component V should be used to establish school wide Professional Development goals.
• Review and publicize the setting of growth targets. Encourage local input and flexibility.
• Consider how component V is applied when a person is in “novice status.” • Novice status should not be tied to an arbitrary length of time. Not all new teachers
are created equally. • “Improvement plan” status should not be part of DPAS II. Individuals considered
ineffective should not be responsible for students. • Place the individual, administrator, teacher, or specialist, under a qualified
professional until such time the qualified professional and the evaluator determine the deficit will no longer place students in educational jeopardy.
• The individual should receive normal salary. • Improvement plan decisions should only be based on Components I-IV. • Expand the use of technology. • Expand the use of walkthroughs in DPAS II. • Narrow the criteria reviewed in unannounced observations. • Create a “short form” for use in these observations. • The summative year should use both off year and current year data. • Refocus through staff development and information the benefits of DPAS II,
reflective practice and improvement in practice. • Clarify why teachers are rated. What is the purpose? The influence of Component
V on ratings influences morale negatively and may be at cross-purposes with reflective practice.
• Publicize the reforms made to DPAS II over the past couple of years. Emphasize the time saving strategies available and the potential for improved feedback.
2013-2014 DPAS II Evaluation Report 8 June 2014
METHODS
Methodology
During the Spring of 2014, surveys, focus groups, and interviews were conducted with teachers, administrators, and specialists.
Surveys The survey for 2014 was adjusted to remove items that have shown stability over the past 4 years and replace them with new items of interest. Survey items were written to solicit feedback on the system, the components of the system, overall grade of the process, resources, communication, Bloomboard, potential improvements, observations and walk-throughs for teachers, and measures in the evaluations. There were open and closed items throughout the survey. A principal components analysis was conducted on the survey items to create factors of related themes. Thirteen factors were extracted from the survey items. A regression factor score was created and used in statistical analyses. For the most part, the factors followed the logic of the sections in the survey. One factor included items that came from different survey sections and included themes related to student improvement component, fairness of the system, organization, continuance of the DPAS II process, training, and improvement involvement. The last factor that emerged only contained one item: “There are too many criteria.” Factor 1 My evaluator handles the workload effectively. The DPAS II evaluation system is being implemented appropriately in my work location. My administrator has worked with me to mutually set ambitious goals for student performance. My district ensures that the evaluation system is implemented consistently. My district ensures that the evaluation system is implemented as intended. Overall, the evaluation process is implemented consistently at my school. Overall, the evaluation process is implemented appropriately at the district level. Implementation is organized at my school. Implementation is organized in my district. Implementation is organized at the state level. Conferences are on schedule. Observations are on schedule. Factor 2 Measure A is an appropriate measure. Measure B is an appropriate measure. Measure C is an appropriate measure. Measure A is a good indicator of my teaching effectiveness. Measure B is a good indicator of my teaching effectiveness.
2013-2014 DPAS II Evaluation Report 9 June 2014
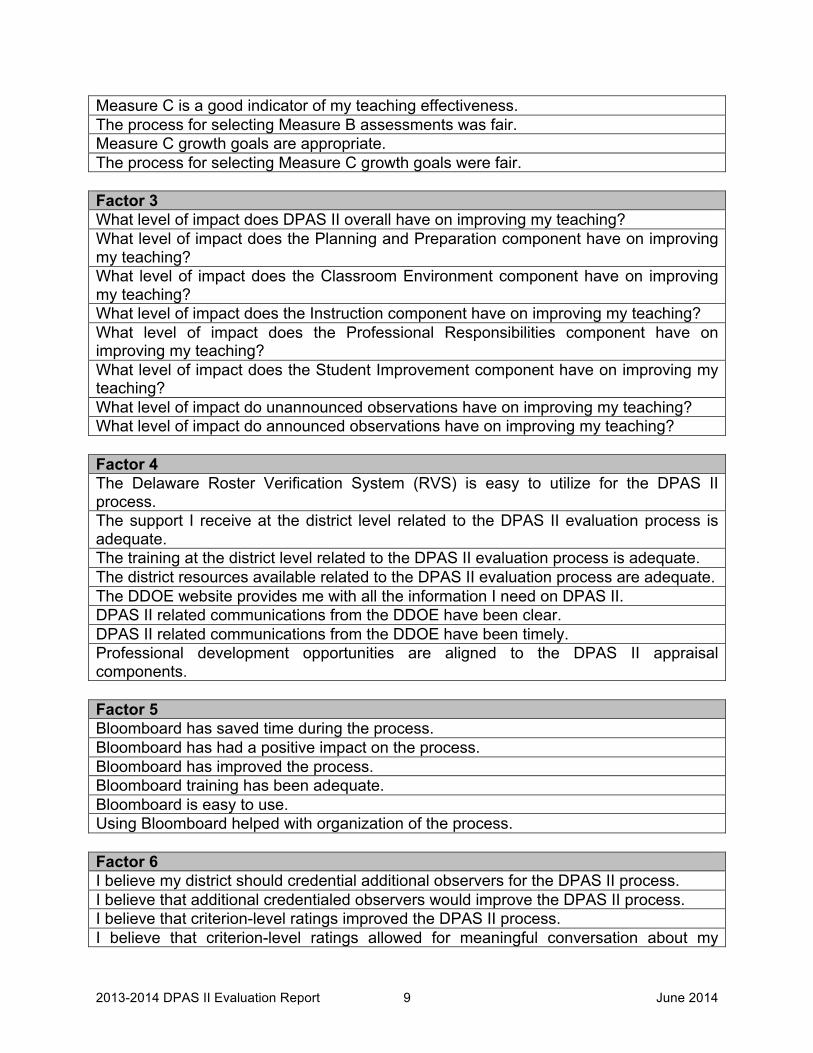
Measure C is a good indicator of my teaching effectiveness. The process for selecting Measure B assessments was fair. Measure C growth goals are appropriate. The process for selecting Measure C growth goals were fair. Factor 3 What level of impact does DPAS II overall have on improving my teaching? What level of impact does the Planning and Preparation component have on improving my teaching? What level of impact does the Classroom Environment component have on improving my teaching? What level of impact does the Instruction component have on improving my teaching? What level of impact does the Professional Responsibilities component have on improving my teaching? What level of impact does the Student Improvement component have on improving my teaching? What level of impact do unannounced observations have on improving my teaching? What level of impact do announced observations have on improving my teaching? Factor 4 The Delaware Roster Verification System (RVS) is easy to utilize for the DPAS II process. The support I receive at the district level related to the DPAS II evaluation process is adequate. The training at the district level related to the DPAS II evaluation process is adequate. The district resources available related to the DPAS II evaluation process are adequate. The DDOE website provides me with all the information I need on DPAS II. DPAS II related communications from the DDOE have been clear. DPAS II related communications from the DDOE have been timely. Professional development opportunities are aligned to the DPAS II appraisal components. Factor 5 Bloomboard has saved time during the process. Bloomboard has had a positive impact on the process. Bloomboard has improved the process. Bloomboard training has been adequate. Bloomboard is easy to use. Using Bloomboard helped with organization of the process. Factor 6 I believe my district should credential additional observers for the DPAS II process. I believe that additional credentialed observers would improve the DPAS II process. I believe that criterion-level ratings improved the DPAS II process. I believe that criterion-level ratings allowed for meaningful conversation about my
2013-2014 DPAS II Evaluation Report 10 June 2014
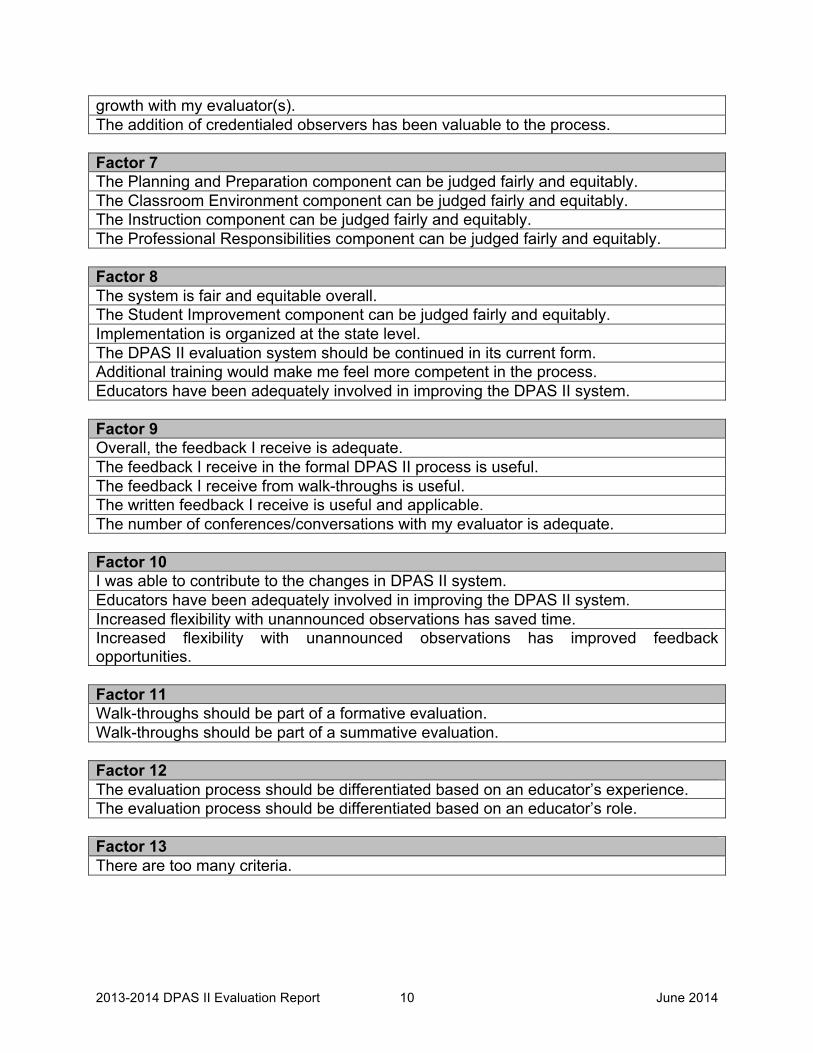
growth with my evaluator(s). The addition of credentialed observers has been valuable to the process. Factor 7 The Planning and Preparation component can be judged fairly and equitably. The Classroom Environment component can be judged fairly and equitably. The Instruction component can be judged fairly and equitably. The Professional Responsibilities component can be judged fairly and equitably. Factor 8 The system is fair and equitable overall. The Student Improvement component can be judged fairly and equitably. Implementation is organized at the state level. The DPAS II evaluation system should be continued in its current form. Additional training would make me feel more competent in the process. Educators have been adequately involved in improving the DPAS II system. Factor 9 Overall, the feedback I receive is adequate. The feedback I receive in the formal DPAS II process is useful. The feedback I receive from walk-throughs is useful. The written feedback I receive is useful and applicable. The number of conferences/conversations with my evaluator is adequate. Factor 10 I was able to contribute to the changes in DPAS II system. Educators have been adequately involved in improving the DPAS II system. Increased flexibility with unannounced observations has saved time. Increased flexibility with unannounced observations has improved feedback opportunities. Factor 11 Walk-throughs should be part of a formative evaluation. Walk-throughs should be part of a summative evaluation. Factor 12 The evaluation process should be differentiated based on an educator’s experience. The evaluation process should be differentiated based on an educator’s role. Factor 13 There are too many criteria.
2013-2014 DPAS II Evaluation Report 11 June 2014
Interviews The interview sample was radically changed in 2014. In previous studies, a 5% sample size from throughout the state was selected for a one on one interview. In the current study the interview sample was randomly selected from 5 districts (Caesar Rodney, Milford, Sussex Technical, Cape Henlopen, and Colonial). Replacement interviewees were also selected in case those in the original sample could not participate in the interview. There were a total of 40 interviews conducted by 2 external evaluators. The length of the interviews was adjusted from 15 minutes to 30 minutes to allow for a deeper and broader conversation.
Focus Groups The focus group questions were derived from the survey and interviews. They were meant to begin a conversation with the participants leading to recommendations for DPAS II improvements. The issues discussed were around Component V, unannounced observations, walk-throughs, individuals on improvement plans, alignment of testing to the curriculum, the process, potential improvement and the use of technology.
2013-2014 DPAS II Evaluation Report 12 June 2014
RESULTS
Teachers
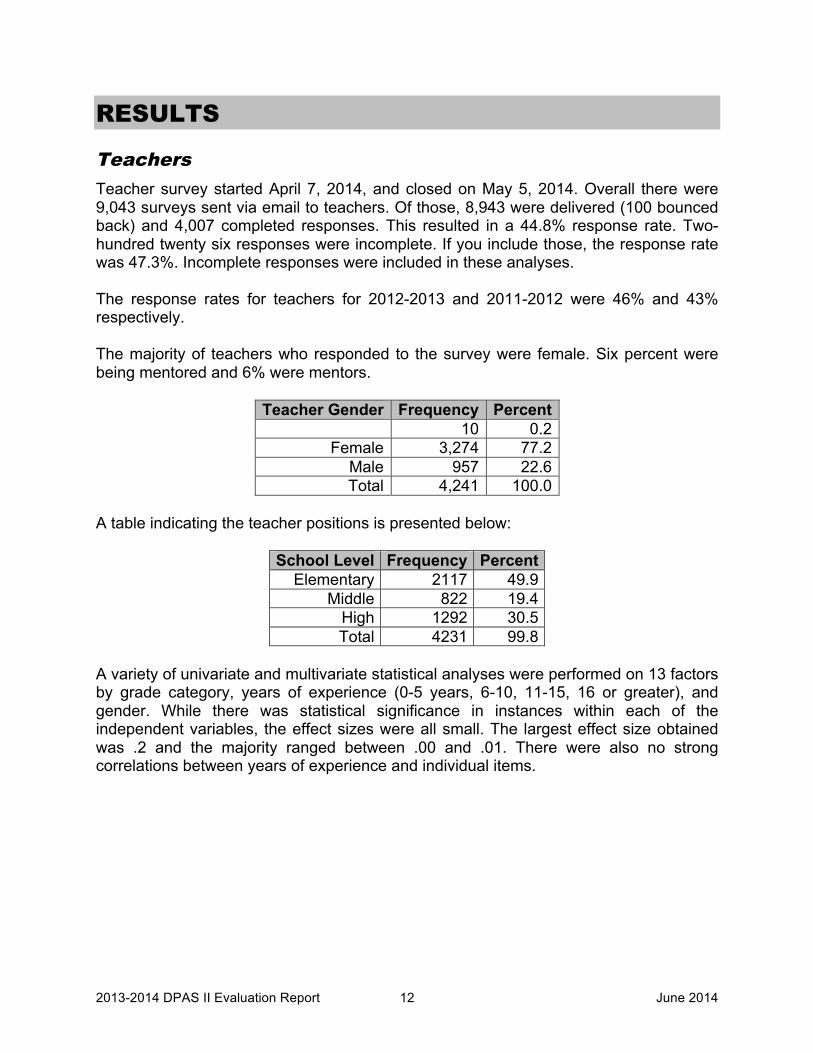
Teacher survey started April 7, 2014, and closed on May 5, 2014. Overall there were 9,043 surveys sent via email to teachers. Of those, 8,943 were delivered (100 bounced back) and 4,007 completed responses. This resulted in a 44.8% response rate. Two-hundred twenty six responses were incomplete. If you include those, the response rate was 47.3%. Incomplete responses were included in these analyses. The response rates for teachers for 2012-2013 and 2011-2012 were 46% and 43% respectively. The majority of teachers who responded to the survey were female. Six percent were being mentored and 6% were mentors.
Teacher Gender Frequency Percent 10 0.2
Female 3,274 77.2 Male 957 22.6 Total 4,241 100.0
A table indicating the teacher positions is presented below:
School Level Frequency Percent Elementary 2117 49.9
Middle 822 19.4 High 1292 30.5 Total 4231 99.8
A variety of univariate and multivariate statistical analyses were performed on 13 factors by grade category, years of experience (0-5 years, 6-10, 11-15, 16 or greater), and gender. While there was statistical significance in instances within each of the independent variables, the effect sizes were all small. The largest effect size obtained was .2 and the majority ranged between .00 and .01. There were also no strong correlations between years of experience and individual items.
2013-2014 DPAS II Evaluation Report 13 June 2014
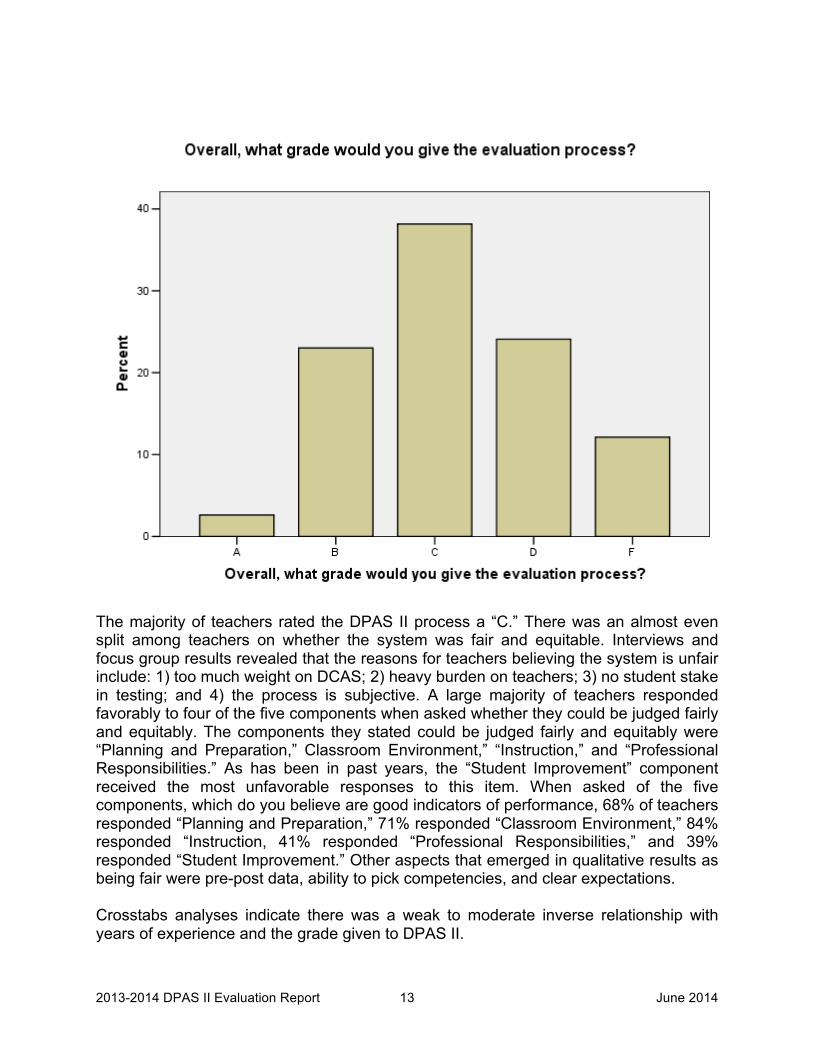
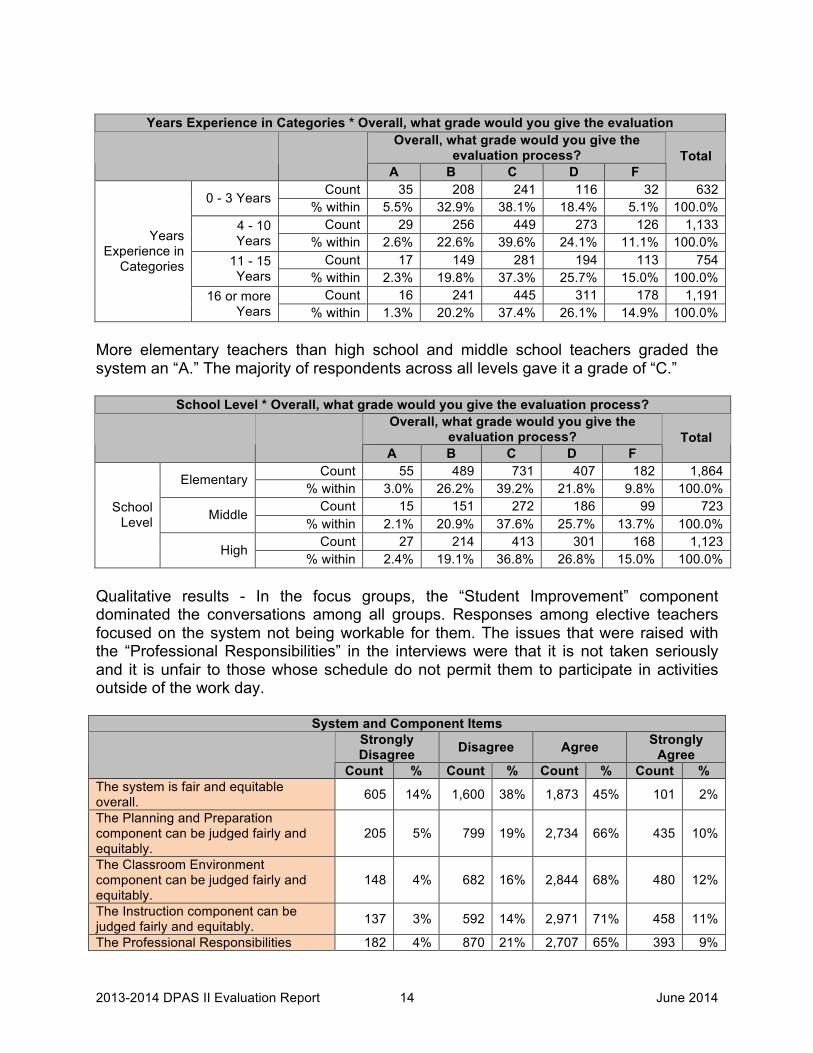
The majority of teachers rated the DPAS II process a “C.” There was an almost even split among teachers on whether the system was fair and equitable. Interviews and focus group results revealed that the reasons for teachers believing the system is unfair include: 1) too much weight on DCAS; 2) heavy burden on teachers; 3) no student stake in testing; and 4) the process is subjective. A large majority of teachers responded favorably to four of the five components when asked whether they could be judged fairly and equitably. The components they stated could be judged fairly and equitably were “Planning and Preparation,” Classroom Environment,” “Instruction,” and “Professional Responsibilities.” As has been in past years, the “Student Improvement” component received the most unfavorable responses to this item. When asked of the five components, which do you believe are good indicators of performance, 68% of teachers responded “Planning and Preparation,” 71% responded “Classroom Environment,” 84% responded “Instruction, 41% responded “Professional Responsibilities,” and 39% responded “Student Improvement.” Other aspects that emerged in qualitative results as being fair were pre-post data, ability to pick competencies, and clear expectations. Crosstabs analyses indicate there was a weak to moderate inverse relationship with years of experience and the grade given to DPAS II.
2013-2014 DPAS II Evaluation Report 14 June 2014
Years Experience in Categories * Overall, what grade would you give the evaluation
Overall, what grade would you give the evaluation process?
A B C D F Total
Count 35 208 241 116 32 632 0 - 3 Years % within 5.5% 32.9% 38.1% 18.4% 5.1% 100.0%
Count 29 256 449 273 126 1,133 4 - 10 Years % within 2.6% 22.6% 39.6% 24.1% 11.1% 100.0%
Count 17 149 281 194 113 754 11 - 15 Years % within 2.3% 19.8% 37.3% 25.7% 15.0% 100.0%
Count 16 241 445 311 178 1,191
Years Experience in
Categories
16 or more Years % within 1.3% 20.2% 37.4% 26.1% 14.9% 100.0%
More elementary teachers than high school and middle school teachers graded the system an “A.” The majority of respondents across all levels gave it a grade of “C.”
School Level * Overall, what grade would you give the evaluation process? Overall, what grade would you give the
evaluation process? A B C D F
Total
Count 55 489 731 407 182 1,864 Elementary % within 3.0% 26.2% 39.2% 21.8% 9.8% 100.0%
Count 15 151 272 186 99 723 Middle % within 2.1% 20.9% 37.6% 25.7% 13.7% 100.0%
Count 27 214 413 301 168 1,123
School Level
High % within 2.4% 19.1% 36.8% 26.8% 15.0% 100.0%
Qualitative results - In the focus groups, the “Student Improvement” component dominated the conversations among all groups. Responses among elective teachers focused on the system not being workable for them. The issues that were raised with the “Professional Responsibilities” in the interviews were that it is not taken seriously and it is unfair to those whose schedule do not permit them to participate in activities outside of the work day.
System and Component Items Strongly Disagree Disagree Agree Strongly
Agree Count % Count % Count % Count %
The system is fair and equitable overall. 605 14% 1,600 38% 1,873 45% 101 2%
The Planning and Preparation component can be judged fairly and equitably.
205 5% 799 19% 2,734 66% 435 10%
The Classroom Environment component can be judged fairly and equitably.
148 4% 682 16% 2,844 68% 480 12%
The Instruction component can be judged fairly and equitably. 137 3% 592 14% 2,971 71% 458 11%
The Professional Responsibilities 182 4% 870 21% 2,707 65% 393 9%

2013-2014 DPAS II Evaluation Report 15 June 2014
System and Component Items Strongly Disagree Disagree Agree Strongly
Agree Count % Count % Count % Count %
component can be judged fairly and equitably. The Student Improvement component can be judged fairly and equitably. 1,390 33% 1,641 39% 1,042 25% 100 2%
The time it takes to complete the DPAS II paperwork requirements is reasonable.
622 15% 1,617 39% 1,851 44% 109 3%
My evaluator handles the workload effectively. 229 5% 666 16% 2,670 64% 628 15%
The DPAS II evaluation system is being implemented appropriately in my work location.
201 5% 679 16% 2,789 67% 492 12%
My administrator has worked with me to mutually set ambitious goals for student performance.
205 5% 709 17% 2,650 63% 625 15%
My district ensures that the evaluation system is implemented consistently. 303 7% 1,044 25% 2,440 59% 349 8%
My district ensures that the evaluation system is implemented as intended. 223 5% 917 22% 2,639 64% 350 8%
Overall, the evaluation process is implemented consistently at my school. 242 6% 806 19% 2,624 63% 473 11%
Overall, the evaluation process is implemented appropriately at the district level.
230 6% 951 23% 2,571 63% 325 8%
Implementation is organized at my school. 208 5% 772 19% 2,695 65% 472 11%
Implementation is organized in my district. 209 5% 953 24% 2,578 64% 307 8%
Implementation is organized at the state level. 524 13% 1,206 30% 2,098 52% 188 5%
Conferences are on schedule. 221 5% 654 16% 2,699 65% 577 14% Observations are on schedule. 201 5% 562 14% 2,769 67% 614 15% The DPAS II evaluation system should be continued in its current form. 1,300 31% 1,726 41% 1,108 26% 79 2%
Training in the evaluation system is adequate. 367 9% 1,250 31% 2,205 55% 177 4%
Additional training would make me feel more competent in the process. 309 8% 1,532 38% 1,820 45% 400 10%
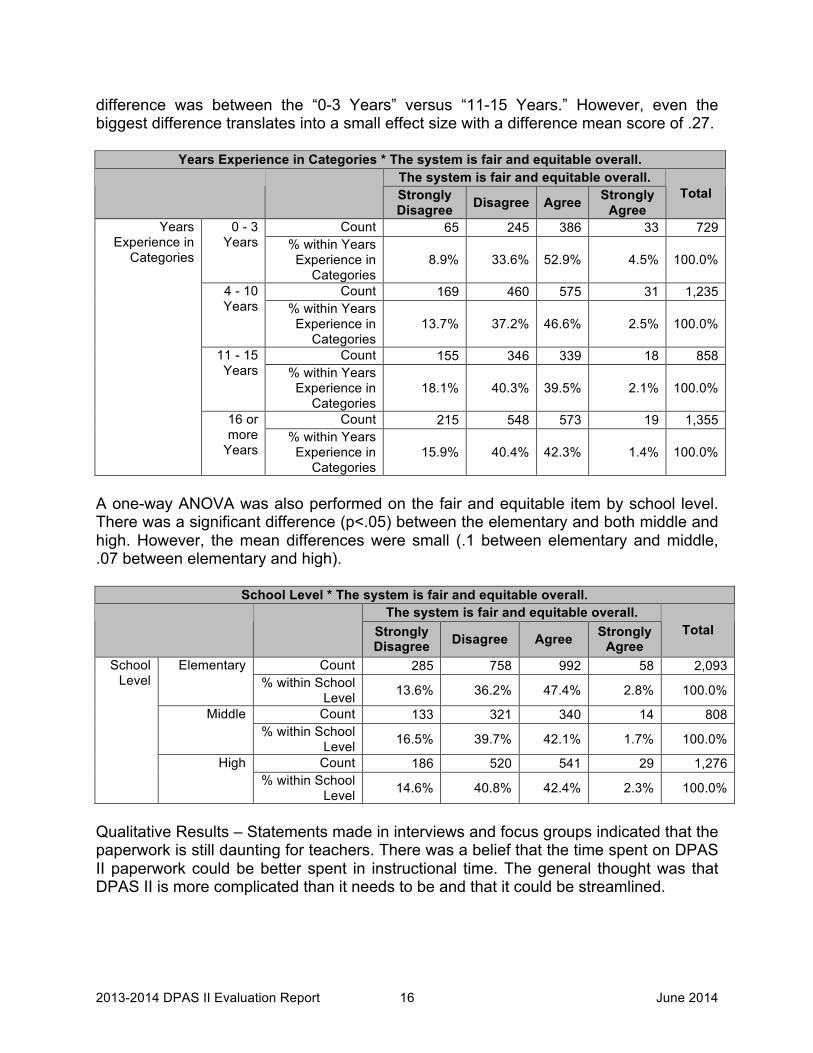
Organization of implementation and consistency of implementation received positive responses among teachers. To determine if there were any differences in whether teachers believe the system is fair and equitable by categories of years of experience or school level, crosstabs analyses was performed. The results indicate that the percent of teachers with fewer years of experience are more likely to agree that the system is fair and equitable. A one-way ANOVA was conducted to determine if there were any differences by categories that were statistically significant. With the exception of “11-15 Years” compared to “16 or more Years,” all comparisons were statistically significant (p<.05). The biggest
2013-2014 DPAS II Evaluation Report 16 June 2014
difference was between the “0-3 Years” versus “11-15 Years.” However, even the biggest difference translates into a small effect size with a difference mean score of .27.
Years Experience in Categories * The system is fair and equitable overall. The system is fair and equitable overall.
Strongly Disagree Disagree Agree Strongly
Agree Total
Count 65 245 386 33 729 0 - 3 Years % within Years
Experience in Categories
8.9% 33.6% 52.9% 4.5% 100.0%
Count 169 460 575 31 1,235 4 - 10 Years % within Years
Experience in Categories
13.7% 37.2% 46.6% 2.5% 100.0%
Count 155 346 339 18 858 11 - 15 Years % within Years
Experience in Categories
18.1% 40.3% 39.5% 2.1% 100.0%
Count 215 548 573 19 1,355
Years Experience in
Categories
16 or more
Years % within Years
Experience in Categories
15.9% 40.4% 42.3% 1.4% 100.0%
A one-way ANOVA was also performed on the fair and equitable item by school level. There was a significant difference (p<.05) between the elementary and both middle and high. However, the mean differences were small (.1 between elementary and middle, .07 between elementary and high).
School Level * The system is fair and equitable overall. The system is fair and equitable overall.
Strongly Disagree Disagree Agree Strongly
Agree Total
Count 285 758 992 58 2,093 Elementary % within School
Level 13.6% 36.2% 47.4% 2.8% 100.0%
Count 133 321 340 14 808 Middle % within School
Level 16.5% 39.7% 42.1% 1.7% 100.0%
Count 186 520 541 29 1,276
School Level
High % within School
Level 14.6% 40.8% 42.4% 2.3% 100.0%
Qualitative Results – Statements made in interviews and focus groups indicated that the paperwork is still daunting for teachers. There was a belief that the time spent on DPAS II paperwork could be better spent in instructional time. The general thought was that DPAS II is more complicated than it needs to be and that it could be streamlined.
2013-2014 DPAS II Evaluation Report 17 June 2014
Observations Strongly Disagree Disagree Agree Strongly
Agree Count % Count % Count % Count %
Increased flexibility with unannounced observations has saved time. 280 7% 984 26% 2,245 59% 272 7%
Increased flexibility with unannounced observations has improved feedback opportunities.
325 9% 1,163 31% 2,065 55% 215 6%
I believe my district should credential additional observers for the DPAS II process.
7 5% 31 22% 87 63% 13 9%
I believe that additional credentialed observers would improve the DPAS II process.
6 4% 32 23% 84 61% 16 12%
I believe that criterion-level ratings improved the DPAS II process. 10 7% 27 20% 88 65% 11 8%
I believe that criterion-level ratings allowed for meaningful conversation about my growth with my evaluator(s).
8 6% 24 18% 94 69% 11 8%
There are too many criteria. 3 2% 35 26% 75 56% 22 16% The addition of credentialed observers has been valuable to the process. 8 6% 32 24% 85 63% 11 8%
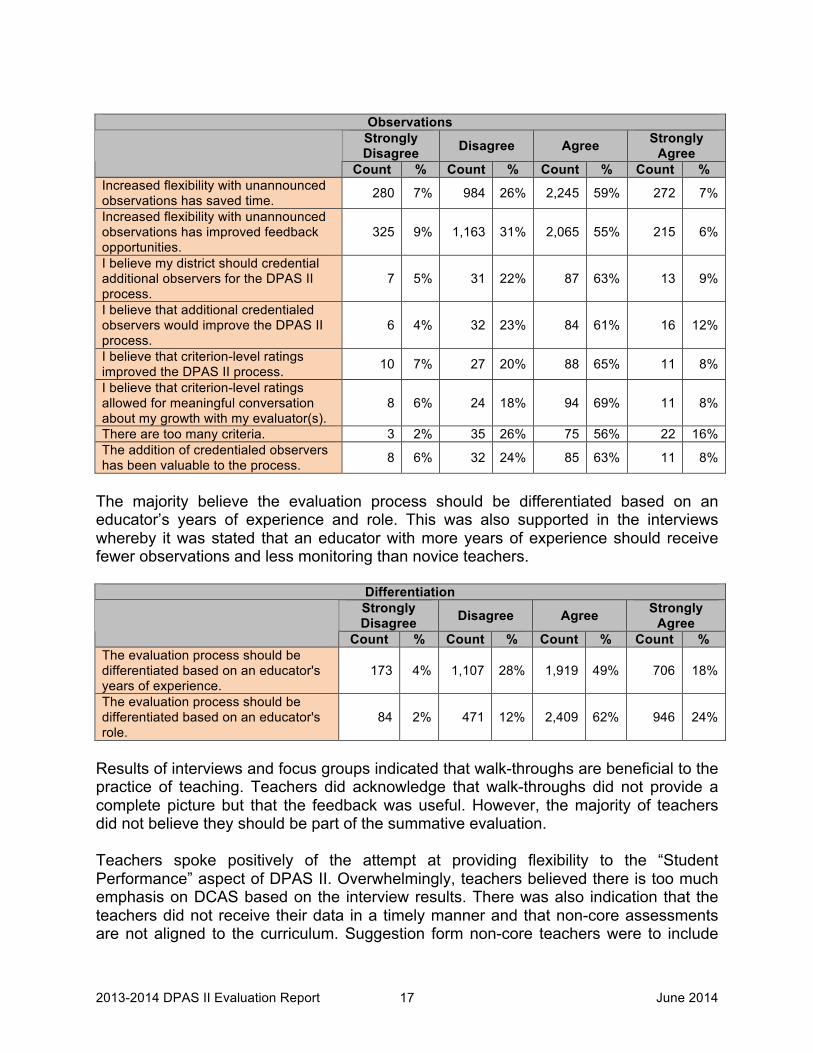
The majority believe the evaluation process should be differentiated based on an educator’s years of experience and role. This was also supported in the interviews whereby it was stated that an educator with more years of experience should receive fewer observations and less monitoring than novice teachers.
Differentiation Strongly Disagree Disagree Agree Strongly
Agree Count % Count % Count % Count %
The evaluation process should be differentiated based on an educator's years of experience.
173 4% 1,107 28% 1,919 49% 706 18%
The evaluation process should be differentiated based on an educator's role.
84 2% 471 12% 2,409 62% 946 24%
Results of interviews and focus groups indicated that walk-throughs are beneficial to the practice of teaching. Teachers did acknowledge that walk-throughs did not provide a complete picture but that the feedback was useful. However, the majority of teachers did not believe they should be part of the summative evaluation. Teachers spoke positively of the attempt at providing flexibility to the “Student Performance” aspect of DPAS II. Overwhelmingly, teachers believed there is too much emphasis on DCAS based on the interview results. There was also indication that the teachers did not receive their data in a timely manner and that non-core assessments are not aligned to the curriculum. Suggestion form non-core teachers were to include
2013-2014 DPAS II Evaluation Report 18 June 2014
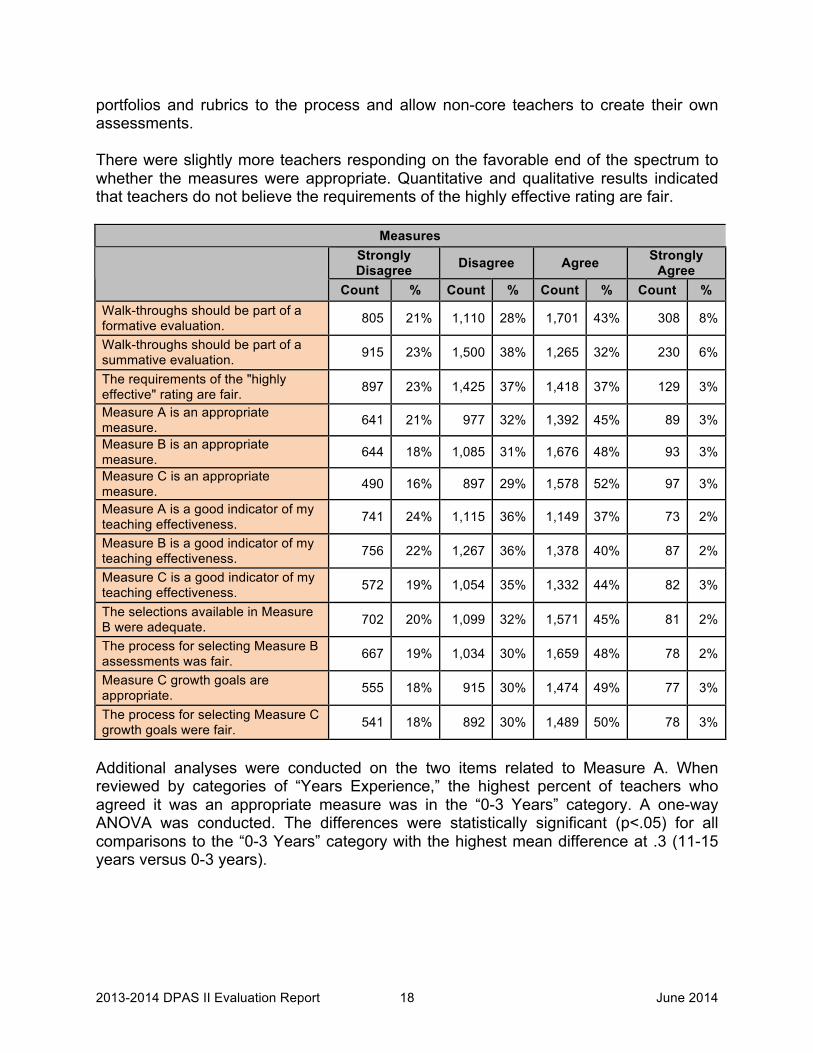
portfolios and rubrics to the process and allow non-core teachers to create their own assessments. There were slightly more teachers responding on the favorable end of the spectrum to whether the measures were appropriate. Quantitative and qualitative results indicated that teachers do not believe the requirements of the highly effective rating are fair.
Measures Strongly Disagree Disagree Agree Strongly
Agree Count % Count % Count % Count %
Walk-throughs should be part of a formative evaluation. 805 21% 1,110 28% 1,701 43% 308 8%
Walk-throughs should be part of a summative evaluation. 915 23% 1,500 38% 1,265 32% 230 6%
The requirements of the "highly effective" rating are fair. 897 23% 1,425 37% 1,418 37% 129 3%
Measure A is an appropriate measure. 641 21% 977 32% 1,392 45% 89 3%
Measure B is an appropriate measure. 644 18% 1,085 31% 1,676 48% 93 3%
Measure C is an appropriate measure. 490 16% 897 29% 1,578 52% 97 3%
Measure A is a good indicator of my teaching effectiveness. 741 24% 1,115 36% 1,149 37% 73 2%
Measure B is a good indicator of my teaching effectiveness. 756 22% 1,267 36% 1,378 40% 87 2%
Measure C is a good indicator of my teaching effectiveness. 572 19% 1,054 35% 1,332 44% 82 3%
The selections available in Measure B were adequate. 702 20% 1,099 32% 1,571 45% 81 2%
The process for selecting Measure B assessments was fair. 667 19% 1,034 30% 1,659 48% 78 2%
Measure C growth goals are appropriate. 555 18% 915 30% 1,474 49% 77 3%
The process for selecting Measure C growth goals were fair. 541 18% 892 30% 1,489 50% 78 3%
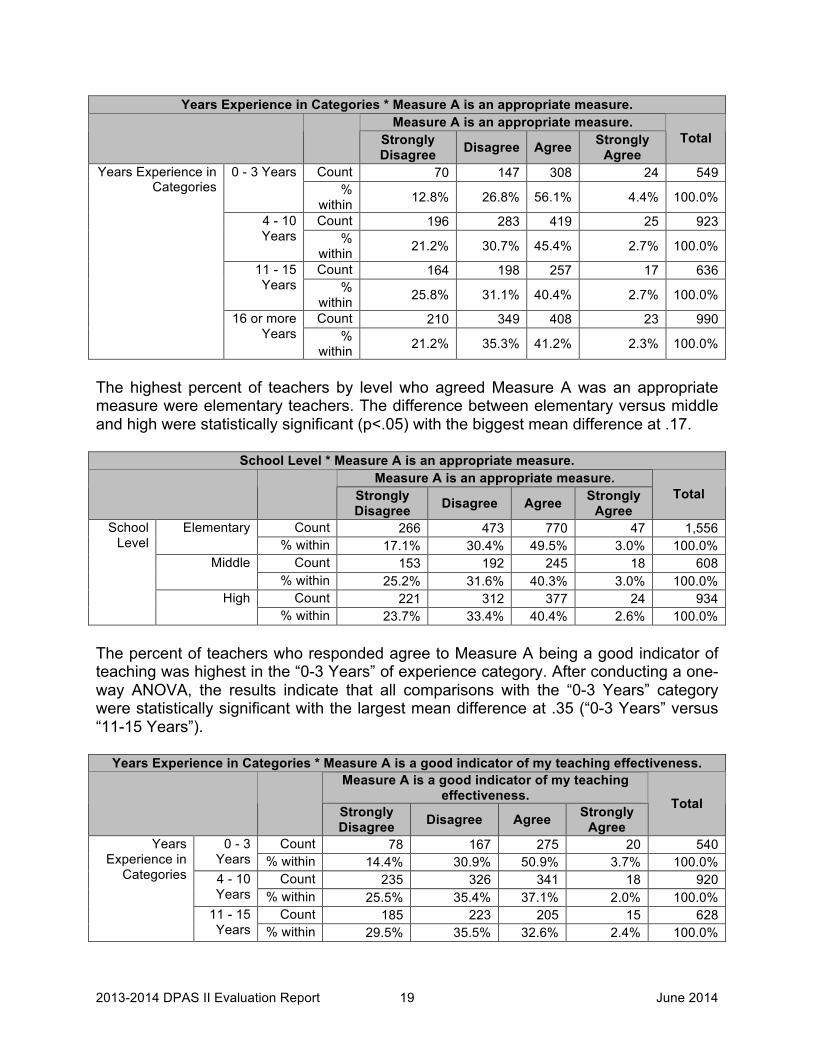
Additional analyses were conducted on the two items related to Measure A. When reviewed by categories of “Years Experience,” the highest percent of teachers who agreed it was an appropriate measure was in the “0-3 Years” category. A one-way ANOVA was conducted. The differences were statistically significant (p<.05) for all comparisons to the “0-3 Years” category with the highest mean difference at .3 (11-15 years versus 0-3 years).
2013-2014 DPAS II Evaluation Report 19 June 2014
Years Experience in Categories * Measure A is an appropriate measure. Measure A is an appropriate measure.
Strongly Disagree Disagree Agree Strongly
Agree Total
Count 70 147 308 24 549 0 - 3 Years %
within 12.8% 26.8% 56.1% 4.4% 100.0%
Count 196 283 419 25 923 4 - 10 Years %
within 21.2% 30.7% 45.4% 2.7% 100.0%
Count 164 198 257 17 636 11 - 15 Years %
within 25.8% 31.1% 40.4% 2.7% 100.0%
Count 210 349 408 23 990
Years Experience in Categories
16 or more Years %
within 21.2% 35.3% 41.2% 2.3% 100.0%
The highest percent of teachers by level who agreed Measure A was an appropriate measure were elementary teachers. The difference between elementary versus middle and high were statistically significant (p<.05) with the biggest mean difference at .17.
School Level * Measure A is an appropriate measure. Measure A is an appropriate measure.
Strongly Disagree Disagree Agree Strongly
Agree Total
Count 266 473 770 47 1,556 Elementary % within 17.1% 30.4% 49.5% 3.0% 100.0%
Count 153 192 245 18 608 Middle % within 25.2% 31.6% 40.3% 3.0% 100.0%
Count 221 312 377 24 934
School Level
High % within 23.7% 33.4% 40.4% 2.6% 100.0%
The percent of teachers who responded agree to Measure A being a good indicator of teaching was highest in the “0-3 Years” of experience category. After conducting a one-way ANOVA, the results indicate that all comparisons with the “0-3 Years” category were statistically significant with the largest mean difference at .35 (“0-3 Years” versus “11-15 Years”).
Years Experience in Categories * Measure A is a good indicator of my teaching effectiveness. Measure A is a good indicator of my teaching
effectiveness.
Strongly Disagree Disagree Agree Strongly
Agree
Total
Count 78 167 275 20 540 0 - 3 Years % within 14.4% 30.9% 50.9% 3.7% 100.0%
Count 235 326 341 18 920 4 - 10 Years % within 25.5% 35.4% 37.1% 2.0% 100.0%
Count 185 223 205 15 628
Years Experience in
Categories
11 - 15 Years % within 29.5% 35.5% 32.6% 2.4% 100.0%
2013-2014 DPAS II Evaluation Report 20 June 2014
Years Experience in Categories * Measure A is a good indicator of my teaching effectiveness. Measure A is a good indicator of my teaching
effectiveness.
Strongly Disagree Disagree Agree Strongly
Agree
Total
Count 242 399 328 20 989 16 or more
Years % within 24.5% 40.3% 33.2% 2.0% 100.0%
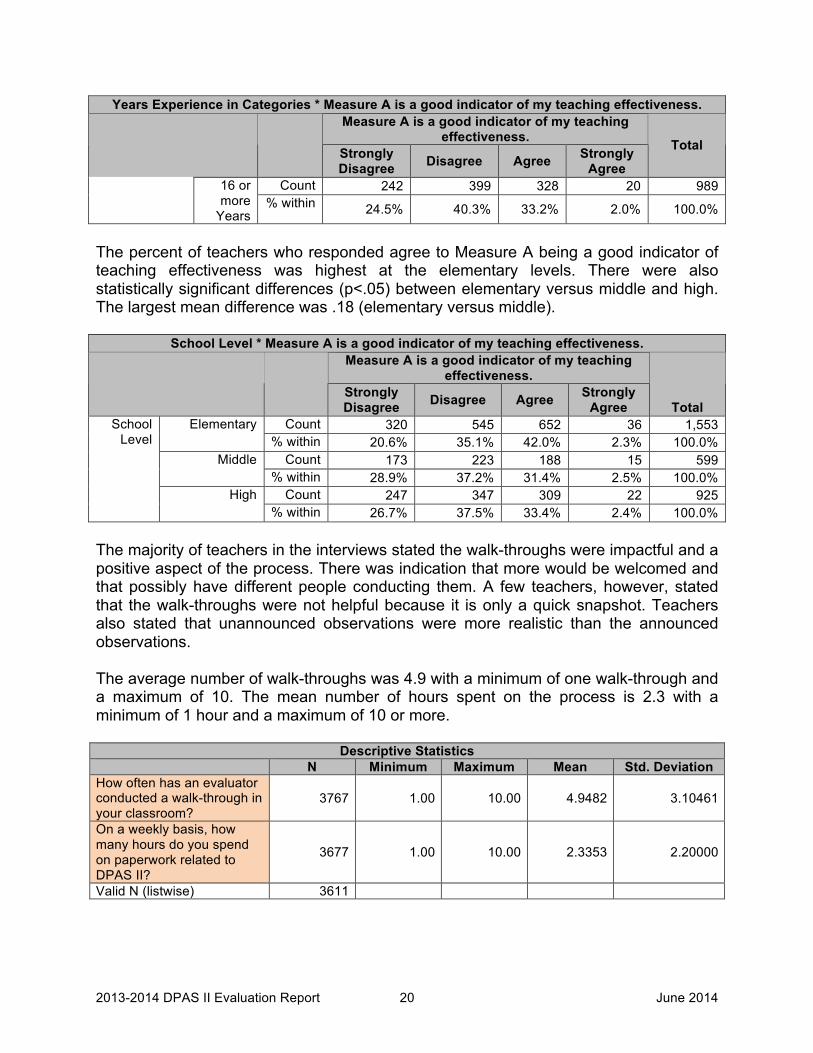
The percent of teachers who responded agree to Measure A being a good indicator of teaching effectiveness was highest at the elementary levels. There were also statistically significant differences (p<.05) between elementary versus middle and high. The largest mean difference was .18 (elementary versus middle).
School Level * Measure A is a good indicator of my teaching effectiveness. Measure A is a good indicator of my teaching
effectiveness.
Strongly Disagree Disagree Agree Strongly
Agree Total Count 320 545 652 36 1,553 Elementary
% within 20.6% 35.1% 42.0% 2.3% 100.0% Count 173 223 188 15 599 Middle
% within 28.9% 37.2% 31.4% 2.5% 100.0% Count 247 347 309 22 925
School Level
High % within 26.7% 37.5% 33.4% 2.4% 100.0%
The majority of teachers in the interviews stated the walk-throughs were impactful and a positive aspect of the process. There was indication that more would be welcomed and that possibly have different people conducting them. A few teachers, however, stated that the walk-throughs were not helpful because it is only a quick snapshot. Teachers also stated that unannounced observations were more realistic than the announced observations. The average number of walk-throughs was 4.9 with a minimum of one walk-through and a maximum of 10. The mean number of hours spent on the process is 2.3 with a minimum of 1 hour and a maximum of 10 or more.
Descriptive Statistics N Minimum Maximum Mean Std. Deviation
How often has an evaluator conducted a walk-through in your classroom?
3767 1.00 10.00 4.9482 3.10461
On a weekly basis, how many hours do you spend on paperwork related to DPAS II?
3677 1.00 10.00 2.3353 2.20000
Valid N (listwise) 3611
2013-2014 DPAS II Evaluation Report 21 June 2014
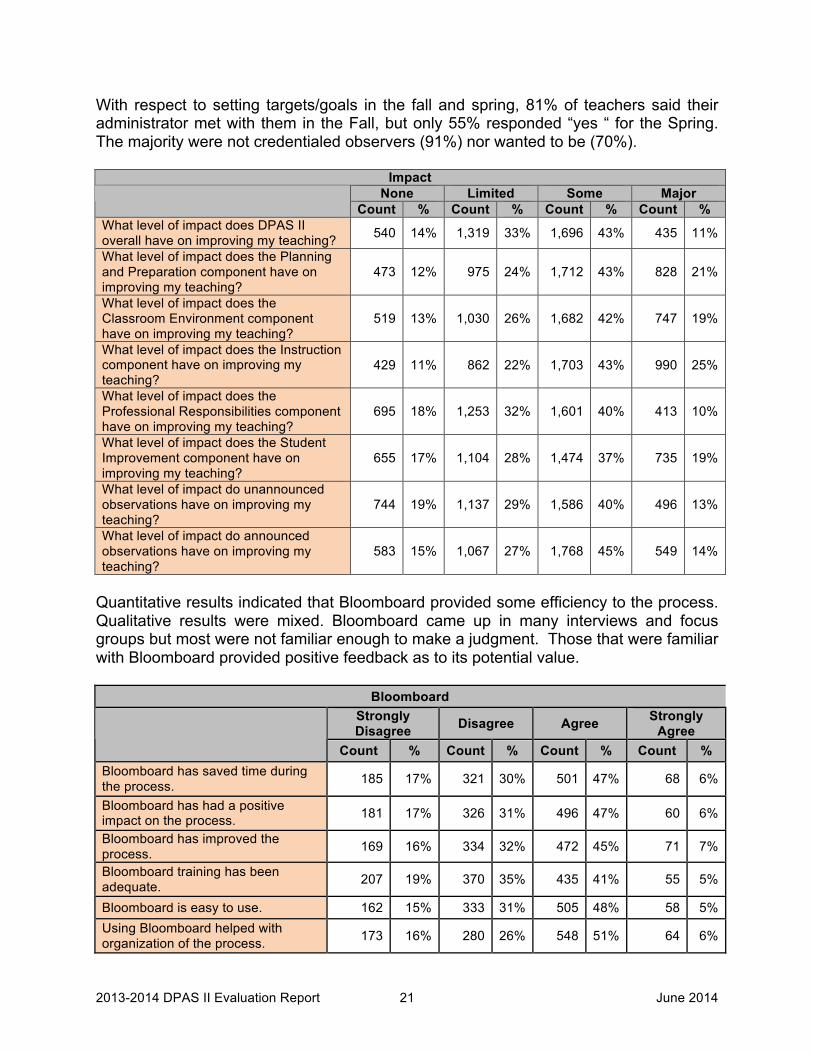
With respect to setting targets/goals in the fall and spring, 81% of teachers said their administrator met with them in the Fall, but only 55% responded “yes “ for the Spring. The majority were not credentialed observers (91%) nor wanted to be (70%).
Impact None Limited Some Major Count % Count % Count % Count %
What level of impact does DPAS II overall have on improving my teaching? 540 14% 1,319 33% 1,696 43% 435 11%
What level of impact does the Planning and Preparation component have on improving my teaching?
473 12% 975 24% 1,712 43% 828 21%
What level of impact does the Classroom Environment component have on improving my teaching?
519 13% 1,030 26% 1,682 42% 747 19%
What level of impact does the Instruction component have on improving my teaching?
429 11% 862 22% 1,703 43% 990 25%
What level of impact does the Professional Responsibilities component have on improving my teaching?
695 18% 1,253 32% 1,601 40% 413 10%
What level of impact does the Student Improvement component have on improving my teaching?
655 17% 1,104 28% 1,474 37% 735 19%
What level of impact do unannounced observations have on improving my teaching?
744 19% 1,137 29% 1,586 40% 496 13%
What level of impact do announced observations have on improving my teaching?
583 15% 1,067 27% 1,768 45% 549 14%
Quantitative results indicated that Bloomboard provided some efficiency to the process. Qualitative results were mixed. Bloomboard came up in many interviews and focus groups but most were not familiar enough to make a judgment. Those that were familiar with Bloomboard provided positive feedback as to its potential value.
Bloomboard Strongly Disagree Disagree Agree Strongly
Agree Count % Count % Count % Count %
Bloomboard has saved time during the process. 185 17% 321 30% 501 47% 68 6%
Bloomboard has had a positive impact on the process. 181 17% 326 31% 496 47% 60 6%
Bloomboard has improved the process. 169 16% 334 32% 472 45% 71 7%
Bloomboard training has been adequate. 207 19% 370 35% 435 41% 55 5%
Bloomboard is easy to use. 162 15% 333 31% 505 48% 58 5% Using Bloomboard helped with organization of the process. 173 16% 280 26% 548 51% 64 6%
2013-2014 DPAS II Evaluation Report 22 June 2014
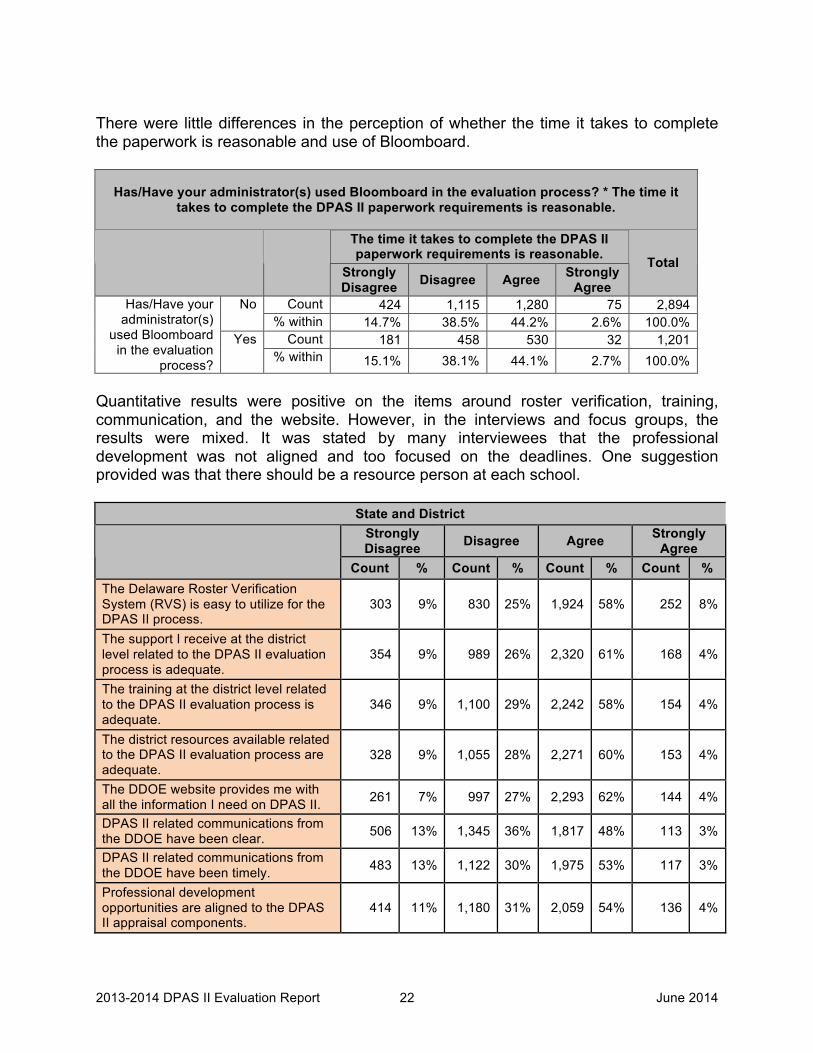
There were little differences in the perception of whether the time it takes to complete the paperwork is reasonable and use of Bloomboard.
Has/Have your administrator(s) used Bloomboard in the evaluation process? * The time it takes to complete the DPAS II paperwork requirements is reasonable.
The time it takes to complete the DPAS II paperwork requirements is reasonable.
Strongly Disagree Disagree Agree Strongly
Agree
Total
Count 424 1,115 1,280 75 2,894 No % within 14.7% 38.5% 44.2% 2.6% 100.0%
Count 181 458 530 32 1,201
Has/Have your administrator(s)
used Bloomboard in the evaluation
process?
Yes % within 15.1% 38.1% 44.1% 2.7% 100.0%
Quantitative results were positive on the items around roster verification, training, communication, and the website. However, in the interviews and focus groups, the results were mixed. It was stated by many interviewees that the professional development was not aligned and too focused on the deadlines. One suggestion provided was that there should be a resource person at each school.
State and District Strongly Disagree Disagree Agree Strongly
Agree Count % Count % Count % Count %
The Delaware Roster Verification System (RVS) is easy to utilize for the DPAS II process.
303 9% 830 25% 1,924 58% 252 8%
The support I receive at the district level related to the DPAS II evaluation process is adequate.
354 9% 989 26% 2,320 61% 168 4%
The training at the district level related to the DPAS II evaluation process is adequate.
346 9% 1,100 29% 2,242 58% 154 4%
The district resources available related to the DPAS II evaluation process are adequate.
328 9% 1,055 28% 2,271 60% 153 4%
The DDOE website provides me with all the information I need on DPAS II. 261 7% 997 27% 2,293 62% 144 4%
DPAS II related communications from the DDOE have been clear. 506 13% 1,345 36% 1,817 48% 113 3%
DPAS II related communications from the DDOE have been timely. 483 13% 1,122 30% 1,975 53% 117 3%
Professional development opportunities are aligned to the DPAS II appraisal components.
414 11% 1,180 31% 2,059 54% 136 4%

2013-2014 DPAS II Evaluation Report 23 June 2014
What areas do you feel you need more training?
Percent of respondents selecting the
area Planning and Preparation 11% Classroom Environment 8% Instruction 11% Professional Responsibilities 9% Student Improvement 30% Measure selection and goal setting for the Student Improvement component 48% When asked what supports they used, the majority said “District provided training.”
DDOE Training 20% DPAS II Component V Hotline 2% Delaware Academy for School Leadership 3% Educationally Speaking 11% Development Coaches 14% District provided training 62% DASA/DSEA provided training 5% DDOE Online modules 19% Other 9%
Quantitative and qualitative results both supported that teachers like the feedback they received from various aspects of the process.
Feedback Strongly Disagree Disagree Agree Strongly
Agree Count % Count % Count % Count %
Overall, the feedback I receive is adequate. 157 4% 592 15% 2,684 67% 566 14%
The feedback I receive in the formal DPAS II process is useful. 212 5% 896 22% 2,456 61% 433 11%
The feedback I receive from walk-throughs is useful. 349 9% 1,002 25% 2,140 54% 470 12%
The written feedback I receive is useful and applicable. 216 5% 728 18% 2,537 64% 496 12%
The number of conferences/conversations with my evaluator is adequate.
184 5% 534 13% 2,671 67% 605 15%
Both quantitative and qualitative results indicated that many teachers do not believe they have contributed to the process. In one interview, the respondent stated that a committee was able to provide input into the process, but that it wasn’t used. The specific mention was around the “Student Improvement” component.
2013-2014 DPAS II Evaluation Report 24 June 2014
Contribution to the Process
Strongly Disagree Disagree Agree Strongly
Agree Count % Count % Count % Count %
I was able to contribute to the changes in DPAS II system. 960 25% 2,128 56% 679 18% 56 1%
Educators have been adequately involved in improving the DPAS II system.
781 20% 1,879 49% 1,098 29% 72 2%
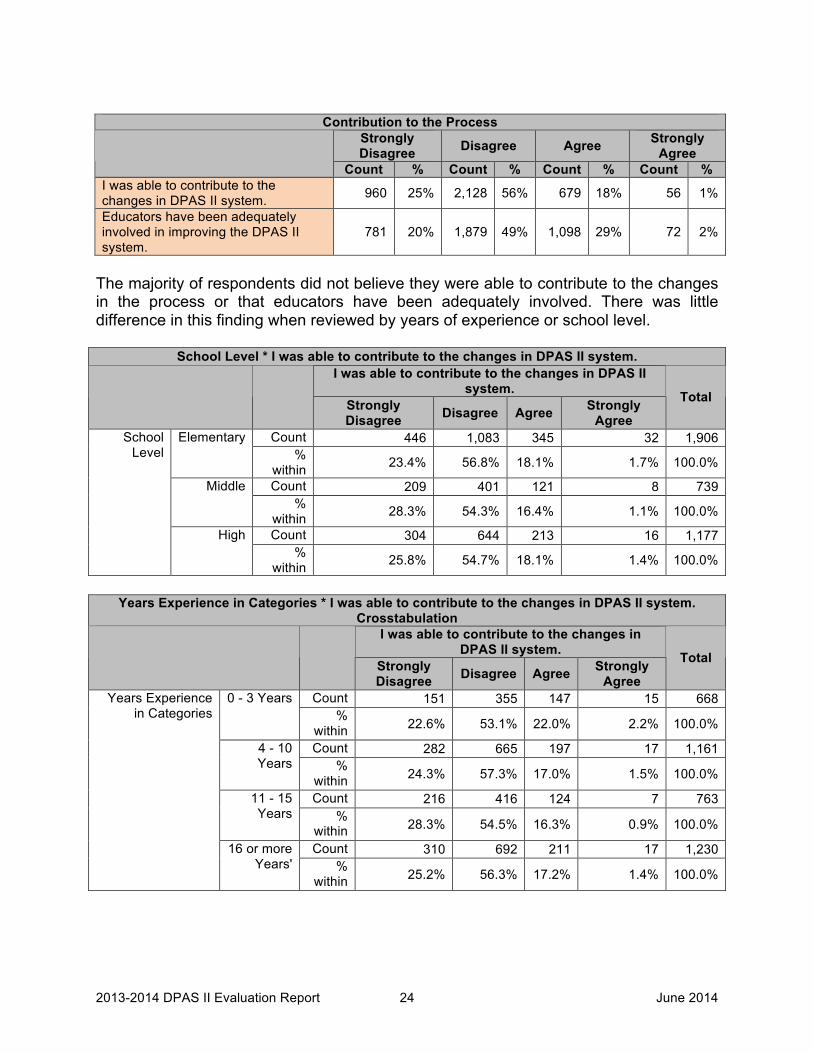
The majority of respondents did not believe they were able to contribute to the changes in the process or that educators have been adequately involved. There was little difference in this finding when reviewed by years of experience or school level.
School Level * I was able to contribute to the changes in DPAS II system. I was able to contribute to the changes in DPAS II
system.
Strongly Disagree Disagree Agree Strongly
Agree
Total
Count 446 1,083 345 32 1,906 Elementary %
within 23.4% 56.8% 18.1% 1.7% 100.0%
Count 209 401 121 8 739 Middle %
within 28.3% 54.3% 16.4% 1.1% 100.0%
Count 304 644 213 16 1,177
School Level
High %
within 25.8% 54.7% 18.1% 1.4% 100.0%
Years Experience in Categories * I was able to contribute to the changes in DPAS II system.
Crosstabulation I was able to contribute to the changes in
DPAS II system.
Strongly Disagree Disagree Agree Strongly
Agree
Total
Count 151 355 147 15 668 0 - 3 Years %
within 22.6% 53.1% 22.0% 2.2% 100.0%
Count 282 665 197 17 1,161 4 - 10 Years %
within 24.3% 57.3% 17.0% 1.5% 100.0%
Count 216 416 124 7 763 11 - 15 Years %
within 28.3% 54.5% 16.3% 0.9% 100.0%
Count 310 692 211 17 1,230
Years Experience in Categories
16 or more Years' %
within 25.2% 56.3% 17.2% 1.4% 100.0%

2013-2014 DPAS II Evaluation Report 25 June 2014
Please select an option that best describes how the DPAS II process compares to other initiatives in your school or work location.
The DPAS II evaluation
process is the most significant driver of student
achievement gains.
DPAS II is one of the top three
efforts.
DPAS II is one of the top five
efforts.
The DPAS II evaluation
process is not one of the
important drivers of student
achievement gains.
Total
Responses Received 307 7.95% 1065 27.57% 986 25.52% 1505 38.96% 3863
Specialists Results
Survey invitations were sent to 1,324 specialists. Of those, 1,306 were successfully delivered. The response rate was 44.8%. The response rates for specialists in 2012-2013 and 2011-2012 were 47.4% and 42% respectively. The average number of years’ experience among specialists was 17.6. A large majority of specialists are not being mentored and are not serving as mentors. The tables below indicate the positions that made up the specialist sample and the gender distribution.
Specialists Gender Frequency Percent 8 1.3 Female 558 89.3 Male 59 9.4 Total 625 100.0
2013-2014 DPAS II Evaluation Report 26 June 2014
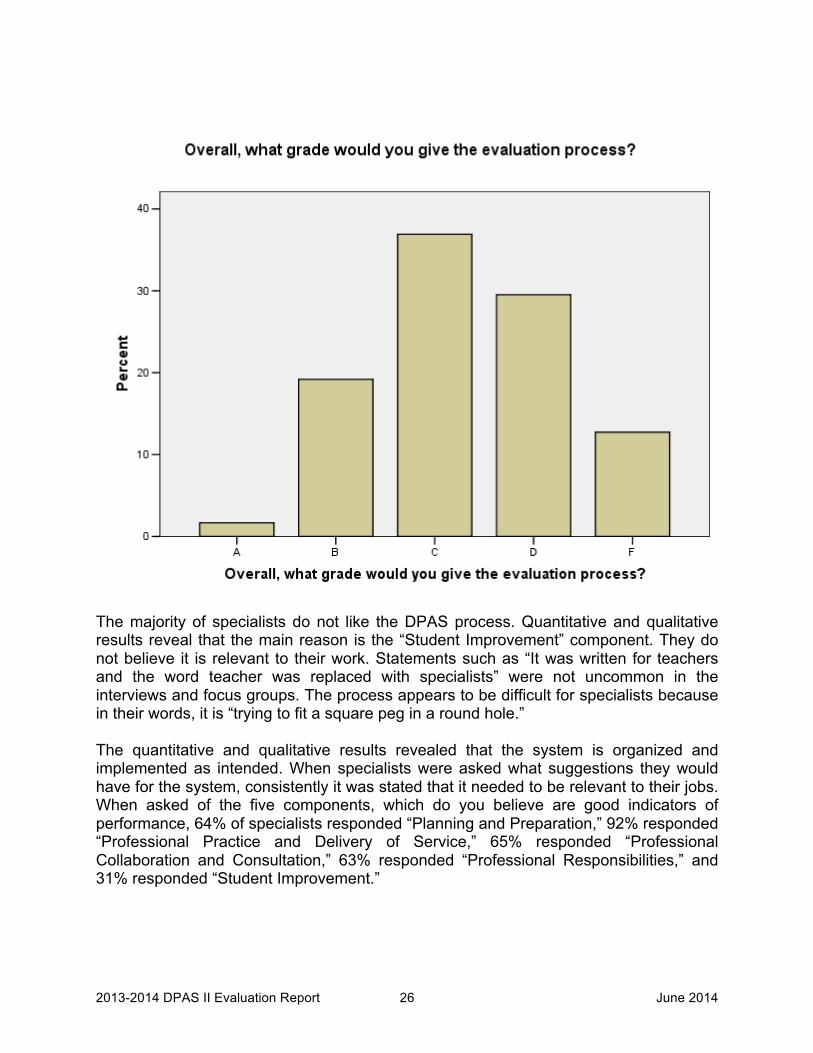
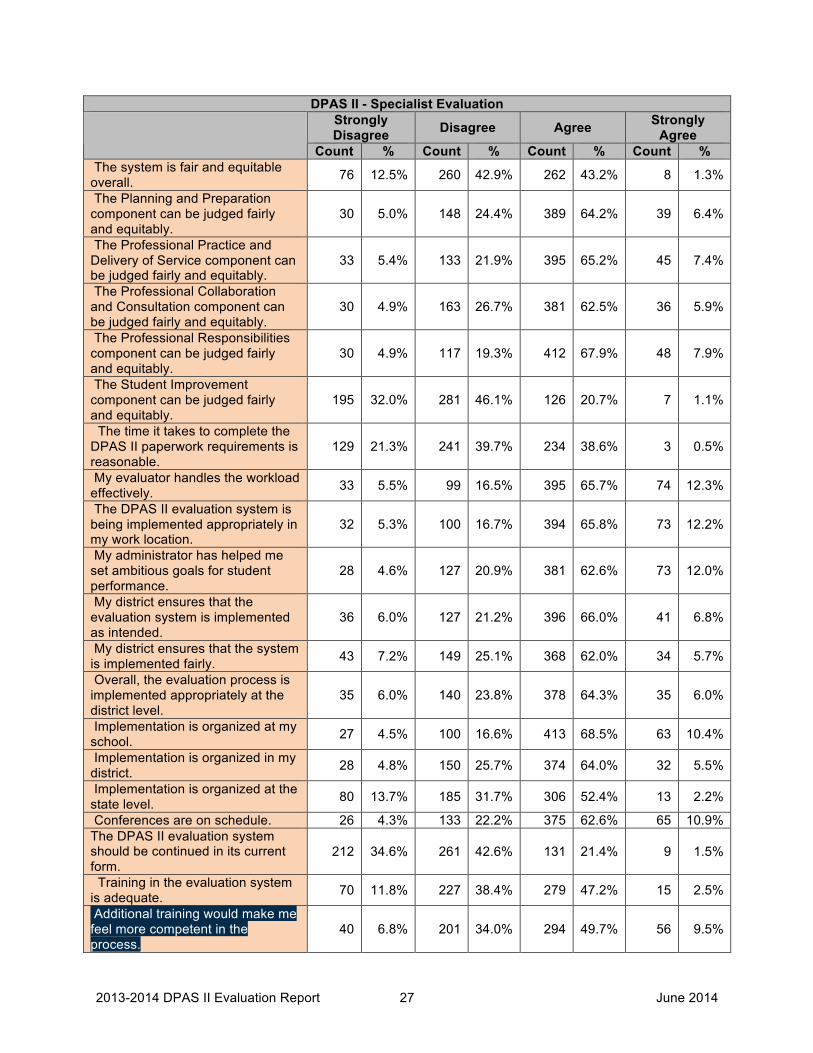
The majority of specialists do not like the DPAS process. Quantitative and qualitative results reveal that the main reason is the “Student Improvement” component. They do not believe it is relevant to their work. Statements such as “It was written for teachers and the word teacher was replaced with specialists” were not uncommon in the interviews and focus groups. The process appears to be difficult for specialists because in their words, it is “trying to fit a square peg in a round hole.” The quantitative and qualitative results revealed that the system is organized and implemented as intended. When specialists were asked what suggestions they would have for the system, consistently it was stated that it needed to be relevant to their jobs. When asked of the five components, which do you believe are good indicators of performance, 64% of specialists responded “Planning and Preparation,” 92% responded “Professional Practice and Delivery of Service,” 65% responded “Professional Collaboration and Consultation,” 63% responded “Professional Responsibilities,” and 31% responded “Student Improvement.”
2013-2014 DPAS II Evaluation Report 27 June 2014
DPAS II - Specialist Evaluation Strongly Disagree Disagree Agree Strongly
Agree Count % Count % Count % Count %
The system is fair and equitable overall. 76 12.5% 260 42.9% 262 43.2% 8 1.3%
The Planning and Preparation component can be judged fairly and equitably.
30 5.0% 148 24.4% 389 64.2% 39 6.4%
The Professional Practice and Delivery of Service component can be judged fairly and equitably.
33 5.4% 133 21.9% 395 65.2% 45 7.4%
The Professional Collaboration and Consultation component can be judged fairly and equitably.
30 4.9% 163 26.7% 381 62.5% 36 5.9%
The Professional Responsibilities component can be judged fairly and equitably.
30 4.9% 117 19.3% 412 67.9% 48 7.9%
The Student Improvement component can be judged fairly and equitably.
195 32.0% 281 46.1% 126 20.7% 7 1.1%
The time it takes to complete the DPAS II paperwork requirements is reasonable.
129 21.3% 241 39.7% 234 38.6% 3 0.5%
My evaluator handles the workload effectively. 33 5.5% 99 16.5% 395 65.7% 74 12.3%
The DPAS II evaluation system is being implemented appropriately in my work location.
32 5.3% 100 16.7% 394 65.8% 73 12.2%
My administrator has helped me set ambitious goals for student performance.
28 4.6% 127 20.9% 381 62.6% 73 12.0%
My district ensures that the evaluation system is implemented as intended.
36 6.0% 127 21.2% 396 66.0% 41 6.8%
My district ensures that the system is implemented fairly. 43 7.2% 149 25.1% 368 62.0% 34 5.7%
Overall, the evaluation process is implemented appropriately at the district level.
35 6.0% 140 23.8% 378 64.3% 35 6.0%
Implementation is organized at my school. 27 4.5% 100 16.6% 413 68.5% 63 10.4%
Implementation is organized in my district. 28 4.8% 150 25.7% 374 64.0% 32 5.5%
Implementation is organized at the state level. 80 13.7% 185 31.7% 306 52.4% 13 2.2%
Conferences are on schedule. 26 4.3% 133 22.2% 375 62.6% 65 10.9% The DPAS II evaluation system should be continued in its current form.
212 34.6% 261 42.6% 131 21.4% 9 1.5%
Training in the evaluation system is adequate. 70 11.8% 227 38.4% 279 47.2% 15 2.5%
Additional training would make me feel more competent in the process.
40 6.8% 201 34.0% 294 49.7% 56 9.5%
2013-2014 DPAS II Evaluation Report 28 June 2014
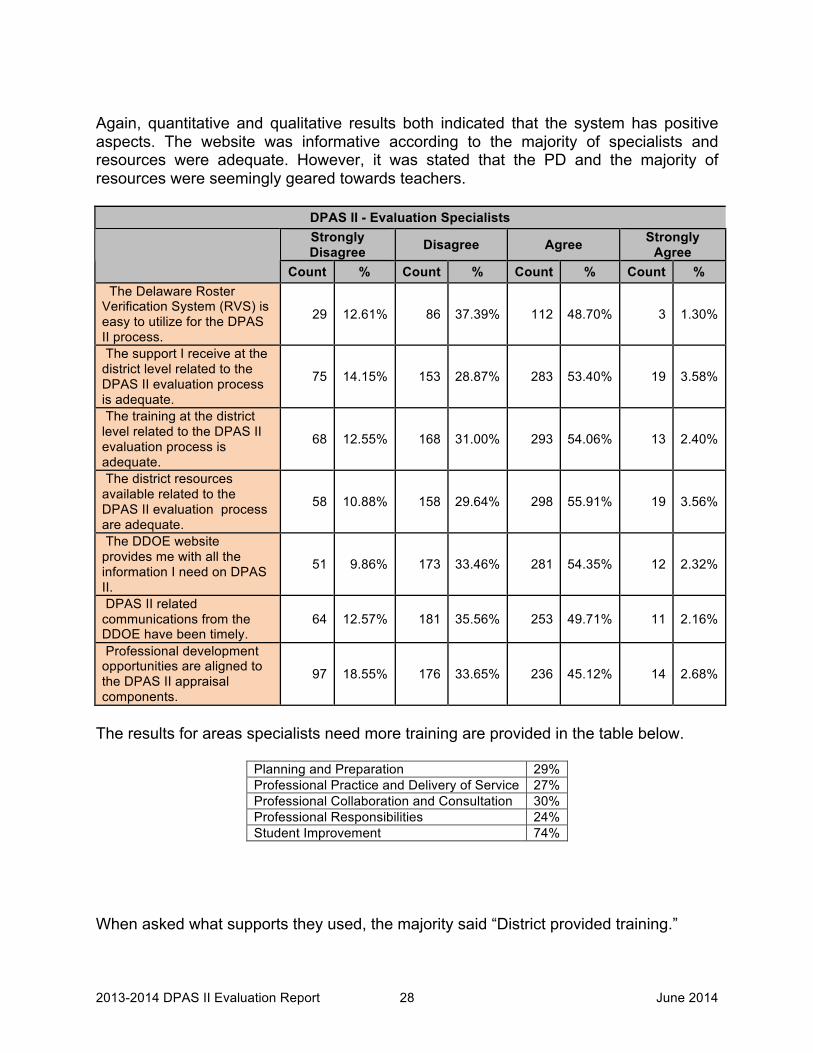
Again, quantitative and qualitative results both indicated that the system has positive aspects. The website was informative according to the majority of specialists and resources were adequate. However, it was stated that the PD and the majority of resources were seemingly geared towards teachers.
DPAS II - Evaluation Specialists Strongly Disagree Disagree Agree Strongly
Agree Count % Count % Count % Count %
The Delaware Roster Verification System (RVS) is easy to utilize for the DPAS II process.
29 12.61% 86 37.39% 112 48.70% 3 1.30%
The support I receive at the district level related to the DPAS II evaluation process is adequate.
75 14.15% 153 28.87% 283 53.40% 19 3.58%
The training at the district level related to the DPAS II evaluation process is adequate.
68 12.55% 168 31.00% 293 54.06% 13 2.40%
The district resources available related to the DPAS II evaluation process are adequate.
58 10.88% 158 29.64% 298 55.91% 19 3.56%
The DDOE website provides me with all the information I need on DPAS II.
51 9.86% 173 33.46% 281 54.35% 12 2.32%
DPAS II related communications from the DDOE have been timely.
64 12.57% 181 35.56% 253 49.71% 11 2.16%
Professional development opportunities are aligned to the DPAS II appraisal components.
97 18.55% 176 33.65% 236 45.12% 14 2.68%
The results for areas specialists need more training are provided in the table below.
Planning and Preparation 29% Professional Practice and Delivery of Service 27% Professional Collaboration and Consultation 30% Professional Responsibilities 24% Student Improvement 74%
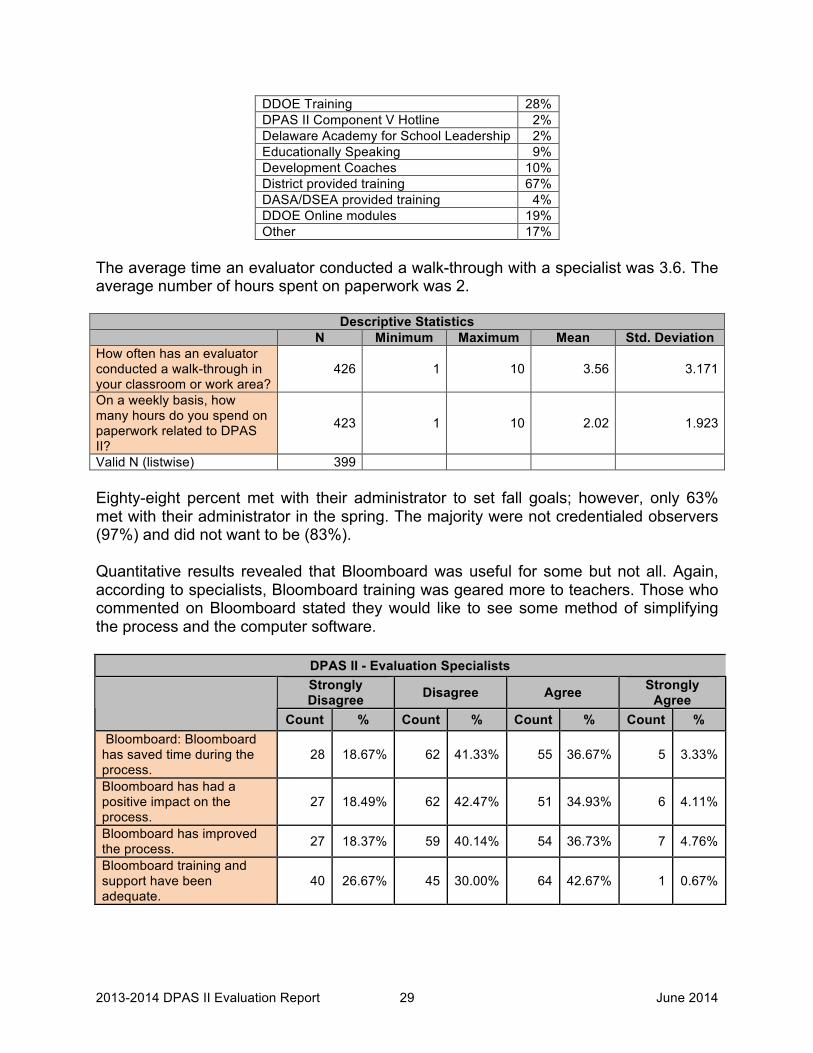
When asked what supports they used, the majority said “District provided training.”
2013-2014 DPAS II Evaluation Report 29 June 2014
DDOE Training 28% DPAS II Component V Hotline 2% Delaware Academy for School Leadership 2% Educationally Speaking 9% Development Coaches 10% District provided training 67% DASA/DSEA provided training 4% DDOE Online modules 19% Other 17%
The average time an evaluator conducted a walk-through with a specialist was 3.6. The average number of hours spent on paperwork was 2.
Descriptive Statistics N Minimum Maximum Mean Std. Deviation
How often has an evaluator conducted a walk-through in your classroom or work area?
426 1 10 3.56 3.171
On a weekly basis, how many hours do you spend on paperwork related to DPAS II?
423 1 10 2.02 1.923
Valid N (listwise) 399 Eighty-eight percent met with their administrator to set fall goals; however, only 63% met with their administrator in the spring. The majority were not credentialed observers (97%) and did not want to be (83%). Quantitative results revealed that Bloomboard was useful for some but not all. Again, according to specialists, Bloomboard training was geared more to teachers. Those who commented on Bloomboard stated they would like to see some method of simplifying the process and the computer software.
DPAS II - Evaluation Specialists Strongly Disagree Disagree Agree Strongly
Agree Count % Count % Count % Count %
Bloomboard: Bloomboard has saved time during the process.
28 18.67% 62 41.33% 55 36.67% 5 3.33%
Bloomboard has had a positive impact on the process.
27 18.49% 62 42.47% 51 34.93% 6 4.11%
Bloomboard has improved the process. 27 18.37% 59 40.14% 54 36.73% 7 4.76%
Bloomboard training and support have been adequate.
40 26.67% 45 30.00% 64 42.67% 1 0.67%
2013-2014 DPAS II Evaluation Report 30 June 2014
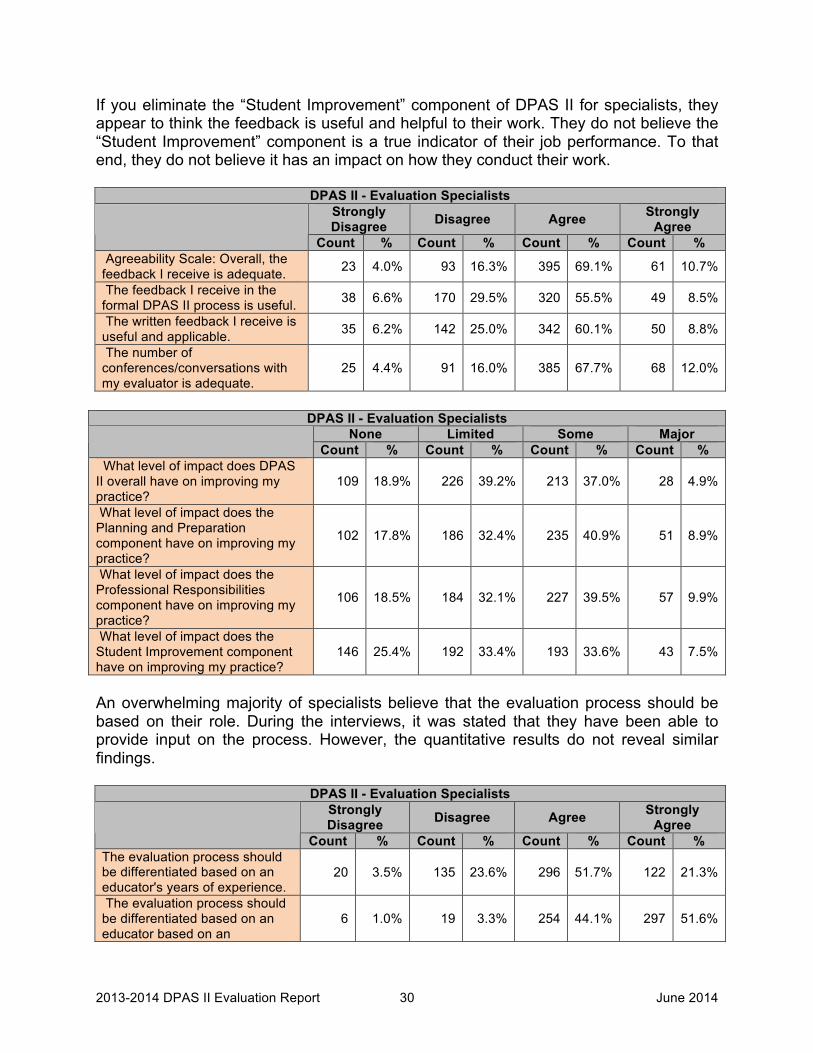
If you eliminate the “Student Improvement” component of DPAS II for specialists, they appear to think the feedback is useful and helpful to their work. They do not believe the “Student Improvement” component is a true indicator of their job performance. To that end, they do not believe it has an impact on how they conduct their work.
DPAS II - Evaluation Specialists Strongly Disagree Disagree Agree Strongly
Agree Count % Count % Count % Count %
Agreeability Scale: Overall, the feedback I receive is adequate. 23 4.0% 93 16.3% 395 69.1% 61 10.7%
The feedback I receive in the formal DPAS II process is useful. 38 6.6% 170 29.5% 320 55.5% 49 8.5%
The written feedback I receive is useful and applicable. 35 6.2% 142 25.0% 342 60.1% 50 8.8%
The number of conferences/conversations with my evaluator is adequate.
25 4.4% 91 16.0% 385 67.7% 68 12.0%
DPAS II - Evaluation Specialists
None Limited Some Major Count % Count % Count % Count % What level of impact does DPAS II overall have on improving my practice?
109 18.9% 226 39.2% 213 37.0% 28 4.9%
What level of impact does the Planning and Preparation component have on improving my practice?
102 17.8% 186 32.4% 235 40.9% 51 8.9%
What level of impact does the Professional Responsibilities component have on improving my practice?
106 18.5% 184 32.1% 227 39.5% 57 9.9%
What level of impact does the Student Improvement component have on improving my practice?
146 25.4% 192 33.4% 193 33.6% 43 7.5%
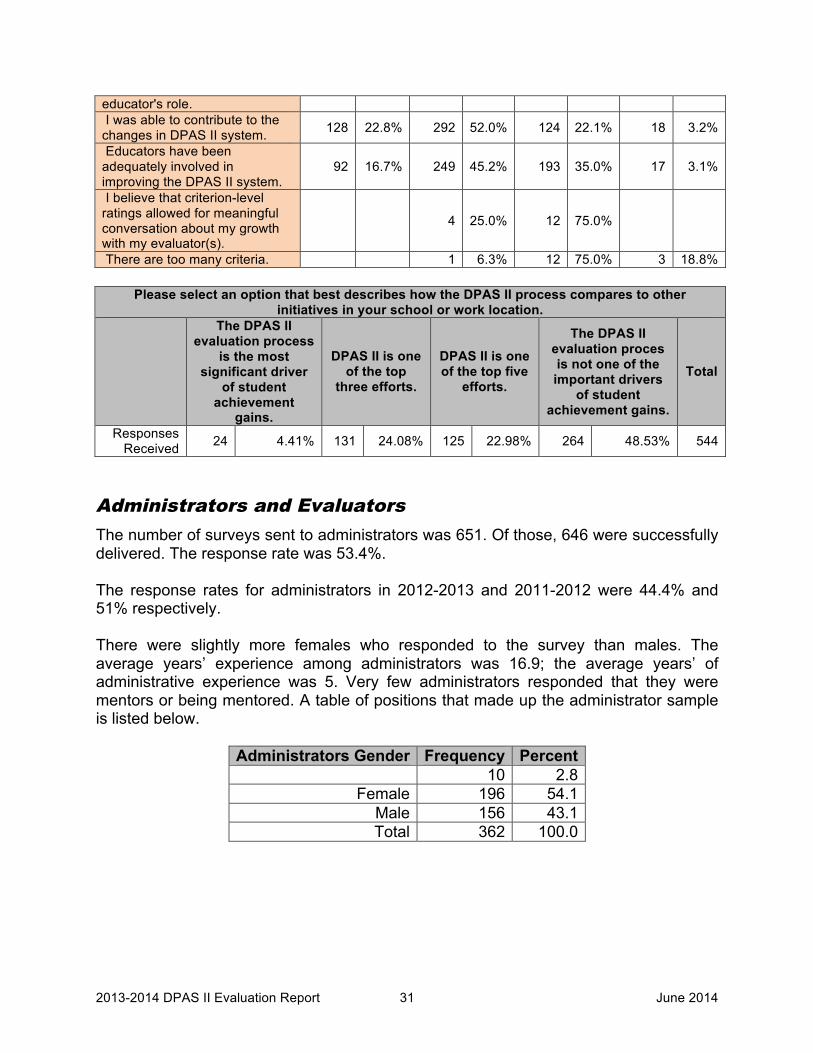
An overwhelming majority of specialists believe that the evaluation process should be based on their role. During the interviews, it was stated that they have been able to provide input on the process. However, the quantitative results do not reveal similar findings.
DPAS II - Evaluation Specialists Strongly Disagree Disagree Agree Strongly
Agree Count % Count % Count % Count %
The evaluation process should be differentiated based on an educator's years of experience.
20 3.5% 135 23.6% 296 51.7% 122 21.3%
The evaluation process should be differentiated based on an educator based on an
6 1.0% 19 3.3% 254 44.1% 297 51.6%
2013-2014 DPAS II Evaluation Report 31 June 2014
educator's role. I was able to contribute to the changes in DPAS II system. 128 22.8% 292 52.0% 124 22.1% 18 3.2%
Educators have been adequately involved in improving the DPAS II system.
92 16.7% 249 45.2% 193 35.0% 17 3.1%
I believe that criterion-level ratings allowed for meaningful conversation about my growth with my evaluator(s).
4 25.0% 12 75.0%
There are too many criteria. 1 6.3% 12 75.0% 3 18.8%
Please select an option that best describes how the DPAS II process compares to other initiatives in your school or work location.
The DPAS II evaluation process
is the most significant driver
of student achievement
gains.
DPAS II is one of the top
three efforts.
DPAS II is one of the top five
efforts.
The DPAS II evaluation proces is not one of the important drivers
of student achievement gains.
Total
Responses Received 24 4.41% 131 24.08% 125 22.98% 264 48.53% 544
Administrators and Evaluators
The number of surveys sent to administrators was 651. Of those, 646 were successfully delivered. The response rate was 53.4%. The response rates for administrators in 2012-2013 and 2011-2012 were 44.4% and 51% respectively. There were slightly more females who responded to the survey than males. The average years’ experience among administrators was 16.9; the average years’ of administrative experience was 5. Very few administrators responded that they were mentors or being mentored. A table of positions that made up the administrator sample is listed below.
Administrators Gender Frequency Percent 10 2.8
Female 196 54.1 Male 156 43.1 Total 362 100.0
2013-2014 DPAS II Evaluation Report 32 June 2014
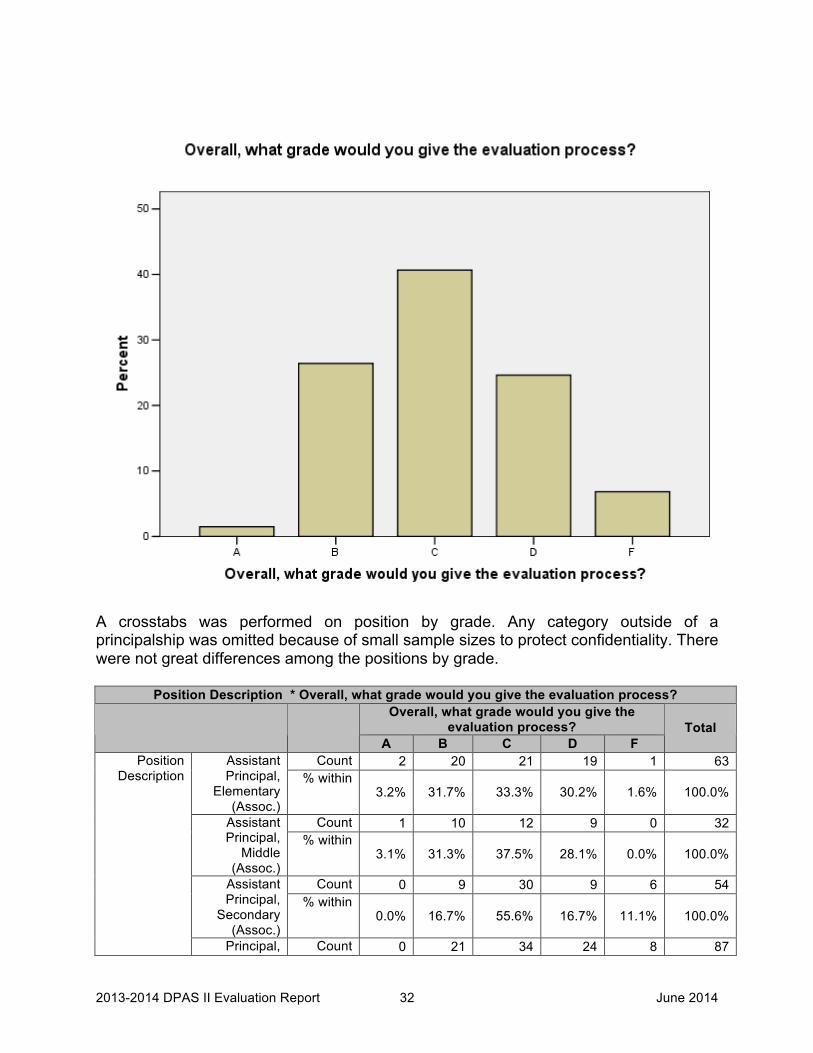
A crosstabs was performed on position by grade. Any category outside of a principalship was omitted because of small sample sizes to protect confidentiality. There were not great differences among the positions by grade.
Position Description * Overall, what grade would you give the evaluation process? Overall, what grade would you give the
evaluation process? A B C D F
Total
Count 2 20 21 19 1 63 Assistant Principal,
Elementary (Assoc.)
% within 3.2% 31.7% 33.3% 30.2% 1.6% 100.0%
Count 1 10 12 9 0 32 Assistant Principal,
Middle (Assoc.)
% within 3.1% 31.3% 37.5% 28.1% 0.0% 100.0%
Count 0 9 30 9 6 54 Assistant Principal,
Secondary (Assoc.)
% within 0.0% 16.7% 55.6% 16.7% 11.1% 100.0%
Position Description
Principal, Count 0 21 34 24 8 87

2013-2014 DPAS II Evaluation Report 33 June 2014
Elementary % within 0.0% 24.1% 39.1% 27.6% 9.2% 100.0% Count 0 4 6 5 0 15 Principal,
Middle % within 0.0% 26.7% 40.0% 33.3% 0.0% 100.0% Count 0 8 8 5 3 24
Principal, Secondary % within 0.0% 33.3% 33.3% 20.8% 12.5% 100.0%
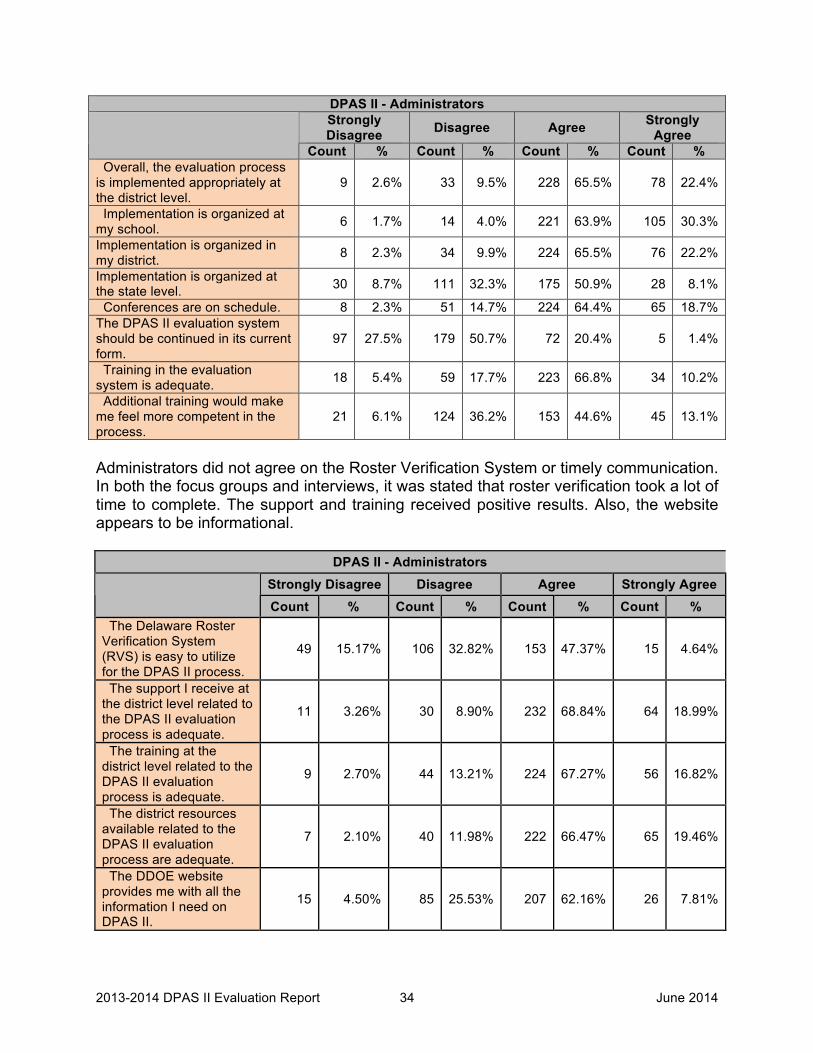
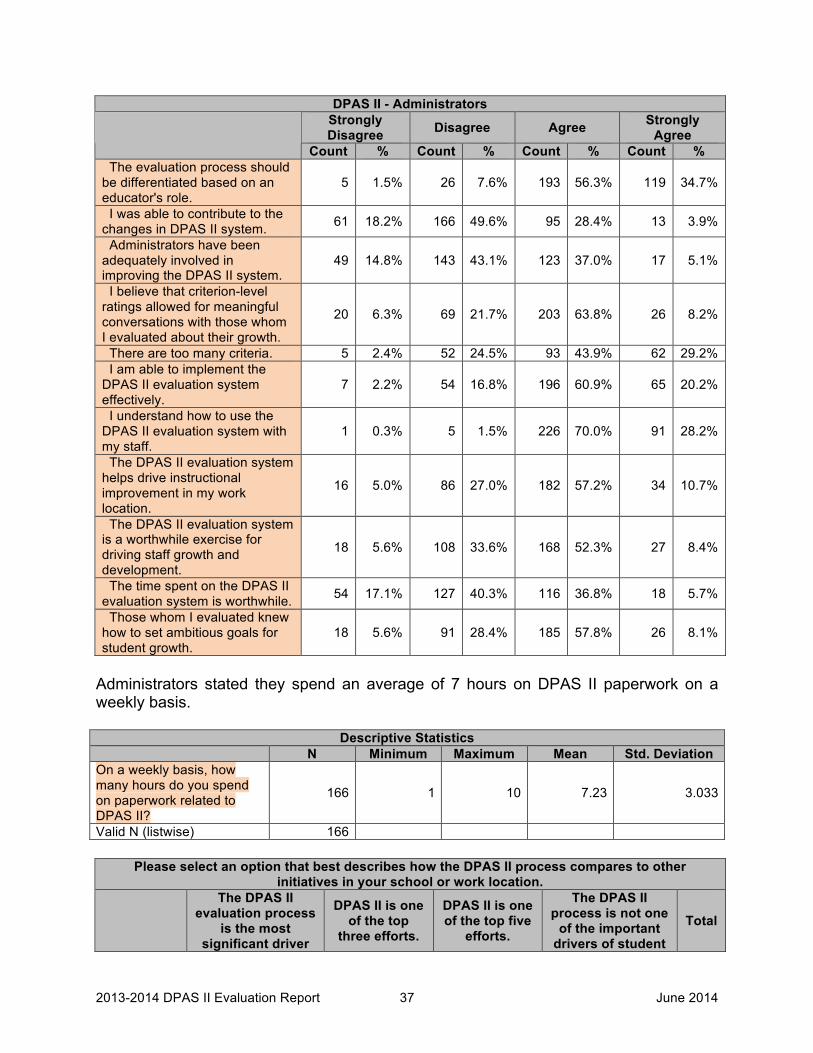
Administrators had many positive statements about some of the changes to DPAS II. As with teachers and specialists, four of the five criteria can be judged fairly and equitably. This item did not have a majority agree on the “Student Improvement” component. The process appears to be organized and implemented as intended. When asked of the five components, which do you believe are good indicators of performance, 61% of administrators responded “Vision and Goals,” 86% responded “Culture of Learning,” 81% responded “Management,” 44% responded “Professional Responsibilities,” and 49% responded “Student Improvement.”
DPAS II - Administrators Strongly Disagree Disagree Agree Strongly
Agree Count % Count % Count % Count %
The system is fair and equitable overall. 28 8.0% 105 30.0% 203 58.0% 14 4.0%
The Vision and Goals component can be judged fairly and equitably.
10 2.8% 62 17.7% 254 72.4% 25 7.1%
The Culture of Learning component can be judged fairly and equitably.
8 2.3% 53 15.1% 252 72.0% 37 10.6%
The Management component can be judged fairly and equitably.
6 1.7% 32 9.1% 262 74.4% 52 14.8%
The Professional Responsibilities component can be judged fairly and equitably.
13 3.7% 60 17.1% 238 68.0% 39 11.1%
The Student Improvement component can be judged fairly and equitably.
81 23.3% 134 38.6% 113 32.6% 19 5.5%
The time it takes to complete the DPAS II paperwork requirements is reasonable.
87 24.9% 147 42.0% 110 31.4% 6 1.7%
My evaluator handles the workload effectively. 15 4.3% 54 15.5% 227 65.2% 52 14.9%
The DPAS II evaluation system is being implemented appropriately in my work location.
8 2.3% 33 9.4% 228 65.0% 82 23.4%
My district ensures that the evaluation system is implemented as intended.
10 2.8% 26 7.4% 241 68.7% 74 21.1%
My district ensures that the system is implemented fairly. 9 2.6% 31 8.9% 230 66.1% 78 22.4%
2013-2014 DPAS II Evaluation Report 34 June 2014
DPAS II - Administrators Strongly Disagree Disagree Agree Strongly
Agree Count % Count % Count % Count %
Overall, the evaluation process is implemented appropriately at the district level.
9 2.6% 33 9.5% 228 65.5% 78 22.4%
Implementation is organized at my school. 6 1.7% 14 4.0% 221 63.9% 105 30.3%
Implementation is organized in my district. 8 2.3% 34 9.9% 224 65.5% 76 22.2%
Implementation is organized at the state level. 30 8.7% 111 32.3% 175 50.9% 28 8.1%
Conferences are on schedule. 8 2.3% 51 14.7% 224 64.4% 65 18.7% The DPAS II evaluation system should be continued in its current form.
97 27.5% 179 50.7% 72 20.4% 5 1.4%
Training in the evaluation system is adequate. 18 5.4% 59 17.7% 223 66.8% 34 10.2%
Additional training would make me feel more competent in the process.
21 6.1% 124 36.2% 153 44.6% 45 13.1%
Administrators did not agree on the Roster Verification System or timely communication. In both the focus groups and interviews, it was stated that roster verification took a lot of time to complete. The support and training received positive results. Also, the website appears to be informational.
DPAS II - Administrators Strongly Disagree Disagree Agree Strongly Agree
Count % Count % Count % Count %
The Delaware Roster Verification System (RVS) is easy to utilize for the DPAS II process.
49 15.17% 106 32.82% 153 47.37% 15 4.64%
The support I receive at the district level related to the DPAS II evaluation process is adequate.
11 3.26% 30 8.90% 232 68.84% 64 18.99%
The training at the district level related to the DPAS II evaluation process is adequate.
9 2.70% 44 13.21% 224 67.27% 56 16.82%
The district resources available related to the DPAS II evaluation process are adequate.
7 2.10% 40 11.98% 222 66.47% 65 19.46%
The DDOE website provides me with all the information I need on DPAS II.
15 4.50% 85 25.53% 207 62.16% 26 7.81%
2013-2014 DPAS II Evaluation Report 35 June 2014
DPAS II related communications from the DDOE have been timely.
39 11.82% 116 35.15% 160 48.48% 15 4.55%
Professional development opportunities are aligned to the DPAS II appraisal components.
16 4.88% 57 17.38% 231 70.43% 24 7.32%
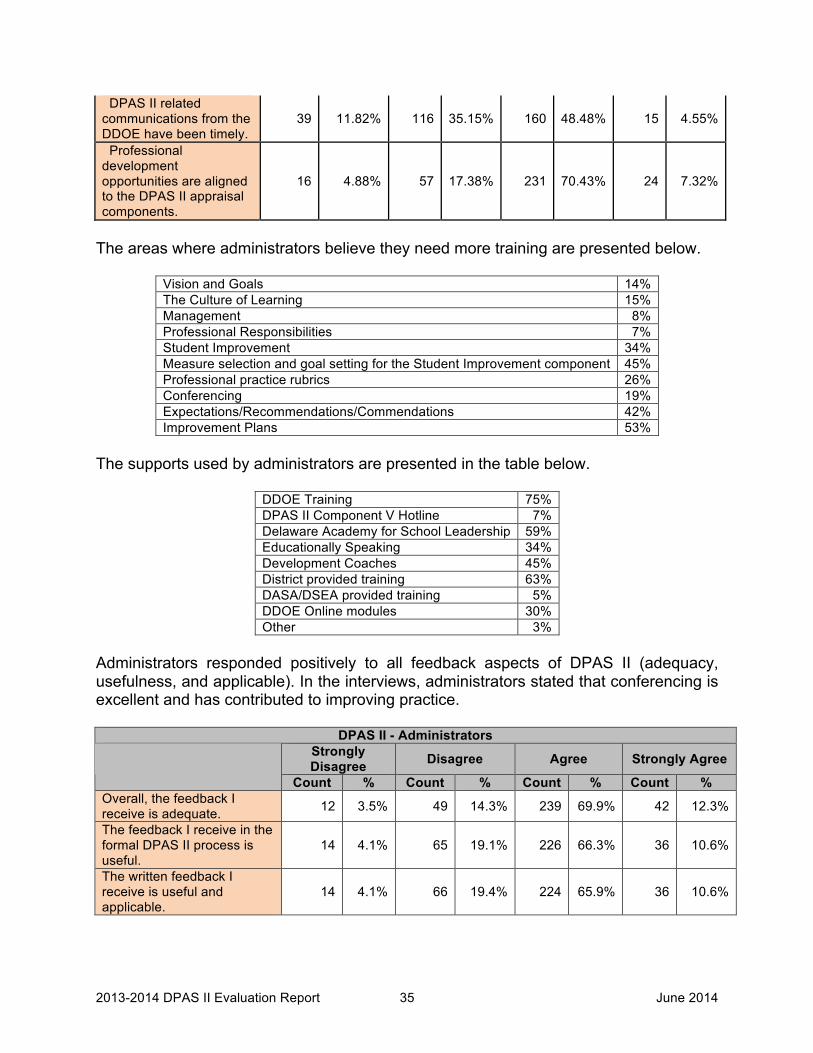
The areas where administrators believe they need more training are presented below.
Vision and Goals 14% The Culture of Learning 15% Management 8% Professional Responsibilities 7% Student Improvement 34% Measure selection and goal setting for the Student Improvement component 45% Professional practice rubrics 26% Conferencing 19% Expectations/Recommendations/Commendations 42% Improvement Plans 53%
The supports used by administrators are presented in the table below.
DDOE Training 75% DPAS II Component V Hotline 7% Delaware Academy for School Leadership 59% Educationally Speaking 34% Development Coaches 45% District provided training 63% DASA/DSEA provided training 5% DDOE Online modules 30% Other 3%
Administrators responded positively to all feedback aspects of DPAS II (adequacy, usefulness, and applicable). In the interviews, administrators stated that conferencing is excellent and has contributed to improving practice.
DPAS II - Administrators Strongly Disagree Disagree Agree Strongly Agree
Count % Count % Count % Count % Overall, the feedback I receive is adequate. 12 3.5% 49 14.3% 239 69.9% 42 12.3%
The feedback I receive in the formal DPAS II process is useful.
14 4.1% 65 19.1% 226 66.3% 36 10.6%
The written feedback I receive is useful and applicable.
14 4.1% 66 19.4% 224 65.9% 36 10.6%
2013-2014 DPAS II Evaluation Report 36 June 2014
DPAS II - Administrators Strongly Disagree Disagree Agree Strongly Agree
Count % Count % Count % Count % The number of conferences/conversations with my evaluator is adequate.
15 4.4% 56 16.4% 218 63.7% 53 15.5%
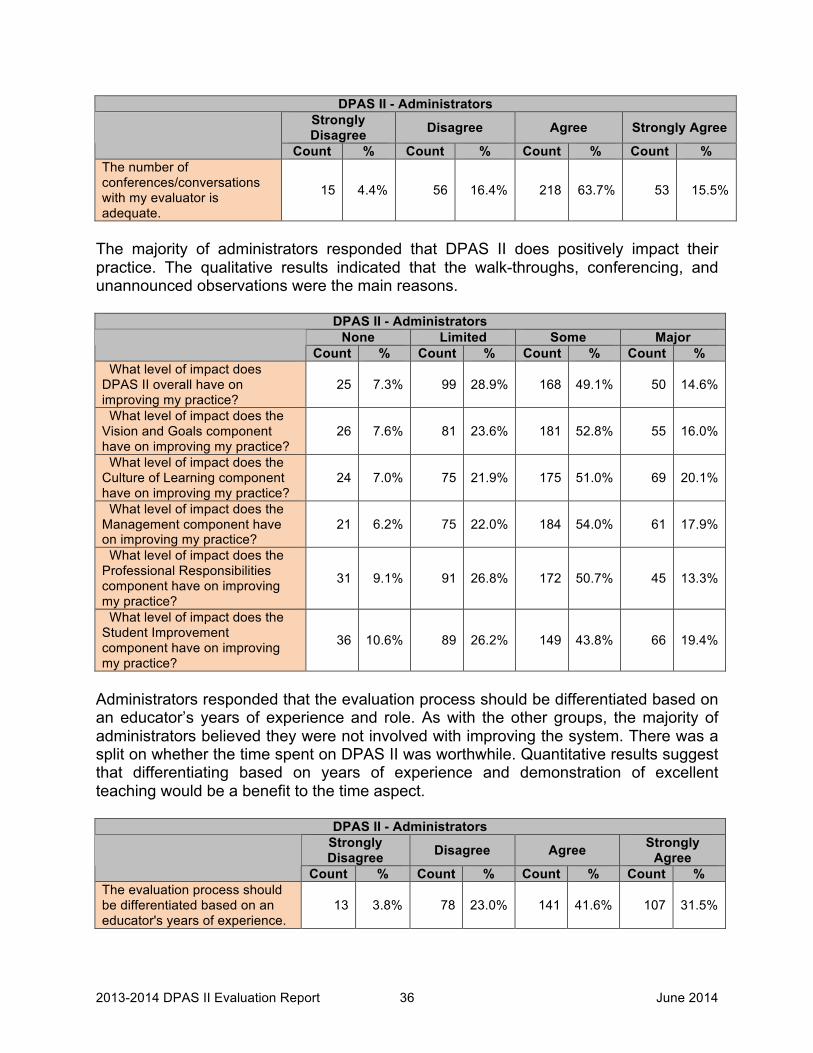
The majority of administrators responded that DPAS II does positively impact their practice. The qualitative results indicated that the walk-throughs, conferencing, and unannounced observations were the main reasons.
DPAS II - Administrators None Limited Some Major Count % Count % Count % Count %
What level of impact does DPAS II overall have on improving my practice?
25 7.3% 99 28.9% 168 49.1% 50 14.6%
What level of impact does the Vision and Goals component have on improving my practice?
26 7.6% 81 23.6% 181 52.8% 55 16.0%
What level of impact does the Culture of Learning component have on improving my practice?
24 7.0% 75 21.9% 175 51.0% 69 20.1%
What level of impact does the Management component have on improving my practice?
21 6.2% 75 22.0% 184 54.0% 61 17.9%
What level of impact does the Professional Responsibilities component have on improving my practice?
31 9.1% 91 26.8% 172 50.7% 45 13.3%
What level of impact does the Student Improvement component have on improving my practice?
36 10.6% 89 26.2% 149 43.8% 66 19.4%
Administrators responded that the evaluation process should be differentiated based on an educator’s years of experience and role. As with the other groups, the majority of administrators believed they were not involved with improving the system. There was a split on whether the time spent on DPAS II was worthwhile. Quantitative results suggest that differentiating based on years of experience and demonstration of excellent teaching would be a benefit to the time aspect.
DPAS II - Administrators Strongly Disagree Disagree Agree Strongly
Agree Count % Count % Count % Count %
The evaluation process should be differentiated based on an educator's years of experience.
13 3.8% 78 23.0% 141 41.6% 107 31.5%
2013-2014 DPAS II Evaluation Report 37 June 2014
DPAS II - Administrators Strongly Disagree Disagree Agree Strongly
Agree Count % Count % Count % Count %
The evaluation process should be differentiated based on an educator's role.
5 1.5% 26 7.6% 193 56.3% 119 34.7%
I was able to contribute to the changes in DPAS II system. 61 18.2% 166 49.6% 95 28.4% 13 3.9%
Administrators have been adequately involved in improving the DPAS II system.
49 14.8% 143 43.1% 123 37.0% 17 5.1%
I believe that criterion-level ratings allowed for meaningful conversations with those whom I evaluated about their growth.
20 6.3% 69 21.7% 203 63.8% 26 8.2%
There are too many criteria. 5 2.4% 52 24.5% 93 43.9% 62 29.2% I am able to implement the DPAS II evaluation system effectively.
7 2.2% 54 16.8% 196 60.9% 65 20.2%
I understand how to use the DPAS II evaluation system with my staff.
1 0.3% 5 1.5% 226 70.0% 91 28.2%
The DPAS II evaluation system helps drive instructional improvement in my work location.
16 5.0% 86 27.0% 182 57.2% 34 10.7%
The DPAS II evaluation system is a worthwhile exercise for driving staff growth and development.
18 5.6% 108 33.6% 168 52.3% 27 8.4%
The time spent on the DPAS II evaluation system is worthwhile. 54 17.1% 127 40.3% 116 36.8% 18 5.7%
Those whom I evaluated knew how to set ambitious goals for student growth.
18 5.6% 91 28.4% 185 57.8% 26 8.1%
Administrators stated they spend an average of 7 hours on DPAS II paperwork on a weekly basis.
Descriptive Statistics N Minimum Maximum Mean Std. Deviation
On a weekly basis, how many hours do you spend on paperwork related to DPAS II?
166 1 10 7.23 3.033
Valid N (listwise) 166
Please select an option that best describes how the DPAS II process compares to other initiatives in your school or work location.
The DPAS II evaluation process
is the most significant driver
DPAS II is one of the top
three efforts.
DPAS II is one of the top five
efforts.
The DPAS II process is not one
of the important drivers of student
Total
2013-2014 DPAS II Evaluation Report 38 June 2014
of student achievement
gains.
achievement gains.
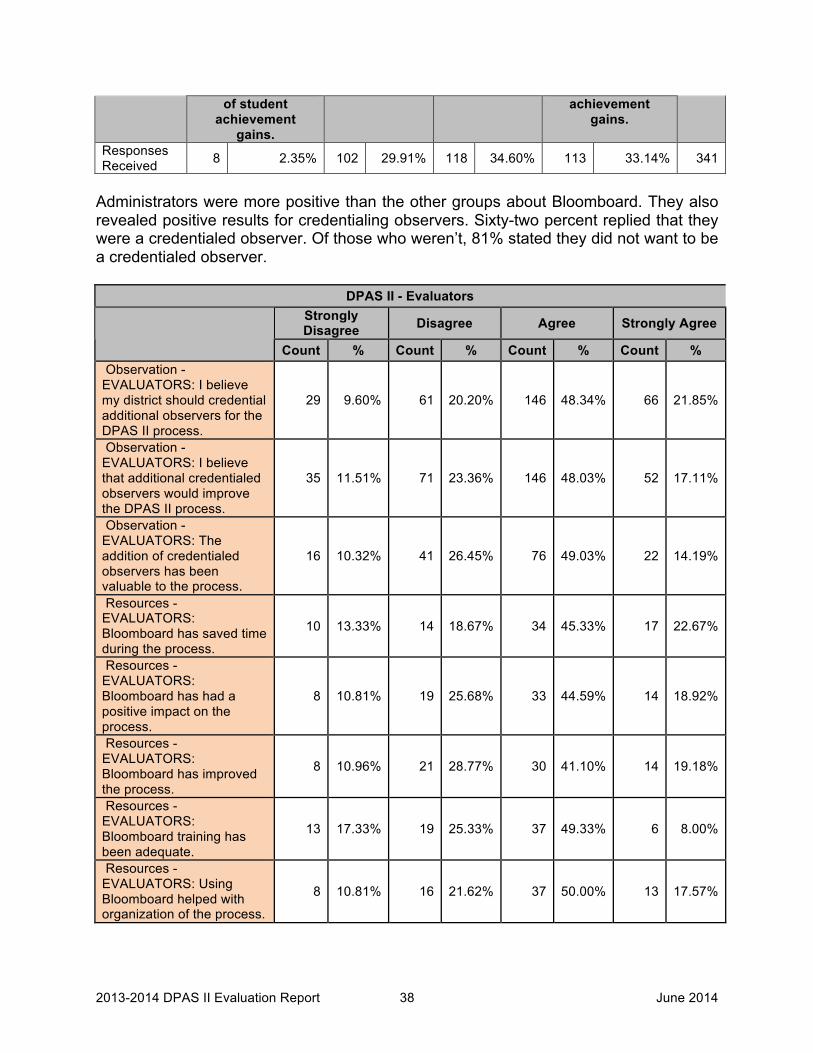
Responses Received 8 2.35% 102 29.91% 118 34.60% 113 33.14% 341
Administrators were more positive than the other groups about Bloomboard. They also revealed positive results for credentialing observers. Sixty-two percent replied that they were a credentialed observer. Of those who weren’t, 81% stated they did not want to be a credentialed observer.
DPAS II - Evaluators Strongly Disagree Disagree Agree Strongly Agree
Count % Count % Count % Count %
Observation - EVALUATORS: I believe my district should credential additional observers for the DPAS II process.
29 9.60% 61 20.20% 146 48.34% 66 21.85%
Observation - EVALUATORS: I believe that additional credentialed observers would improve the DPAS II process.
35 11.51% 71 23.36% 146 48.03% 52 17.11%
Observation - EVALUATORS: The addition of credentialed observers has been valuable to the process.
16 10.32% 41 26.45% 76 49.03% 22 14.19%
Resources - EVALUATORS: Bloomboard has saved time during the process.
10 13.33% 14 18.67% 34 45.33% 17 22.67%
Resources - EVALUATORS: Bloomboard has had a positive impact on the process.
8 10.81% 19 25.68% 33 44.59% 14 18.92%
Resources - EVALUATORS: Bloomboard has improved the process.
8 10.96% 21 28.77% 30 41.10% 14 19.18%
Resources - EVALUATORS: Bloomboard training has been adequate.
13 17.33% 19 25.33% 37 49.33% 6 8.00%
Resources - EVALUATORS: Using Bloomboard helped with organization of the process.
8 10.81% 16 21.62% 37 50.00% 13 17.57%

2013-2014 DPAS II Evaluation Report 39 June 2014
APPENDIX
Teacher Interview Questions
• What do you believe is fair and equitable about the evaluation system? What do you believe is unfair?
• What have you experienced at the school, district, and state levels in regard to consistency, fairness, and organization? Where are there no gaps/disconnects and where are there gaps/disconnects?
• What impact does DPAS II have on improving your teaching? • What aspects of DPAS II would you keep? What aspects would you change?
Components
• What is your opinion about the Professional Responsibilities component, both positive and negative?
o If negative response, ask, “How do you explain the disconnect between 73% of respondents agreeing that the component can be judged fairly and equitably and the idea that it is a poor indicator?”
• What is your opinion about the Student Improvement component, both positive and negative?
• What are two suggestions for improving the Roster Verification System (RVS)? • Were you evaluated through Bloomboard? If so, what one aspect did you like
most and which aspect did you like least? • Survey results indicated that announced observations have a more positive
impact on improving teaching than unannounced observations. What is your opinion on this and why?
• Describe your opinion of walk-throughs for formative and summative evaluations?
• Describe your opinion of each Measure: A, B, and C.; what should remain and what should be revised?
Communication
• What was communicated well and what were communication concerns from DDOE?
Professional Development
• Which aspects of the process do you feel confident with implementing, and in which aspects do you lack confidence?
• How well does professional development align with the appraisals in DPAS II?
2013-2014 DPAS II Evaluation Report 40 June 2014
o If negative response, ask, “What are your suggestions for improvement?” • (If you get to it). Why do you think survey response rates are low?
Specialist Interview Items
• What do you believe is fair and equitable about the evaluation system? What do you believe is unfair?
• What have you experienced at the school, district, and state levels in regard to consistency, fairness, and organization? Where are there no gaps/disconnects and where are there gaps/disconnects?
• What impact does DPAS II have on improving your work? • Which aspects do you believe are relevant and which aspects are not relevant? • Which aspects of DPAS II would you keep? Which aspects would you change? • Do you feel there is sufficient differentiation within DPAS for years of experience?
Specific roles? Why? • Survey results indicated that the majority of specialists did not believe they were
able to contribute to changes in DPAS. In which specific ways could you be engaged in process improvement?
Components
• What is your opinion about the Student Improvement component, both positive and negative?
• What is your opinion about the Student Improvement component, both positive and negative?
• What are two suggestions for improving the Roster Verification System (RVS)? • How could the DPAS paperwork load be reduced so that it is not a burden? • Were you evaluated through Bloomboard? If so, what one aspect did you like
most and which aspect did you like least? Communication
• What was communicated well and what were communication concerns from DDOE?
Professional Development
• Which aspects of the process do you feel confident with implementing, and in which aspects do you lack confidence?
• How well does professional development align with the appraisals in DPAS II? o If negative response, ask “What are your suggestions for improvement?”
2013-2014 DPAS II Evaluation Report 41 June 2014
• (If you get to it). Why do you think survey response rates are low?
Administrator Interview Items
• What do you believe is fair and equitable about the evaluation system? What do you believe is unfair?
• What have you experienced at the school, district, and state levels in regard to consistency, fairness, and organization? Where are there no gaps/disconnects and where are there gaps/disconnects?
• What impact does DPAS II have on improving your work? • Which aspects of DPAS II would you keep? Which aspects would you change? • Where does the DPAS system at the state level demonstrate good organization? • What are the three biggest ways that DPAS improves your practice? Why do
you think teachers might say DPAS doesn’t improve their practice? Specialists? • Do you feel there is sufficient differentiation within DPAS for years of experience?
Specific roles? Why? • Survey results indicated that the majority of administrators did not believe they
were able to contribute to changes in DPAS. In which specific ways could you be engaged in process improvement?
• What are the disconnects between your understanding of how to implement the system with your staff and the actual implementation?
• What specific changes could make the time spent on DPAS more valuable? Components
• What is your opinion about the Professional Responsibilities component, both positive and negative?
o If the response is negative, ask “How do you explain the disconnect between 73% of respondents agreeing that the component can be judged fairly and equitably and the idea that it is a poor indicator?”
• What is your opinion about the Student Improvement component, both positive and negative?
• What are two suggestions for improving the Roster Verification System (RVS)? • How could the DPAS paperwork load be reduced, so that it is not a burden? • Did you use Bloomboard? If so, what one aspect did you like most and which
aspect did you like least? • Describe your opinion of each Measure: A, B, and C.; what should remain and
what should be revised?
2013-2014 DPAS II Evaluation Report 42 June 2014
• What are your thoughts about the criterion-level ratings? Provide three positives and three negatives.
Communication
• What was communicated well and what were communication concerns from DDOE?
Professional Development
• Which aspects of the process do you feel confident with implementing and in which aspects do you lack confidence?
• How well does professional development align with the appraisals in DPAS II? o If negative response, ask “What are your suggestions for improvement?”
• Why do you think teachers would say that PD and DPAS aren’t aligned? Specialists?
• Why do you think survey response rates are low?


![Delaware Performance Appraisal Systemfiles.constantcontact.com/f6736190301/0b2c3728-fb03-49a2...I. INTRODUCTION to DPAS II [1] DPAS-II Guide Revised for Teachers, Updated August 2017](https://img.pdfslide.us/doc/110x75/5f36c5f6be00df163d74bc6e/delaware-performance-appraisal-i-introduction-to-dpas-ii-1-dpas-ii-guide.jpg)


![Delaware Performance Appraisal System...I. INTRODUCTION to DPAS II [1] DPAS-II Guide Revised for Teachers, Updated September 2018 Purpose of the Delaware Performance Appraisal System](https://img.pdfslide.us/doc/110x75/5e8f44b55116f473d3418f8e/delaware-performance-appraisal-system-i-introduction-to-dpas-ii-1-dpas-ii.jpg)