Embed Size (px)
Citation preview
Delaware Information and Analysis Center
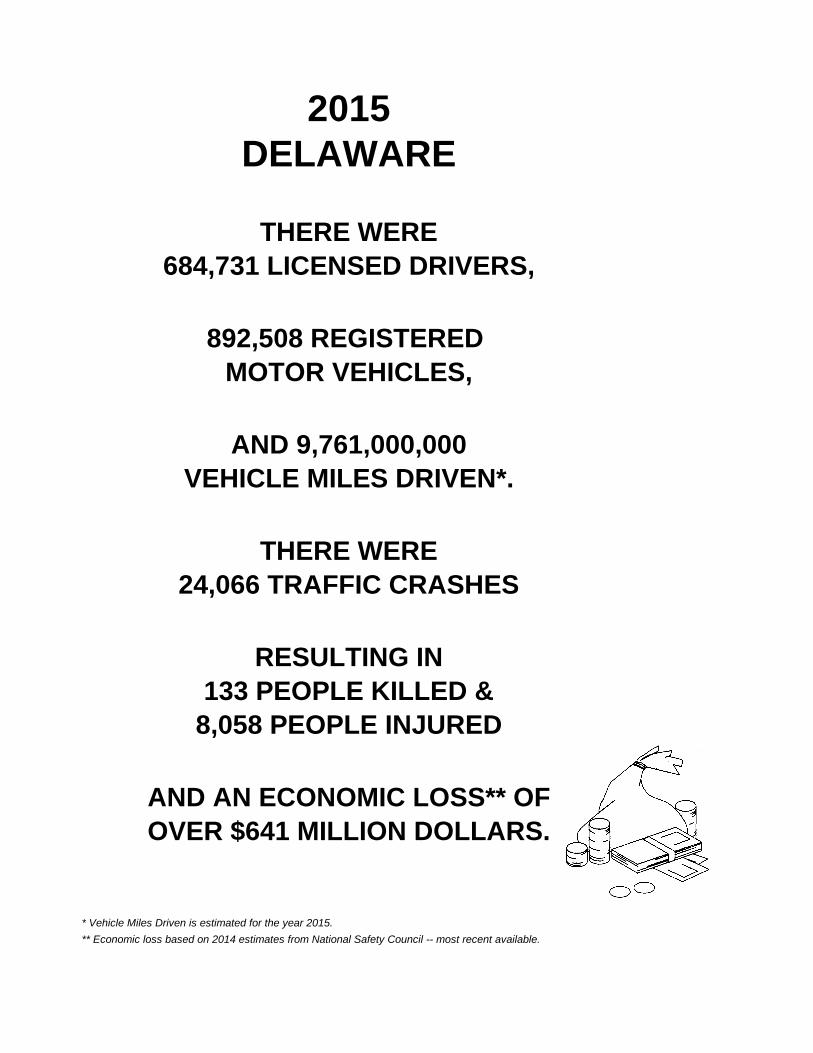
2015DELAWARE
THERE WERE684,731 LICENSED DRIVERS,
892,508 REGISTERED MOTOR VEHICLES,
AND 9,761,000,000VEHICLE MILES DRIVEN*.
THERE WERE24,066 TRAFFIC CRASHES
RESULTING IN133 PEOPLE KILLED &
8,058 PEOPLE INJURED
AND AN ECONOMIC LOSS** OFOVER $641 MILLION DOLLARS.
* Vehicle Miles Driven is estimated for the year 2015.** Economic loss based on 2014 estimates from National Safety Council -- most recent available.
i
INTRODUCTION
This annual compilation of the 2015 crash statistics shows information for crashes occurring on public roadways which produced injuries and/or property damage over $1500. Crashes investigated by all police agencies in Delaware are included in the statistics unless otherwise noted. Delaware’s Annual Traffic Statistical Report for 2015 is available for viewing and printing from the State Police website http://dsp.delaware.gov/reports.shtml. Current as well as past Reports are available. If you have any questions regarding this Report you may contact me by phone at (302) 741-2754 or e-mail at [email protected]. Tammy J. Hyland Data Analyst Delaware Information & Analysis Center Delaware State Police Publication date of report: June, 2016
Table of Contents
Introduction iGeneral Traffic Statistics 1 - 9
Traffic Statistics in Brief 2Population, Licensed Drivers, Registered 3
Motor Vehicles, & Vehicle MileageNumber of Licensed Drivers 4 - 5Vehicle Death Rates 6 - 7Crash & Injury Data History 8Traffic Deaths History 9
General Crash Statistics for 2015 10 - 26Delaware Traffic Crash Facts 11Statewide Fatal Crash Summary 12Crash Comparison by County 13 - 14Type of Crash 15Contributing Circumstances 16Contributing Circumstances in Intersection Related Crashes 17Road, Light, & Weather Conditions 18All Crashes by Day, Hour, & Month 19 - 24Investigating Police Agencies 25 - 26
Vehicle / Driver Statistics 27 - 47Type of Vehicle 28Age of Driver 29Gender & Residence of Driver 30Motorcycle Crashes 31 - 34Bicycle Crashes 35 - 37Truck Crashes 38 - 41School Bus Crashes 42 - 43Pedestrian Crashes 44 - 47
Other Special Topics 48 - 56 Dangerous Times in Delaware 49 - 50Seat Belt Data 51 - 56
Alcohol Related Crashes 57 - 75Alcohol Involvement in Traffic Crashes 58 - 59Alcohol Involvement in Traffic Injuries 60 - 61Crash Fatalities by Age & Gender (All & Alcohol Related) 62 - 63Crash Injuries by Age & Gender (All & Alcohol Related) 64 - 65Drivers Killed by Age & Gender (All & Under the Influence) 66 - 67Alcohol Related Crash Comparisons by County 68 - 69Alcohol Related Crashes by Day, Hour, & Month 70 - 75
Delaware State Police Statistics 76 - 95Crash Investigation 77 - 79Traffic & Truck Enforcement 80 - 81BAC Data for Drivers Arrested for DUI 82 - 84Traffic Arrests Information by Troop (All, Speeding, 55 MPH, 85 - 95
65 MPH, DUI, Dangerous Moving, ChildRestraint, Seat Belt Assessments, PrimarySeat Belt Arrests, Aggressive Driving Related, & Cell Phone Arrests)
Delaware Crash - Crime Clock 96
GeneralTraffic
Statistics
1
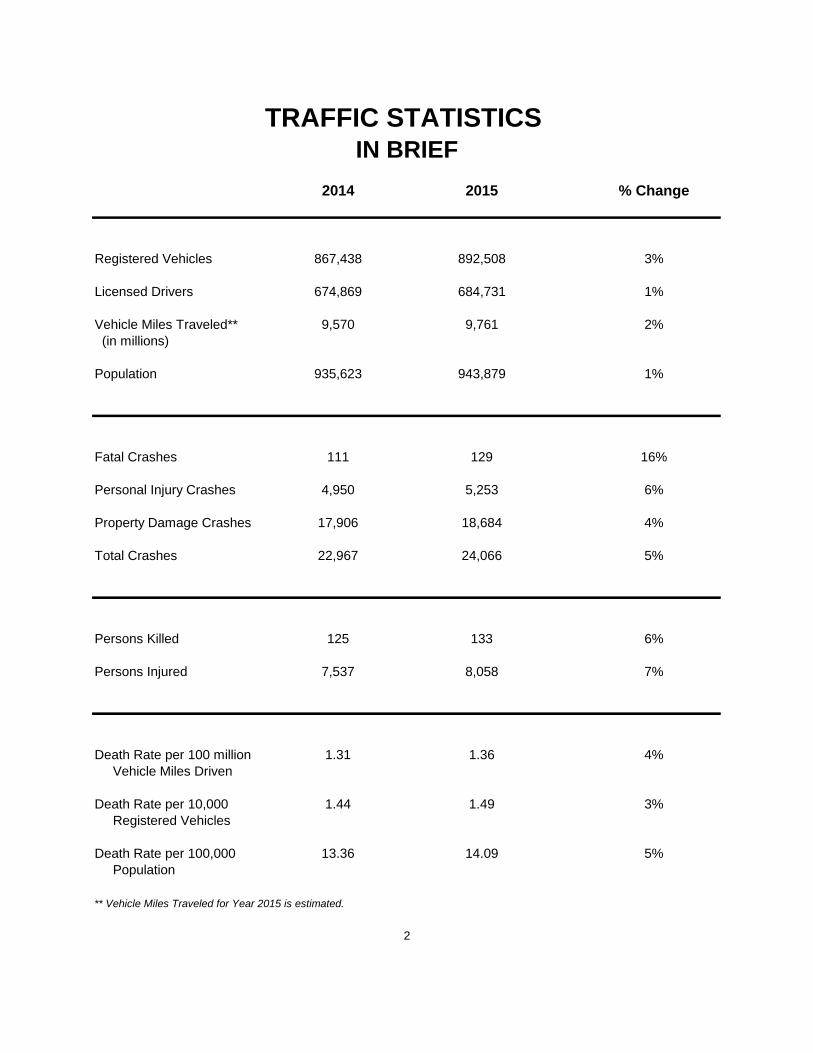
TRAFFIC STATISTICS IN BRIEF
2014 2015 % Change
Registered Vehicles 867,438 892,508 3%
Licensed Drivers 674,869 684,731 1%
Vehicle Miles Traveled** 9,570 9,761 2% (in millions)
Population 935,623 943,879 1%
Fatal Crashes 111 129 16%
Personal Injury Crashes 4,950 5,253 6%
Property Damage Crashes 17,906 18,684 4%
Total Crashes 22,967 24,066 5%
Persons Killed 125 133 6%
Persons Injured 7,537 8,058 7%
Death Rate per 100 million 1.31 1.36 4% Vehicle Miles Driven
Death Rate per 10,000 1.44 1.49 3% Registered Vehicles
Death Rate per 100,000 13.36 14.09 5% Population
** Vehicle Miles Traveled for Year 2015 is estimated.
2
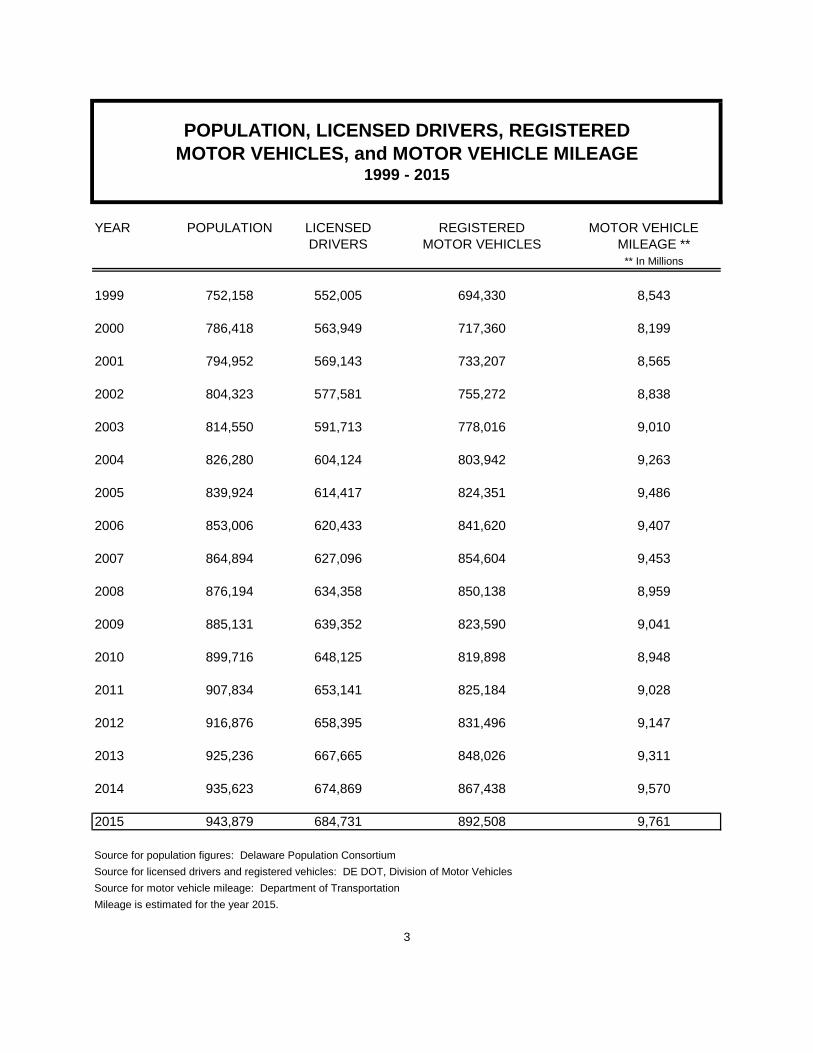
POPULATION, LICENSED DRIVERS, REGISTEREDMOTOR VEHICLES, and MOTOR VEHICLE MILEAGE
1999 - 2015
YEAR POPULATION LICENSED REGISTERED MOTOR VEHICLEDRIVERS MOTOR VEHICLES MILEAGE **
** In Millions
1999 752,158 552,005 694,330 8,543
2000 786,418 563,949 717,360 8,199
2001 794,952 569,143 733,207 8,565
2002 804,323 577,581 755,272 8,838
2003 814,550 591,713 778,016 9,010
2004 826,280 604,124 803,942 9,263
2005 839,924 614,417 824,351 9,486
2006 853,006 620,433 841,620 9,407
2007 864,894 627,096 854,604 9,453
2008 876,194 634,358 850,138 8,959
2009 885,131 639,352 823,590 9,041
2010 899,716 648,125 819,898 8,948
2011 907,834 653,141 825,184 9,028
2012 916,876 658,395 831,496 9,147
2013 925,236 667,665 848,026 9,311
2014 935,623 674,869 867,438 9,570
2015 943,879 684,731 892,508 9,761
Source for population figures: Delaware Population ConsortiumSource for licensed drivers and registered vehicles: DE DOT, Division of Motor VehiclesSource for motor vehicle mileage: Department of TransportationMileage is estimated for the year 2015.
3
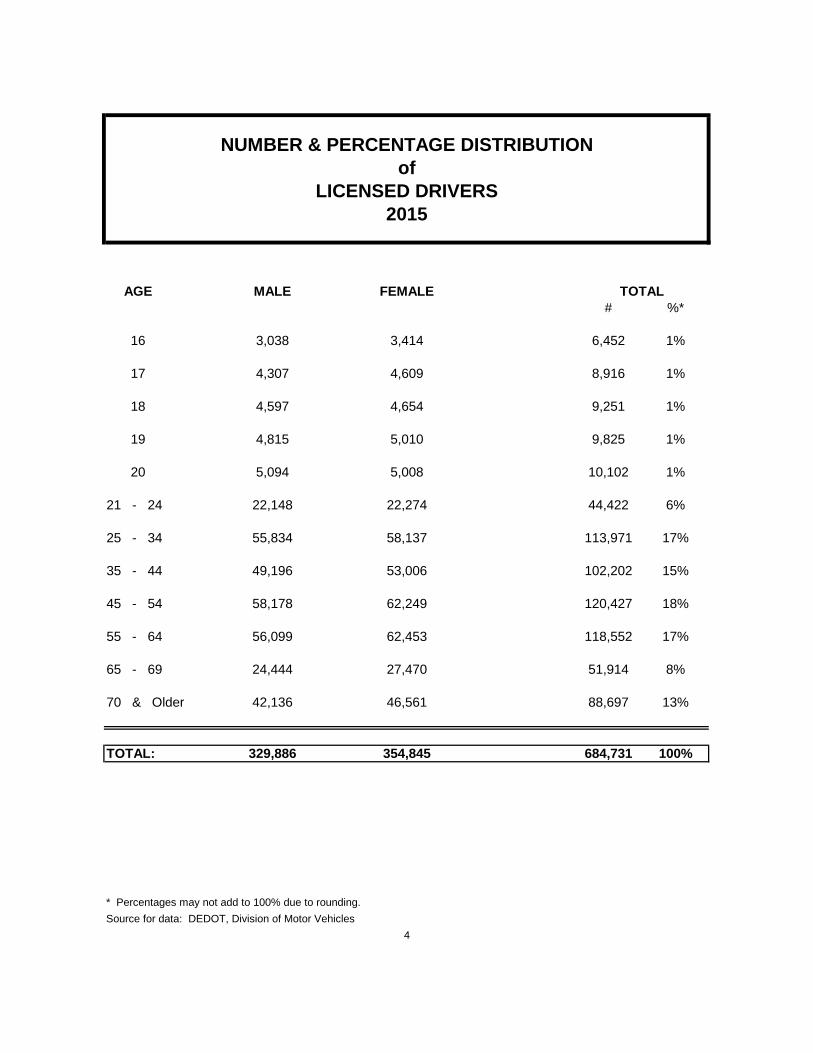
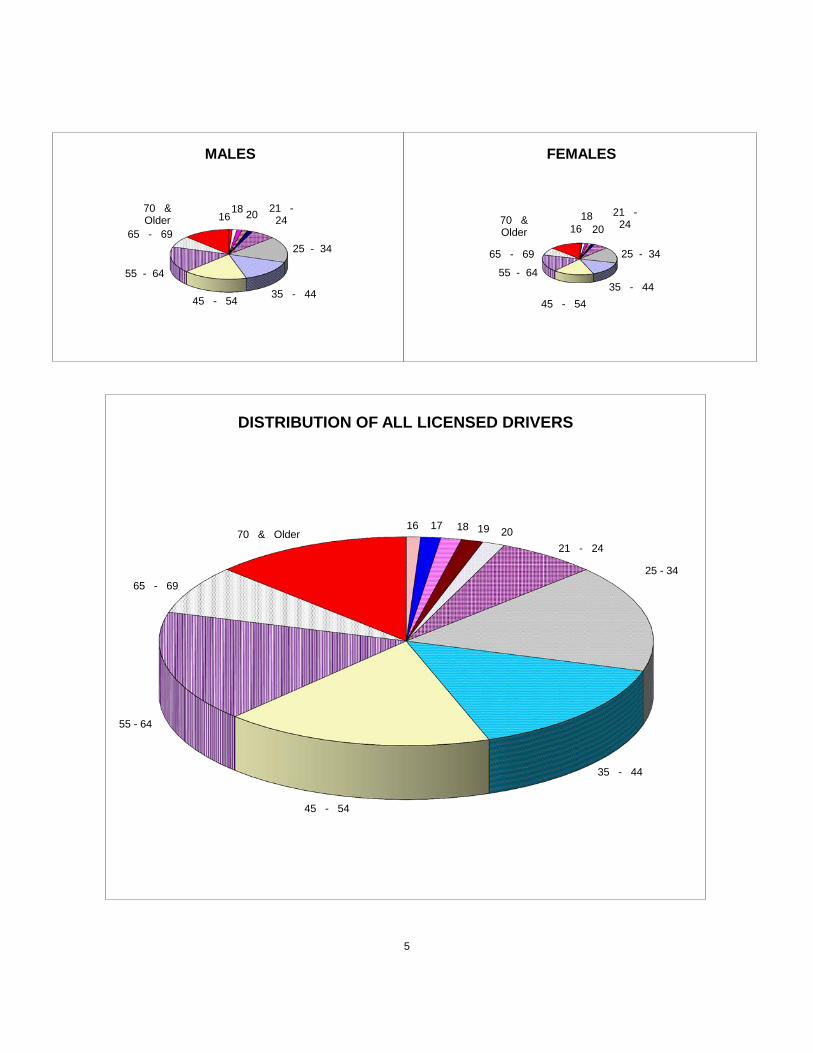
NUMBER & PERCENTAGE DISTRIBUTIONof
LICENSED DRIVERS2015
AGE MALE FEMALE TOTAL# %*
16 3,038 3,414 6,452 1%
17 4,307 4,609 8,916 1%
18 4,597 4,654 9,251 1%
19 4,815 5,010 9,825 1%
20 5,094 5,008 10,102 1%
21 - 24 22,148 22,274 44,422 6%
25 - 34 55,834 58,137 113,971 17%
35 - 44 49,196 53,006 102,202 15%
45 - 54 58,178 62,249 120,427 18%
55 - 64 56,099 62,453 118,552 17%
65 - 69 24,444 27,470 51,914 8%
70 & Older 42,136 46,561 88,697 13%
TOTAL: 329,886 354,845 684,731 100%
* Percentages may not add to 100% due to rounding.Source for data: DEDOT, Division of Motor Vehicles
4
5
16 18 20 21 -
24
25 - 34
35 - 44 45 - 54
55 - 64
65 - 69
70 & Older
MALES
16 18
20 21 -
24
25 - 34
35 - 44 45 - 54
55 - 64
65 - 69
70 & Older
FEMALES
16 17 18 19 20 21 - 24
25 - 34
35 - 44
45 - 54
55 - 64
65 - 69
70 & Older
DISTRIBUTION OF ALL LICENSED DRIVERS
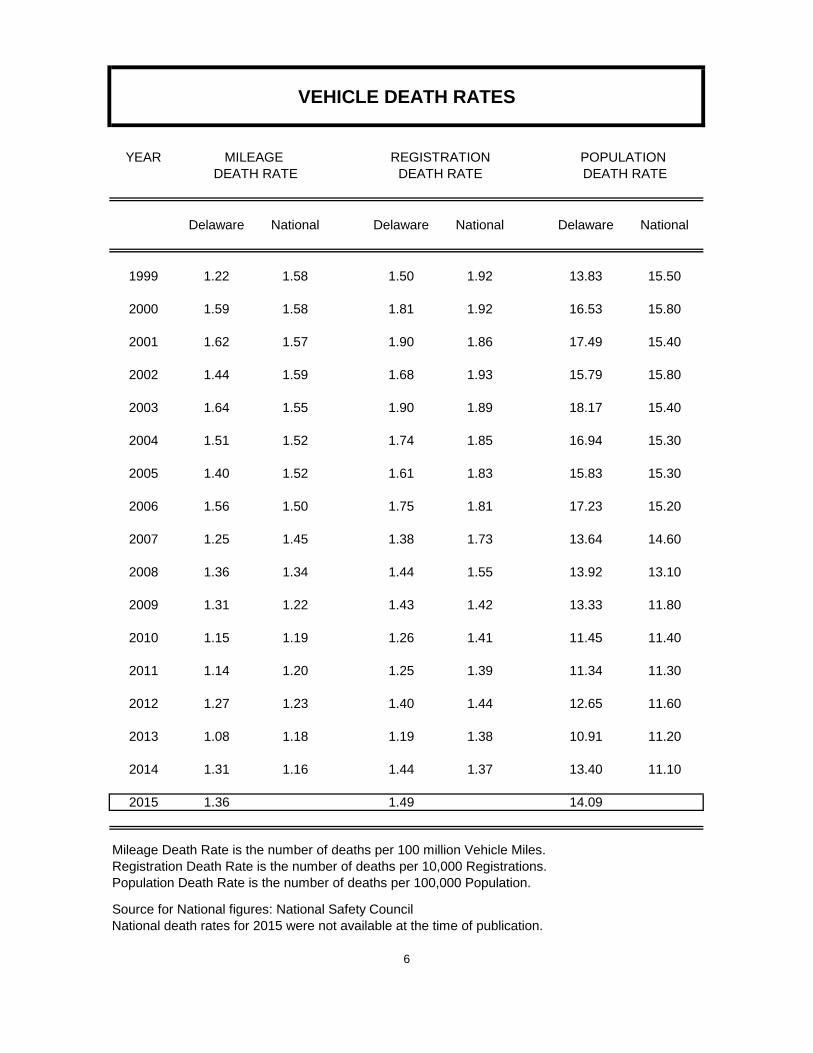
VEHICLE DEATH RATES
YEAR MILEAGE REGISTRATION POPULATION DEATH RATE DEATH RATE DEATH RATE
Delaware National Delaware National Delaware National
1999 1.22 1.58 1.50 1.92 13.83 15.50
2000 1.59 1.58 1.81 1.92 16.53 15.80
2001 1.62 1.57 1.90 1.86 17.49 15.40
2002 1.44 1.59 1.68 1.93 15.79 15.80
2003 1.64 1.55 1.90 1.89 18.17 15.40
2004 1.51 1.52 1.74 1.85 16.94 15.30
2005 1.40 1.52 1.61 1.83 15.83 15.30
2006 1.56 1.50 1.75 1.81 17.23 15.20
2007 1.25 1.45 1.38 1.73 13.64 14.60
2008 1.36 1.34 1.44 1.55 13.92 13.10
2009 1.31 1.22 1.43 1.42 13.33 11.80
2010 1.15 1.19 1.26 1.41 11.45 11.40
2011 1.14 1.20 1.25 1.39 11.34 11.30
2012 1.27 1.23 1.40 1.44 12.65 11.60
2013 1.08 1.18 1.19 1.38 10.91 11.20
2014 1.31 1.16 1.44 1.37 13.40 11.10
2015 1.36 1.49 14.09
Mileage Death Rate is the number of deaths per 100 million Vehicle Miles.Registration Death Rate is the number of deaths per 10,000 Registrations.Population Death Rate is the number of deaths per 100,000 Population.
Source for National figures: National Safety CouncilNational death rates for 2015 were not available at the time of publication.
6
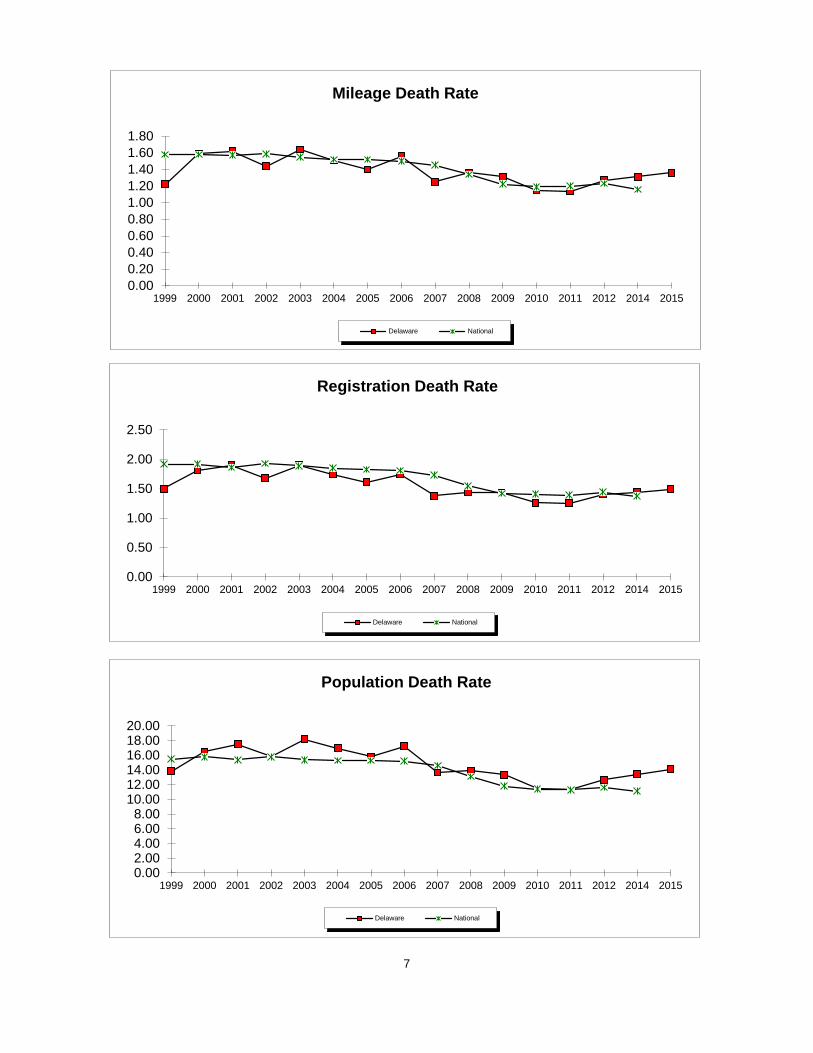
7
0.000.200.400.600.801.001.201.401.601.80
1999 2000 2001 2002 2003 2004 2005 2006 2007 2008 2009 2010 2011 2012 2014 2015
Mileage Death Rate
Delaware National
0.00
0.50
1.00
1.50
2.00
2.50
1999 2000 2001 2002 2003 2004 2005 2006 2007 2008 2009 2010 2011 2012 2014 2015
Registration Death Rate
Delaware National
0.002.004.006.008.00
10.0012.0014.0016.0018.0020.00
1999 2000 2001 2002 2003 2004 2005 2006 2007 2008 2009 2010 2011 2012 2014 2015
Population Death Rate
Delaware National
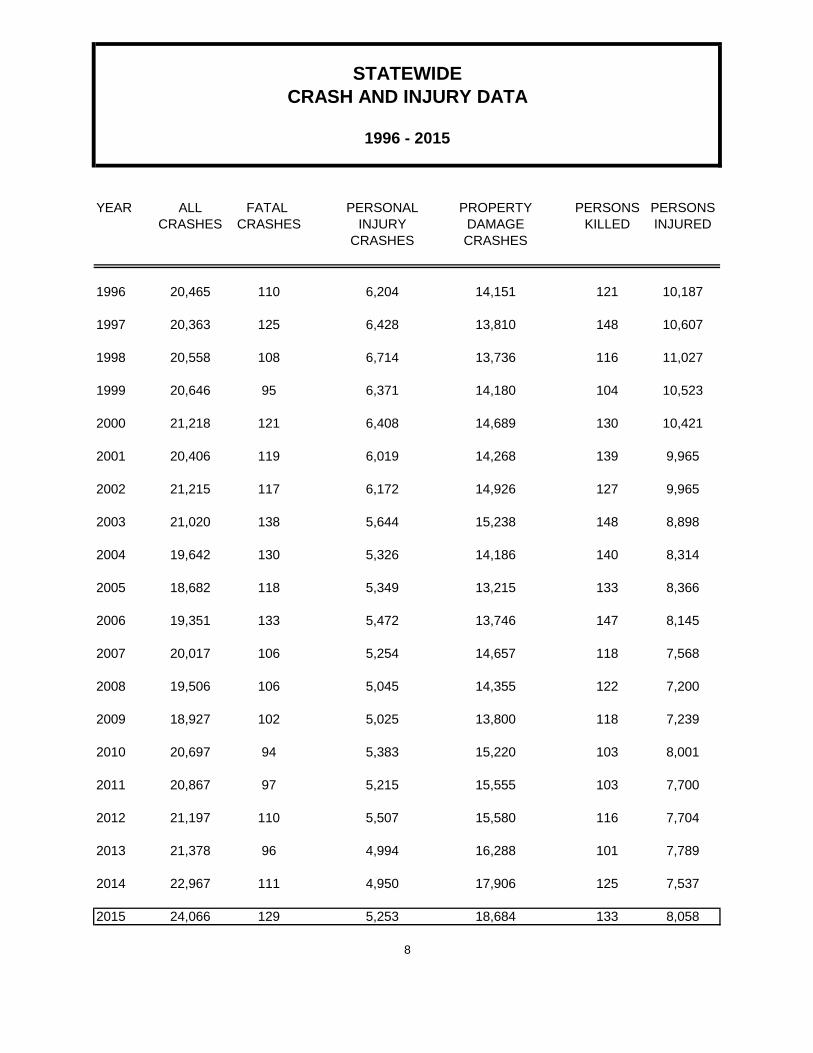
STATEWIDECRASH AND INJURY DATA
1996 - 2015
YEAR ALL FATAL PERSONAL PROPERTY PERSONS PERSONSCRASHES CRASHES INJURY DAMAGE KILLED INJURED
CRASHES CRASHES
1996 20,465 110 6,204 14,151 121 10,187
1997 20,363 125 6,428 13,810 148 10,607
1998 20,558 108 6,714 13,736 116 11,027
1999 20,646 95 6,371 14,180 104 10,523
2000 21,218 121 6,408 14,689 130 10,421
2001 20,406 119 6,019 14,268 139 9,965
2002 21,215 117 6,172 14,926 127 9,965
2003 21,020 138 5,644 15,238 148 8,898
2004 19,642 130 5,326 14,186 140 8,314
2005 18,682 118 5,349 13,215 133 8,366
2006 19,351 133 5,472 13,746 147 8,145
2007 20,017 106 5,254 14,657 118 7,568
2008 19,506 106 5,045 14,355 122 7,200
2009 18,927 102 5,025 13,800 118 7,239
2010 20,697 94 5,383 15,220 103 8,001
2011 20,867 97 5,215 15,555 103 7,700
2012 21,197 110 5,507 15,580 116 7,704
2013 21,378 96 4,994 16,288 101 7,789
2014 22,967 111 4,950 17,906 125 7,537
2015 24,066 129 5,253 18,684 133 8,058
8
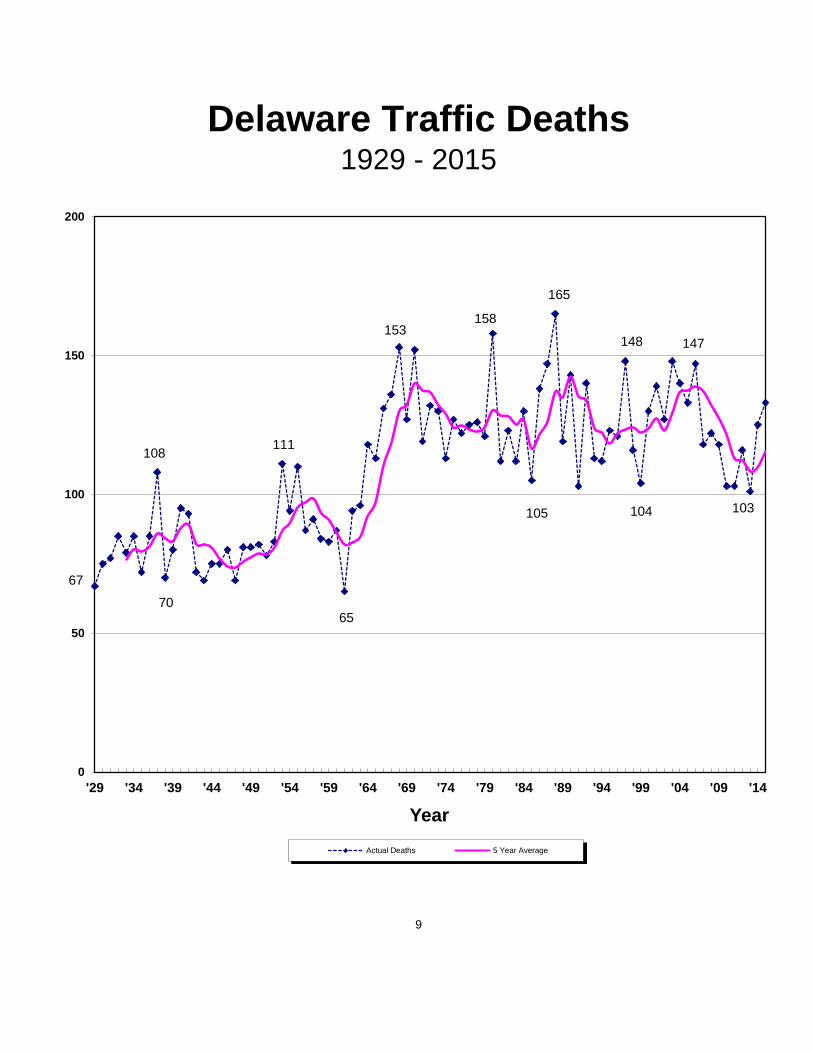
Delaware Traffic Deaths1929 - 2015
9
0
50
100
150
200
'29 '34 '39 '44 '49 '54 '59 '64 '69 '74 '79 '84 '89 '94 '99 '04 '09 '14
Year Actual Deaths 5 Year Average
67
108 111
158
105
165
148 153
65 70
104 103
147
GeneralCrash Statistics
for
2015
10
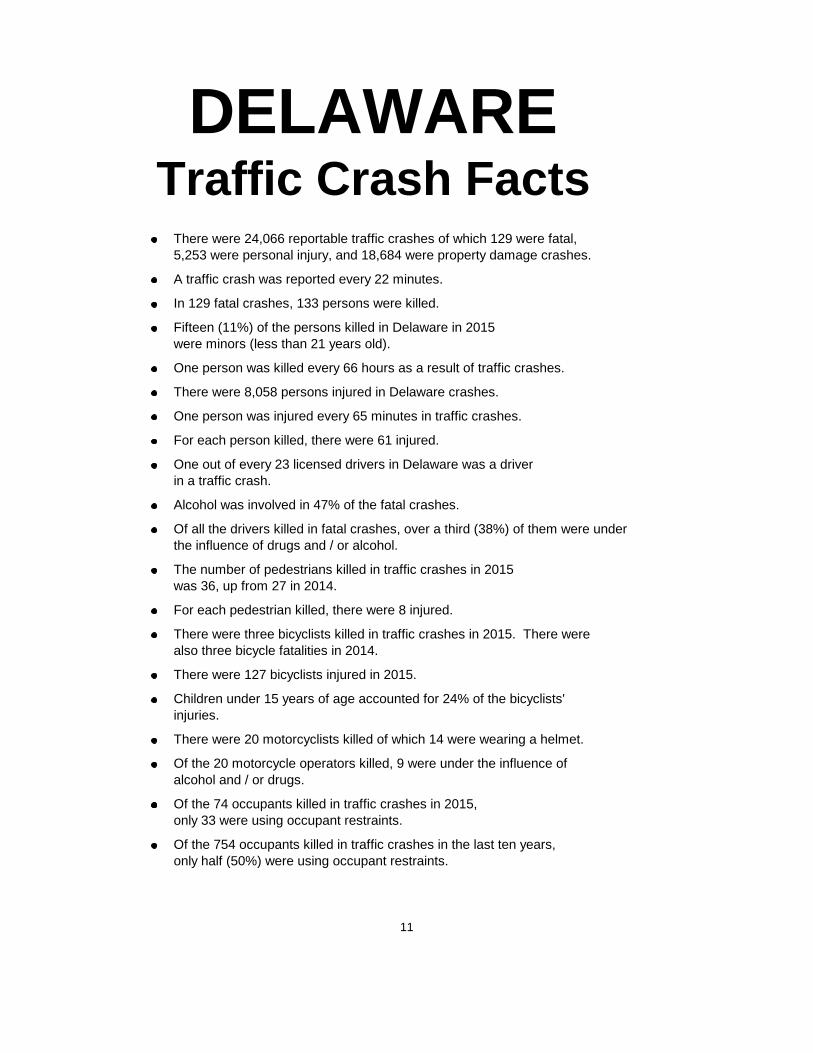
DELAWARETraffic Crash Facts
There were 24,066 reportable traffic crashes of which 129 were fatal,5,253 were personal injury, and 18,684 were property damage crashes.
A traffic crash was reported every 22 minutes.
In 129 fatal crashes, 133 persons were killed.
Fifteen (11%) of the persons killed in Delaware in 2015were minors (less than 21 years old).
One person was killed every 66 hours as a result of traffic crashes.
There were 8,058 persons injured in Delaware crashes.
One person was injured every 65 minutes in traffic crashes.
For each person killed, there were 61 injured.
One out of every 23 licensed drivers in Delaware was a driverin a traffic crash.
Alcohol was involved in 47% of the fatal crashes.
Of all the drivers killed in fatal crashes, over a third (38%) of them were underthe influence of drugs and / or alcohol.
The number of pedestrians killed in traffic crashes in 2015was 36, up from 27 in 2014.
For each pedestrian killed, there were 8 injured.
There were three bicyclists killed in traffic crashes in 2015. There werealso three bicycle fatalities in 2014.
There were 127 bicyclists injured in 2015.
Children under 15 years of age accounted for 24% of the bicyclists'injuries.
There were 20 motorcyclists killed of which 14 were wearing a helmet.
Of the 20 motorcycle operators killed, 9 were under the influence ofalcohol and / or drugs.
Of the 74 occupants killed in traffic crashes in 2015,only 33 were using occupant restraints.
Of the 754 occupants killed in traffic crashes in the last ten years,only half (50%) were using occupant restraints.
11
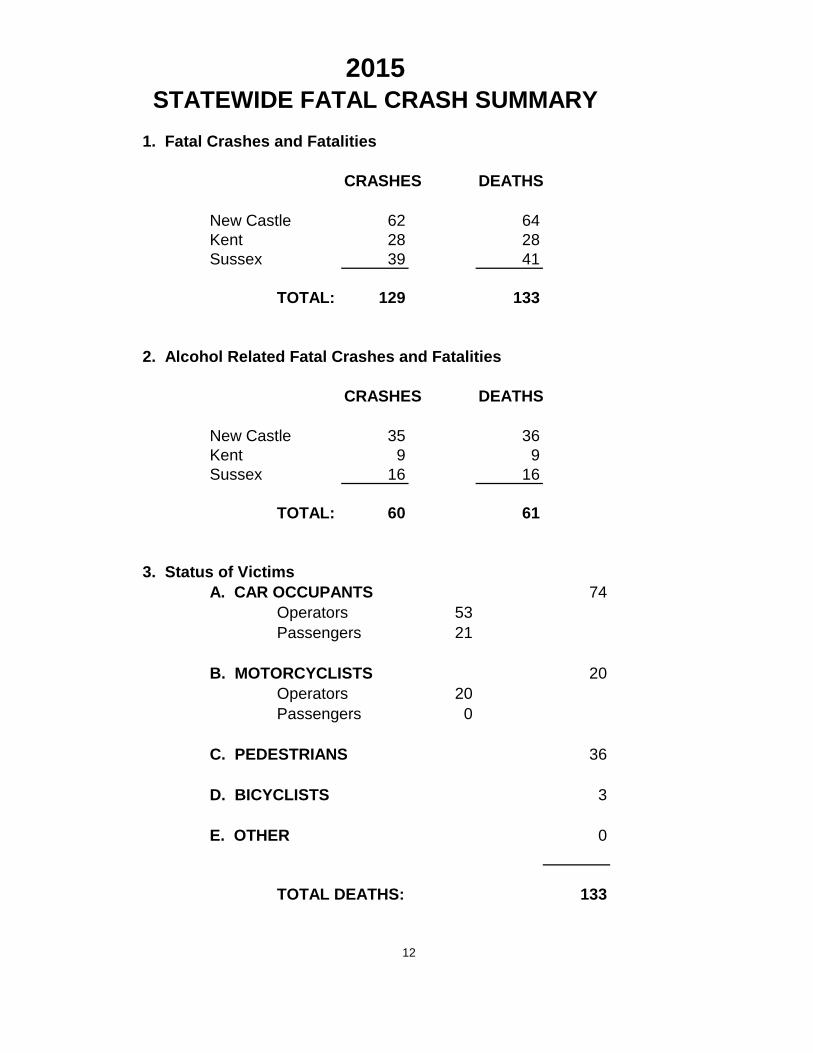
2015STATEWIDE FATAL CRASH SUMMARY
1. Fatal Crashes and Fatalities
CRASHES DEATHS
New Castle 62 64Kent 28 28Sussex 39 41
TOTAL: 129 133
2. Alcohol Related Fatal Crashes and Fatalities
CRASHES DEATHS
New Castle 35 36Kent 9 9Sussex 16 16
TOTAL: 60 61
3. Status of VictimsA. CAR OCCUPANTS 74
Operators 53Passengers 21
B. MOTORCYCLISTS 20Operators 20Passengers 0
C. PEDESTRIANS 36
D. BICYCLISTS 3
E. OTHER 0
TOTAL DEATHS: 133
12
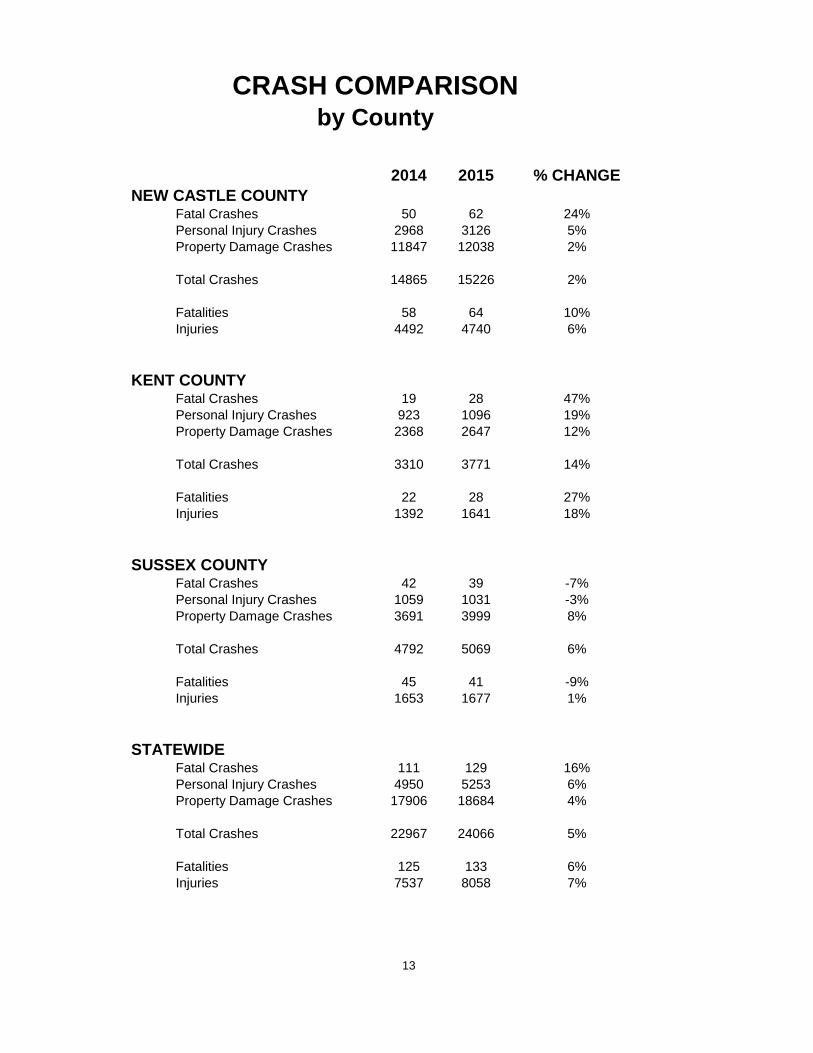
CRASH COMPARISONby County
2014 2015 % CHANGE NEW CASTLE COUNTY
Fatal Crashes 50 62 24%Personal Injury Crashes 2968 3126 5%Property Damage Crashes 11847 12038 2%
Total Crashes 14865 15226 2%
Fatalities 58 64 10%Injuries 4492 4740 6%
KENT COUNTYFatal Crashes 19 28 47%Personal Injury Crashes 923 1096 19%Property Damage Crashes 2368 2647 12%
Total Crashes 3310 3771 14%
Fatalities 22 28 27%Injuries 1392 1641 18%
SUSSEX COUNTYFatal Crashes 42 39 -7%Personal Injury Crashes 1059 1031 -3%Property Damage Crashes 3691 3999 8%
Total Crashes 4792 5069 6%
Fatalities 45 41 -9%Injuries 1653 1677 1%
STATEWIDEFatal Crashes 111 129 16%Personal Injury Crashes 4950 5253 6%Property Damage Crashes 17906 18684 4%
Total Crashes 22967 24066 5%
Fatalities 125 133 6%Injuries 7537 8058 7%
13
14
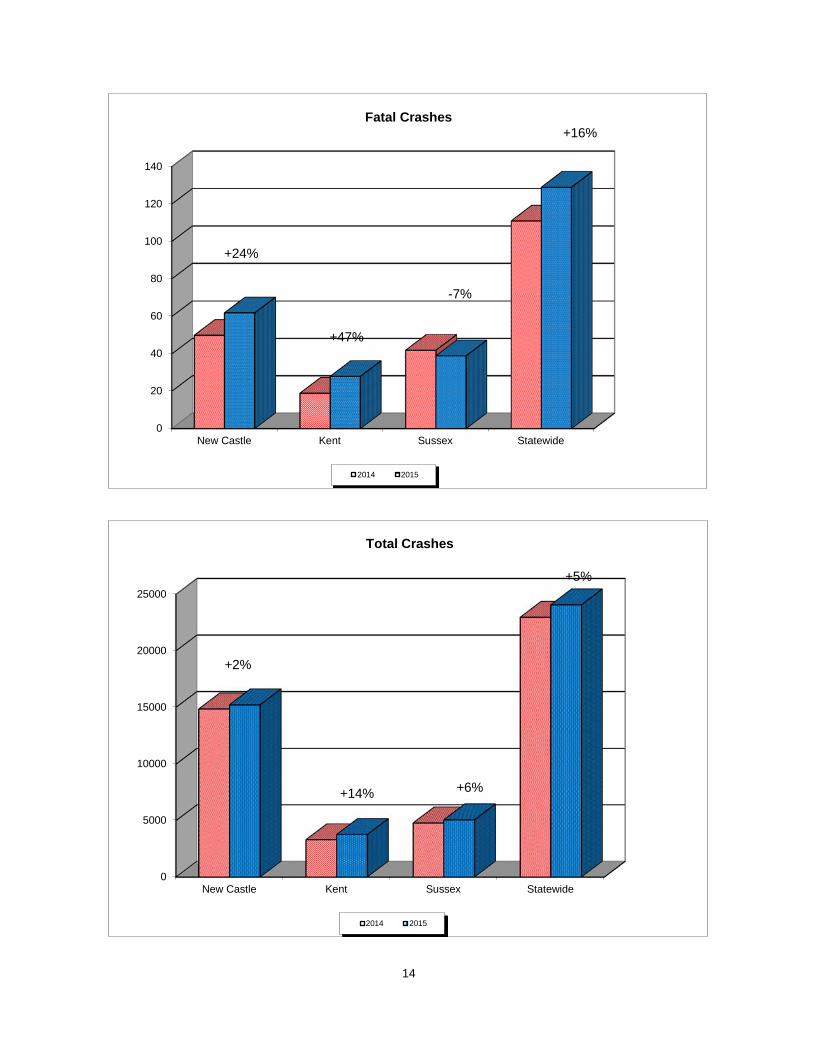
0
20
40
60
80
100
120
140
New Castle Kent Sussex Statewide
Fatal Crashes
2014 2015
+24%
+47%
-7%
+16%
0
5000
10000
15000
20000
25000
New Castle Kent Sussex Statewide
Total Crashes
2014 2015
+2%
+14% +6%
+5%
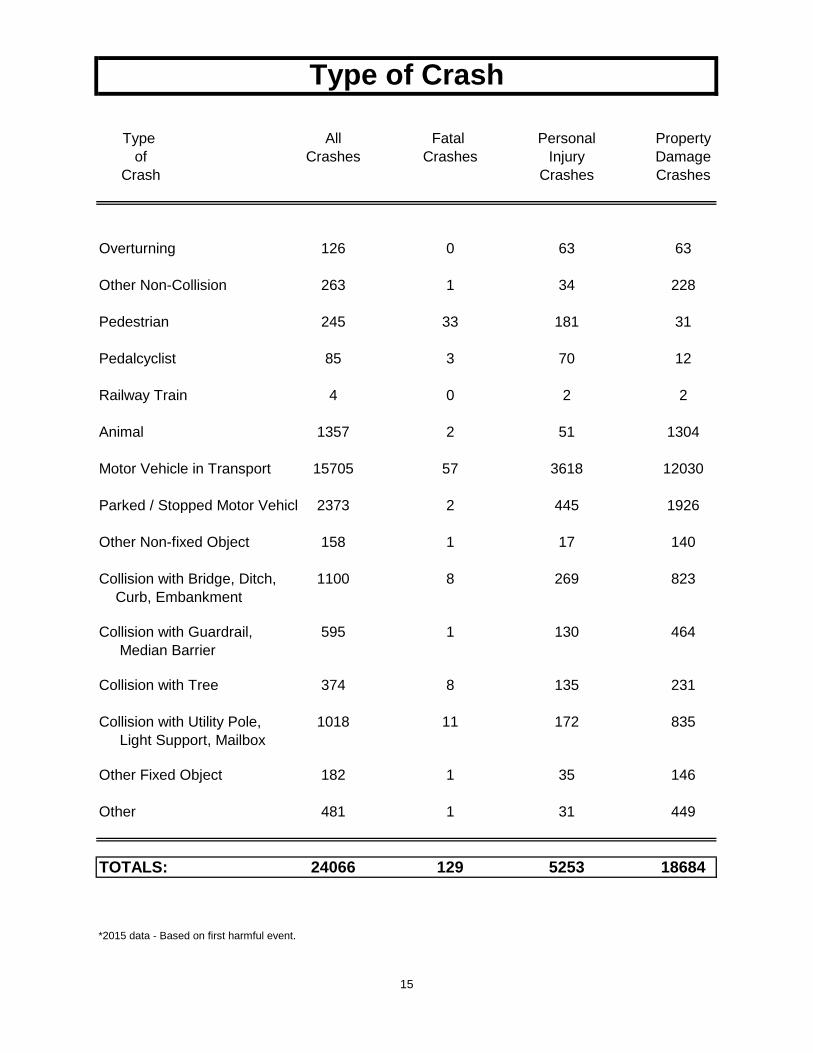
Type of Crash
Type All Fatal Personal Propertyof Crashes Crashes Injury Damage
Crash Crashes Crashes
Overturning 126 0 63 63
Other Non-Collision 263 1 34 228
Pedestrian 245 33 181 31
Pedalcyclist 85 3 70 12
Railway Train 4 0 2 2
Animal 1357 2 51 1304
Motor Vehicle in Transport 15705 57 3618 12030
Parked / Stopped Motor Vehicl 2373 2 445 1926
Other Non-fixed Object 158 1 17 140
Collision with Bridge, Ditch, 1100 8 269 823 Curb, Embankment
Collision with Guardrail, 595 1 130 464 Median Barrier
Collision with Tree 374 8 135 231
Collision with Utility Pole, 1018 11 172 835 Light Support, Mailbox
Other Fixed Object 182 1 35 146
Other 481 1 31 449
TOTALS: 24066 129 5253 18684
*2015 data - Based on first harmful event.
15
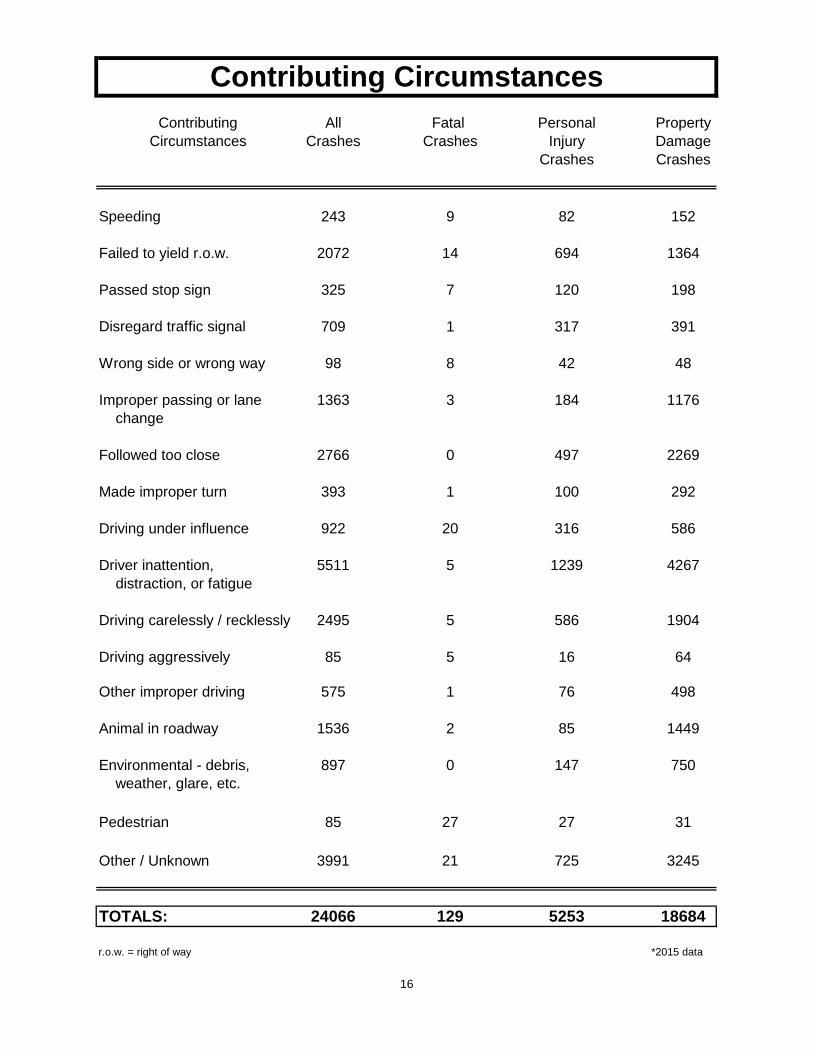
Contributing CircumstancesContributing All Fatal Personal Property
Circumstances Crashes Crashes Injury DamageCrashes Crashes
Speeding 243 9 82 152
Failed to yield r.o.w. 2072 14 694 1364
Passed stop sign 325 7 120 198
Disregard traffic signal 709 1 317 391
Wrong side or wrong way 98 8 42 48
Improper passing or lane 1363 3 184 1176 change
Followed too close 2766 0 497 2269
Made improper turn 393 1 100 292
Driving under influence 922 20 316 586
Driver inattention, 5511 5 1239 4267 distraction, or fatigue
Driving carelessly / recklessly 2495 5 586 1904
Driving aggressively 85 5 16 64
Other improper driving 575 1 76 498
Animal in roadway 1536 2 85 1449
Environmental - debris, 897 0 147 750 weather, glare, etc.
Pedestrian 85 27 27 31
Other / Unknown 3991 21 725 3245
TOTALS: 24066 129 5253 18684
r.o.w. = right of way *2015 data
16
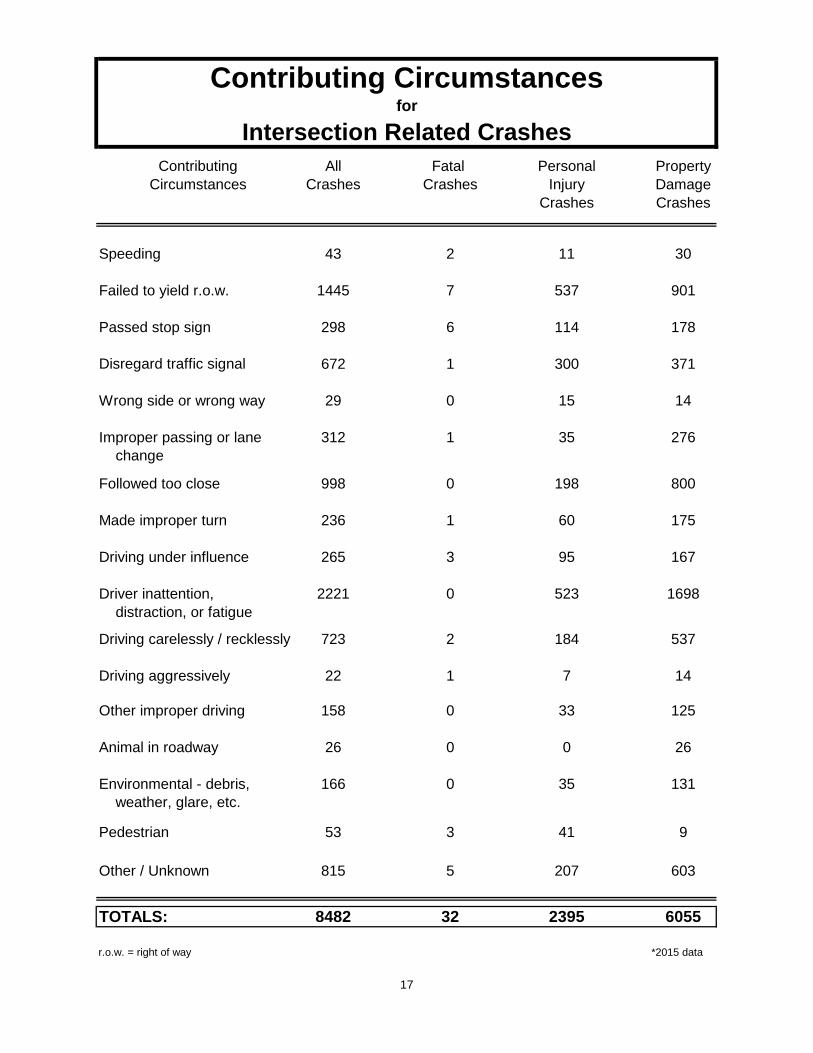
Contributing Circumstancesfor
Intersection Related CrashesContributing All Fatal Personal Property
Circumstances Crashes Crashes Injury DamageCrashes Crashes
Speeding 43 2 11 30
Failed to yield r.o.w. 1445 7 537 901
Passed stop sign 298 6 114 178
Disregard traffic signal 672 1 300 371
Wrong side or wrong way 29 0 15 14
Improper passing or lane 312 1 35 276 change
Followed too close 998 0 198 800
Made improper turn 236 1 60 175
Driving under influence 265 3 95 167
Driver inattention, 2221 0 523 1698 distraction, or fatigue
Driving carelessly / recklessly 723 2 184 537
Driving aggressively 22 1 7 14
Other improper driving 158 0 33 125
Animal in roadway 26 0 0 26
Environmental - debris, 166 0 35 131 weather, glare, etc.
Pedestrian 53 3 41 9
Other / Unknown 815 5 207 603
TOTALS: 8482 32 2395 6055
r.o.w. = right of way *2015 data
17
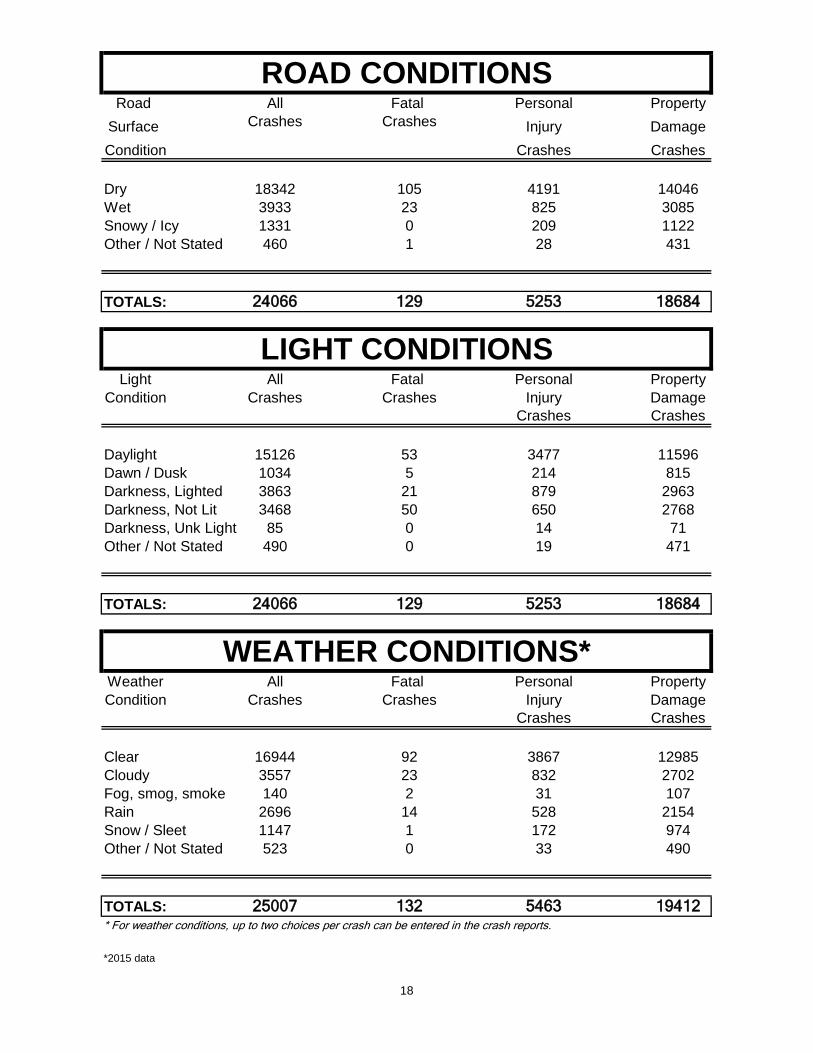
ROAD CONDITIONSRoad All Fatal Personal Property
Surface Crashes Crashes Injury DamageCondition Crashes Crashes
Dry 18342 105 4191 14046Wet 3933 23 825 3085Snowy / Icy 1331 0 209 1122Other / Not Stated 460 1 28 431
TOTALS: 24066 129 5253 18684
LIGHT CONDITIONSLight All Fatal Personal Property
Condition Crashes Crashes Injury DamageCrashes Crashes
Daylight 15126 53 3477 11596Dawn / Dusk 1034 5 214 815Darkness, Lighted 3863 21 879 2963Darkness, Not Lit 3468 50 650 2768Darkness, Unk Light 85 0 14 71Other / Not Stated 490 0 19 471
TOTALS: 24066 129 5253 18684
WEATHER CONDITIONS*Weather All Fatal Personal PropertyCondition Crashes Crashes Injury Damage
Crashes Crashes
Clear 16944 92 3867 12985Cloudy 3557 23 832 2702Fog, smog, smoke 140 2 31 107Rain 2696 14 528 2154Snow / Sleet 1147 1 172 974Other / Not Stated 523 0 33 490
TOTALS: 25007 132 5463 19412* For weather conditions, up to two choices per crash can be entered in the crash reports.
*2015 data
18
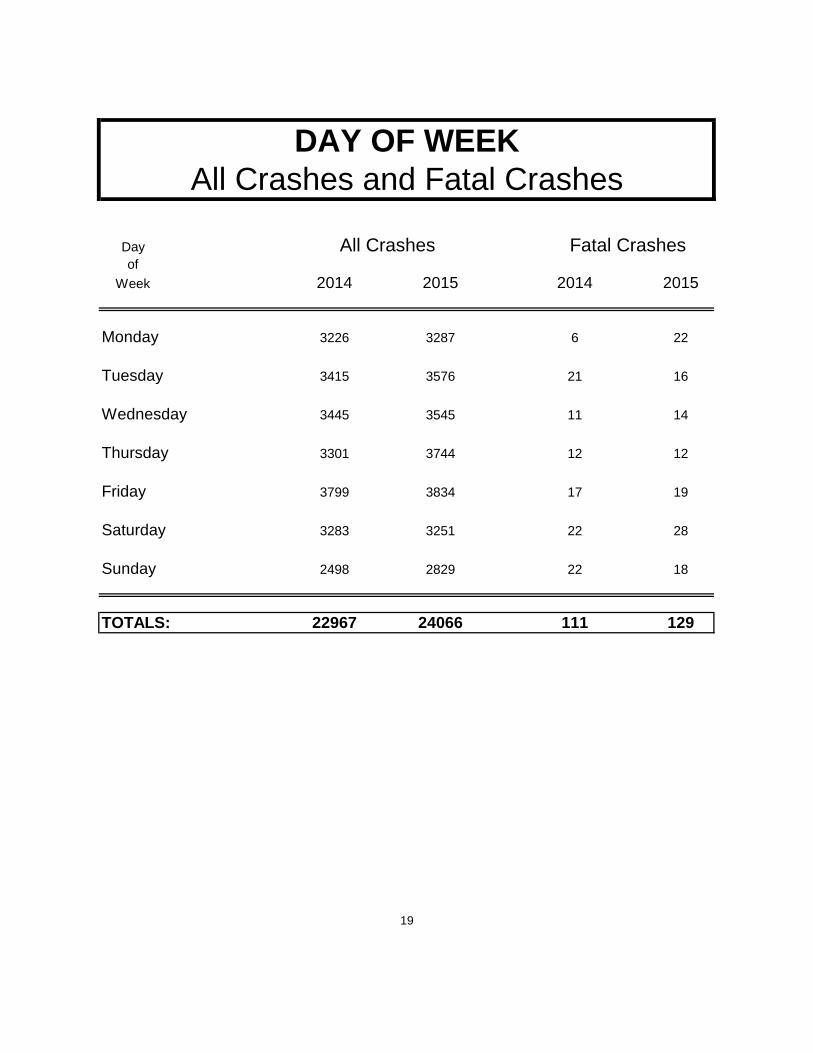
DAY OF WEEKAll Crashes and Fatal Crashes
Day All Crashes Fatal Crashesof
Week 2014 2015 2014 2015
Monday 3226 3287 6 22
Tuesday 3415 3576 21 16
Wednesday 3445 3545 11 14
Thursday 3301 3744 12 12
Friday 3799 3834 17 19
Saturday 3283 3251 22 28
Sunday 2498 2829 22 18
TOTALS: 22967 24066 111 129
19
20
0
500
1000
1500
2000
2500
3000
3500
4000
4500
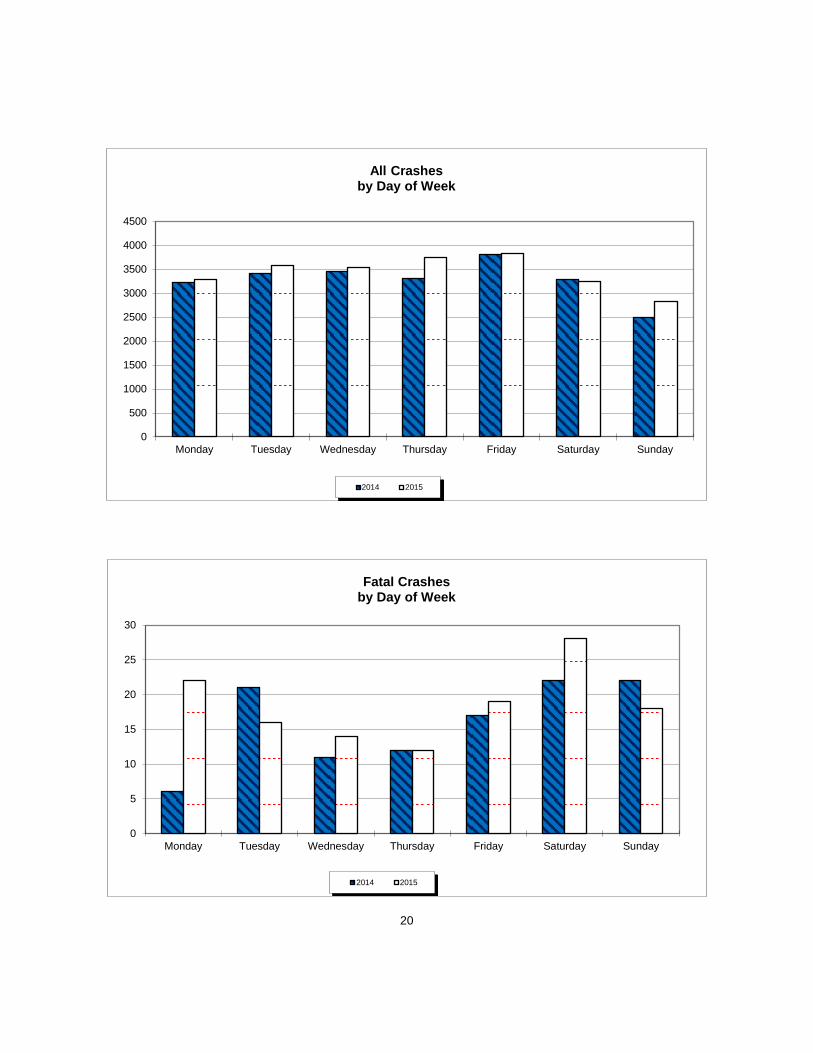
Monday Tuesday Wednesday Thursday Friday Saturday Sunday
All Crashes by Day of Week
2014 2015
0
5
10
15
20
25
30
Monday Tuesday Wednesday Thursday Friday Saturday Sunday
Fatal Crashes by Day of Week
2014 2015
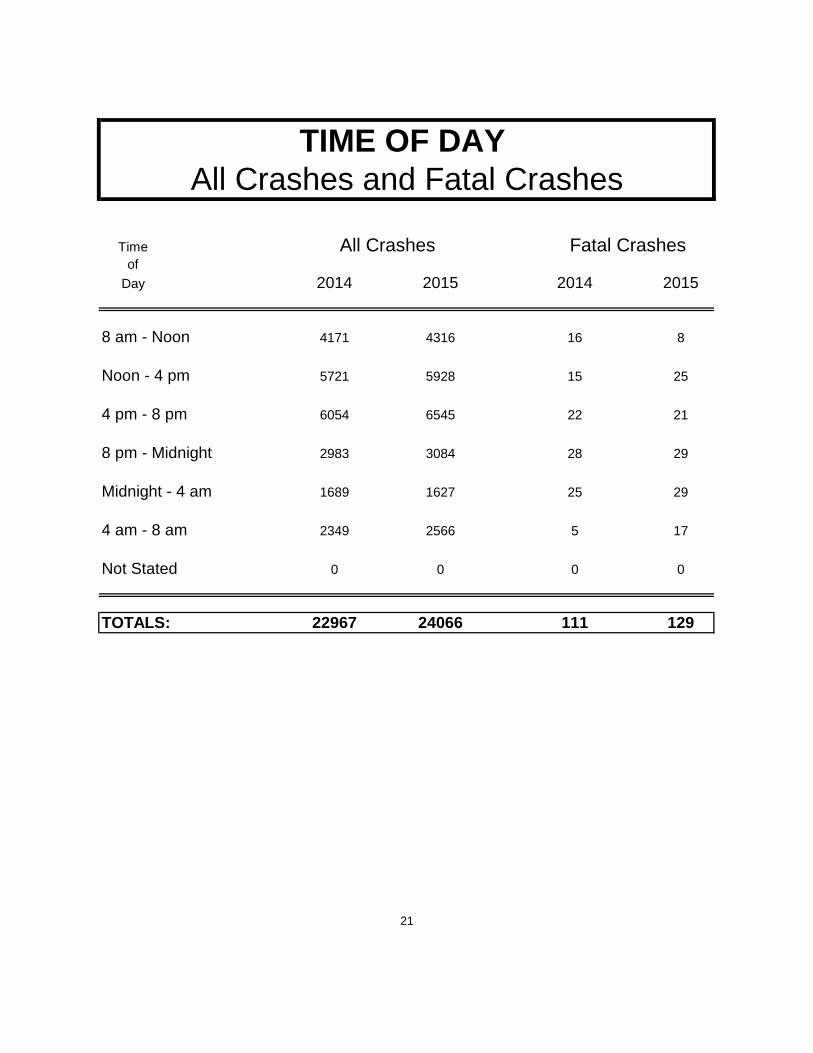
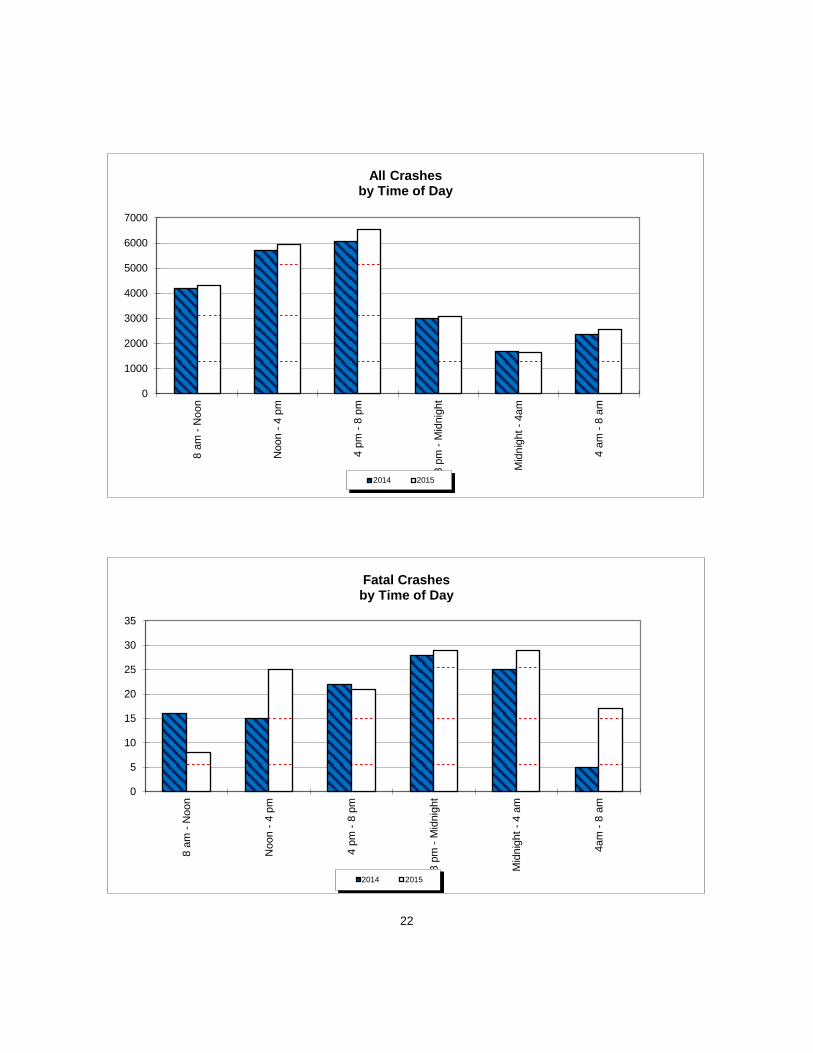
TIME OF DAY All Crashes and Fatal Crashes
Time All Crashes Fatal Crashesof
Day 2014 2015 2014 2015
8 am - Noon 4171 4316 16 8
Noon - 4 pm 5721 5928 15 25
4 pm - 8 pm 6054 6545 22 21
8 pm - Midnight 2983 3084 28 29
Midnight - 4 am 1689 1627 25 29
4 am - 8 am 2349 2566 5 17
Not Stated 0 0 0 0
TOTALS: 22967 24066 111 129
21
22
0
1000
2000
3000
4000
5000
6000
7000
8 am
- N
oon
Noo
n - 4
pm
4 pm
- 8
pm
8 pm
- M
idni
ght
Mid
nigh
t - 4
am
4 am
- 8
am
All Crashes by Time of Day
2014 2015
0
5
10
15
20
25
30
35
8 am
- N
oon
Noo
n - 4
pm
4 pm
- 8
pm
8 pm
- M
idni
ght
Mid
nigh
t - 4
am
4am
- 8
am
Fatal Crashes by Time of Day
2014 2015
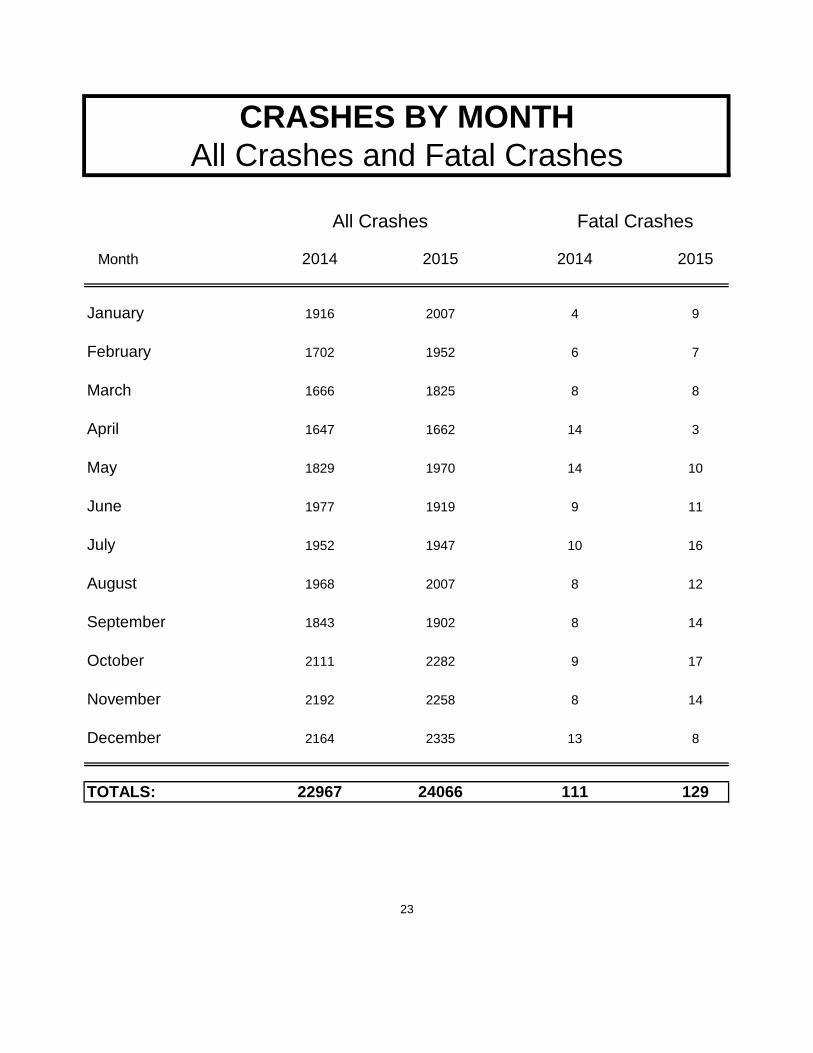
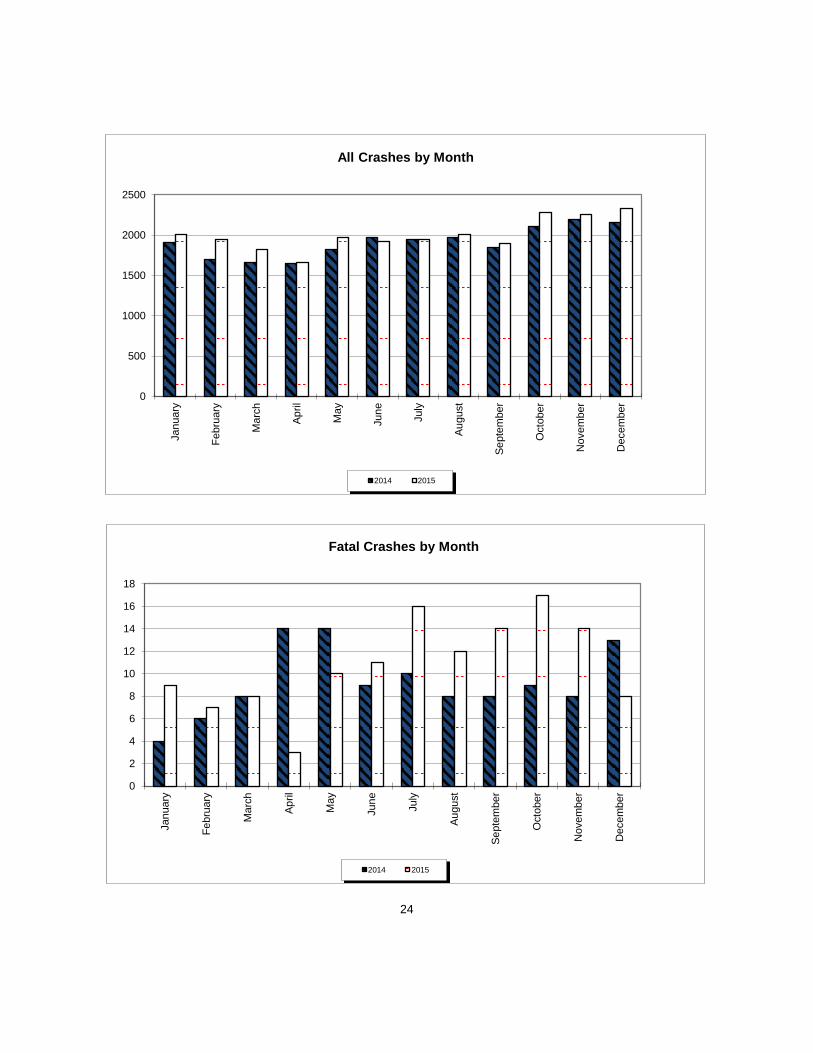
CRASHES BY MONTHAll Crashes and Fatal Crashes
All Crashes Fatal Crashes
Month 2014 2015 2014 2015
January 1916 2007 4 9
February 1702 1952 6 7
March 1666 1825 8 8
April 1647 1662 14 3
May 1829 1970 14 10
June 1977 1919 9 11
July 1952 1947 10 16
August 1968 2007 8 12
September 1843 1902 8 14
October 2111 2282 9 17
November 2192 2258 8 14
December 2164 2335 13 8
TOTALS: 22967 24066 111 129
23
24
0
500
1000
1500
2000
2500
Janu
ary
Febr
uary
Mar
ch
April
May
June July
Augu
st
Sept
embe
r
Oct
ober
Nov
embe
r
Dec
embe
r
All Crashes by Month
2014 2015
0
2
4
6
8
10
12
14
16
18
Janu
ary
Febr
uary
Mar
ch
April
May
June July
Augu
st
Sept
embe
r
Oct
ober
Nov
embe
r
Dec
embe
r
Fatal Crashes by Month
2014 2015
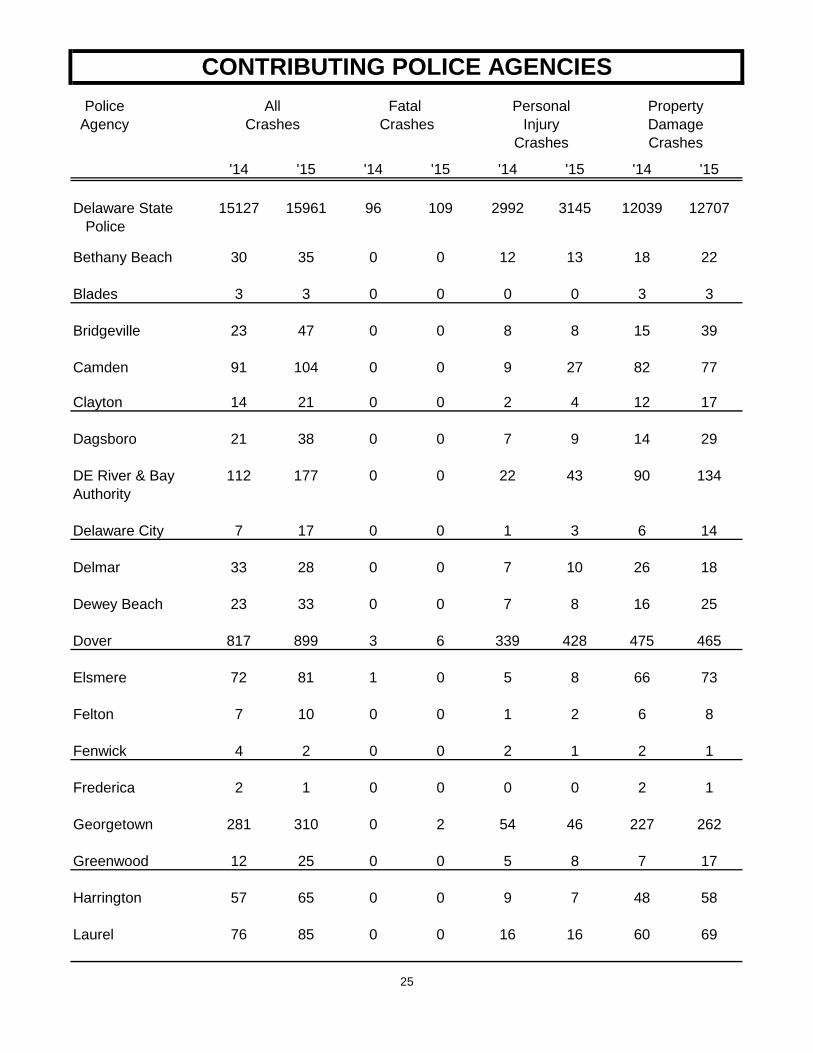
CONTRIBUTING POLICE AGENCIESPolice All Fatal Personal Property
Agency Crashes Crashes Injury DamageCrashes Crashes
'14 '15 '14 '15 '14 '15 '14 '15
Delaware State 15127 15961 96 109 2992 3145 12039 12707 Police
Bethany Beach 30 35 0 0 12 13 18 22
Blades 3 3 0 0 0 0 3 3
Bridgeville 23 47 0 0 8 8 15 39
Camden 91 104 0 0 9 27 82 77
Clayton 14 21 0 0 2 4 12 17
Dagsboro 21 38 0 0 7 9 14 29
DE River & Bay 112 177 0 0 22 43 90 134Authority
Delaware City 7 17 0 0 1 3 6 14
Delmar 33 28 0 0 7 10 26 18
Dewey Beach 23 33 0 0 7 8 16 25
Dover 817 899 3 6 339 428 475 465
Elsmere 72 81 1 0 5 8 66 73
Felton 7 10 0 0 1 2 6 8
Fenwick 4 2 0 0 2 1 2 1
Frederica 2 1 0 0 0 0 2 1
Georgetown 281 310 0 2 54 46 227 262
Greenwood 12 25 0 0 5 8 7 17
Harrington 57 65 0 0 9 7 48 58
Laurel 76 85 0 0 16 16 60 69
25
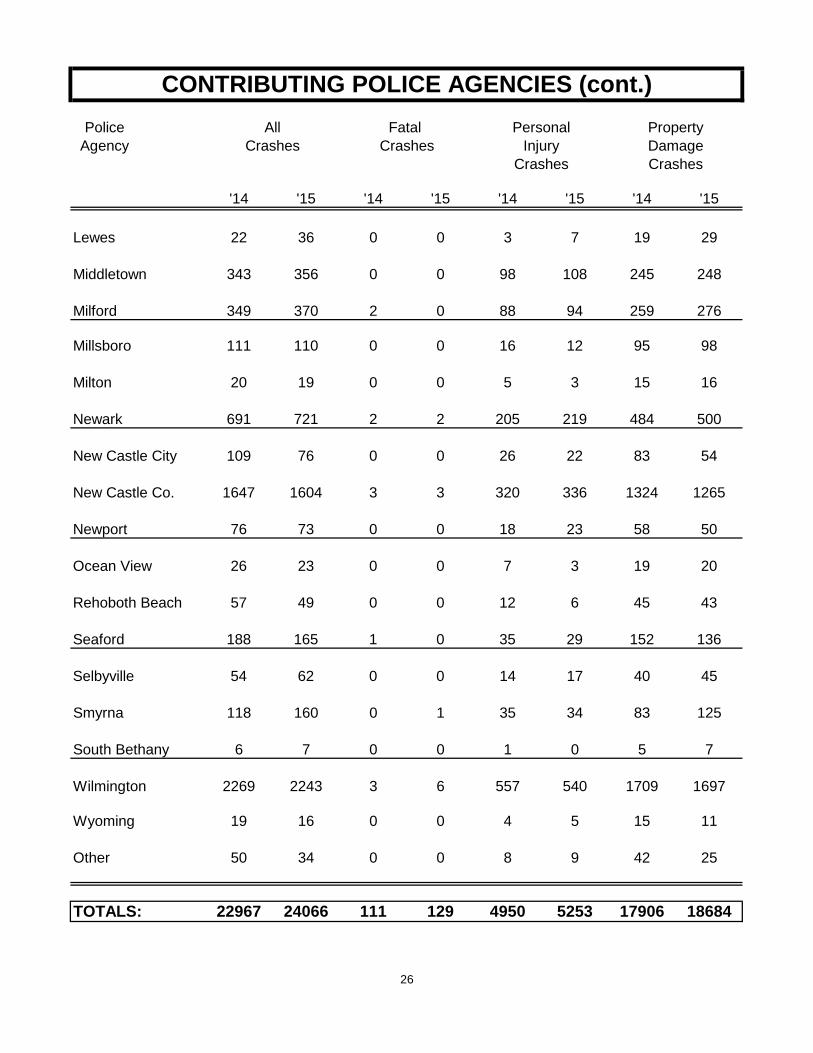
CONTRIBUTING POLICE AGENCIES (cont.)Police All Fatal Personal Property
Agency Crashes Crashes Injury DamageCrashes Crashes
'14 '15 '14 '15 '14 '15 '14 '15
Lewes 22 36 0 0 3 7 19 29
Middletown 343 356 0 0 98 108 245 248
Milford 349 370 2 0 88 94 259 276
Millsboro 111 110 0 0 16 12 95 98
Milton 20 19 0 0 5 3 15 16
Newark 691 721 2 2 205 219 484 500
New Castle City 109 76 0 0 26 22 83 54
New Castle Co. 1647 1604 3 3 320 336 1324 1265
Newport 76 73 0 0 18 23 58 50
Ocean View 26 23 0 0 7 3 19 20
Rehoboth Beach 57 49 0 0 12 6 45 43
Seaford 188 165 1 0 35 29 152 136
Selbyville 54 62 0 0 14 17 40 45
Smyrna 118 160 0 1 35 34 83 125
South Bethany 6 7 0 0 1 0 5 7
Wilmington 2269 2243 3 6 557 540 1709 1697
Wyoming 19 16 0 0 4 5 15 11
Other 50 34 0 0 8 9 42 25
TOTALS: 22967 24066 111 129 4950 5253 17906 18684
26
Vehicle /Driver
Statistics
27
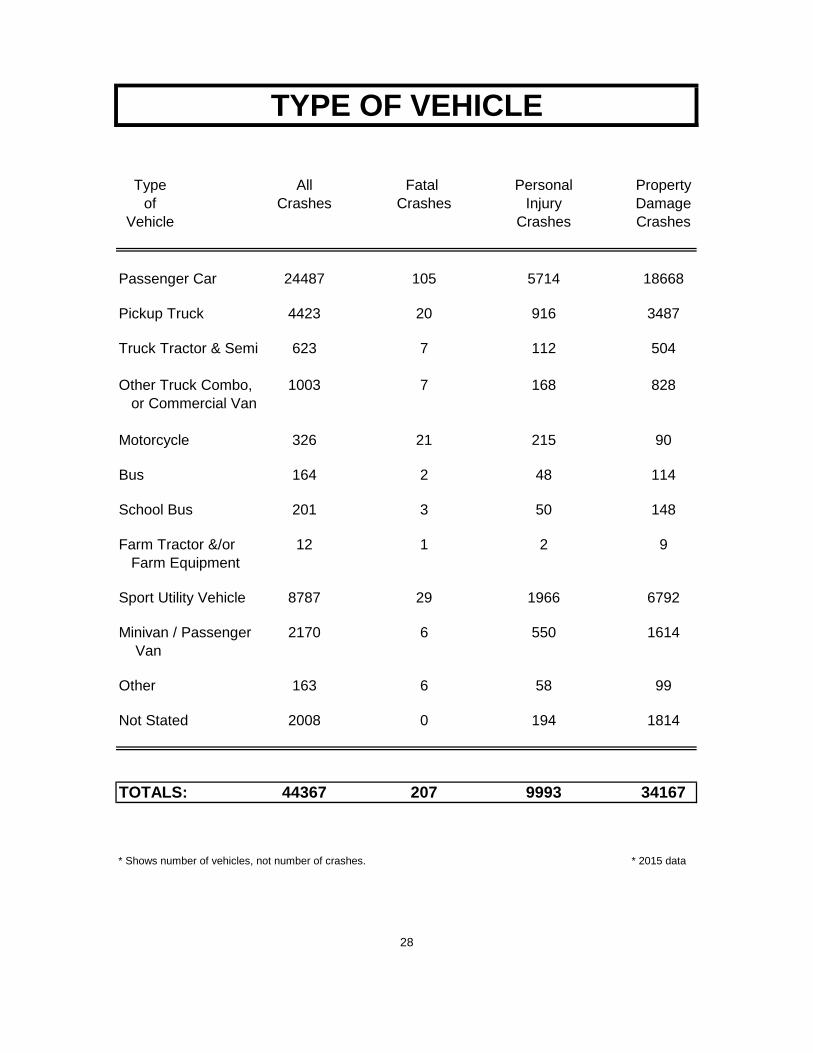
TYPE OF VEHICLE
Type All Fatal Personal Propertyof Crashes Crashes Injury Damage
Vehicle Crashes Crashes
Passenger Car 24487 105 5714 18668
Pickup Truck 4423 20 916 3487
Truck Tractor & Semi 623 7 112 504
Other Truck Combo, 1003 7 168 828 or Commercial Van
Motorcycle 326 21 215 90
Bus 164 2 48 114
School Bus 201 3 50 148
Farm Tractor &/or 12 1 2 9 Farm Equipment
Sport Utility Vehicle 8787 29 1966 6792
Minivan / Passenger 2170 6 550 1614 Van
Other 163 6 58 99
Not Stated 2008 0 194 1814
TOTALS: 44367 207 9993 34167
* Shows number of vehicles, not number of crashes. * 2015 data
28
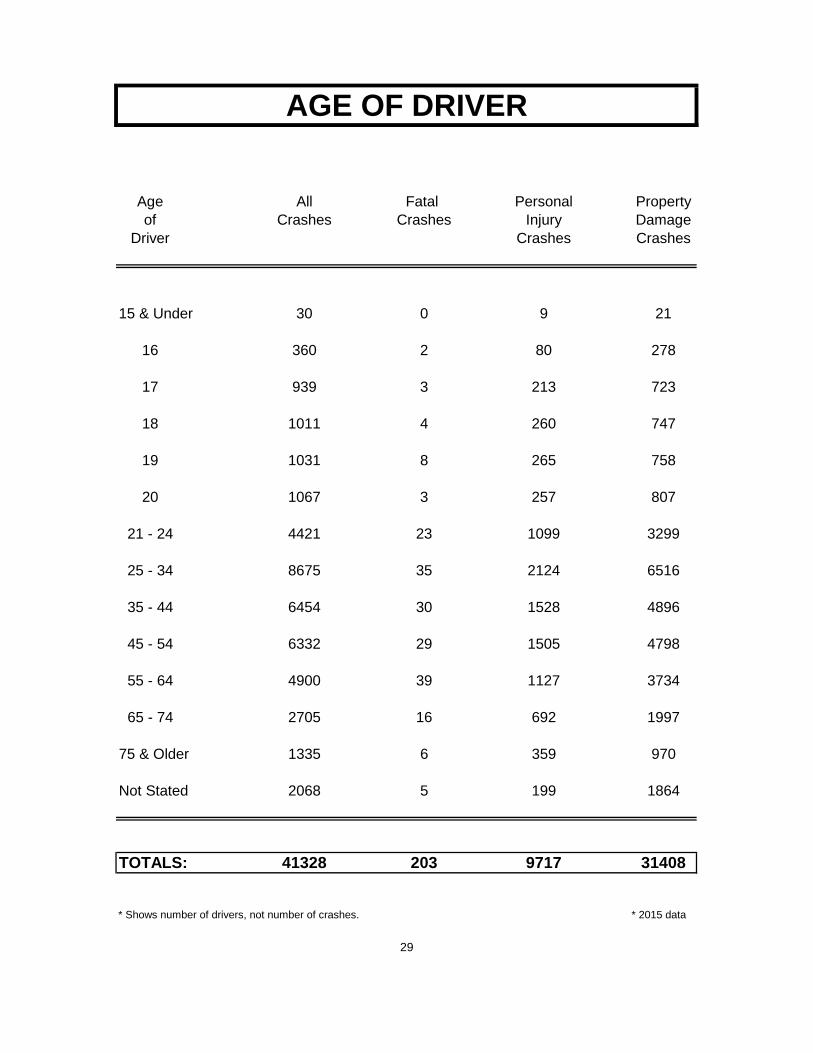
AGE OF DRIVER
Age All Fatal Personal Propertyof Crashes Crashes Injury Damage
Driver Crashes Crashes
15 & Under 30 0 9 21
16 360 2 80 278
17 939 3 213 723
18 1011 4 260 747
19 1031 8 265 758
20 1067 3 257 807
21 - 24 4421 23 1099 3299
25 - 34 8675 35 2124 6516
35 - 44 6454 30 1528 4896
45 - 54 6332 29 1505 4798
55 - 64 4900 39 1127 3734
65 - 74 2705 16 692 1997
75 & Older 1335 6 359 970
Not Stated 2068 5 199 1864
TOTALS: 41328 203 9717 31408
* Shows number of drivers, not number of crashes. * 2015 data
29
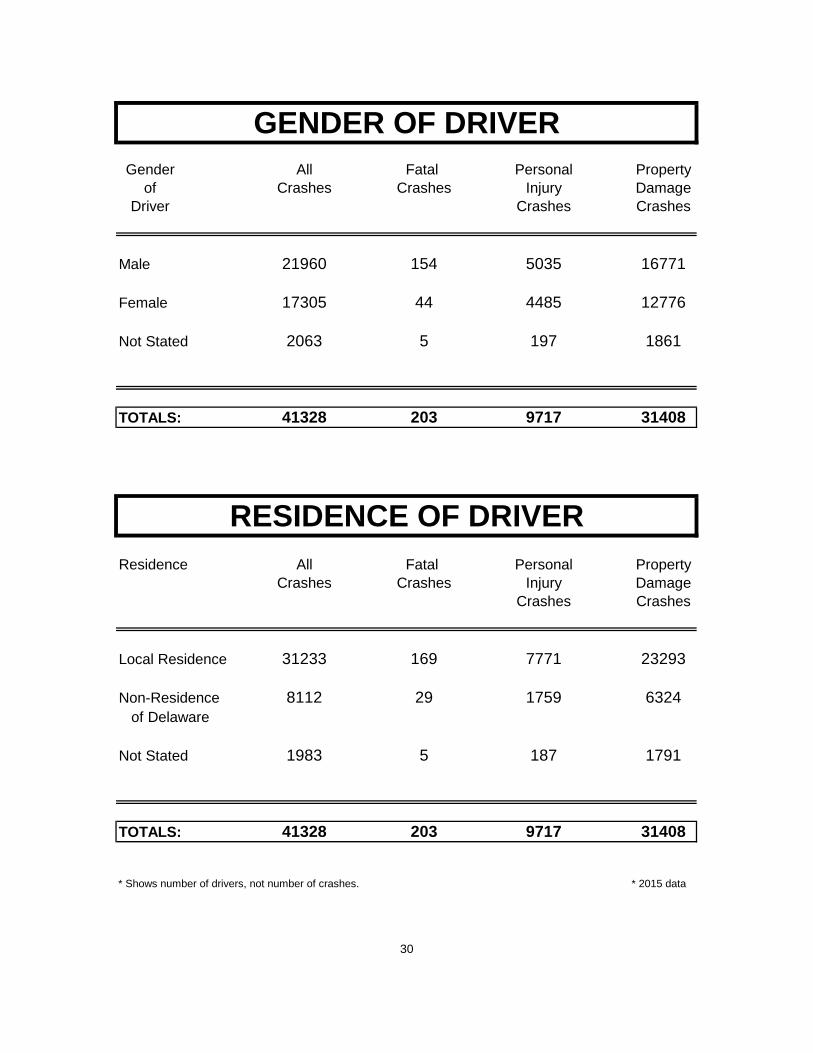
GENDER OF DRIVERGender All Fatal Personal Property
of Crashes Crashes Injury DamageDriver Crashes Crashes
Male 21960 154 5035 16771
Female 17305 44 4485 12776
Not Stated 2063 5 197 1861
TOTALS: 41328 203 9717 31408
RESIDENCE OF DRIVERResidence All Fatal Personal Property
Crashes Crashes Injury DamageCrashes Crashes
Local Residence 31233 169 7771 23293
Non-Residence 8112 29 1759 6324 of Delaware
Not Stated 1983 5 187 1791
TOTALS: 41328 203 9717 31408
* Shows number of drivers, not number of crashes. * 2015 data
30
Motorcycle CrashesIn 2015:
There were 375 traffic crashes which involved a motorcycle.
5% of the crashes were fatal crashes.
Of the 20 fatal crashes involving motorcycles, 8 werealcohol related.
64% of the crashes were personal injury crashes.
Of the 240 personal injury crashes involving motorcycles, 19 were alcohol related.
31% of the crashes were property damage crashes.
Of the 115 property damage crashes involvingmotorcycles, 3 were alcohol related.
Of the 20 motorcyclists killed in 2015, 14 werewearing a helmet.
Of the 20 motorcycle operators killed, 9 hadbeen drinking alcohol & / or consuming drugs.
The death rate for motorcyclists was 8.74 per10,000 registrations -- compared to a death rate of1.49 for all vehicles registered.
** Percentages may not add to 100% due to rounding.
31
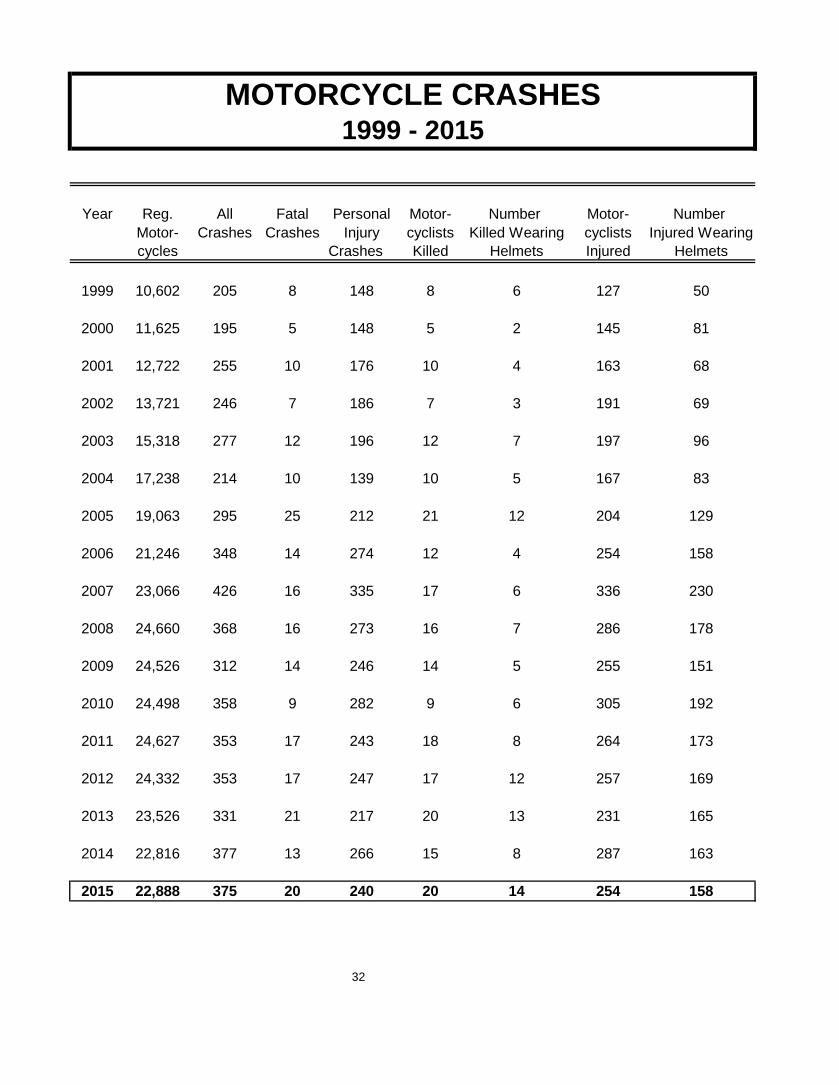
MOTORCYCLE CRASHES1999 - 2015
Year Reg. All Fatal Personal Motor- Number Motor- Number Motor- Crashes Crashes Injury cyclists Killed Wearing cyclists Injured Wearingcycles Crashes Killed Helmets Injured Helmets
1999 10,602 205 8 148 8 6 127 50
2000 11,625 195 5 148 5 2 145 81
2001 12,722 255 10 176 10 4 163 68
2002 13,721 246 7 186 7 3 191 69
2003 15,318 277 12 196 12 7 197 96
2004 17,238 214 10 139 10 5 167 83
2005 19,063 295 25 212 21 12 204 129
2006 21,246 348 14 274 12 4 254 158
2007 23,066 426 16 335 17 6 336 230
2008 24,660 368 16 273 16 7 286 178
2009 24,526 312 14 246 14 5 255 151
2010 24,498 358 9 282 9 6 305 192
2011 24,627 353 17 243 18 8 264 173
2012 24,332 353 17 247 17 12 257 169
2013 23,526 331 21 217 20 13 231 165
2014 22,816 377 13 266 15 8 287 163
2015 22,888 375 20 240 20 14 254 158
32
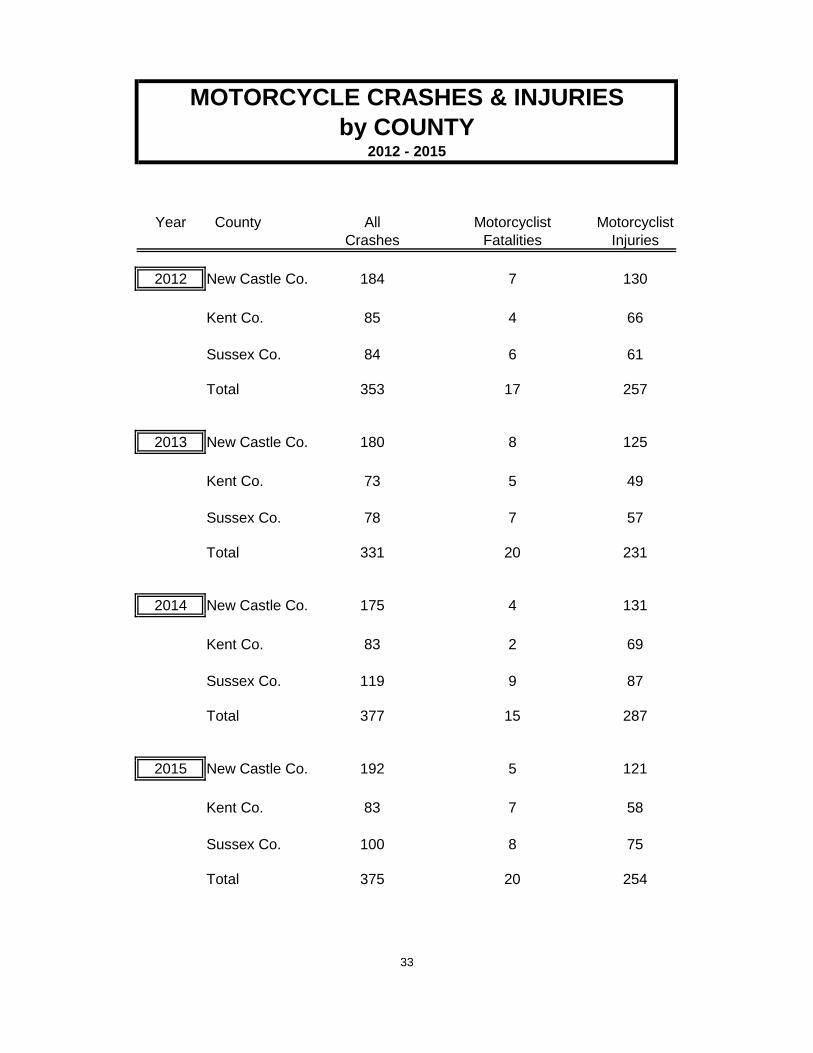
MOTORCYCLE CRASHES & INJURIESby COUNTY
2012 - 2015
Year County All Motorcyclist MotorcyclistCrashes Fatalities Injuries
2012 New Castle Co. 184 7 130
Kent Co. 85 4 66
Sussex Co. 84 6 61
Total 353 17 257
2013 New Castle Co. 180 8 125
Kent Co. 73 5 49
Sussex Co. 78 7 57
Total 331 20 231
2014 New Castle Co. 175 4 131
Kent Co. 83 2 69
Sussex Co. 119 9 87
Total 377 15 287
2015 New Castle Co. 192 5 121
Kent Co. 83 7 58
Sussex Co. 100 8 75
Total 375 20 254
33
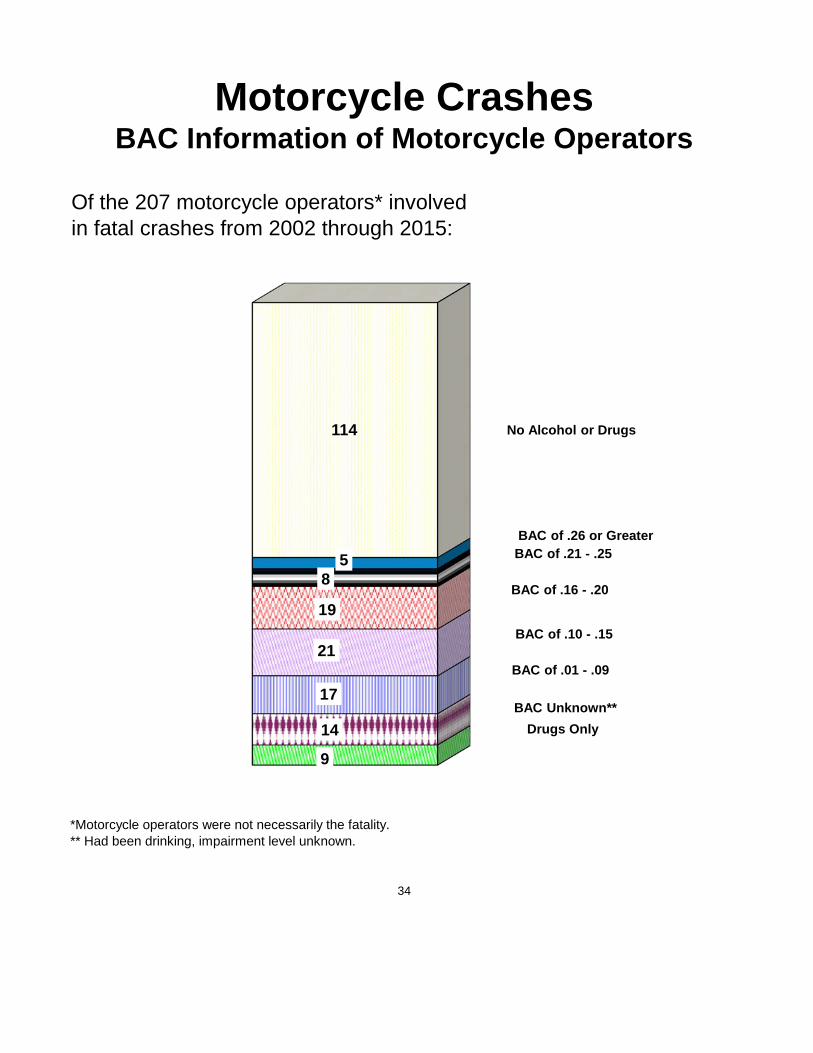
Motorcycle CrashesBAC Information of Motorcycle Operators
Of the 207 motorcycle operators* involvedin fatal crashes from 2002 through 2015:
*Motorcycle operators were not necessarily the fatality.** Had been drinking, impairment level unknown.
34
9
14
17
21
19
8 5
114 No Alcohol or Drugs
BAC of .16 - .20
BAC Unknown**
BAC of .01 - .09
BAC of .10 - .15
BAC of .21 - .25 BAC of .26 or Greater
Drugs Only
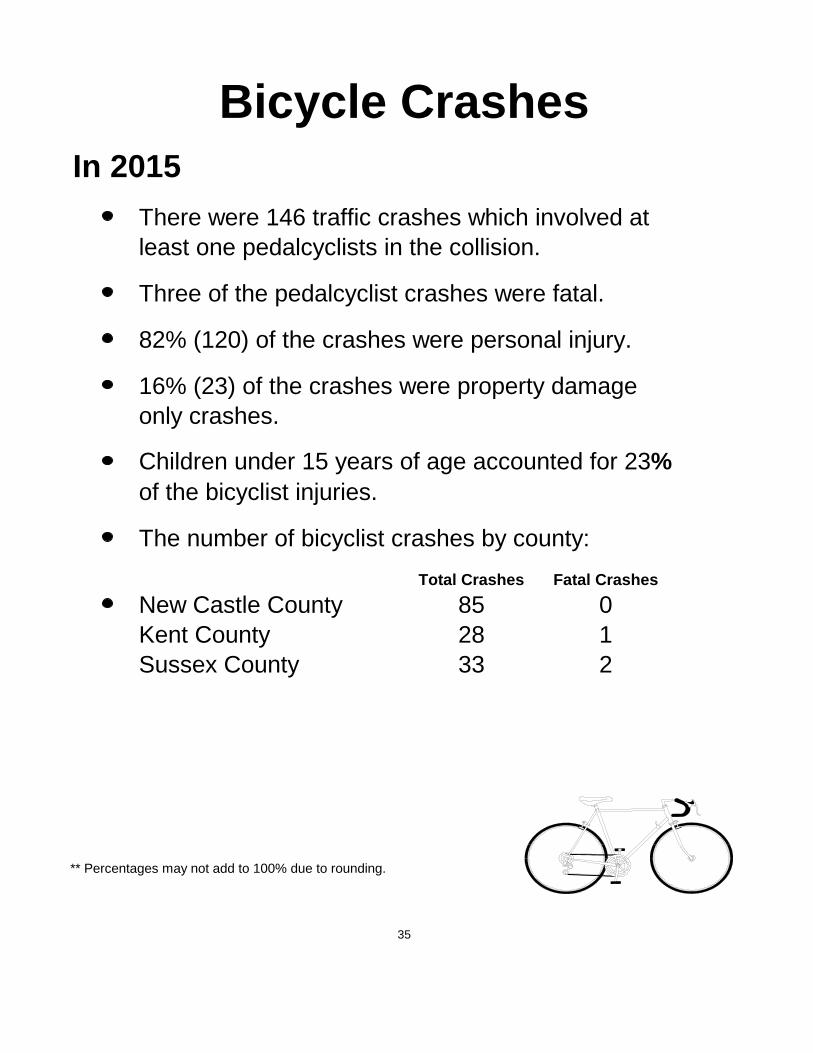
Bicycle CrashesIn 2015
There were 146 traffic crashes which involved at least one pedalcyclists in the collision.
Three of the pedalcyclist crashes were fatal.
82% (120) of the crashes were personal injury.
16% (23) of the crashes were property damageonly crashes.
Children under 15 years of age accounted for 23%of the bicyclist injuries.
The number of bicyclist crashes by county:Total Crashes Fatal Crashes
New Castle County 85 0Kent County 28 1Sussex County 33 2
** Percentages may not add to 100% due to rounding.
35
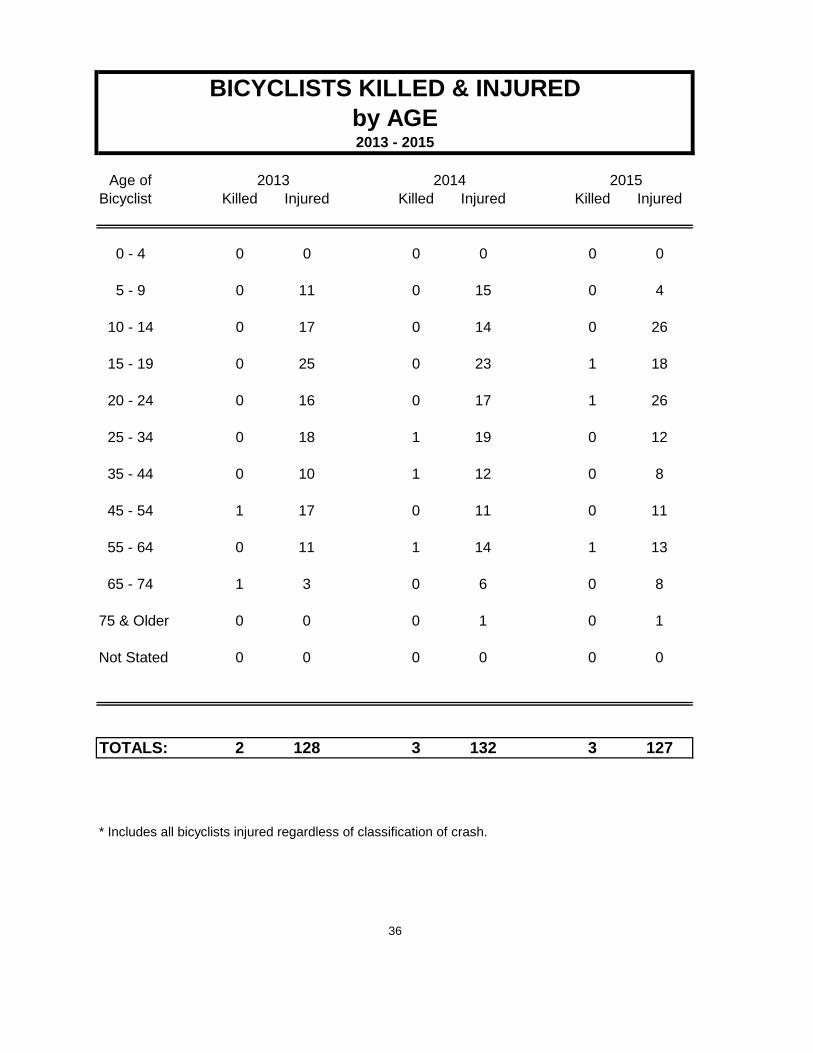
BICYCLISTS KILLED & INJURED by AGE 2013 - 2015
Age of 2013 2014 2015Bicyclist Killed Injured Killed Injured Killed Injured
0 - 4 0 0 0 0 0 0
5 - 9 0 11 0 15 0 4
10 - 14 0 17 0 14 0 26
15 - 19 0 25 0 23 1 18
20 - 24 0 16 0 17 1 26
25 - 34 0 18 1 19 0 12
35 - 44 0 10 1 12 0 8
45 - 54 1 17 0 11 0 11
55 - 64 0 11 1 14 1 13
65 - 74 1 3 0 6 0 8
75 & Older 0 0 0 1 0 1
Not Stated 0 0 0 0 0 0
TOTALS: 2 128 3 132 3 127
* Includes all bicyclists injured regardless of classification of crash.
36
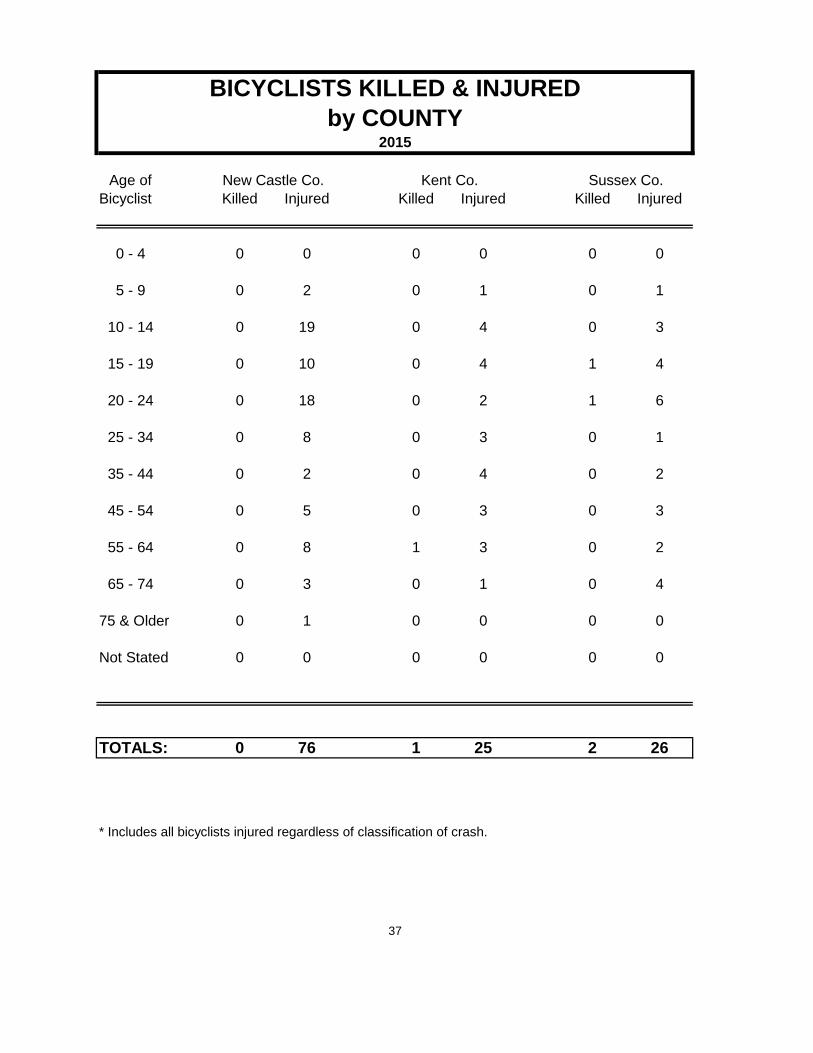
BICYCLISTS KILLED & INJUREDby COUNTY
2015
Age of New Castle Co. Kent Co. Sussex Co.Bicyclist Killed Injured Killed Injured Killed Injured
0 - 4 0 0 0 0 0 0
5 - 9 0 2 0 1 0 1
10 - 14 0 19 0 4 0 3
15 - 19 0 10 0 4 1 4
20 - 24 0 18 0 2 1 6
25 - 34 0 8 0 3 0 1
35 - 44 0 2 0 4 0 2
45 - 54 0 5 0 3 0 3
55 - 64 0 8 1 3 0 2
65 - 74 0 3 0 1 0 4
75 & Older 0 1 0 0 0 0
Not Stated 0 0 0 0 0 0
TOTALS: 0 76 1 25 2 26
* Includes all bicyclists injured regardless of classification of crash.
37
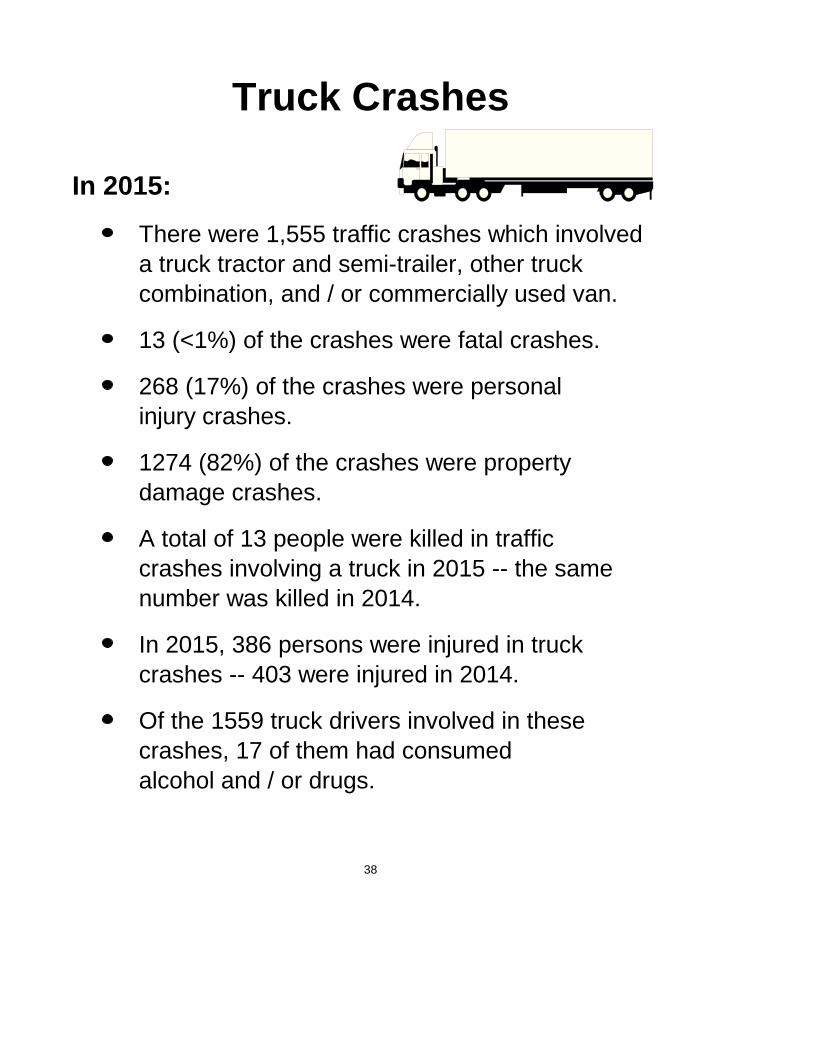
Truck Crashes
In 2015:
There were 1,555 traffic crashes which involveda truck tractor and semi-trailer, other truck combination, and / or commercially used van.
13 (<1%) of the crashes were fatal crashes.
268 (17%) of the crashes were personalinjury crashes.
1274 (82%) of the crashes were property damage crashes.
A total of 13 people were killed in traffic crashes involving a truck in 2015 -- the same number was killed in 2014.
In 2015, 386 persons were injured in truck crashes -- 403 were injured in 2014.
Of the 1559 truck drivers involved in these crashes, 17 of them had consumed alcohol and / or drugs.
38
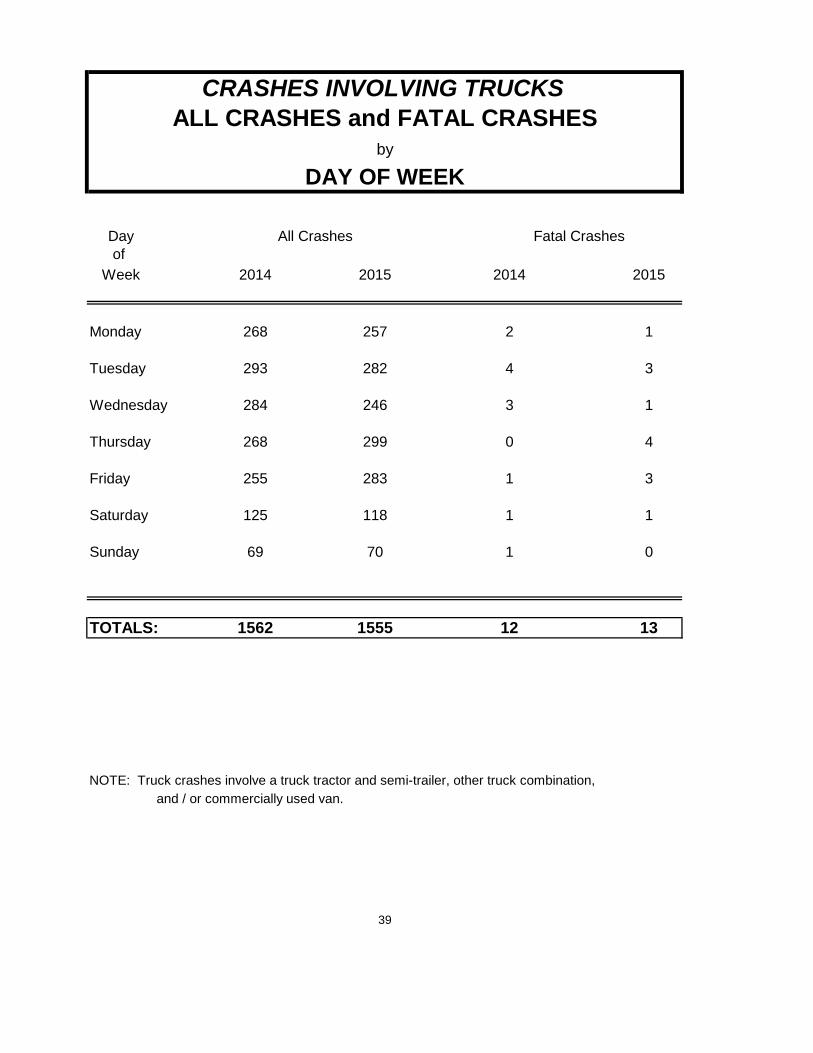
CRASHES INVOLVING TRUCKS ALL CRASHES and FATAL CRASHES
by
DAY OF WEEK
Day All Crashes Fatal Crashesof
Week 2014 2015 2014 2015
Monday 268 257 2 1
Tuesday 293 282 4 3
Wednesday 284 246 3 1
Thursday 268 299 0 4
Friday 255 283 1 3
Saturday 125 118 1 1
Sunday 69 70 1 0
TOTALS: 1562 1555 12 13
NOTE: Truck crashes involve a truck tractor and semi-trailer, other truck combination,and / or commercially used van.
39
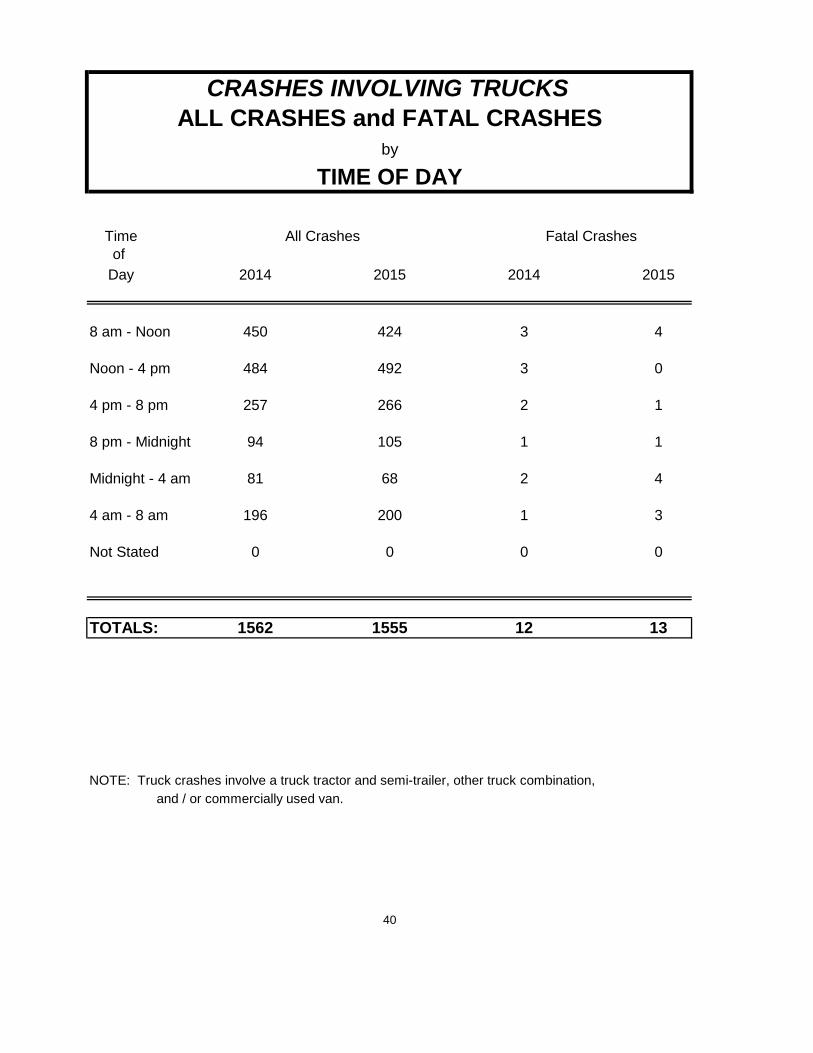
CRASHES INVOLVING TRUCKS ALL CRASHES and FATAL CRASHES
by
TIME OF DAY
Time All Crashes Fatal Crashesof
Day 2014 2015 2014 2015
8 am - Noon 450 424 3 4
Noon - 4 pm 484 492 3 0
4 pm - 8 pm 257 266 2 1
8 pm - Midnight 94 105 1 1
Midnight - 4 am 81 68 2 4
4 am - 8 am 196 200 1 3
Not Stated 0 0 0 0
TOTALS: 1562 1555 12 13
NOTE: Truck crashes involve a truck tractor and semi-trailer, other truck combination,and / or commercially used van.
40
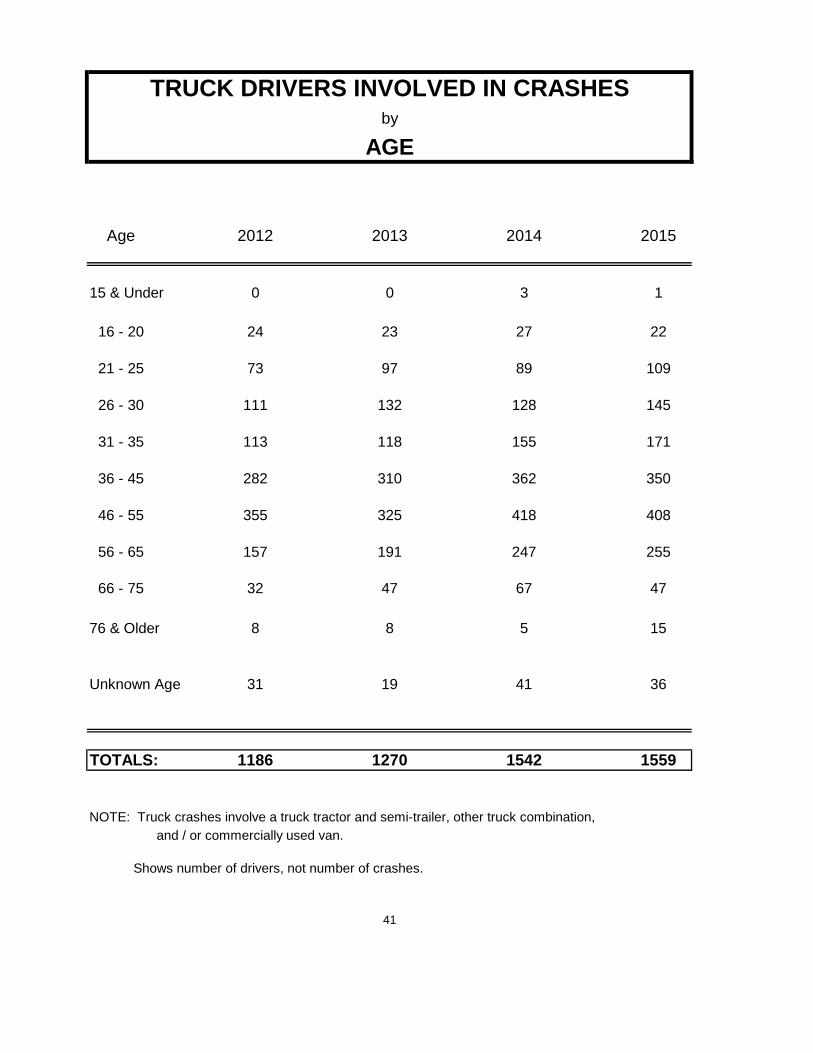
TRUCK DRIVERS INVOLVED IN CRASHESby
AGE
Age 2012 2013 2014 2015
15 & Under 0 0 3 1
16 - 20 24 23 27 22
21 - 25 73 97 89 109
26 - 30 111 132 128 145
31 - 35 113 118 155 171
36 - 45 282 310 362 350
46 - 55 355 325 418 408
56 - 65 157 191 247 255
66 - 75 32 47 67 47
76 & Older 8 8 5 15
Unknown Age 31 19 41 36
TOTALS: 1186 1270 1542 1559
NOTE: Truck crashes involve a truck tractor and semi-trailer, other truck combination,and / or commercially used van.
Shows number of drivers, not number of crashes.
41
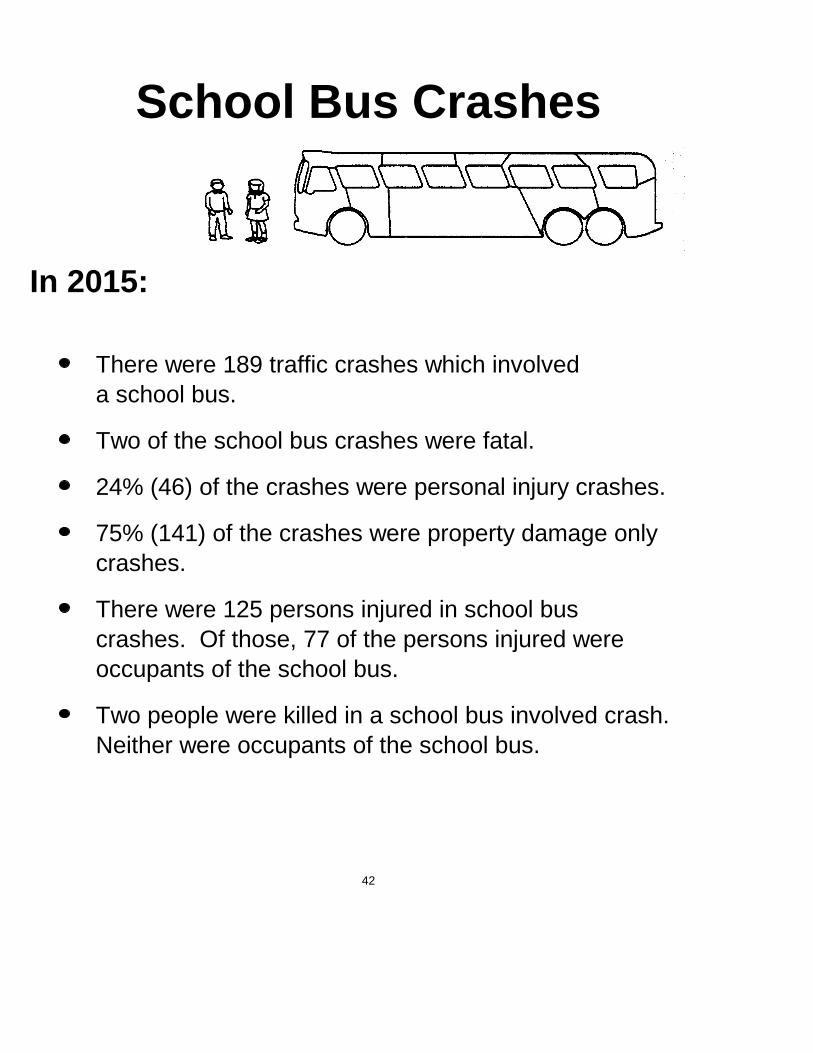
School Bus Crashes
In 2015:
There were 189 traffic crashes which involveda school bus.
Two of the school bus crashes were fatal.
24% (46) of the crashes were personal injury crashes.
75% (141) of the crashes were property damage onlycrashes.
There were 125 persons injured in school buscrashes. Of those, 77 of the persons injured wereoccupants of the school bus.
Two people were killed in a school bus involved crash.Neither were occupants of the school bus.
42
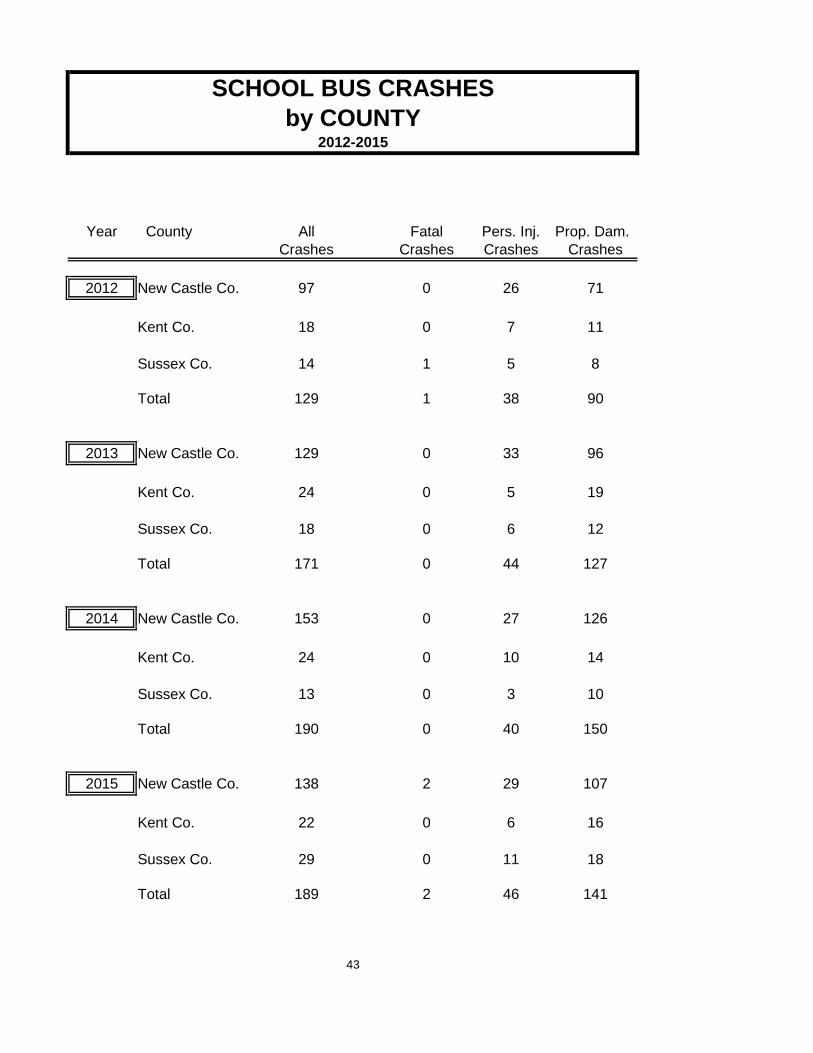
SCHOOL BUS CRASHESby COUNTY
2012-2015
Year County All Fatal Pers. Inj. Prop. Dam.Crashes Crashes Crashes Crashes
2012 New Castle Co. 97 0 26 71
Kent Co. 18 0 7 11
Sussex Co. 14 1 5 8
Total 129 1 38 90
2013 New Castle Co. 129 0 33 96
Kent Co. 24 0 5 19
Sussex Co. 18 0 6 12
Total 171 0 44 127
2014 New Castle Co. 153 0 27 126
Kent Co. 24 0 10 14
Sussex Co. 13 0 3 10
Total 190 0 40 150
2015 New Castle Co. 138 2 29 107
Kent Co. 22 0 6 16
Sussex Co. 29 0 11 18
Total 189 2 46 141
43
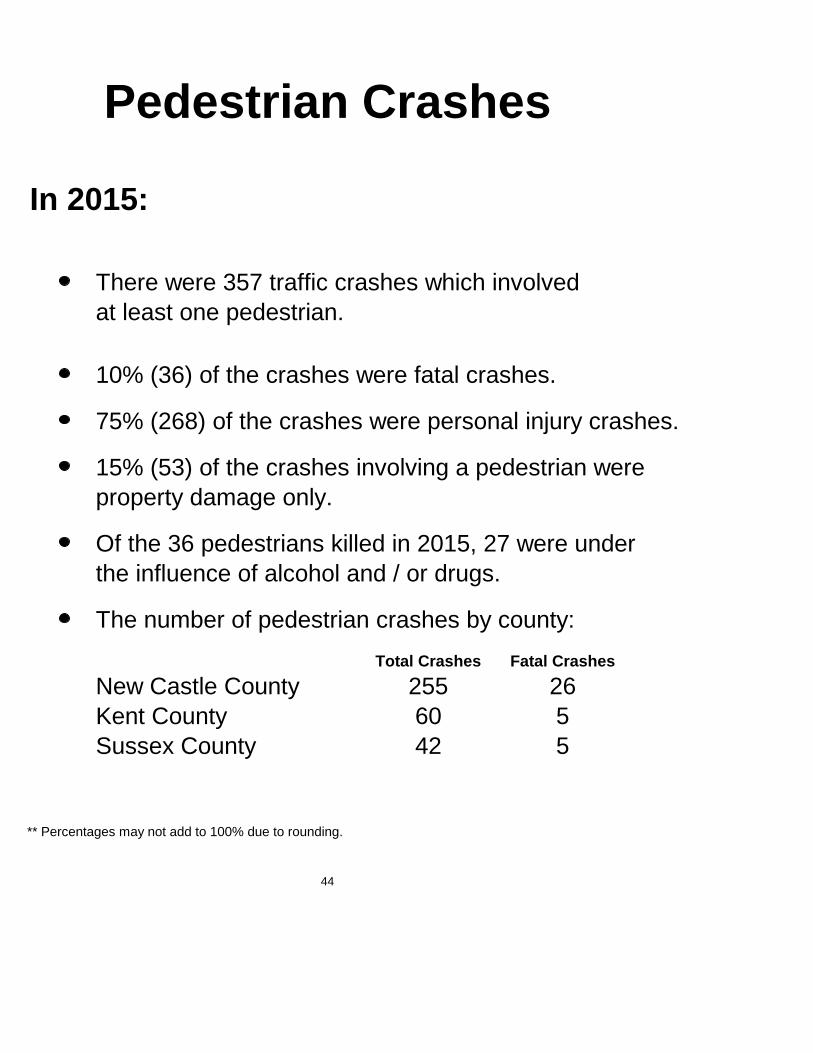
Pedestrian Crashes
In 2015:
There were 357 traffic crashes which involvedat least one pedestrian.
10% (36) of the crashes were fatal crashes.
75% (268) of the crashes were personal injury crashes.
15% (53) of the crashes involving a pedestrian wereproperty damage only.
Of the 36 pedestrians killed in 2015, 27 were under the influence of alcohol and / or drugs.
The number of pedestrian crashes by county:Total Crashes Fatal Crashes
New Castle County 255 26Kent County 60 5Sussex County 42 5
** Percentages may not add to 100% due to rounding.
44
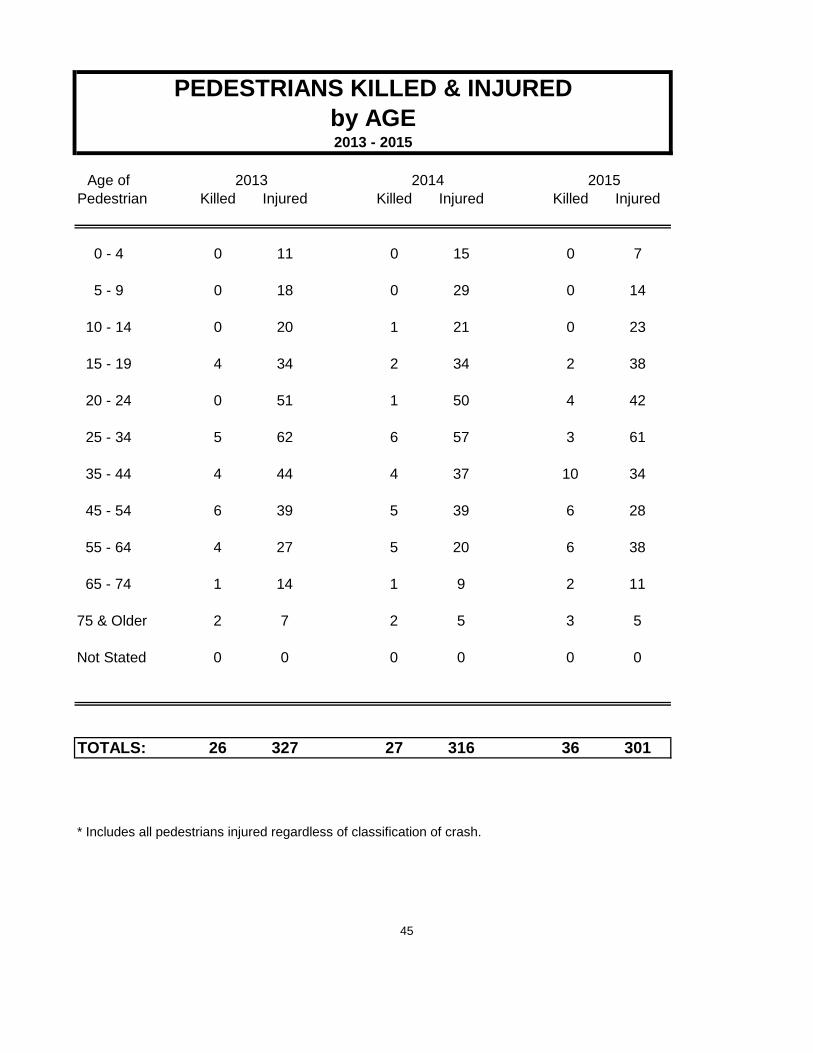
PEDESTRIANS KILLED & INJURED by AGE 2013 - 2015
Age of 2013 2014 2015Pedestrian Killed Injured Killed Injured Killed Injured
0 - 4 0 11 0 15 0 7
5 - 9 0 18 0 29 0 14
10 - 14 0 20 1 21 0 23
15 - 19 4 34 2 34 2 38
20 - 24 0 51 1 50 4 42
25 - 34 5 62 6 57 3 61
35 - 44 4 44 4 37 10 34
45 - 54 6 39 5 39 6 28
55 - 64 4 27 5 20 6 38
65 - 74 1 14 1 9 2 11
75 & Older 2 7 2 5 3 5
Not Stated 0 0 0 0 0 0
TOTALS: 26 327 27 316 36 301
* Includes all pedestrians injured regardless of classification of crash.
45
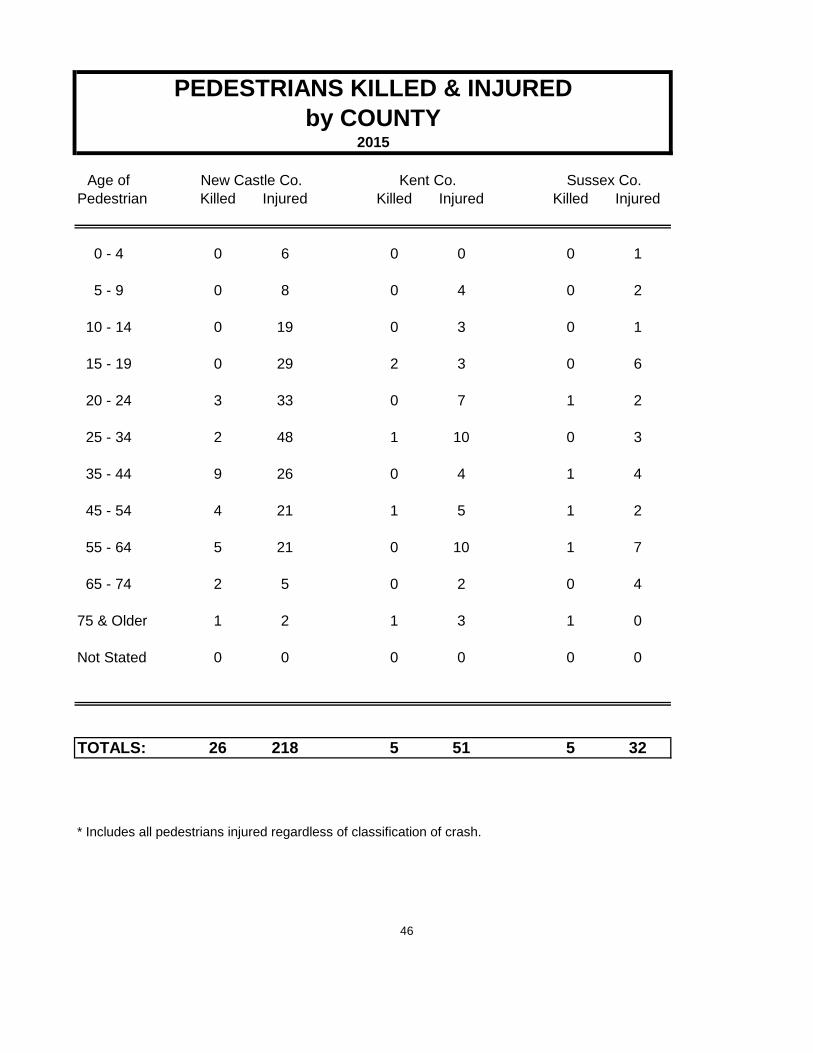
PEDESTRIANS KILLED & INJUREDby COUNTY
2015
Age of New Castle Co. Kent Co. Sussex Co.Pedestrian Killed Injured Killed Injured Killed Injured
0 - 4 0 6 0 0 0 1
5 - 9 0 8 0 4 0 2
10 - 14 0 19 0 3 0 1
15 - 19 0 29 2 3 0 6
20 - 24 3 33 0 7 1 2
25 - 34 2 48 1 10 0 3
35 - 44 9 26 0 4 1 4
45 - 54 4 21 1 5 1 2
55 - 64 5 21 0 10 1 7
65 - 74 2 5 0 2 0 4
75 & Older 1 2 1 3 1 0
Not Stated 0 0 0 0 0 0
TOTALS: 26 218 5 51 5 32
* Includes all pedestrians injured regardless of classification of crash.
46
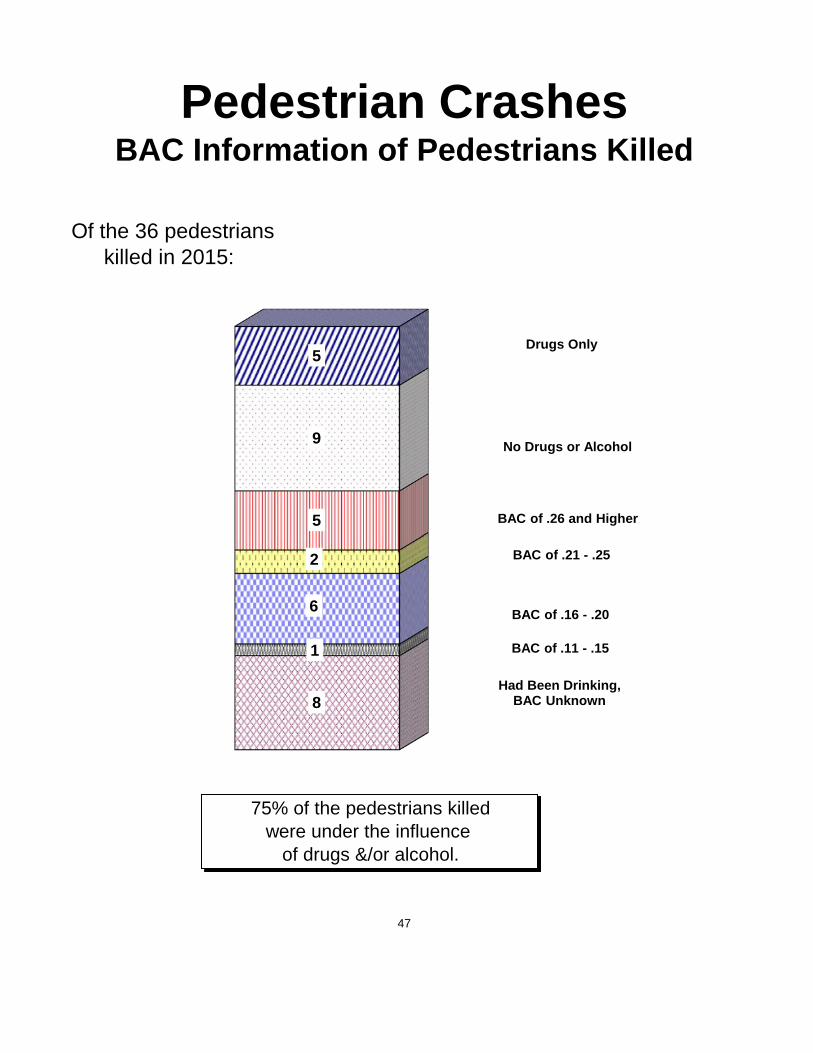
Pedestrian CrashesBAC Information of Pedestrians Killed
Of the 36 pedestrianskilled in 2015:
75% of the pedestrians killedwere under the influence
of drugs &/or alcohol.
47
8
1
6
2
5
9
5
No Drugs or Alcohol
BAC of .16 - .20
BAC of .26 and Higher
Had Been Drinking, BAC Unknown
Drugs Only
BAC of .21 - .25
BAC of .11 - .15

OtherSpecialTopics
48
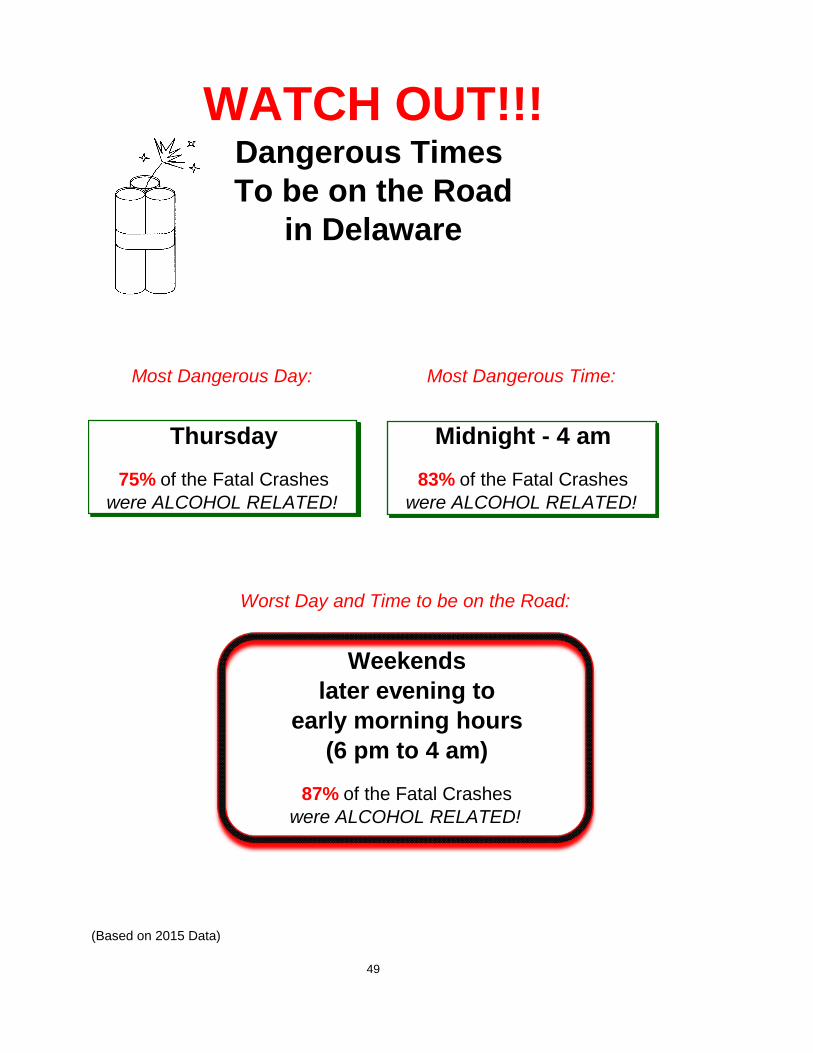
WATCH OUT!!!Dangerous Times To be on the Road
in Delaware
Most Dangerous Day: Most Dangerous Time:
Thursday Midnight - 4 am75% of the Fatal Crashes 83% of the Fatal Crashes
were ALCOHOL RELATED! were ALCOHOL RELATED!
Worst Day and Time to be on the Road:
Weekendslater evening to
early morning hours(6 pm to 4 am)
87% of the Fatal Crashes were ALCOHOL RELATED!
(Based on 2015 Data)
49
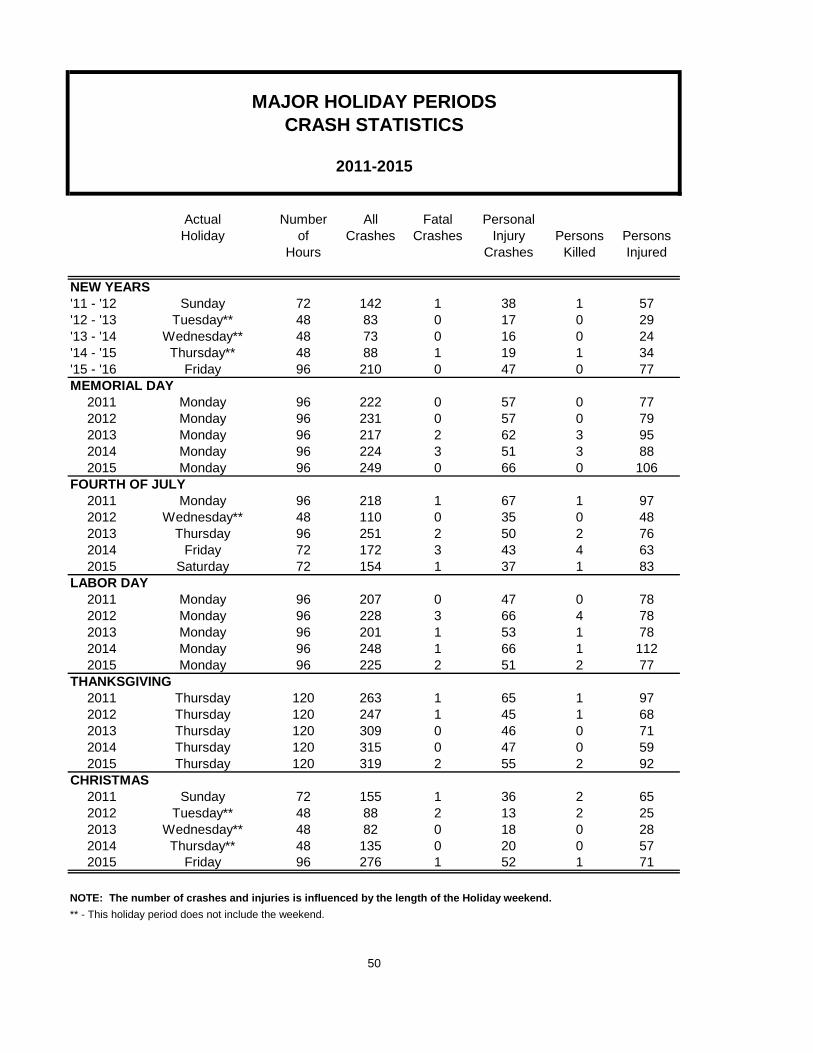
MAJOR HOLIDAY PERIODSCRASH STATISTICS
2011-2015
Actual Number All Fatal PersonalHoliday of Crashes Crashes Injury Persons Persons
Hours Crashes Killed Injured
NEW YEARS'11 - '12 Sunday 72 142 1 38 1 57'12 - '13 Tuesday** 48 83 0 17 0 29'13 - '14 Wednesday** 48 73 0 16 0 24'14 - '15 Thursday** 48 88 1 19 1 34'15 - '16 Friday 96 210 0 47 0 77MEMORIAL DAY
2011 Monday 96 222 0 57 0 772012 Monday 96 231 0 57 0 792013 Monday 96 217 2 62 3 952014 Monday 96 224 3 51 3 882015 Monday 96 249 0 66 0 106
FOURTH OF JULY2011 Monday 96 218 1 67 1 972012 Wednesday** 48 110 0 35 0 482013 Thursday 96 251 2 50 2 762014 Friday 72 172 3 43 4 632015 Saturday 72 154 1 37 1 83
LABOR DAY2011 Monday 96 207 0 47 0 782012 Monday 96 228 3 66 4 782013 Monday 96 201 1 53 1 782014 Monday 96 248 1 66 1 1122015 Monday 96 225 2 51 2 77
THANKSGIVING2011 Thursday 120 263 1 65 1 972012 Thursday 120 247 1 45 1 682013 Thursday 120 309 0 46 0 712014 Thursday 120 315 0 47 0 592015 Thursday 120 319 2 55 2 92
CHRISTMAS2011 Sunday 72 155 1 36 2 652012 Tuesday** 48 88 2 13 2 252013 Wednesday** 48 82 0 18 0 282014 Thursday** 48 135 0 20 0 572015 Friday 96 276 1 52 1 71
NOTE: The number of crashes and injuries is influenced by the length of the Holiday weekend.** - This holiday period does not include the weekend.
50
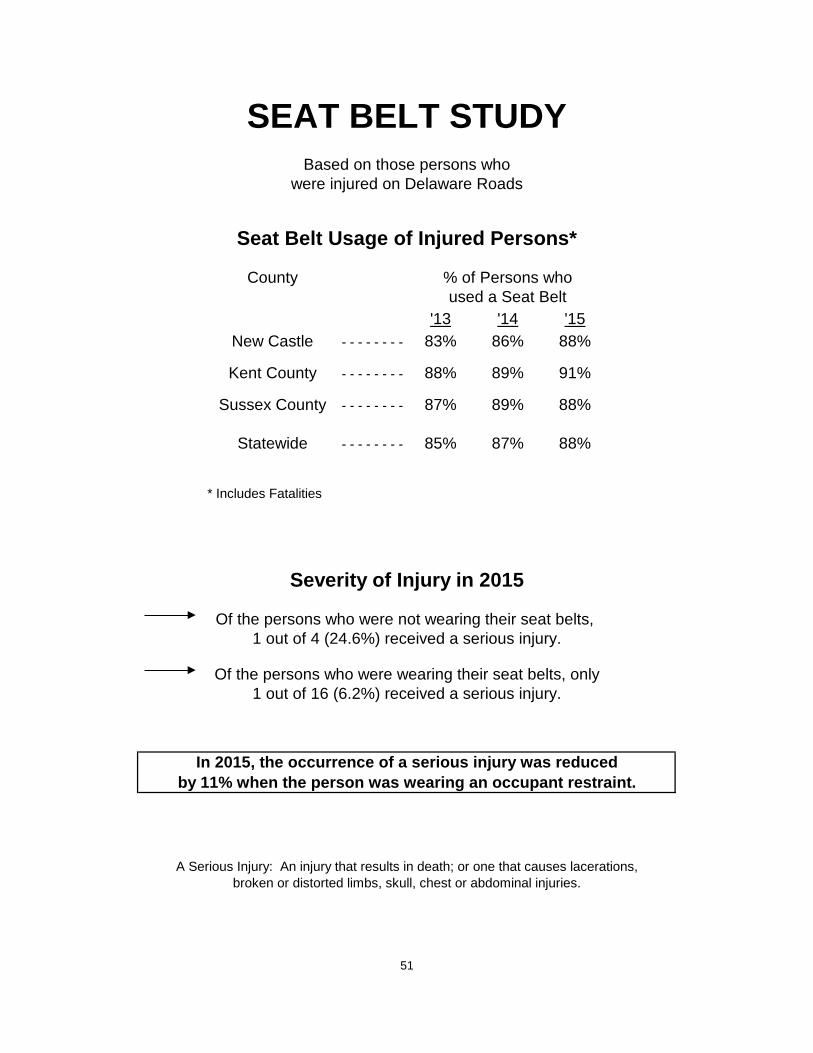
SEAT BELT STUDYBased on those persons who
were injured on Delaware Roads
Seat Belt Usage of Injured Persons*
County % of Persons whoused a Seat Belt
'13 '14 '15New Castle - - - - - - - - 83% 86% 88%
Kent County - - - - - - - - 88% 89% 91%
Sussex County - - - - - - - - 87% 89% 88%
Statewide - - - - - - - - 85% 87% 88%
* Includes Fatalities
Severity of Injury in 2015
Of the persons who were not wearing their seat belts, 1 out of 4 (24.6%) received a serious injury.
Of the persons who were wearing their seat belts, only1 out of 16 (6.2%) received a serious injury.
In 2015, the occurrence of a serious injury was reducedby 11% when the person was wearing an occupant restraint.
A Serious Injury: An injury that results in death; or one that causes lacerations,broken or distorted limbs, skull, chest or abdominal injuries.
51
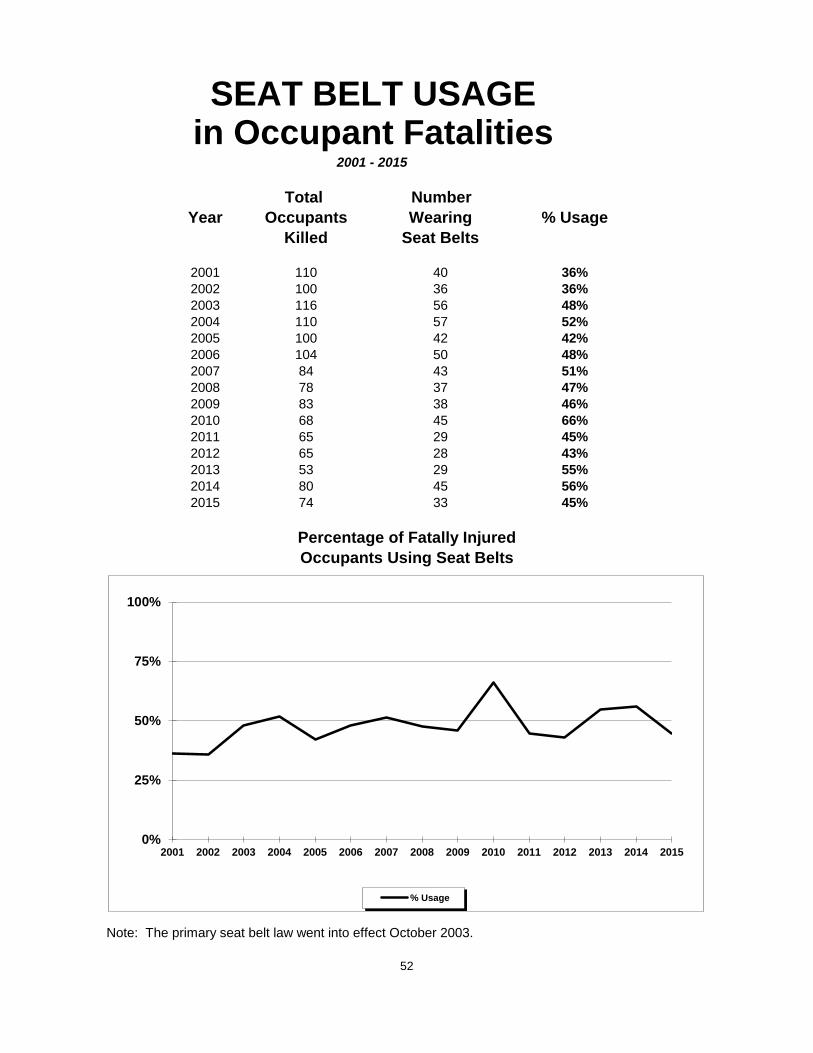
SEAT BELT USAGEin Occupant Fatalities
2001 - 2015
Total Number Year Occupants Wearing % Usage
Killed Seat Belts
2001 110 40 36%2002 100 36 36%2003 116 56 48%2004 110 57 52%2005 100 42 42%2006 104 50 48%2007 84 43 51%2008 78 37 47%2009 83 38 46%2010 68 45 66%2011 65 29 45%2012 65 28 43%2013 53 29 55%2014 80 45 56%2015 74 33 45%
Percentage of Fatally InjuredOccupants Using Seat Belts
Note: The primary seat belt law went into effect October 2003.
52
0%
25%
50%
75%
100%
2001 2002 2003 2004 2005 2006 2007 2008 2009 2010 2011 2012 2013 2014 2015
% Usage
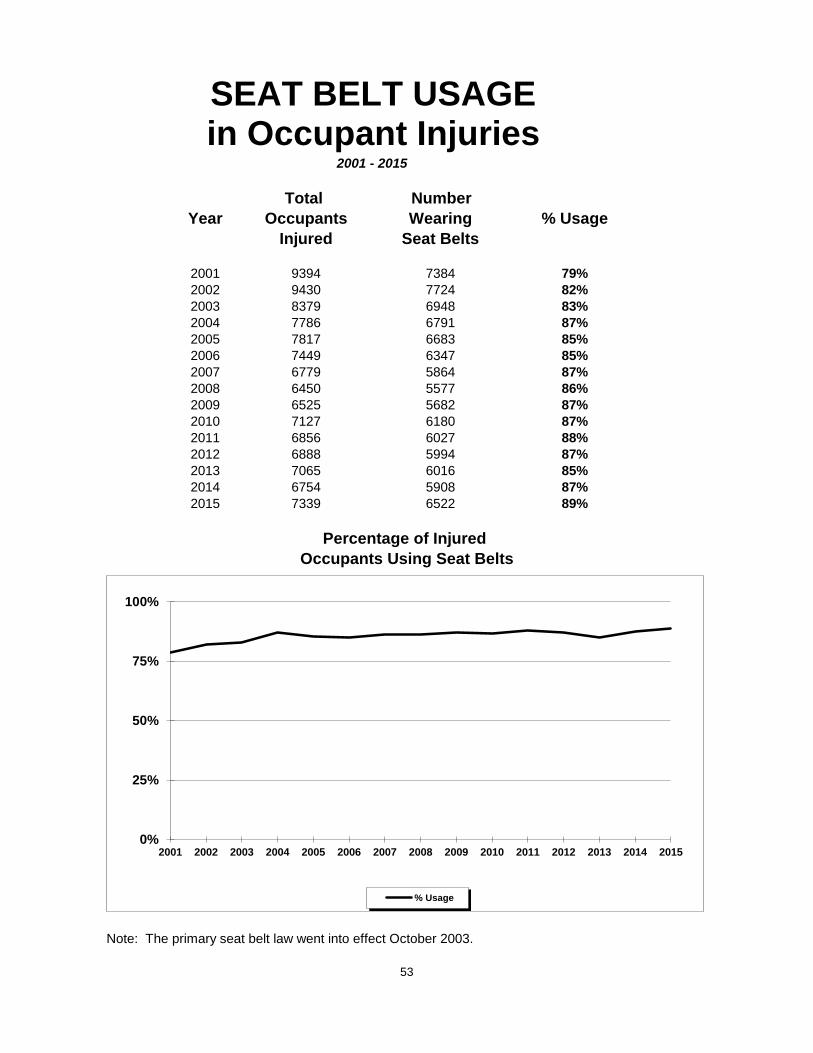
SEAT BELT USAGEin Occupant Injuries
2001 - 2015
Total Number Year Occupants Wearing % Usage
Injured Seat Belts
2001 9394 7384 79%2002 9430 7724 82%2003 8379 6948 83%2004 7786 6791 87%2005 7817 6683 85%2006 7449 6347 85%2007 6779 5864 87%2008 6450 5577 86%2009 6525 5682 87%2010 7127 6180 87%2011 6856 6027 88%2012 6888 5994 87%2013 7065 6016 85%2014 6754 5908 87%2015 7339 6522 89%
Percentage of Injured Occupants Using Seat Belts
Note: The primary seat belt law went into effect October 2003.
53
0%
25%
50%
75%
100%
2001 2002 2003 2004 2005 2006 2007 2008 2009 2010 2011 2012 2013 2014 2015
% Usage
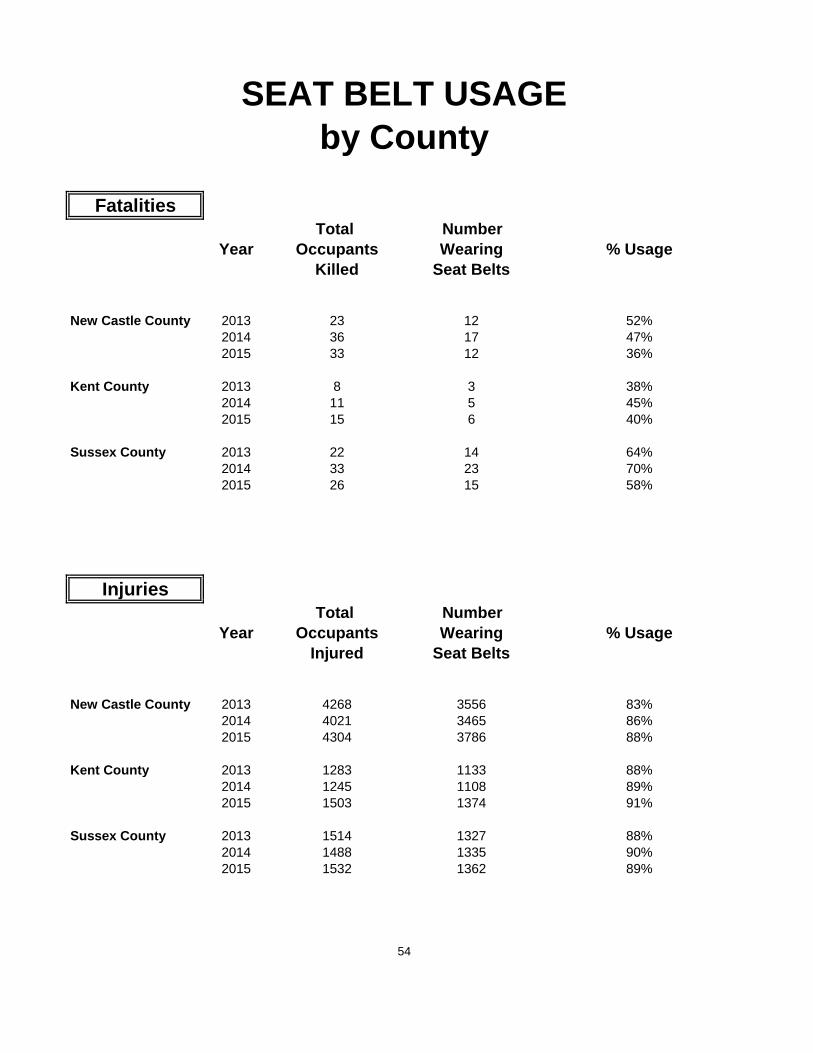
SEAT BELT USAGEby County
FatalitiesTotal Number
Year Occupants Wearing % UsageKilled Seat Belts
New Castle County 2013 23 12 52%2014 36 17 47%2015 33 12 36%
Kent County 2013 8 3 38%2014 11 5 45%2015 15 6 40%
Sussex County 2013 22 14 64%2014 33 23 70%2015 26 15 58%
InjuriesTotal Number
Year Occupants Wearing % UsageInjured Seat Belts
New Castle County 2013 4268 3556 83%2014 4021 3465 86%2015 4304 3786 88%
Kent County 2013 1283 1133 88%2014 1245 1108 89%2015 1503 1374 91%
Sussex County 2013 1514 1327 88%2014 1488 1335 90%2015 1532 1362 89%
54
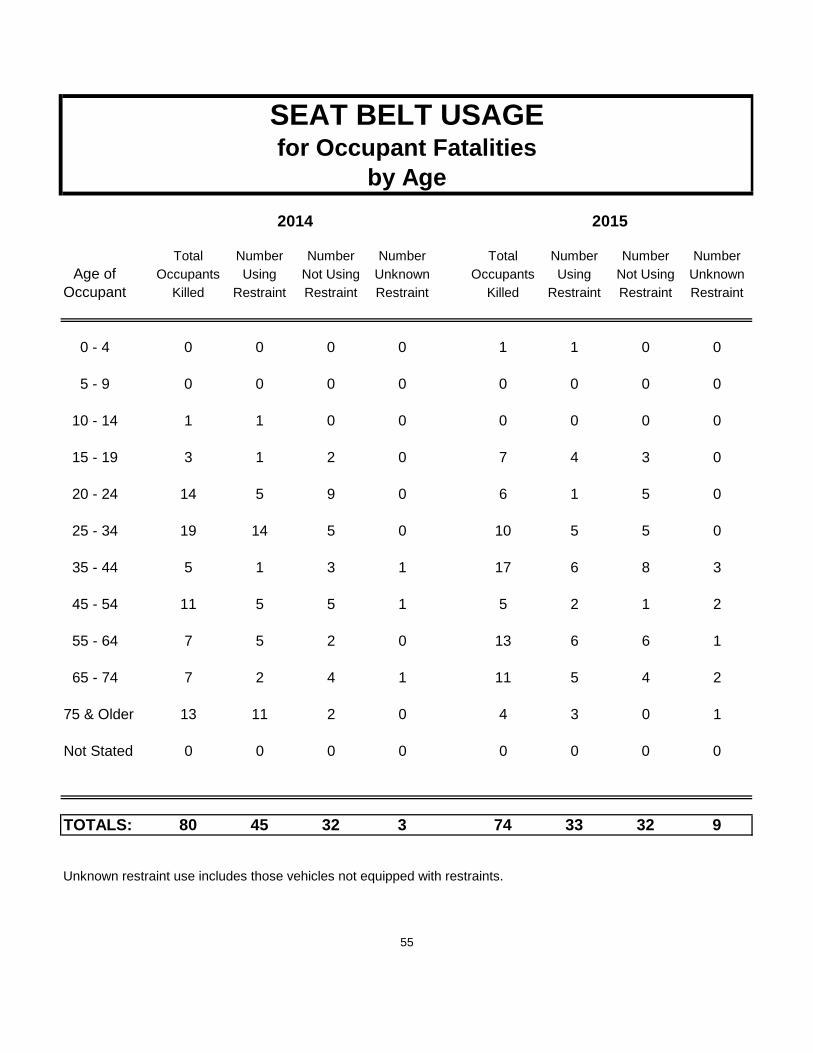
SEAT BELT USAGE for Occupant Fatalities
by Age 2014 2015
Total Number Number Number Total Number Number NumberAge of Occupants Using Not Using Unknown Occupants Using Not Using Unknown
Occupant Killed Restraint Restraint Restraint Killed Restraint Restraint Restraint
0 - 4 0 0 0 0 1 1 0 0
5 - 9 0 0 0 0 0 0 0 0
10 - 14 1 1 0 0 0 0 0 0
15 - 19 3 1 2 0 7 4 3 0
20 - 24 14 5 9 0 6 1 5 0
25 - 34 19 14 5 0 10 5 5 0
35 - 44 5 1 3 1 17 6 8 3
45 - 54 11 5 5 1 5 2 1 2
55 - 64 7 5 2 0 13 6 6 1
65 - 74 7 2 4 1 11 5 4 2
75 & Older 13 11 2 0 4 3 0 1
Not Stated 0 0 0 0 0 0 0 0
TOTALS: 80 45 32 3 74 33 32 9
Unknown restraint use includes those vehicles not equipped with restraints.
55
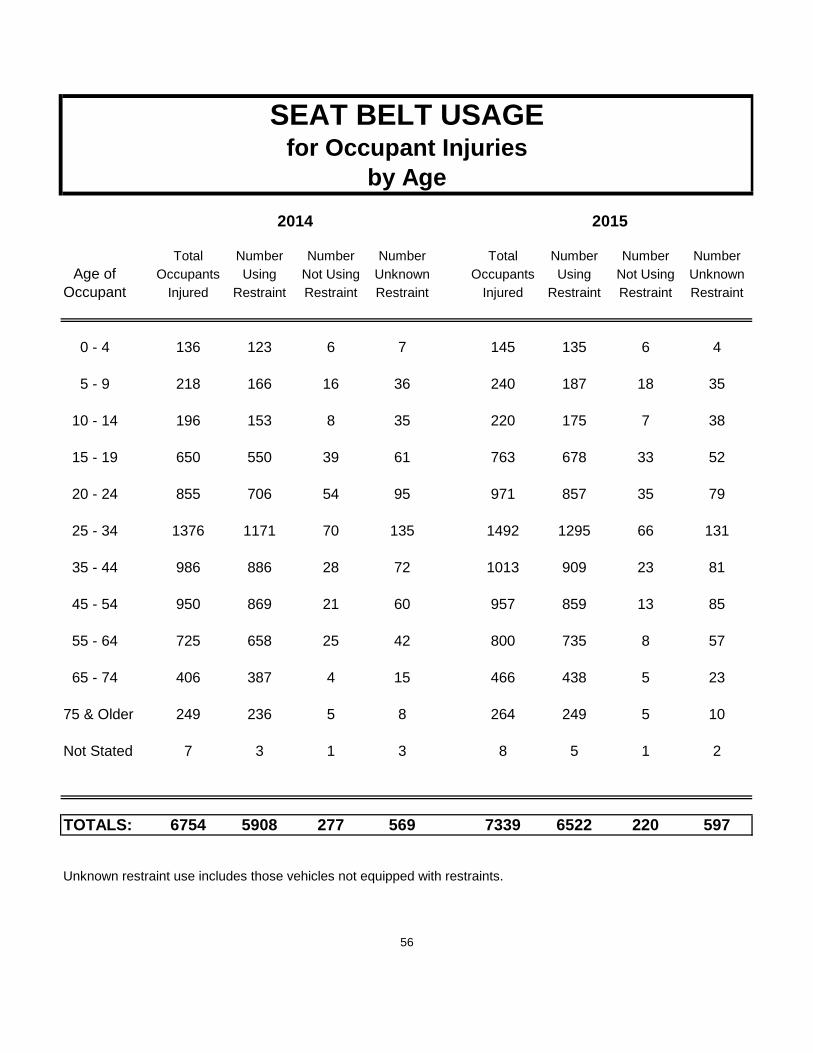
SEAT BELT USAGEfor Occupant Injuries
by Age2014 2015
Total Number Number Number Total Number Number NumberAge of Occupants Using Not Using Unknown Occupants Using Not Using Unknown
Occupant Injured Restraint Restraint Restraint Injured Restraint Restraint Restraint
0 - 4 136 123 6 7 145 135 6 4
5 - 9 218 166 16 36 240 187 18 35
10 - 14 196 153 8 35 220 175 7 38
15 - 19 650 550 39 61 763 678 33 52
20 - 24 855 706 54 95 971 857 35 79
25 - 34 1376 1171 70 135 1492 1295 66 131
35 - 44 986 886 28 72 1013 909 23 81
45 - 54 950 869 21 60 957 859 13 85
55 - 64 725 658 25 42 800 735 8 57
65 - 74 406 387 4 15 466 438 5 23
75 & Older 249 236 5 8 264 249 5 10
Not Stated 7 3 1 3 8 5 1 2
TOTALS: 6754 5908 277 569 7339 6522 220 597
Unknown restraint use includes those vehicles not equipped with restraints.
56
Alcohol Involvement
in
Traffic Crashes
Definition:A crash is considered alcohol related if at least one driver or non-motorist involved in the
crash has consumed alcohol -- regardless of the level of blood alcohol concentration.
57
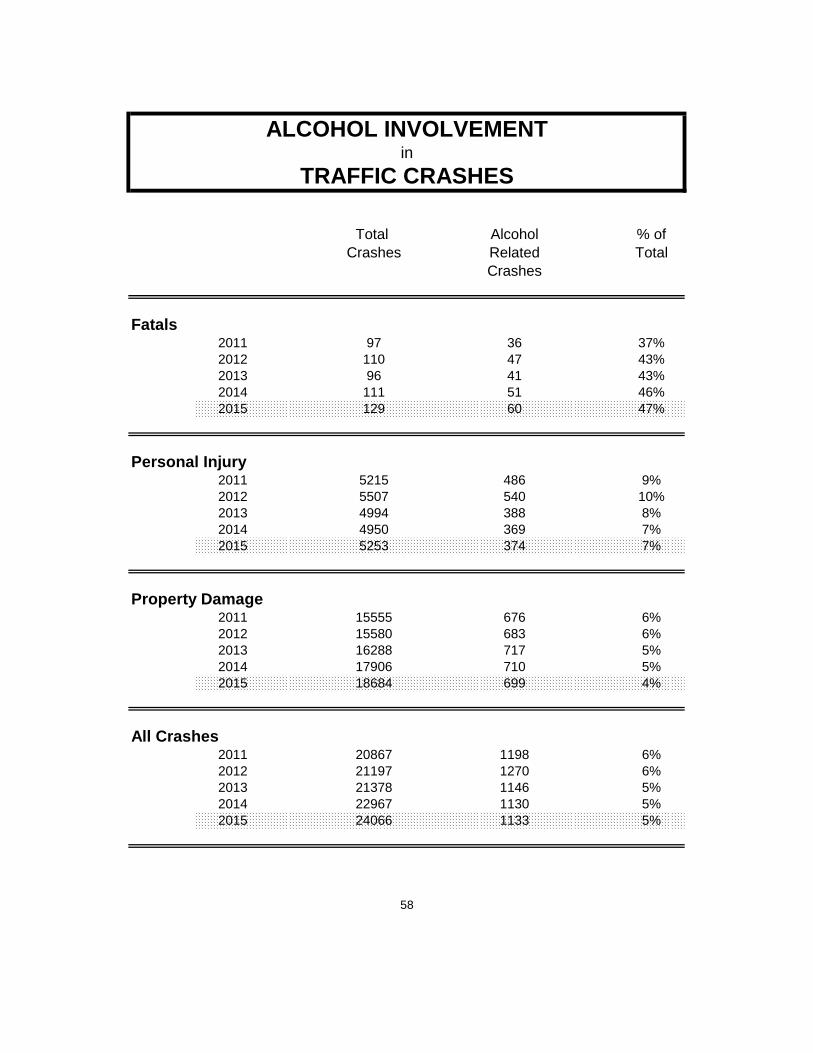
ALCOHOL INVOLVEMENTin
TRAFFIC CRASHES
Total Alcohol % ofCrashes Related Total
Crashes
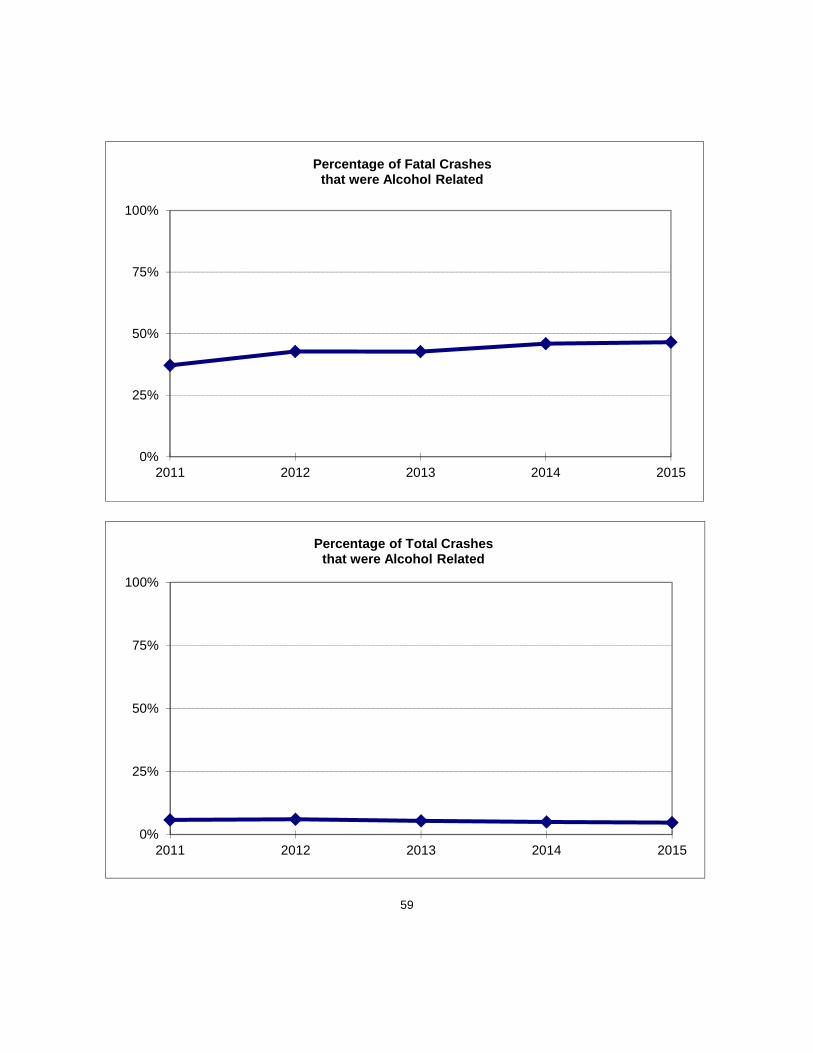
Fatals2011 97 36 37%2012 110 47 43%2013 96 41 43%2014 111 51 46%2015 129 60 47%
Personal Injury2011 5215 486 9%2012 5507 540 10%2013 4994 388 8%2014 4950 369 7%2015 5253 374 7%
Property Damage2011 15555 676 6%2012 15580 683 6%2013 16288 717 5%2014 17906 710 5%2015 18684 699 4%
All Crashes2011 20867 1198 6%2012 21197 1270 6%2013 21378 1146 5%2014 22967 1130 5%2015 24066 1133 5%
58
59
0%
25%
50%
75%
100%
2011 2012 2013 2014 2015
Percentage of Fatal Crashes that were Alcohol Related
0%
25%
50%
75%
100%
2011 2012 2013 2014 2015
Percentage of Total Crashes that were Alcohol Related
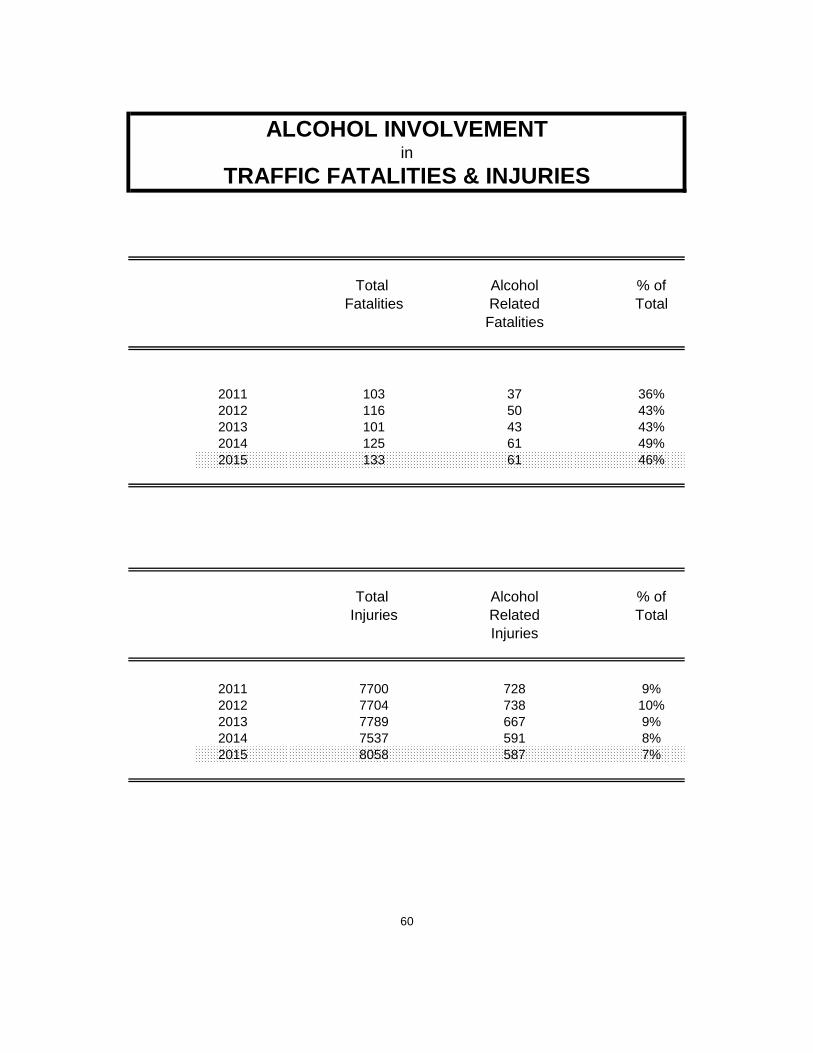
ALCOHOL INVOLVEMENTin
TRAFFIC FATALITIES & INJURIES
Total Alcohol % ofFatalities Related Total
Fatalities
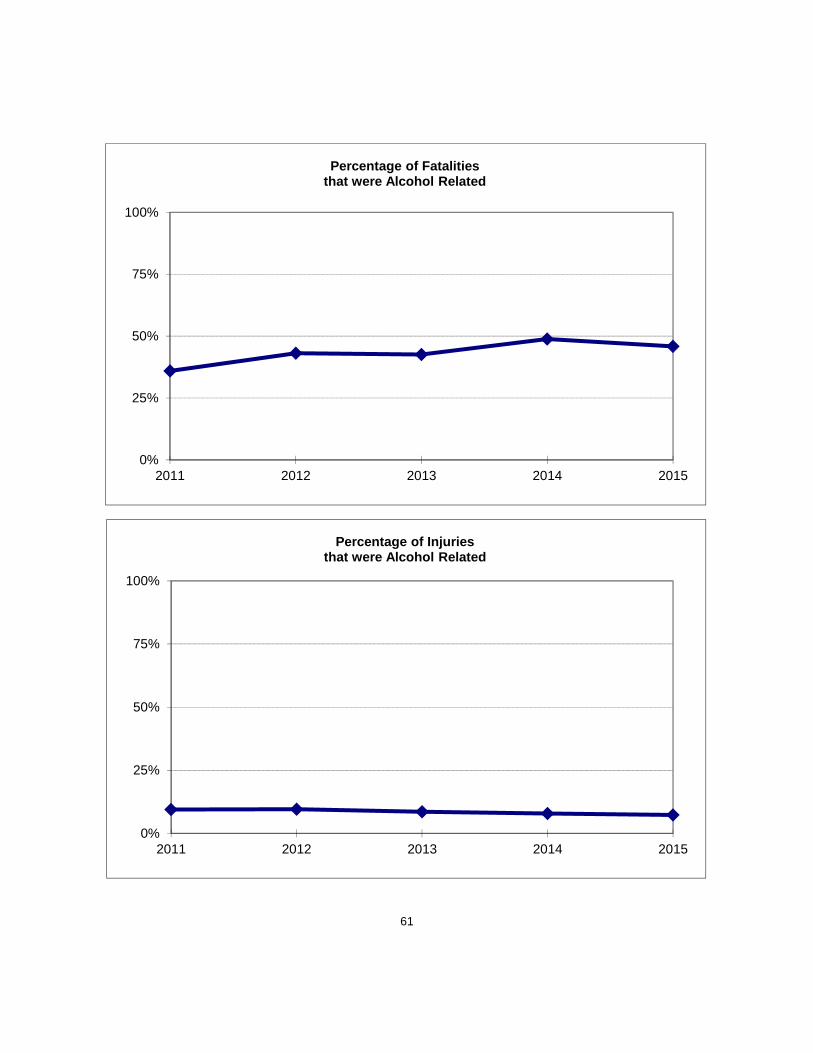
2011 103 37 36%2012 116 50 43%2013 101 43 43%2014 125 61 49%2015 133 61 46%
Total Alcohol % ofInjuries Related Total
Injuries
2011 7700 728 9%2012 7704 738 10%2013 7789 667 9%2014 7537 591 8%2015 8058 587 7%
60
61
0%
25%
50%
75%
100%
2011 2012 2013 2014 2015
Percentage of Fatalities that were Alcohol Related
0%
25%
50%
75%
100%
2011 2012 2013 2014 2015
Percentage of Injuries that were Alcohol Related
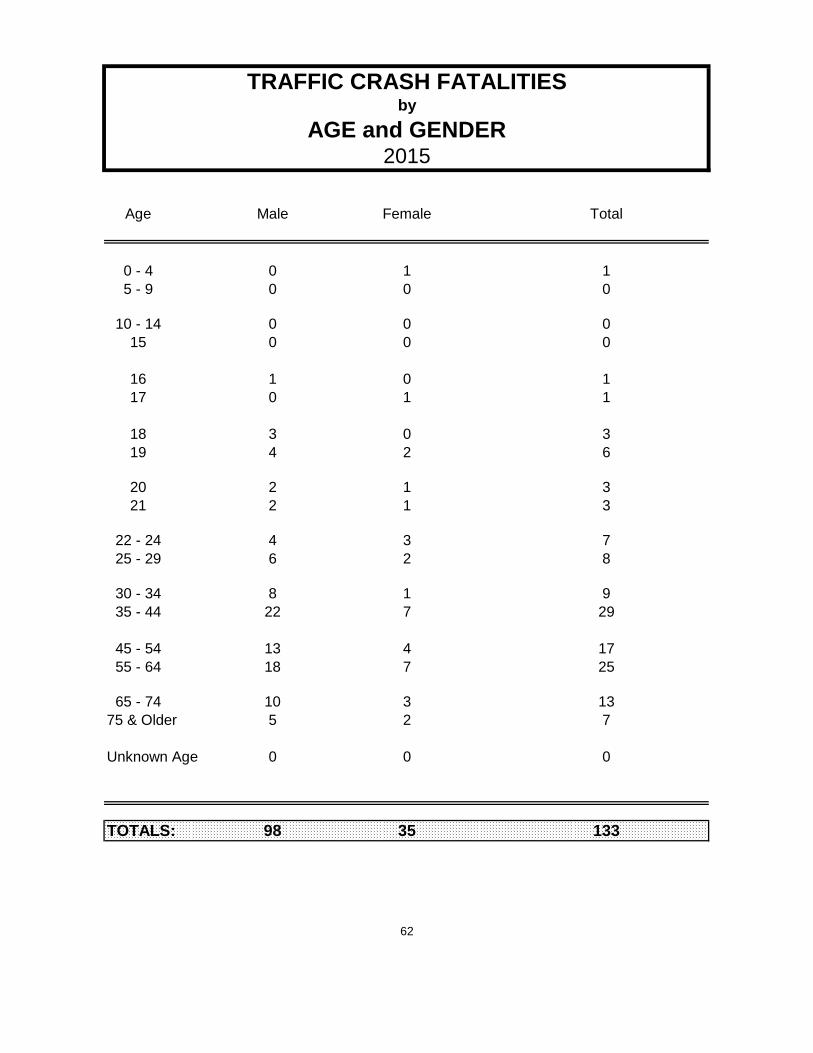
TRAFFIC CRASH FATALITIESby
AGE and GENDER2015
Age Male Female Total
0 - 4 0 1 15 - 9 0 0 0
10 - 14 0 0 015 0 0 0
16 1 0 117 0 1 1
18 3 0 319 4 2 6
20 2 1 321 2 1 3
22 - 24 4 3 725 - 29 6 2 8
30 - 34 8 1 935 - 44 22 7 29
45 - 54 13 4 1755 - 64 18 7 25
65 - 74 10 3 1375 & Older 5 2 7
Unknown Age 0 0 0
TOTALS: 98 35 133
62
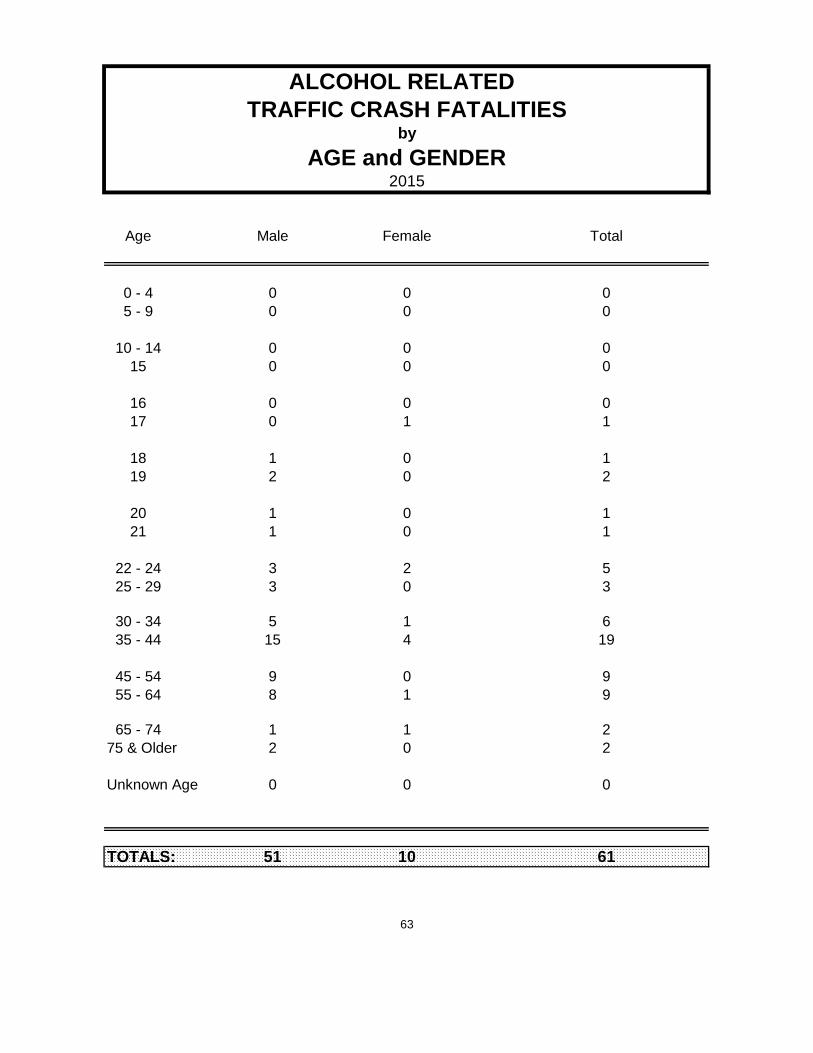
ALCOHOL RELATED TRAFFIC CRASH FATALITIES
by
AGE and GENDER2015
Age Male Female Total
0 - 4 0 0 05 - 9 0 0 0
10 - 14 0 0 015 0 0 0
16 0 0 017 0 1 1
18 1 0 119 2 0 2
20 1 0 121 1 0 1
22 - 24 3 2 525 - 29 3 0 3
30 - 34 5 1 635 - 44 15 4 19
45 - 54 9 0 955 - 64 8 1 9
65 - 74 1 1 275 & Older 2 0 2
Unknown Age 0 0 0
TOTALS: 51 10 61
63
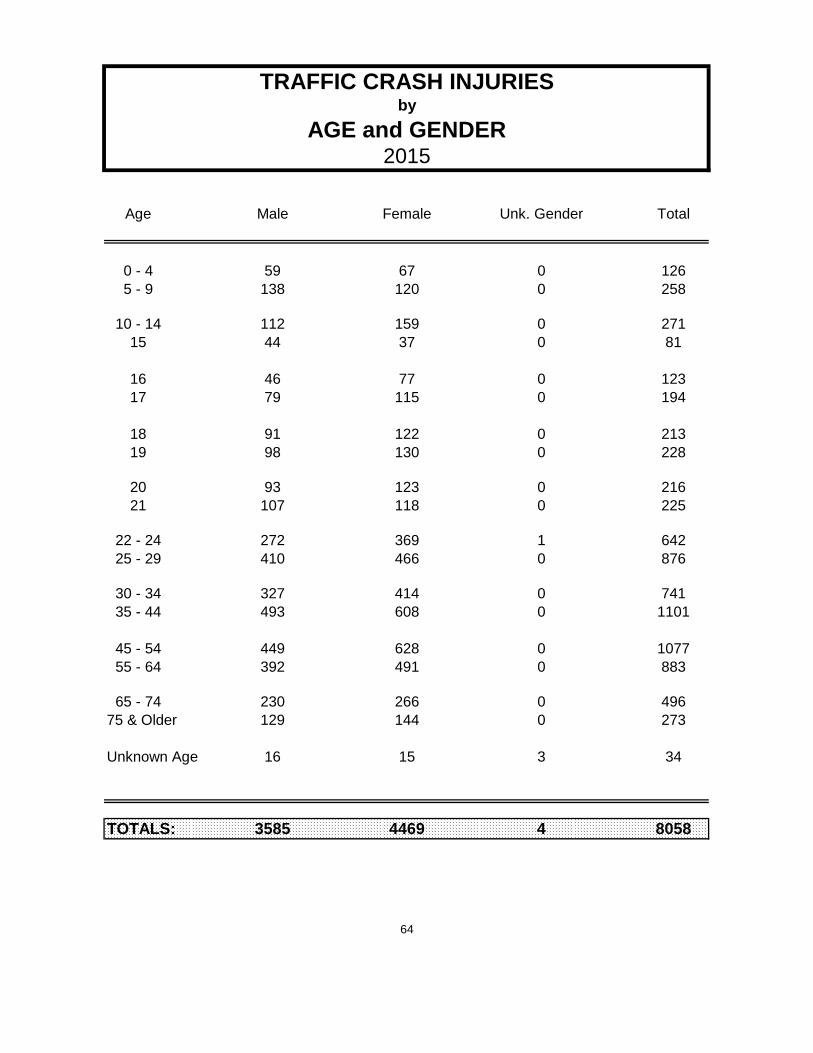
TRAFFIC CRASH INJURIESby
AGE and GENDER2015
Age Male Female Unk. Gender Total
0 - 4 59 67 0 1265 - 9 138 120 0 258
10 - 14 112 159 0 27115 44 37 0 81
16 46 77 0 12317 79 115 0 194
18 91 122 0 21319 98 130 0 228
20 93 123 0 21621 107 118 0 225
22 - 24 272 369 1 64225 - 29 410 466 0 876
30 - 34 327 414 0 74135 - 44 493 608 0 1101
45 - 54 449 628 0 107755 - 64 392 491 0 883
65 - 74 230 266 0 49675 & Older 129 144 0 273
Unknown Age 16 15 3 34
TOTALS: 3585 4469 4 8058
64
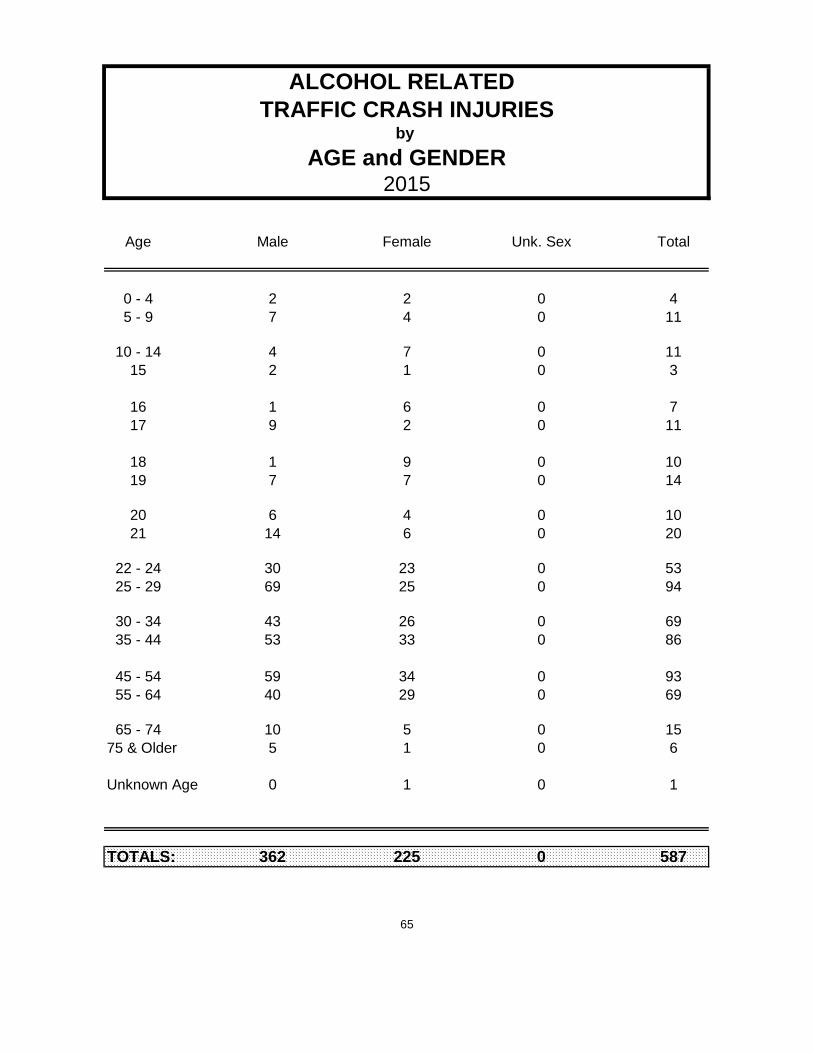
ALCOHOL RELATED TRAFFIC CRASH INJURIES
by
AGE and GENDER2015
Age Male Female Unk. Sex Total
0 - 4 2 2 0 45 - 9 7 4 0 11
10 - 14 4 7 0 1115 2 1 0 3
16 1 6 0 717 9 2 0 11
18 1 9 0 1019 7 7 0 14
20 6 4 0 1021 14 6 0 20
22 - 24 30 23 0 5325 - 29 69 25 0 94
30 - 34 43 26 0 6935 - 44 53 33 0 86
45 - 54 59 34 0 9355 - 64 40 29 0 69
65 - 74 10 5 0 1575 & Older 5 1 0 6
Unknown Age 0 1 0 1
TOTALS: 362 225 0 587
65
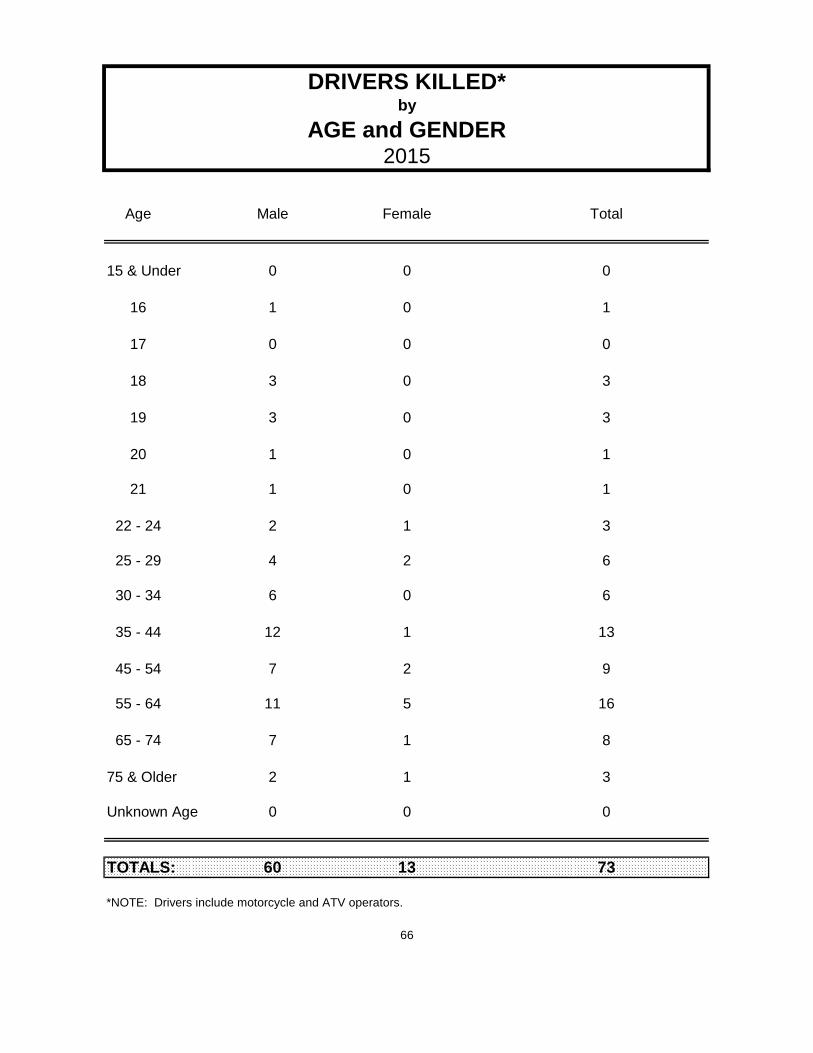
DRIVERS KILLED*by
AGE and GENDER2015
Age Male Female Total
15 & Under 0 0 0
16 1 0 1
17 0 0 0
18 3 0 3
19 3 0 3
20 1 0 1
21 1 0 1
22 - 24 2 1 3
25 - 29 4 2 6
30 - 34 6 0 6
35 - 44 12 1 13
45 - 54 7 2 9
55 - 64 11 5 16
65 - 74 7 1 8
75 & Older 2 1 3
Unknown Age 0 0 0
TOTALS: 60 13 73
*NOTE: Drivers include motorcycle and ATV operators.
66
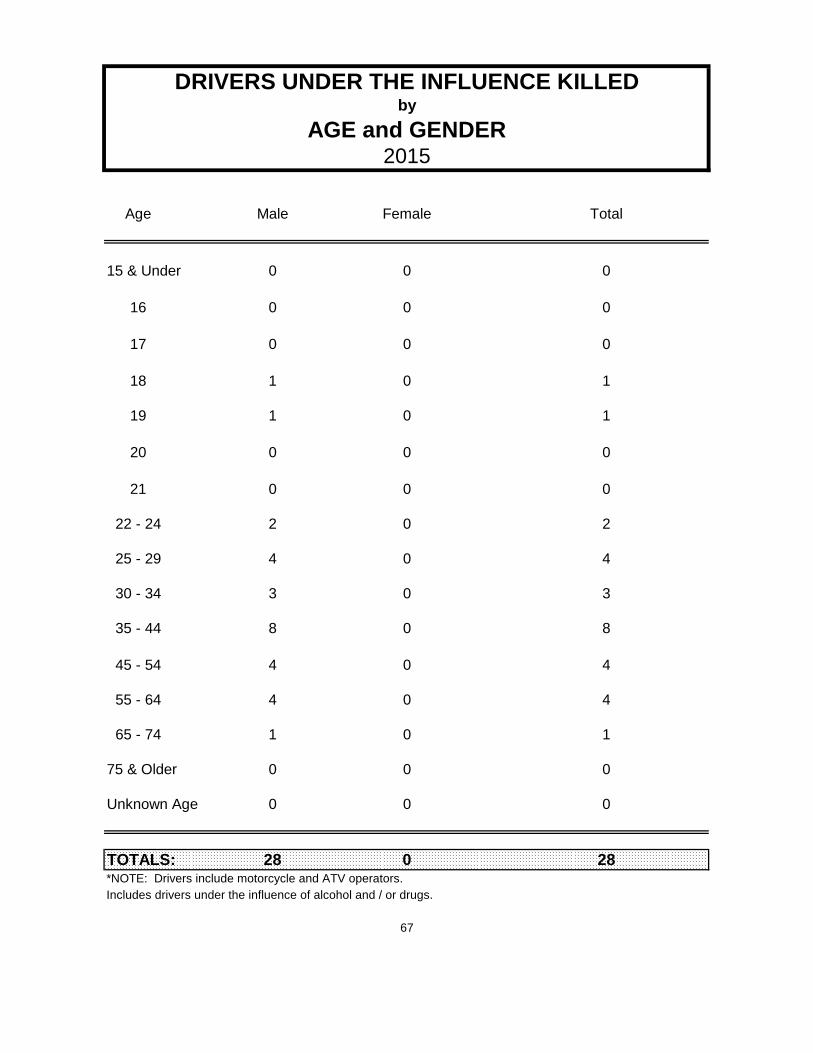
DRIVERS UNDER THE INFLUENCE KILLEDby
AGE and GENDER2015
Age Male Female Total
15 & Under 0 0 0
16 0 0 0
17 0 0 0
18 1 0 1
19 1 0 1
20 0 0 0
21 0 0 0
22 - 24 2 0 2
25 - 29 4 0 4
30 - 34 3 0 3
35 - 44 8 0 8
45 - 54 4 0 4
55 - 64 4 0 4
65 - 74 1 0 1
75 & Older 0 0 0
Unknown Age 0 0 0
TOTALS: 28 0 28*NOTE: Drivers include motorcycle and ATV operators.Includes drivers under the influence of alcohol and / or drugs.
67
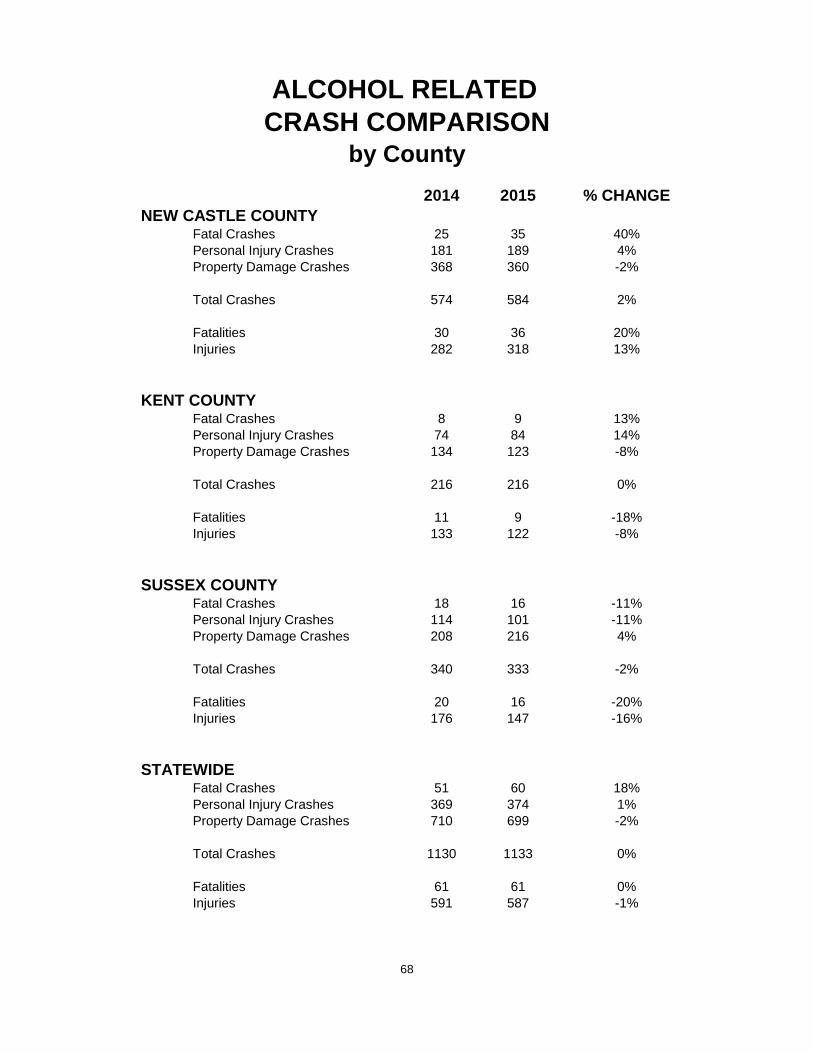
ALCOHOL RELATEDCRASH COMPARISON
by County
2014 2015 % CHANGE NEW CASTLE COUNTY
Fatal Crashes 25 35 40%Personal Injury Crashes 181 189 4%Property Damage Crashes 368 360 -2%
Total Crashes 574 584 2%
Fatalities 30 36 20%Injuries 282 318 13%
KENT COUNTYFatal Crashes 8 9 13%Personal Injury Crashes 74 84 14%Property Damage Crashes 134 123 -8%
Total Crashes 216 216 0%
Fatalities 11 9 -18%Injuries 133 122 -8%
SUSSEX COUNTYFatal Crashes 18 16 -11%Personal Injury Crashes 114 101 -11%Property Damage Crashes 208 216 4%
Total Crashes 340 333 -2%
Fatalities 20 16 -20%Injuries 176 147 -16%
STATEWIDEFatal Crashes 51 60 18%Personal Injury Crashes 369 374 1%Property Damage Crashes 710 699 -2%
Total Crashes 1130 1133 0%
Fatalities 61 61 0%Injuries 591 587 -1%
68
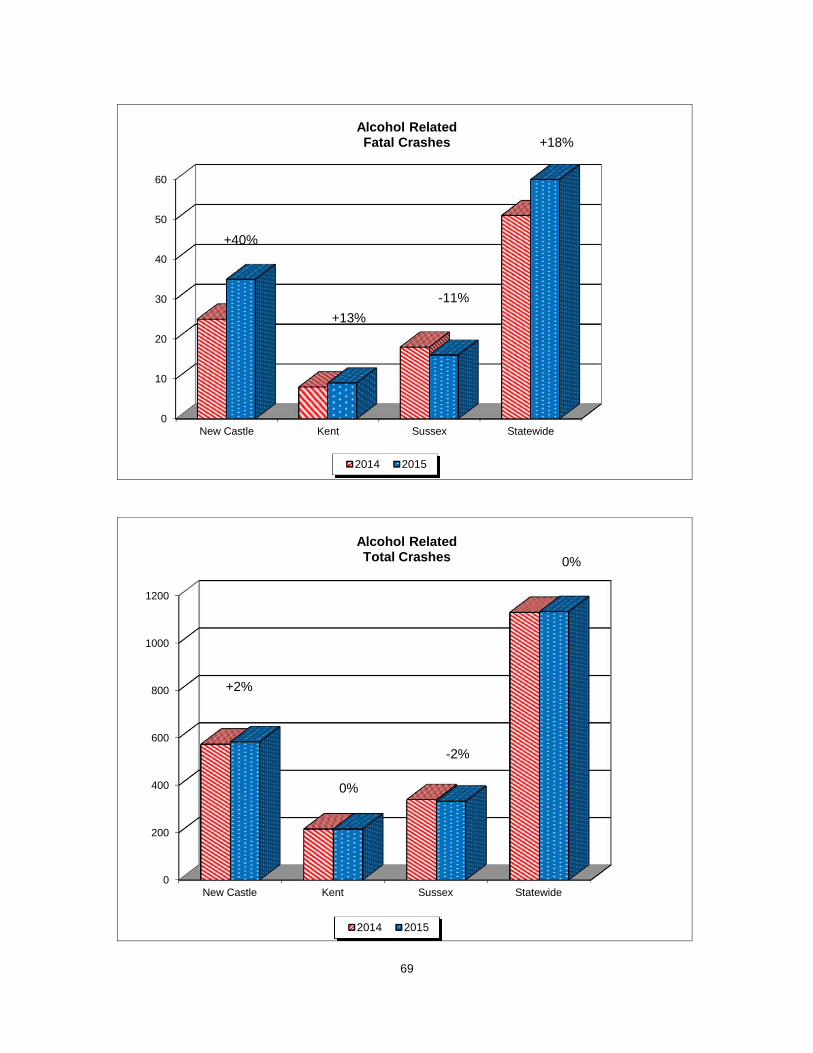
69
0
10
20
30
40
50
60
New Castle Kent Sussex Statewide
Alcohol Related Fatal Crashes
2014 2015
+40%
+13%
-11%
+18%
0
200
400
600
800
1000
1200
New Castle Kent Sussex Statewide
Alcohol Related Total Crashes
2014 2015
+2%
0%
-2%
0%
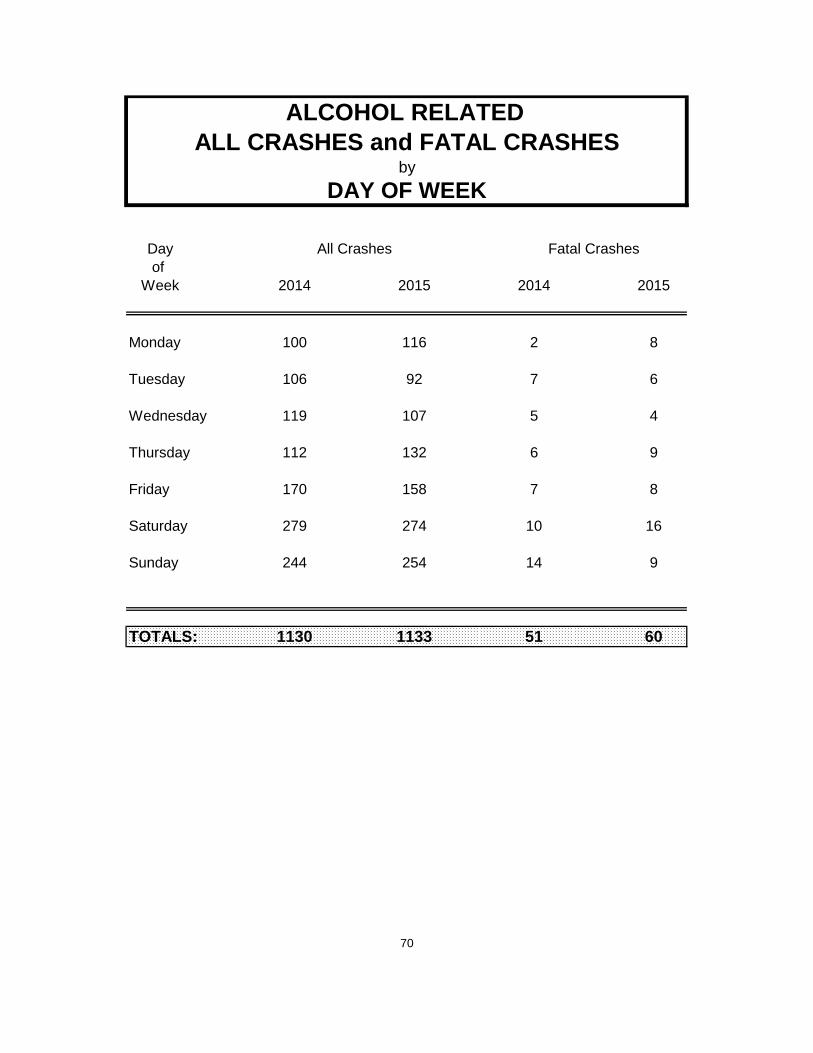
ALCOHOL RELATEDALL CRASHES and FATAL CRASHES
by
DAY OF WEEK
Day All Crashes Fatal Crashesof
Week 2014 2015 2014 2015
Monday 100 116 2 8
Tuesday 106 92 7 6
Wednesday 119 107 5 4
Thursday 112 132 6 9
Friday 170 158 7 8
Saturday 279 274 10 16
Sunday 244 254 14 9
TOTALS: 1130 1133 51 60
70
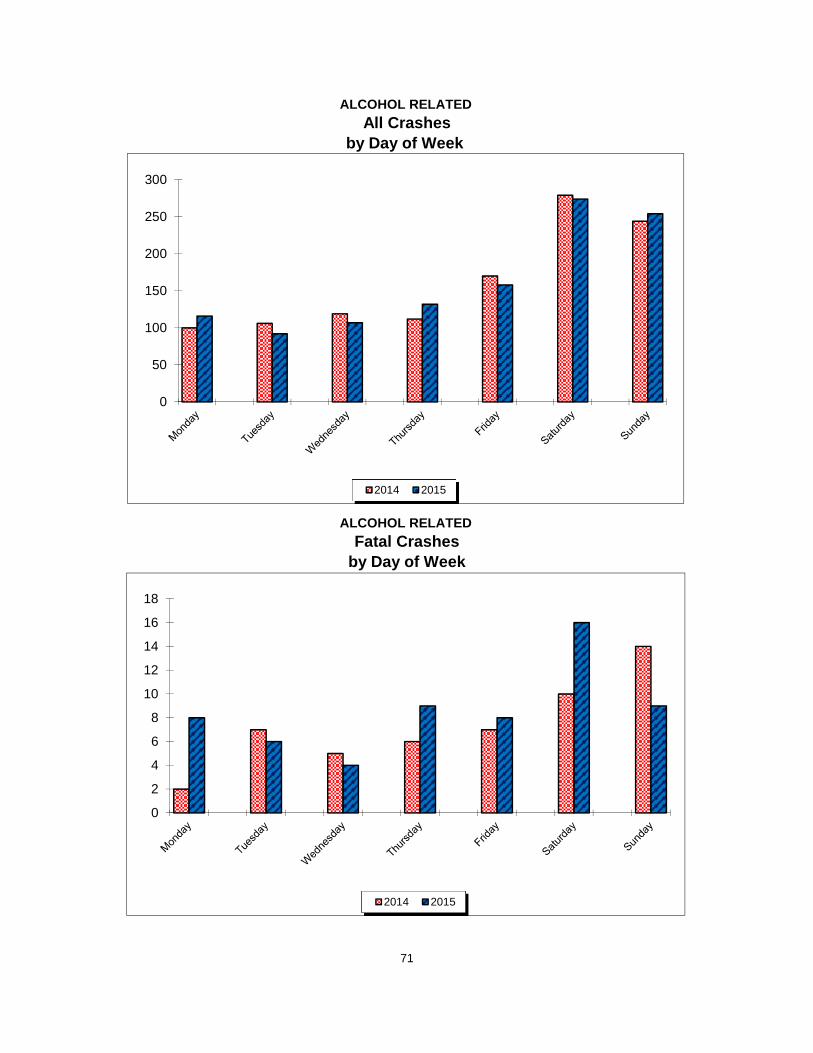
ALCOHOL RELATEDAll Crashes
by Day of Week
ALCOHOL RELATEDFatal Crashes
by Day of Week
71
0
50
100
150
200
250
300
2014 2015
0
2
4
6
8
10
12
14
16
18
2014 2015
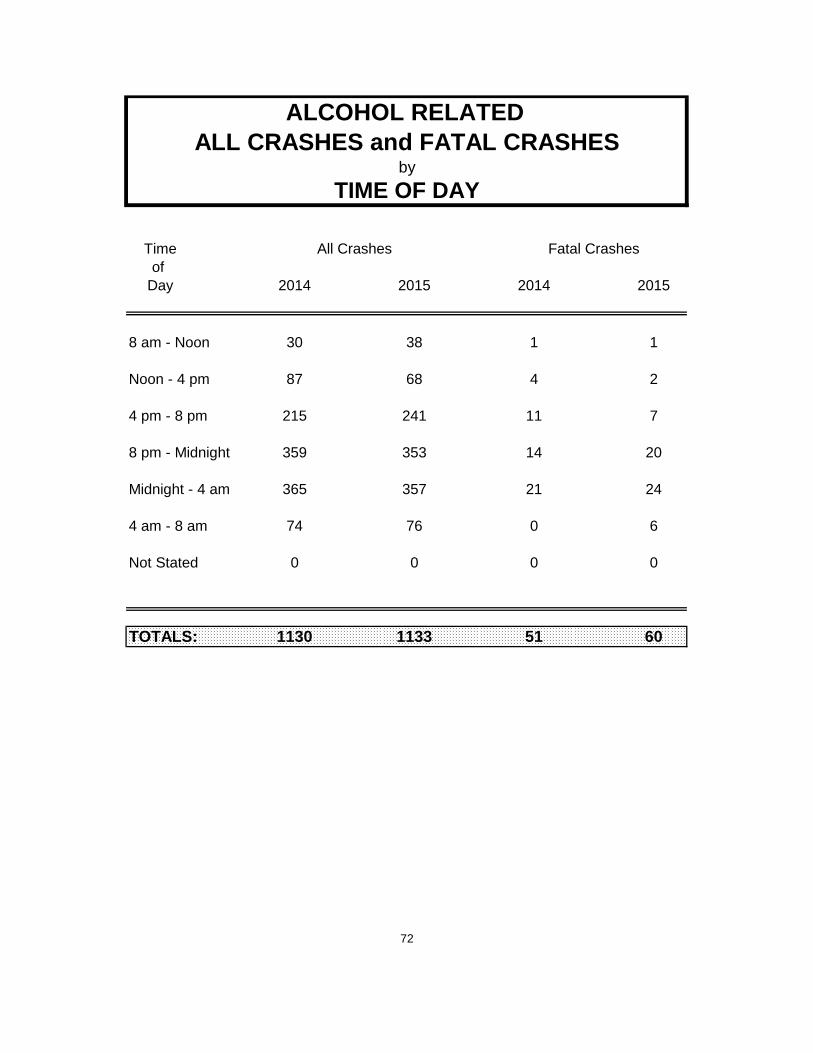
ALCOHOL RELATEDALL CRASHES and FATAL CRASHES
by
TIME OF DAY
Time All Crashes Fatal Crashesof
Day 2014 2015 2014 2015
8 am - Noon 30 38 1 1
Noon - 4 pm 87 68 4 2
4 pm - 8 pm 215 241 11 7
8 pm - Midnight 359 353 14 20
Midnight - 4 am 365 357 21 24
4 am - 8 am 74 76 0 6
Not Stated 0 0 0 0
TOTALS: 1130 1133 51 60
72
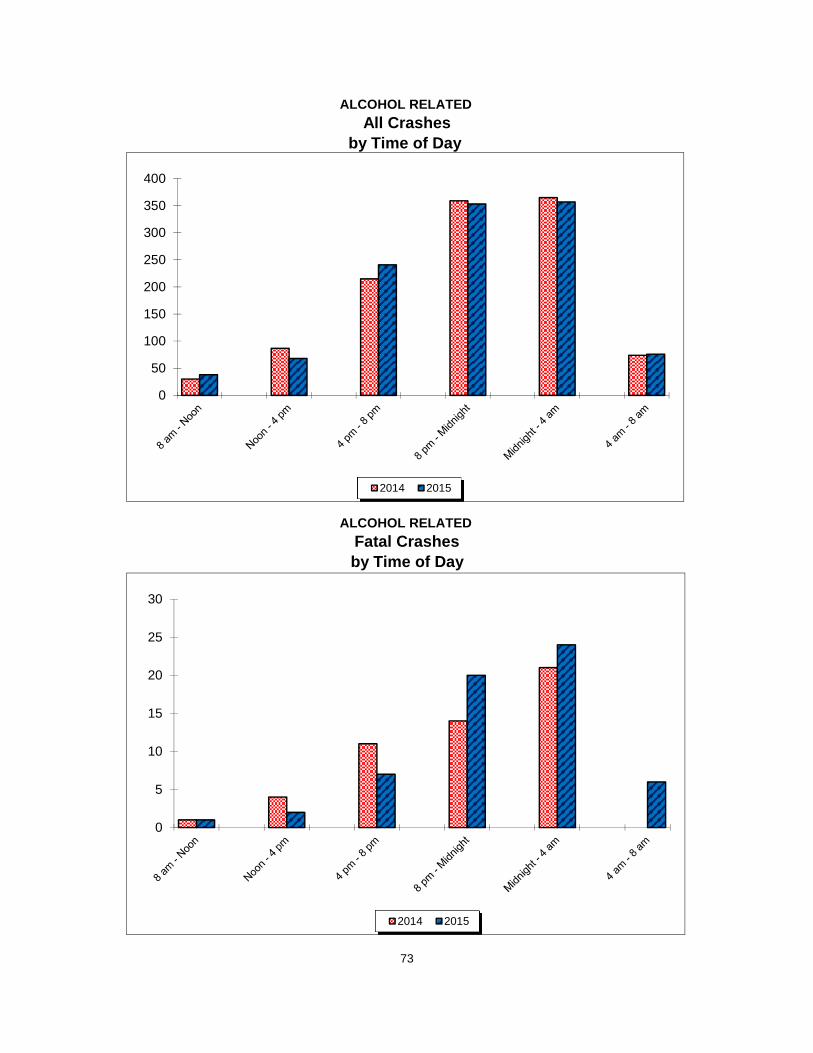
ALCOHOL RELATEDAll Crashes
by Time of Day
ALCOHOL RELATEDFatal Crashesby Time of Day
73
0
50
100
150
200
250
300
350
400
2014 2015
0
5
10
15
20
25
30
2014 2015
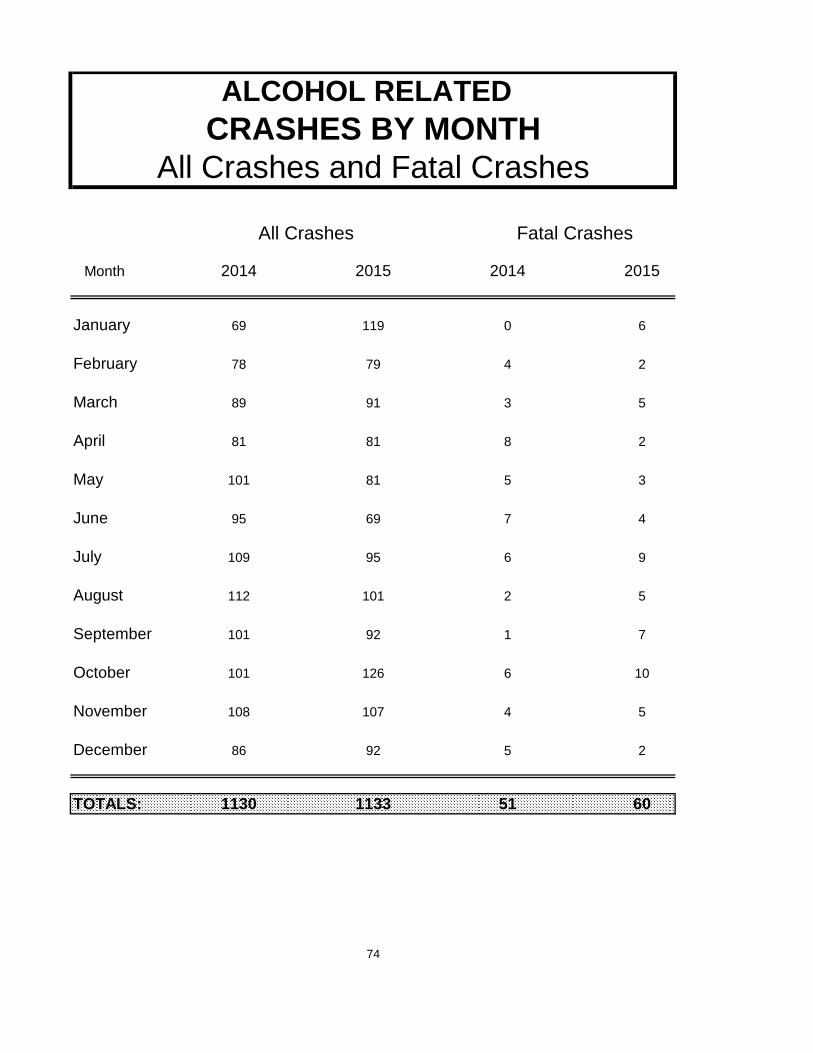
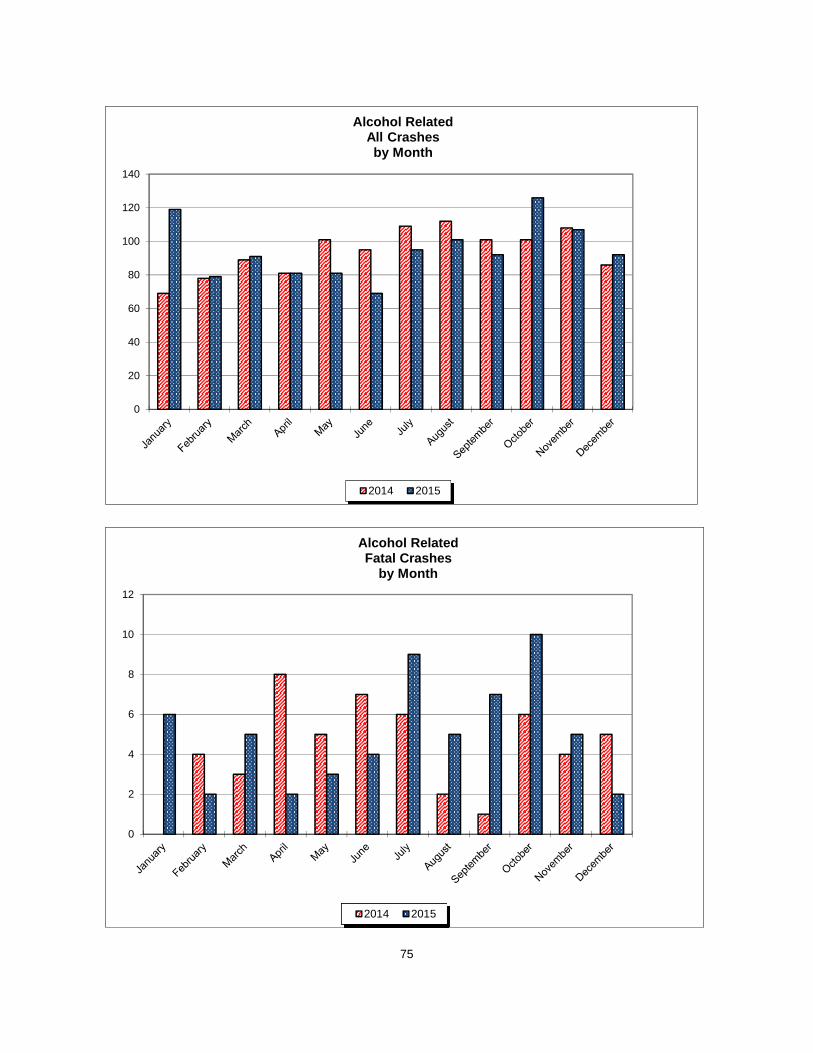
ALCOHOL RELATED CRASHES BY MONTH
All Crashes and Fatal Crashes
All Crashes Fatal Crashes
Month 2014 2015 2014 2015
January 69 119 0 6
February 78 79 4 2
March 89 91 3 5
April 81 81 8 2
May 101 81 5 3
June 95 69 7 4
July 109 95 6 9
August 112 101 2 5
September 101 92 1 7
October 101 126 6 10
November 108 107 4 5
December 86 92 5 2
TOTALS: 1130 1133 51 60
74
75
0
20
40
60
80
100
120
140
Alcohol RelatedAll Crashes by Month
2014 2015
0
2
4
6
8
10
12
Alcohol RelatedFatal Crashes
by Month
2014 2015
76
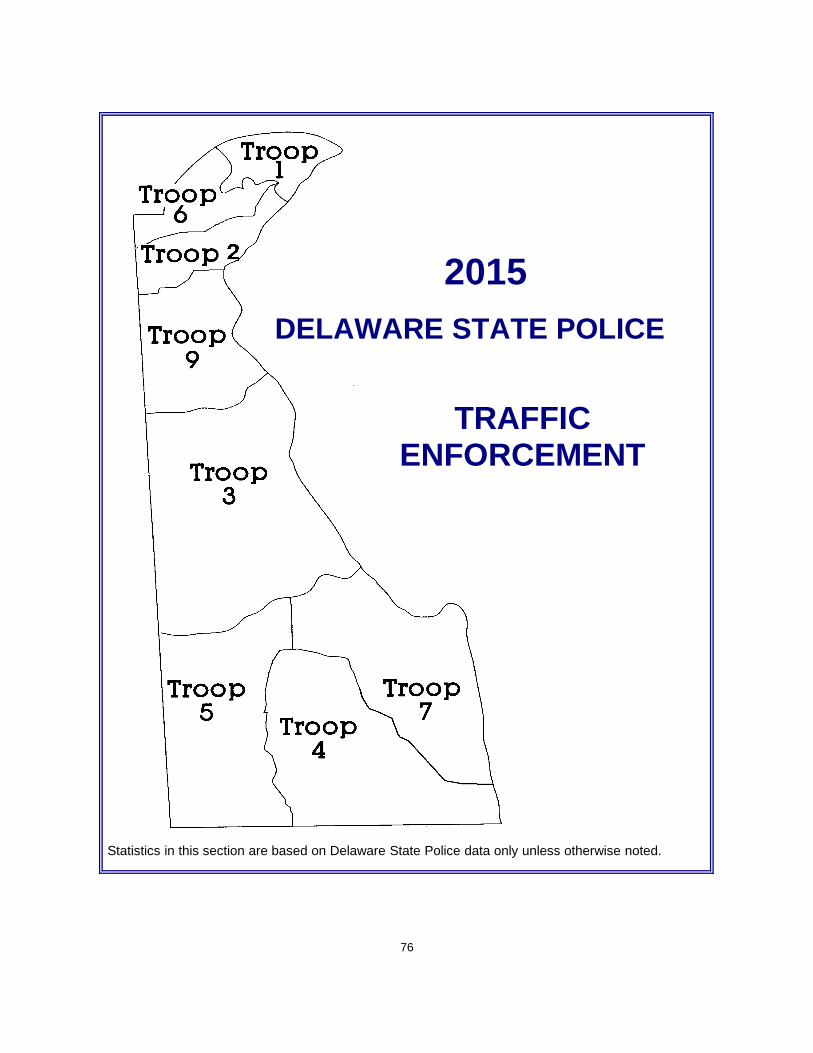
2015DELAWARE STATE POLICE
TRAFFIC ENFORCEMENT
Statistics in this section are based on Delaware State Police data only unless otherwise noted.
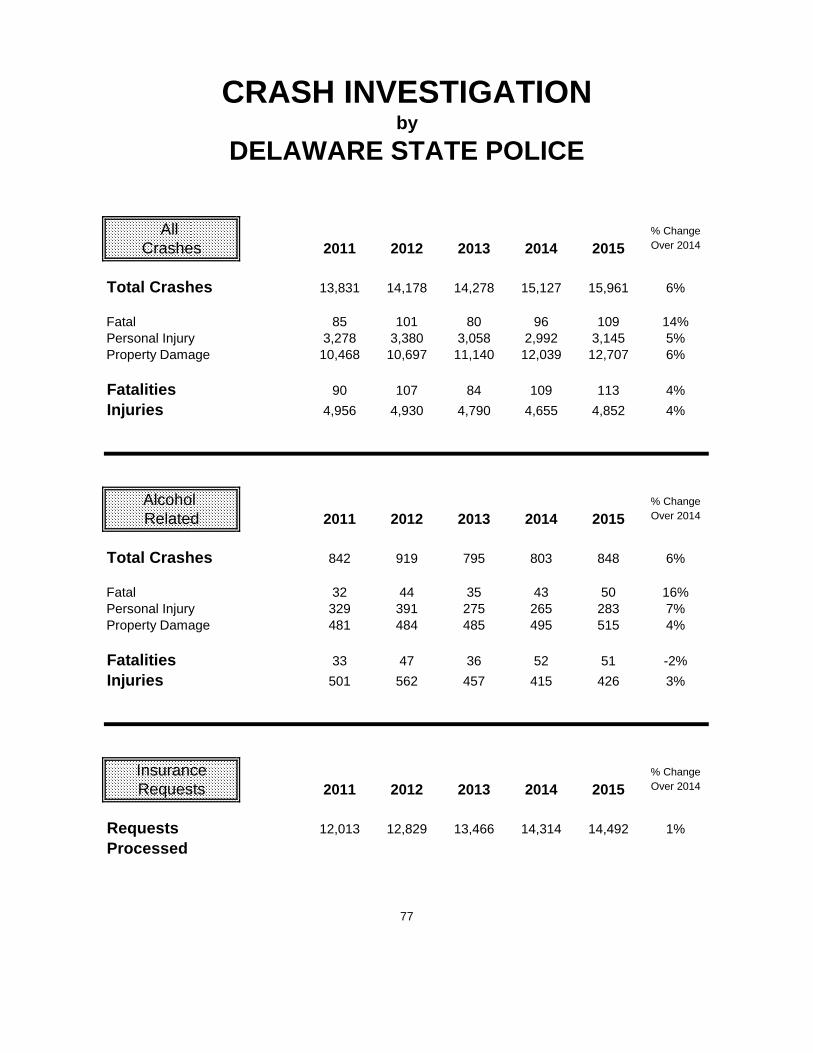
CRASH INVESTIGATIONby
DELAWARE STATE POLICE
All % Change
Crashes 2011 2012 2013 2014 2015 Over 2014
Total Crashes 13,831 14,178 14,278 15,127 15,961 6%
Fatal 85 101 80 96 109 14%Personal Injury 3,278 3,380 3,058 2,992 3,145 5%Property Damage 10,468 10,697 11,140 12,039 12,707 6%
Fatalities 90 107 84 109 113 4%
Injuries 4,956 4,930 4,790 4,655 4,852 4%
Alcohol % Change
Related 2011 2012 2013 2014 2015 Over 2014
Total Crashes 842 919 795 803 848 6%
Fatal 32 44 35 43 50 16%Personal Injury 329 391 275 265 283 7%Property Damage 481 484 485 495 515 4%
Fatalities 33 47 36 52 51 -2%
Injuries 501 562 457 415 426 3%
Insurance % Change
Requests 2011 2012 2013 2014 2015 Over 2014
Requests 12,013 12,829 13,466 14,314 14,492 1%
Processed
77
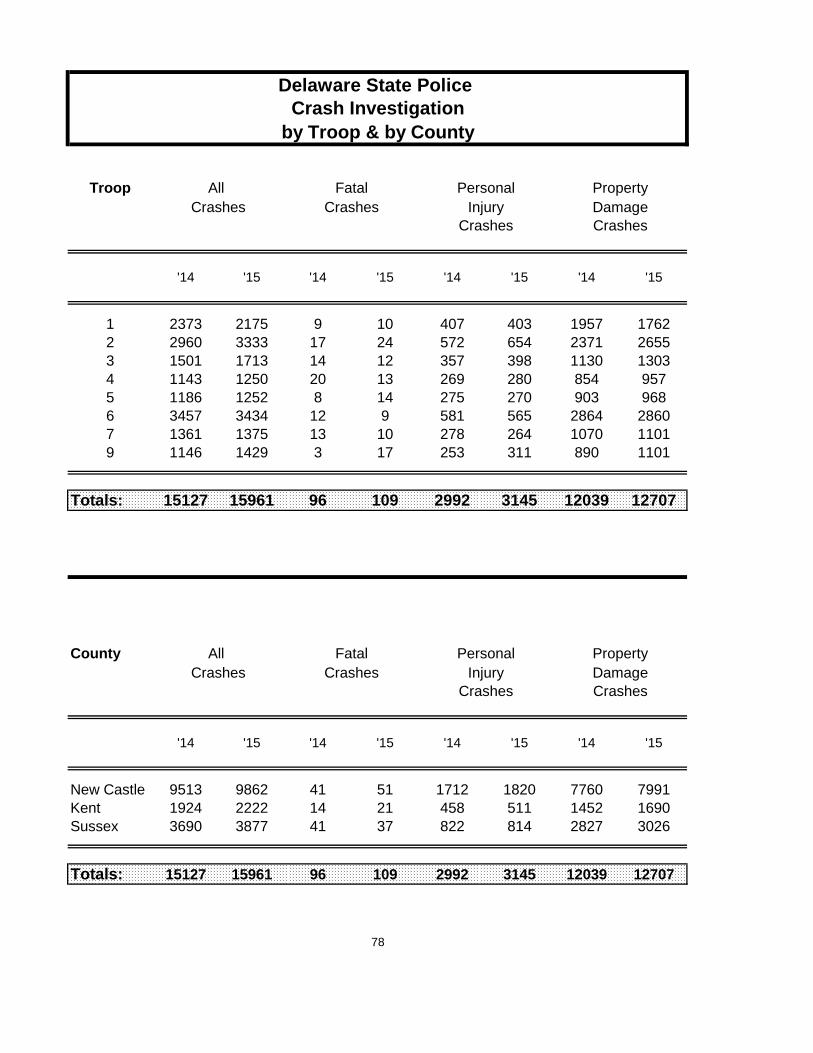
Delaware State Police Crash Investigation
by Troop & by County
Troop All Fatal Personal PropertyCrashes Crashes Injury Damage
Crashes Crashes
'14 '15 '14 '15 '14 '15 '14 '15
1 2373 2175 9 10 407 403 1957 17622 2960 3333 17 24 572 654 2371 26553 1501 1713 14 12 357 398 1130 13034 1143 1250 20 13 269 280 854 9575 1186 1252 8 14 275 270 903 9686 3457 3434 12 9 581 565 2864 28607 1361 1375 13 10 278 264 1070 11019 1146 1429 3 17 253 311 890 1101
Totals: 15127 15961 96 109 2992 3145 12039 12707
County All Fatal Personal PropertyCrashes Crashes Injury Damage
Crashes Crashes
'14 '15 '14 '15 '14 '15 '14 '15
New Castle 9513 9862 41 51 1712 1820 7760 7991Kent 1924 2222 14 21 458 511 1452 1690Sussex 3690 3877 41 37 822 814 2827 3026
Totals: 15127 15961 96 109 2992 3145 12039 12707
78
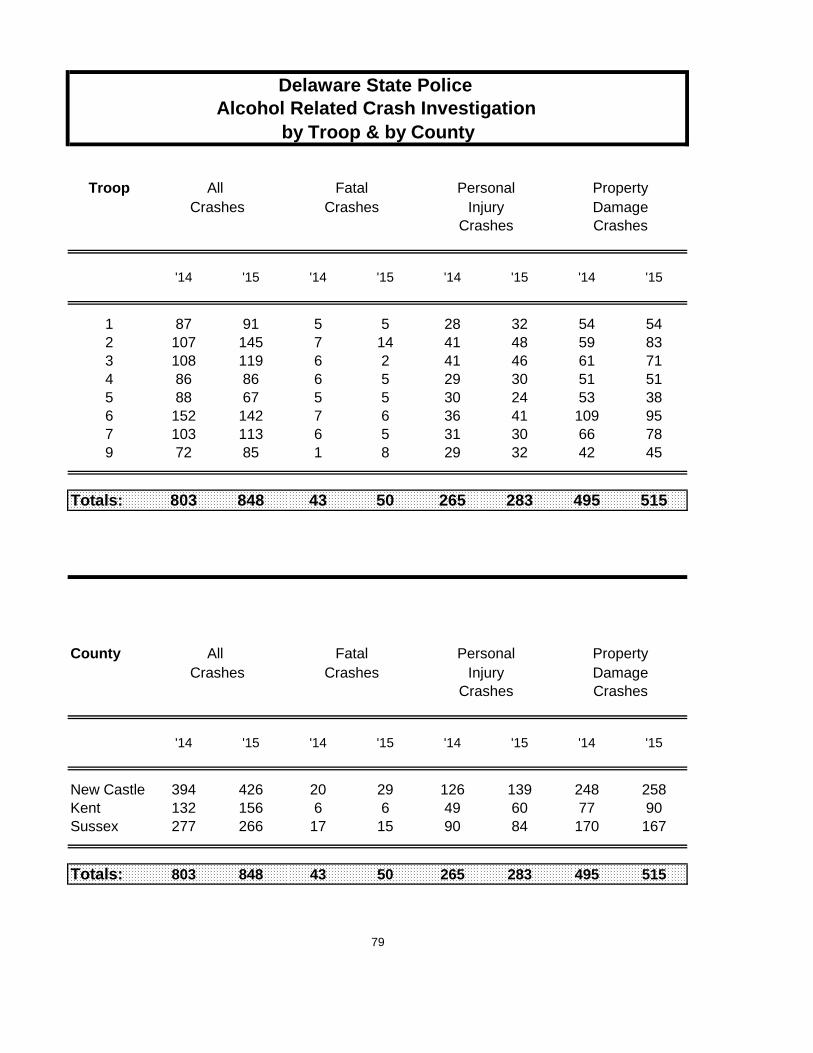
Delaware State Police Alcohol Related Crash Investigation
by Troop & by County
Troop All Fatal Personal PropertyCrashes Crashes Injury Damage
Crashes Crashes
'14 '15 '14 '15 '14 '15 '14 '15
1 87 91 5 5 28 32 54 542 107 145 7 14 41 48 59 833 108 119 6 2 41 46 61 714 86 86 6 5 29 30 51 515 88 67 5 5 30 24 53 386 152 142 7 6 36 41 109 957 103 113 6 5 31 30 66 789 72 85 1 8 29 32 42 45
Totals: 803 848 43 50 265 283 495 515
County All Fatal Personal PropertyCrashes Crashes Injury Damage
Crashes Crashes
'14 '15 '14 '15 '14 '15 '14 '15
New Castle 394 426 20 29 126 139 248 258Kent 132 156 6 6 49 60 77 90Sussex 277 266 17 15 90 84 170 167
Totals: 803 848 43 50 265 283 495 515
79
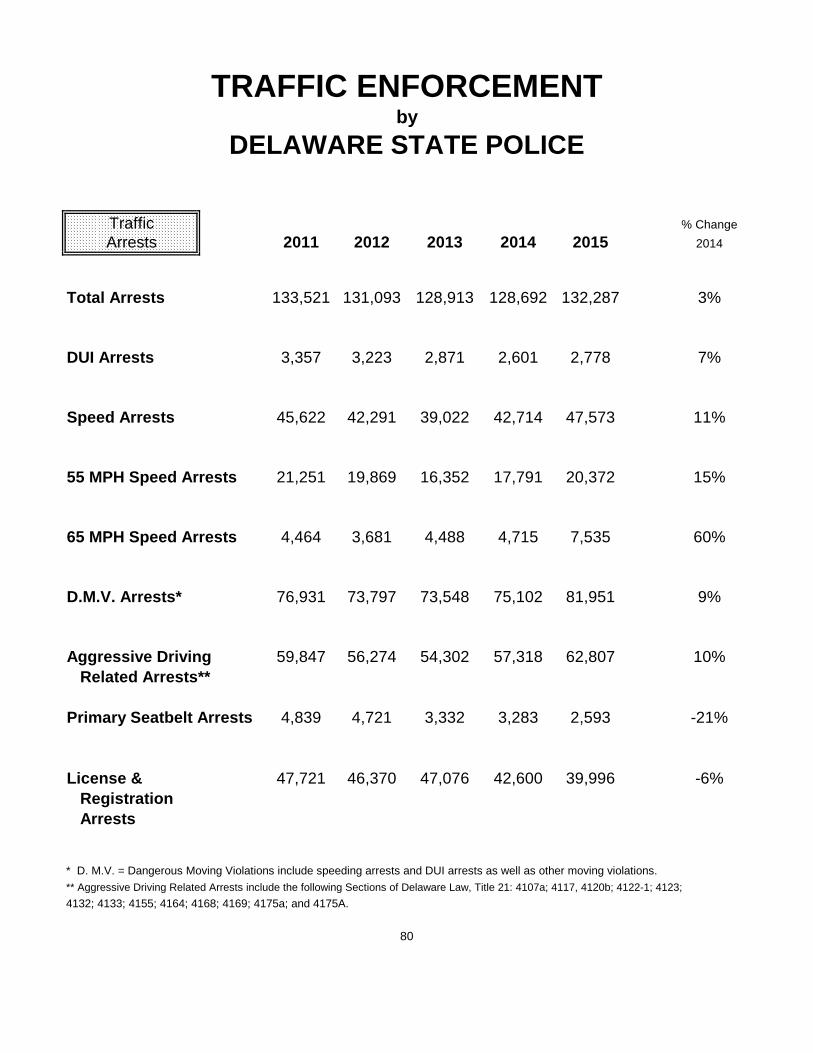
TRAFFIC ENFORCEMENTby
DELAWARE STATE POLICE
Traffic % Change
Arrests 2011 2012 2013 2014 2015 2014
Total Arrests 133,521 131,093 128,913 128,692 132,287 3%
DUI Arrests 3,357 3,223 2,871 2,601 2,778 7%
Speed Arrests 45,622 42,291 39,022 42,714 47,573 11%
55 MPH Speed Arrests 21,251 19,869 16,352 17,791 20,372 15%
65 MPH Speed Arrests 4,464 3,681 4,488 4,715 7,535 60%
D.M.V. Arrests* 76,931 73,797 73,548 75,102 81,951 9%
Aggressive Driving 59,847 56,274 54,302 57,318 62,807 10% Related Arrests**
Primary Seatbelt Arrests 4,839 4,721 3,332 3,283 2,593 -21%
License & 47,721 46,370 47,076 42,600 39,996 -6% Registration Arrests
* D. M.V. = Dangerous Moving Violations include speeding arrests and DUI arrests as well as other moving violations.
** Aggressive Driving Related Arrests include the following Sections of Delaware Law, Title 21: 4107a; 4117, 4120b; 4122-1; 4123;
4132; 4133; 4155; 4164; 4168; 4169; 4175a; and 4175A.
80
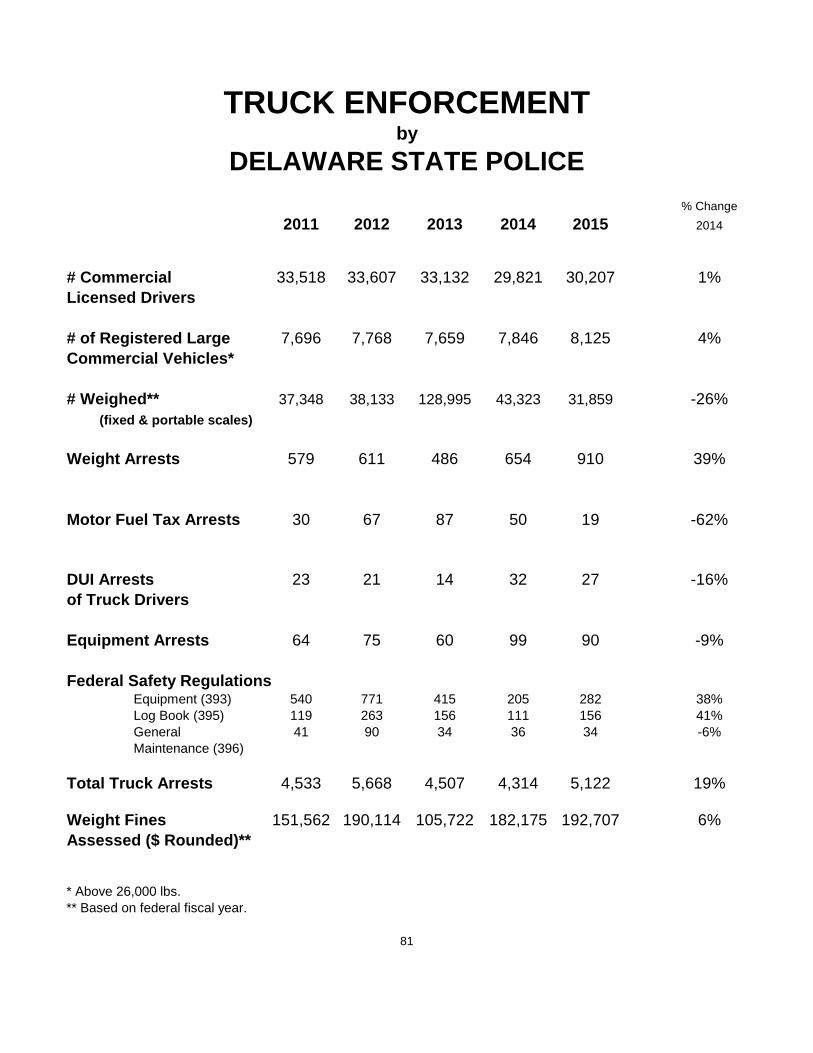
TRUCK ENFORCEMENTby
DELAWARE STATE POLICE
% Change
2011 2012 2013 2014 2015 2014
# Commercial 33,518 33,607 33,132 29,821 30,207 1%Licensed Drivers
# of Registered Large 7,696 7,768 7,659 7,846 8,125 4%Commercial Vehicles*
# Weighed** 37,348 38,133 128,995 43,323 31,859 -26%(fixed & portable scales)
Weight Arrests 579 611 486 654 910 39%
Motor Fuel Tax Arrests 30 67 87 50 19 -62%
DUI Arrests 23 21 14 32 27 -16%of Truck Drivers
Equipment Arrests 64 75 60 99 90 -9%
Federal Safety RegulationsEquipment (393) 540 771 415 205 282 38%Log Book (395) 119 263 156 111 156 41%General 41 90 34 36 34 -6%Maintenance (396)
Total Truck Arrests 4,533 5,668 4,507 4,314 5,122 19%
Weight Fines 151,562 190,114 105,722 182,175 192,707 6%Assessed ($ Rounded)**
* Above 26,000 lbs.** Based on federal fiscal year.
81
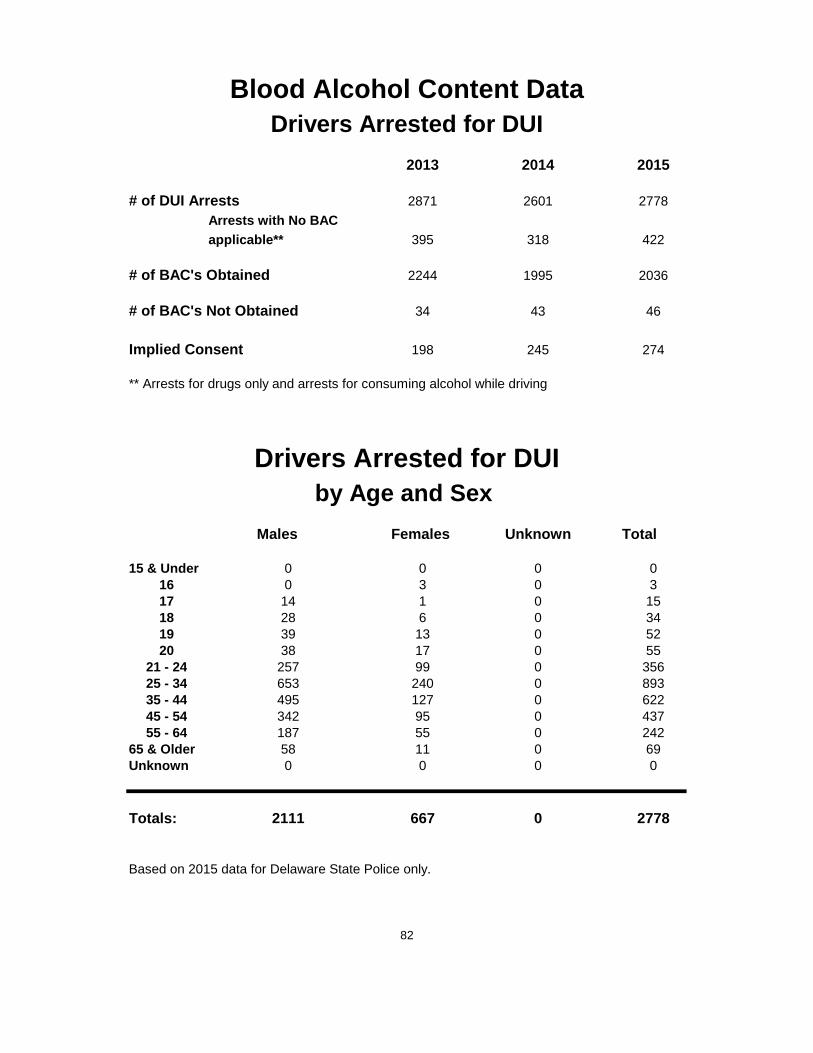
Blood Alcohol Content DataDrivers Arrested for DUI
2013 2014 2015
# of DUI Arrests 2871 2601 2778
Arrests with No BACapplicable** 395 318 422
# of BAC's Obtained 2244 1995 2036
# of BAC's Not Obtained 34 43 46
Implied Consent 198 245 274
** Arrests for drugs only and arrests for consuming alcohol while driving
Drivers Arrested for DUIby Age and Sex
Males Females Unknown Total
15 & Under 0 0 0 016 0 3 0 317 14 1 0 1518 28 6 0 3419 39 13 0 5220 38 17 0 55
21 - 24 257 99 0 35625 - 34 653 240 0 89335 - 44 495 127 0 62245 - 54 342 95 0 43755 - 64 187 55 0 242
65 & Older 58 11 0 69Unknown 0 0 0 0
Totals: 2111 667 0 2778
Based on 2015 data for Delaware State Police only.
82
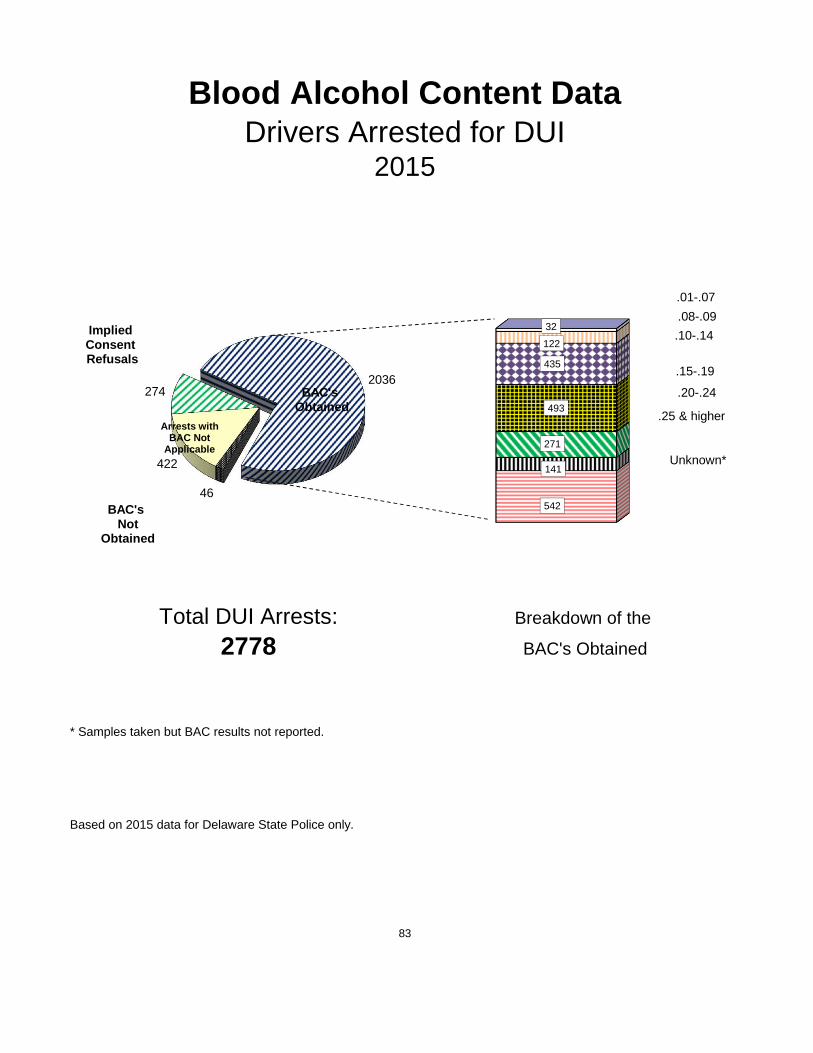
Blood Alcohol Content DataDrivers Arrested for DUI
2015
Total DUI Arrests: Breakdown of the
2778 BAC's Obtained
* Samples taken but BAC results not reported.
Based on 2015 data for Delaware State Police only.
83
542
141
271
493
435
122
32
.01-.07
.10-.14
.15-.19
.20-.24
.25 & higher
Unknown*
.08-.09
2036
46
422
274 BAC's Obtained
BAC's Not
Obtained
Implied Consent Refusals
Arrests with BAC Not
Applicable
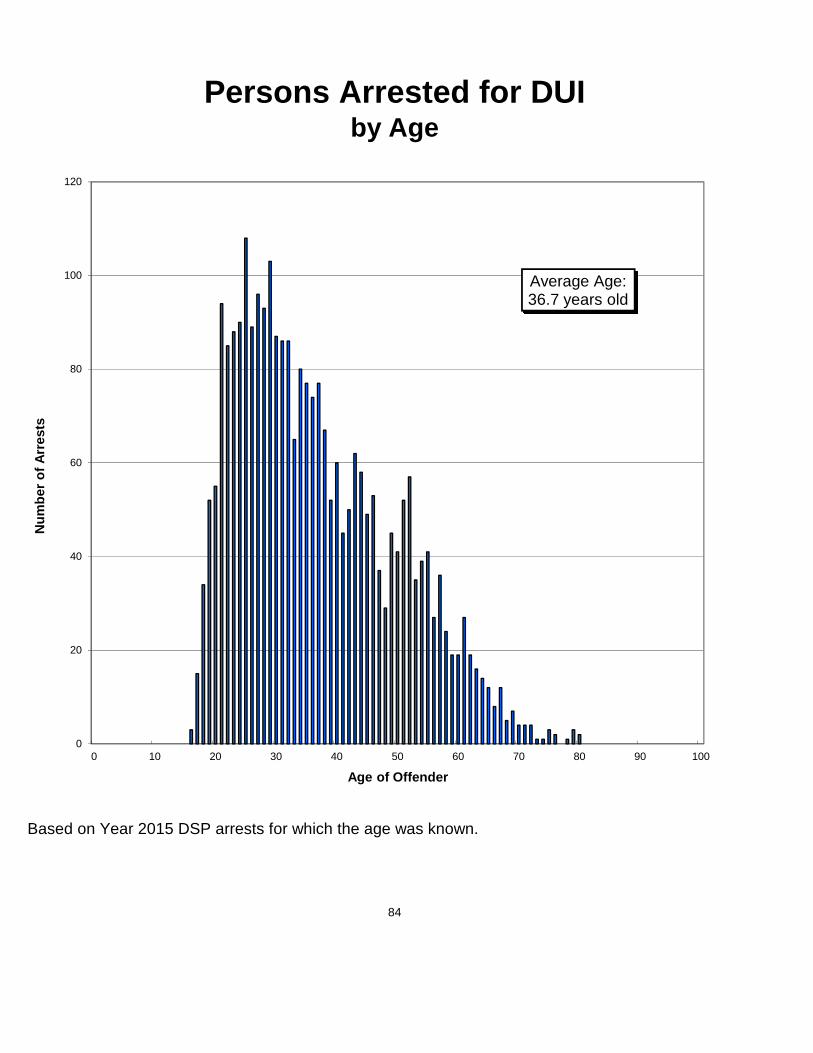
Persons Arrested for DUIby Age
Based on Year 2015 DSP arrests for which the age was known.
84
0
20
40
60
80
100
120
0 10 20 30 40 50 60 70 80 90 100
Num
ber
of A
rres
ts
Age of Offender
Average Age:36.7 years old
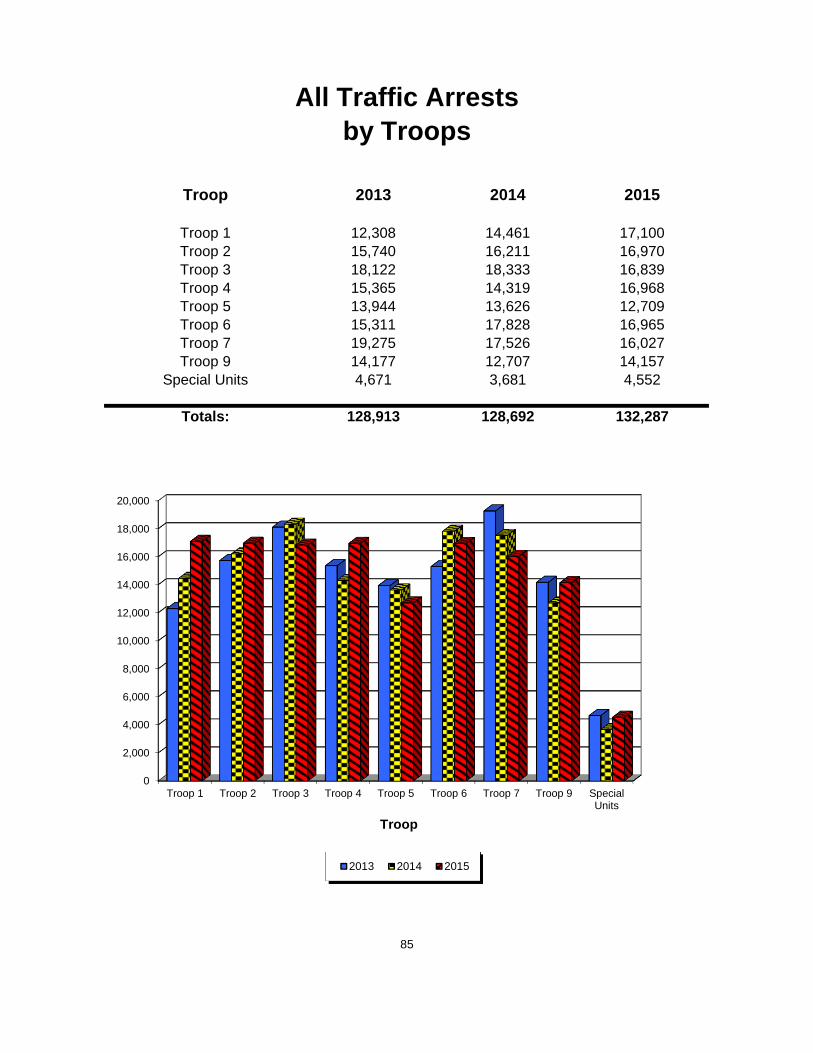
All Traffic Arrestsby Troops
Troop 2013 2014 2015
Troop 1 12,308 14,461 17,100Troop 2 15,740 16,211 16,970Troop 3 18,122 18,333 16,839Troop 4 15,365 14,319 16,968Troop 5 13,944 13,626 12,709Troop 6 15,311 17,828 16,965Troop 7 19,275 17,526 16,027Troop 9 14,177 12,707 14,157
Special Units 4,671 3,681 4,552
Totals: 128,913 128,692 132,287
85
0
2,000
4,000
6,000
8,000
10,000
12,000
14,000
16,000
18,000
20,000
Troop 1 Troop 2 Troop 3 Troop 4 Troop 5 Troop 6 Troop 7 Troop 9 SpecialUnits
Troop
2013 2014 2015
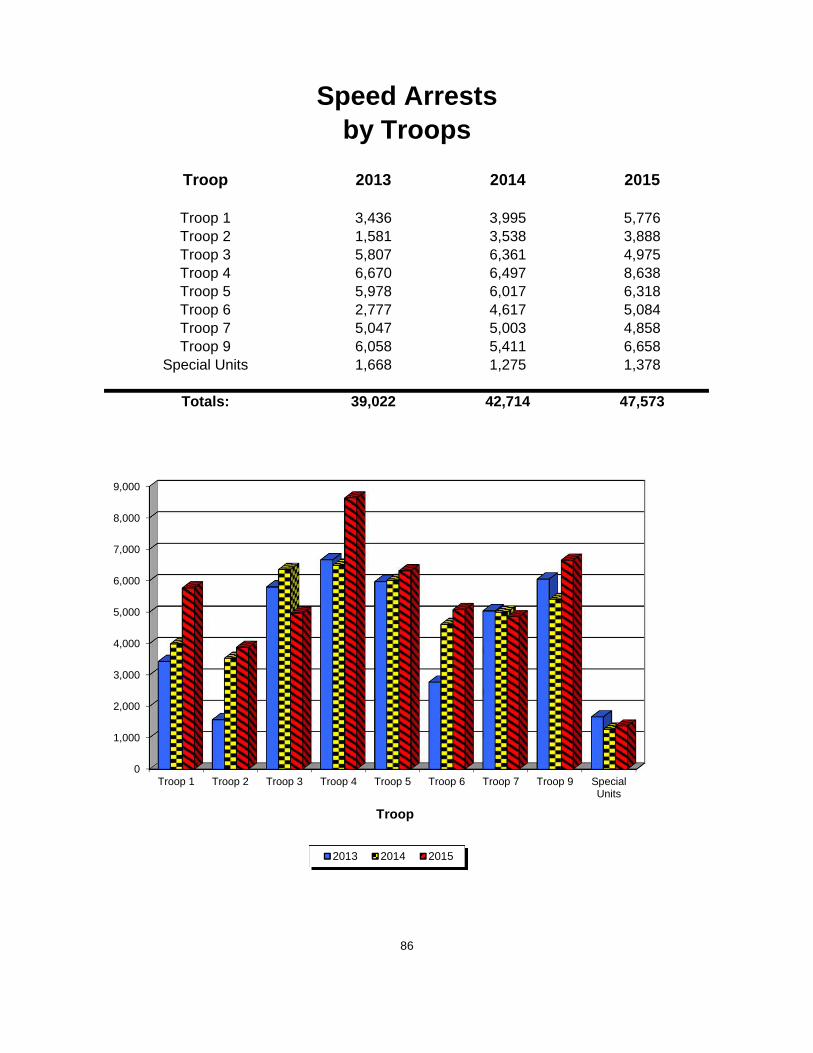
Speed Arrestsby Troops
Troop 2013 2014 2015
Troop 1 3,436 3,995 5,776Troop 2 1,581 3,538 3,888Troop 3 5,807 6,361 4,975Troop 4 6,670 6,497 8,638Troop 5 5,978 6,017 6,318Troop 6 2,777 4,617 5,084Troop 7 5,047 5,003 4,858Troop 9 6,058 5,411 6,658
Special Units 1,668 1,275 1,378
Totals: 39,022 42,714 47,573
86
0
1,000
2,000
3,000
4,000
5,000
6,000
7,000
8,000
9,000
Troop 1 Troop 2 Troop 3 Troop 4 Troop 5 Troop 6 Troop 7 Troop 9 SpecialUnits
Troop
2013 2014 2015
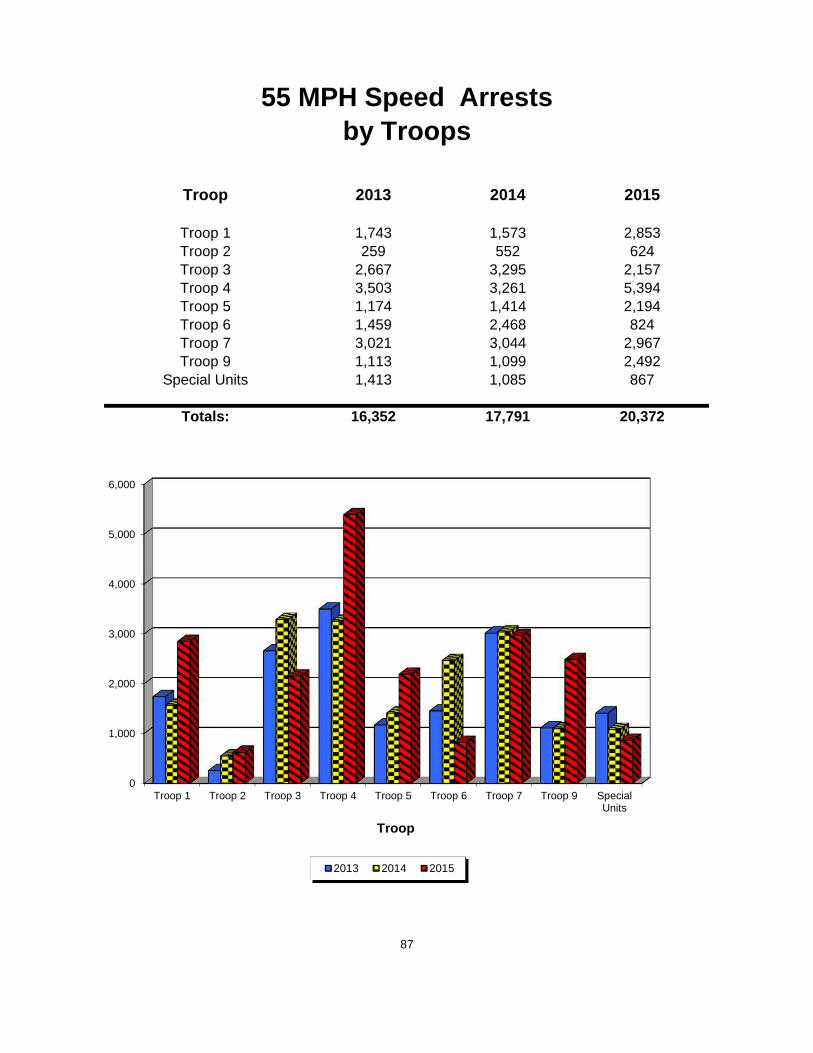
55 MPH Speed Arrestsby Troops
Troop 2013 2014 2015
Troop 1 1,743 1,573 2,853Troop 2 259 552 624Troop 3 2,667 3,295 2,157Troop 4 3,503 3,261 5,394Troop 5 1,174 1,414 2,194Troop 6 1,459 2,468 824Troop 7 3,021 3,044 2,967Troop 9 1,113 1,099 2,492
Special Units 1,413 1,085 867
Totals: 16,352 17,791 20,372
87
0
1,000
2,000
3,000
4,000
5,000
6,000
Troop 1 Troop 2 Troop 3 Troop 4 Troop 5 Troop 6 Troop 7 Troop 9 SpecialUnits
Troop
2013 2014 2015

65 MPH Speed Arrestsby Troops
Troop 2013 2014 2015
Troop 1 331 723 1,236Troop 2 674 1,009 647Troop 3 153 131 250Troop 4 0 0 0Troop 5 1 0 0Troop 6 31 22 2,228Troop 7 1 0 0Troop 9 3,248 2,792 2,803
Special Units 49 38 371
Totals: 4,488 4,715 7,535
88
0
500
1,000
1,500
2,000
2,500
3,000
3,500
Troop 1 Troop 2 Troop 3 Troop 4 Troop 5 Troop 6 Troop 7 Troop 9 SpecialUnits
Troop
2013 2014 2015

DUI Arrestsby Troops
Troop 2013 2014 2015
Troop 1 282 260 299Troop 2 386 319 403Troop 3 492 409 477Troop 4 291 271 321Troop 5 310 243 231Troop 6 372 416 419Troop 7 526 486 436Troop 9 206 193 189
Special Units 6 4 3
Totals: 2,871 2,601 2,778
89
0
100
200
300
400
500
600
Troop 1 Troop 2 Troop 3 Troop 4 Troop 5 Troop 6 Troop 7 Troop 9 SpecialUnits
Troop
2013 2014 2015
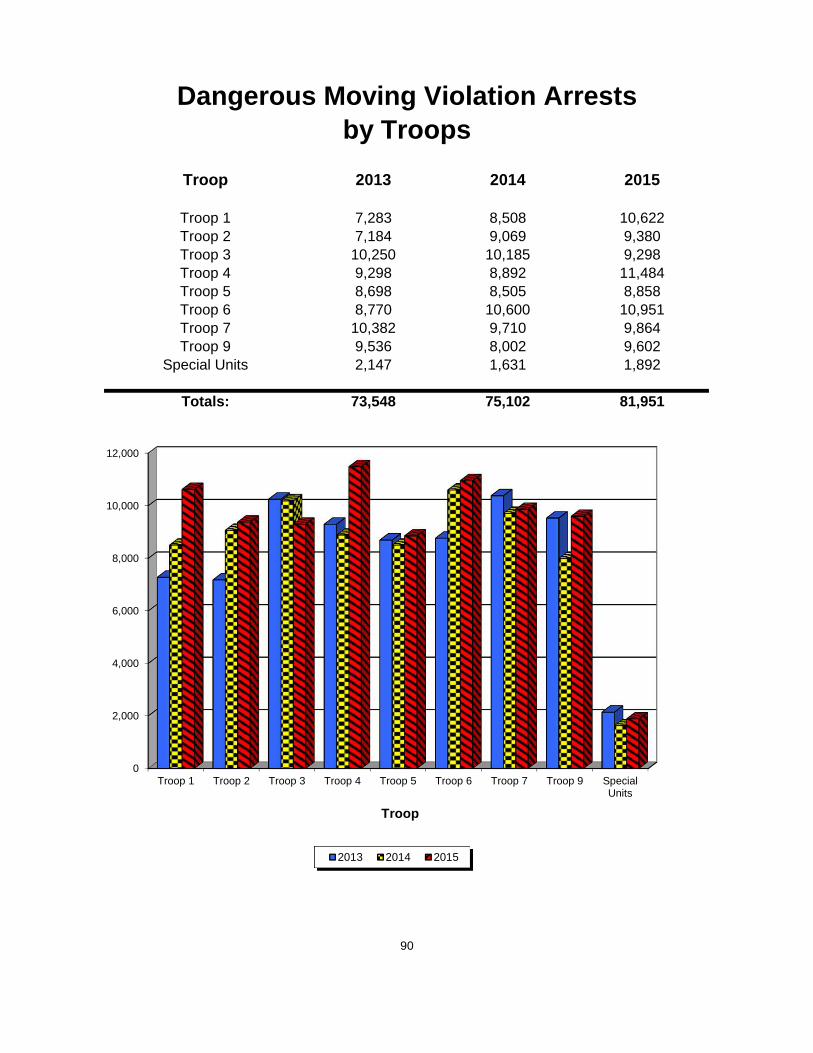
Dangerous Moving Violation Arrestsby Troops
Troop 2013 2014 2015
Troop 1 7,283 8,508 10,622Troop 2 7,184 9,069 9,380Troop 3 10,250 10,185 9,298Troop 4 9,298 8,892 11,484Troop 5 8,698 8,505 8,858Troop 6 8,770 10,600 10,951Troop 7 10,382 9,710 9,864Troop 9 9,536 8,002 9,602
Special Units 2,147 1,631 1,892
Totals: 73,548 75,102 81,951
90
0
2,000
4,000
6,000
8,000
10,000
12,000
Troop 1 Troop 2 Troop 3 Troop 4 Troop 5 Troop 6 Troop 7 Troop 9 SpecialUnits
Troop
2013 2014 2015
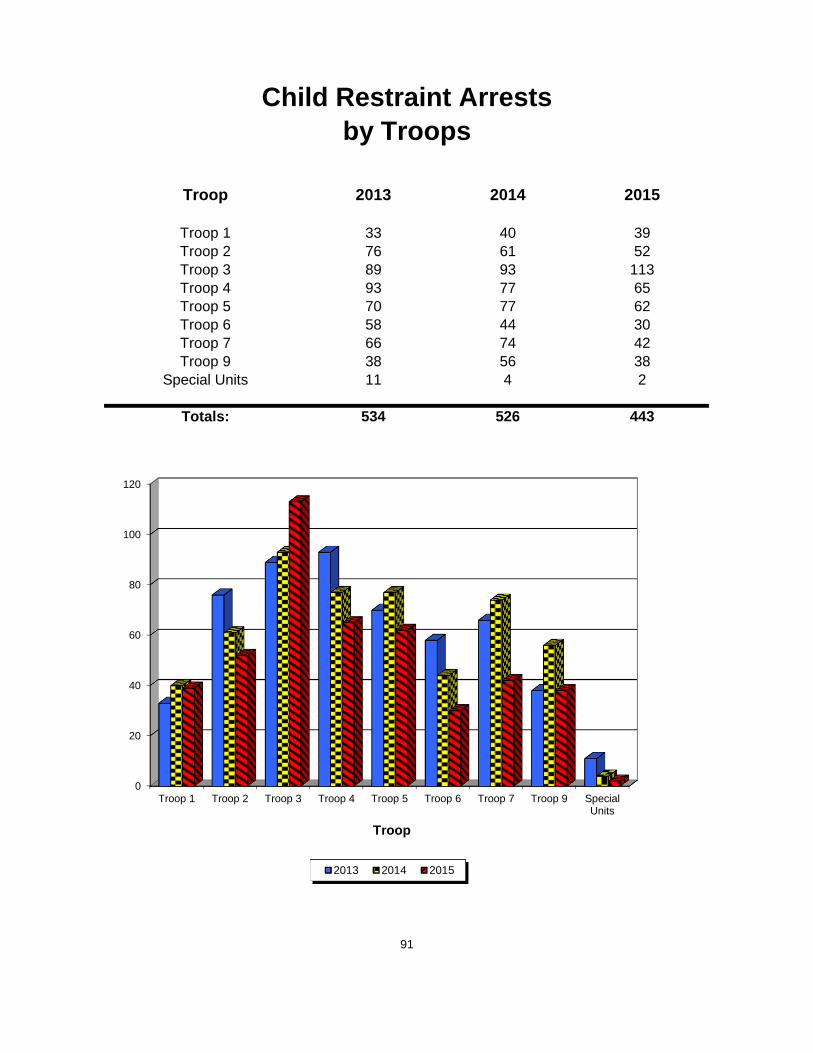
Child Restraint Arrestsby Troops
Troop 2013 2014 2015
Troop 1 33 40 39Troop 2 76 61 52Troop 3 89 93 113Troop 4 93 77 65Troop 5 70 77 62Troop 6 58 44 30Troop 7 66 74 42Troop 9 38 56 38
Special Units 11 4 2
Totals: 534 526 443
91
0
20
40
60
80
100
120
Troop 1 Troop 2 Troop 3 Troop 4 Troop 5 Troop 6 Troop 7 Troop 9 SpecialUnits
Troop
2013 2014 2015
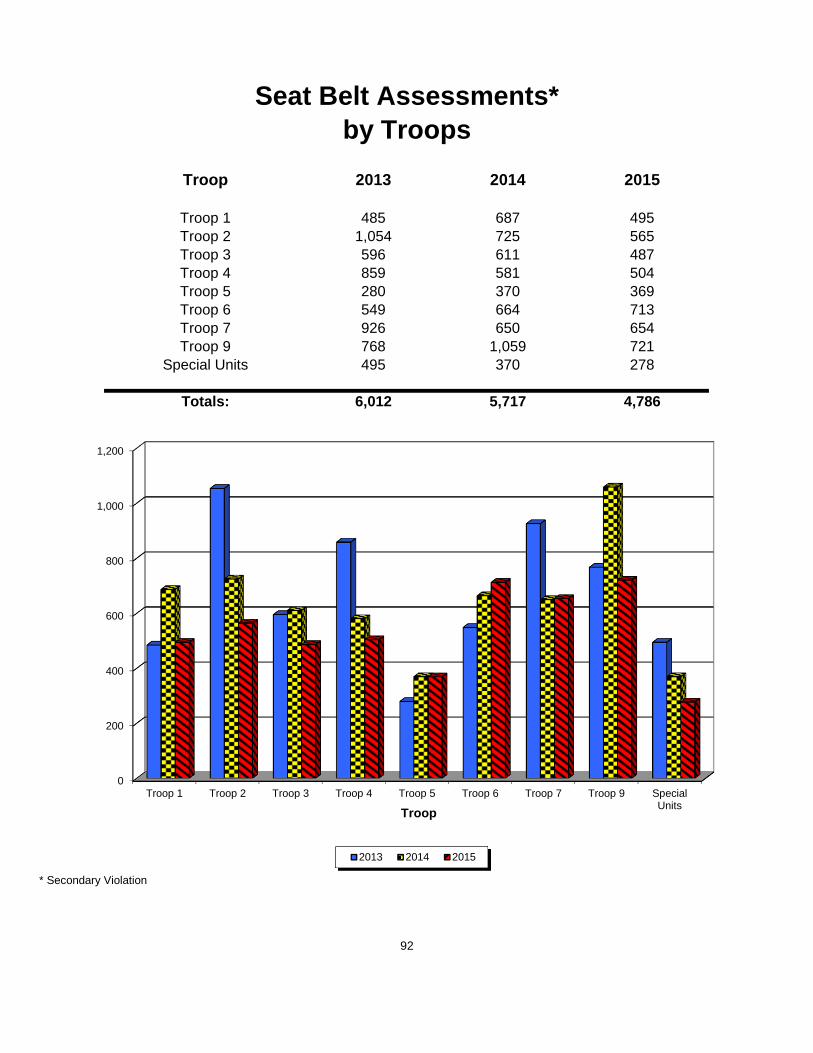
Seat Belt Assessments*by Troops
Troop 2013 2014 2015
Troop 1 485 687 495Troop 2 1,054 725 565Troop 3 596 611 487Troop 4 859 581 504Troop 5 280 370 369Troop 6 549 664 713Troop 7 926 650 654Troop 9 768 1,059 721
Special Units 495 370 278
Totals: 6,012 5,717 4,786
* Secondary Violation
92
0
200
400
600
800
1,000
1,200
Troop 1 Troop 2 Troop 3 Troop 4 Troop 5 Troop 6 Troop 7 Troop 9 SpecialUnits
Troop
2013 2014 2015
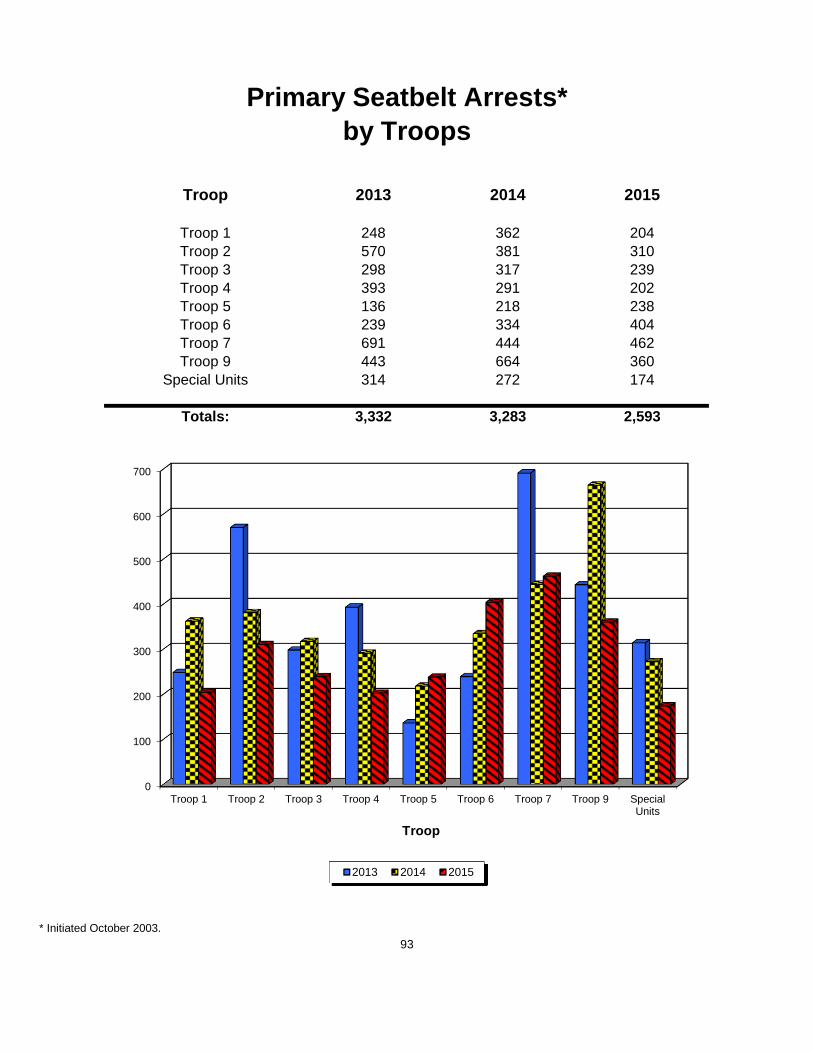
Primary Seatbelt Arrests*by Troops
Troop 2013 2014 2015
Troop 1 248 362 204Troop 2 570 381 310Troop 3 298 317 239Troop 4 393 291 202Troop 5 136 218 238Troop 6 239 334 404Troop 7 691 444 462Troop 9 443 664 360
Special Units 314 272 174
Totals: 3,332 3,283 2,593
* Initiated October 2003.
93
0
100
200
300
400
500
600
700
Troop 1 Troop 2 Troop 3 Troop 4 Troop 5 Troop 6 Troop 7 Troop 9 SpecialUnits
Troop
2013 2014 2015
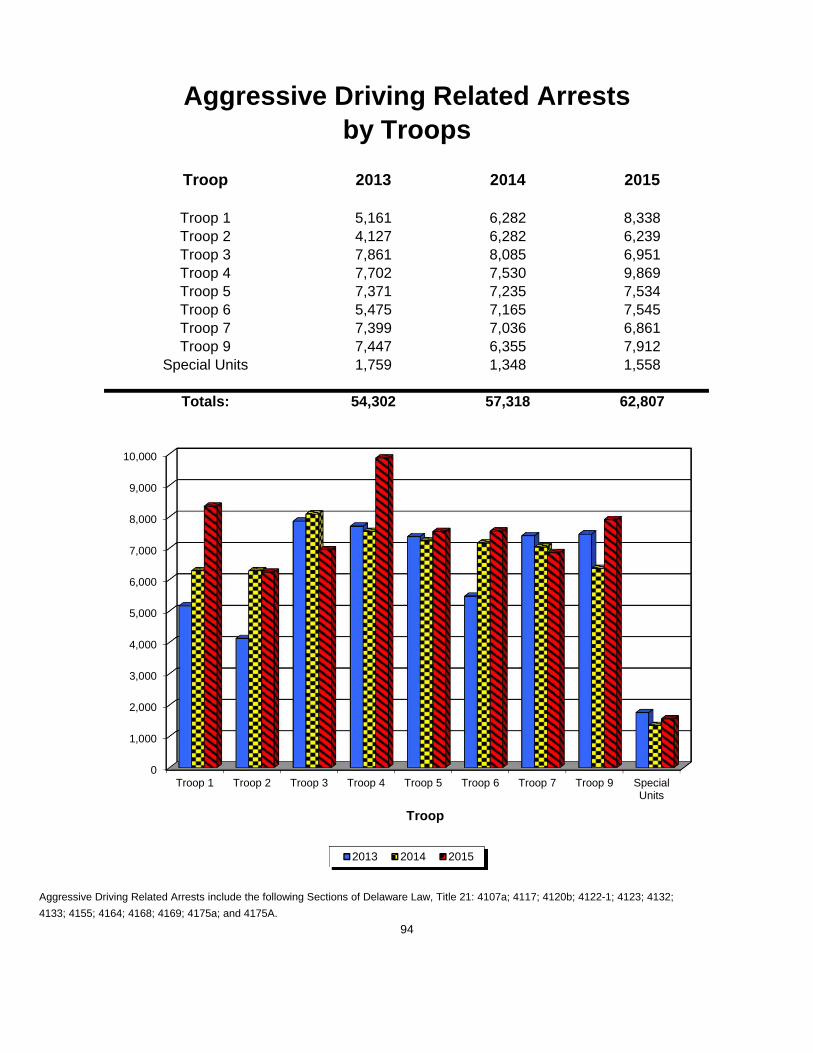
Aggressive Driving Related Arrestsby Troops
Troop 2013 2014 2015
Troop 1 5,161 6,282 8,338Troop 2 4,127 6,282 6,239Troop 3 7,861 8,085 6,951Troop 4 7,702 7,530 9,869Troop 5 7,371 7,235 7,534Troop 6 5,475 7,165 7,545Troop 7 7,399 7,036 6,861Troop 9 7,447 6,355 7,912
Special Units 1,759 1,348 1,558
Totals: 54,302 57,318 62,807
Aggressive Driving Related Arrests include the following Sections of Delaware Law, Title 21: 4107a; 4117; 4120b; 4122-1; 4123; 4132;
4133; 4155; 4164; 4168; 4169; 4175a; and 4175A.
94
0
1,000
2,000
3,000
4,000
5,000
6,000
7,000
8,000
9,000
10,000
Troop 1 Troop 2 Troop 3 Troop 4 Troop 5 Troop 6 Troop 7 Troop 9 SpecialUnits
Troop
2013 2014 2015
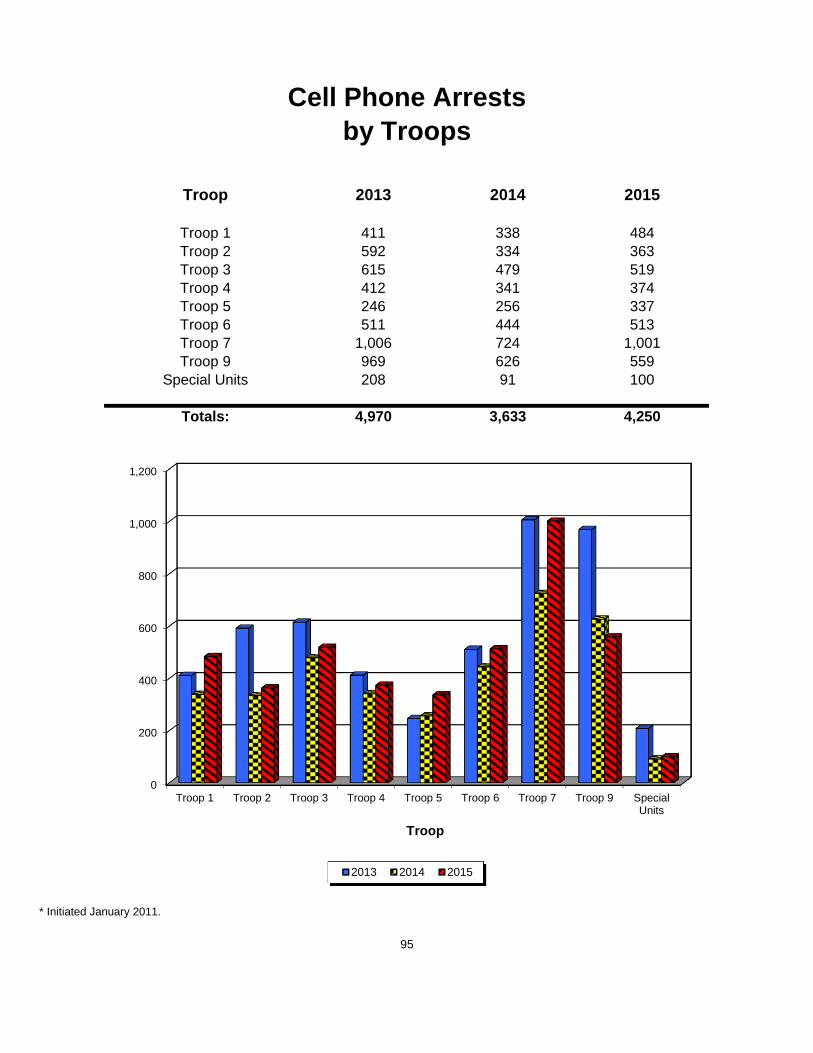
Cell Phone Arrestsby Troops
Troop 2013 2014 2015
Troop 1 411 338 484Troop 2 592 334 363Troop 3 615 479 519Troop 4 412 341 374Troop 5 246 256 337Troop 6 511 444 513Troop 7 1,006 724 1,001Troop 9 969 626 559
Special Units 208 91 100
Totals: 4,970 3,633 4,250
* Initiated January 2011.
95
0
200
400
600
800
1,000
1,200
Troop 1 Troop 2 Troop 3 Troop 4 Troop 5 Troop 6 Troop 7 Troop 9 SpecialUnits
Troop
2013 2014 2015
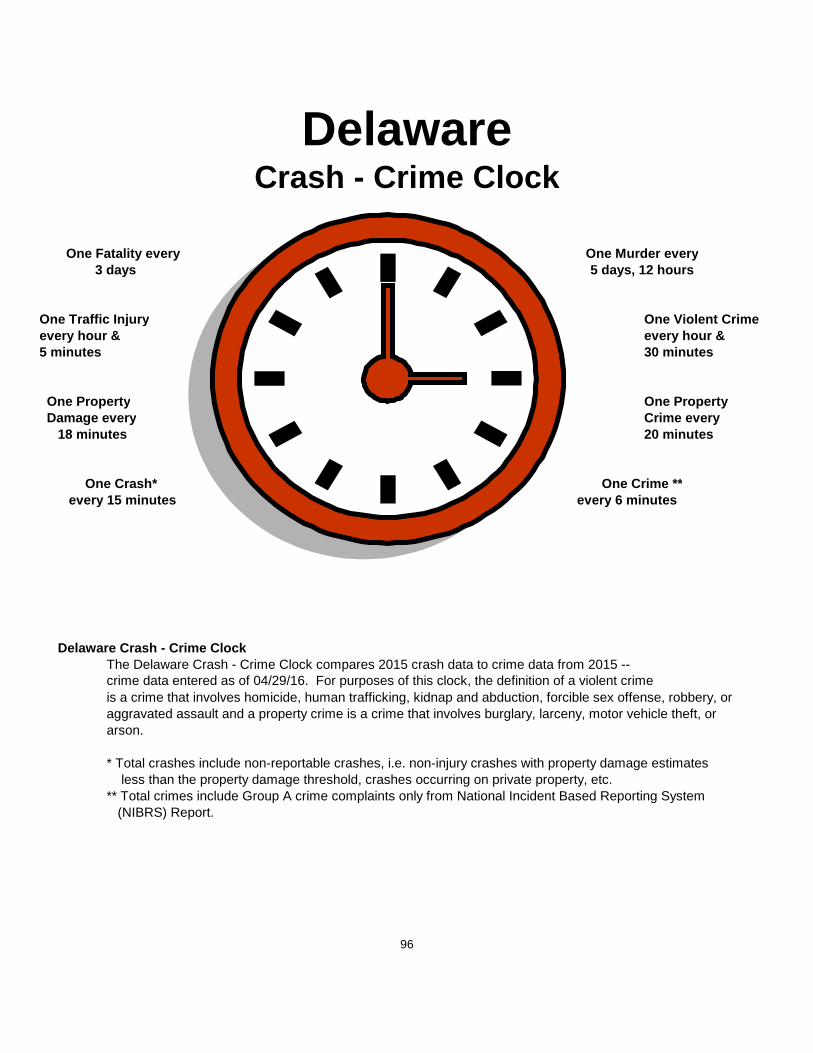
DelawareCrash - Crime Clock
One Fatality every One Murder every 3 days 5 days, 12 hours
One Traffic Injury One Violent Crimeevery hour & every hour &5 minutes 30 minutes
One Property One Property Damage every Crime every 18 minutes 20 minutes
One Crash* One Crime ** every 15 minutes every 6 minutes
Delaware Crash - Crime ClockThe Delaware Crash - Crime Clock compares 2015 crash data to crime data from 2015 --crime data entered as of 04/29/16. For purposes of this clock, the definition of a violent crimeis a crime that involves homicide, human trafficking, kidnap and abduction, forcible sex offense, robbery, oraggravated assault and a property crime is a crime that involves burglary, larceny, motor vehicle theft, orarson.
* Total crashes include non-reportable crashes, i.e. non-injury crashes with property damage estimates less than the property damage threshold, crashes occurring on private property, etc.** Total crimes include Group A crime complaints only from National Incident Based Reporting System (NIBRS) Report.
96