Embed Size (px)
Citation preview
Delaware Highway Safety Improvement Program
2014 Annual Report
Prepared by: DE
ii
Disclaimer
Protection of Data from Discovery & Admission into Evidence
23 U.S.C. 148(h)(4) states “Notwithstanding any other provision of law, reports, surveys, schedules, lists, or data compiled or collected for any purpose relating to this section [HSIP], shall not be subject to discovery or admitted into evidence in a Federal or State court proceeding or considered for other purposes in any action for damages arising from any occurrence at a location identified or addressed in the reports, surveys, schedules, lists, or other data.”
23 U.S.C. 409 states “Notwithstanding any other provision of law, reports, surveys, schedules, lists, or data compiled or collected for the purpose of identifying, evaluating, or planning the safety enhancement of potential accident sites, hazardous roadway conditions, or railway-highway crossings, pursuant to sections 130, 144, and 148 of this title or for the purpose of developing any highway safety construction improvement project which may be implemented utilizing Federal-aid highway funds shall not be subject to discovery or admitted into evidence in a Federal or State court proceeding or considered for other purposes in any action for damages arising from any occurrence at a location mentioned or addressed in such reports, surveys, schedules, lists, or data.”
iii
Table of Contents
Disclaimer...................................................................................................................................................... ii
Executive Summary ....................................................................................................................................... 1
Introduction .................................................................................................................................................. 2
Program Structure ........................................................................................................................................ 2
Program Administration ........................................................................................................................... 2
Program Methodology .............................................................................................................................. 5
Progress in Implementing Projects ............................................................................................................. 14
Funds Programmed ............................................................................................................................. 14
General Listing of Projects .................................................................................................................. 17
Progress in Achieving Safety Performance Targets .................................................................................... 18
Overview of General Safety Trends ........................................................................................................ 18
Application of Special Rules .................................................................................................................... 33
Assessment of the Effectiveness of the Improvements (Program Evaluation) .......................................... 37
SHSP Emphasis Areas .............................................................................................................................. 38
Groups of similar project types ............................................................................................................... 43
Systemic Treatments ............................................................................................................................... 48
Glossary ....................................................................................................................................................... 56
2014 Delaware Highway Safety Improvement Program
1
Executive Summary
The Delaware Department of Transportation (DelDOT) has prepared this Annual Report for state fiscal year 2014 (July 1, 2013 – June 30, 2014) to demonstrate the success of their safety program. Crash statistics reported in this Annual Report are for calendar year 2013 (January 1, 2013 – December 31, 2013). During the 2014 reporting period, DelDOT continued its successful core HSIP programs – Hazard Elimination Program (HEP), Highway Rail-Grade Crossing Program (HRGX), and Strategic Highway Safety Plan (SHSP) and began pursuing the development and implementation of systemic-based programs.
On an annual basis, HEP sites are selected using the Critical Rate methodology to identify high crash locations for all HSIP components. The Critical Ratio method (also known as the Rate Quality Control Method) uses a statistical test to determine whether the crash rate at a particular location is significantly higher than a predetermined average crash rate for locations of similar characteristics. A total of 15 corridors were studied under HEP and 12 highway-grade crossings were studied under HRGX. Both programs continued to identify both low-cost remedial improvements and long-term safety improvement needs. Pedestrian safety audits were initiated to evaluate pedestrian safety along two corridors with identified pedestrian crash trends. The success of these programs is demonstrated by the number of fatalities and serious injuries (based on 5-year rolling averages) gradually decreasing from 2009 to 2013. In addition, DelDOT continued working towards the development of a new crash analysis reporting system, and continued to identify future program-level needs and changes related to the MAP-21 legislation.
2014 Delaware Highway Safety Improvement Program
2
Introduction
The Highway Safety Improvement Program (HSIP) is a core Federal-aid program with the purpose of achieving a significant reduction in fatalities and serious injuries on all public roads. As per 23 U.S.C. 148(h) and 23 CFR 924.15, States are required to report annually on the progress being made to advance HSIP implementation and evaluation efforts. The format of this report is consistent with the HSIP MAP-21 Reporting Guidance dated February 13, 2013 and consists of four sections: program structure, progress in implementing HSIP projects, progress in achieving safety performance targets, and assessment of the effectiveness of the improvements.
Program Structure
Program Administration How are Highway Safety Improvement Program funds allocated in a State?
Central
District
Other
Describe how local roads are addressed as part of Highway Safety Improvement Program.
All roadways throughout the state are eligible for safety funding; however, the calculations used to identify high crash locations for the Hazard Elimination Program (HEP) include state roadways in DelDOT's road inventory where traffic volumes are available. Traffic volume data is required in order to calculate crash rates required for the critical ratio calculations and is not available on subdivision streets and municipal roadways. Based on a review of statewide crash data on all public roadways from 2009 to 2011, only 4 percent of fatal and incapacitating injury crashes occur on subdivision streets and municipal roadways, indicating that crashes reported on these roadways would not likely meet the minimum crash criteria for the various HSIP elements.
2014 Delaware Highway Safety Improvement Program
3
Identify which internal partners are involved with Highway Safety Improvement Program planning.
Design
Planning
Maintenance
Operations
Governors Highway Safety Office
Other:
Briefly describe coordination with internal partners.
Strategic Highway SafetyPlan (SHSP) - Delaware’s SHSP is a statewide-coordinated safety plan that provides a comprehensive framework, identifies specific goals and objectives, and integrates the four E's - engineering, education, enforcement and emergency medical services (EMS). Delaware’s SHSP coordinating agencies include DelDOT, Federal Highway Administration (FHWA), National Highway Traffic Safety Administration (NHTSA), Office of Highway Safety (OHS), Delaware State Police (DSP), Department of Justice, and Delaware Office of Emergency Medical Services (OEMS). Together, the SHSP coordinating agencies compared statewide fatality crash rates to national crash rates to identify areas with a higher than average occurrence in Delaware and drafted the SHSP. Additionally, working groups, including representatives from relevant partners and stakeholders, meet to discuss implementation plans for specific emphasis areas. Hazard Elimination Program (HEP) - Fifteen spot locations throughout the state are chosen for safety studies as part of the HEP. For each site selected, DelDOT’s Traffic Section reviews crash data, performs a field review, and identifies potential safety improvement alternatives. For candidate locations where improvements are in project development, design, or construction, a safety audit is performed to confirm that the proposed improvements will address the identified crash problem. The HEP committee, which includes representatives from DelDOT (Traffic, Planning, Project Development, and the Maintenance Districts), DSP, FHWA, MPOs, and the counties and municipalities, meets to reach a consensus on the recommended safety improvements. Traffic control device improvements (i.e., signing, striping, lighting, and traffic signal upgrades) are then designed by DelDOT’s Traffic Section and implemented by DelDOT’s maintenance forces and/or on-call contractors. Projects requiring detailed
2014 Delaware Highway Safety Improvement Program
4
design, public involvement, or resulting in right-of-way or environmental impacts are forwarded to DelDOT’s Project Development section for prioritization and inclusion in the Capital Transportation Program (CTP).
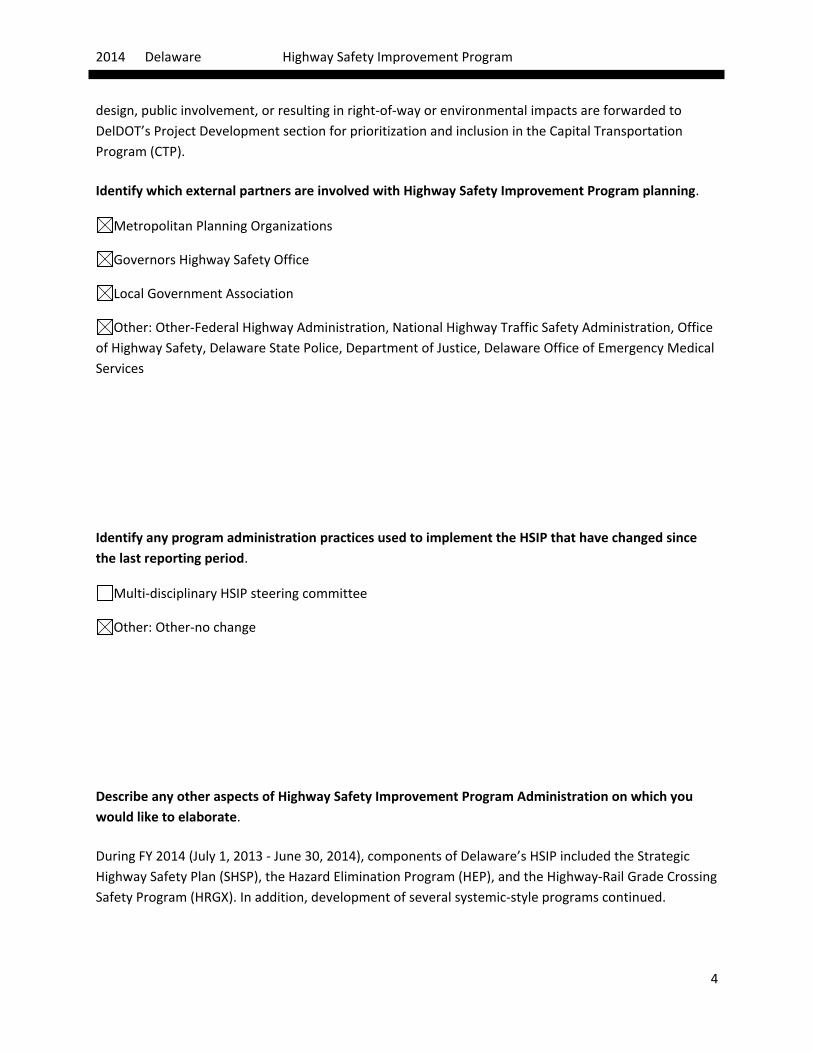
Identify which external partners are involved with Highway Safety Improvement Program planning.
Metropolitan Planning Organizations
Governors Highway Safety Office
Local Government Association
Other: Other-Federal Highway Administration, National Highway Traffic Safety Administration, Office of Highway Safety, Delaware State Police, Department of Justice, Delaware Office of Emergency Medical Services
Identify any program administration practices used to implement the HSIP that have changed since the last reporting period.
Multi-disciplinary HSIP steering committee
Other: Other-no change
Describe any other aspects of Highway Safety Improvement Program Administration on which you would like to elaborate.
During FY 2014 (July 1, 2013 - June 30, 2014), components of Delaware’s HSIP included the Strategic Highway Safety Plan (SHSP), the Hazard Elimination Program (HEP), and the Highway-Rail Grade Crossing Safety Program (HRGX). In addition, development of several systemic-style programs continued.
2014 Delaware Highway Safety Improvement Program
5
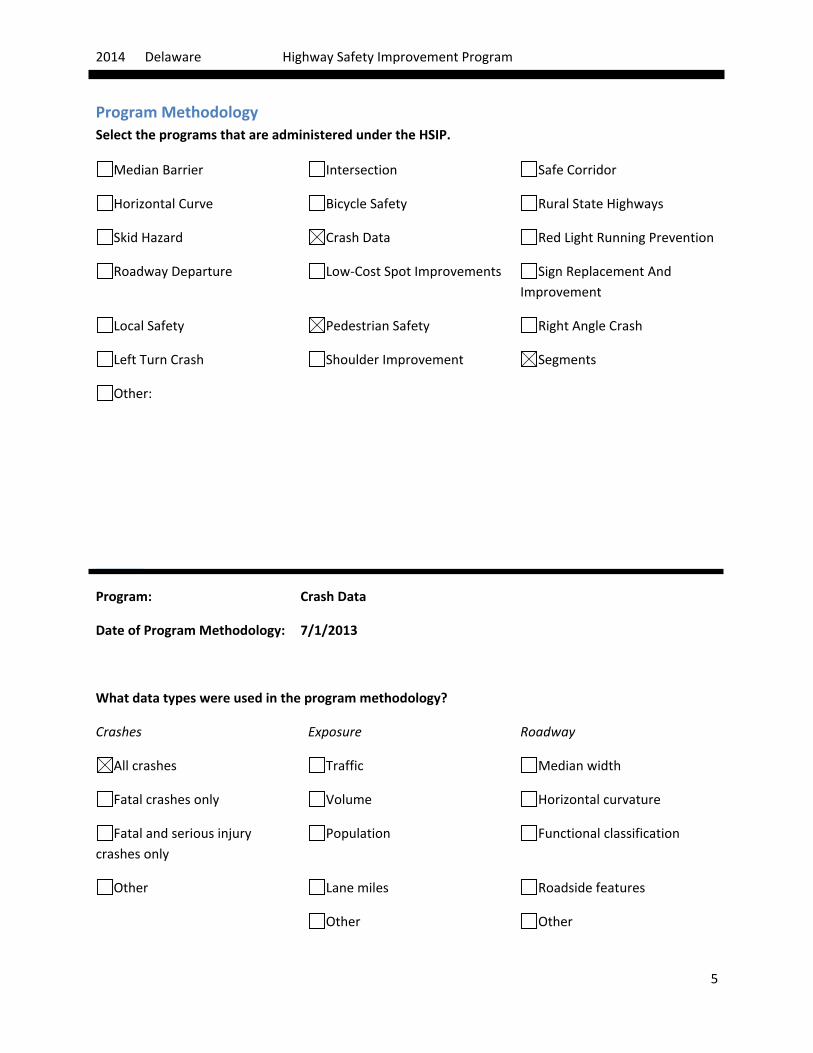
Program Methodology Select the programs that are administered under the HSIP.
Median Barrier Intersection Safe Corridor
Horizontal Curve Bicycle Safety Rural State Highways
Skid Hazard Crash Data Red Light Running Prevention
Roadway Departure Low-Cost Spot Improvements Sign Replacement And Improvement
Local Safety Pedestrian Safety Right Angle Crash
Left Turn Crash Shoulder Improvement Segments
Other:
Program: Crash Data
Date of Program Methodology: 7/1/2013
What data types were used in the program methodology?
Crashes Exposure Roadway
All crashes Traffic Median width
Fatal crashes only Volume Horizontal curvature
Fatal and serious injury crashes only
Population Functional classification
Other Lane miles Roadside features
Other Other
2014 Delaware Highway Safety Improvement Program
6
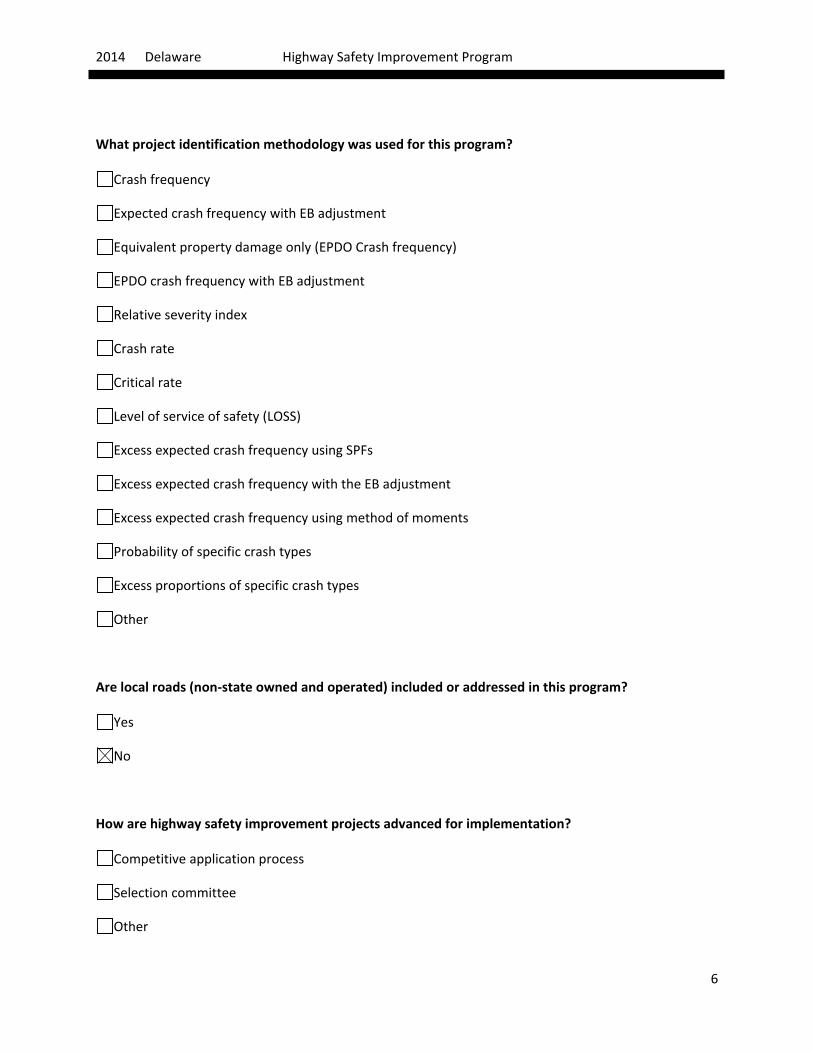
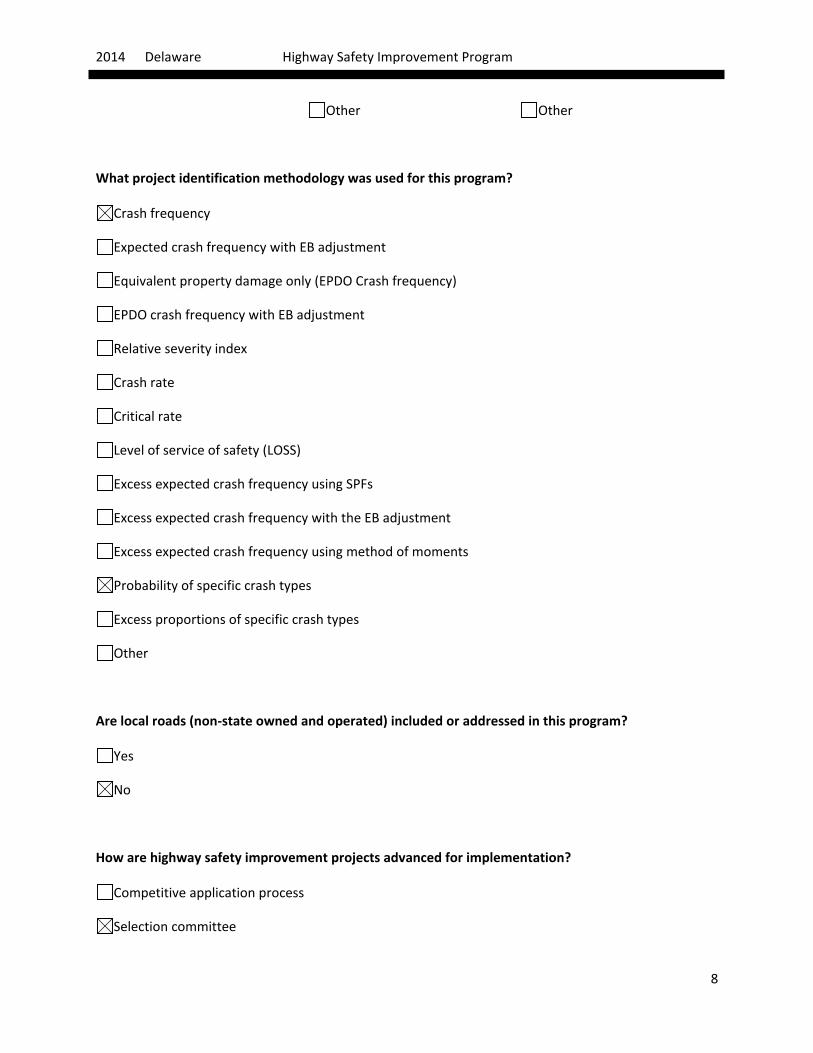
What project identification methodology was used for this program?
Crash frequency
Expected crash frequency with EB adjustment
Equivalent property damage only (EPDO Crash frequency)
EPDO crash frequency with EB adjustment
Relative severity index
Crash rate
Critical rate
Level of service of safety (LOSS)
Excess expected crash frequency using SPFs
Excess expected crash frequency with the EB adjustment
Excess expected crash frequency using method of moments
Probability of specific crash types
Excess proportions of specific crash types
Other
Are local roads (non-state owned and operated) included or addressed in this program?
Yes
No
How are highway safety improvement projects advanced for implementation?
Competitive application process
Selection committee
Other
2014 Delaware Highway Safety Improvement Program
7
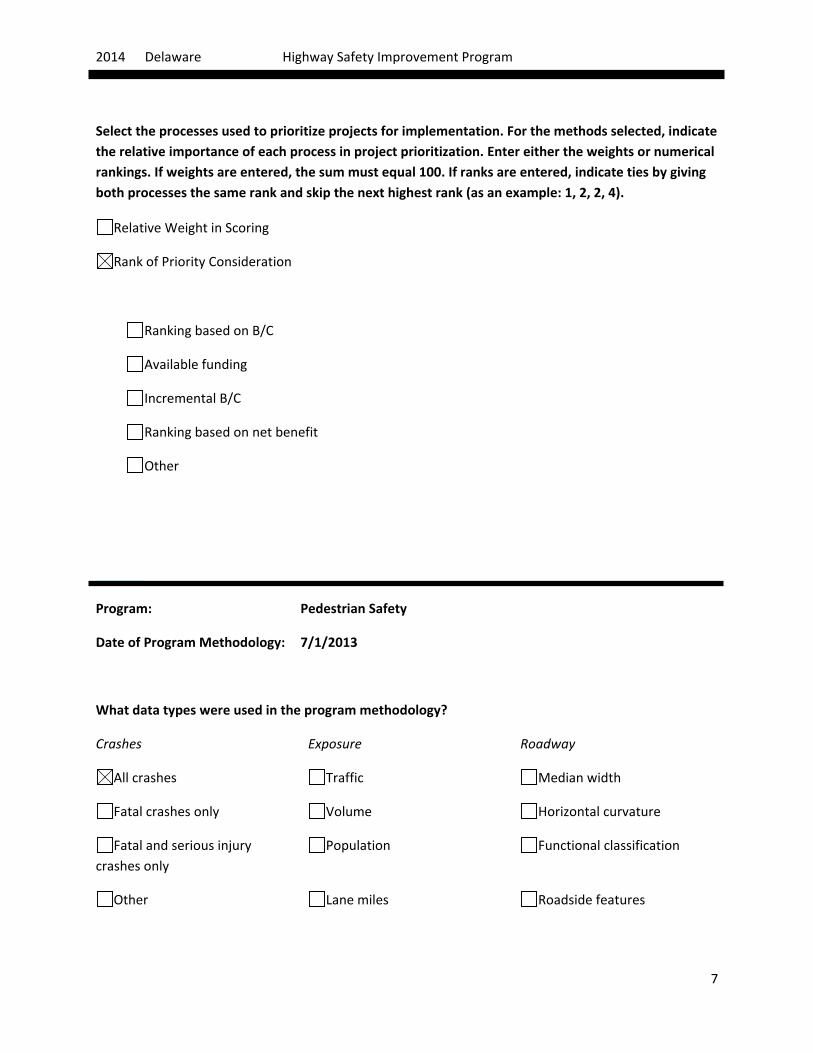
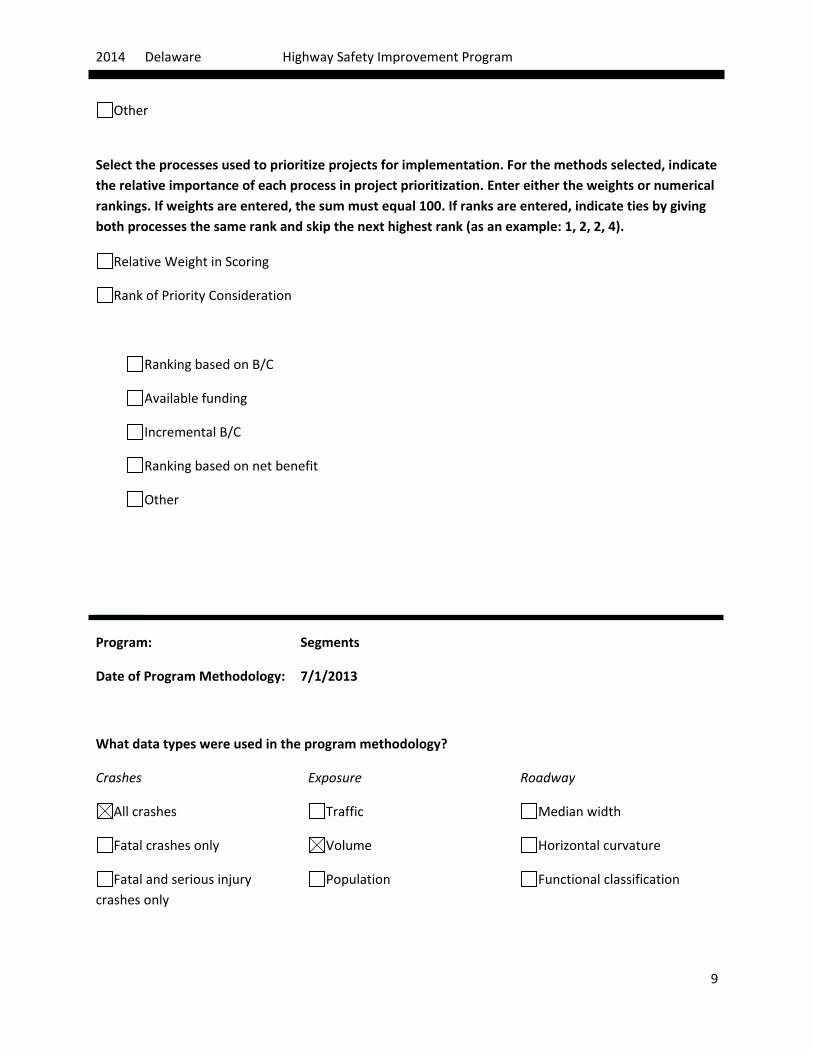
Select the processes used to prioritize projects for implementation. For the methods selected, indicate the relative importance of each process in project prioritization. Enter either the weights or numerical rankings. If weights are entered, the sum must equal 100. If ranks are entered, indicate ties by giving both processes the same rank and skip the next highest rank (as an example: 1, 2, 2, 4).
Relative Weight in Scoring
Rank of Priority Consideration
Ranking based on B/C
Available funding
Incremental B/C
Ranking based on net benefit
Other
Program: Pedestrian Safety
Date of Program Methodology: 7/1/2013
What data types were used in the program methodology?
Crashes Exposure Roadway
All crashes Traffic Median width
Fatal crashes only Volume Horizontal curvature
Fatal and serious injury Population Functional classification crashes only
Other Lane miles Roadside features
2014 Delaware Highway Safety Improvement Program
8
Other Other
What project identification methodology was used for this program?
Crash frequency
Expected crash frequency with EB adjustment
Equivalent property damage only (EPDO Crash frequency)
EPDO crash frequency with EB adjustment
Relative severity index
Crash rate
Critical rate
Level of service of safety (LOSS)
Excess expected crash frequency using SPFs
Excess expected crash frequency with the EB adjustment
Excess expected crash frequency using method of moments
Probability of specific crash types
Excess proportions of specific crash types
Other
Are local roads (non-state owned and operated) included or addressed in this program?
Yes
No
How are highway safety improvement projects advanced for implementation?
Competitive application process
Selection committee
2014 Delaware Highway Safety Improvement Program
9
Other
Select the processes used to prioritize projects for implementation. For the methods selected, indicate the relative importance of each process in project prioritization. Enter either the weights or numerical rankings. If weights are entered, the sum must equal 100. If ranks are entered, indicate ties by giving both processes the same rank and skip the next highest rank (as an example: 1, 2, 2, 4).
Relative Weight in Scoring
Rank of Priority Consideration
Ranking based on B/C
Available funding
Incremental B/C
Ranking based on net benefit
Other
Program: Segments
Date of Program Methodology: 7/1/2013
What data types were used in the program methodology?
Crashes Exposure Roadway
All crashes Traffic Median width
Fatal crashes only Volume Horizontal curvature
Fatal and serious injury Population Functional classification crashes only
2014 Delaware Highway Safety Improvement Program
10
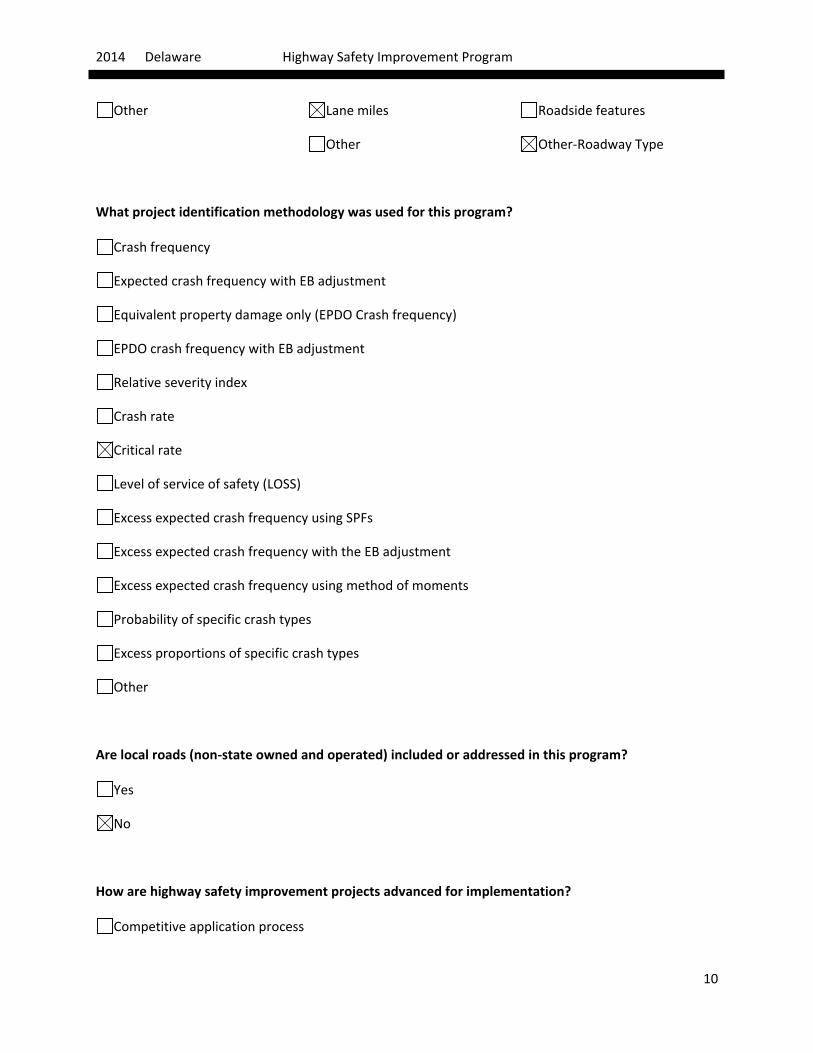
Other Lane miles Roadside features
Other Other-Roadway Type
What project identification methodology was used for this program?
Crash frequency
Expected crash frequency with EB adjustment
Equivalent property damage only (EPDO Crash frequency)
EPDO crash frequency with EB adjustment
Relative severity index
Crash rate
Critical rate
Level of service of safety (LOSS)
Excess expected crash frequency using SPFs
Excess expected crash frequency with the EB adjustment
Excess expected crash frequency using method of moments
Probability of specific crash types
Excess proportions of specific crash types
Other
Are local roads (non-state owned and operated) included or addressed in this program?
Yes
No
How are highway safety improvement projects advanced for implementation?
Competitive application process
2014 Delaware Highway Safety Improvement Program
11
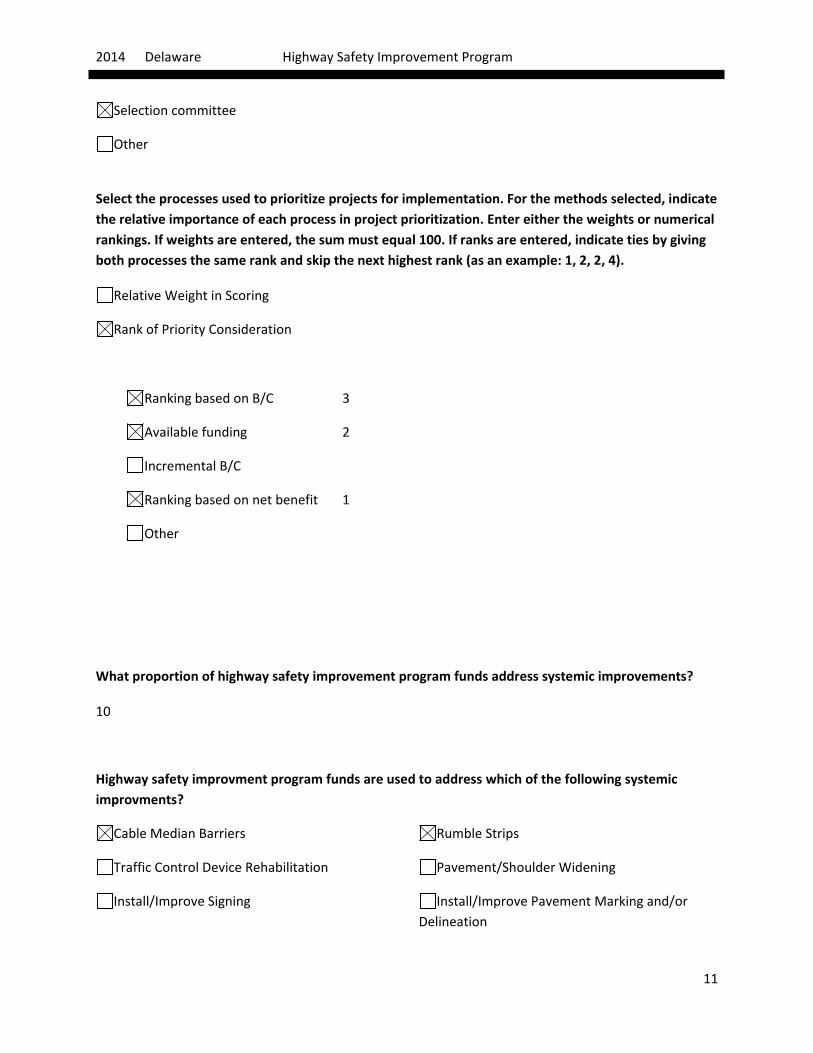
Selection committee
Other
Select the processes used to prioritize projects for implementation. For the methods selected, indicate the relative importance of each process in project prioritization. Enter either the weights or numerical rankings. If weights are entered, the sum must equal 100. If ranks are entered, indicate ties by giving both processes the same rank and skip the next highest rank (as an example: 1, 2, 2, 4).
Relative Weight in Scoring
Rank of Priority Consideration
Ranking based on B/C 3
Available funding 2
Incremental B/C
Ranking based on net benefit 1
Other
What proportion of highway safety improvement program funds address systemic improvements?
10
Highway safety improvment program funds are used to address which of the following systemic improvments?
Cable Median Barriers Rumble Strips
Traffic Control Device Rehabilitation Pavement/Shoulder Widening
Install/Improve Signing Install/Improve Pavement Marking and/or Delineation
2014 Delaware Highway Safety Improvement Program
12
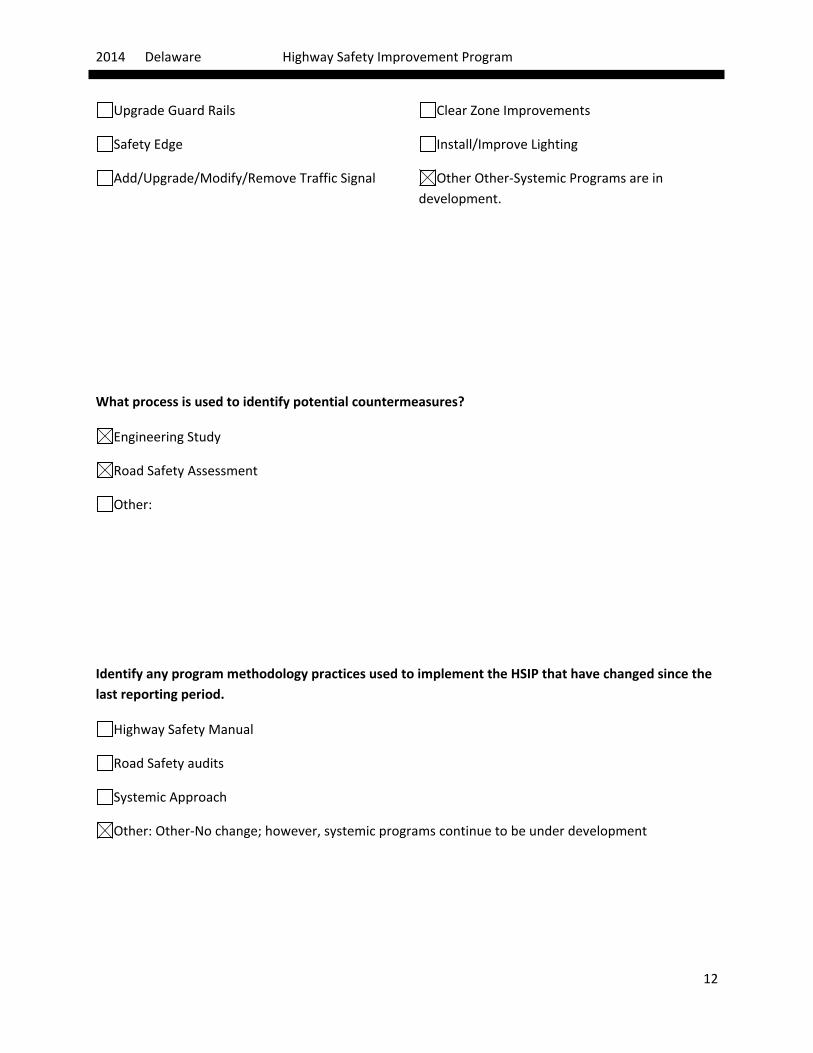
Upgrade Guard Rails Clear Zone Improvements
Safety Edge Install/Improve Lighting
Add/Upgrade/Modify/Remove Traffic Signal Other Other-Systemic Programs are in development.
What process is used to identify potential countermeasures?
Engineering Study
Road Safety Assessment
Other:
Identify any program methodology practices used to implement the HSIP that have changed since the last reporting period.
Highway Safety Manual
Road Safety audits
Systemic Approach
Other: Other-No change; however, systemic programs continue to be under development
2014 Delaware Highway Safety Improvement Program
13
Describe any other aspects of the Highway Safety Improvement Program methodology on which you would like to elaborate.
Please see attachment for the methodology on the HSIP Site Selection Process.
2014 Delaware Highway Safety Improvement Program
14
Progress in Implementing Projects
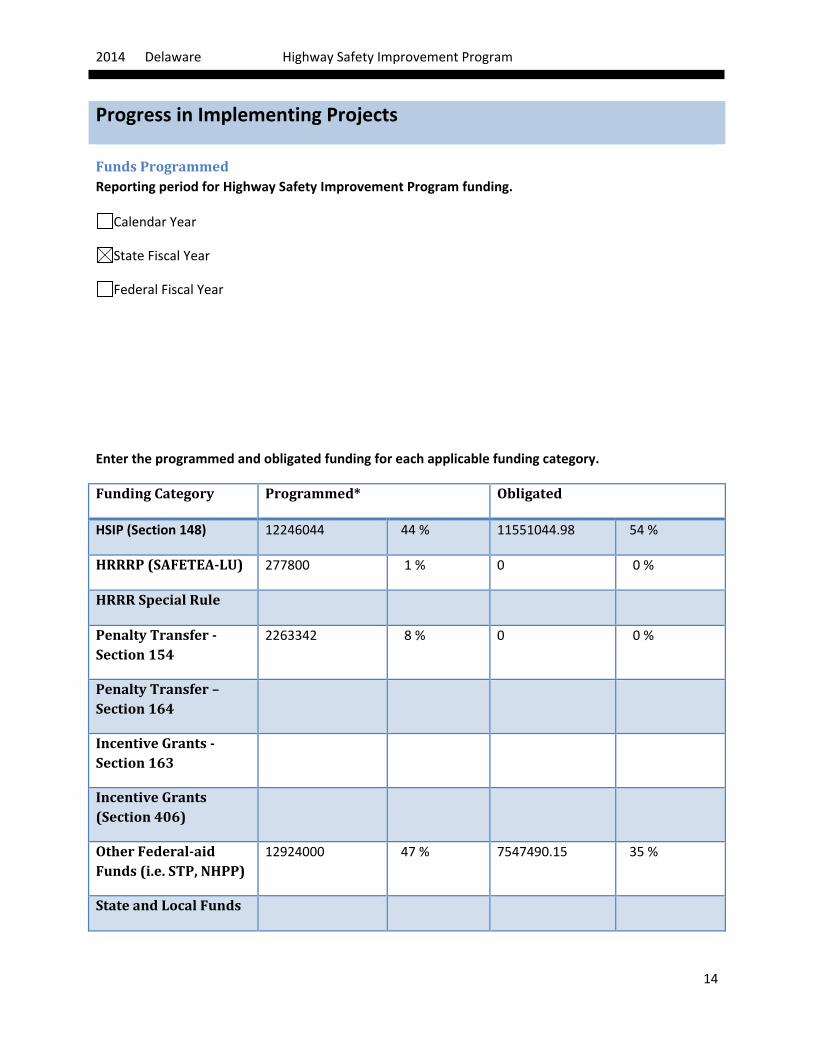
Funds Programmed Reporting period for Highway Safety Improvement Program funding.
Calendar Year
State Fiscal Year
Federal Fiscal Year
Enter the programmed and obligated funding for each applicable funding category.
Funding Category Programmed* Obligated
HSIP (Section 148) 12246044 44 % 11551044.98 54 %
HRRRP (SAFETEA-LU) 277800 1 % 0 0 %
HRRR Special Rule
Penalty Transfer - Section 154
2263342 8 % 0 0 %
Penalty Transfer – Section 164
Incentive Grants - Section 163
Incentive Grants (Section 406)
Other Federal-aid Funds (i.e. STP, NHPP)
12924000 47 % 7547490.15 35 %
State and Local Funds
2014 Delaware Highway Safety Improvement Program
15
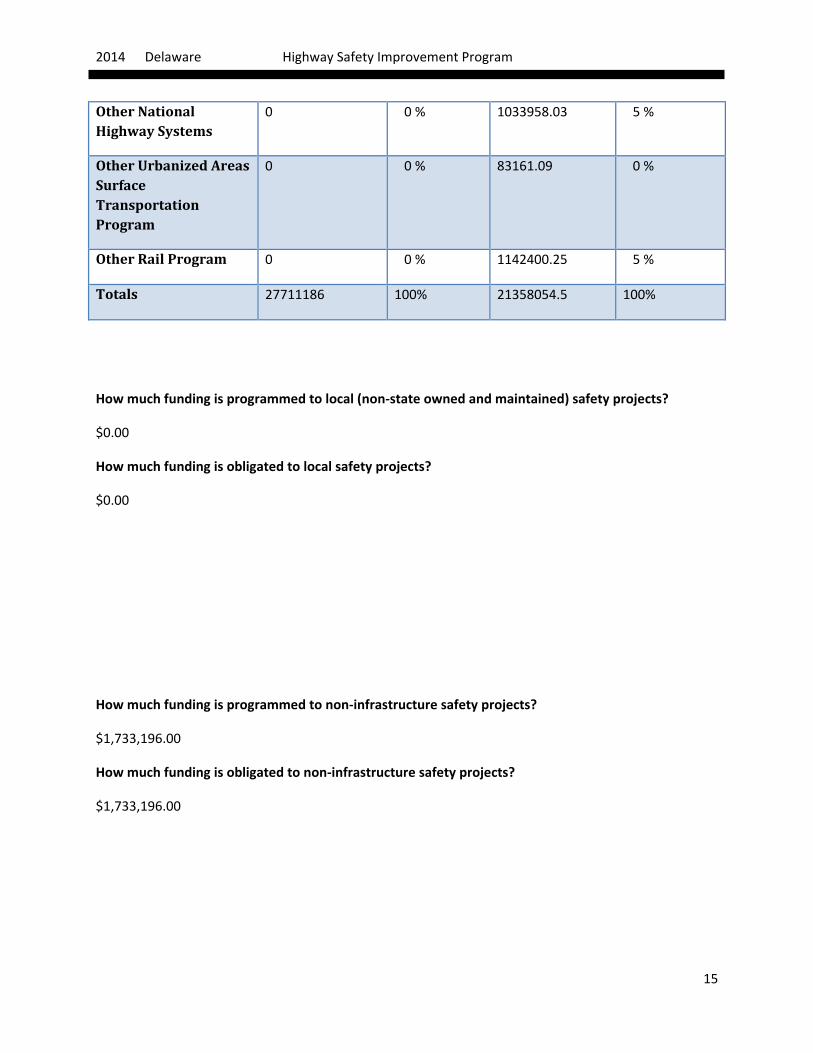
Other National Highway Systems
0 0 % 1033958.03 5 %
Other Urbanized Areas Surface Transportation Program
0 0 % 83161.09 0 %
Other Rail Program 0 0 % 1142400.25 5 %
Totals 27711186 100% 21358054.5 100%
How much funding is programmed to local (non-state owned and maintained) safety projects?
$0.00
How much funding is obligated to local safety projects?
$0.00
How much funding is programmed to non-infrastructure safety projects?
$1,733,196.00
How much funding is obligated to non-infrastructure safety projects?
$1,733,196.00
2014 Delaware Highway Safety Improvement Program
16
How much funding was transferred in to the HSIP from other core program areas during the reporting period?
$0.00
How much funding was transferred out of the HSIP to other core program areas during the reporting period?
$0.00
Discuss impediments to obligating Highway Safety Improvement Program funds and plans to overcome this in the future.
No impediments at this time.
Describe any other aspects of the general Highway Safety Improvement Program implementation progress on which you would like to elaborate.
None at this time.
2014 Delaware Highway Safety Improvement Program
17
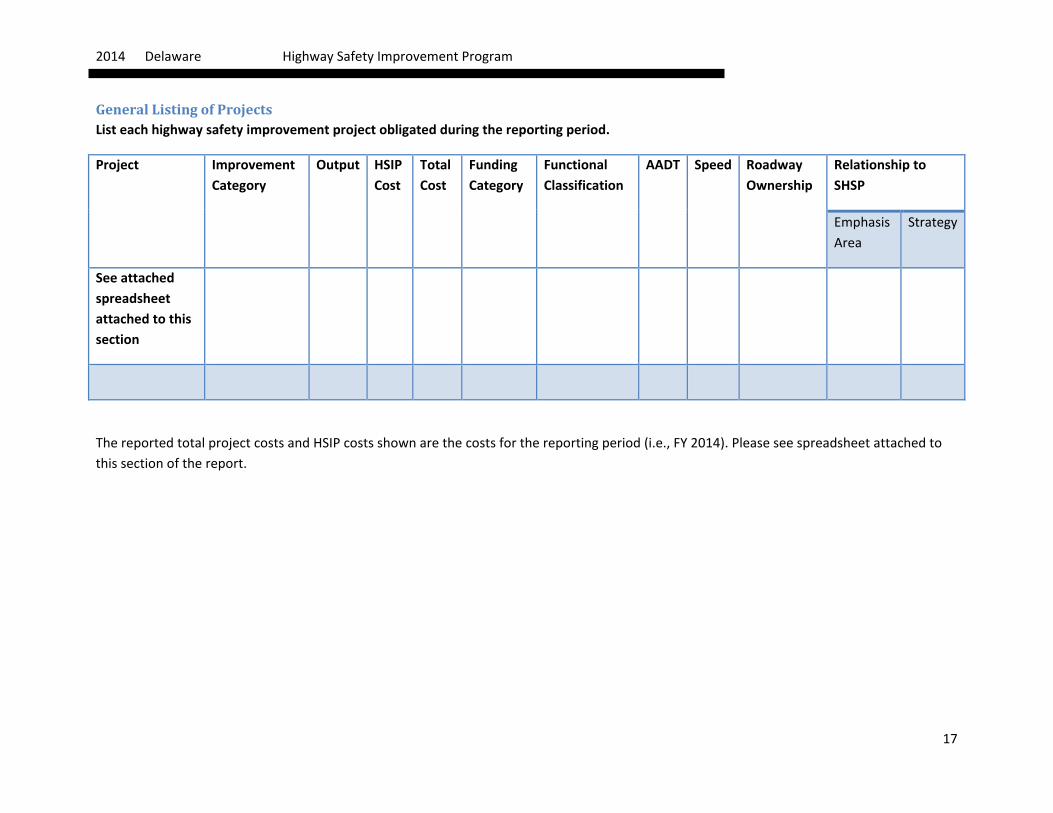
General Listing of Projects List each highway safety improvement project obligated during the reporting period.
Project Improvement Category
Output HSIP Cost
Total Cost
Funding Category
Functional Classification
AADT Speed Roadway Ownership
Relationship to SHSP
Emphasis Area
Strategy
See attached spreadsheet attached to this section
The reported total project costs and HSIP costs shown are the costs for the reporting period (i.e., FY 2014). Please see spreadsheet attached to this section of the report.
2014 Delaware Highway Safety Improvement Program
18
Progress in Achieving Safety Performance Targets
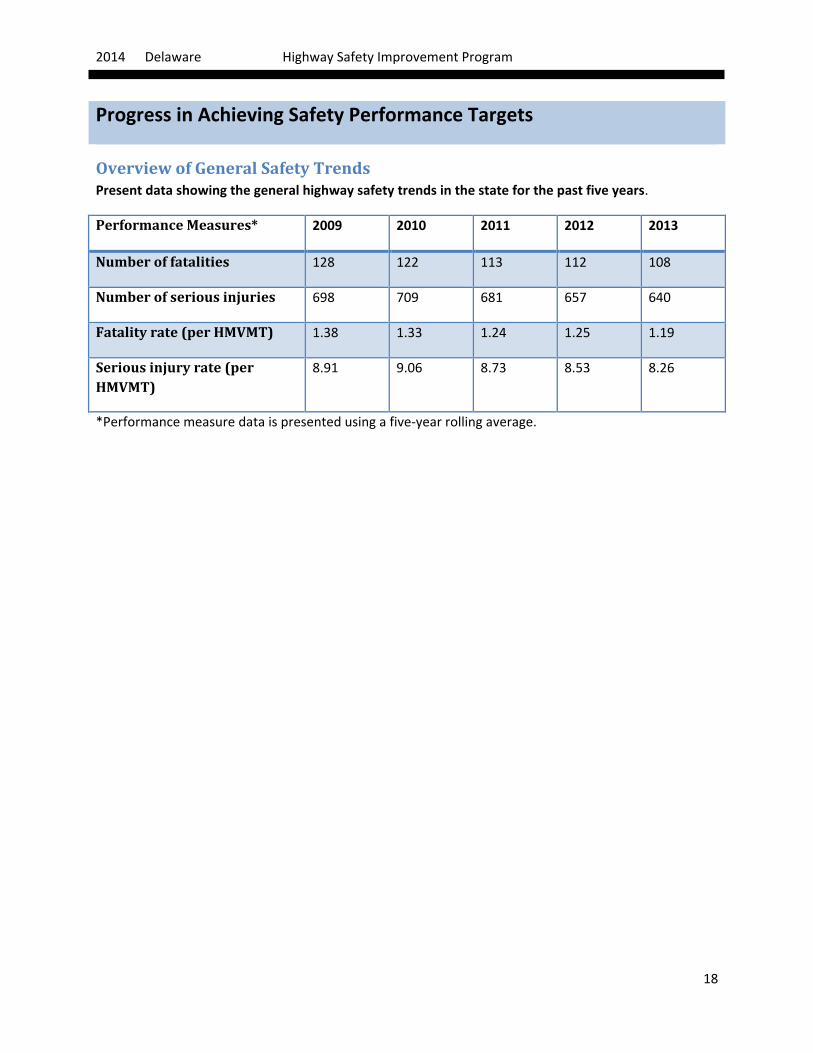
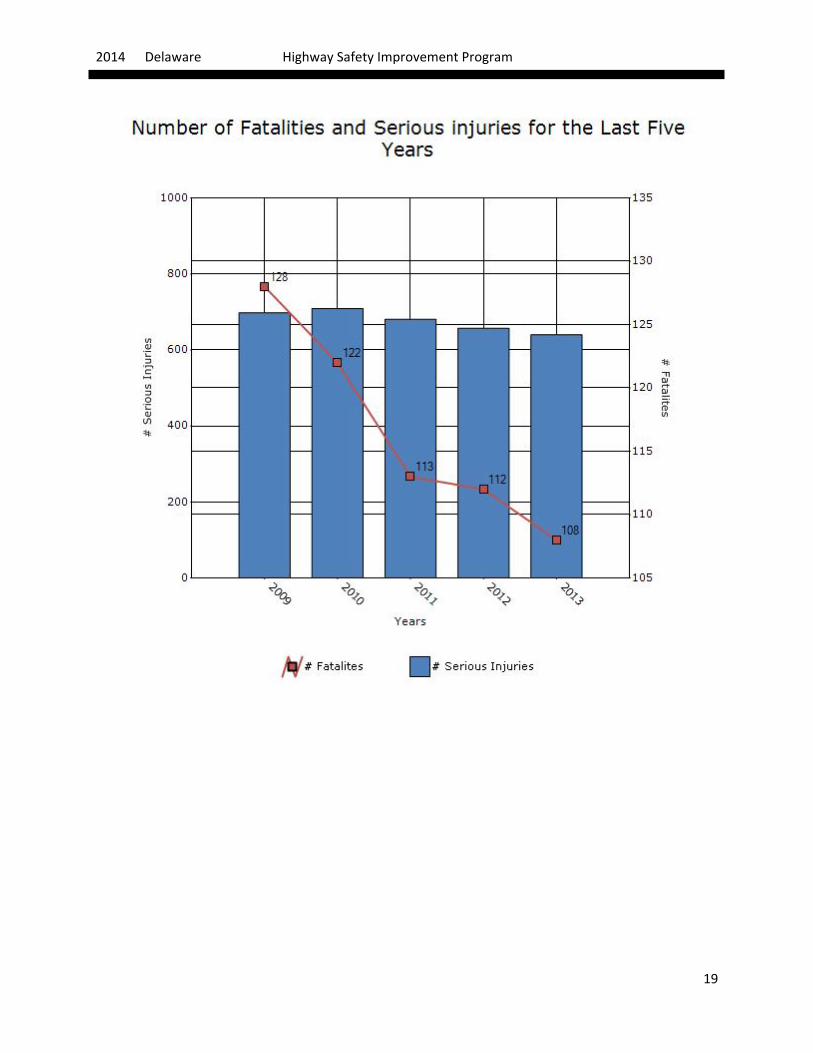
Overview of General Safety Trends Present data showing the general highway safety trends in the state for the past five years.
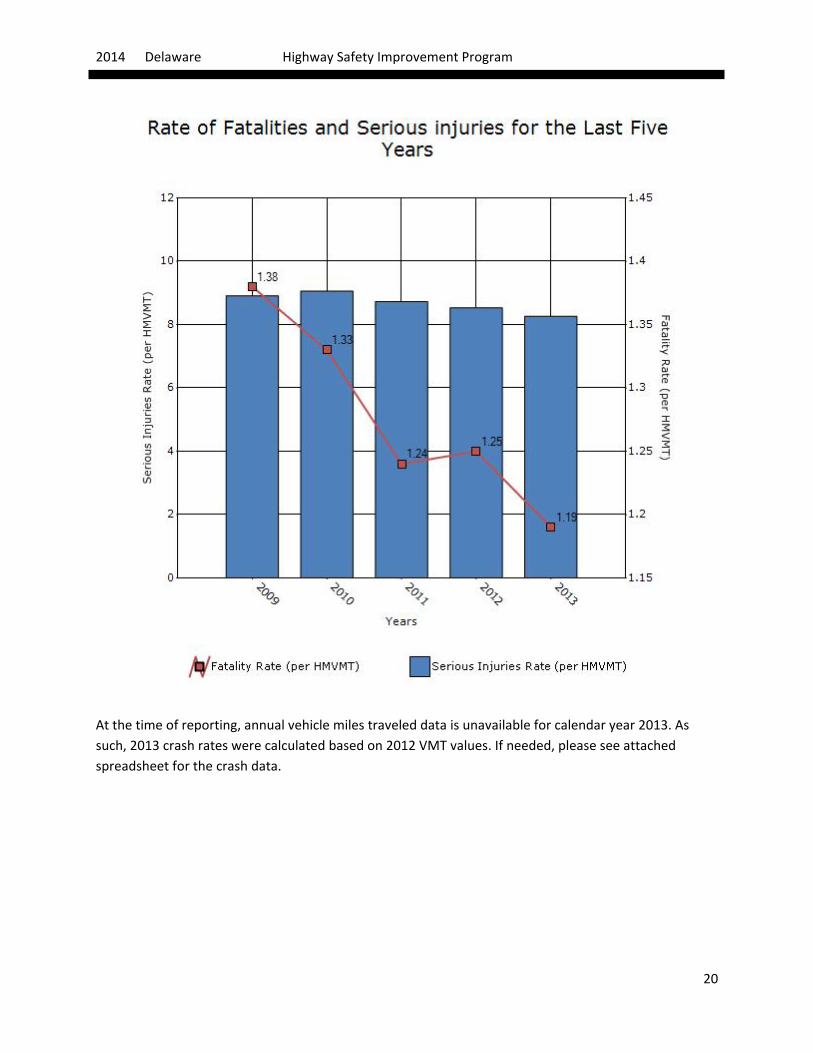
Performance Measures* 2009 2010 2011 2012 2013
Number of fatalities 128 122 113 112 108
Number of serious injuries 698 709 681 657 640
Fatality rate (per HMVMT) 1.38 1.33 1.24 1.25 1.19
Serious injury rate (per HMVMT)
8.91 9.06 8.73 8.53 8.26
*Performance measure data is presented using a five-year rolling average.
2014 Delaware Highway Safety Improvement Program
19
2014 Delaware Highway Safety Improvement Program
20
At the time of reporting, annual vehicle miles traveled data is unavailable for calendar year 2013. As such, 2013 crash rates were calculated based on 2012 VMT values. If needed, please see attached spreadsheet for the crash data.
2014 Delaware Highway Safety Improvement Program
21
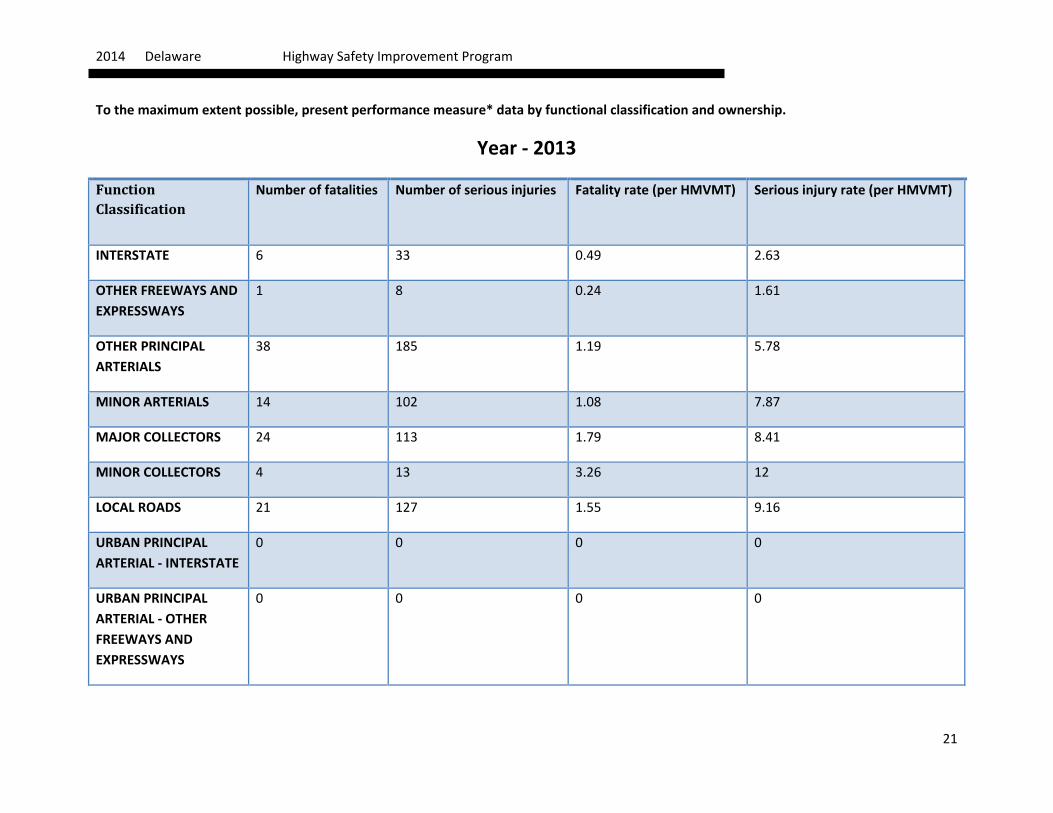
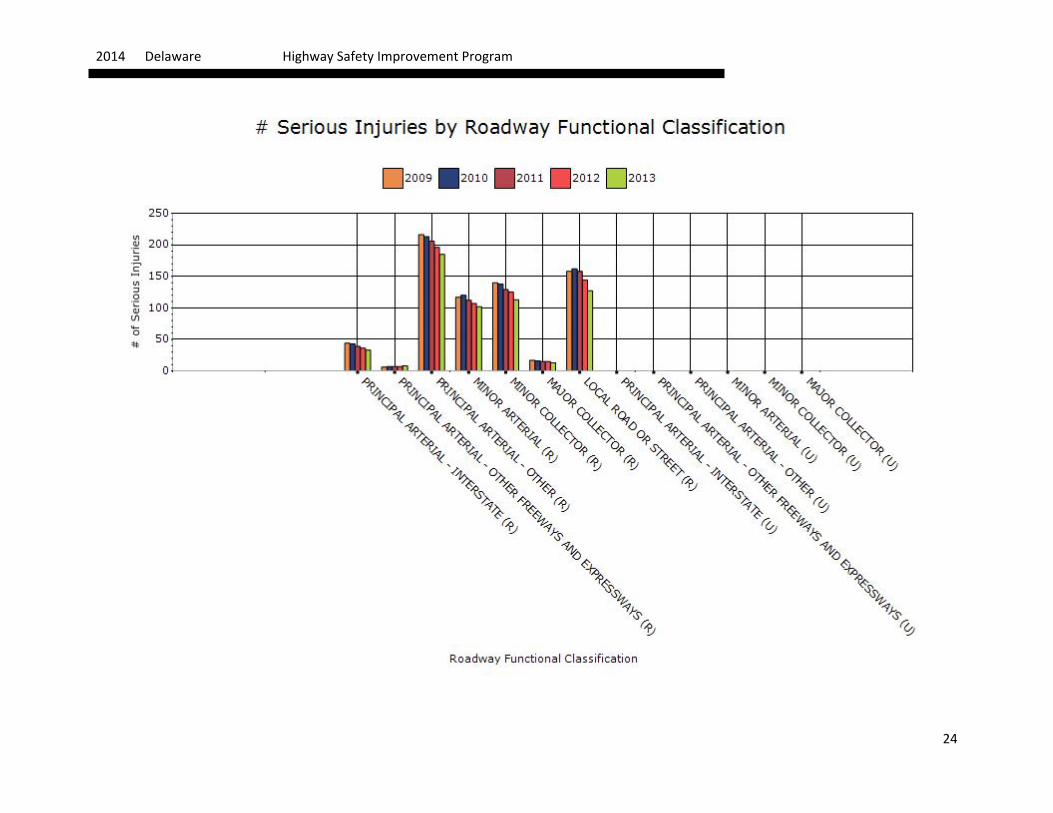
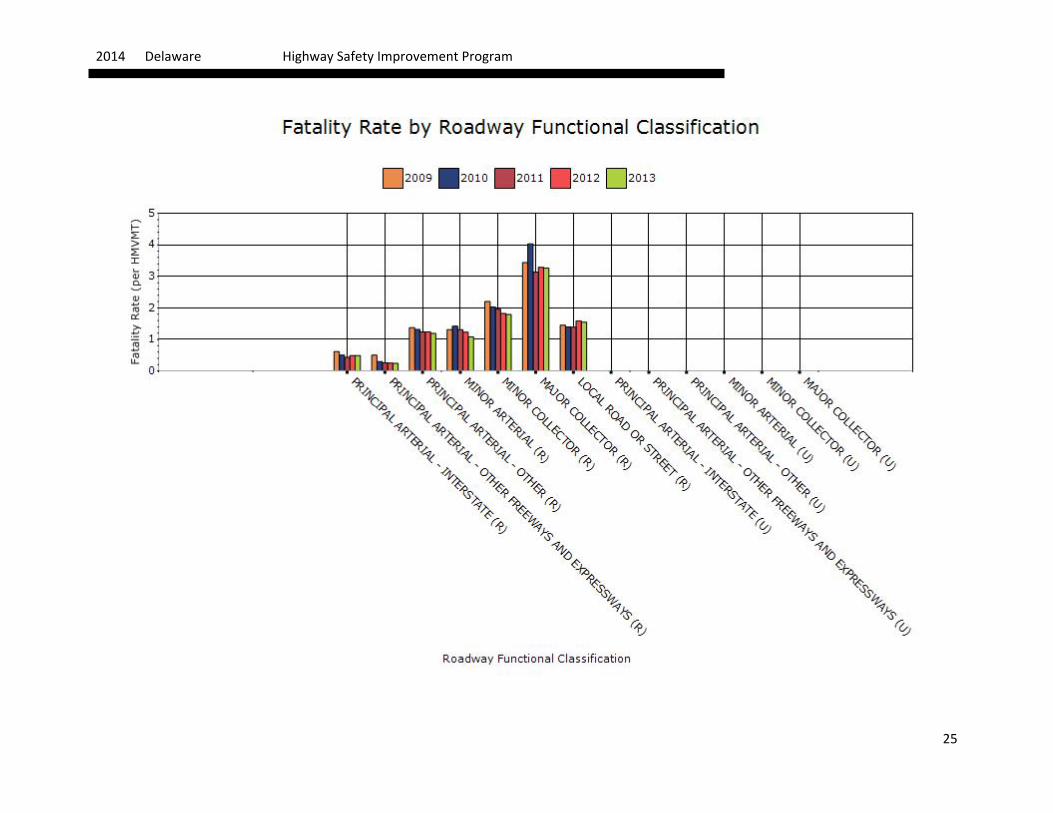
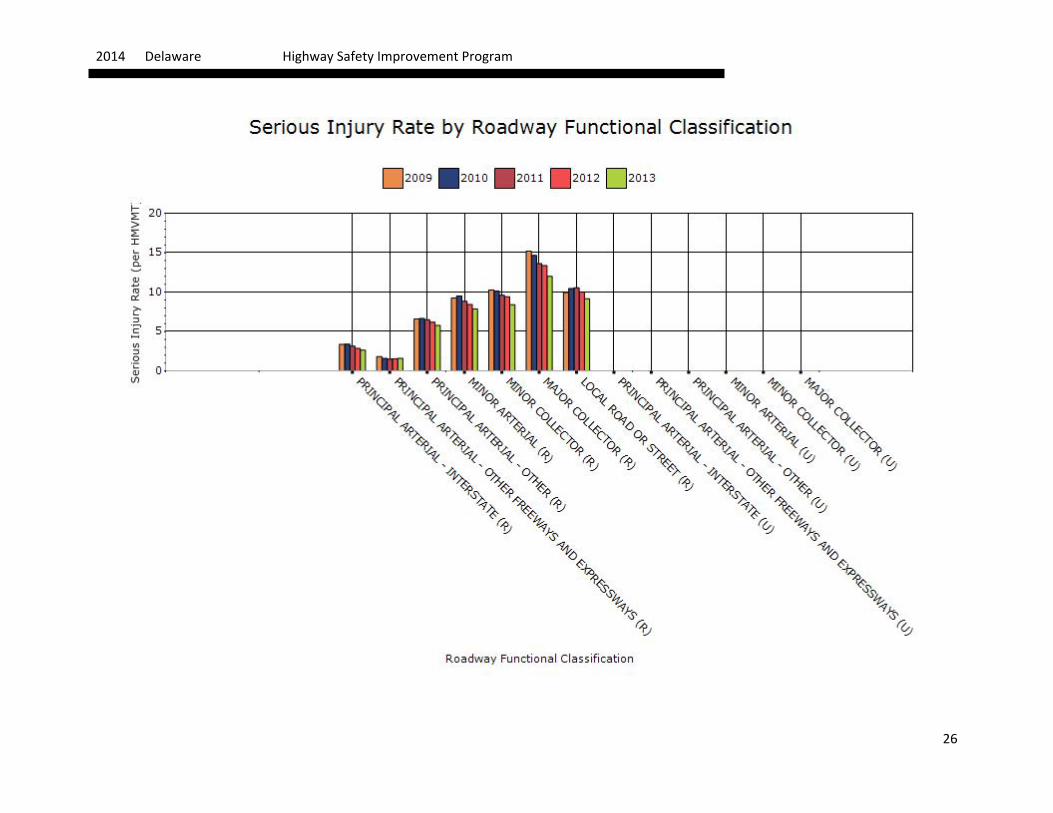
To the maximum extent possible, present performance measure* data by functional classification and ownership.
Year - 2013
Function Classification
Number of fatalities Number of serious injuries Fatality rate (per HMVMT) Serious injury rate (per HMVMT)
INTERSTATE 6 33 0.49 2.63
OTHER FREEWAYS AND EXPRESSWAYS
1 8 0.24 1.61
OTHER PRINCIPAL ARTERIALS
38 185 1.19 5.78
MINOR ARTERIALS 14 102 1.08 7.87
MAJOR COLLECTORS 24 113 1.79 8.41
MINOR COLLECTORS 4 13 3.26 12
LOCAL ROADS 21 127 1.55 9.16
URBAN PRINCIPAL ARTERIAL - INTERSTATE
0 0 0 0
URBAN PRINCIPAL ARTERIAL - OTHER FREEWAYS AND EXPRESSWAYS
0 0 0 0
2014 Delaware Highway Safety Improvement Program
22
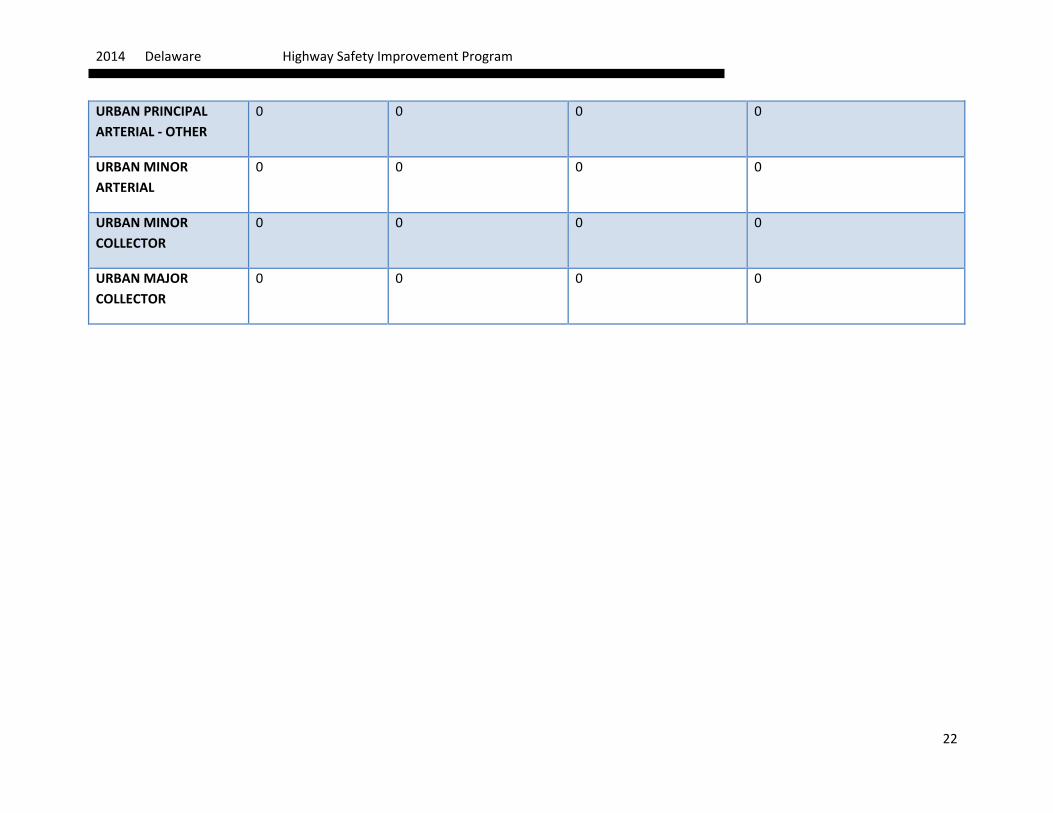
URBAN PRINCIPAL ARTERIAL - OTHER
0 0 0 0
URBAN MINOR ARTERIAL
0 0 0 0
URBAN MINOR COLLECTOR
0 0 0 0
URBAN MAJOR COLLECTOR
0 0 0 0
2014 Delaware Highway Safety Improvement Program
23
2014 Delaware Highway Safety Improvement Program
24
2014 Delaware Highway Safety Improvement Program
25
2014 Delaware Highway Safety Improvement Program
26
2014 Delaware Highway Safety Improvement Program
27
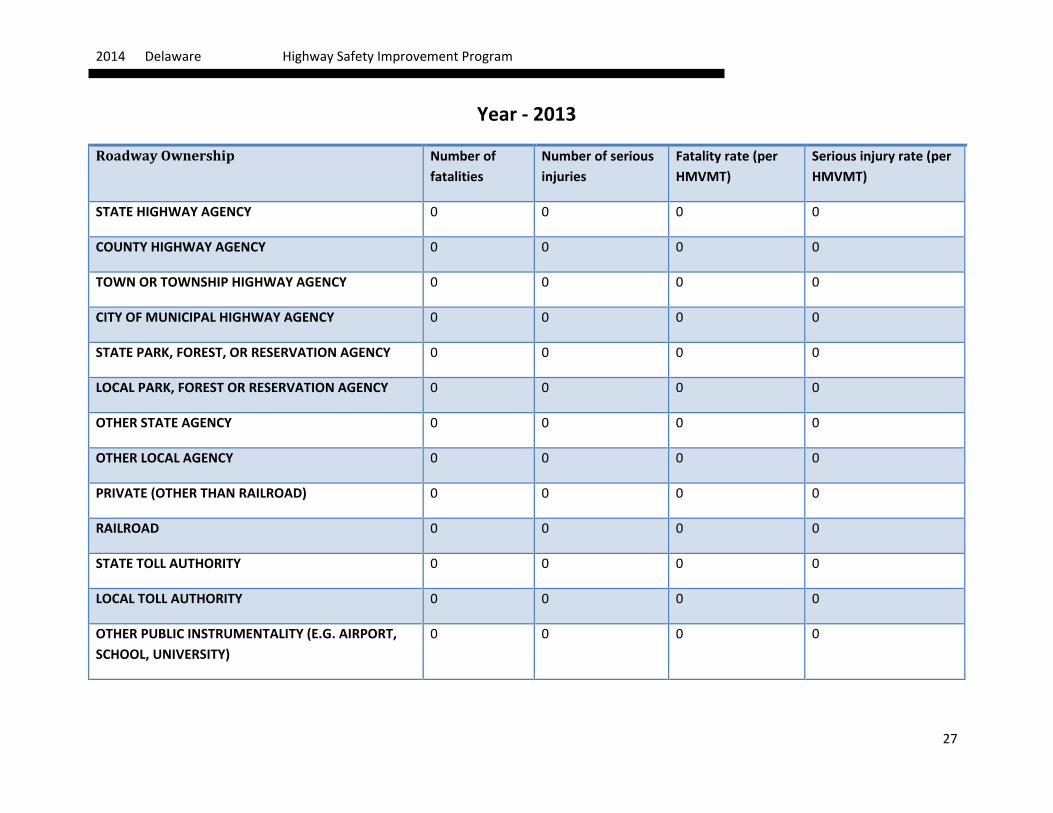
Year - 2013
Roadway Ownership Number of fatalities
Number of serious injuries
Fatality rate (per HMVMT)
Serious injury rate (per HMVMT)
STATE HIGHWAY AGENCY 0 0 0 0
COUNTY HIGHWAY AGENCY 0 0 0 0
TOWN OR TOWNSHIP HIGHWAY AGENCY 0 0 0 0
CITY OF MUNICIPAL HIGHWAY AGENCY 0 0 0 0
STATE PARK, FOREST, OR RESERVATION AGENCY 0 0 0 0
LOCAL PARK, FOREST OR RESERVATION AGENCY 0 0 0 0
OTHER STATE AGENCY 0 0 0 0
OTHER LOCAL AGENCY 0 0 0 0
PRIVATE (OTHER THAN RAILROAD) 0 0 0 0
RAILROAD 0 0 0 0
STATE TOLL AUTHORITY 0 0 0 0
LOCAL TOLL AUTHORITY 0 0 0 0
OTHER PUBLIC INSTRUMENTALITY (E.G. AIRPORT, SCHOOL, UNIVERSITY)
0 0 0 0
2014 Delaware Highway Safety Improvement Program
28
2014 Delaware Highway Safety Improvement Program
29
2014 Delaware Highway Safety Improvement Program
30
2014 Delaware Highway Safety Improvement Program
31
2014 Delaware Highway Safety Improvement Program
32
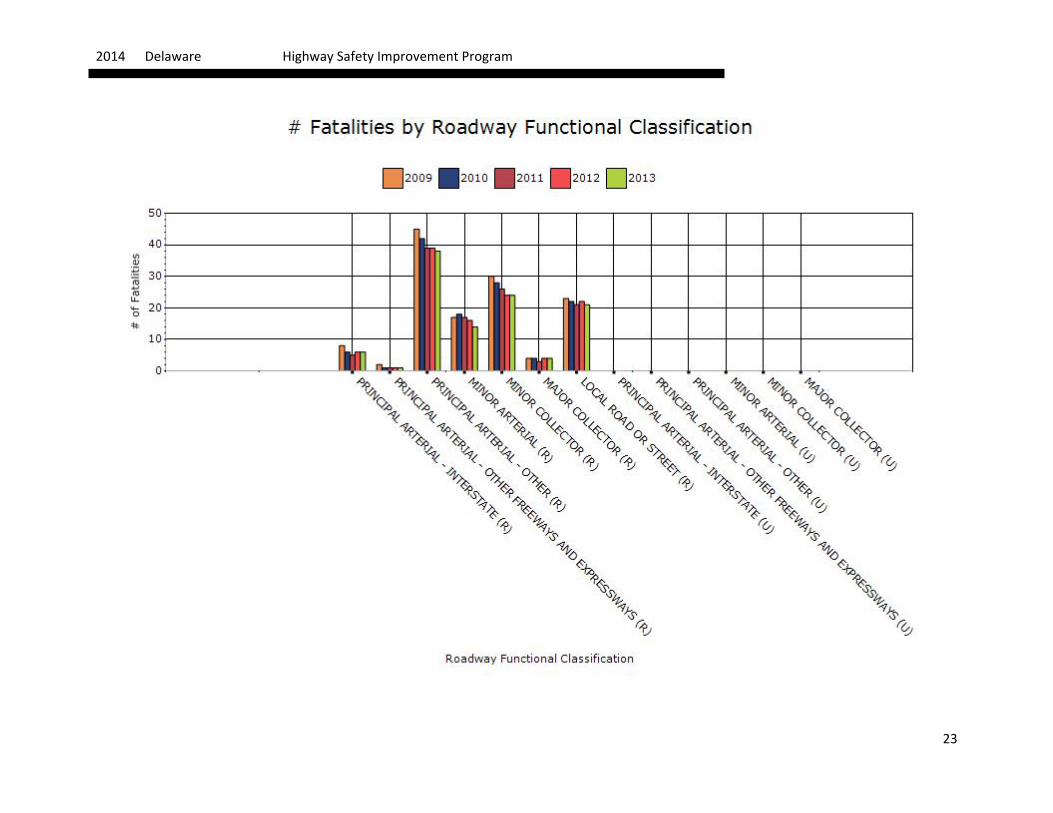
Urban vs. rural crash data by functional classification is not readily available at this time; therefore, functional classifications that combine urban and rural are shown. Additionally, crash data by roadway ownership is not readily available for this reporting period and is not provided. At the time of reporting, annual vehicle miles traveled data is unavailable for calendar year 2013. As such, 2013 crash rates were calculated based on 2012 VMT values. If needed, please see attached spreadsheet for the crash data.
2014 Delaware Highway Safety Improvement Program
33
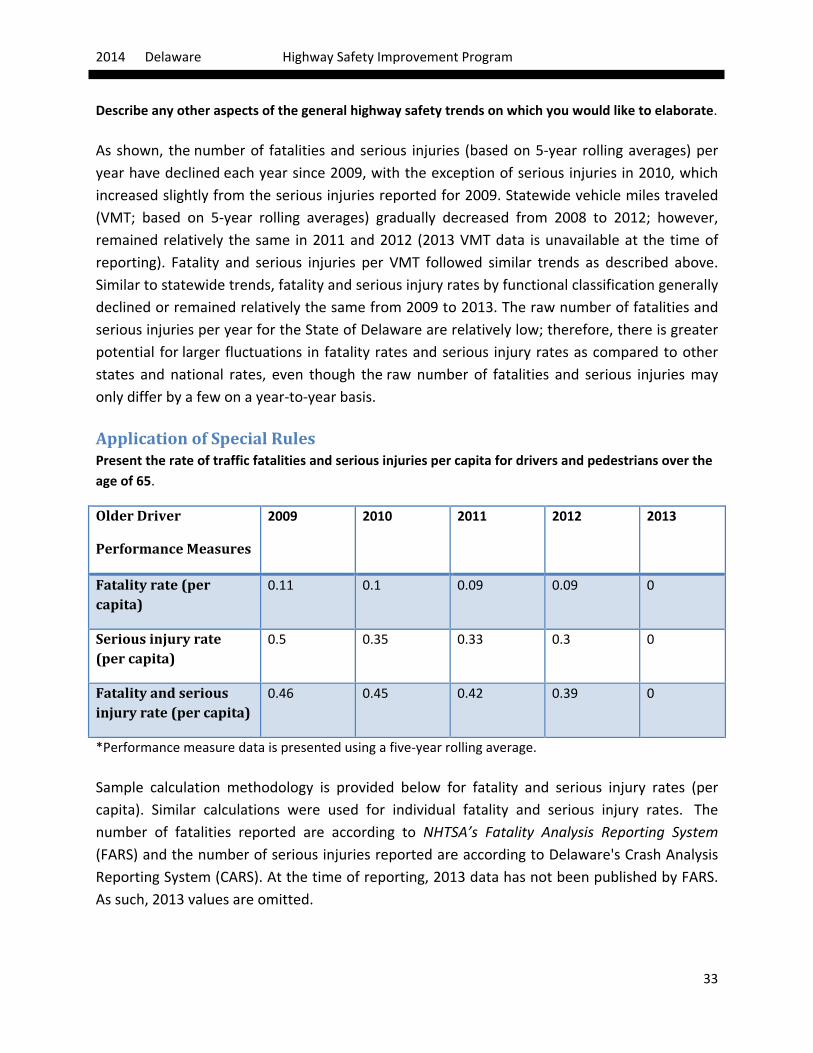
Describe any other aspects of the general highway safety trends on which you would like to elaborate.
As shown, the number of fatalities and serious injuries (based on 5-year rolling averages) per year have declined each year since 2009, with the exception of serious injuries in 2010, which increased slightly from the serious injuries reported for 2009. Statewide vehicle miles traveled (VMT; based on 5-year rolling averages) gradually decreased from 2008 to 2012; however, remained relatively the same in 2011 and 2012 (2013 VMT data is unavailable at the time of reporting). Fatality and serious injuries per VMT followed similar trends as described above. Similar to statewide trends, fatality and serious injury rates by functional classification generally declined or remained relatively the same from 2009 to 2013. The raw number of fatalities and serious injuries per year for the State of Delaware are relatively low; therefore, there is greater potential for larger fluctuations in fatality rates and serious injury rates as compared to other states and national rates, even though the raw number of fatalities and serious injuries may only differ by a few on a year-to-year basis.
Application of Special Rules Present the rate of traffic fatalities and serious injuries per capita for drivers and pedestrians over the age of 65.
Older Driver
Performance Measures
2009 2010 2011 2012 2013
Fatality rate (per capita)
0.11 0.1 0.09 0.09 0
Serious injury rate (per capita)
0.5 0.35 0.33 0.3 0
Fatality and serious injury rate (per capita)
0.46 0.45 0.42 0.39 0
*Performance measure data is presented using a five-year rolling average.
Sample calculation methodology is provided below for fatality and serious injury rates (per capita). Similar calculations were used for individual fatality and serious injury rates. The number of fatalities reported are according to NHTSA’s Fatality Analysis Reporting System (FARS) and the number of serious injuries reported are according to Delaware's Crash Analysis Reporting System (CARS). At the time of reporting, 2013 data has not been published by FARS. As such, 2013 values are omitted.
2014 Delaware Highway Safety Improvement Program
34
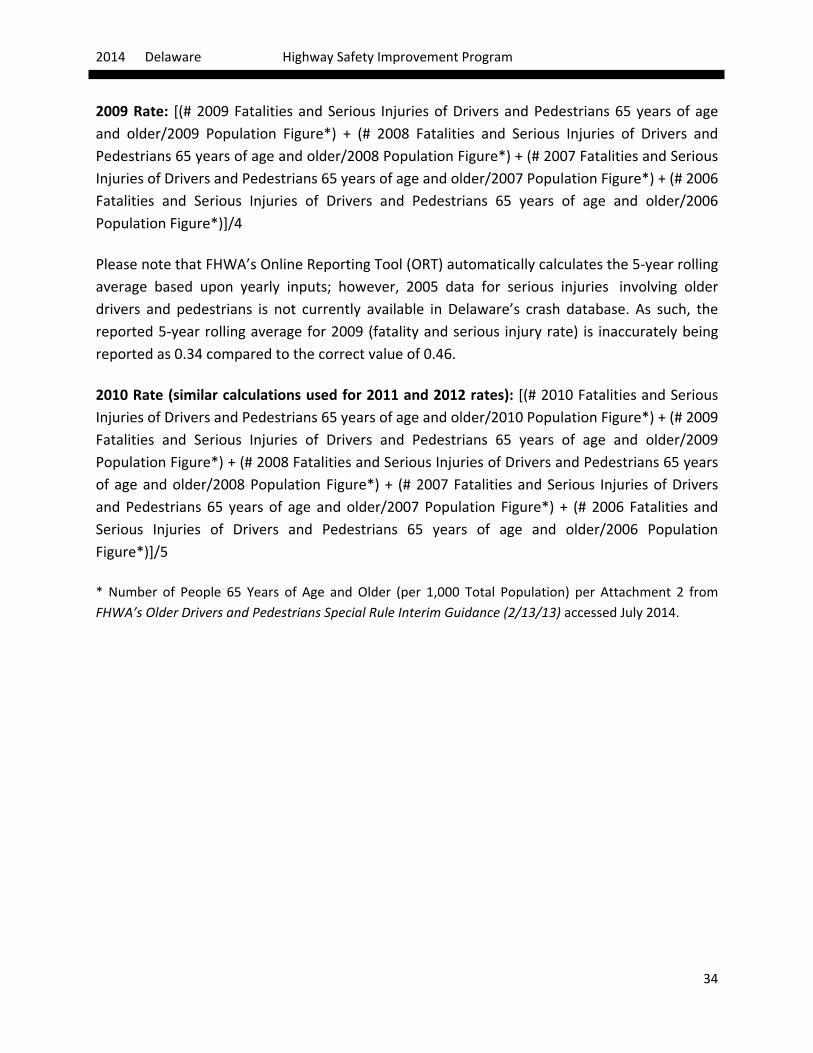
2009 Rate: [(# 2009 Fatalities and Serious Injuries of Drivers and Pedestrians 65 years of age and older/2009 Population Figure*) + (# 2008 Fatalities and Serious Injuries of Drivers and Pedestrians 65 years of age and older/2008 Population Figure*) + (# 2007 Fatalities and Serious Injuries of Drivers and Pedestrians 65 years of age and older/2007 Population Figure*) + (# 2006 Fatalities and Serious Injuries of Drivers and Pedestrians 65 years of age and older/2006 Population Figure*)]/4
Please note that FHWA’s Online Reporting Tool (ORT) automatically calculates the 5-year rolling average based upon yearly inputs; however, 2005 data for serious injuries involving older drivers and pedestrians is not currently available in Delaware’s crash database. As such, the reported 5-year rolling average for 2009 (fatality and serious injury rate) is inaccurately being reported as 0.34 compared to the correct value of 0.46.
2010 Rate (similar calculations used for 2011 and 2012 rates): [(# 2010 Fatalities and Serious Injuries of Drivers and Pedestrians 65 years of age and older/2010 Population Figure*) + (# 2009 Fatalities and Serious Injuries of Drivers and Pedestrians 65 years of age and older/2009 Population Figure*) + (# 2008 Fatalities and Serious Injuries of Drivers and Pedestrians 65 years of age and older/2008 Population Figure*) + (# 2007 Fatalities and Serious Injuries of Drivers and Pedestrians 65 years of age and older/2007 Population Figure*) + (# 2006 Fatalities and Serious Injuries of Drivers and Pedestrians 65 years of age and older/2006 Population Figure*)]/5
* Number of People 65 Years of Age and Older (per 1,000 Total Population) per Attachment 2 from FHWA’s Older Drivers and Pedestrians Special Rule Interim Guidance (2/13/13) accessed July 2014.

2014 Delaware Highway Safety Improvement Program
35
At the time of reporting, annual vehicle miles traveled data is unavailable for calendar year 2013. As such, 2013 crash rates were calculated based on 2012 VMT values. Please note that FHWA’s Online Reporting Tool (ORT) automatically calculates the 5-year rolling average based upon yearly inputs; however, 2005 data for serious injuries is not currently available in Delaware’s crash database for the reported emphasis areas. As such, the reported 5-year rolling averages for 2009 were manually edited to reflect a 4-year rolling average. Additionally, population data for 2013 is not published; therefore, 5-year rolling averages for 2013 are omitted. If needed, please see attached spreadsheet for the crash data.
Does the older driver special rule apply to your state?
No

2014 Delaware Highway Safety Improvement Program
36
2014 Delaware Highway Safety Improvement Program
37
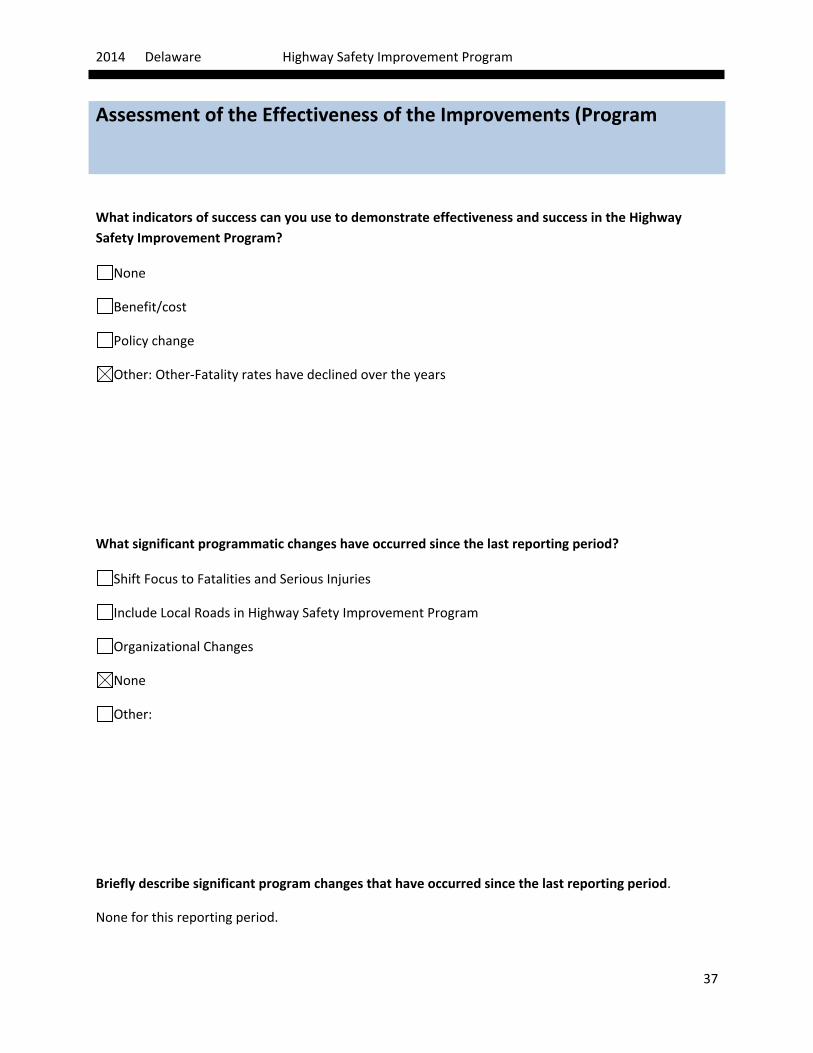
Assessment of the Effectiveness of the Improvements (Program Evaluation)
What indicators of success can you use to demonstrate effectiveness and success in the Highway Safety Improvement Program?
None
Benefit/cost
Policy change
Other: Other-Fatality rates have declined over the years
What significant programmatic changes have occurred since the last reporting period?
Shift Focus to Fatalities and Serious Injuries
Include Local Roads in Highway Safety Improvement Program
Organizational Changes
None
Other:
Briefly describe significant program changes that have occurred since the last reporting period.
None for this reporting period.
2014 Delaware Highway Safety Improvement Program
38
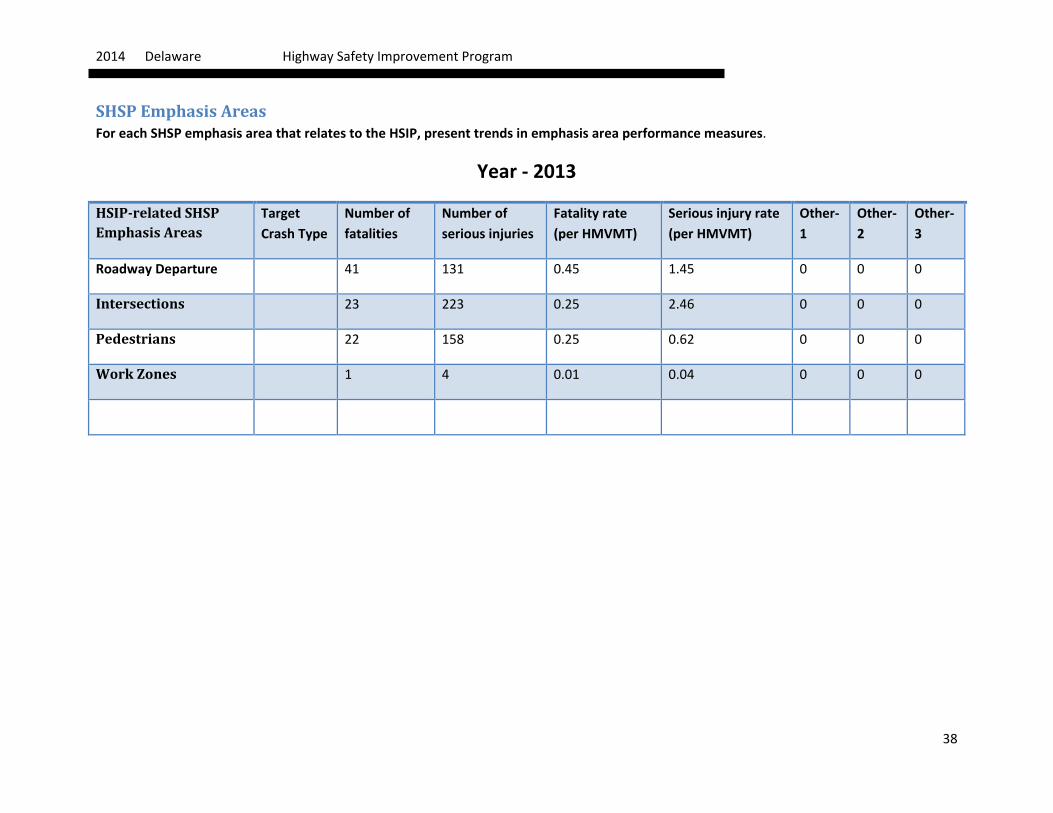
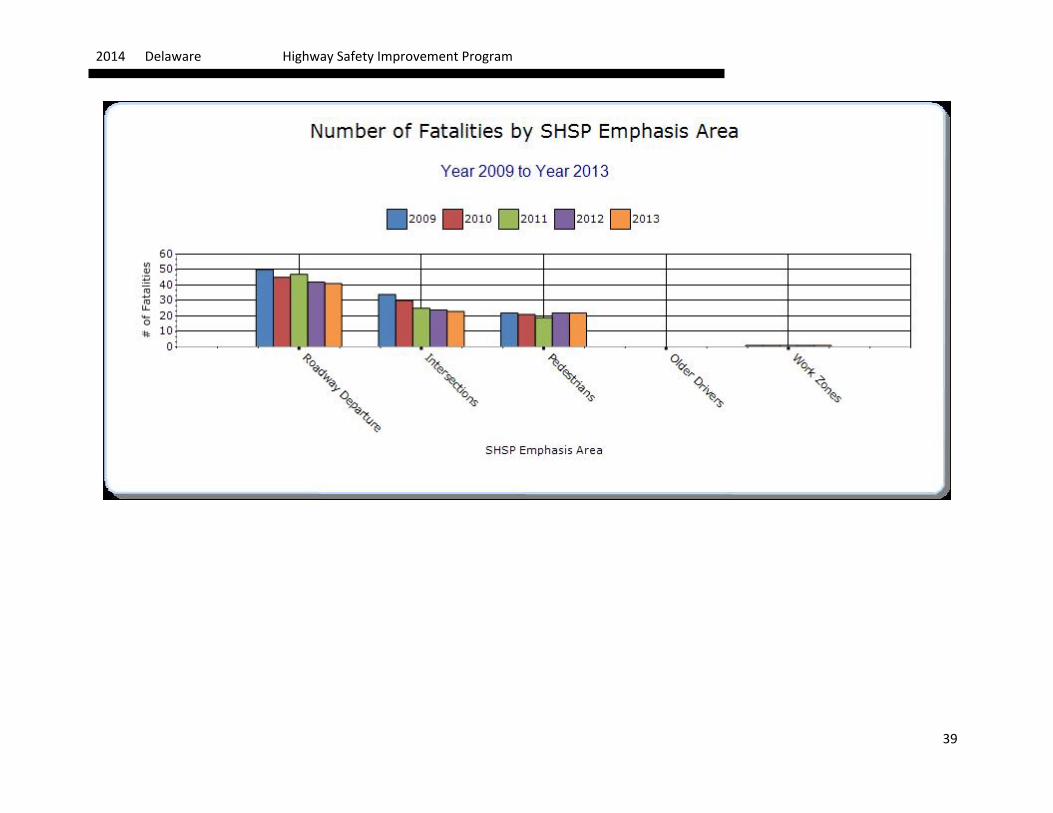
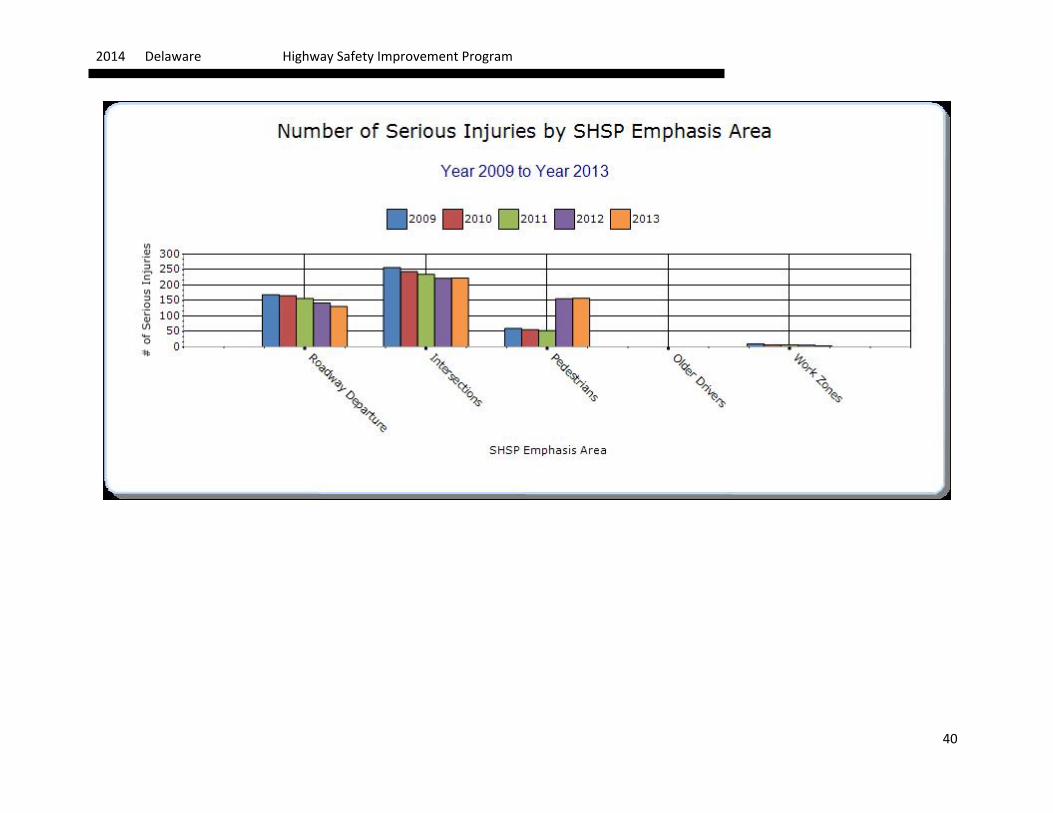
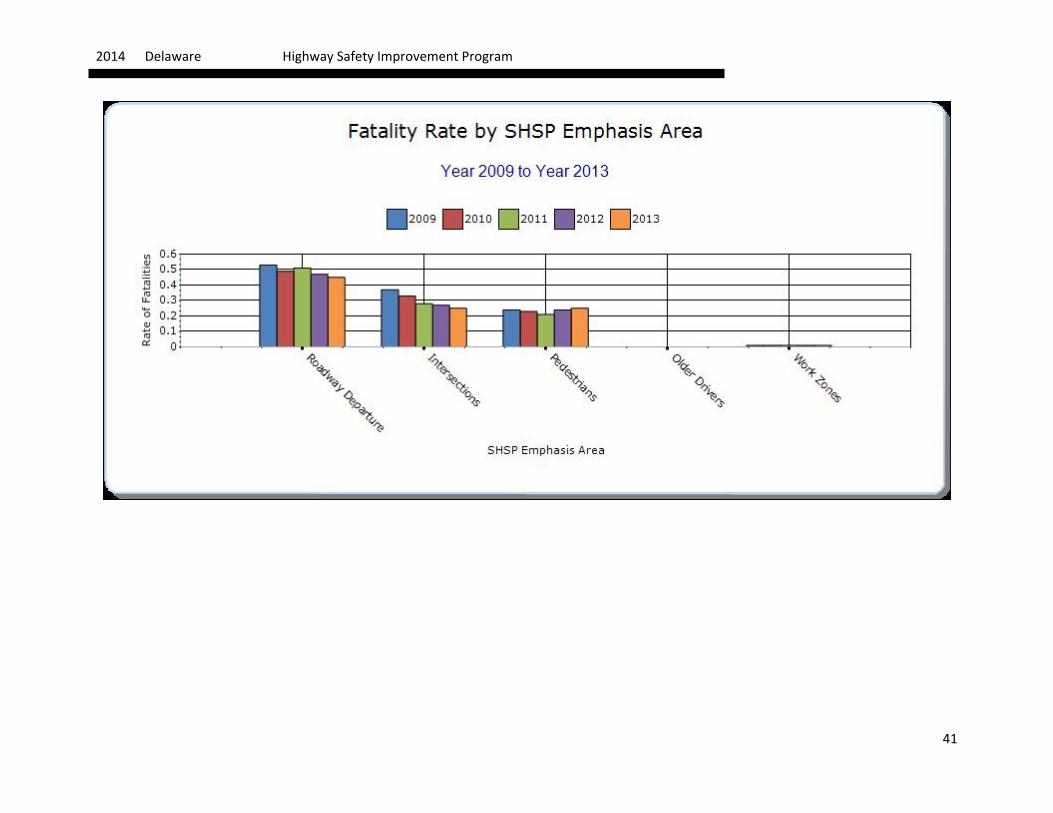
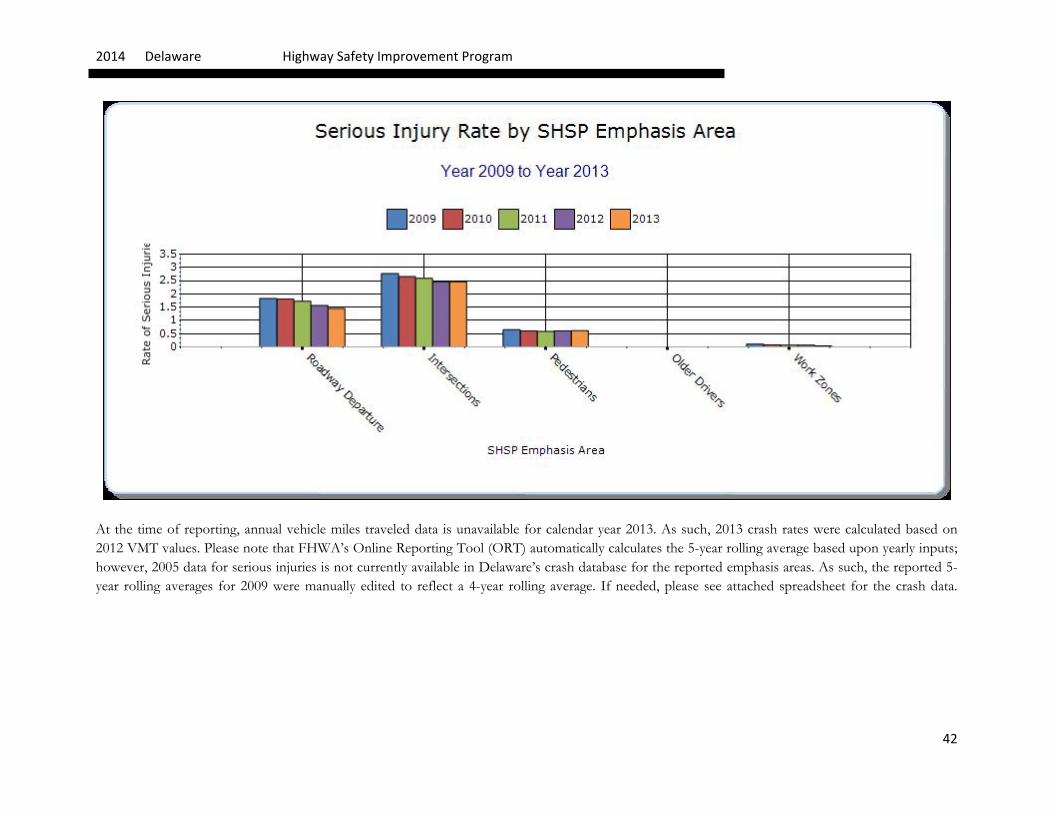
SHSP Emphasis Areas For each SHSP emphasis area that relates to the HSIP, present trends in emphasis area performance measures.
Year - 2013
HSIP-related SHSP Emphasis Areas
Target Crash Type
Number of fatalities
Number of serious injuries
Fatality rate (per HMVMT)
Serious injury rate (per HMVMT)
Other-1
Other-2
Other-3
Roadway Departure 41 131 0.45 1.45 0 0 0
Intersections 23 223 0.25 2.46 0 0 0
Pedestrians 22 158 0.25 0.62 0 0 0
Work Zones 1 4 0.01 0.04 0 0 0
2014 Delaware Highway Safety Improvement Program
39
2014 Delaware Highway Safety Improvement Program
40
2014 Delaware Highway Safety Improvement Program
41
2014 Delaware Highway Safety Improvement Program
42
At the time of reporting, annual vehicle miles traveled data is unavailable for calendar year 2013. As such, 2013 crash rates were calculated based on 2012 VMT values. Please note that FHWA’s Online Reporting Tool (ORT) automatically calculates the 5-year rolling average based upon yearly inputs; however, 2005 data for serious injuries is not currently available in Delaware’s crash database for the reported emphasis areas. As such, the reported 5-year rolling averages for 2009 were manually edited to reflect a 4-year rolling average. If needed, please see attached spreadsheet for the crash data.
2014 Delaware Highway Safety Improvement Program
43
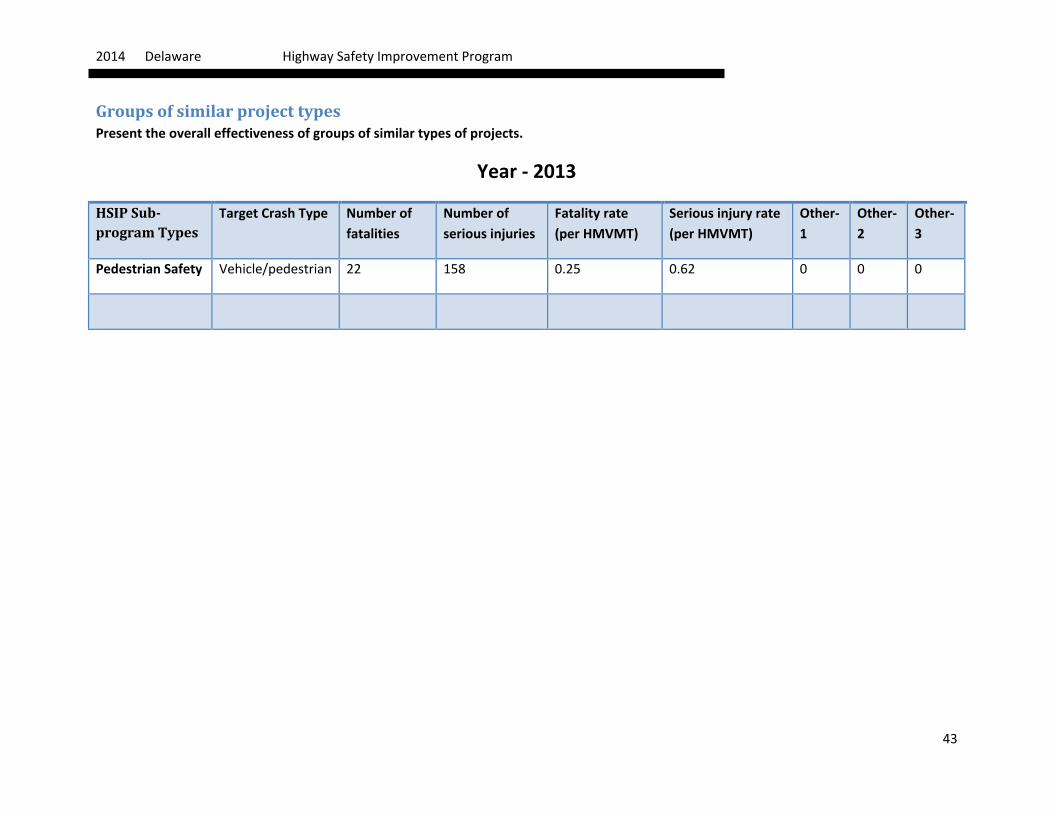
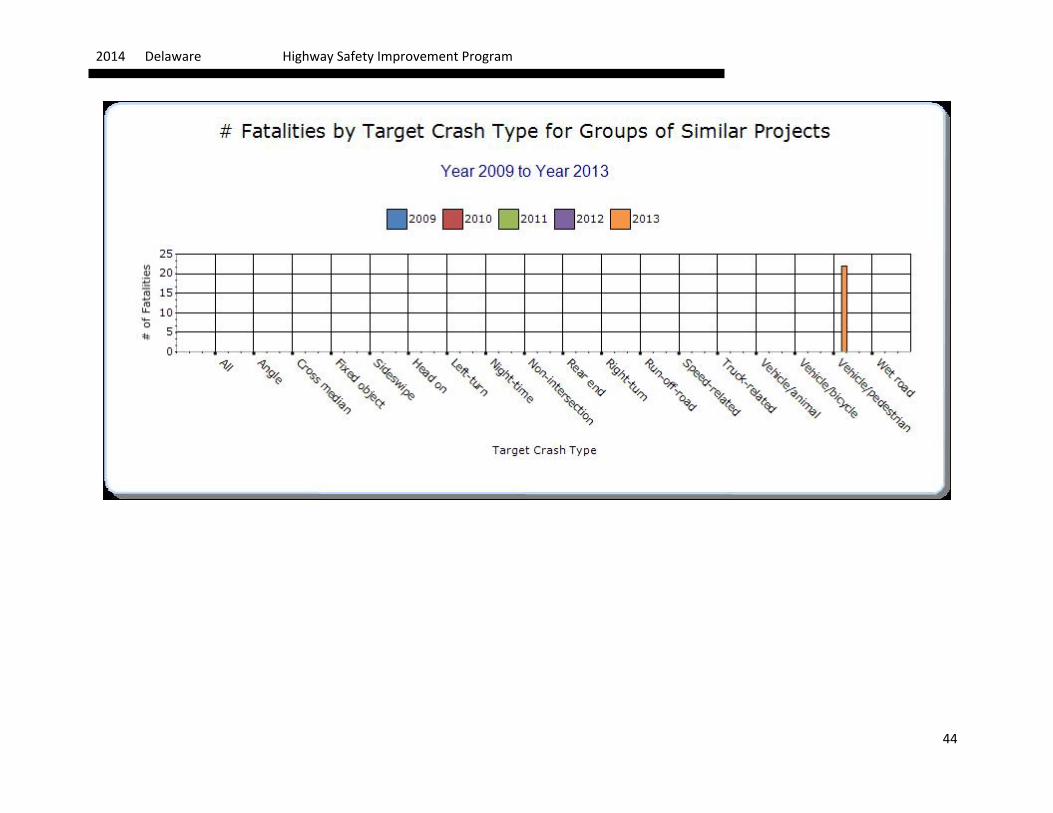
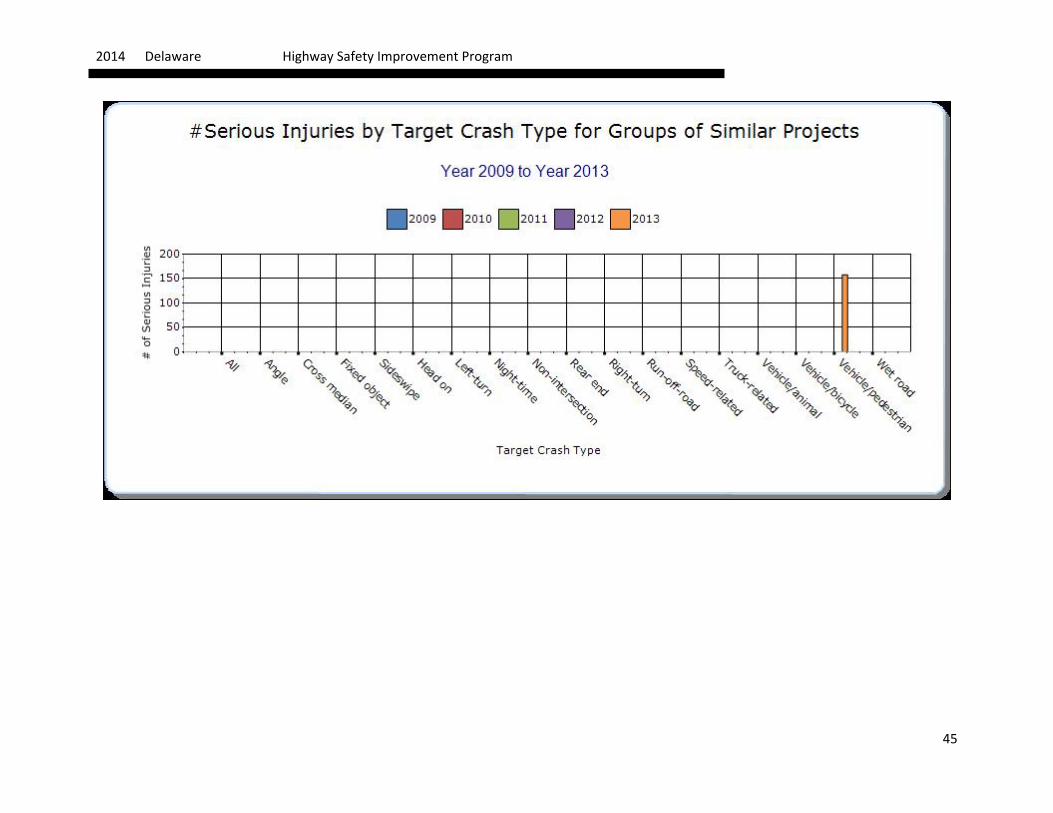
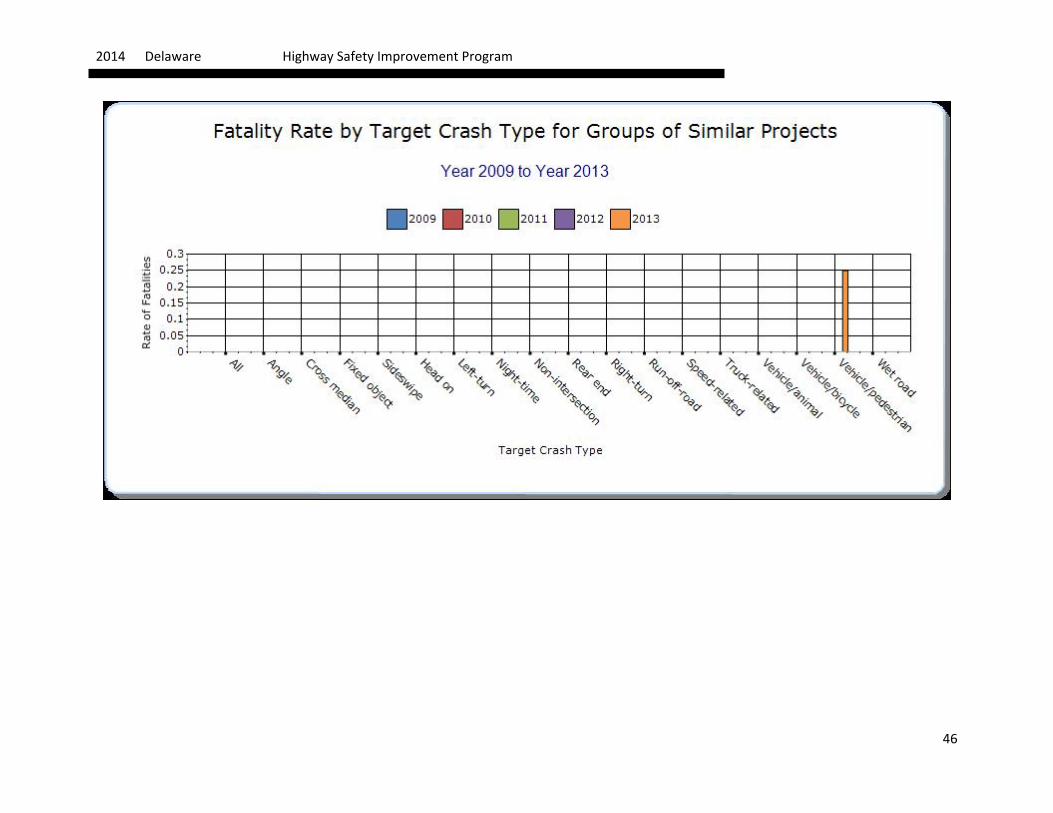
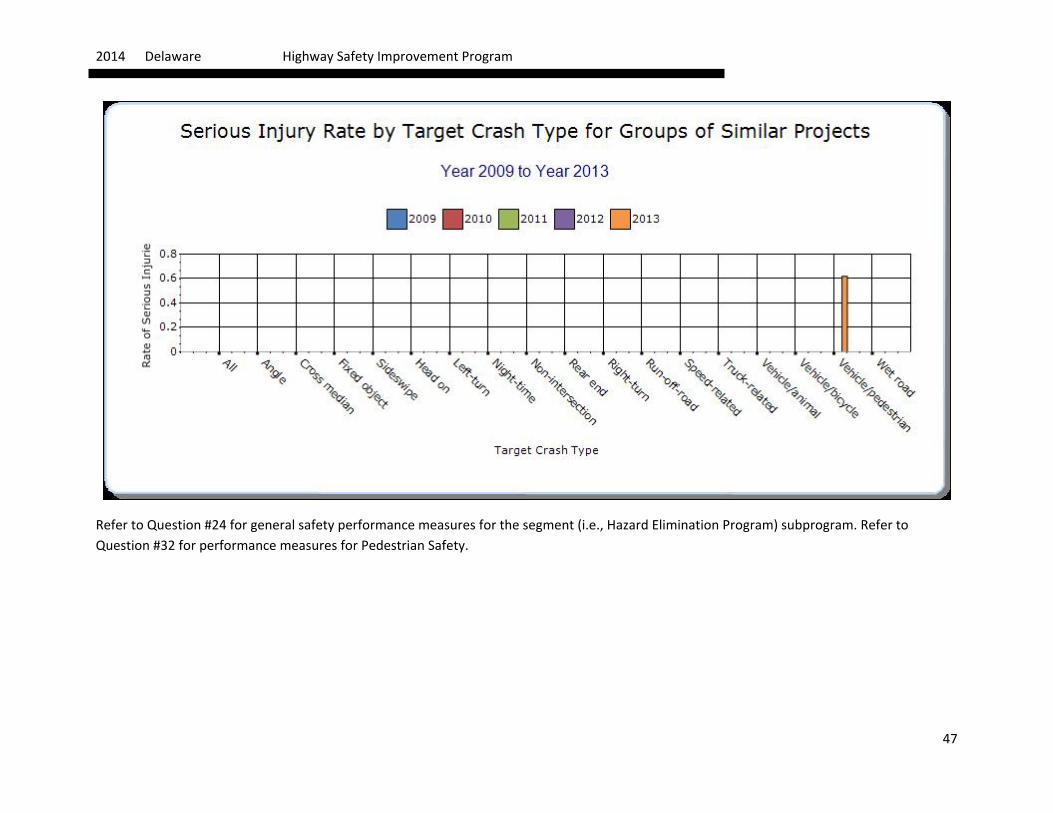
Groups of similar project types Present the overall effectiveness of groups of similar types of projects.
Year - 2013
HSIP Sub-program Types
Target Crash Type Number of fatalities
Number of serious injuries
Fatality rate (per HMVMT)
Serious injury rate (per HMVMT)
Other-1
Other-2
Other-3
Pedestrian Safety Vehicle/pedestrian 22 158 0.25 0.62 0 0 0
2014 Delaware Highway Safety Improvement Program
44
2014 Delaware Highway Safety Improvement Program
45
2014 Delaware Highway Safety Improvement Program
46
2014 Delaware Highway Safety Improvement Program
47
Refer to Question #24 for general safety performance measures for the segment (i.e., Hazard Elimination Program) subprogram. Refer to Question #32 for performance measures for Pedestrian Safety.
2014 Delaware Highway Safety Improvement Program
48
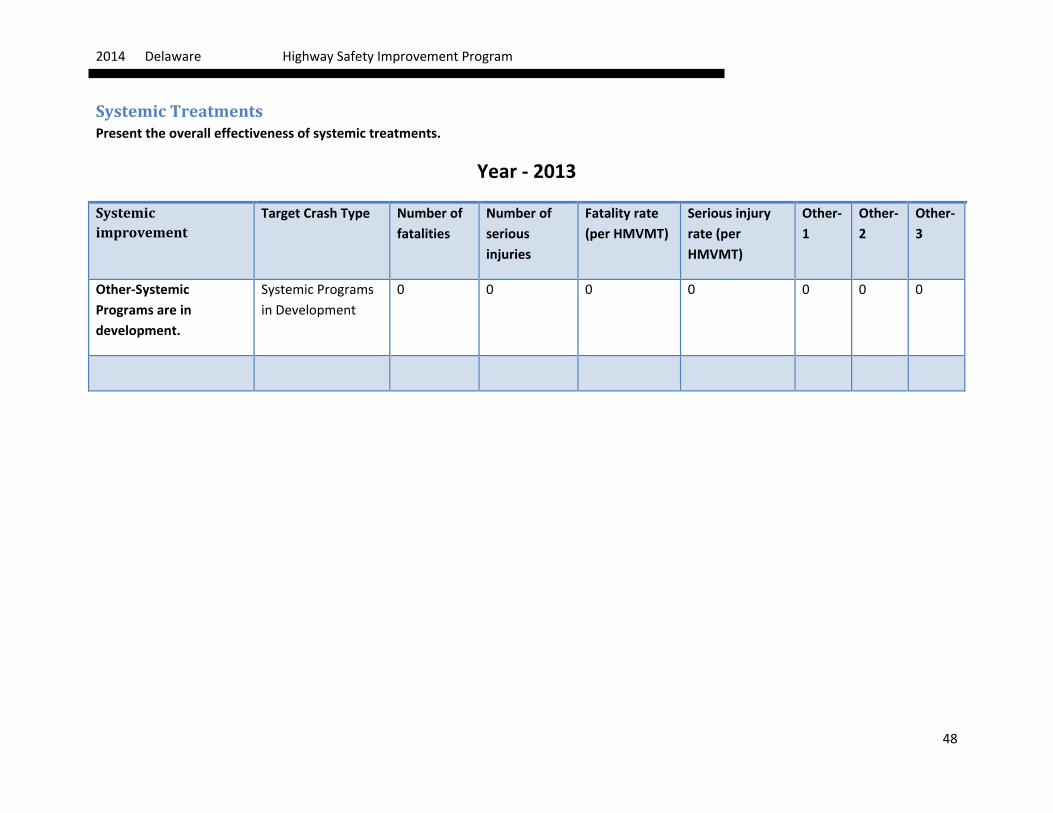
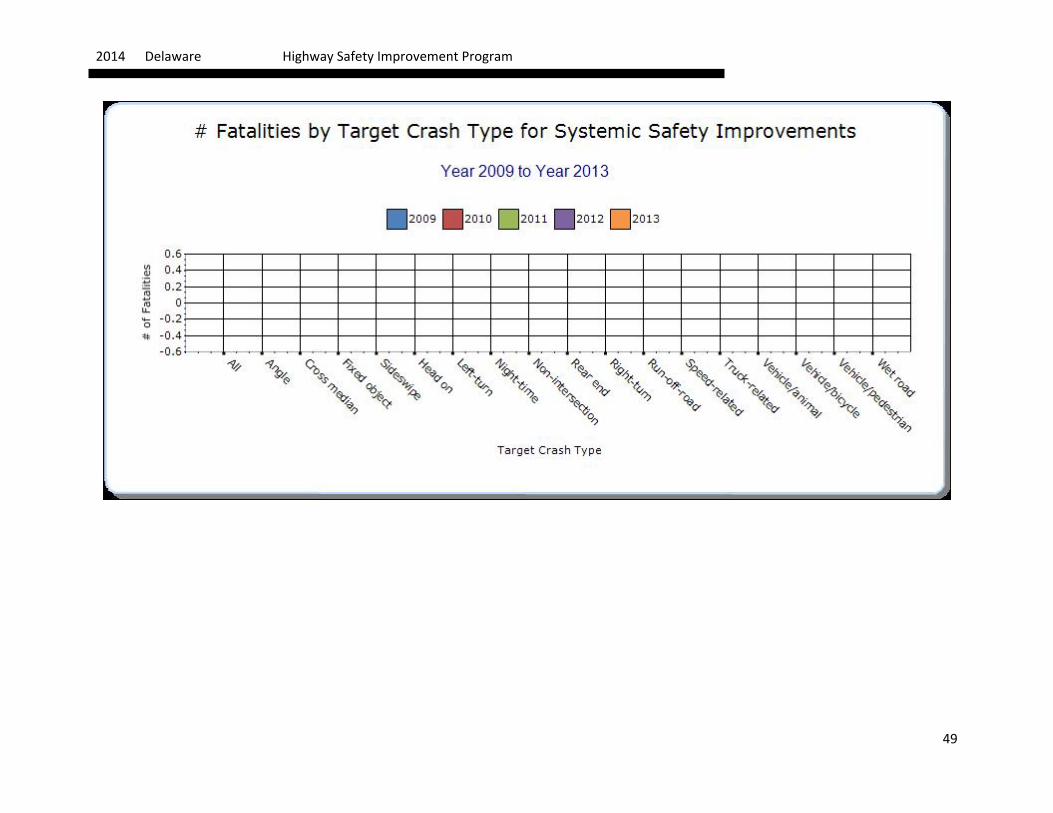
Systemic Treatments Present the overall effectiveness of systemic treatments.
Year - 2013
Systemic improvement
Target Crash Type Number of fatalities
Number of serious injuries
Fatality rate (per HMVMT)
Serious injury rate (per HMVMT)
Other-1
Other-2
Other-3
Other-Systemic Programs are in development.
Systemic Programs in Development
0 0 0 0 0 0 0
2014 Delaware Highway Safety Improvement Program
49

2014 Delaware Highway Safety Improvement Program
50
2014 Delaware Highway Safety Improvement Program
51
2014 Delaware Highway Safety Improvement Program
52

2014 Delaware Highway Safety Improvement Program
53
Describe any other aspects of the overall Highway Safety Improvement Program effectiveness on which you would like to elaborate.
No elaboration at this time.
2014 Delaware Highway Safety Improvement Program
54
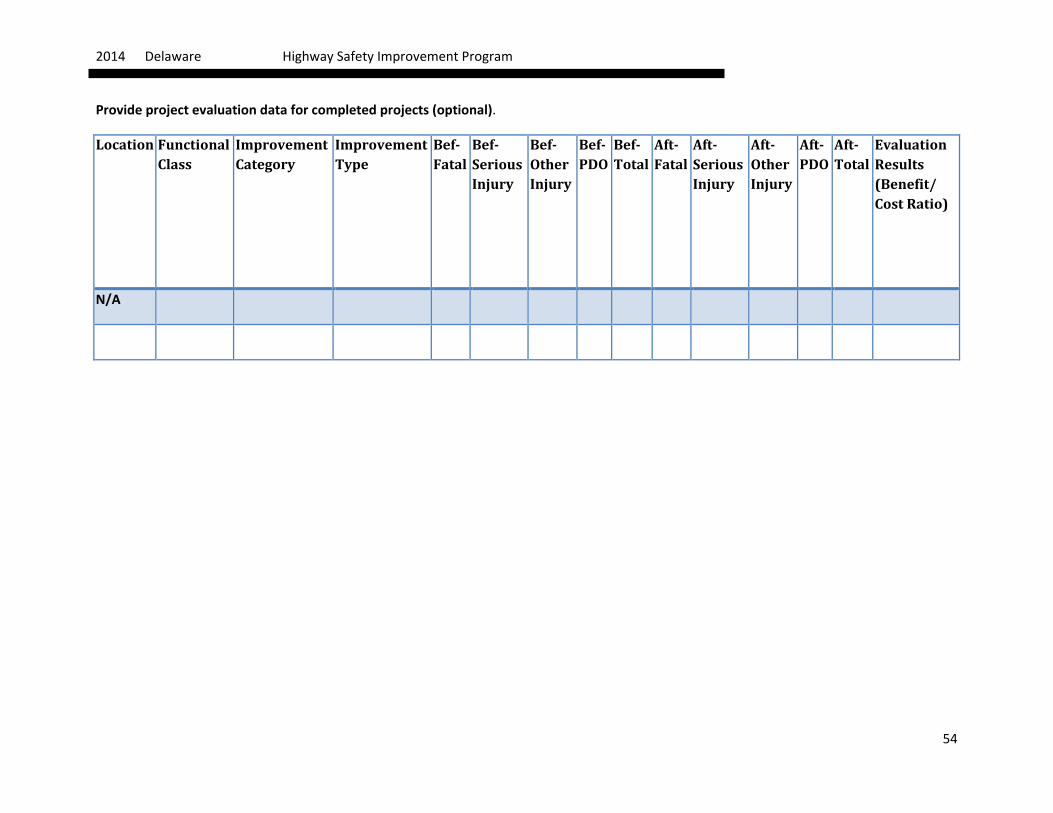
Provide project evaluation data for completed projects (optional).
Location Functional Class
Improvement Category
Improvement Type
Bef-Fatal
Bef-Serious Injury
Bef-Other Injury
Bef-PDO
Bef-Total
Aft-Fatal
Aft-Serious Injury
Aft-Other Injury
Aft-PDO
Aft-Total
Evaluation Results (Benefit/ Cost Ratio)
N/A
2014 Delaware Highway Safety Improvement Program
55
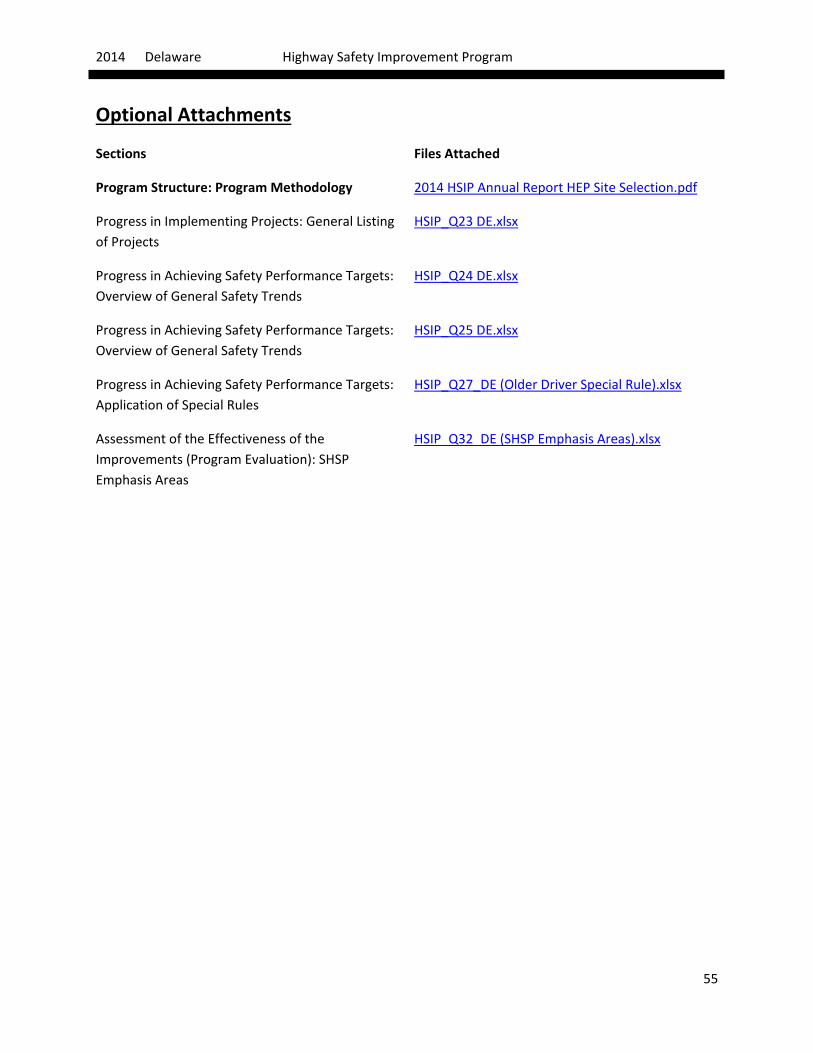
Optional Attachments
Sections Files Attached
Program Structure: Program Methodology 2014 HSIP Annual Report HEP Site Selection.pdf
Progress in Implementing Projects: General Listing of Projects
HSIP_Q23 DE.xlsx
Progress in Achieving Safety Performance Targets: Overview of General Safety Trends
HSIP_Q24 DE.xlsx
Progress in Achieving Safety Performance Targets: Overview of General Safety Trends
HSIP_Q25 DE.xlsx
Progress in Achieving Safety Performance Targets: Application of Special Rules
HSIP_Q27_DE (Older Driver Special Rule).xlsx
Assessment of the Effectiveness of the Improvements (Program Evaluation): SHSP Emphasis Areas
HSIP_Q32_DE (SHSP Emphasis Areas).xlsx

2014 Delaware Highway Safety Improvement Program
56
Glossary
5 year rolling average means the average of five individual, consecutive annual points of data (e.g. annual fatality rate).
Emphasis area means a highway safety priority in a State’s SHSP, identified through a data-driven, collaborative process.
Highway safety improvement project means strategies, activities and projects on a public road that are consistent with a State strategic highway safety plan and corrects or improves a hazardous road location or feature or addresses a highway safety problem.
HMVMT means hundred million vehicle miles traveled.
Non-infrastructure projects are projects that do not result in construction. Examples of non-infrastructure projects include road safety audits, transportation safety planning activities, improvements in the collection and analysis of data, education and outreach, and enforcement activities.
Older driver special rule applies if traffic fatalities and serious injuries per capita for drivers and pedestrians over the age of 65 in a State increases during the most recent 2-year period for which data are available, as defined in the Older Driver and Pedestrian Special Rule Interim Guidance dated February 13, 2013.
Performance measure means indicators that enable decision-makers and other stakeholders to monitor changes in system condition and performance against established visions, goals, and objectives.
Programmed funds mean those funds that have been programmed in the Statewide Transportation Improvement Program (STIP) to be expended on highway safety improvement projects.
Roadway Functional Classification means the process by which streets and highways are grouped into classes, or systems, according to the character of service they are intended to provide.
Strategic Highway Safety Plan (SHSP) means a comprehensive, multi-disciplinary plan, based on safety data developed by a State Department of Transportation in accordance with 23 U.S.C. 148.
Systemic safety improvement means an improvement that is widely implemented based on high risk roadway features that are correlated with specific severe crash types.
Transfer means, in accordance with provisions of 23 U.S.C. 126, a State may transfer from an apportionment under section 104(b) not to exceed 50 percent of the amount apportioned for the fiscal year to any other apportionment of the State under that section.