Embed Size (px)
Citation preview
NASA / CR-1999-209725
Delamination Modeling of
Improved Crash Analysis
Composites for
David C. Fleming
Florida Institute of Technology, Melbourne, Florida
National Aeronautics and
Space Administration
Langley Research CenterHampton, Virginia 23681-2199
Prepared for Langley Research Centerunder Grant NAG1-2061
October 1999
https://ntrs.nasa.gov/search.jsp?R=20000004186 2018-05-21T17:31:42+00:00Z

Available from:
NASA Center for AeroSpace Information (CAS1)7121 Standard Drive
Hanover, MD 21076-1320
(301) 621-0390
National Technical Information Service (NTIS)5285 Port Royal Road
Springfield, VA 22161-2171(703) 605-6000
Delamination Modeling of Composites
for Improved Crash Analysis
by
David C. Fleming, Assistant Professor
Aerospace Engineering Program
Florida Institute of Technology
ABSTRACT
Finite element crash modeling of composite structures is limited by the inability of
current commercial crash codes to accurately model delamination growth. Efforts are made to
implement and assess delamination modeling techniques using a current finite element crash
code, MSC/DYTRAN. Three methods are evaluated, including a straightforward method based
on monitoring forces in elements or constraints representing an interface; a cohesive fracture
model proposed in the literature; and the virtual crack closure technique commonly used in
fracture mechanics. Results are compared with dynamic double cantilever beam test data from
the literature. Examples show that it is possible to accurately model delamination propagation in
this case. However, the computational demands required for accurate solution are great and
reliable property data may not be available to support general crash modeling efforts. Additional
examples are modeled including an impact-loaded beam, damage initiation in laminated crushing
specimens, and a scaled aircraft subfloor structures in which composite sandwich structures are
used as energy-absorbing elements. These examples illustrate some of the difficulties in
modeling delamination as part of a finite element crash analysis.
°.,
I11
TABLE OF CONTENTS
1. INTRODUCTION ....................................................................................................................... 1
1.1. Composite Crushing Phenomenology .................................................................................. I
1.2. Previous Models of Laminate Crushing ............................................................................... 2
1.3. Dynamic Fracture .................................................................................................................. 4
1.3.1. Experimental Studies of Fracture Behavior ................................................................... 4
1.3.2. Finite Element Modeling of Dynamic Fracture ............................................................. 5
1.4. Delamination Modeling using Finite Element Crash Codes ................................................. 6
2. IMPLEMENTATION OF DELAMINATION MODELING SCHEMES IN MSC/DYTRAN..8
2.1. Force-Based Tied Connections ............................................................................................. 8
2.2. Cohesive Fracture Model .................................................................................................... 10
2.3. Virtual Crack Closure Technique ....................................................................................... 11
2.3. I, Crack Front Curvature ................................................................................................. 12
2.3.2. Mixed Mode Fracture ................................................................................................. 12
2.3.3. Implementation of VCCT in MSC/DYTRAN ............................................................. 13
3. APPLICATIONS OF DELAMINATION MODELS ................................................................ 16
3.1. Mixed-Mode Fracture ......................................................................................................... 16
3.2. Laminate Crushing Initiation .............................................................................................. 17
3.3. Sandwich Truss Fuselage Model ........................................................................................ 19
4. CONCLUDING REMARKS ..................................................................................................... 23
5. REFERENCES .......................................................................................................................... 25
iv
1. INTRODUCTION
If the results of finite element crash models can be viewed with confidence the potential
benefits are substantial. Physical crash testing of full-scale test articles is extremely costly, and as
a result the number of tests and the variety of conditions that can be studied is limited. Whereas
some of the benefits of crash modeling are beginning to be realized in certain applications, such as
the modeling of metallic automotive structures, the potential of crash modeling has not yet been
realized for composite structures. The material models available in the crash codes for composites
are less well developed than those for metals, and several important failure mechanisms cannot be
accurately modeled.
The present research addresses one portion of the composite crash simulation problem:
delamination modeling. Delamination can be a significant part of composite crushing behavior,
but procedures for modeling delamination growth are not established in finite element crash codes.
There is a substantial body of literature on delamination modeling, particularly for research in
fracture mechanics (see, for example, Reference 1). For finite element (FE) analysis of crash
behavior, however, there are serious limitations on the methods that may be used. Many
computational methods for predicting crack growth rely on accurate computation of forces,
stresses and/or displacements in close proximity to the crack front, requiring highly-refined
meshes. However, current finite element crash codes use explicit integration schemes that impose
severe cost penalties for small element sizes. A further problem relates to the dynamic nature of
the event. There is no generally accepted method for characterizing the properties of composite
materials under high loading rates, particularly when delamination is involved. The present
research studies the application of existing delamination modeling techniques for finite element
crash modeling. Procedures are implemented in a commercial explicit crash code,
MSC/DYTRAN. Several example problems are studied, including basic fracture tests as well as
examples more specific to crash modeling.
1.1. Composite Crushing Phenomenology
Application of crash modeling to composite structures requires an understanding of the
response of composites to crushing loads. To evaluate the basic crushing performance of
composite structures _, researchers crush simple structural specimens, such as hollow tubes [2-4],
or flat plate specimens supported against buckling in a stabilizing fixture [5,6]. Quasistatic crush
testing may be used to investigate the basic failure mechanisms, or for purposes of laminate
screening. Dynamic crush testing may be required to provide more realistic engineering data.
Due to a variety of scaling and geometric problems, the use of tube or plate crushing data for
design purposes is difficult, unless the geometry and.loading conditions in the test are close to
those that will be experienced under the expected crash conditions. However, several researchers
have demonstrated cases in which such component data have been used for design purposes [7-9].
A further use that may be made of experimental data resulting from the crush testing of simple
Such tests can not properly be called material tests because geometric factors associated with the specimenconstruction or testing have a strong influence on the results
composite components is to validate the performance of crash modeling techniques for composite
structures.
Various researchers have attempted to model the crushing behavior of composite
components, as described below in Section 1.2. A problem common to these models is the
following. Whereas physical crushing of composites is an extremely complicated event, including
fiber fracture, matrix failure, delamination, local instability, frictional effects, and virtually every
other failure mechanism within a single specimen, the practical realities of crash modeling require
that only a limited subset of the failure mechanisms be included in the model, or that the overall
failure be described in a simplified global fashion. Each of the various tube crushing models
describe here addresses this problem in some fashion, and a variety of solutions to the problem are
proposed.
1.2. Previous Models of Laminate Crushing
Several authors have studied composite crushing behavior using finite element models.
These models illustrate some of the challenges faced in this area, and emphasize some of the needs
for further research. The earliest finite element model of composite crushing behavior reported in
the literature was by Farley and Jones [10]. They used a quasistatic finite element model to predict
the crushing response of circular composite tubes. A primary feature of their model was ply
separation, which was predicted using a virtual crack extension technique. The method gave
reasonable correlation for the failure mode experienced by experimental specimens, but the
crushing stress was not well-predicted. Hamada and Ramakfishna [11] used a quasistatic finite
element model to study composite tubes that failed in a splaying mode whereby the laminate is
separated into two sublaminates that move apart from each other as crushing proceeds. Their
model utilized a mesh that was tailored to the experimentally observed crush geometry.
Propagation of the crack dividing the laminate was predicted from calculated stress intensity
factors. Each of these early models identified delamination or separation of plies as one of the key
controlling factors governing the performance of composites under crushing loads.
Perhaps due to the nature of current finite element crash codes, many of the more recent
efforts to model the crush behavior of composites have focused less on the role of delamination,
but have instead relied heavily on in-plane failure models. Several efforts at modeling composite
crushing behavior have utilized an in-plane "damaging" model. Pickett et al [12] describe such a
model, as implemented in the FE crash code PAM-CRASH, for random short-fiber composites.
By this model, a scalar damage parameter is defined as a function of the strain invariants. The
modulus is reduced according to the value of the damage parameter. Subsequent development of
this concept has resulted in a so'called bi-phase model applicable to unidirectional composites
[13], and a similar model applicable to fabric composites [14]. Material properties used by these
models are derived from tensile and sometimes compressive coupon tests. Despite the limitations
in the amount of crushing phenomenology captured by these models, some crush models have
been made using these or similar failure models as their foundation.
Haug et al [I3] model the failure of composite tubes using the bi-phase model. For a
brittle column under crushing loads, the model predicts severe global failure rather than
progressive crushing. For a hybrid graphite/Kevlar column, a local buckling failure mode is
predicted.For thesespecimens,however,failurewasdominatedby failureof the specimen
comers, and little laminate crushing was observed. Kohlgrtiber and Kamoulakos [14] modeled the
crushing of composite tube segments and test specimens comprised of intersecting flat panels
using in-plane damaging models. While the models predict the appearance of progressive damage
at the specimen ends, it is not clear that the phenomenology of the failure mode in the model
corresponds to that of the tests. Modeled crushing loads were typically below the levels of the
experiment, which the authors attribute to "deficiencies in the ...model and failure mechanisms..."
In particular, "delamination and separation of individual plies...could not be modeled." [14]
Castej6n et al [16] show a model of tube crushing based on in-plane failure properties. Results are
presented for pultruded glass fiber composite tubes. Computed energy absorption values areshown to be within about 15% of experimental results. However, almost no details about the
modeling techniques are given. Philipps et al [17] present a similar model of a composite tube.
In-plane properties are derived from dynamic tension testing of coupons using a laser-based local
strain measuring technique. The failure mode appears to be a progressive folding mode. Although
experimental results are not presented, the authors claim good agreement with experiment. They
note, however, that currently available material models are not adequate for predictive analysis of
composite components in a crash analysis. Feillard [18] developed tube crushing models for glass
fiber mat composites. This effort focused on using high speed tensile tests to determine material
properties for use in the FE model. An in-plane damaging model similar to that described in
Reference [12] is used to model these low volume fraction glass fiber mat structures. Some
material properties not obtainable from the tensile tests were derived from a representative tube
test. These parameters were then fixed for the remaining models. Good correlations in the load
displacement curves were obtained between the experiments and the computations.Several of these researchers and others recognized the importance of delamination in the
crash behavior and attempted to address this topic in their models. Haug et al [13] modeled the
crushing of a tube made with a sandwich construction. By allowing failure of the core, separation
of the outer and inner facesheets is modeled. Good correlation between computed and
experimental load-displacement curves is found. Kerth et al [15] modeled the crushing of
composite tubes formed by bonding hat stiffeners back-to-back. Failure of the bond was modeled
in DYNA3D using a spotweld technique, and a reasonable correlation with experiments was
obtained. Kohlgriiber and Kamoulakos [14] made some preliminary investigations of modeling
delamination growth as part of a model of circular segment specimens. In addition to the studies
described above, Feillard [18] modeled foam-filled specimens. An investigation was made of the
influence of the failure of the foam-composite interface. Correlations with experiments showed
that for the specimens under study an assumed perfectly-bonded interface gave better results than
either of two interface modeling techniques, and the matter was not pursued further.
While the modeling efforts described above present advances in modeling composite
behavior, these models are not sufficiently general to accurately predict the response of even as
"simple" a structure as a composite tube 2. Many of the models described above identified
2 Another method for modeling the crash behavior of composite structures was proposed by Johnson [19].
He suggested a hybrid modeling approach for modeling the behavior of complex composite structures. The responseof crushable composite members may be modeled by simplified elements such as nonlinear springs, while the rest ofthe structure which may be subject to more well-characterized failure modes may be modeled in detail. Such a
model, obviously, relies on the availability of relevant crush test data for the members in use, and as such does not

delaminationasa critical partof thecrushingresponse.Varioustechniqueswereusedin thesemodelsto describedelaminationbehaviorusingexistingmodelingcapabilitiesof thefiniteelementcrashcodes.However,thereis aneedto betterunderstandthecapabilitiesof modelingdelaminationgrowthaspartof acrashanalysisof compositestructures.In additionto the intrinsicdelaminationbehaviorevidentin laminatecrushing,compositestructuresmay includeadhesivelybondedjoints anddisbondingof suchjoints maycontributesignificantlyto the globalresponseofthestructureundercrashloads.
1.3. Dynamic Fracture
There is a substantial research history on modeling dynamic fracture behavior, includingdynamic delamination growth in composites [20]. Much of this work has been directed toward
detailed modeling of conventional fracture specimens, for the purpose of assisting the
determination of critical fracture parameters and studying phenomena such as crack arrest.
Because oft he specialized purpose of these models, and their relatively simple geometry, highly-
refined mesh geometries may be used to obtain accurate results. In the context of such a research
program, the computational expense associated with such modeling techniques is appropriate, anddoes not pose serious limitations in time or computational cost. In the context of finite element
crash modeling, which typically involves complex geometries, and orders of magnitude greater
numbers of elements and nodes, computational expense associated with delamination modeling
may impose a substantial additional burden on the modeling effort. Therefore, modeling
techniques that avoid or minimize the extreme mesh refinement used in the fracture mechanics
models may be necessary. The following sections review previous work in dynamic delamination
growth modeling. Emphasis is placed on areas relevant to the applications to crash modeling thatfollow.
1.3.1. Experimental Studies of Fracture Behavior
Effective modeling of deiaminati0n propagation is a Substantial challenge, particularly for
dynamic loading conditions. Some of the computational difficulties are reviewed by Leibowitz
and Moyer [21] and relate to the physical nature of the fracture event. To illustrate the difl_culties,some experimental results from the literature pertaining to crack propagation under static and
dynamic loading conditions for both metallic and composite materials are presented here.
Irwin [22] provides an overview of dynamic fracture behavior in metals. Irwin contends
that crack propagation is a result of"Iocally discontinuous increments of crack extension"
occurring on a small scale. Thus, the concept of crack speed, as defined experimentally, results
from an average of these discontinuous, small-scale events. Conventional finite element models of
crack propagation, due to their discretized nature, similarly represent crack propagation by
averaging intervals of crack extension (though on an element scale, instead of the atomic scale
realize the full potential of crash modeling techniques. However, this technique may prove valuable until moregeneral modeling techniques for composite structures are available.
identified by Irwin). Issues relating to crack velocity present some of the greatest difficulties for
fracture modeling. Using Double-Cantilever-Beam (DCB) specimens, Kanninen et al [23]
determined that the energy required for crack growth depends upon the crack speed. This point
has serious implications for efforts to model crack propagation behavior, because material
property data may therefore be difficult to obtain. While Kanninen's work was based on metals, a
similar dependence of toughness on crack velocity was found for graphite/epoxy composites by
Thesken [24]. In addition to potential variations in toughness as a function of crack speed under
propagation, Blackman et al [25] show that the critical energy release rates for delamination
initiation may vary as a ftmction of loading rate for certain composite systems.
Additional rate-dependent fracture effects for composite materials have been reported by
various researchers. Gillespie et al [26] show stick-slip fracture behavior (periods of unstable
crack growth followed by periods of subcritical crack growth) in graphite/PEEK DCB specimens.
Among the range of loading rates they used (0.25 - 250 mm/min) the graphite/epoxy specimens
showed virtually no change in Gic, whereas Graphite/PEEK showed significant variations over this
range. This is similar to results reported by Blackman et al [25]. Using dynamically loaded Mode
II End-Notched-Flexure (ENF) fracture tests, Smiley and Pipes [27] showed that Critical Mode II
energy release rates dropped significantly at higher loading rates for graphite/epoxy composites.
Further difficulties with composites result from differences in fracture behavior for interfaces with
varying ply orientations. Whereas standard fracture tests typically use unidirectional laminates, a
different response may be found for interfaces between dissimilar ply angles. Trakas and
Kortschot [28] determined that critical energy release rates for Modes II and III, G_c and Gmc, are
structural properties depending upon ply orientations at the interface. The problem of fracture
along bimaterial interfaces has been studied by several researchers (see, e.g., Reference 29) and
has some ramifications for computational modeling, as discussed below.
1.3.2. Finite Element Modeling of Dynamic Fracture
One of the chief difficulties in finite element modeling of fracture propagation is to
properly represent the effectively continuous process of crack propagation using a discrete model.
Researchers have handled this problem in a variety of ways, as described below.
Early work in finite element modeling of crack propagation was made by Kobayashi,
Emery and Mall [30,31]. The material they studied was Homalite-100, a material used for
photoelastic stress analysis. They used 2-D mesh of elements with the fracture plane lying on a
boundary of the model due to symmetry conditions. Crack growth was modeled by releasing
nodal constraints at predetermined times corresponding to a predetermined crack velocity. Energy
release rates were calculated by a crack opening displacement (COD) method. The abrupt release
of nodal constraints resulted in significant spurious oscillations in the stress and dfsplacement near
the crack tip, requiring the use of an averaging technique to calculate fracture parameters.
However, they were able to obtain results in reasonable agreement with experiment, despite using
a relatively coarse mesh. Yagawa et al [32] developed an approach to avoids the problem of
abrupt nodal release. They made a similar 2-D model of constant (prescribed) velocity crack
propagation. A Lagrangian multiplier approach is used to apply effective surface tractions over
only the attached portion of the element boundary near the location of the crack front, which does
not necessarilycoincidewith anodalposition. Thestrongoscillationstypical of abrupt release of
nodal constraints are eliminated. Another early paper addressing problems with abrupt release of
nodes in a crack propagation model is provided by Keegstra et al [33]. To provide an energy sink
during crack growth, which is not available in Kobayashi's model, a diminishing "holding back"
force is applied at crack tip nodes following release. This also reduces spurious stress wave effects
associated with finite jumping of crack lengths. The magnitude of the holding-back force is
proportional to the ratio of the time-averaged displacement of the node and some critical
displacement. For a model in which a crack is initially joined by rigid connections, there is no
intrinsic mechanism for energy to be removed from the system following crack extension, and
these so-called "holding back forces" are used for this purpose. Rydholm et al [34] propose a
similar holding-back force.
For delamination of composites, finite element models may use similar constraints to join
elements on opposite sides of an interface. An early example of this modeling approach for
composites is by Sankar and Hu [35]. In this work, a laminate is modeled using beam elements to
represent sublaminates. Springs act as the interface between sublaminates. Crack growth, is
simulated by breaking the crack-tip springs. The use of springs as opposed to rigid constraints
obviates the need for holding-back forces as a means of energy dissipation. However, the dynamic
response of the model due to the abrupt release of nodal constraints may still introduce problems.
Wang and Williams [36] present a finite element model based on a similar stacked sublaminate
approach. They model crack propagation by releasing nodal constraints, and therefore must
include holding back forces as energy sinks. Problems associated with abrupt nodal release are
discussed. "Stress waves generated from nodal releases will reflect between the two ends of the
beam..." and "generate a large amount of kinetic energy and strain energy en route." For their
approach, they could maximize the effect by setting the holding back force to zero, and a test case
was run whereby a clamped boundary condition was abruptly removed. The resulting
displacements were highly oscillatory. The use of holding back forces apparently reduced this
effect. Their conclusions cite their work as being essentially a verification of Keegstra's method
[33]. An earlier paper on this method [37] references Rydholm [34], and uses a similar approach
with a holding-back force that "damps oscillations due to nodal releases, while producing a tip
energy sink." Among the geometries studied in this paper is the DCB specimen. They suggest
that some of the wave effects observed in the model are real and represent overshoot and
undershoot of the relatively free DCB arms rather than from any nodal release oscillations. This
causes energy release rate values to rise and fall compared to the static solution for a constant
speed crack propagation. Wang and Williams [38] use a similar model to study isotropic DCB
specimens under dynamic loads. Effects due to dynamic overshoot are largest for large starting
crack lengths, and disappear for cracks starting from an initial length approaching zero.
Oscillations in the energy release rate, G, are cited as the source of stick-slip behavior commonly
observed in DCB specimens.
1.4. Delamination Modeling using Finite Element Crash Codes
Three methods for modeling delamination growth in the context of crash analysis have
been reported in the literature. These are: 1) failure models based on the forces applied through
elements or constraints holding an interface together [14,15], 2) a similar approach using a

cohesivefailure modelto predictinterfacefailure [40] and3)usingaVirtual crackclosuretechnique(VCCT) similar to that employedin fracturemechanicsresearchapplicationsasdescribedabove(thisapproachwasusedby theauthorin theworkuponwhich this researchprogramis based[39]). Eachof thesemethodshassomeadvantagesin thepresentcontext,aswellassomedrawbacks.Theforce-basedmethodis theeasiestto apply. Dependingon thefailure lawusedto predictdelamination,no specialmodificationto existingprogramcodesmayberequired.It is notclear,however,howthe failurepropertydatamaybeobtainedfor suchatechnique,otherthanthroughdirect correlationwith experimentaldata. Thismayrenderthis techniquelessgeneralthandesiredfor useasapredictivetool. Also, if rigid connectionsareusedto model theinterface,issuesrelatingto energydissipation,asdiscussedabove,maybeimportant. Thecohesivemodelingapproachcanbeappliedalmostassimply astheforce-basedmethod.Onedrawbackto thecohesivemodelis that someneededmaterialpropertiesaredifficult to obtainfrom conventionalexperimentaldata. TheVCCTtechniquecanprovideaccurateG calculation, if
the mesh is sufficiently well refined. The required properties are readily obtained by conventional
techniques in fracture mechanics for quasistatic loading, though obtaining dynamic properties is
still not so easy. However, while VCCT requires less mesh refinement than finite element
methods that attempt to capture the behavior of a crack-tip singularity, the amount of refinement
required may be substantially greater than that otherwise used for crash analysis. Each of these
methods is studied in Chapter 2.
7
2. IMPLEMENTATION OF DELAMINATION MODELING SCHEMESIN MSC/DYTRAN
Delamination modeling schemes were implemented and studied using a finite element
crash code. MSC/DYTRAN was selected based on the author's experience and for commonality
with the funding agency. Pre- and post-processing was performed using MSC/PATRAN and by
direct manipulation of the output files. Because the present research is strictly computational in
nature, results from the literature were used to provide the correlation with experimental results.
The first portion of the research involved studying the delamination modeling methods
most applicable to crash modeling, as described in Section 1.4. The double cantilever beam
(DCB) geometry was chosen for this purpose due to its simplicity and because of the presence of
clear experimental results from the literature. Results of the computational models were compared
with experimental results from dynamic DCB tests conducted by Blackman et al [25]. DCB
specimens comprised of unidirectional graphite/epoxy laminates bonded with an epoxy film
adhesive were studied for the following examples. Sublaminates were modeled with uniform
meshes of solid or shell elements. Based on test cases which showed small sensitivity of the
computational results to width effects, the full width of the DCB specimens was not modeled in
most cases. Instead, a single element was used in the width direction. Symmetry boundary
conditions were applied to the sides of these models. This provided a substantial improvement in
computational time. Material properties for the laminates were obtained from Reference 25 and
from typical values from the literature for data not included in Reference 25. Because laminate
failure was not observed in the tests, linear elastic material properties were used for the laminates.
Details of each of the models specific to the technique being used are presented with the results,
below. Following the initial evaluations using the DCB specimen geometry, models of
delamination propagation under more complex loadings were performed, as described in Chapter3.
2.1. Force-Based Tied Connections
By this method, as described by previous researchers in References 14 and 15, nodes on
opposite sides of an interface where delamination is expected are tied together using any of a
variety of methods including spring elements or rigid rods. If the forces produced by these
elements exceed some criterion, the constraint is released. Crash codes include 1-D element types
such as spotweld elements, breakable joints or other constraint types that may be adapted for this
purpose. Two methods are available in MSC/DYTRAN for this type of constraint. The spotweld
(PWELD) property may be used with 1-D rod (CROD) elements [41 ]. It is a rigid connection,
with failure determined by several uncoupled criteria,. (tension force, compression force, bending
moment, etc.). No interaction between loading components is allowed, and there is no built-in
potential for user-defined failure properties using this method. A similar constraint may be
applied via the Breakable Join (B JOIN) card [41]. This joint may only be applied to grid points
connected to one-dimensional elements or shell elements. B JOIN allows greater freedom in
failure definitions, including the possible use of a user-defined subroutine to define failure.
8
Interaction between failure modes may be a requirement for a model intended to represent
delamination failures, as critical energy release rates may differ significantly for different fracture
modes. In Reference 14, the failure law used is:
eN +t,Fs,) =l
where FN and FS are the normal and shear forces in the rigid connection, FNc and FSc are failure
loads for normal and shear forces, and aN and as are parameters governing the interaction between
the failure modes. This criterion is essentially similar to that used in Reference 15.
For the case of a pure Mode I DCB problem, the shear forces are expected to be zero and
the failure criterion reduces to a simple maximum force type criterion that may be easily applied
using either PWELD or B JOIN elements. As a demonstration of this method, a DCB model was
made using solid elements, and the PWELD material property in MSC/DYTRAN. A mesh size of
lmm x lmm was used in the plane of the interface, and the geometry and material properties for
the model were set to allow comparison with dynamic double cantilever beam results reported by
BIackman et al [25]. The only difficulty, then, is to select an appropriate failure 10ad FNc to
govern failure of the interface. As a starting point, the critical load was estimated from typical
properties of epoxy as follows:
Fu, z c ui,A,,
where A e is the interface area modeled by the spring element and o',lt is the strength of the epoxy.
Because strength properties for the epoxy used in Reference 25 were not available, a typical value
of o',k of 80 MPa was used. This yielded a value of 0.08 kN for FNc. Several runs of this DCB
model were conducted using values of this parameter spanaling approximately an order of
magnitude. These results illustrate the sensitivity of the delamination propagation to this
parameter. Results are shown in Figure 1, and are compared with dynamic fracture results from
the literature [25].
Although the computational results for the force-based failure criterion show sensitivity to
the selection of the failure load, FNo they are in reasonable agreement with the experiment for
values of FNc around the approximate value chosen based on the strength of the adhesive. For
FNc equal to 0.08 kN, the initiation time is within 22% of the experimental results, and the time to
complete separation of the laminate is within 5% of the experiment. Some of the physical
behavior of the experiment is not captured by this model, including the period of crack arrest
starting at about 1.8 ms.
The primary disadvantage of this method is that there is no strong physical basis for
determining the failure forces. The force at a crack tip is not accepted as being a good indicator of
the stress state around a crack front. A further difficulty with the method is the abrupt release of
nodal forces at an effectively rigid constraint. This does not remove energy from the system, as is
required for an accurate model of delamination propagation. Also,...... because of the rigid
connection, it is anticipated that problems due to spurious dynamic effects resulting from discrete
crack growth and the abrupt release of nodal forces will be maximized. Some of these problems
are overcome by the cohesive fracture model, described in the following section.
2.2. Cohesive Fracture Model
This method, described by Reedy et al [40], is similar to the simple tied connection models
described in the previous section. However, instead of relying on simple spring properties theforce-displacement response of the interracial elements is based on classical cohesive failure
behavior, as shown in Figure 2. Properties defining this failure law are obtained from the
conventional critical energy release rates, and from harder-to-obtain cohesive zone length or
maximum force. Reedy et al [40] implemented this model in PRONTO3D using a special hex
element. The cohesive failure model approach is similar to previously described earlier fracture
models that use "holding back" forces [33,34] to avoid abrupt nodal release and to remove energy
from the system upon crack extension.
To implement the cohesive failure model proposed by Reedy et al [40] into
MSC_YTRAN a user-defined spring property EXELAS was written to provide stress-separation
response in interracial spring elements according to Figure 2. This subroutine is included in
Appendix A. The cohesive failure model was tested using DCB models essentially similar to
those described in the previous section, except that CELAS 1 spring elements referencing the
cohesive model EXELAS subroutine are substituted for the CROD elements. Due to the simple
geometry and loading of the DCB specimen, ordy springs in the Mode I orientation were included.
As can be seen from Figure 2, the cohesive failure model requires two parameters to define the
curve. Reedy et al [40] define the area under the curve for u c < 8 < Um_, as the critical energy
release rate. The second parameter must be either uc, Um_, or some relationship between these two
quantities. Needleman [42] suggests Um_x = /9_._, where q0_ is the work of separation. This
results in Um_xon the order of uc for the properties used in the present model. Reedy et al used
values of Urn,x typically tWO orders of magnitude greater than u¢. Figure 3 shows results from the
MSC/DYTRAN model of dynamic DCB behavior based on the cohesive failure model for two
loading rates. For these cases, G¢ was taken from experimental results in Reference 11. _"So was
taken to be 10. Results for the cohesive failure model are mixed. At the slower opening
displacement rate in Figure 3, the crack growth is well-predicted in an average sense although the
stick-slip behavior evident in the experiment is not captured by the finite element analysis. At the
higher loading rate the experiment is well modeled for initiation and the initial portion of the
propagation response, but the computed results deviate from the experiment at about one half of
the total delamination length.
Reedy et al [40] report that results are mesh size-independent, provided the element length
is sufficient to cover the size of the cohesive zone. These results were verified using the present
model. For DCB specimens loaded with a constant opening displacement of 23 m/s, FEA results
for four mesh sizes are given in Figure 4. The cohesive zone size was observed to be
approximately 2 mm in length, and results for mesh sizes below this value are nearly identical.
Failure properties for the cohesive model include the critical energy release rate as well as
a second parameter defining the size of the cohesive zone. Because values of Um_,, Uc, or _c are
not easily established from experimental data, the sensitivity of the results to the choice of
_"/,_, were investigated. Using a constant value of G c, u_o was varied from 5 to 1000. Results
are shown in Figure 5. As the ratio increases, the results converge to a consistent result with little
difference observed between values of this ratio of 100 and 1000 for a fixed mesh size of 1mm x
10
1mm. For lower ratios, the size of the cohesive zone approached the element size, influencing the
results. Examination of force output data shows that for the cases represented above, when
_*'_Scwas 100, the length of the cohesive zone was approximately four element lengths, for
_'_ = 10, the length of the cohesive zone was approximately two elements, and for _'"S_ = 5,
the length of the cohesive zone was indeterminate, but may have been one element length or less.
In the absence of the experimental data about the cohesive zone size, these failure parameters
should be chosen to promote a large cohesive zone. This will minimize the requirement for meshrefinement.
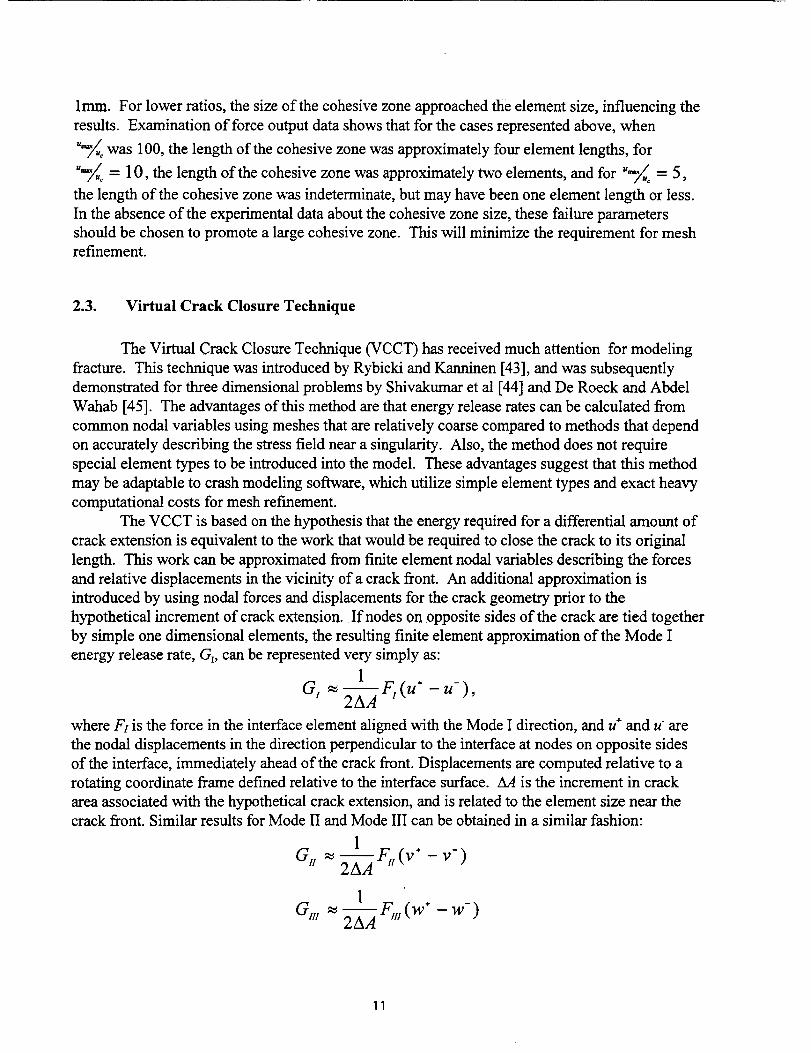
2.3. Virtual Crack Closure Technique
The Virtual Crack Closure Technique (VCCT) has received much attention for modeling
fracture. This technique was introduced by Rybicki and Kanninen [43], and was subsequently
demonstrated for three dimensional problems by Shivakumar et al [44] and De Roeck and Abdel
Wahab [45]. The advantages of this method are that energy release rates can be calculated from
common nodal variables using meshes that are relatively coarse compared to methods that depend
on accurately describing the stress field near a singularity. Also, the method does not require
special element types to be introduced into the model. These advantages suggest that this method
may be adaptable to crash modeling software, which utilize simple element types and exact heavy
computational costs for mesh refinement.
The VCCT is based on the hypothesis that the energy required for a differential amount of
crack extension is equivalent to the work that would be required to close the crack to its original
length. This work can be approximated from finite element nodal variables describing the forces
and relative displacements in the vicinity of a crack front. An additional approximation is
introduced by using nodal forces and displacements for the crack geometry prior to the
hypothetical increment of crack extension. If nodes on opposite sides of the crack are tied together
by simple one dimensional elements, the resulting finite element approximation of the Mode I
energy release rate, GI, can be represented very simply as:
1G, ._ --F,(u ÷ - u-),
2AA
where FI is the force in the interface element aligned with the Mode I direction, and u ÷ and u" are
the nodal displacements in the direction perpendicular to the interface at nodes on opposite sides
of the interface, immediately ahead of the crack front. Displacements are computed relative to a
rotating coordinate frame defined relative to the interface surface. AA is the increment in crack
area associated with the hypothetical crack extension, and is related to the element size near the
crack front. Similar results for Mode II and Mode III can be obtained in a similar fashion:
1a,, _--F,,(v ÷ -v-)
2AA
1G11, _Fl,,(w ÷ - w-)
2AA
11

where v and w are defined as displacements relative to the interface in the Mode II and Mode III
directions, respectively. The accuracy of these energy release rate computations increases as AA
decreases. Some early uses of this method for modeling composite delamination growth are
presented by Sankar and Hu [35] and by Sun and Pandey [46]
Issues identified by previous research relating to the use of the virtual crack closure method
are reviewed the following sections. These reviews emphasize problems and concerns relevant to
the present research. Following this section, the application of the VCCT to MSC/DYTRAN is
presented.
2.3.1. Crack Front Curvature
For propagating cracks, the shape of the crack front may not remain uniform. Even for the
relatively simple case of a composite DCB specimen, it is well known that the crack front will
become curved during propagation [47] and that the amount of curvature may relate to the global
specimen geometry [48]. This presents a problem for the VCCT because the formula for
calculating energy release rates presume that the mesh is perpendicular to the crack front. While
an finite element mesh can be readily made perpendicular to any starting crack geometry, under
propagation the crack front is likely to deviate from any fixed mesh geometry. This problem is
addressed by Salpekar et al [49] who model delamination growth between a matrix crack in an
angle ply and the free edge. Because delamination progresses for this case in a uniform mesh over
a wedge shaped area, the mesh is inherently not perpendicular to the delamination front. They
acknowledged that this introduced error in their calculations, and used the results for qualitative
comparison of fracture modes only. Klug and Sun [50] modeled the propagation of an initially
circular delamination in a laminate under compressive loads. They used a mesh regeneration
scheme to redefine the mesh following each instance of delamination growth to account for the
changing shape of the delamination. Such mesh redefinition may be the most effective solution to
this problem, but it is not currently feasible for implementation in the present research. Thus, the
application of this method described below may be most applicable to models in which the crack
front may be presumed to progress in a predictable fashion, such as might be experienced in
skin/stringer debonding or similar situations 3.
2.3.2. Mixed Mode Fracture
A further problem relating to the modeling of delamination growth in composites relates to
mixed-mode behavior. It is well documented that delamination response depends on the manner
of the loading. Critical energy release rates may be different for different modes. Further, for
mixed mode fracture cases, fracture criteria are difficult to establish for any particular material
3 Raju et al [51] used the VCCT to analyze energy release rates in skin-stringer configurations. For a skin-
stringer model, in which the stringer had a prominent blade (T shape), the total energy release rate was fairly constantacross the width of the flange, but increased significantly under the blade due to the increased stiffness. Thus, care
must be taken when predicting delamination propagation to ensure that appropriate locations are used to predict
growth.
12
system. Computationally, there are also problems in computing energy release rates for each of
the fracture modes using the VCCT for general composite laminates. Atkinson [52] reviews the
problem for a general cases of a crack at a bimaterial interface. The stresses and displacement
solutions become oscillatory as the crack front is approached. When the VCCT is used to
calculate energy release rates at a bimaterial interface, a convergent solution for the energy release
rate components individually may not be obtained, though the total energy release rate will
converge [53]. For composite materials, while this problem will not be evident in the analysis of
common single mode fracture specimens which utilize unidirectional laminates, it may prevent
obtaining accurately partitioned energy release rates for general laminate interfaces. This problem
is identified in work by Sun and Pandey [46] on general split beam problems and Zheng and Sun
[54] on impact-induced delaminations. Beuth and Narayan [55] demonstrated a modified VCCT
technique that yields mesh size independent results for individual fracture modes if the
sublaminates can be modeled as in-plane orthotropic materials with one principal axis aligned withthe crack front.
In summary, two problems relating to mixed-mode delamination behavior are: 1)
computationally, it may be difficulty to obtain reliable mode partitioning for general laminate
interfaces, and 2) there is not reliable experimental data on the influence of mixed-mode fracture
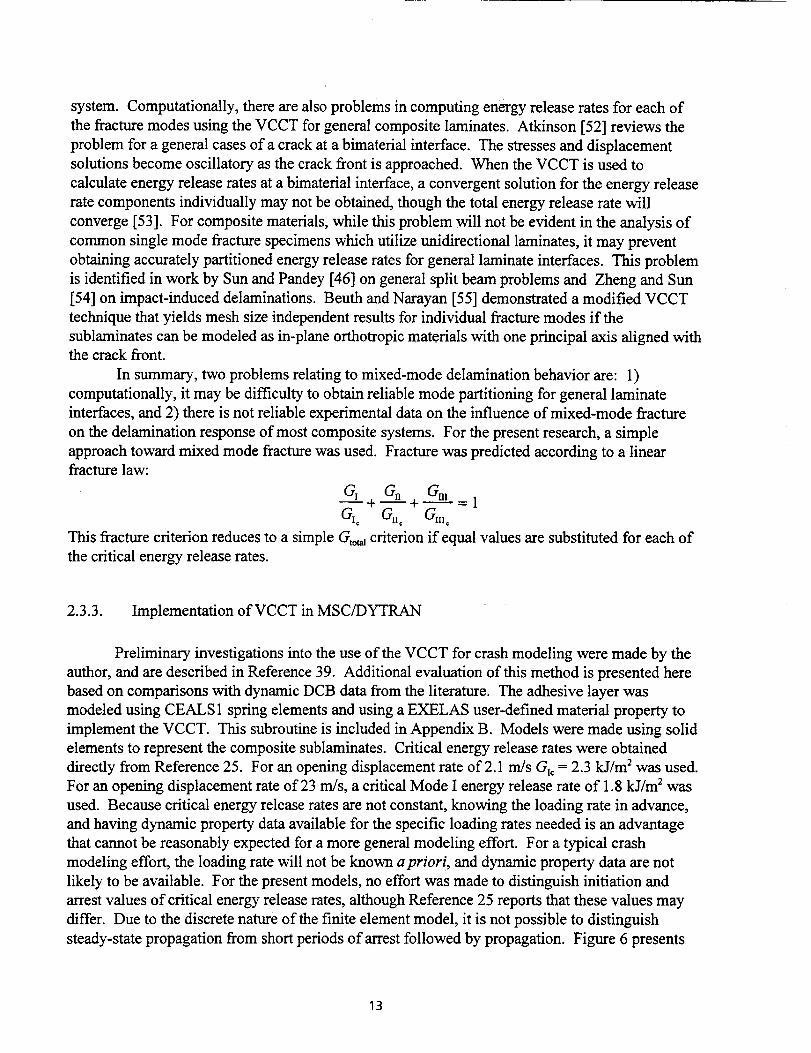
on the delamination response of most composite systems. For the present research, a simple
approach toward mixed mode fracture was used. Fracture was predicted according to a linearfracture law:
G, Gm+--+ -I
This fracture criterion reduces to a simple Gtot_ criterion if equal values are substituted for each of
the critical energy release rates.
2.3.3. Implementation of VCCT in MSC/DYTRAN
Preliminary investigations into the use of the VCCT for crash modeling were made by the
author, and are described in Reference 39. Additional evaluation of this method is presented here
based on comparisons with dynamic DCB data from the literature. The adhesive layer was
modeled using CEALS 1 spring elements and using a EXELAS user-defined material property to
implement the VCCT. This subroutine is included in Appendix B. Models were made using solid
elements to represent the composite sublaminates. Critical energy release rates were obtained
directly from Reference 25. For an opening displacement rate of 2.1 m/s Gxc = 2.3 kJ/m 2 was used.
For an opening displacement rate of 23 m/s, a critical Mode I energy release rate of 1.8 kJ/m 2 was
used. Because critical energy release rates are not constant, knowing the loading rate in advance,
and having dynamic property data available for the specific loading rates needed is an advantage
that cannot be reasonably expected for a more general modeling effort. For a typical crash
modeling effort, the loading rate will not be known apriori, and dynamic property data are not
likely to be available. For the present models, no effort was made to distinguish initiation and
arrest values of critical energy release rates, although Reference 25 reports that these values may
differ. Due to the discrete nature of the finite element model, it is not possible to distinguish
steady-state propagation from short periods of arrest followed by propagation. Figure 6 presents
13
delamination growth versus time results for the DCB model using the VCCT routine to predict
delamination growth. This figure compares the computed results with experimental data from
Reference 25 for two values of opening displacement rate.
An important issue that was not fully addressed in the previous study was the convergent
behavior of the solution with respect to element size. Delamination growth results for three mesh
sizes are given in Figure 7. The results of the ½ mm mesh are incomplete due to a numerical
instability that occurred during computation. Not shown on in the figure are results for more
coarse geometries. For such cases the computed crack growth continues to observe the trend of
progressing more rapidly for coarser meshes. Although the total time required for the
delamination event varies considerably as a function of mesh refinement, the time to delamination
initiation is consistent for a range of mesh refinements. Table 1 shows times to delamination
initiation for DCB models at two opening displacement rates for various mesh geometries. Figure
8 shows crack length versus time results for three mesh sizes and an opening displacement rate of
2.1 rrds. These results show a similar trend to those for the faster opening displacement rate.
Again, initiation results are much more consistent for the various mesh geometries than is the
overall propagation behavior.
While the VCCT method yielded the most accurate DCB solutions among the three
methods studied, it did so at a great cost in CPU time. Comparisons in CPU time required to run
DCB models using each of the delamination methods studied are presented in Table 2. Each of
the models contained 1452 grid points and 480 solid elements, and modeled delamination growth
at a uniform loading rate of 23 m/s. Because the models were not run to the same total time,
results are presented in terms of CPU seconds required per millisecond of computed data using a
SGi 05 workstation. Comparison between the methods should be considered approximate due to
small modeling differences between each of the cases. As can be seen, the spotweld method
requires the least amount of CPU time. The cohesive model requires approximately twice the
CPU time as the spotweld method. The VCCT model required nearly an order of magnitude
increase in computation time. This is due in part to the implementation of the method through the
EXELAS subroutine. A more direct implementation into the program code is expected to require
significantly less CPU time.
To obtain good results the mesh must be refined sufficiently to yield accurate energy
release rate computation, and accurate Gc data appropriate to the loading rate in question must be
available. In practice, such data are not readily available, particularly when the loading rate is not
known a priori. The relative independence of the initiation behavior with mesh size seen in Table
1 and the sensitivity of the propagation behavior with mesh size seen in Figures 7 and 8 are
consistent with results previously reported in the literature for this method. The strong influence
of mesh size on the results is most likely due to the effect of abrupt release of spring elements.
Spurious dynamic effects will appear when a spring representing a finite interface area is released.
These wave effects may artificially increase the maximum forces exerted by the crack tip springs,
resulting in an over prediction of the energy release rate following the initiation of delamination.
This is illustrated by Figure 9 which shows computed energy release rate values before and after
delamination initiation for two mesh sizes. The data in Figure 9 are not filtered, but contain the
computed value of G/Go for each computational step in the model. From these results, it appears
that the computed energy release rate ratios for the coarse mesh are subject to oscillations with an
amplitude of roughly 0.3 ath'ibutable to spurious dynamic effects, whereas the "noise" in the finer
mesh is considerably reduced. Further investigation reveals the obvious fact that the oscillatory
14
response is primarily due to the spring force, the opening displacement behind the crack front not
showing the same vibratory response. However, in either case, certain aspects of the computed
response are undesirable, and may represent unrealistic response. $_ar and Hu [35] also noted
a tendency for delamination to propagate more rapidly in finite element computations than in
experiments. They attribute this phenomenon to an increase in the fracture resistance property
with crack speed. Such effects may also contribute to the effects observed in the present research.
A secondary material property required for this implementation of the VCCT is the
stiffness of the springs representing the interface. Crack growth versus time curves were
computed using spring stiffnesses between + one order of magnitude from a value determined
based on a simple elastic foundation model:
EAk-
h '
where k represents the spring stiffness, E is the modulus of the interface material, A is the interface
area modeled by the spring and h is the interface thickness. Results in Figure 10 show little
sensitivity to this parameter, as expected. If possible, stiffness properties should therefore be
selected such that the stiffness isas close as possible to the desired property without being so large
as to govern the time step in the computation.
In addition to quasi-two-dimensional finite element models, full three-dimensional models
of the DCB specimens were made using the VCCT technique. A sample deformed finite element
mesh for such a case is shown in Figure 11. Failed springs are evident in the figure as vertical
lines in the region immediately behind the crack front. Initially, the crack front progressed nearly
uniformly, with some evidence of delamination at the free edges lagging behind the delamination
at the midpoint, as is expected from previous research in crack front curvature in DCB specimens
[48]. However, as crack growth continued, the shape of the crack front became chaotic. This
behavior represents an undesirable modeling artifact. Alternate versions of the procedure have
been written such that the delamination of an entire linear crack front can be controlled by a single
representative point, thus forcing the crack front to remain linear during propagation. Such a
modeling strategy would force the crack front curvature to be eliminated from consideration.
However, in the context of crash analysis as opposed to fracture mechanics analysis, this loss in
fidelity may be acceptable, especially if the width of the interface is relatively small, and the
direction of crack front propagation is essentially predetermined. While this approach may appear
to reduce the generality of the procedure, it may in fact represent better modeling procedure. The
VCCT procedure as written assumes that the crack front is parallel to mesh lines. To allow for
arbitrary motion of a crack front in a plane using the VCCT technique would require adaptive
meshing schemes that are not currently available in the crash code. Further, the reduction in
computation required for this method resulted in a factor of two improvement in CPU time.
15
3. APPLICATIONS OF DELAMINATION MODELS
Following the initial evaluations of the delamination modeling schemes made based on the
DCB geometry, additional models were made to explore their use in broader modeling contexts.
Three investigations were made. First, models of relatively simple fracture tests from the literature
exhibiting either mixed-mode or Mode II behavior were made. Second, a study was made of the
initiation behavior of a composite laminate under crushing loads. Finally, a model was made of
the crushing behavior of a scaled fuselage section using composite sandwich structures as the
energy-absorbing components.
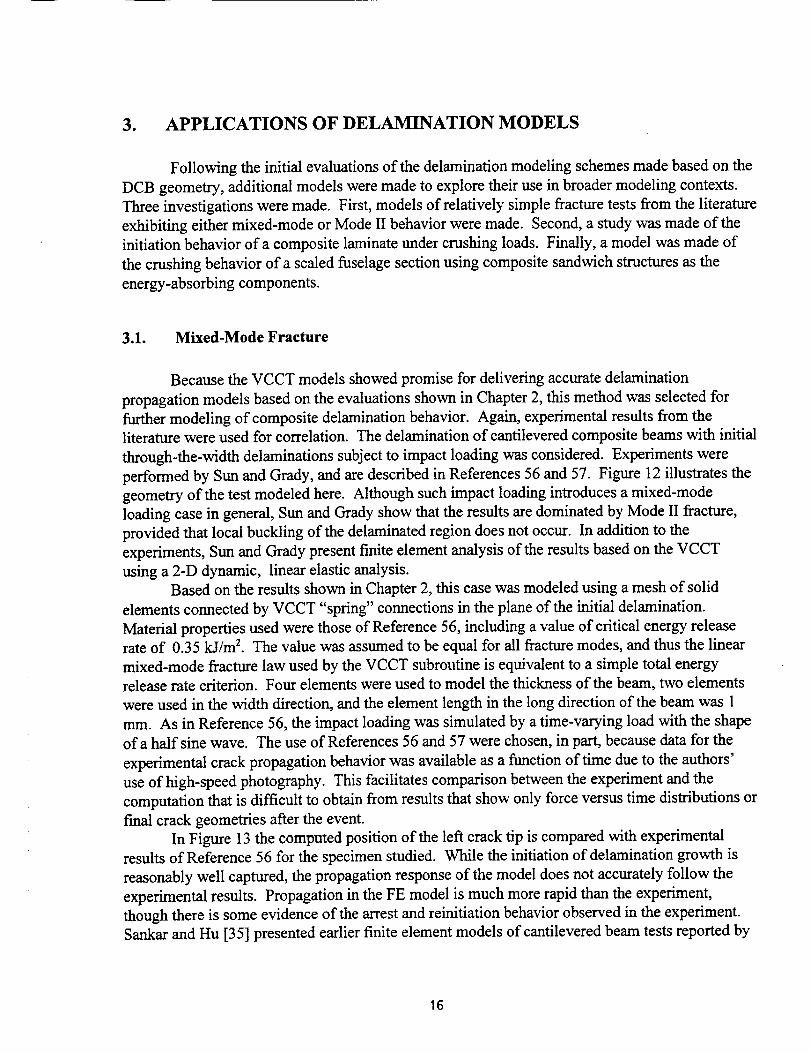
3.1. Mixed-Mode Fracture
Because the VCCT models showed promise for delivering accurate delamination
propagation models based on the evaluations shown in Chapter 2, this method was selected for
further modeling of composite delamination behavior. Again, experimental results from the
literature were used for correlation. The delamination of cantilevered composite beams with initial
through-the-width delaminations subject to impact loading was considered. Experiments were
performed by Sun and Grady, and are described in References 56 and 57. Figure 12 illustrates the
geometry of the test modeled here. Although such impact loading introduces a mixed-mode
loading case in general, Sun and Grady show that the results are dominated by Mode II fracture,
provided that local buckling of the delaminated region does not occur. In addition to the
experiments, Sun and Grady present finite element analysis of the results based on the VCCT
using a 2-D dynamic, linear elastic analysis.
Based on the results shown in Chapter 2, this case was modeled using a mesh of solid
elements connected by VCCT "spring" connections in the plane of the initial delamination.
Material properties used were those of Reference 56, including a value of critical energy release
rate of 0.35 kJ/m 2. The value was assumed to be equal for all fracture modes, and thus the linear
mixed-mode fracture law used by the VCCT subroutine is equivalent to a simple total energy
release rate criterion. Four elements were used to model the thickness of the beam, two elements
were used in the width direction, and the element length in the long direction of the beam was 1
mm. As in Reference 56, the impact loading was simulated by a time-varying load with the shape
of a half sine wave. The use of References 56 and 57 were chosen, in part, because data for the
experimental crack propagation behavior was available as a function of time due to the authors'
use of high-speed photography. This facilitates comparison between the experiment and the
computation that is difficult to obtain from results that show only force versus time distributions or
final crack geometries after the event.
In Figure 13 the computed position of the left crack tip is compared with experimental
results of Reference 56 for the specimen studied. While the initiation of delamination growth is
reasonably well captured, the propagation response of the model does not accurately follow the
experimental results. Propagation in the FE model is much more rapid than the experiment,
though there is some evidence of the arrest and reinitiation behavior observed in the experiment.
Sankar and Hu [35] presented earlier finite element models of cantilevered beam tests reported by
16
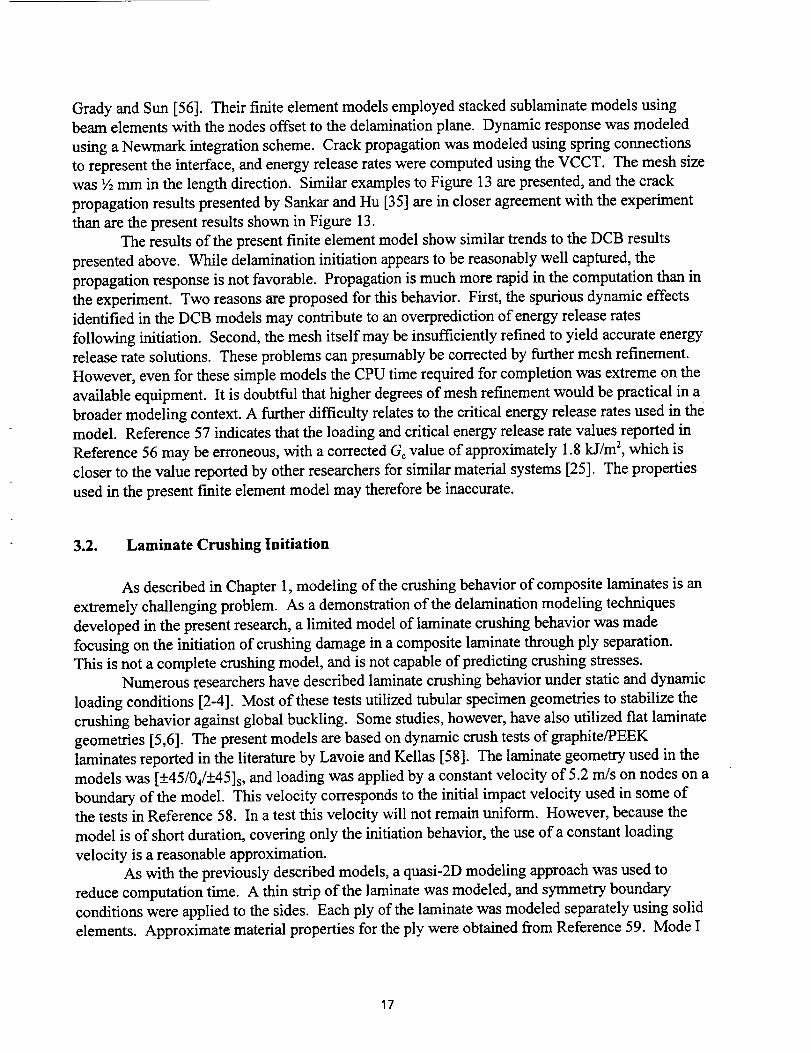
GradyandSun[56]. Their finite elementmodelsemployedstackedsublaminatemodelsusingbeamelementswith thenodesoffset to thedelaminationplane. DynamicresponsewasmodeledusingaNewmarkintegrationscheme.Crackpropagationwasmodeledusingspringconnectionsto representthe interface,andenergyreleaserateswerecomputedusingtheVCCT. Themeshsizewas½mm in thelengthdirection. Similarexamplesto Figure 13arepresented,andthecrackpropagationresultspresentedby SankarandHu [35] arein closeragreementwith theexperimentthanarethepresentresultsshownin Figure 13.
Theresultsof thepresentfinite elementmodelshowsimilar trendsto theDCB resultspresentedabove. While delaminationinitiation appearsto bereasonablywell captured,thepropagationresponseisnot favorable.Propagationis muchmorerapid in thecomputationthanintheexperiment.Two reasonsareproposedfor thisbehavior.First, thespuriousdynamiceffectsidentified in theDCB modelsmaycontributeto anoverpredictionof energyreleaseratesfollowing initiation. Second,themeshitself maybe insufficiently refinedto yield accurateenergyreleaseratesolutions. Theseproblemscanpresumablybecorrectedby furthermeshrefinement.However,evenfor thesesimplemodelsthe CPUtimerequiredfor completionwasextremeon theavailableequipment.It is doubtful thathigherdegreesof meshrefinementwould bepracticalin abroadermodelingcontext.A furtherdifficulty relatesto thecritical energyreleaseratesusedin themodel. Reference57 indicatesthat the loadingandcritical energyreleaseratevaluesreportedinReference56maybeerroneous,with acorrectedGc value of approximately 1.8 kJ/m 2, which is
closer to the value reported by other researchers for similar material systems [25]. The properties
used in the present finite element model may therefore be inaccurate.
3.2. Laminate Crushing Initiation
As described in Chapter 1, modeling of the crushing behavior of composite laminates is an
extremely challenging problem. As a demonstration of the delamination modeling techniques
developed in the present research, a limited model of laminate crushing behavior was made
focusing on the initiation of crushing damage in a composite laminate through ply separation.
This is not a complete crushing model, and is not capable of predicting crushing stresses.Numerous researchers have described laminate crushing behavior under static and dynamic
loading conditions [2-4]. Most of these tests utilized tubular specimen geometries to stabilize the
crushing behavior against global buckling. Some studies, however, have also utilized fiat laminate
geometries [5,6]. The present models are based on dynamic crush tests of graphite/PEEK
laminates reported in the literature by Lavoie and Kellas [58]. The laminate geometry used in the
models was [+45/04/+45]s, and loading was applied by a constant velocity of 5.2 m/s on nodes on a
boundary of the model. This velocity corresponds to the initial impact velocity used in some of
the tests in Reference 58. In a test this velocity will not remain uniform. However, because the
model is of short duration, covering only the initiation behavior, the use of a constant loading
velocity is a reasonable approximation.
As with the previously described models, a quasi-2D modeling approach was used to
reduce computation time. A thin strip of the laminate was modeled, and symmetry boundary
conditions were applied to the sides. Each ply of the laminate was modeled separately using solid
elements. Approximate material properties for the ply were obtained from Reference 59. Mode I
17
and Mode II critical energy release rates from Reference 25 were used because such data were not
available for the material system used in Reference 58. The Mode HI critical release rate was
assumed to equal the Mode II value for purposes of data entry, though Mode III behavior is
assumed to have little influence on this quasi-2D model. All ply interfaces were modeled using
VCCT spring elements to join opposite sublaminates. Contact surfaces were defined between each
set of plies to prevent unrealistic overlap following delamination extension. The total length of the
model was not taken to be the entire length of the test specimen, but was 15 mm. Thus, the model
represents a portion of the laminate near the point of damage initiation. A rigid surface was
defined at the bottom of the mesh to represent the crushing surface. Contact definitions between
the laminate elements and the crushing surface provide the loading. Additional details of these
models may be found in Reference 60. These initiation models are similar in many respects to
those described in Reference 61. However the present implementation is executed in
MSC/DYTRAN whereas the previous model was a quasistatic solution using a specialized finite
element code.
The purpose of this model is to study how delamination relates to the initiation of crushing
behavior in a composite laminate. Experimental crashing tests of composite laminates typically
include a physical mechanism for initiating localized crushing behavior while preventing global
failures. For basic laminate tests, the most common crushing initiators are chamfering, in which
one end of a test specimen is ground or machined to a point, or notches machined into a specimen.
In practice, crushing initiators are often more complex and may involve machined dies, ply drops,
rounded comers, or other mechanisms. Experimentally, crushing initiators can have a significant
influence on crushing behavior and the use of different crushing initiators may result in the
appearance of different failure modes within specimens of similar composition and testing
conditions. However, some studies have shown that crushing initiators have little influence on
steady state crushing behavior for a fairly wide range of geometries. Because it is unlikely that a
crash model will be able to fully capture the complex failure behavior in a composite crushing
initiation zone, the present model seeks to introduce initial delamination in the form of a starting
delamination state, and to examine how this choice influences the global progression of damage inthe model.
The present models represent the results of a crush initiator such as chamfer by initial
delaminations occurring between plies. This is similar to an approach taken by Farley and Jones
[10] in a model of quasistatic crushing behavior described above. The topics to be studied are:
what is an appropriate initial delamination state corresponding to a particular crushing initiator,
and how sensitive is the fmal crushing behavior to the choice of the initial delamination state. To
address these questions, a series of models was run in which the initial delamination state was
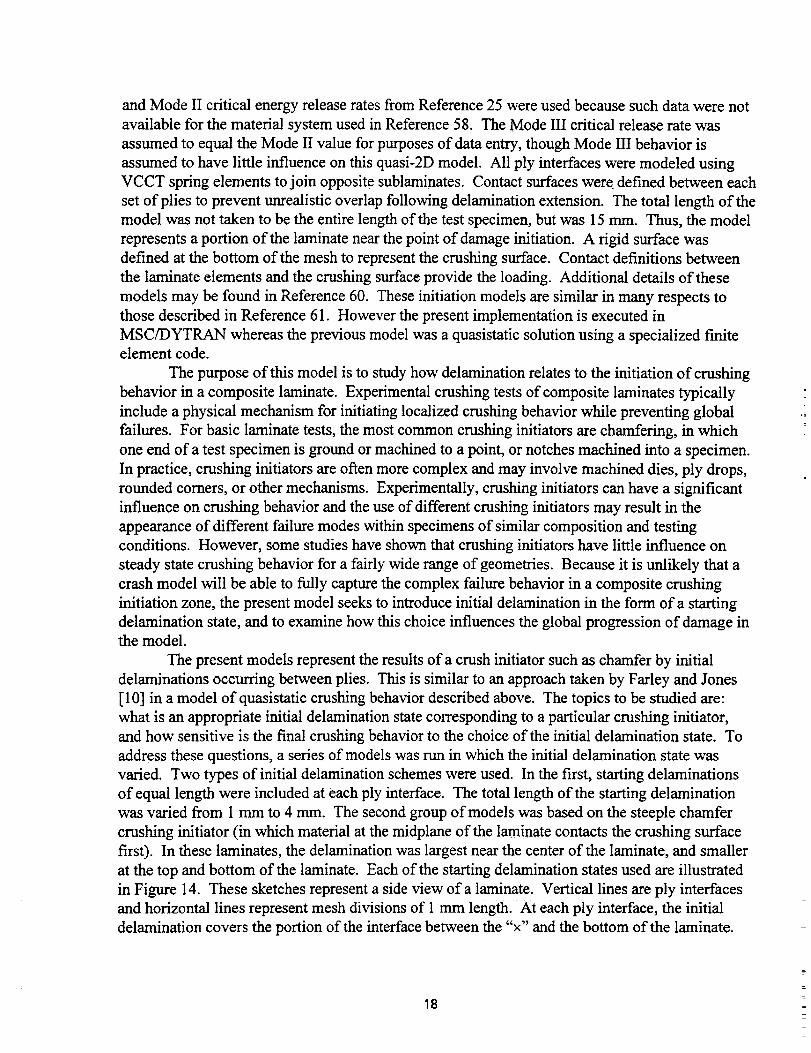
varied. Two types of initial delamination schemes were used. In the first, starting delaminations
of equal length were included at each ply interface. The total length of the starting delamination
was varied from 1 mm to 4 mm. The second group of models was based on the steeple chamfer
crushing initiator (in which material at the midplane of the laminate contacts the crushing surface
first). In these laminates, the delamination was largest near the center of the laminate, and smaller
at the top and bottom of the laminate. Each of the starting delamination states used are illustrated
in Figure 14. These sketches represent a side view of a laminate. Vertical lines are ply interfaces
and horizontal lines represent mesh divisions of 1 mm length. At each ply interface, the initial
delamination covers the portion of the interface between the "x" and the bottom of the laminate.
18
The nature of the results is such that only qualitative comparison of the results can be
made. Sequences of deformed mesh geometries are shown in Figures 15 through 21 for each of
the initial crack configurations. The uniform crack geometry models _1 show a tendency toward
global buckling, with some delamination of the outer +45 ply groups evident. The only apparent
difference of the initial length of the crack is that the initiation event is more rapid for the longer
initial cracks. Qualitatively, the deformation shape is the same for each case. The presence of the
steeple shaped initial crack geometries, however, results in the model predicting delamination
extension around the central +45 groups, producing a symmetric deformation pattern reminiscent
of the splaying or lamina bending crushing modes identified by Hull [3] and Farley [2],
respectively.
These results illustrate that there is a significant response on the models according to the
nature of the assumed initial crack configuration. This represents a substantial difficulty in
composite crush modeling, as it is unlikely that detailed modeling of crushing initiation is likely to
be achieved as part of a larger model in the near term. Thus, the choice of an initial delamination
state may represent a modeling choice that may only be decided by empirical means, at best. This
reduces the generality of the method. An intrinsic problem of models derived from fracture
mechanics, such as the VCCT, is the need for initial flaws in the model. Such methods are not
capable of modeling the initiation of delamination from an assumed perfect interface. Thus, the
issue of choosing an appropriate starting crack geometry may be a significant problem in future
efforts to model the crushing behavior of composite laminates, and is one that warrants further
study.
3.3. Sandwich Truss Fuselage Model
A substantial amount of research has been conducted at the NASA Langley Research
Center on the crashworthy behavior of aircraft structures [62]. Recently, much of this work has
addressed the unique problems associated with using composite materials for crashworthy
structures. This has included crush testing of composite laminates [5], testing of composite
airframe components and scaled fuselage sections [7,63], and full-scale crash testing of composite
airframes [64]. Finite element modeling has been done in conjunction with the experimental work
to advance the capability of using advanced modeling techniques for crashworthy design purposes.
The present research is focused on evaluating the potential for enhancing these modeling efforts by
using finite element crash models to simulate delamination behavior. A model of a simulated
aircraft structure in which delamination was a significant part of the response was made. Results
were compared with previously reported experimental data.
To facilitate comparison of finite element results with experimental test data, a test case
was needed in which delamination was prominent, and in which the geometry was sufficiently
simple as to not require substantial efforts in mesh generation. These requirements were met by
the scaled sandwich truss fuselage subfloor described by Fasanella and Jackson in Reference 65.
The sandwich truss subfloor utilizes foam-filled sandwich structures arranged in a truss-like
pattern as a subfloor energy absorbing system. In the subfloor region, the outer covering of the
structure is a thin, compliant material designed to readily deform in a fashion that promotes the
engagement of the subfloor energy absorbing members. The aircraft floor is a stiff structural
19
member that helps resist flight and pressure loads. Reference 65 describes a test of a 1/5-scale
sandwich truss component representing the subfloor in a general aviation aircraft. The subfloor
was fabricated using E-glass/epoxy facesheets and a PVC foam core comprised of a single layer of
E-glass/epoxy cloth. The structure was crushed between flat surfaces under a uniform loading rate
of 8.5 mm/s. The crushing force was measured to determine the energy absorbing performance of
the structure. The resulting damage included separation of the composite facesheets from the
foam cores in a fashion similar to delamination buckling.
To model the sandwich truss subfloor component, the force-based delamination model was
chosen. This decision was made based on previous experience, described above, which showed
that the potentially more accurate VCCT method did not provide a significant improvement over
the less rigorous force-based criterion. Further, the mesh refinement required to obtain accurate
results using the VCCT method would have resulted in prohibitive computation times. Also,
energy release rate property data are not available for the skin/core interface used in the
experiment. In the absence of reliable material property data, the use of more rigorous fracture
methods are not justified. While it was desirable to compare aspects of the behavior between the
force-based and the VCCT delamination methods, such comparisons could not be made because
the Windows NT version of MSC/DYTRAN in use at the time could not link user subroutines
using the currently available FORTRAN compiler.The MSC/DYTRAN model used solid elements for the core material and shell elements for
the face sheets and skins. Facesheet/core interfaces were modeled using spot weld elements to
join the shell elements representing the composite facesheet to the solid elements representing the
core. The reference surface of the shell elements on the interface was offset to coincide with the
interface. Figure 22 shows a MSC/PATRAN display of the model. A front view exhibiting the
mesh geometry is given in Figure 23. The figures show the structure in an upside-down
configuration with the floor at the bottom and the impacting surface at the top. The models were
created and are presented in this orientation to correspond to the geometry used in Reference 65.
The height of the subfloor model is 4 lmm and the maximum width of the subfloor is 210 mm.
The full depth of the experimental article was not modeled owing to the uniformity of the behavior
in the longitudinal direction observed in the test. This allowed for a model with fewer elements,
reducing the computation time. Figure 24 shows a detail of the mesh in the vicinity of the
attachment point between the outer shell and the central sandwich truss members. Facesheet and
core elements on opposite sides of an interface attach to the outer shell at a common nodes to
reduce the need for very small element sizes in the outer shell. However, as is seen in Figure 24,
some small elements are still needed in the skin at the center of the model, This reduces the
computational efficiency of the model by reducing the maximum time step. Contact surfaces weredefined between the core and facesheet elements, between facesheet elements and the outer shell,
between facesheet elements and the floor, and between facesheet elements on adjacent truss
elements. Although the experiment was tested under a relatively slow displacement rate of 8.5
mm/sec, the loading rate used in the model was increased to approximately 2000 mm/s to reduce
the computation time.
Material properties for the glass epoxy skin and facesheet materials are those used in for
models of similar subfloor structures in Reference 65. Skin and facesheet elements were modeled
using PSHELL elements with elastic-plastic DMATEP properties. Properties of the core were not
available from direct experimentation. Instead, properties of a similar foam material used in
Reference 18 were used. As a result, the density of the foam used in the model was greater than
2o
thatof the foam used in the experiment, and the available data are such that the foam properties
should be considered approximate, at best. The foam was modeled using solid elements with the
PSOLID material property data referencing DMATEP material properties. The foam was assumed
elastic-plastic with a failure strain of 0.8. A range of failure loads for the skin/core debonding
were studied, and a trial-and-error procedure was used to qualitatively correlate this failure load
with the experimental data. Improvements to the results are expected if more accurate material
property data were available.
Displacement sequences for the value of the critical spring force that resulted in the best
correlation with experimental results are shown in Figure 25. Following delamination, failed
spotweld elements are visible in Figure 25 as short lines connecting core and facesheet elements.
This display artifact was left in place to allow easier visualization of core/facesheet debonding.
Figure 26 illustrates a portion of the delamination sequence in which the visualization of the
spotweld elements has been disabled, resulting in a more realistic depiction of the event. The
value of the spotweld failure load that resulted in the closest qualitative correlation with the
experimental results was 0.0445 N. Elements representing the facesheets of the truss members are
subdivided in such a way as to result in approximately equal lengths for most elements. Except
for small regions near the intersection of truss elements, the element length varied between
1.95mm and 2.02 mm. For the most of the core/facesheet interface, the use of the maximum force
criterion therefore represents an interfacial strength based on a simple foundation model of
approximately 20 kPa. This value seems low, particularly as compared with the values of the
maximum force found for the DCB specimens, in Section 2.1. Due to a lack of experimental data,
there is no way to ascertain the validity of this value based on material considerations. The
computed delamination sequence observes a pattern of debonding of facesheets in conjunction
with localized instability of the facesheets. It should be noted that no initial delaminations were
included in the model, and therefore the maximum force failure criterion was used to predict initial
failure of the interface, as well as propagation of the resulting debond. The computed results tend
to have nearly symmetrical global displacement shapes, whereas the experimental results showed a
more pronounced asymmetry in the behavior of the center-most truss elements.As a demonstration of the influence of skin-core debonding on the crushing performance, a
computation was run in which debonding of the facesheets was prevented. The resulting
deformation shape, dominated by buckling of the sandwich elements, is shown in Figure 27.
In all cased, the computed crushing load was stored for comparison with experimental
results. Figures 28 and 29 illustrate the computed load-displacement response for the case whose
deformed shape best correlates with the experimentally observed deformations; and the case in
which all delamination was prevented, respectively. For the delamination enabled case of Figure
28, load data were collected at every 0.1 p.s, corresponding to an interval of approximately 5 time
steps. A sample of the complete data set is shown on the left hand side of Figure 28. For clarity,
only every 500 th available data point is shown. Even in the sampled data set, it is evident that the
response is extremely noisy. This is due to high-frequency dynamic response to the loading event
itself, as well as dynamic behavior due to nodal release during delamination. Data were smoothed
using a Lowess procedure, which uses locally weighted regression of data points to smooth a
curve. The smoothed data are shown on the right hand side of Figure 28. Figure 29 shows load
versus displacement data for the model in which delamination was prevented. The left hand figure
shows the entire collected data set, which was sampled every 1 lxs, or approximately once every
21
50 _ time step. The Lowess smoothed curve is shown on the right. There is considerably less
noise in the load response for the case in which delamination is disabled, which illustrates the
undesirable influence of nodal release on the computations.
Figure 30 compares the smoothed load-displacement data from the delaminating finite
element model with the experimental results from Reference 65. The finite element results are
scaled according to the ratio of the longitudinal length of the test article to the modeled length ofthe finite element model to facilitate this comparison. The results show that the finite element
model consistently overpredicts the load for the model by approximately a factor of three. This
may be due to inaccurate material properties, limitations of the failure model, or because of the
higher displacement rate used in the model as compared to the test. Figure 31 compares the load-
displacement response for the two finite element models. Loads for the model where skin-core
debonding is prevented are considerably higher than those for the delamination-enabled model.
This illustrates that a significant difference in global response is obtained due to the presence ofskin-core debonding.
22
4. CONCLUDING REMARKS
Finite element crash modeling of composite structures remains a challenging problem.
Delamination models offer the potential for enhancing the capabilities for crash modeling.
However, substantial obstacles must be overcome before delamination may be included as part of
a general modeling effort. Three methods for modeling delamination using a fmite element crash
code were evaluated in the present study. Each of the methods is based on modeling a structure
using conventional solid or shell elements to represent material on opposite sides of an interface.
The interface itself is modeled using simple elements such as springs or rigid tied constraints to
join the opposite sides of the interface. The methods differed in the failure criteria used to predict
failure of the interface. A simple criterion based on the forces observed in the interface elements
is the easiest to apply. If experimental data are available for correlation, accurate delamination
propagation results can be obtained with this method. However, the method is nonphysical, and it
is doubtful whether this method can be used as part of a general predictive tool. A cohesive
fracture model for interface failure provides several improvements over the force-based method,
such as reducing unwanted dynamic behavior due to abrupt release of nodal constraints. However,
in the examples studied here, the results did not correlate well with dynamic fracture tests during
propagation. Improved accuracy may be obtained using the fracture mechanics-derived virtual
crack closure technique (VCCT) to model delamination growth. However, the method may be
computationally prohibitive for current generation finite element crash codes and computing
hardware. General remarks about delamination modeling for crash analysis follow.
• Initiation of delamination growth is modeled much more effectively and with less computation
expense than is delamination propagation. If delamination growth is rapid and details of
delamination propagation are not significant to the global response, then delamination may be
effectively modeled as part of a crash model.
• Each of the methods studied yield improved solutions for increasing mesh refinement. The
VCCT method, particularly, requires a fine mesh size in the vicinity of a crack front to provide
accurate solutions. Such mesh refinement poses a severe restriction on explicit crash codes by
reducing the allowable solution time step. If propagation is expected over a large area, mesh
refinement in the delamination region may also significantly increase the number of degrees of
freedom in the model. These problems could be reduced if adaptive meshing schemes are
introduced into finite element crash codes, and if global-local analysis techniques can be used
to restrict the portion of the model requiring a small time step to the vicinity of critical crack
fronts.
• The VCCT method, as implemented in the present application, does not permit the general
propagation of a delamination because the delamination front must be aligned with the mesh
geometry to permit accurate calculation of energy release rates. To allow arbitrary
propagation of delaminations using this method, adaptive meshing schemes are required.
However, this may not be needed for many practical applications. For cases such as skin-
stringer debonding, an assumed one-dimensional crack propagation path may yield sufficiently
accurate solutions.
23
• Delamination models based on fracture mechanics approaches, such as VCCT, require initial
defects along interfaces where delamination is anticipated. The choice of initial delamination
states may have a significant influence on the global response of the model. The sensitivity of
the results to the modeler's choice of starting delamination states must be assessed to
determine the utility of a model as a predictive tool. ModeIs based on the strength of an
interface may avoid this problem. However, a highly refined mesh may be needed before the
stresses in an interface are accurately modeled.
• Regardless of the method used, accurate failure property data may not be readily available.
Fracture data for dynamically loaded composites are uncommon. Furthermore, for dynamic
loading conditions, Mode II and Mode III fracture data are structural properties and may
depend on the laminate architecture. If accurate property data are not available, the use of
more sophisticated fracture models such as VCCT is not justified.
24
5. REFERENCES
1. Newaz, G. M., Delamination in Advanced Composites, Technomic, Lancaster, PA, 1991.
2. Farley, G. L., and R. M. Jones, "Crushing Characteristics of Continuous Fiber-Reinforced
Composite Tubes," Journal of Composite Materials, Vol. 26, (1), 1992, pp. 37-50.
3. Hull, D., "A Unified Approach to Progressive Crushing of Fibre-Reinforced Composite
Tubes," Composites Science and Technology, Vol. 40, 1991, p. 377-421.
4. Mamalis, A. G., M. Robinson, D. E. Manolakos, G. A. Demosthenous, M. B. Ioannidis, and J.
Carruthers, "Crashworthy Capability of Composite Material Structures," Composite
Structures, Vol. 37, 1997, pp. 109-134.
5. Lavoie, J. A., J. Morton and K. Jackson, "An Evaluation of the Energy Absorption of
Laminated Composite Plates," Proc Instn Mech Engrs Part G: Journal of Aerospace
Engineering, Vol. 209, 1995, pp. 185-194
6. Fleming, D. C., and A. J. Vizzini, "The Energy Absorption of Composite Plates under Off-
Axis Loads," Journal of Composite Materials, Vol. 30, (18), 1996, pp. 1977-1995.
7. Carden, H. D., and S. Kellas, "Energy-Absorbing-Beam Design for Composite Aircraft
Subfloors," Proceedings of the AIAA/ASME/ASCE/AHS/ASC 34 th Structures, Structural
Dynamics and Materials Conference, La Jolla, CA, April 19-22, 1993, pp. 378-388.
8. Kindervater, C. F., "Crashresistant Composite Helicopter Structural Concepts -Thermoset and
Thermoplastic Corrugated Web Designs," Proceedings of the AHS National Technical
Specialists" Meeting on Rotorcraft Structure, Williamsburg, VA, Oct. 30-Nov. 2, 1995.
9. Botkin, M., A. Browne, N. Johnson, S. Fidan, R. Jeryan, H. Mahrnood, R. Wang, L. Lalik and
D. Peterson, "Development of a Composite Front Structure for Automotive Crashworthiness,"
AMD-Vol. 230/BED-Vol. 41, Crashworthiness, Occupant Protection and Biomechanics in
Transportation Systems, ASME, 1998, pp. 95-113.
10. Farley, G. L., and R. M. Jones, "Prediction of the Energy-Absorption Capability of Composite
Tubes," Journal of Composite Materials, Vol. 26 (3), 1992, pp. 388-404.
11. Hamada, H., and S. Ramakrishna, "A FEM Method for Prediction of Energy Absorption
Capability of Crashworthy Polymer Composite Materials," Journal of Reinforced Plastics and
Composites, Vol. 16 (3), 1997, pp. 226-242. =
12. Pickett, A. K., E. Hang and J. Rtickert, "A Fracture Damaging Law Suitable for Anisotropic
Short Fibre/Matrix Materials in an Explicit Finite Element Code," Composites, Vol. 21(4),
1990, pp. 297-304.
13. Hang, E., O. Fort, A. Trame_on, M. Watanabe and I. Nakada, "Numerical Crashworthiness
Simulation of Automotive Structures and Components Made of Continuous Fiber Reinforced
Composite and Sandwich Assemblies," SAE Technical Paper Series 910152, 1991.
14. Kohlg_ber, K., and A. Kamoulakos, "Validation of Numerical Simulation of Composite
Helicopter Sub-floor Structures under Crash Loading," Proceedings of the AHS 54 th Annual
Forum, Washington, DC, May 20-22, 1998, pp. 340-349.
15. Kerth, S., A. Dehn, M. Osgathe and M. Maier, "Experimental Investigation and Numerical
Simulation of the Crush Behaviour of Composite Structural Parts," Proceedings of the 41 st
International SAMPE Symposium, March 24-28, 1996, pp. 1397-1408.
25
16.Castejdn,L., J.Cuartero,R. ClementeandE. Larrodd,"EnergyAbsorptionCapabilityofCompositeMaterialsAppliedto AutomotiveCrashAbsorbersDesign,"from Polymer
Composites and Polymeric Materials, proceedings of the 1998 SAE International Congress
and Exposition, February 23-26, t998, Detroit, MI., pp. 37-46.
17. Philipps, M., L. Patberg, R. Dittmann and H. Adam, "Structural Analysis and Testing of
Composites in Automotive Crashworthiness Application," Safety and Material Test
Methodologies, Proceedings of the 1998 SAE International Congress and Exposition, Vol.
1320, Feb. 23-26, 1998, Detroit, MI, pp. 97-101.
18. Feillard, P., "Crash Modelling of Automotive Structural Parts Made of Composite Materials,"
SAE Technical Paper Series 1999-01-0298, from Polymer Composites and Polymeric
Materials for Energy Management and Occupant Safety, Proceedings of the 1999 SAE
International Congress arid Exposition, March 1-4, 1999, Detroit, MI.
19. Johnson, A. F., C. M. Kindervater, D. Kohlgriiber and M. Ltitzenburger, "Predictive
Methodologies for the Crashworthiness of Aircraft Structures, Proceedings of the 52 nd
American Helicopter Society Annual Forum, Washington, DC, June 4-6, 1996, pp. 1340-1352.
20. Cherepanov, G. P., ed., Fracture: A Topical Encyclopedia of Current Knowledge, Kreiger,
Malabar, FL, 1998.
21. Leibowitz, H., and E. T. Moyer, Jr., "Finite Element Methods in Fracture Mechanics,"
Computers and Structures, Vol. 31 (1), 1989, pp. 1-9.
22. Irwin, G. R., "Comments on Dynamic Fracturing," Fast Fracture and Crack Arrest, ASTM
STP 627, G. T. Hahn and M. F. Kanninen, Eds., ASTM, 1977, pp. 7-18.
23. Kanninen, M. F., C. Popelar, and P. C. Gehlen, "Dynamic Analysis of Crack Propagation and
Arrest in the Double-Cantilever-Beam Specimen," Fast Fracture and Crack Arrest, ASTM
fliP 627, G. T. Hahn and M. F. Kanninen, Eds., ASTM, 1977, pp. 19-38.
24. Thesken, J. C., "A Theoretical and Experimental Investigation of Dynamic Delamination in
Composites," Fatigue and Fracture of Engineering Materials and Structures, Vol. 18 (10),
1995, pp. 1133-1154.
25. Blackman, B. R. K., J. P. Dear, A. J. Kinloch, H. Macgillivray, Y. Wang, J. G. Williams and P.
Yayla, "The Failure of Fibre Composites and Adhesively Bonded Fibre Composites under
High Rates of Test, Part I Mode I Loading -Experimental Studies," Journal of Materials
Science, Vol. 30, 1995, pp. 5885-5900.
26. Gillespie, J. W., Jr., L. A. Carlsson and A. J. Smiley, "Rate-Dependent Mode I Interlaminar
Crack Growth Mechanisms in Graphite/Epoxy and Graphite/Peek," Composites Science and
Technology, Vol. 28, 1987, pp. 1-15.
27. Smiley, A. J., and R. B. Pipes, "Rate Sensitivity of Mode II Interlaminar Fracture Toughness
in Graphite/Epoxy and Graphite/PEEK Composite Materials, Composites Science and
Technology, Vol. 29, 1987, pp. 1-15.
28. Trakas, K., and M. T. Kortschot, "The Relationship Between Critical Strain Energy Release
Rate and Fracture Mode in Multidirectional Carbon-fiber/Epoxy Laminates," Composite
Materials: Fatigue and Fracture (Sixth Volume), ASTM STP 1285, E. A. Armanios, ed.,
ASTM, 1997, pp. 283-304.
29. Kavaturu, M., and A. Shukla, "Dynamic Fracture Criteria for Crack Growth along Bimaterial
Interfaces," Journal of Applied Mechanics, Vol. 65, June 1998, pp. 293-299.
26
30.Kobayashi,A. S.,A. F. Emery and S. Mall, "Dynamic Finite Element and Dynamic
Photoelastic Analyses of Two Fracturing Homalite-100 Plates," Experimental Mechanics, Vol.
16, (9), 1976, pp. 321-328.
31. Kobayashi, A. S., A. F. Emery and S. Mall, "Dynamic Finite Element and Dynamic
Photoelastic Analyses of Crack Arrest in Homalite-100 Plates," Fast Fracture and Crack
Arrest, ASTMSTP 627, G. T. Hahn and M. F. Kanninen, Eds., ASTM, 1977, pp. 95-108.
32. Yagawa, G., Y. Sakai and Y. Ando, "Analysis of a Rapidly Propagating Crack Using Finite
Elements," ASTMSTP 627, G. T. Hahn and M. F. Kanninen, Eds., ASTM, 1977, pp. 109-122.
33. Keegstra, P. N. R., J. L. Head and C. E. Turner, "A Transient Finite Element Analysis of
Unstable Crack Propagation in some 2-Dimensional Geometries," Fracture 1977, Vol. 3,
ICF4, Waterloo, Canada, June 19-24, 1977, pp. 515-522.
34. Rydholm, G., B. Fredriksson and F. Nilsson, "Numerical Investigations of Rapid Crack
Propagation," Proceedings of the First International Conference on Numerical Methods in
Fracture Mechanics, 1978, pp. 660-672.
35. Sankar, B. V., and S. Hu, "Dynamic Delamination Propagation in Composite Beams," Journal
of Composite Materials, Vol. 25, November 1991, pp. 1414-1426.
36. Wang Y., and J. G. Williams, "Dynamic G Calculations for an Axially Loaded Parallel Strip,"
Engineering Fracture Mechanics, Vol. 46, (4), 1993, pp. 617-631.
37. Crouch, B. A., and J. G. Williams, "Application of a Dynamic Numerical Solution to High
Speed Fracture Experiments -I. Analysis of Experimental Geometries," Engineering Fracture
Mechanics, Vol. 26, (4), 1987, pp. 541-551.
38. Wang Y., and J. G. Williams, "A Numerical Study of Dynamic Crack Growth in Isotropic
DCB Specimens," Composites, Vol. 25, (5), 1994, pp. 323-331.
39. Fleming, D., "Delamination Modeling of Composites for Improved Crash Analysis,"
Proceedings of the ASC 13 th Technical Conference, Baltimore, MD, Sept. 21-23, 1998.
40. Reedy, E. D., Jr., F. J. Mello and T. R. Guess, "Modeling the Initiation and Growth of
Delaminations in Composite Structures," Journal of Composite Materials, Vol. 31, (8), 1997,
pp. 812-831.
41. Anon., MSC/DYTRAN Version 4. 0 Users Manual, MSC Corporation, 1997.
42. Needleman, A., "A Continuum Model for Void Nucleation by Inclusion Debonding," Journal
of Applied Mechanics, Vol. 54, Sept, 1987, pp. 525-531.
43. Rybicki, E. F., and M. F. Kanninen, "A Finite Element Calculation of Stress Intensity Factors
by a Modified Crack Closure Integral," Engineering Fracture Mechanics, Vol. 9, 1977, pp.931-938.
44. Shivakumar, K. N., P. W. Tan and J. C. Newman, Jr., "A Virtual Crack-Closure Technique for
Calculating Stress Intensity Factors for Cracked Three Dimensional Bodies," International
Journal of Fracture, Vol. 36, 1988, pp. R43-R50.
45. De Roeck, G., and M. M. Abdel Wahab, "Strain Energy Release Rate Formulae for 3D Finite
Element," Engineering Fracture Mechanics, Vol. 50 (4), 1995, pp. 569-580.
46. Sun, C. T., and R. K. Pandey, "Improved Method for Calculating Strain Energy Release Rate
Based on Beam Theory," AIAA Journal, Vol. 32 (I), 1994, pp. 184-189.
47. Raju, I. S., K. N. Shivakumar and J. H. Crews, Jr., "Three-Dimensional Elastic Analysis of a
Composite Double Cantilever Beam Specimen," AIAA Journal, Vol. 26, (12), 1988, pp. 1493-1498.
27
48. Crews, J. H., Jr., K. N. Shivakumar, and I. S. Raju, "Strain Energy Release Rate Distributions
for Double Cantilever Beam Specimens," AIAA Journal, Vol. 29, (11), 1991, pp. 1686-1691.
49. Salpekar, S. A., T. K. O'Brien and K. N. Shivakumar, "Analysis of Local Delamination
Caused by Angle Ply Matrix Cracks," Journal of Composite Materials, Vol. 30 (4), 1996, pp.
418-439.
50. Klug, J., X. X. Wu and C. T. Sun, "Efficient Modeling ofPostbuckling Delamination Growth
in Composite Laminates using Plate Elements," AIAA Journal, Vol. 34 (1), 1996, pp. 178-184.
51. Raju, I. S., R. Sistla and T. Krishnamurthy, "Fracture Mechanics Analyses for Skin-Stiffener
Debonding," Engineering Fracture Mechanics, V. 54 (3), June 1996, pp. 371-385.
52. Atkinson, C., "Cracks in Bimaterial Interface -An Overview," in Advances in Fracture
Research; Proceedings of the Seventh International Conference on Fracture (ICFT), Houston,
TX, Mar. 20-24, 1989, pp. 3053-3061.
53. Sun, C. T., and C. J. Jih, "On Strain Energy Release Rates for Interracial Cracks in Bi-Material
Media," Engineering Fracture Mechanics, vol. 28 (1), 1987, pp. 13-20.
54. Zheng, S., and C. T. Sun, "A Double-Plate Finite-Element Model for the Impact-Induced
Delamination Problem," Composites Science and Technology, Vol. 53, 1995, pp. 111-118.
55. Beuth, J. L., and S. H. Narayan, "Separation of Crack Extension Modes in Composite
Delamination Problems," in Composite Materials: Fatigue and Fracture (Sixth Volume),
ASTMSTP 1285, E. A. Armanios, Ed., ASTM, 1997, pp. 324-342.
56. Grady, J. G., and C. T. Sun, "Dynamic Delamination Crack Propagation in a Graphite/Epoxy
Laminate, in Composite Materials: Fatigue and Fracture, ASTM STP 907, H. T. Hahn, ed.,
SATM, Philadelphia, 1986, pp. 5-31.
57. Sun, C. T., and J. E. Grady, "Dynamic Delamination Fracture Toughness of a Graphite/Epoxy
Laminate Under Impact," Composites Science and Technology, Vol. 31, 1988, pp. 55-72.
58. Lavoie, J. A., and S. KeUas, "Dynamic Crush Tests of Energy-Absorbing Laminated
Composite Plates," Composites: Part A, Vol. 27A, 1996, pp. 467-475.
59. Agarwal, B. D., and L. J. Broutman, Analysis and Performance of Fiber Composites, 2 °,
Wiley, New York, 1990.
60. Boonsuan, P., Finite Element Modeling of Delamination Growth in Composites, Master's
Thesis, Florida Institute of Technology, 1999.
61. Fleming, D. C., and A. J. Vizzini, "Off-Axis Energy Absorption Characteristics of Composites
for Crashworthy Rotorcraft Design," Journal of the American Helicopter Society, Vol. 41, (3),
pp. 239-246, 1996.
62. Carden, H. D., and M. P. Robinson, "Failure Behavior of Generic Metallic and Composite
Aircraft Structural Components under Crash Loads," NASA RP 1239, 1990.
63. Fasanella, E. L., K. E. Jackson, and K. H. Lyle, "Crash Simulation of an Unmodified Lear Fan
Fuselage Section Vertical Drop Test," Proceedings of the AHS 54 th Annual Forum,
Washington, DC, May 20-22, 1998.
64. Jackson, K. E., S. Kellas, C. Kindervater, and M. Lutzenburger, "Experimental and Simulated
Crash Responses of Composite Airframe Structures," Proceedings of the AHS 50 th Annual
Forum, Washington, DC, May 11-13, 1994.
65. Fasanella, E. L., and K. E. Jackson, "Analytical and Experimental Evaluation of Scaled
Composite Energy Absorbing Subfloor Concepts," Proceedings of the AHS National
Technical Specialists' Meeting on Rotorcraft Crashworthiness, Phoenix, AZ, Sept. 14-16,
1998.
28
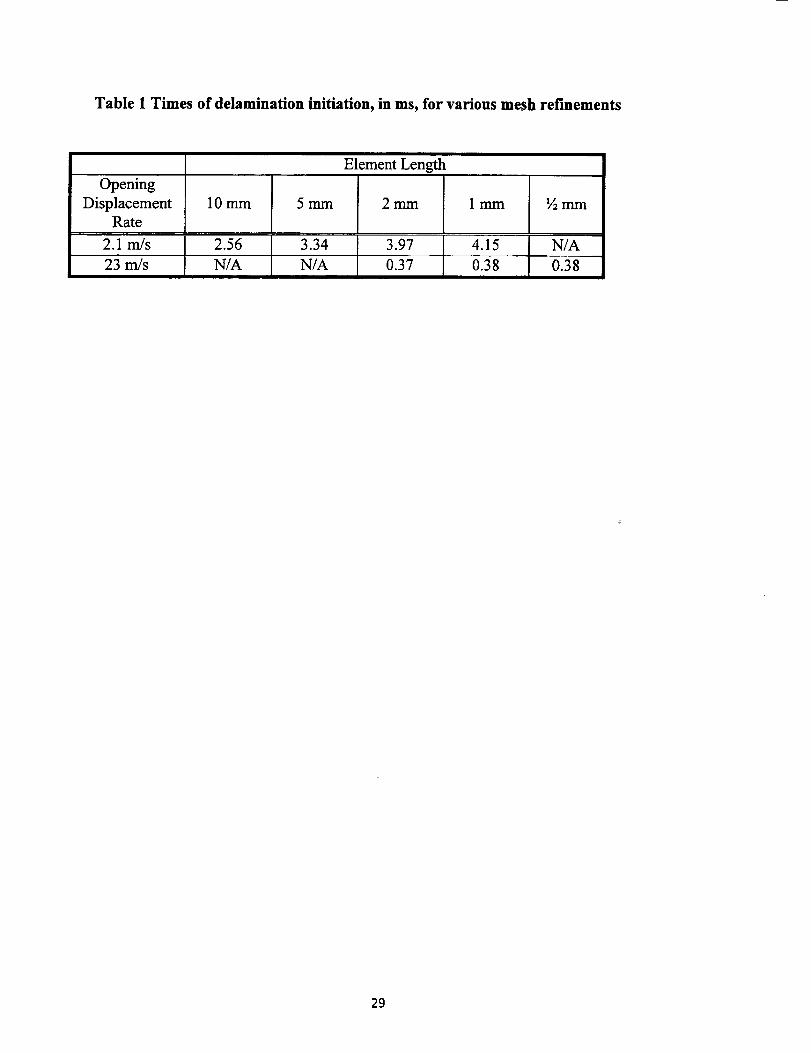
Table 1 Times of delamination initiation, in ms, for various mesh refinements
Element Length
Opening
Displacement 10 mm 5 mm 2 mm 1 mm ½ mm
Rate
2.1 m/s 2.56 3.34 3.97 4.15 N/A
23 m/s N/A N/A 0.37 0.38 0.38
29
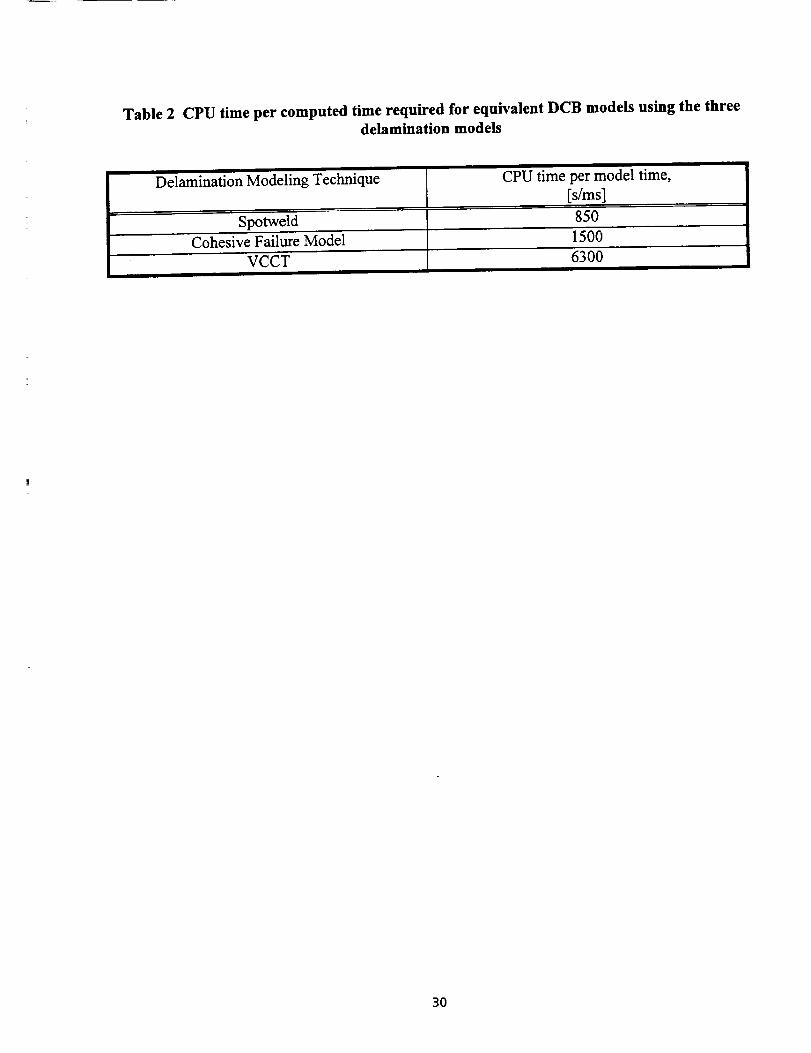
Table 2 CPU time per computed time required for equivalent DCB models using the threedelamination models
Delamination Modeling Technique [ CPU time [s/ms]permodel time,
- Spotweld [ 850Cohesive Failure Model 1500
VCCT 6300I
I II
30
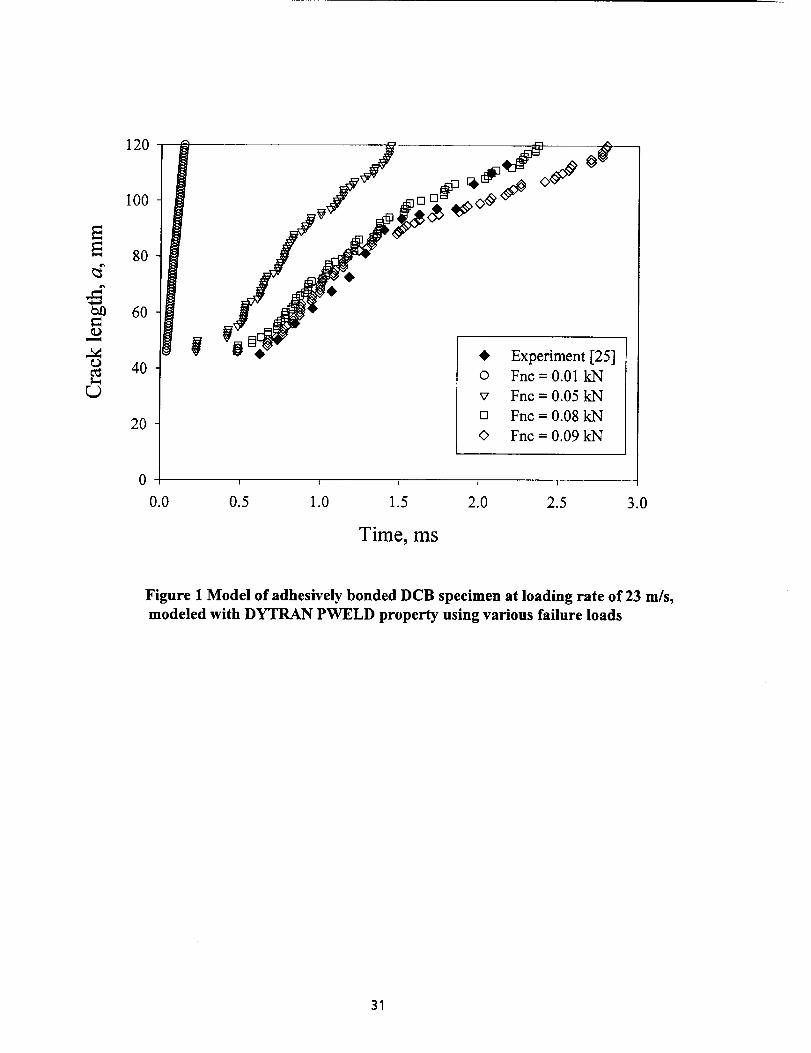
120
100
60
,.-Mc_ 40
2O
0
,i> Experiment [25]
o Fnc = 0.01 kN
v Fnc = 0.05 kN
[] Fnc = 0.08 kN
<> Fnc=0.09kN
I I I I I
0.0 0.5 1.0 1.5 2.0 2.5 3.0
Time, ms
Figure I Model of adhesively bonded DCB specimen at loading rate of 23 m/s,
modeled with DYTRAN PWELD property using various failure loads
31

_c _max
Figure 2 Stress-separation relationship for cohesive fracture model after Reference 40
32
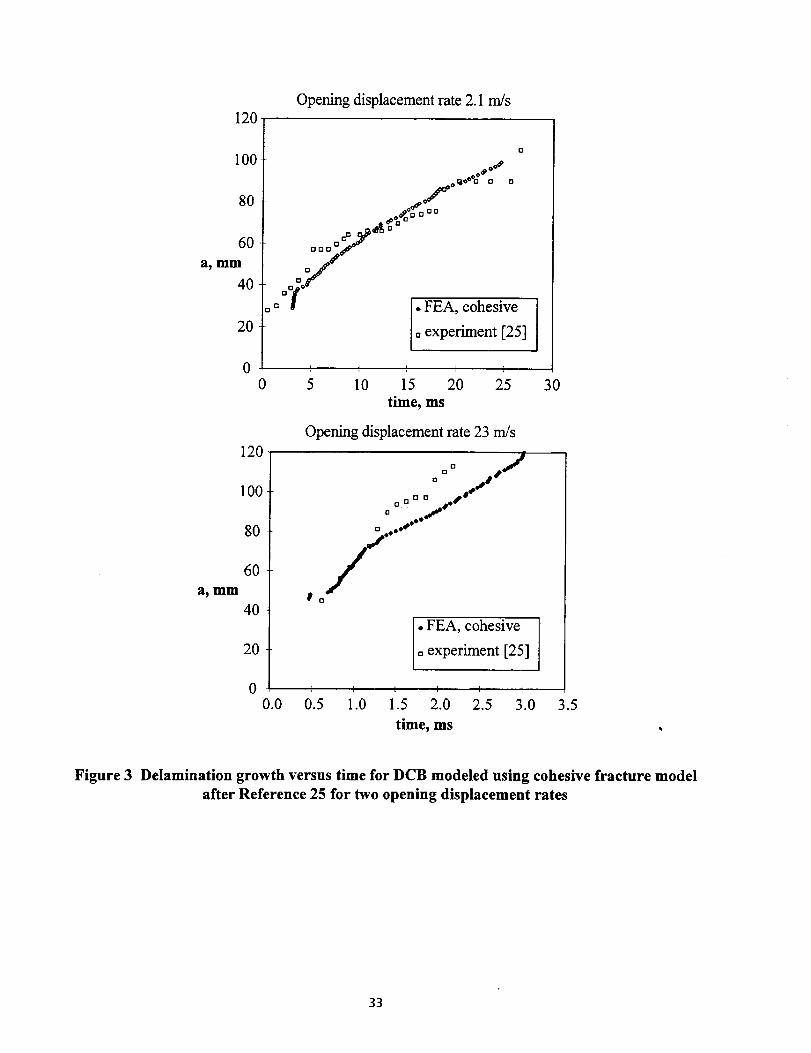
120
100
80
60
a, mm
40
20
0
0
120
100
80
60
a, mm
40
20
Opening displacement rate 2.1 rn/s
o_fo _<> a [] o
°°o¢¢f+°:/
[],,°[ • FEA, cohesive
[]experiment [25]
I I ! I !
5 10 15 20 25
time, ms
Opening displacement rate 23 m/s
30
° aa tl j
a [] [] [] _* S°_S
o ..s
+,°.,S*"*
10
1_ FEA, cohesiveexperiment [25]
i l t I I I
0.5 1.0 1.5 2.0 2.5 3.0
time, ms
00.0 3.5
Figure 3 Delamination growth versus time for DCB modeled using cohesive fracture model
after Reference 25 for two opening displacement rates
33
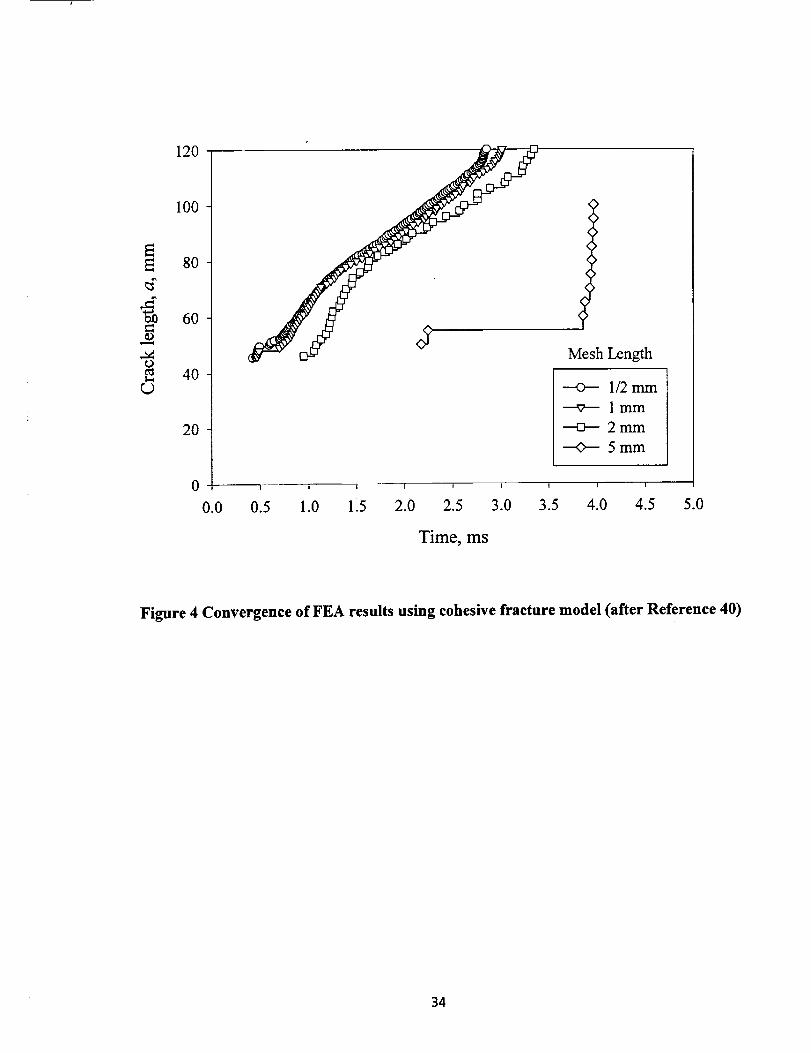
E
r..)
12o
lOO
80
60
40
20
Mesh Length
--o-- 1/2mm
_lmm
--o-- 2 mm
--0--- 5 mm
I | I I t i I I I
0.0 0.5 1.0 1.5 2.0 2.5 3.0 3.5 4.0 4.5 5.0
Time, ms
Figure 4 Convergence of FEA results using cohesive fracture model (after Reference 40)
34
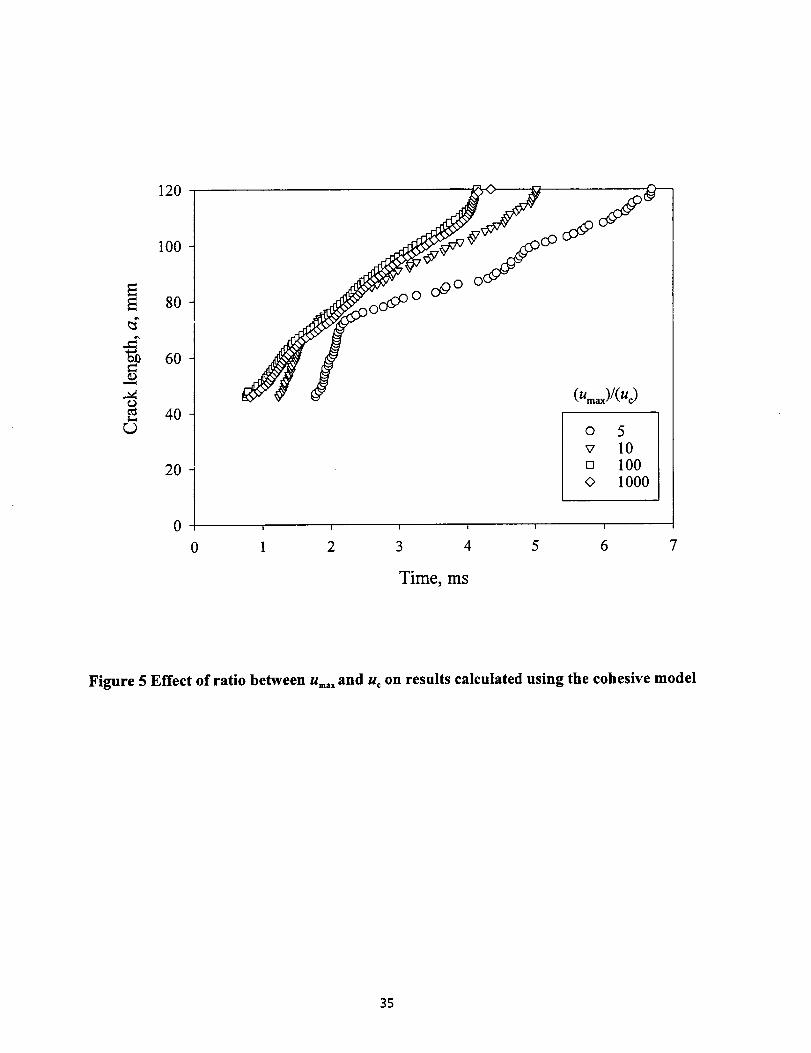
120
100
8o
0c_ 40
20
oOO o/
(Umax)/(U c)
o 5
v 10[] 100
0 1000
I I I I I I
0 1 2 3 4 5 6 7
Time, ms
Figure 5 Effect of ratio between Umaxand u, on results calculated using the cohesive model
35
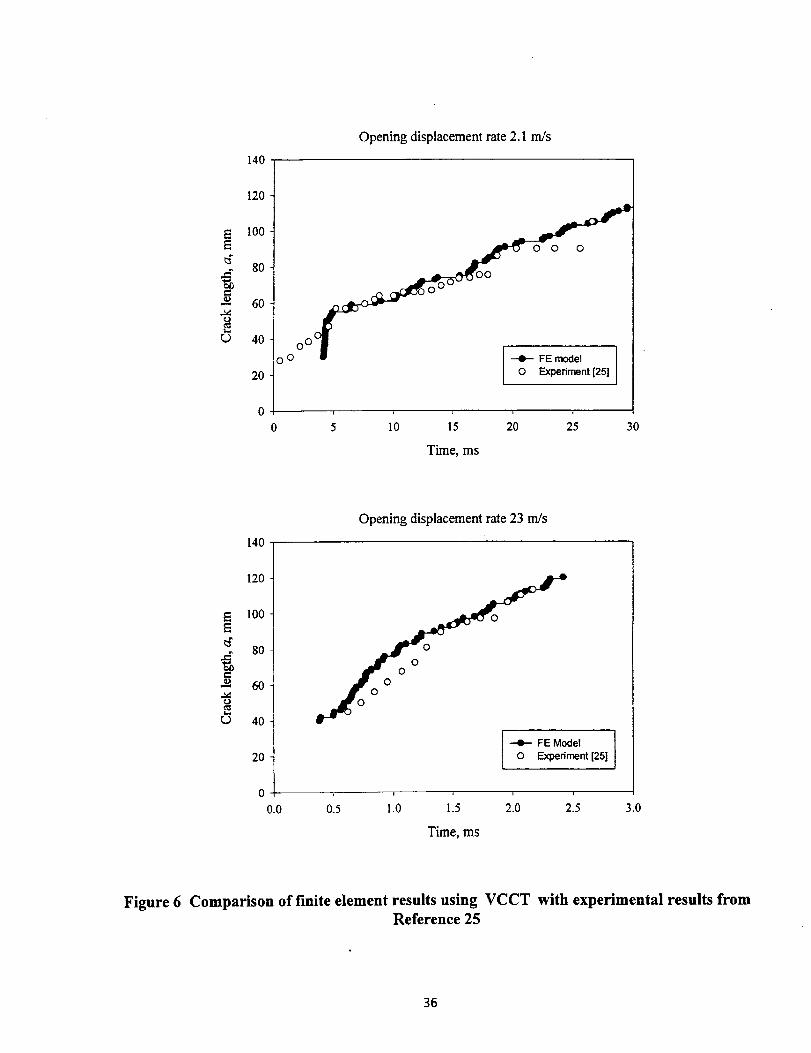
140
Opening displacement rate 2.1 m/s
EE
_b
120
100
8O
60
40
20
0
0
0 0 O0 00_
FE model
O Experiment [25]
i l J
5 10 15
Time, ms
20 25 30
140
Opening displacement rate 23 m/s
EE
120
100
8O
60
40
20
0
o ° o
o o
---e-- FE Model IO Experiment [25]
0.0 0.5 1.0 1.5 2.0 2.5 3.0
Time, ms
Figure 6 Comparison of finite element results using VCCT with experimental results fromReference 25
36
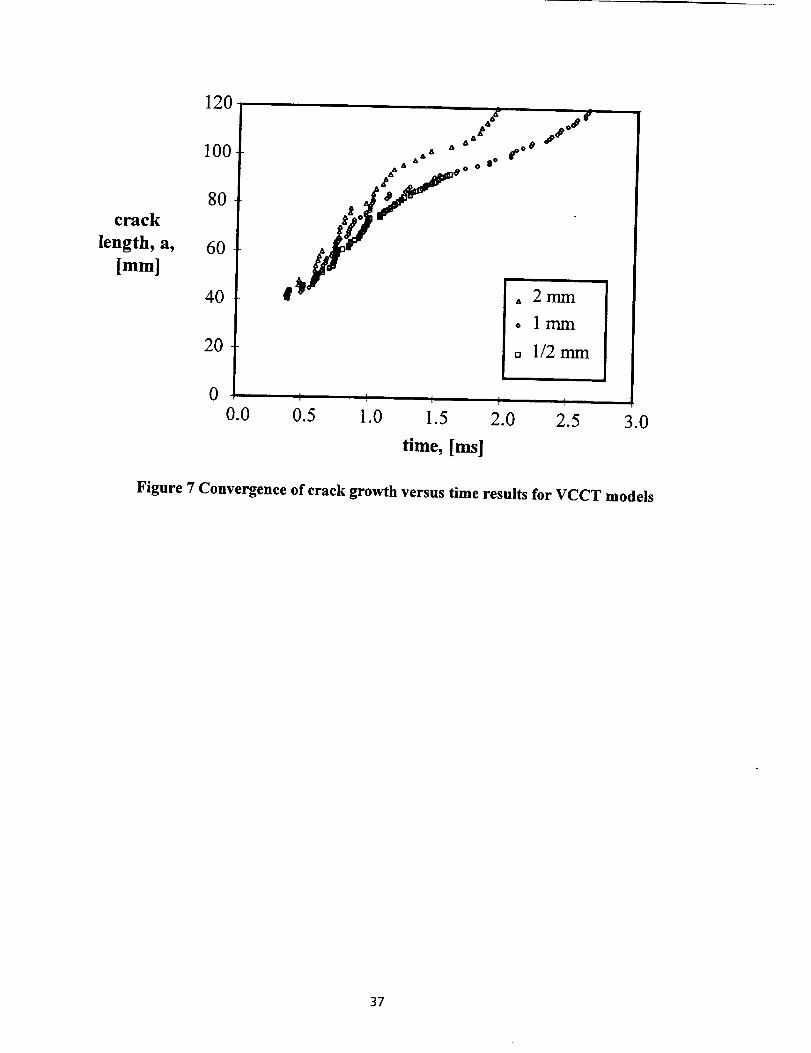
crack
length, a,
[mm]
120
100
80
60
40
20
**A&_ ##
., A coos_A A ooO °
|, _,r . 2mm
o lmm
= 1/2mm
0 I f I ! f
0.0 0.5 1.0 1.5 2.0 2.5
time, [ms]
3.(
Figure 7 Convergence of crack growth versus time results for VCCT models
37
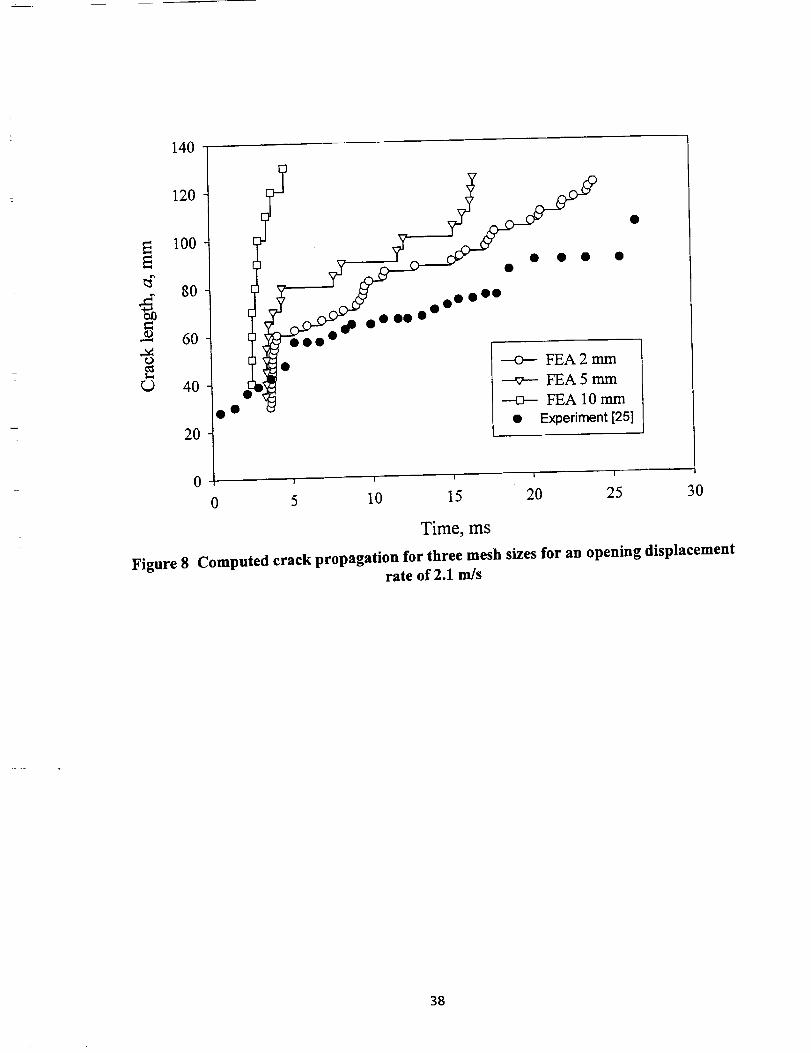
140
120
_ 100
80
_ 40
Figure 8
20
/_;
9 _" ---O--- FEA2 mm
_;_ --_ FEA5mm• --o-- FEA 10 mm
• • • Experiment [25]
0 r _ T r T
0 5 10 15 20 25 30
Time, ms
Computed crack propagation for three mesh sizes for an opening displacementrate of 2.1 m/s
38
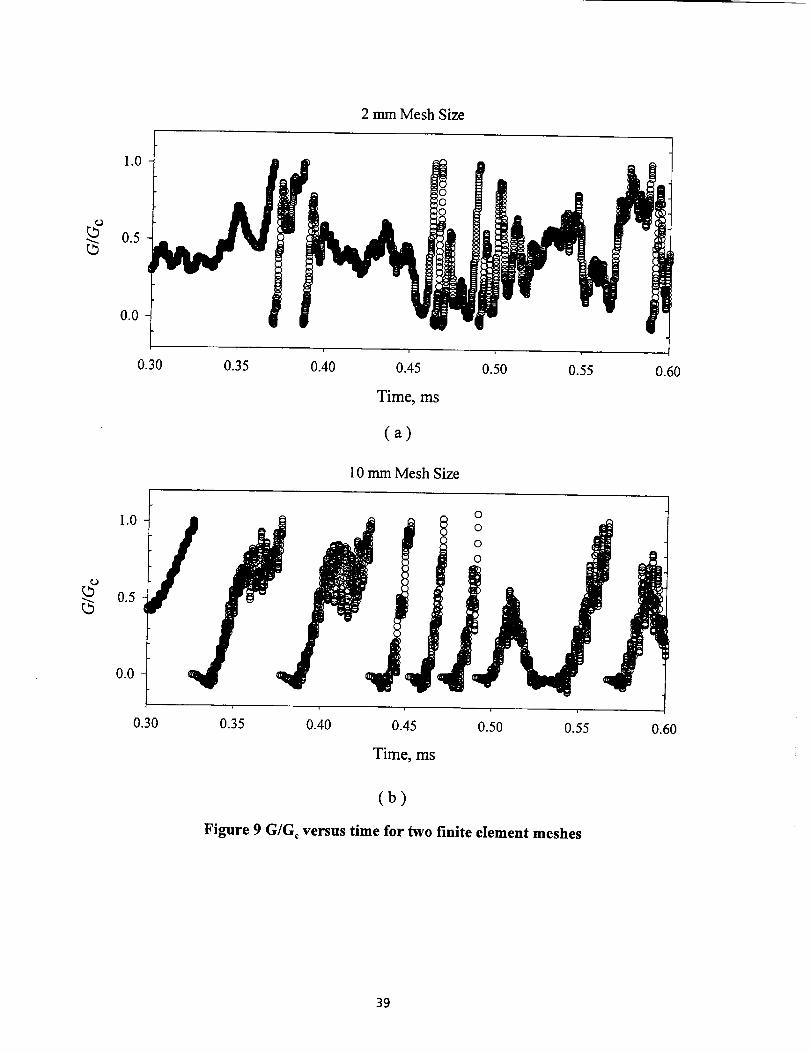
2mmMeshSize
1.0
(D° 0.5
0.0
0.30 0.35 0.40 0.45 0.50 0.55 0.60
Time, ms
(a)
10 mm Mesh Size
1.0
0.5
0.0
/0
0
0
0
0.30 0.35 0.40 0.45 0.50
Time, ms
0.55 0.60
(b)
Figure 9 G/G¢ versus time for two finite element meshes
39
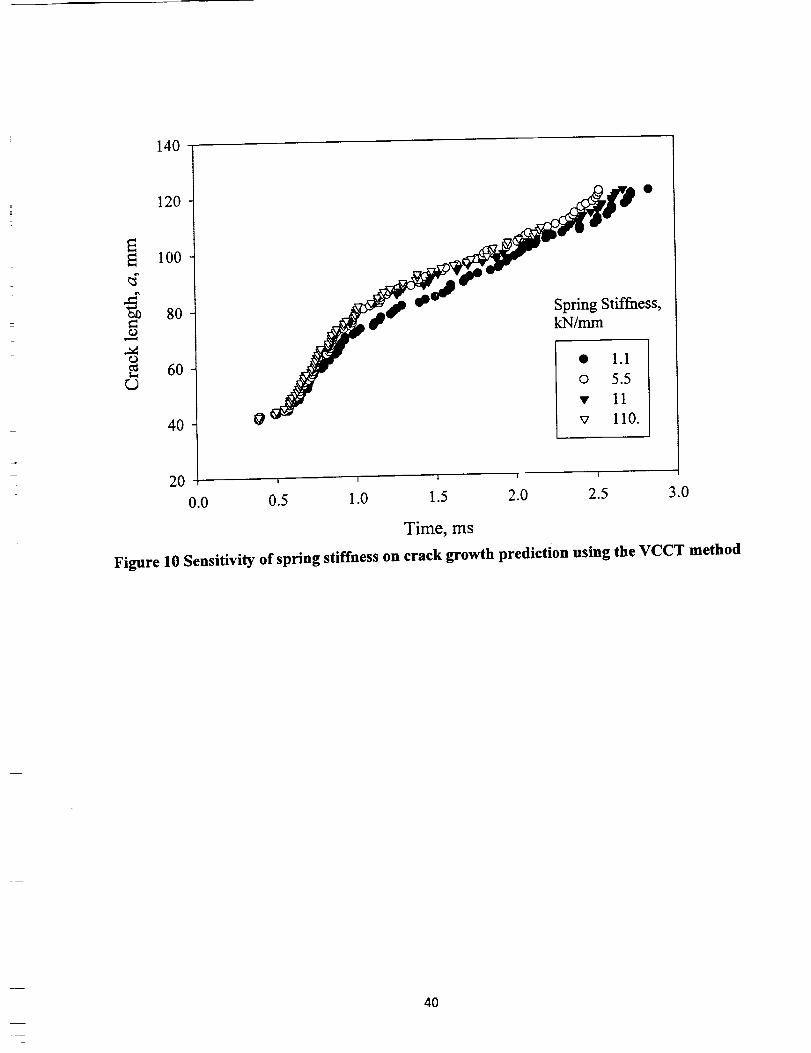
140
120
E_ 100
80O
o60
r,...)
40
20
fs"
• 1.1
o 5.5
.._ • 110 _*_ v 110.
I I | I t
0.0 0.5 1.0 1.5 2.0 2.5 3.0
Time, ms
Figure 10 Sensitivity of spring stiffness on crack growth prediction using the VCCT method
40
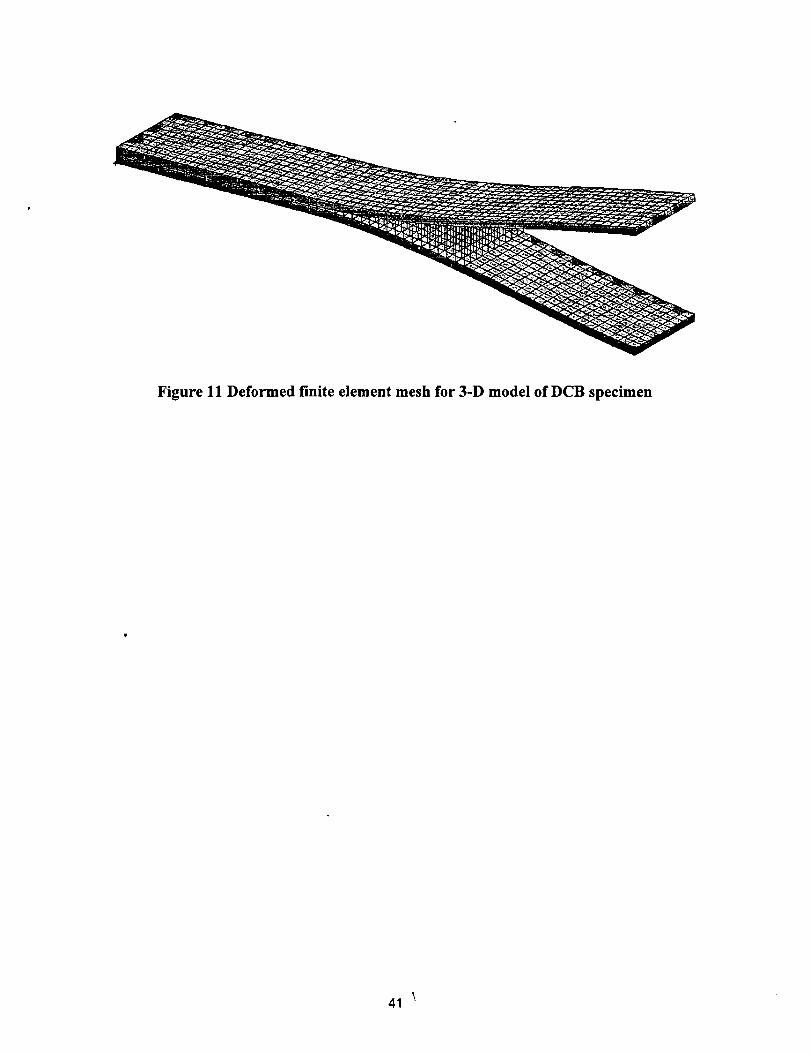
Figure 11 Deformed finite element mesh for 3-D model of DCB specimen
41
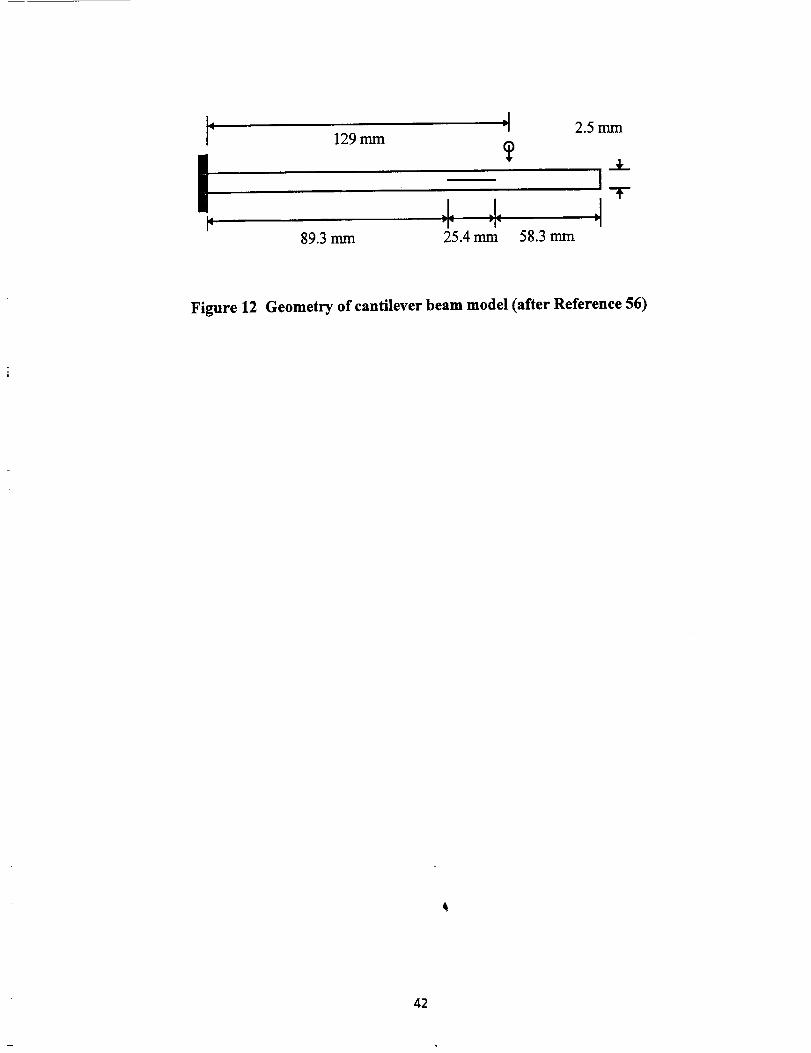
-J 2.5 mm1" 129 mm
| * _._IT
I ,L, + JiI "" "1
89.3 mm 25.4 mm 58.3 mm
Figure 12 Geometry of cantilever beam model (after Reference 56)
42
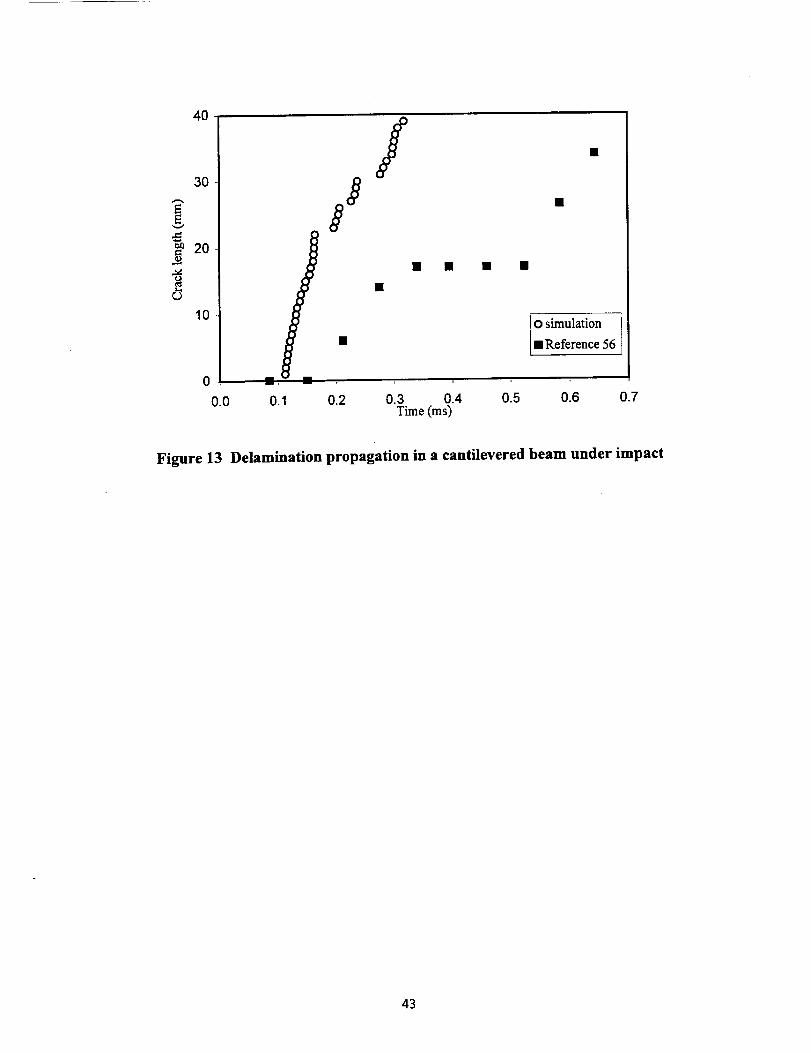
4O
3O
=_ 20
UI
10
/
• • • •
i 0 simulation l• • Reference 56
m mm, ,
0.0 0.1 0.2 0.3 0.4 0.5 0.6 0.7Time (ms)
Figure 13 Delamination propagation in a cantilevered beam under impact
43
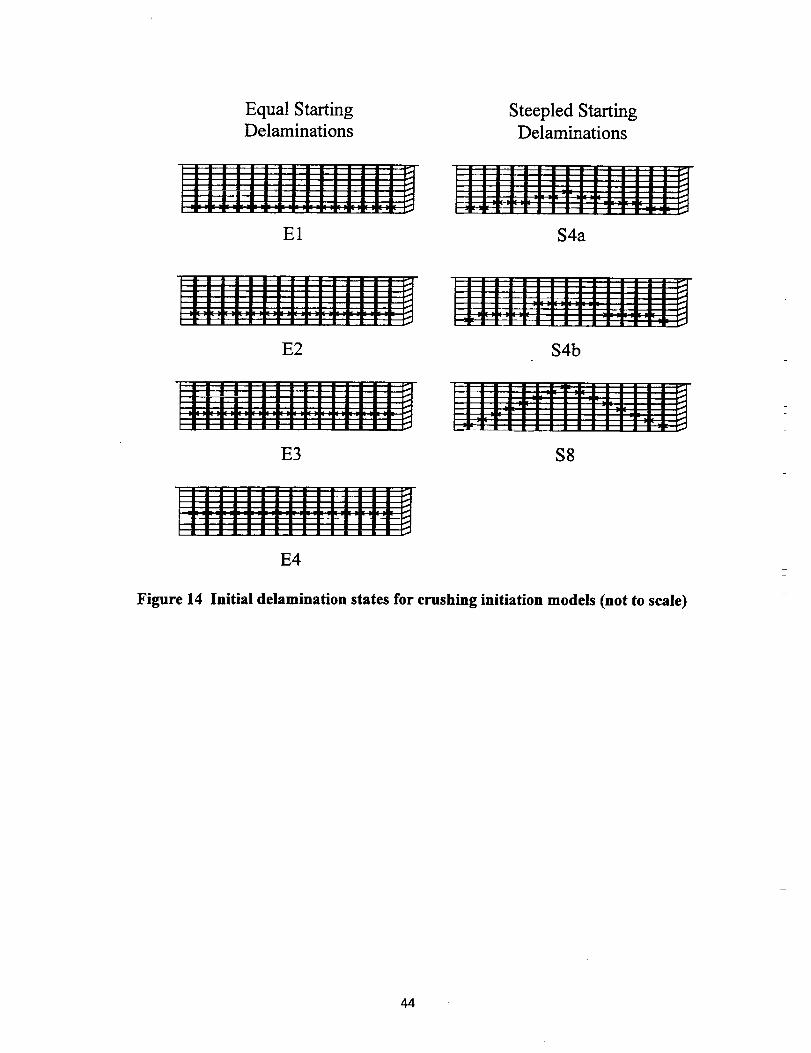
Equal StartingDelaminations
Steepled StartingDelaminations
E1
[Imlmnmmnmmmlilnl_
immmianmHmmmmBnml
Immmmlmmmmmmlmmml
S4a
E2 S4b
E3 $8
E4
Figure 14 Initial delamination states for crushing initiation models (not to scale)
44
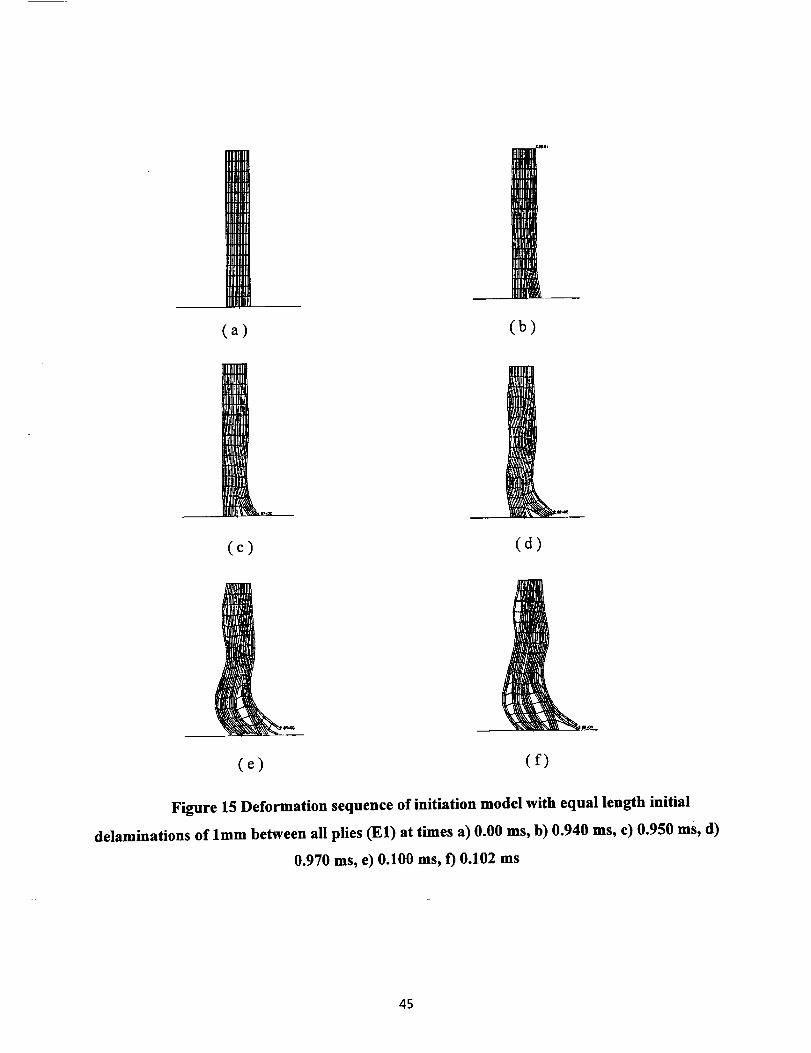
(a) (b)
(c) (d)
(e) (f)
Figure 15 Deformation sequence of initiation model with equal length initial
delaminations of lmm between all plies (El) at times a) 0.00 ms, b) 0.940 ms, c) 0.950 ms, d)
0.970 ms, e) 0.100 ms, f) 0.102 ms
45
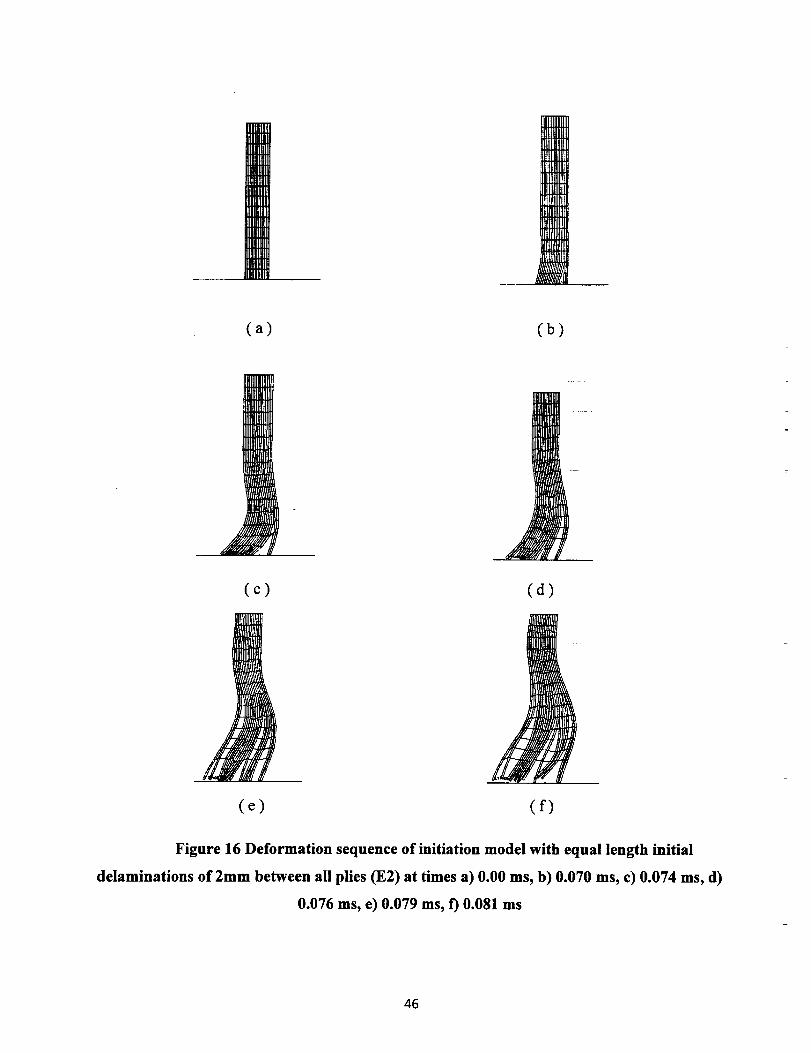
(a) (b)
(c) (d)
(e) (f)
Figure 16 Deformation sequence of initiation model with equal length initial
delaminations of 2mm between all plies (E2) at times a) 0.00 ms, b) 0.070 ms, c) 0.074 ms, d)
0.076 ms, e) 0.079 ms, f) 0.081 ms
46
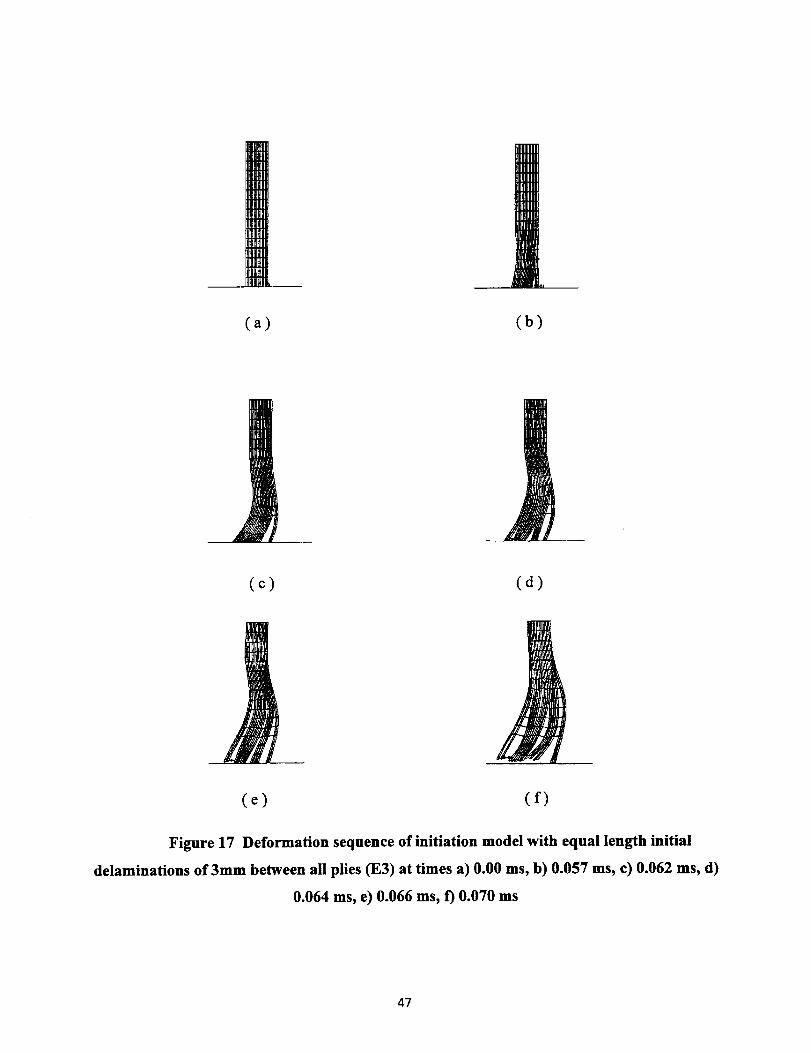
(a) (b)
(c) (d)
(e) (f)
Figure 17 Deformation sequence of initiation model with equal length initial
delaminations of 3mm between all plies (E3) at times a) 0.00 ms, b) 0.057 ms, c) 0.062 ms, d)
0.064 ms, e) 0.066 ms, f) 0.070 ms
47
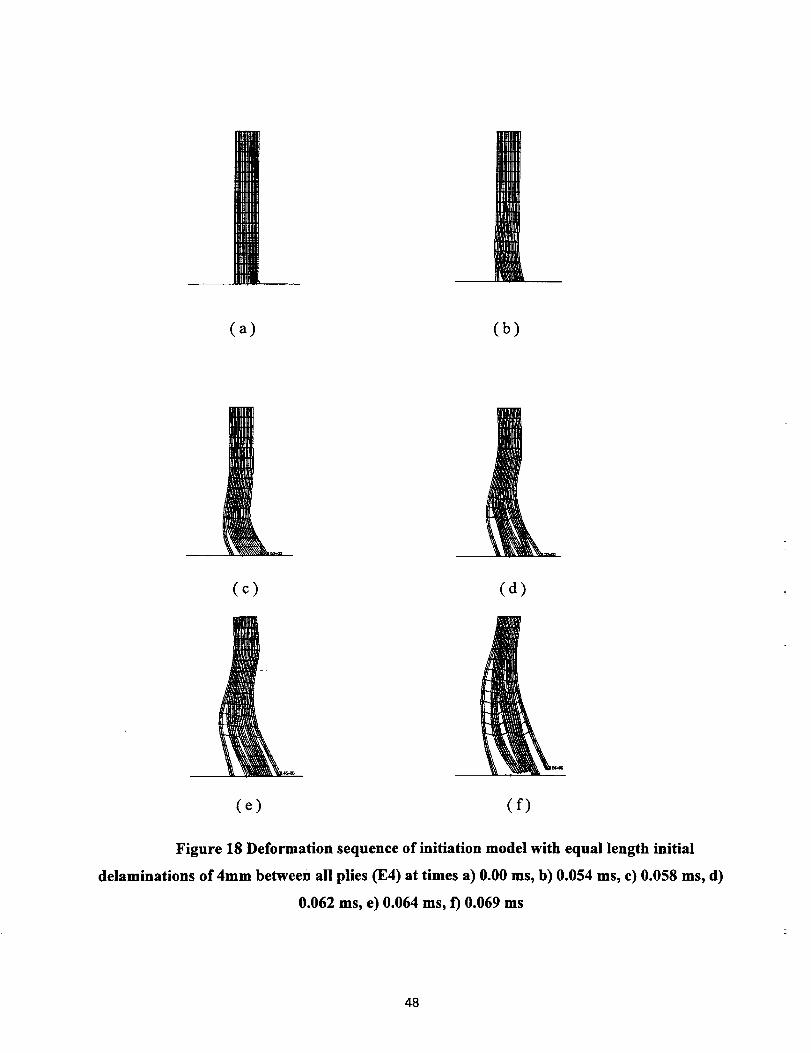
(a) (b)
(c) (d)
(e) (f)
Figure 18 Deformation sequence of initiation model with equal length initial
delaminations of 4mm between all plies (E4) at times a) 0.00 ms, b) 0.054 ms, c) 0.058 ms, d)
0.062 ms, e) 0.064 ms, f) 0.069 ms
48
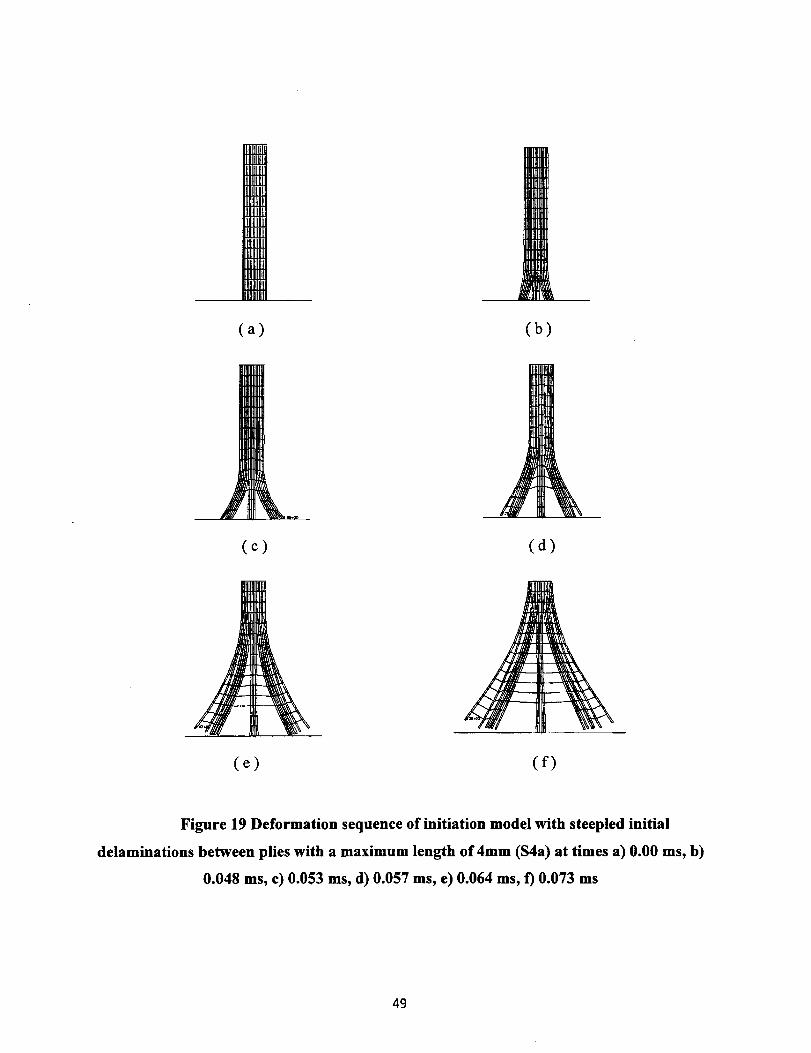
(a) (b)
(c) (d)
(e) (f)
Figure 19 Deformation sequence of initiation model with steepled initial
delaminations between plies with a maximum length of 4mm (S4a) at times a) 0.00 ms, b)
0.048 ms, c) 0.053 ms, d) 0.057 ms, e) 0.064 ms, f) 0.073 ms
49
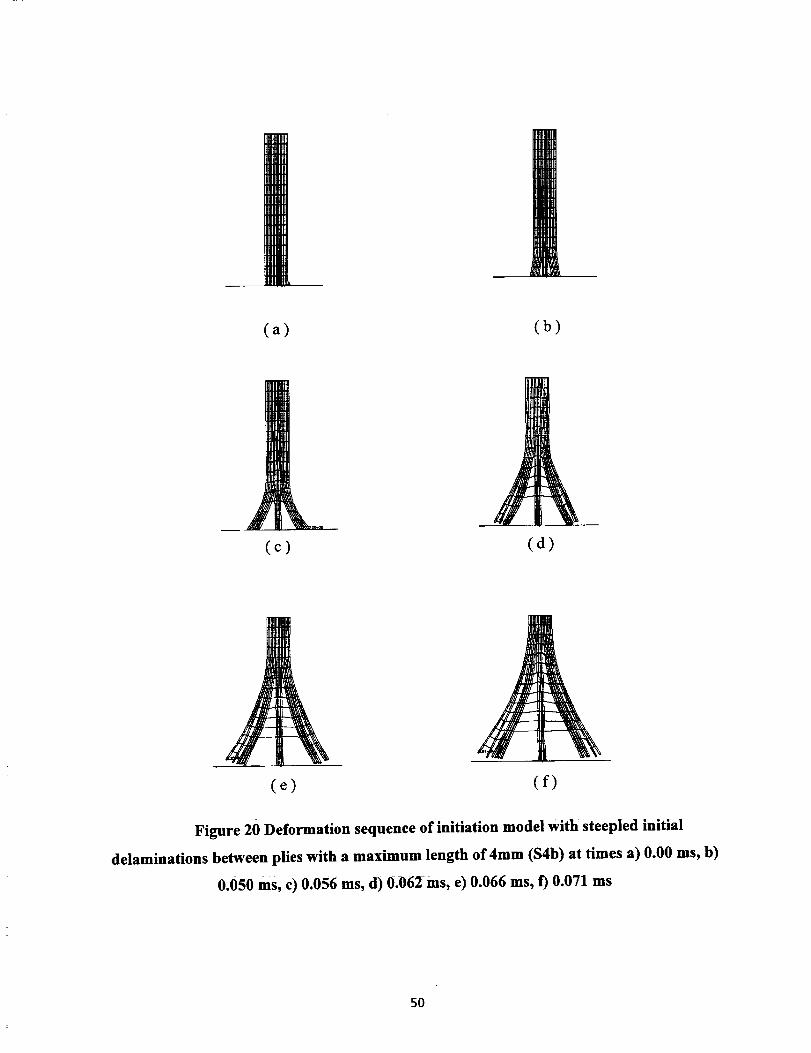
(a) (b)
(c) (d)
(e) (f)
Figure 20 Deformation sequenee of initiation model with steepled initial
delaminations between plies with a maximum length of 4mm (S4b) at times a) 0.00 ms, b)
0.050 ms, c) 0.056 ms, d) 0.062 ms, e) 0.066 ms, f) 0.071 ms
50
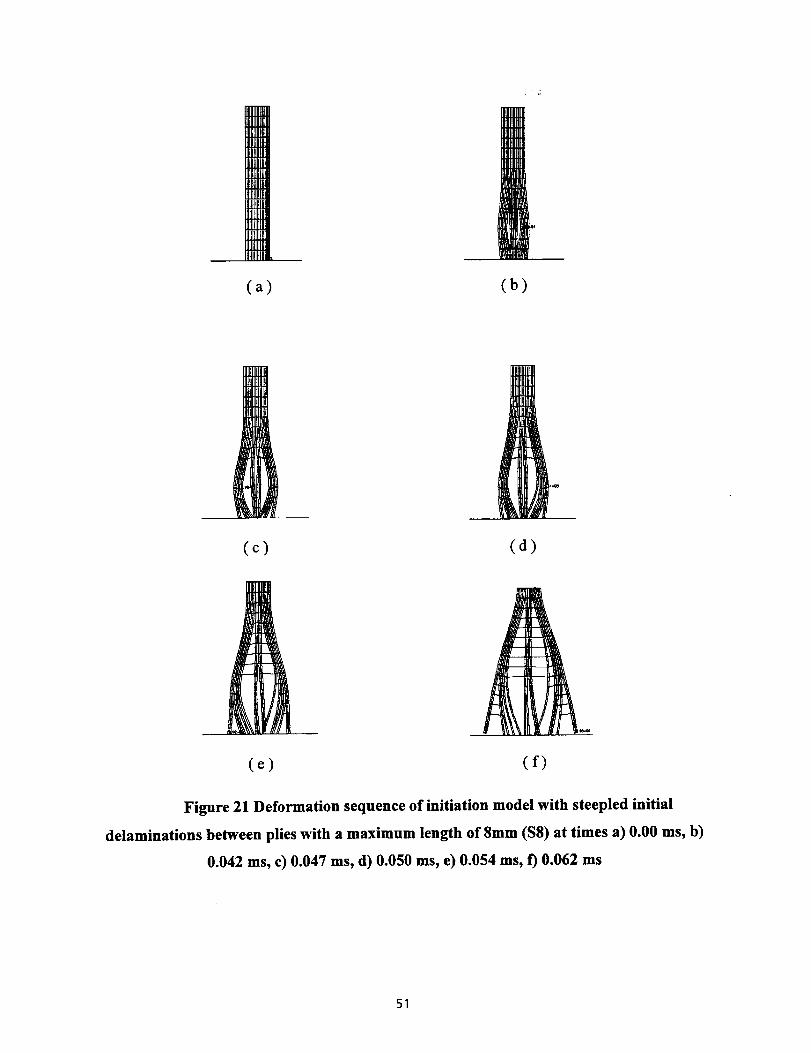
(a) (b)
(c) (d)
(e) (f)
Figure 21 Deformation sequence of initiation model with steepled initial
delaminations between plies with a maximum length of 8mm ($8) at times a) 0.00 ms, b)
0.042 ms, c) 0.047 ms, d) 0.050 ms, e) 0.054 ms, f) 0.062 ms
51
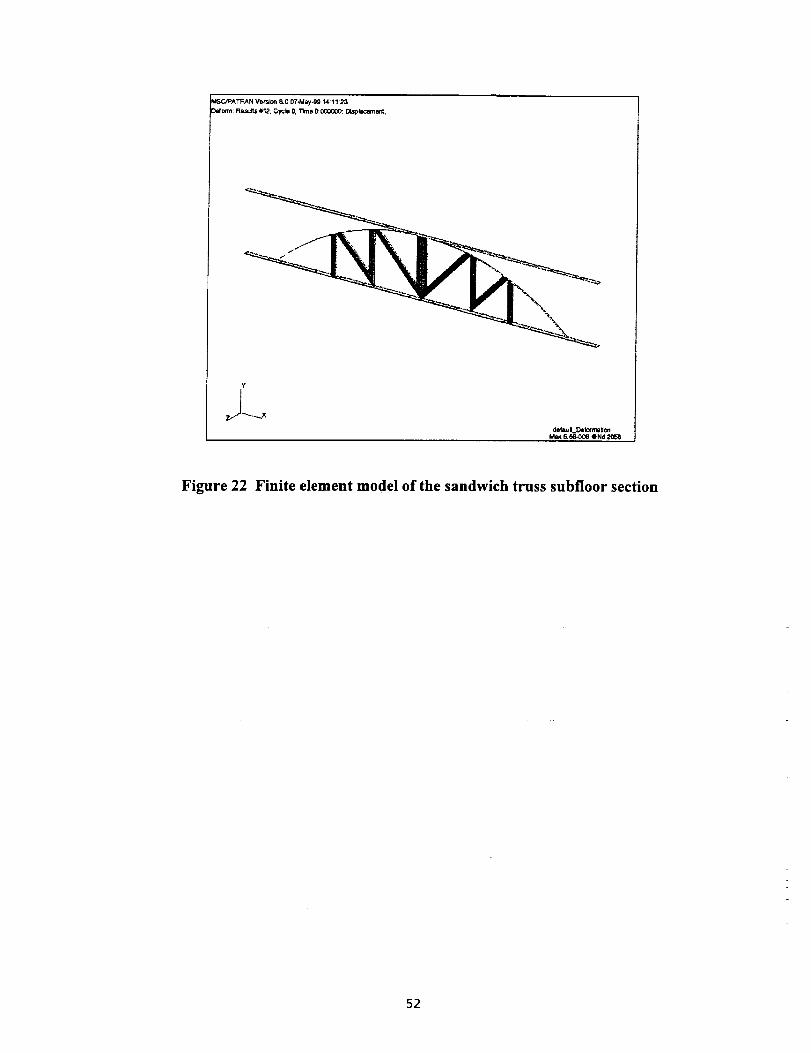
MSC_ATRA N Ve_on 8.0 OT-May-gg 14;11;23
_o¢n1: Re._Rs #12, Cycle 0, Tbne 0._(X_O: DLsplac_nl_,
Y
_ellu l_DIforrr_=on :M_ 656-0136 ONd 2058
Figure 22 Finite element model of the sandwich truss subfloor section
52

Figure 23 Front view of finite element mesh used for sandwich truss model
53
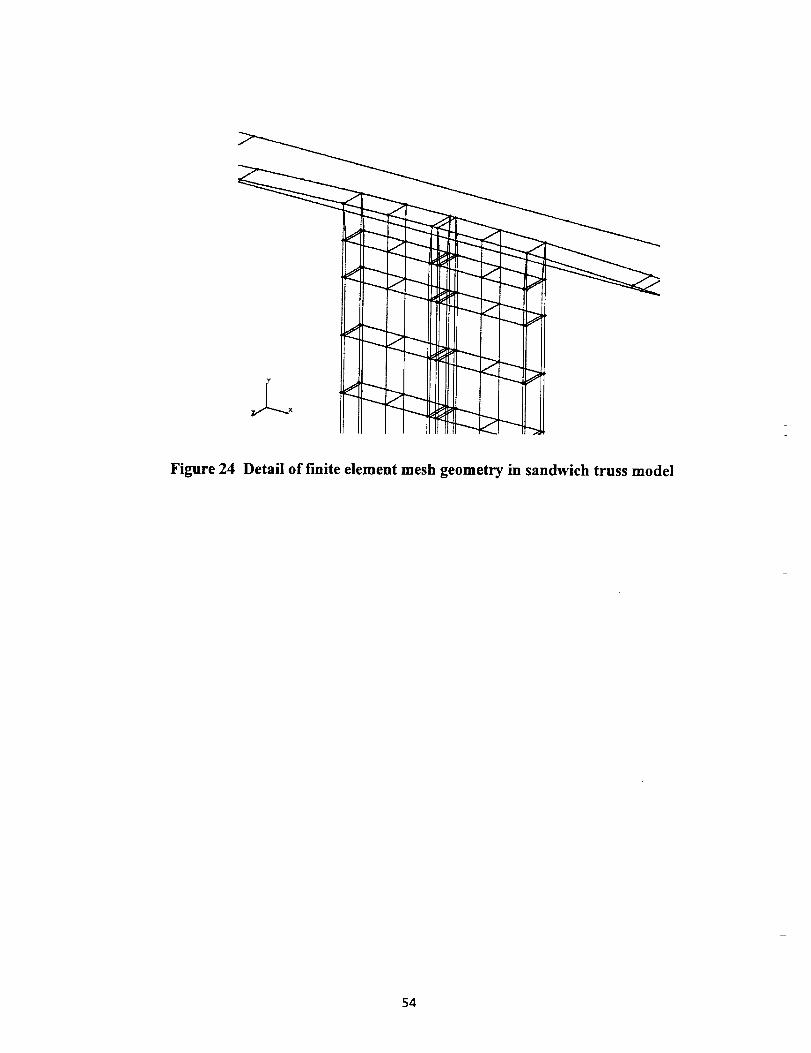
Figure 24 Detail of finite element mesh geometry in sandwich truss model
54
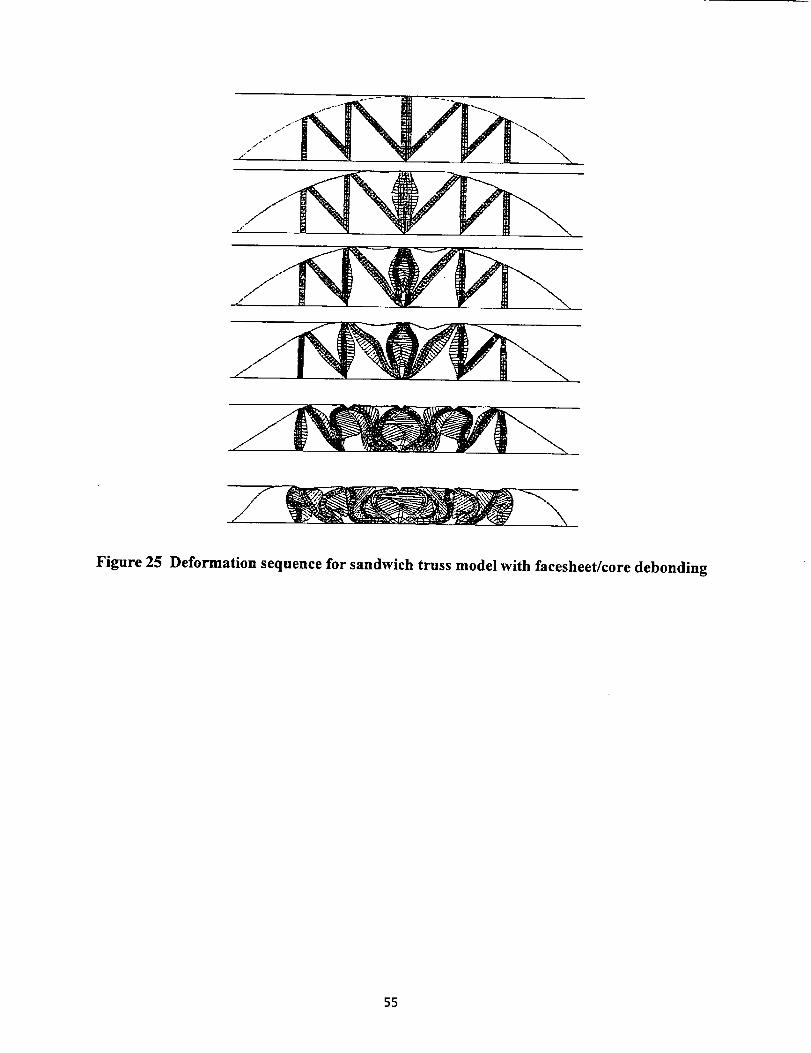
Figure 25 Deformation sequence for sandwich truss model with facesheet/core debonding
55
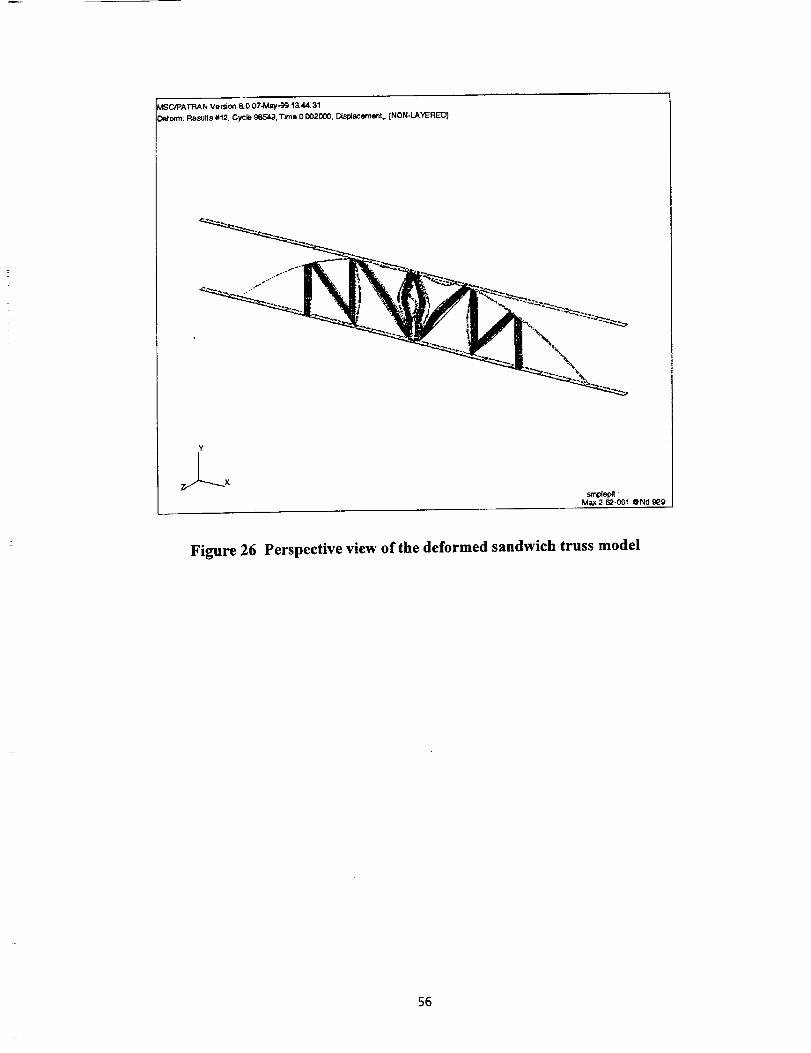
_C_PAT'RAN Version 8.0 07-May-_ I_44:31
)eforrn: P,_su_Ls #12. Cyc_ 96549. Tim8 0.002000, Disp4acernent., (NON-LAYERED)
Ma_2.62-001 @Nd _9
Figure 26 Perspective view of the deformed sandwich truss model
56
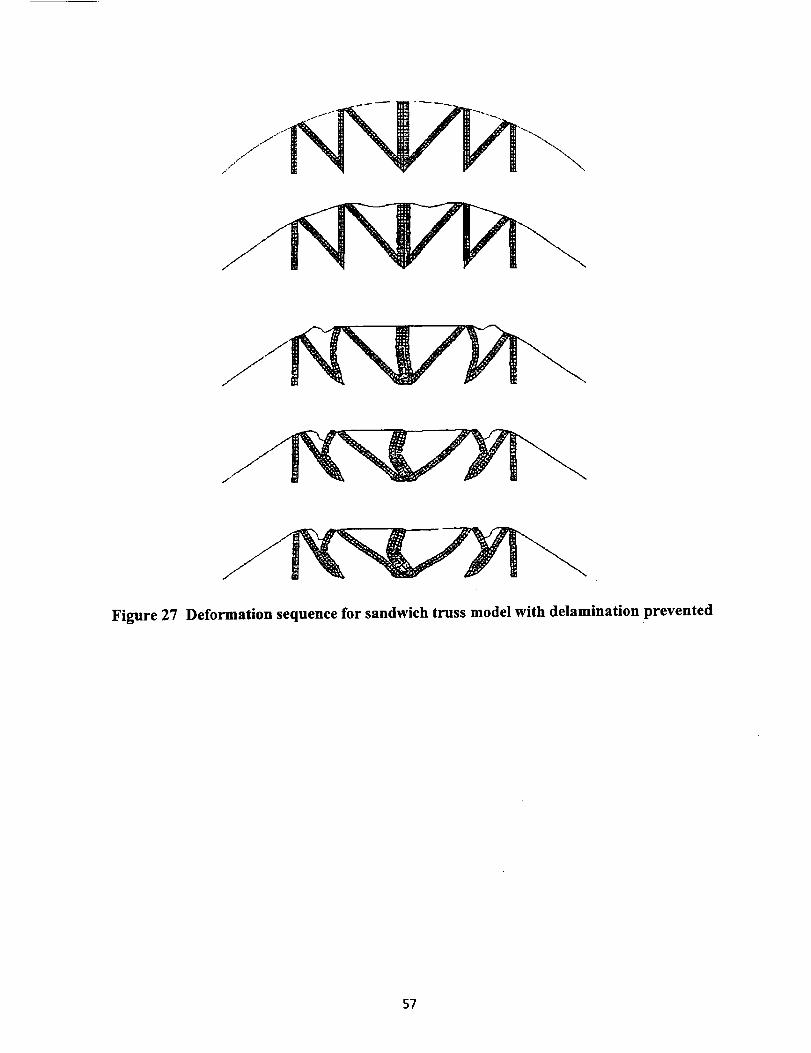
//jj.j,.l_
Figure 27 Deformation sequence for sandwich truss model with delamination prevented
57
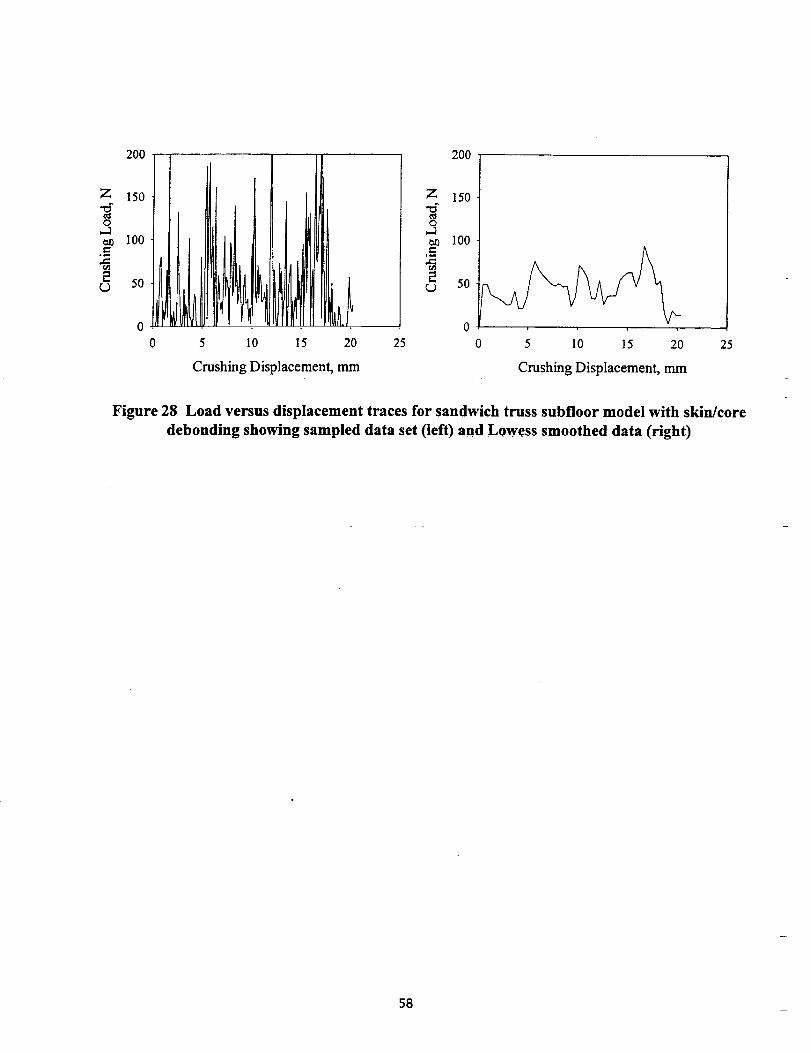
Z
200
150
100
50
O,
200
Z 150
o
100.__
2(.) 50
0 5 I0 25 25
Crushing Displacement, mm
O 5 10 15 20
Crushing Displacement, mm
Figure 28 Load versus displacement traces for sandwich truss subfloor model with skin/core
debonding showing sampled data set (left) and Lowess smoothed data (right)
58
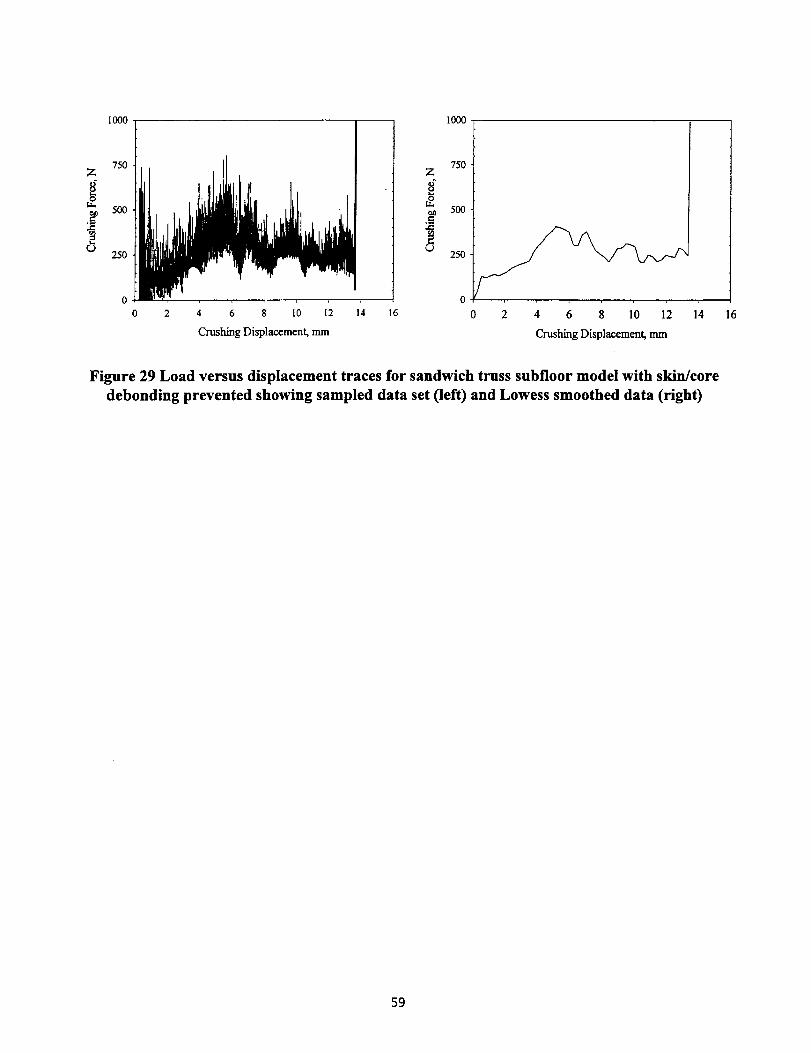
1ooo 1ooo
Z 750
,oo250
0 , , , ,
Z
0
.S
75O
5O0
250
0 2 4 6 8 I0 12 14 16 0 2 4 6 8 10 12 14
Crushing Displacement, mm Crushing Displacement, ram
16
Figure 29 Load versus displacement traces for sandwich truss subfloor model with skin/core
debonding prevented showing sampled data set (left) and Lowess smoothed data (right)
59
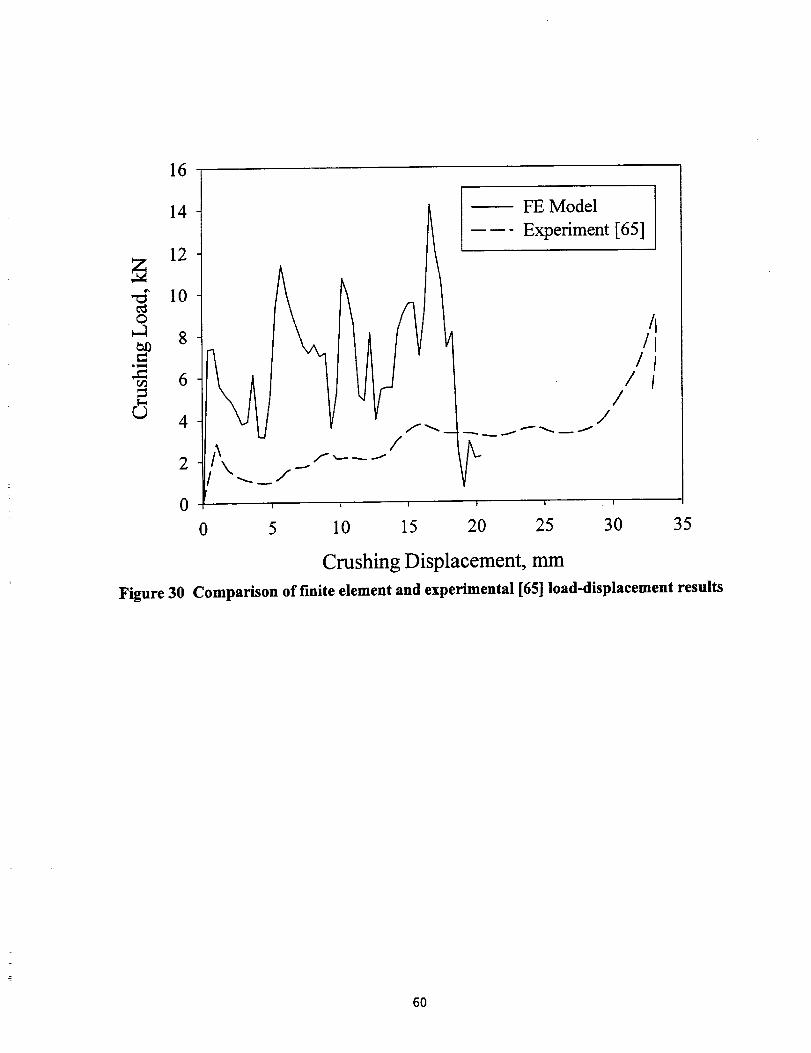
16
14
12
10@
8
*_,,q
6
r,.)4
o
/
FE Model
Experiment [65]
2
t t I t I I
5 10 15 20 25 30
/i/I
/
//
¢35
Crushing Displacement, mm
Figure 30 Comparison of f'mite element and experimental [65] load-displacement results
60
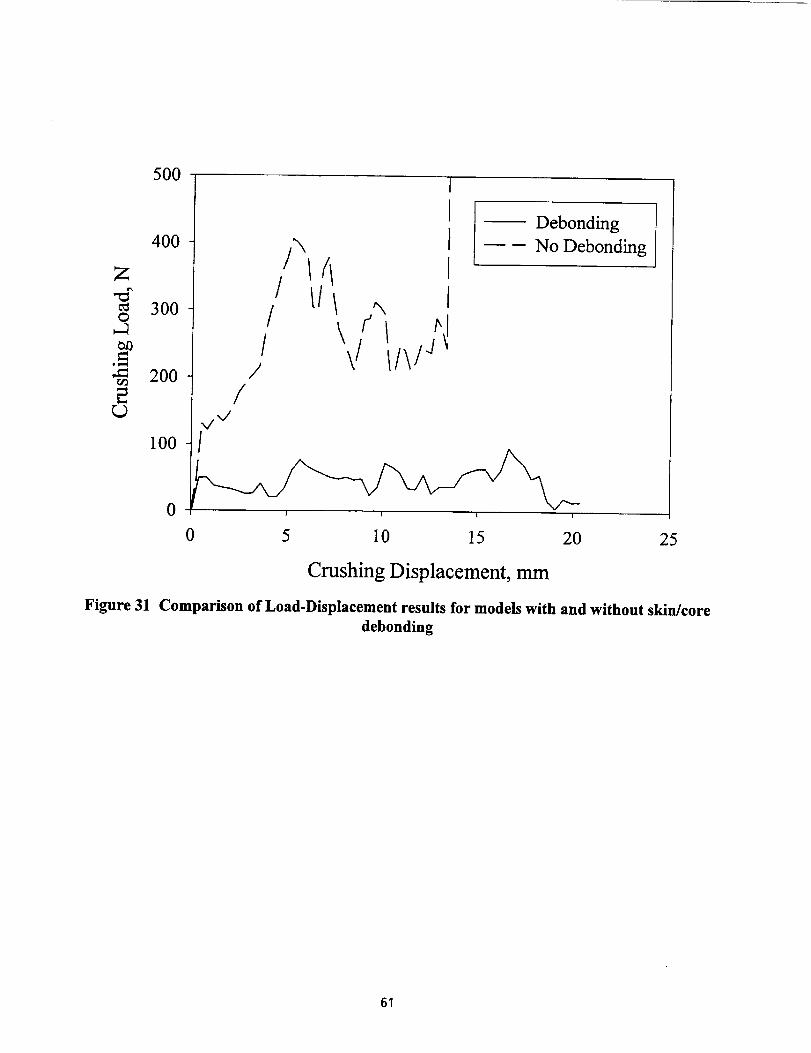
2:
O
e_0
J_
2L)
500
400
300
200
100
0
I
I
I
/ /"
/
/
Debonding
-- No Debonding
x/x/
/
I I I I
Figure 31
0 5 10 15 20 25
Crushing Displacement, mm
Comparison of Load-Displacement results for models with and without skin/core
debonding
61
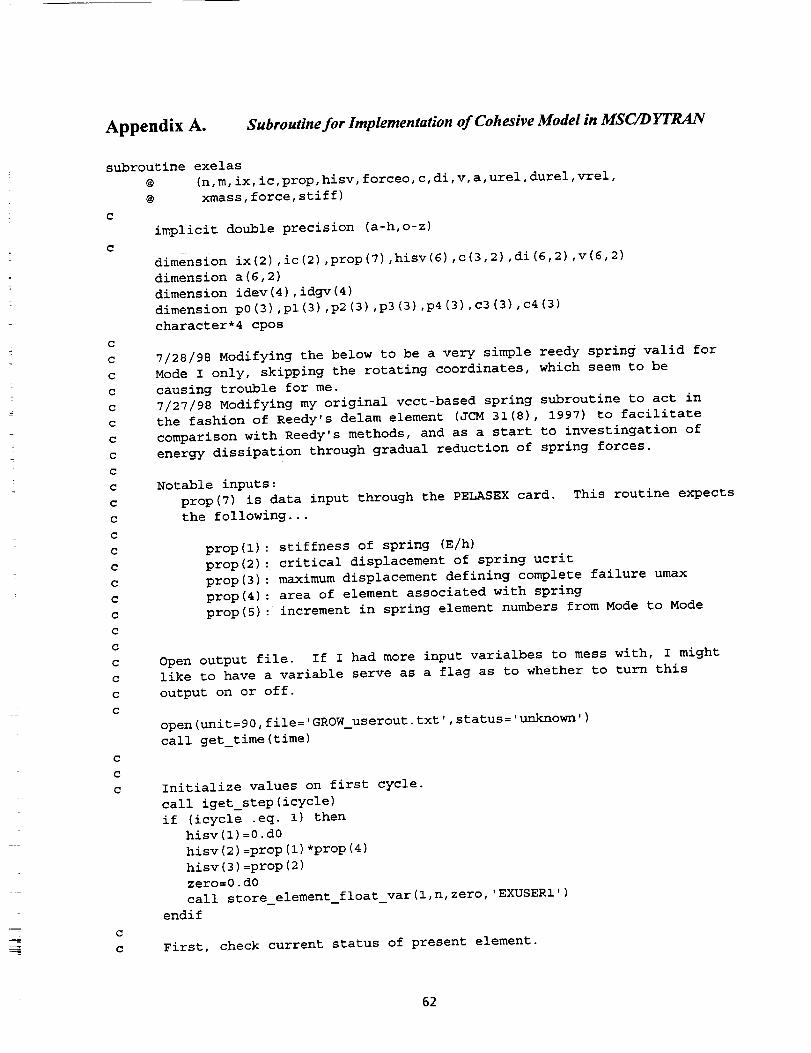
Appendix A. Subroutine for Implementation of Cohesive Model in MSC/D YTRAN
subroutine exelas
@ (n,m, ix, ic,prop,hisv, forceo,c,di,v,a,urel,durel,vrel,
@ xmass,force,stiff)
c
c
C
c
c
c
c
C
c
c
c
c
c
c
c
c
c
c
c
c
c
c
c
c
c
c
C
C
C
C
c
implicit double precision (a-h,o-z)
dimension ix(2) ,ic(2),prop(7),hisv(6) ,c(3,2),di(6,2) ,v(6,2)
dimension a (6,2)
dimension idev (4) ,idgv (4)
dimension p0(3) ,pl(3),p2(3) ,p3(3) ,p4(3),c3(3),c4(3)
character*4 cpos
7/28/98 Modifying the below to be a very simple reedy spring valid for
Mode I only, skipping the rotating coordinates, which seem to be
causing trouble for me.
7/27/98 Modifying my original vcct-based spring subroutine to act in
the fashion of Reedy's delam element (JCM 31(8), 1997) to facilitate
comparison with Reedy's methods, and as a start to investingation of
energy dissipation through gradual reduction of spring forces.
Notable inputs:
prop(7) is data input through the PELASEX card.
the following...
This routine expects
prop(l): stiffness of spring (E/h)
prop(2) : critical displacement of spring ucrit
prop(3) : maximum displacement defining complete failure umax
prop(4) : area of element associated with spring
prop(5) : increment in spring element numbers from Mode to Mode
Open output file. If I had more input varialbes to mess with, I might
like to have a variable serve as a flag as to whether to turn this
output on or off.
open(unit=90,file='GROW_userout.txt',status='unkn°wn')
call get_time(time)
Initialize values on first cycle.
call iget_step (icycle)
if (icycle .eq. i) then
hisv (I) =0 .dO
hisv (2) =prop (I) *prop (4)
hisv (3) =prop (2)
zero=0, dO
call store_element_float_var (1, n, zero, 'EXUSERI ')
endif
First, check current status of present element.
62
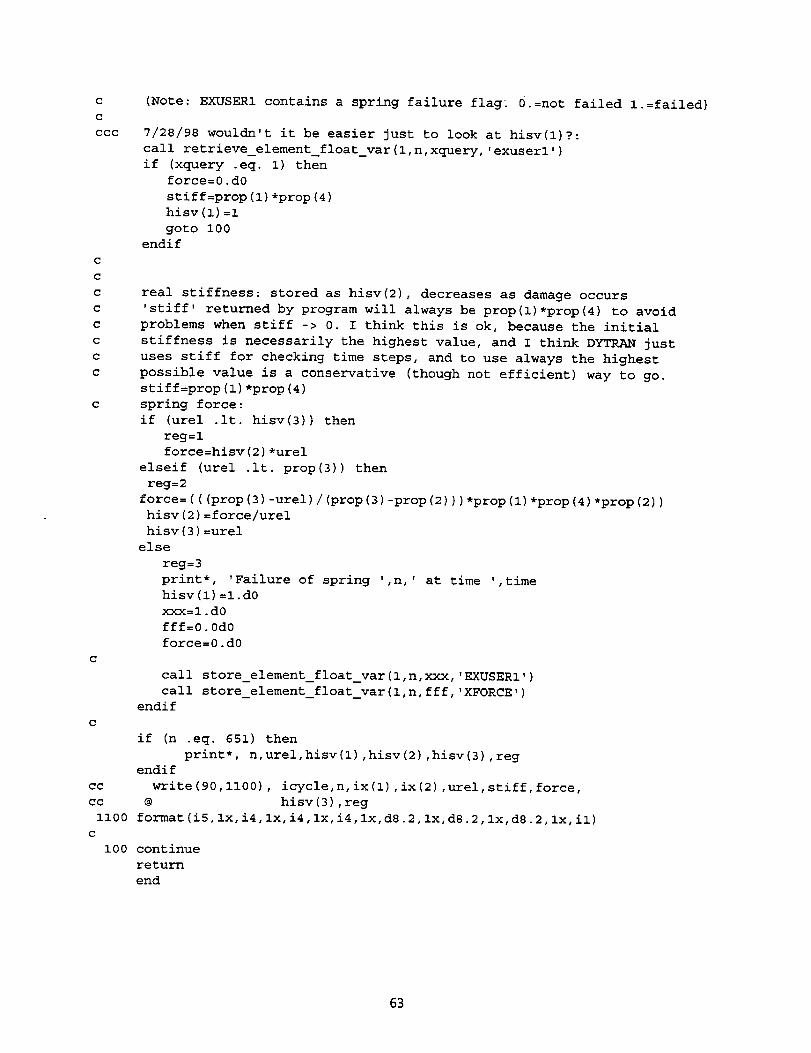
c
c
ccc
c
c
c
c
c
c
c
c
c
(Note: EXUSERI contains a spring failure flag_ 0.=not failed l.=failed)
7/28/98 wouldn't it be easier just to look at hisv(1)?:
call retrieve_element_float_var(l,n,xquery,,exuserl,)
if (xquery .eq. I) then
force=0.d0
stiff=prop(1)*prop(4)
hisv(1)=l
goto 100
endif
real stiffness: stored as hisv(2), decreases as damage occurs
'stiff' returned by program will always be prop(1)*prop(4) to avoid
problems when stiff -> 0. I think this is ok, because the initial
stiffness is necessarily the highest value, and I think DYTRAN just
uses stiff for checking time steps, and to use always the highest
possible value is a conservative (though not efficient) way to go.
stiff=prop(1)*prop(4)
spring force:
if (urel .it. hisv(3)) then
reg=l
force=hisv(2)*urel
elseif (urel .it. prop(3)) then
reg=2
force=(((prop(3)-urel)/(prop(3)-prop(2)))*prop(1)*prop(4)*prop(2))
hisv(2)=force/urel
hisv(3)=urel
else
reg=3
print*, 'Failure of spring ',n, _ at time ',time
hisv(1)=l.d0
xxx=l.d0
fff=0.0d0
force=0.d0
call store_element_float_var(l,n,xxx,'EXUSERl,)
call store_element_float_var(l,n, fff,'XFORCE,)
endif
if (n .eq. 651) then
print*, n,urel,hisv(1) ,hisv(2) ,hisv(3),reg
endif
cc write(90,1100), icycle,n, ix(1),ix(2),urel,stiff,force,
cc @ hisv (3) , reg
II00 format(i5,1x,i4,1x, i4,1x, i4,1x,d8.2,1x,d8.2,1x, dS.2,1x, il)
c
i00 continue
return
end
63
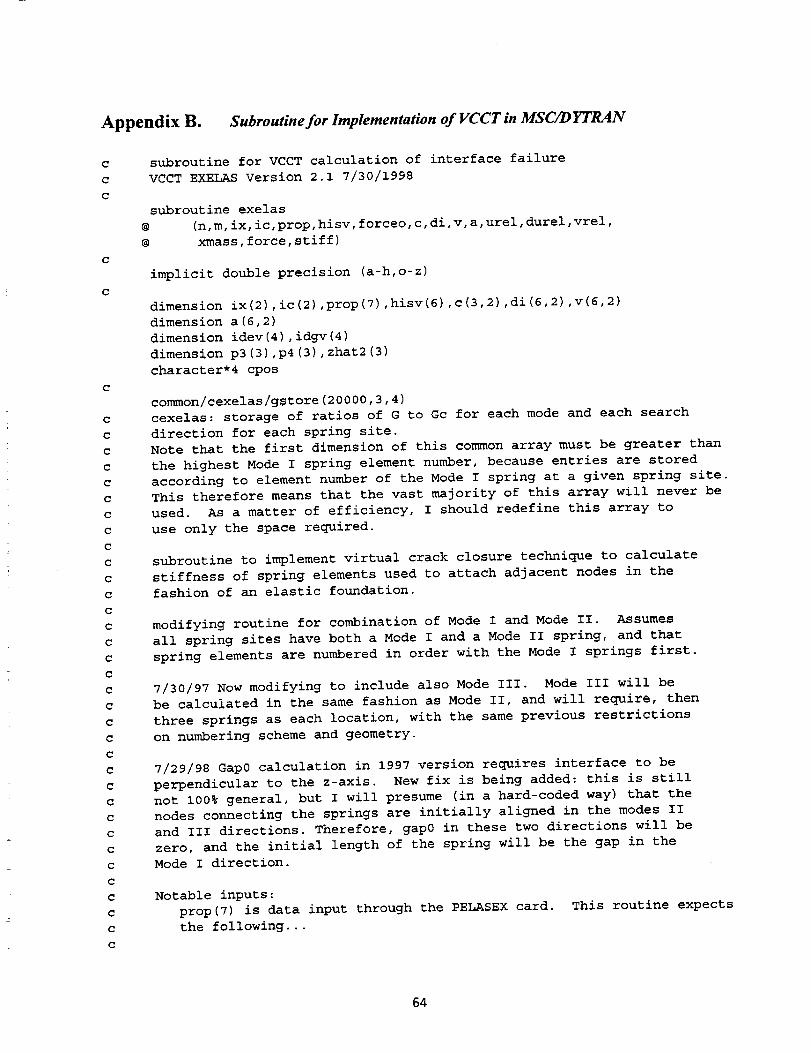
Appendix B. Subroutine for Implementation of VCCT in MSC/D YTRAN
c
c
c
c
c
c
c
c
c
c
c
c
c
c
c
c
c
c
c
c
c
c
c
c
C
c
c
c
c
c
c
c
c
c
subroutine for VCCT calculation of interface failure
VCCT EXELAS Version 2.1 7/30/1998
subroutine exelas
@ (n,m, ix, ic,prop,hisv, forceo,c,di,v,a,urel,durel,vrel,
@ xmass,force,stiff)
implicit double precision (a-h,o-z)
dimension ix (2),ic(2),prop(7) ,hisv(6) ,c(3,2),di(6,2) ,v(6,2)
dimension a (6,2)
dimens ion idev (4 ) , idgv (4 )
dimension p3(3) ,p4(3),zhat2(3)
character*4 cpos
common/cexelas/gstore(20000,3,4)
cexelas: storage of ratios of G to Gc for each mode and each search
direction for each spring site.
Note that the first dimension of this common array must be greater than
the highest Mode I spring element number, because entries are stored
according to element number of the Mode I spring at a given spring site.
This therefore means that the vast majority of this array will never be
used. As a matter of efficiency, I should redefine this array to
use only the space required.
subroutine to implement virtual crack closure technique to calculate
stiffness of spring elements used to attach adjacent nodes in the
fashion of an elastic foundation.
modifying routine for combination of Mode I and Mode II. Assumes
all spring sites have both a Mode I and a Mode II spring, and that
spring elements are numbered in order with the Mode I springs first.
7/30/97 Now modifying to include also Mode III. Mode III will be
be calculated in the same fashion as Mode II, and will require, then
three springs as each location, with the same previous restrictions
on numbering scheme and geometry.
7/29/98 Gap0 calculation in 1997 version requires interface to be
perpendicular to the z-axis. New fix is being added: this is still
not 100% general, but I will presume (in a hard-coded way) that the
nodes connecting the springs are initially aligned in the modes II
and III directions. Therefore, gap0 in these two directions will be
zero, and the initial length of the spring will be the gap in the
Mode I direction.
Notable inputs:
prop(7) is data input through the PELASEX card.
the following...
This routine expects
64
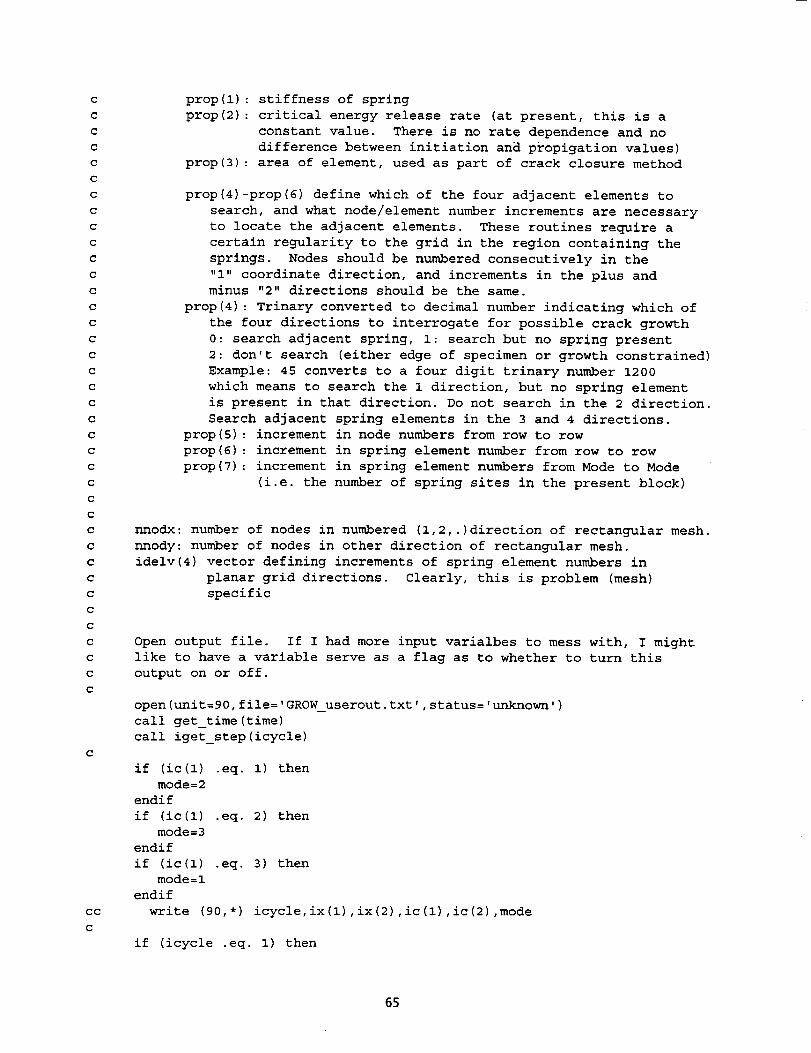
c
c
c
c
c
c
c
c
c
c
c
c
c
c
c
c
c
c
c
c
c
c
c
c
c
c
c
c
c
c
c
c
c
c
c
c
c
c
c
cc
c
prop(l) : stiffness of spring
prop(2) : critical energy release rate (at present, this is a
constant value. There is no rate dependence and no
difference between initiation and propigation values)
prop(3) : area of element, used as part of crack closure method
prop(4)-prop(6) define which of the four adjacent elements to
search, and what node/element number increments are necessary
to locate the adjacent elements. These routines require a
certain regularity to the grid in the region containing the
springs. Nodes should be numbered consecutively in the
"i" coordinate direction, and increments in the plus and
minus "2" directions should be the same.
prop(4): Trinary converted to decimal number indicating which of
the four directions to interrogate for possible crack growth
0: search adjacent spring, i: search but no spring present
2: don't search (either edge of specimen or growth constrained)
Example: 45 converts to a four digit trinary number 1200
which means to search the 1 direction, but no spring element
is present in that direction. Do not search in the 2 direction.
Search adjacent spring elements in the 3 and 4 directions.
prop(5): increment in node numbers from row to row
prop(6) : increment in spring element number from row to row
prop(7) : increment in spring element numbers from Mode to Mode
(i.e. the number of spring sites in the present block)
nnodx: number of nodes in numbered (l,2,.)direction of rectangular mesh.
nnody: number of nodes in other direction of rectangular mesh.
idelv(4) vector defining increments of spring element numbers in
planar grid directions. Clearly, this is problem (mesh)
specific
Open output file. If I had more input varialbes to mess with, I might
like to have a variable serve as a flag as to whether to turn this
output on or off.
open(unit=90,file='GROW_userout.txt',status='unknown,)
call get_time(time)
call iget_step(icycle)
if (ic(1) .eq. I) then
mode=2
endif
if (ic(1) .eq. 2) then
mode=3
endif
if (ic(1) .eq. 3) then
mode=l
endif
write (90,*) icycle,ix(1),ix(2),ic(1),ic(2),mode
if (icycle .eq. I) then
65
c
c
c
c
c
c
c
c
c
c
c
c
c
c
c
c
,Internal error in user defined exelas subroutine:'
, Mode I spring element # too big for gstore array'
, Modify user subroutine, and relink to DYTRAN to'
, increase size of gstore array.'
gap0 is assumed zero for modes II, III directions, and is the
original spring length for Mode I direction
gap0=0.d0
if (mode .eq. 15 then
check node number for comparability with storage of gstore array in
commone block above. It's kind of cheezy, but I have a hard coded
limit in element number of Mode I springs, which is currently 20000
if (n .gt. 200005 then
print*,
print*,
print*,
print*,
stop
endif
gap0=dsqrt((c(l,l)-c(l,2))**2+(c(2,1)-c(2,2))**2+
(c(3,1)-c(3,2))*'2)@
endif
hisv(6)=gap0
convert prop(4) to trinary to define searching directions,
results in hisv(2)-hisv(5)
and store
ntl=prop (4)/27
nt2= (prop (4) - (ntl*27))/9
nt3= (prop (4) -ntl*27-nt2*9)/3
nt4=prop (4) -ntl*27-nt2* 9-nt3"3
hisv (2) =ntl
hisv (3 )=nt2
hisv (4) =nt3
hisv (5) =nt4
initialize hisv(1)
hisv(1)=0.d0
zero=0.d0
call store element float var(l,n, zero,'EXUSERl')
don't calculate SERR on first time step
goto 100
endif
idev(4) defines the increment in spring element in the four searching
directions idgv(4) is a similar array defining the increments in grid
point numbers among adjacent nodes. These definitions, obviously,
depend on regularity of the mesh numbering scheme.
idev (i) =I
idev (2) =-prop (6)
idev (3) =-I
idev (4) =prop (6)
idgv (I) =i
idgv (2 ) = -prop (5 )
idgv (3) =-l
idgv (4) =prop (5)
66
c
c
c
c
c
c
c
c
c
c
c
c
c
c
c
c
c
c
c
c
c
c
c
c
c
c
c
c
c
c
c
c
c
Search through four directions and if appropriate, calculate
SERR for that direction
First, check current status of present element. If it has failed already
we do not search this spring at all.
(Note: EXUSERI contains a spring failure flag. 0.=not failed l.=failed)
call retrieve_element_float_var(l,n,xquery,,exuserl,)
if (xquery .eq. I) then
hisv(1)=l
goto 100
endif
get node numbers of present spring element
nl=ix (i)
n2=ix (2)
cycle through four possible directions
do I0 j=l,4
g=0.d0
gr=0.d0
gap=0.d0
du=0.d0
if search flag for direction j indicates 2, don't search direction j
if (hisv(j+l) .eq. 2) goto 9
if an unbroken spring is present in direction j, don't search that way
if (hisv(j+l) .eq. 0) then
na=n+idev(j)
call retrieve_element_float_var(l,na,xfail,,EXUSERl,)
if (xfail .eq. 0) goto 9
endif
if we've gotten to this point, we definitely need to check the SERR
Now, we want to know the displacements of the free nodes adjacent to
the present spring element, in the coordinate system as defined for
the present spring element. This is a moving coordinate system defined
by a CORD3R card for each spring element, and based upon three nodes:
the two endpoints nodes of the current spling and a node in the plane
of the first endpoint node and adjacenet in (hopefully) the direction
opposite of the searching direction. The choice of this third node
is somewhat problematic, beacuse its selection requires a priori
knowledge of which direction the crack front will advance. Hopefully,
errors will be slight, unless this third node is in fact in the
actual searching direction. This would be terrible, and may be a
problem I'll need to confront, but not at the moment. A way out would
simply be to define the third point in the opposite direction to the
searching direction. This is easy enough (unless we're at a boundary)
and could be implemented. The problem, then is what happens to the
coordinate system defining the spring force directions? This cannot
be changed at will so easily.
7/29/98 I am going to go ahead with the above suggestion and make the
67
c
c
c
C
c
c
c
c
c
c
c
c
c
c
c
c
c
c
c
c
c
c
c
c
c
c
c
c
c
c
c
c
c
c
c
c
c
c
c
c
internal 3rd point oppose the searching direction. This still leaves
a problem of what happens when we're at the end of the line, and there
are no nodes opposing the searching direction. In this case chaos will
erupt in one of two ways: i) the 3rd node will be some random node
located somewhere else in the mesh or 2) the 3rd node will not even
be in the mesh at all (either <=0 or >#of nodes in the model) in which
case the program will crash.
7/30/98 I am abandoning the above idea due to the propblems of _ing
of the end, and of inconsistency between spring force and nearby
displacement coordinate systems...
Modifying calculation of displacements of nearby nodes to make the
calculation relative to the local coordinate system defined at end
number one of the spring element in question. This removes any internal
hard coding of coordinate system directions, which is good. However, the
coordinate system definition is then fixed by the definition of the
spring card, and is inflexible relative to the actual direction of the
advancing crack. Therefore, it is possible that the 3rd node points
in the direction of the oncoming crack which might present some error.
or it might not. Or not really, the spring defines the z axis, and the
x axis is jsut the projection of the'perpendicular point onto the
plane perpendicular to the z axis. I think that this may be just fine.
fill position vectors defining the local coordinate system.
DYTRAN only gives yhat and zhat, not xhat! I'll calculate
xhat internally to the cordcalc2 subroutine, but it seems pretty
stingy of msc not to give x_hat as an element variable. Am I overlooking
some good reason why only 2 of 3 coordinate vectors are given?
Actually, the situation is even more confusing than that given above...
as far as I can tell, ZHAT2{XYZ} give a normal vector pointing in the
cl (or c2) coordinate direction as defined through the celasl card,
and any associated coordinate system cards. ZHAT2{XY} seem to be
cl and c2. ZHAT2Z, and YHATIxyz and YHAT2xyz seem to always have zeros
or other strange numbers I can't make sense of. I would like some
confirmation from MSC that my interpretation of these variables is
correct, however, I believe that ZHAT2 will be enough to allow me
to complete my modifications to the subroutine to ensure consistent
compuation of the force and the nearby displacements for use in the
VCCT computation.
call retrieve element__loat_var(l,n, zhl,'ZHAT2X')
call retrieve--element_float_var(l,n, zh2,'ZHAT2Y')
call retrieve element float_var(l,n, zh3,'ZHAT2Z')
zhat2(1)=zhl
zhat2(2)=zh2
zhat2(3)=zh3
node numbers of currently investigated adjacent spring ends
n3=nl+idgv(j)
n4=n2+idgv(j)
fill position vectors of these adjacent node points
call retrieve gridpoint float var(l,n3,x0,'XPOS')
call retrieve_gridpoint_float_var(l,n3,y0,'YPOS')
call retrieve_gridpoint_float_var(l,n3,z0,'ZPOS')
p3(1)=x0
68
c
c
c
c
c
c
c
c
c
c
C .
c
c
c
c
c
c
c
c
c
c
c
c
ccc
c
c
c
c
c
c
1020
1021
c
p3 (2)=y0
p3 (3)=z0
call retrieve_gridpoint_float_var (I, n4, x0, 'XPOS ' )
call retrieve_gridpoint_float_var (I, n4, y0, 'YPOS ' )
call retrieve_gridpoint_float_var (I, n4, z0, 'ZPOS ')
p4 (I) =x0
p4 (2)=y0
p4 (3) =z0
du is relative displacement between nodes p3 and p4 in the
zhat2 direction, computed by a simple dot product.
du=0.d0
do i=I,3
du=du+(p4(i)-p3(i))*zhat2(i)
enddo
The following represents an approxamation... I am using the initial gap
at the present spring in place of the initial gap at the adjacent node
pair. Obviously, if the interface is of constant thickness they will be
the same. If the interface were tapered, a small error would be
introduced here. This is another artifact of the lack of ZDIS variables.
gap=du- hisv (6 )
Notes on above:
Should I take an absolute value? Is there a geometry dependent sign
convention implicit here? I think it is OK as written, provided the
coordinate system defined for the spring is the same as that defined
by p0, pl, and p2 above. If these are different, there could be a
sign problem. 7/30/98: difference between coord, systems eliminated.
fac=l.d0/(2.d0*prop(3))
note, I am actually using the force from the previous time step in this
calculation. I could alter this by just substituting stiff*urel for
forceo in the following. This might be better, but I want to leave
it for now so I can better compare this cleaned up routine with the
old one.
g=fac*forceo*gap
g=fac*prop(1)*urel*gap
gr: ratio of g to critical value in prop(2). This will be combined
for all spring modes to predict mixed-mode fracture. More complicated
failure locii than this linear one will require more creativity in
sharing data between springs.
gr=g/prop(2)
if (mod(icycle,50) .eq. 0) then
write(90,1020) icycle,ix(1),mode,j,forceo,gap,gr
endif
format(i7,1x, i5,1x, il,lx, il,lx, dl3.5,1x, dl3.5,1x, dl3.5)
format(8x, i5,1x,dl3.5,1x, dl3.5,1x,dl3.5)
69
c
9
1009
c
i0
c
c
c
c
c
c
C
c
c
c
c
c
c
c
c
c
c
c
c
c
c
c
c
c
do not allow positive serr for closing displacement in Mode I
if (mode .eq. 1 .and. g .it. 0.d0) gr=0.d0
gstore(n-(mode-l)*prop(7),mode,j)=gr
format(fl3.5,1x, i5,1x, il,dl3.5,1x,dl3.5,1x, dl3.5,1x,dl3-5)
continue
................... Failure Determination ..........................
the last step is to introduce a failure theory based on the
strain enegy release rates. This assumes a rate independent critical
release rate. The failure check will only be carried out when we come
to the last of the springs at a given site, and have searched all four
searching directions. To know when we have
reached the last spring, I will assume a certain order of components:
component 3 referes to Mode I and will be assumed to be first, comp 1
referes to Mode II and will be assumed to be second.
THIS VERSION assumes a 3D (Mode I, II and III) state.
if (ic(1) .eq. 2) then
ha=n-prop (7) *2
nb=n-prop (7)
@
do j=l,4
grtot=0.d0
do mmm=l,3
if (gstore(na,mmm, j) .gt. 0.d0) then
grtot=grtot+gstore(na,mmm, j)
endif
enddo
if (grtot .ge. 1.0) then
write(*,1005) 'Failure of Spring ',n,na,j,
gstore(na,l,j),gstore(na,2,j),gstore(na,3,J)
Indicate failure in all springs at the same site.
The following is based upon a convention for which springs are numbered
in which order. AT PRESENT, I am assuming springs in order by Mode I,
(ic=3), Mode II (ic=l), Mode III (ic=2).
hisv(1)=l.d0
xxx=l.d0
fff=0.0d0
call store_element_float_var(l,na,xxx,'EXUSERl')
call store_element_float_var(l,nb,xxx,'EXUSERl')
call store_element_float_var(l,n,xxx,'EXUSERl')
call store_element_float_var(l,na, fff,'XFORCE')
call store element_float_var(l,nb, fff,'XFORCE')
call store_element_float_var(l,n,fff,'XFORCE')
to save time, jump out of the "j" loop as soon as a failure is detected.
If I wanted to get more information by continuing all searches, I could
delete the following line.
goto I00
endif
7O
c
c
ioo
c
c
c
c
c
c
c
1004
1005
c
c
enddo
endif
................... _-_ ............................................ •
........................ spring stiffness .........................
continue
set spring stiffness and force for output. The following is just a
linear elastic spring in both tension and compression until failure.
This could be made a bit more sophisticated if necessary/
if (hisv(1) .eq. 0) then
stiff=prop(l)
force=stiff*urel
else
I think I need to keep a nonzero stiffness to calculate time steps
stiff=prop(1)
force=0.d0
endif
...................................................................
format(i4,1x, il,lx,dl2.5,1x, dl2.5,1x,dl2.5,1x,dl2.5)
format(alS,2x, i6,1x, i6,1x, il,lx,dl3.5,1x,dl3.5,1x,dl3-5)
return
end
71

REPORT DOCUMENTATION PAGE For=Approv_C)MR Nn O70,4-n10,_
Public reporting burden for this collection of information is est mated to average 1 hour per response, including the time for reviewing )nstructions, searching existing datasources, gathering and maintaining the data needed and comp et ng and reviewing the collection of information Send comments r ardin thJs burd naspect of this collection of information nclud n_ su-Xe=ti_ns for r=_,ch=t'innthi- _-,.-_....... ' - -- . ^ eg g " e est'mate or any other
, s _s _ v ......... = .-,= uu,ue., ,o wasnmg[on Neaoquarters _ervlces, Directorate for Informat on Operations andReports, 1215 Jefferson Davis Highway Suite 1204 Arlington VA 22-.202-4302 and to the Office of Management and Budget Paperwork Reduchon Pro oct 0704 018Washinc=lton, DC 20503 ' ' ' . , " ( - 8),
1. AGENCY USE ONLY (Leave blank) I 2. REPORT DATE 3. REPORT TYPE AND DATES COVERED
I October 1999 Contractor Report4. TITLE AND SUuml rLE 5. FUNDING NUMBERS
Delamination Modeling of Composites for Improved Crash Analysis
6. AUTHOR(S)
David C. Fleming
7. PERFORMING ORGANIZATION NAME(S) AND ADDRESS(ES)
Florida Institute of Technology150 W. Universi b BoulevardMelbourne, FL 32901
9. SPONSORING/MONITORING AGENCY NAME(S) AND ADDRESS(ES)
National Aeronautics and Space AdministrationLangle) Research Center
Hampton, VA 2368 I-2199
11. SUPPLEMENTARY NOTES
G NAG 1-2061
WII 522-18-31-01
8. PERFORMING ORGANIZATIONREPORT NUMBER
1(). SPONSORING/MONITORINGAGENCY REPORT NUMBER
NASA/CR- 1999-20972.5
I_lngle) Technical Monitor: Karen E. Jackson
Final Report
12a. DISTRIBUTION/AVAILABILITY STATEMENT
l-!nclassi fled- Unlimited
Subject Categor) 39 Distribution: Standard
Availability: NASA CASI (301) 621-039013. ABSTRACT (Maximum 200 words)
12b. DISTRIBUTION CODE
Finite element crash modeling of composite structures is limited by the inabilib' of current commercial crash
codes to accurately model delamination growth. Efforts are made to implement and assess delamination
modeling techniques using a current finite element crash codc, MSC/DYTRAN. Three methods are evaluated,
including a straightforward method based on monitoring forces in elements or constraints representing an
interface; a cohesive fracture model proposed in the literature; and the virtual crack closure technique commonl)used in fracture mechanics. Results are compared with dynamic double cantilever beam test data from the
literaturc. Examples show that it is possible to accurateb model delamination propagation in this case.
Ho_vever, the computational demands required for accurate solution are great and reliable property data ma) notbe available to support gcnerai crash modeling efforts. Additional examples are modeled including an impact-loaded beam, damage initiation in laminated crushing specimens, and a scaled aircraft subfloor strt,cturcs in
which composite sandMch structures are used as energ)-absorbing elements. These examples illustrate some ofthe difficulties in modeling dclamination as part of a finite element crash analysis.
14. SUBJECTTERMS
crash simulation, composite failure prediction, nonlinear finite element
analysis
17. SECURITY CLASSIFICATION 18. SECUHHY CLAS_IPICAHON 19. 5P..CURITY CLA:5:51f-ICATIUNOF REPORT OF THIS PAGE OF ABSTRACT
Unclassified Unclassified Unclassified
15. NUMBER OF PAGES
7816. PRICE CODE
A0520. LIMITATION
OF ABSTRACT
UL
Prescribed by298-102
72