Embed Size (px)
Citation preview

1
282746 IMPACT2C
Quantifying projected impacts under 2°C warming Instrument Large-scale Integrating Project Thematic Priority FP7-ENV.2011.1.1.6-1
Del3.1: Climate available information over vulnerable areas
based on past experiments
Due date of deliverable 31.03.2012
Actual submission date 30.03.2012 Start date of the project 01.10.2011
Duration 48 months Organisation name of lead contractor for this deliverable
ENEA
Revision: Final
Project co-funded by the European Commission within the Seventh Framework Programme
Dissemination Level PU Public X PP Restricted to other programme participants (including the Commission Services) RE Restricted to a group specified by the consortium (including the Commission Services) CO Confidential, only for members of the consortium (including the Commission Services)
2
Executive Summary
• This report discusses the availability of climate data for impact studies in
vulnerable areas (Africa, Bangladesh and Small Islands) during the early stages
of IMPACT2C.
• ENSEMBLES-AMMA is the only international framework that has supported the
production of high-resolution dynamical downscalings of climate scenarios over
Africa.
• Only 3 simulations in the ENSEMBLES-AMMA archive of regional scenarios
fulfil the strict criterion adopted by IMPACT2C to identify the +2°C time
window and only one simulation covers the entire continent.
• In the limited number of simulations analysed for this report, regional models seem to
increase the degree of consensus of future projections on a drier Sahel with respect to
what is simulated by global models. • ENSEMBLES-AMMA archive alone provides a poor basis for a sound evaluation
the uncertainties of the projected future impacts of a 2°C global warming over
the case study areas selected for IMPACT2C.
• The global sea-level rise with respect to 1971-2000 remains below 50cm in 2100
despite a large uncertainty on polar caps and glacier melting. No significant
information on the regional patterns can be exploited from existing global scenarios.
3
1.Introduction .....................................................................................4
2. African case study...........................................................................5
2.1 Strict definition: individual ensemble members .....................8
2.2 Weak definition: Ensemble-mean results..............................16
3. Sea Level Rise ...............................................................................20
3.1 CNRM-CM3.............................................................................21
3.2 HADGEM.................................................................................23
3.3 ECHAM5/MPI-OM.................................................................25
4. Discussion ......................................................................................26
References .........................................................................................28

4
1.Introduction
IMPACT2C aims at quantifying the impacts of 2°C global warming in Europe and in other
vulnerable areas, namely the Niger and Nile river basins in Africa, Bangladesh and Small
Islands in the Indian ocean. Key to this aim is the availability of high-resolution climate
scenarios, generally produced by dynamical or statistical downscaling of coarse resolution
global scenarios. For example, it has been demonstrated that for vulnerable areas in Africa
exposed to significant drought risk, global scenarios would be insufficient to drive impact
models for the quantification of climate risk (Baron et al., 2005; Ines and Hansen, 2006).
In the case of sea-level rise, past generation of global climate models could only provide a
rough estimate of the overall effect of the thermal expansion of sea-water, along with off-line
computation of the potential additional effect of the melting of glaciers. Therefore it was not
possible to provide any reliable information on the spatial distribution of sea level rise at the
time of the IPCC 4th Assessment report.
Besides a sufficient geographical detail, the analysis envisioned in IMPACT2C implies the
availability of climate model scenarios with two important characteristics
First, the global climate scenario should meet or exceed the 2°C of warming compared to the
pre-industrial baseline. This requirement aims at focusing the impact study on the effects of
local climate fluctuations that most likely exceed the range of natural global climate
variability. It has been agreed within IMPACT2C to use the period 1971-2000 as a baseline
for defining future warming. During this period, global temperature is already about 0.5 °C
above pre-industrial level. Therefore IMPACT2C will consider climate scenarios spanning
future time windows characterized by a global warming of about 1.5 °C with respect to the
1971-2000 baseline. Additional analysis will be also performed on windows corresponding to
a global warming of 1.0°C with respect to 1971-2000, corresponding to1.5°C warming from
pre-industrial.
Furthermore, to produce climate impact assessments that are informative for policy makers,
there should be sufficient emphasis on the discussion of uncertainties implied in the analysis.
Therefore, the second desired characteristic of the underlying climate database upon which
5
the impact analysis is conducted, is that a sufficiently large number of independent
realizations of the climate scenario is available.
This report discusses the availability of climate data for impact studies in for vulnerable
areas during the early stages of IMPACT2C. In particular we need to establish if the
available data satisfy the two main criteria discussed above (existence of a 2°C global
warming time window and dimension of the model ensemble). Aim is to provide impact
modelling groups in IMPACT2C who work on vulnerable areas with an overview of data
available for fast track analyses, before the climate scenarios produced during IMPACT2C
itself are available. In particular, since a limited number of climate scenarios will be
performed by the modelling groups in IMPACT2C, it will be important, in view of the criteria
discussed above, to establish what is important, what is missing and what is unnecessary in
terms of climate model data.
We will discuss separately the case of Africa (section 2) and the case of global sea-level rise
(section 3). Conclusions and some recommendation for the climate modelling activity that
will be conducted under IMPACT2C are discussed in section 4.
2. African case study
Past EU projects have established a good basis of climate scenarios for quantitative impact
assessments over Europe and sub-regions (e.g. SESAME, CECILIA, ACQWA, PRUDENCE,
CIRCE, ENSEMBLES). Instead, vulnerable areas in Africa have received much less attention
by climate modellers and a limited number of regional downscalings is available. As a result,
for example, very limited impact studies have been conducted before the IPCC AR4 (e.g.
Jones and Thornton, 2003; Huntingford et al. 2005; Thornton et al. 2006; Tadross et al. 2005).
A significant exception to the availability of regional downscaling for Africa has been the
synergy between the AMMA and ENSEMBLES projects during which the downscaling of
regional climate scenarios over Africa have been produced and collected in a centralized
archive. In particular, the simulations conducted during ENSEMBLES have been designed in
order to meet the requirements of the AMMA project, on the multidisciplinary analysis of the
6
African monsoon. As a result, almost all of the high-resolution regional scenarios produced
during AMMA-ENSEMBLES have been centred over west Africa, which poses severe
constraint to the type of analysis that can be conducted based on this dataset and to the
possibility of evaluating uncertainties.
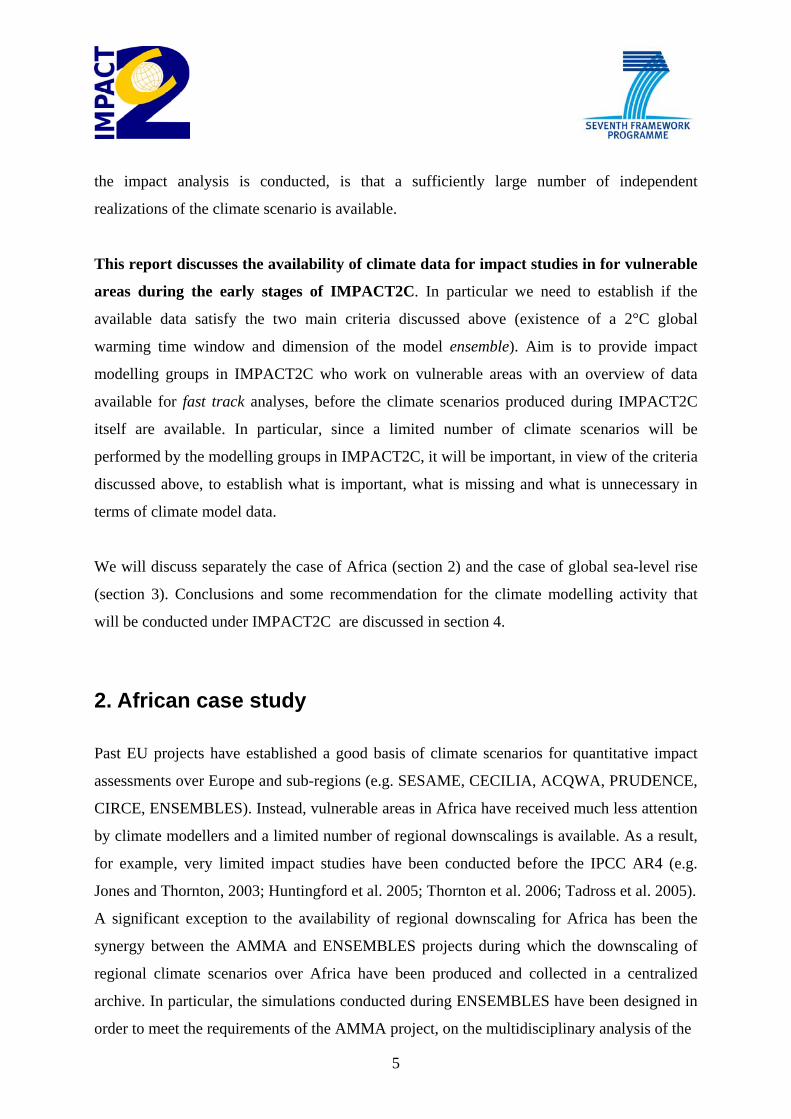
Figure 1. Model domain adopted for the RCM simulation streams during ENSEMBLES. (Christensen et al., 2009)
ENSEMBLES-AMMA is the only international framework that has supported the
production of high-resolution dynamical downscalings of climate scenarios over Africa.
As the focus of AMMA was on West African monsoon (Redelsperger et al., 2006), the model
domain adopted by most of the models that contributed to the ENSEMBLES downscaling
matrix1 is portrayed in Figure 1 (Christensen et al., 2009). In ENSEMBLES –AMMA, the
regional simulations are characterised by common spatial resolution (50Km) and by a
horizontal grid spanning 19.8°S to 35.2°N in latitude and 35.2°W to 31.2°E in longitude
(152x126 points in latitude per longitude). For few models, the domain is slightly bigger (i.e.
ICTP RegCM covers the whole African continent). In table 1 we report a more detailed
description of the regional simulations available over West Africa with some of the more
1 Matrix of possible combinations of all available global model drivers with all regional climate models.

7
relevant variables of interest, the corresponding global driver simulation and the period
covered.
In order to analyse the effects of +2°C global warming over such a vulnerable area as West
Africa, we take into account the regional simulations performed in the framework of
ENSEMBLES –AMMA collaboration.
Model name Variables Global driver Period 1 KNMI-RACMO pr, tasmax,tasmin,tas ECHAM5-MPIOM r3 1970-2050
2 DMI-HIRHAM5 pr, tasmax,tasmin,tas ECHAM5-MPIOM r3 1989-2050
3 SMHIRCA pr, tasmax,tasmin,tas HadCM3Q0 1951-2099
4 METNOHIRHAM pr, tasmax,tasmin,tas HadCM3Q0 1990-2050
5 UCLM_PROMES pr, tasmax,tasmin,tas HadCM3Q0 1991-2050
6 ICTP-REGCM3 pr, tasmax,tasmin,tas ECHAM5-MPIOM r3 1990-2100
7 METO-HC pr,tasmax, tasmin,tas HadCM3Q0 1951-2100
8 GKSS-CCLM4.8 pr, tasmax,tasmin,tas ECHAM5-MPIOM r3 1961-2050
9 INMRCA3 pr, tas HadCM3Q0 1951-2100
10 MPI-M-REMO pr, tasmax,tasmin,tas ECHAM5-MPIOM r3 1950-2050
11 CHMIALADIN pr, tasmax,tasmin ECHAM5-MPIOM r3 1991-2050
Table1: Regional climate simulations analysed in this report from ENSEMBLES-AMMA RCM data portal
(http://ensemblesrt3.dmi.dk/) . The green (yellow) colour are for the simulations that we can take into account to
determine the effect over West Africa of +2 (1.5) °C global warming. Note that the information contained in this
table is based on the data available to the authors before conducting specific activity for IMPACT2C. At the time
when this report was written the ENSEMBLES-AMMA database went off-line for several weeks due to disk
failure and it was not possible to verify the availability of additional data.
Some of the ENSEMBLES-AMMA simulations have been previously analysed by Ruti et al
(2011) and by Diallo et al (2012).
To illustrate the range of uncertainties spanned by existing simulations and of relevance for
IMPACT2C, we discuss the changes main climatic features in West Africa corresponding to a
global temperature increase of 2 (1.5) °C as depicted.
8
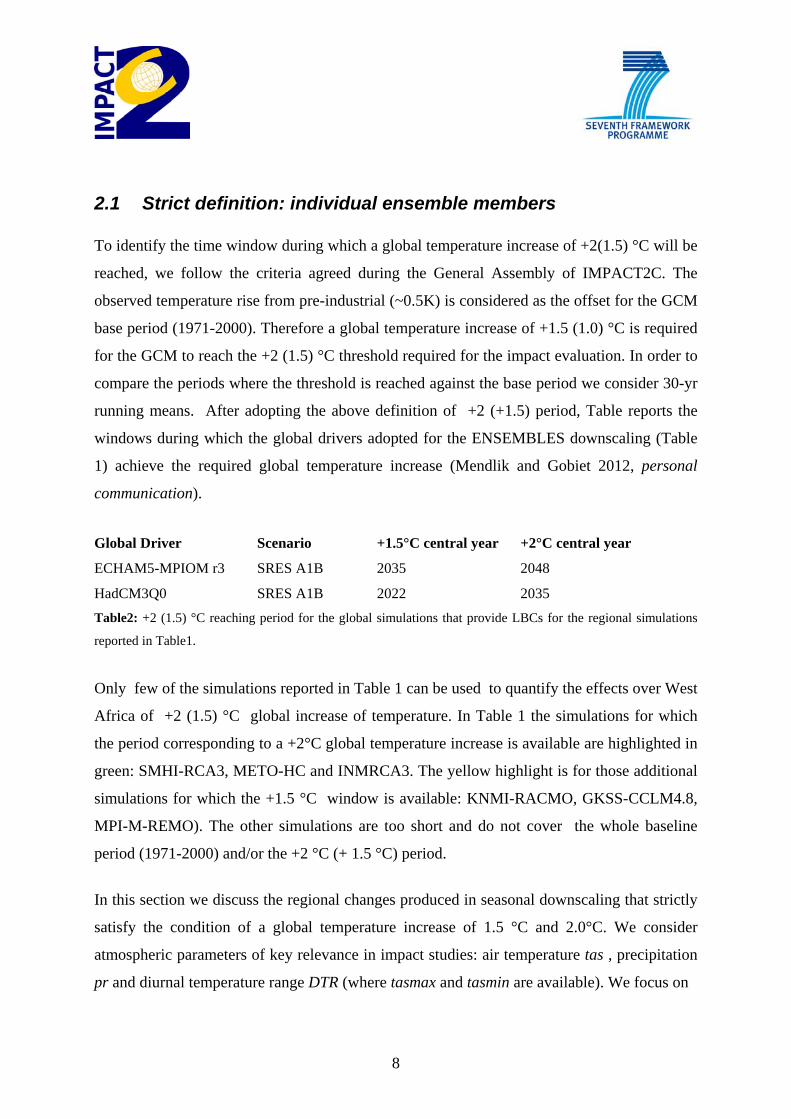
2.1 Strict definition: individual ensemble members To identify the time window during which a global temperature increase of +2(1.5) °C will be
reached, we follow the criteria agreed during the General Assembly of IMPACT2C. The
observed temperature rise from pre-industrial (~0.5K) is considered as the offset for the GCM
base period (1971-2000). Therefore a global temperature increase of +1.5 (1.0) °C is required
for the GCM to reach the +2 (1.5) °C threshold required for the impact evaluation. In order to
compare the periods where the threshold is reached against the base period we consider 30-yr
running means. After adopting the above definition of +2 (+1.5) period, Table reports the
windows during which the global drivers adopted for the ENSEMBLES downscaling (Table
1) achieve the required global temperature increase (Mendlik and Gobiet 2012, personal
communication).
Global Driver Scenario +1.5°C central year +2°C central year
ECHAM5-MPIOM r3 SRES A1B 2035 2048
HadCM3Q0 SRES A1B 2022 2035 Table2: +2 (1.5) °C reaching period for the global simulations that provide LBCs for the regional simulations
reported in Table1.
Only few of the simulations reported in Table 1 can be used to quantify the effects over West
Africa of +2 (1.5) °C global increase of temperature. In Table 1 the simulations for which
the period corresponding to a +2°C global temperature increase is available are highlighted in
green: SMHI-RCA3, METO-HC and INMRCA3. The yellow highlight is for those additional
simulations for which the +1.5 °C window is available: KNMI-RACMO, GKSS-CCLM4.8,
MPI-M-REMO). The other simulations are too short and do not cover the whole baseline
period (1971-2000) and/or the +2 °C (+ 1.5 °C) period.
In this section we discuss the regional changes produced in seasonal downscaling that strictly
satisfy the condition of a global temperature increase of 1.5 °C and 2.0°C. We consider
atmospheric parameters of key relevance in impact studies: air temperature tas , precipitation
pr and diurnal temperature range DTR (where tasmax and tasmin are available). We focus on

9
the summer period JJA (June July August) when the West Africa Monsoon circulation is well
established, therefore corresponding to the main rainy season in the region.
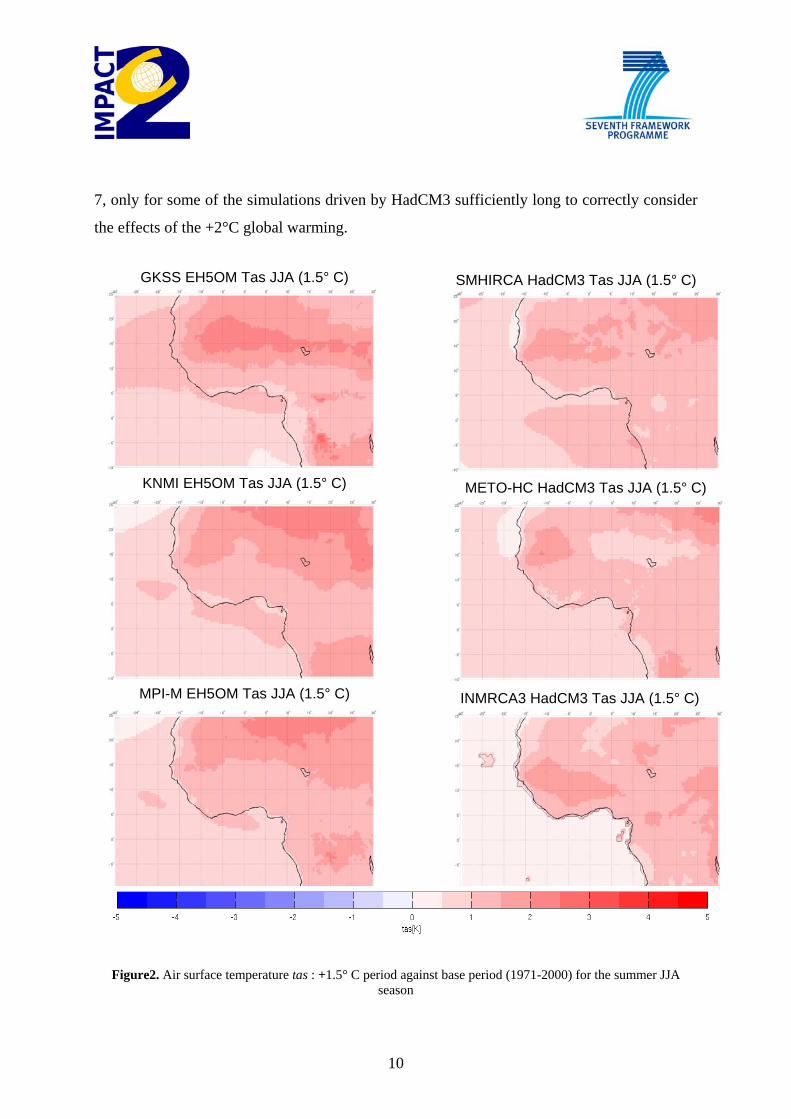
Figure 2 shows the difference in air surface temperature tas in the +1.5 °C period against the
base period 1971-2000 for the six RCM simulations highlighted in Table 1. In the left (right)
column we report the RCMs simulations driven by EH5OM-MPIOM (HadCM3). It is worth
noting that the +1.5°C periods are different for the two GCM simulations: 2021-2050 for
EH5OM and 2008–2037 for HadCM3. In the simulations driven by EH5OM the warming
seems to be more intense (the +1.5°C threshold is reached later), in particular over arid
regions (north of 15°N). In the regional simulations driven by HadCM3 the maximum of
warming is more localized over the western part of the continent whereas the downscalings
driven by ECHAM5-MPIOM show substantial warming over Sahara.
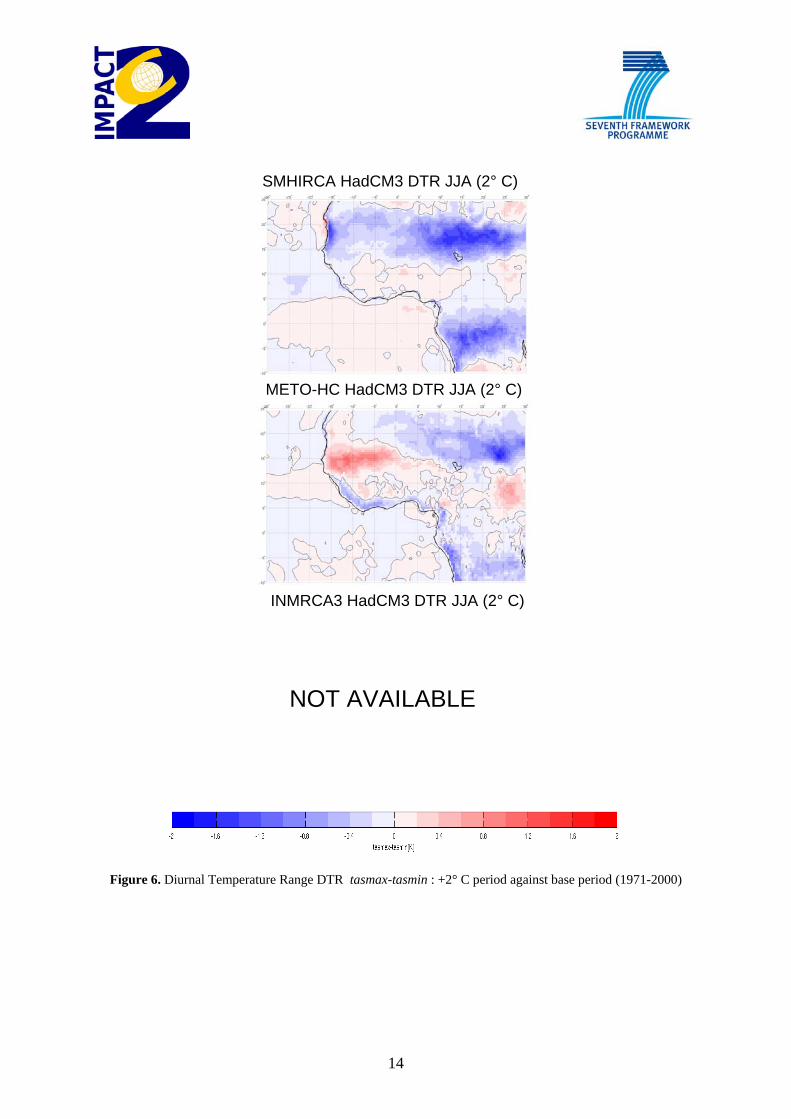
DTR (diurnal temperature range, Figure 3) is a parameter of particular relevance in impact
studies in hydrology and agriculture as it is a proxy for the daily energy flux and for
evapotranspiration. Note that we cannot show the DTR for INMRCA3 run because tasmin
and tasmax are not available.
All downscalings, regardless of the global driver – and with the partial exception of MPI-M
Remo simulation - tend to increase the diurnal temperature range over West Africa indicating
the conditions for a drier soil. On the other hand, over the desert areas in the centre of the
continent the most part of the models exhibit a decreasing diurnal range in the +1.5 period,
suggesting a future higher cloud cover.
In terms of the representation of future tendencies of rainfall, the ENSEMBLES models span
a rather large range of possible behaviours. Overall, rainfall has a decreasing trend over
western Africa (Figure 4). However, in some models a meridional shift of precipitation over
the Guinean coasts is reported (SMHI, METO-HC) likely associated to a southward shift of
ITCZ region. In most simulations, rainfall increases over the vegetated areas of the Guinean
coasts, while the semi-arid sahelian regions generally show an overall decrease of rainfall.
These features are more marked when taking into exam the +2°C period as reported in Fig.5-
10
7, only for some of the simulations driven by HadCM3 sufficiently long to correctly consider
the effects of the +2°C global warming.
Figure2. Air surface temperature tas : +1.5° C period against base period (1971-2000) for the summer JJA season
GKSS EH5OM Tas JJA (1.5° C)
KNMI EH5OM Tas JJA (1.5° C)
MPI-M EH5OM Tas JJA (1.5° C)
SMHIRCA HadCM3 Tas JJA (1.5° C)
METO-HC HadCM3 Tas JJA (1.5° C)
INMRCA3 HadCM3 Tas JJA (1.5° C)

11
Figure 3. Diurnal Temperature Range DTR tasmax-tasmin : +1.5° C period against base period (1971-2000)
GKSS EH5OM DTR JJA (1.5° C)
KNMI EH5OM DTR JJA (1.5° C)
MPI-M EH5OM DTR JJA (1.5° C)
SMHIRCA HadCM3 DTR JJA (1.5° C)
METO-HC HadCM3 DTR JJA (1.5° C)
INMRCA3 HadCM3 DTR JJA (1.5° C)
NOT AVAILABLE

12
Figure 4. Precipitation pr : +1.5° C period against base period (1971-2000)
GKSS EH5OM Pr JJA (1.5° C)
KNMI EH5OM Pr JJA (1.5° C)
MPI-M EH5OM Pr JJA (1.5° C)
SMHIRCA HadCM3 Pr JJA (1.5° C)
METO-HC HadCM3 Pr JJA (1.5° C)
INMRCA3 HadCM3 Pr JJA (1.5° C)

13
Figure 5. Air surface temperature tas : +2° C period against base period (1971-2000)
SMHIRCA HadCM3 Tas JJA (2° C)
METO-HC HadCM3 Tas JJA (2° C)
INMRCA3 HadCM3 Tas JJA (2° C)
14
Figure 6. Diurnal Temperature Range DTR tasmax-tasmin : +2° C period against base period (1971-2000)
SMHIRCA HadCM3 DTR JJA (2° C)
METO-HC HadCM3 DTR JJA (2° C)
INMRCA3 HadCM3 DTR JJA (2° C)
NOT AVAILABLE

15
Figure 7. Precipitation pr : +2° C period against base period (1971-2000)
SMHIRCA HadCM3 Pr JJA (2° C)
METO-HC HadCM3 Pr JJA (2° C)
INMRCA3 HadCM3 Pr JJA (2° C)

16
2.2 Weak definition: Ensemble-mean results To increase the number of simulations considered for the analysis and attempt some basic
ensemble consideration, we have also considered an alternative ‘weaker’ definition of +2°C
threshold. To this aim, we have set a reference baseline period at 1991-2000 and we consider
a 10 years running mean centred over the year of reaching the fixed threshold ( reported in
table2). With such a weaker definition of the reference period we can extend the analysis of
effects of the +1.5°C global temperature increase to all of the simulations reported in Table1.
If we consider the +2 °C threshold we can extend the analysis to all of the simulations driven
by HadCM3. By adopting this weaker criterion for model selection, and repeating the
analysis described above, we obtain similar result for each of the ensemble member (not
reported), thereby suggesting that the projected changes do not depend critically from the
exact reference baseline period.
In Figure 8 we report the ensemble-mean maps for the projected changes during the +1.5°C
period against the reference period 1991-2000 (weak criterion) in tas, DTR and pr in the
ENSEMBLES-AMMA regional simulations (Table1). We consider two different groups of
simulations depending on the global driver. The hatched areas indicate where more than 66%
of the models of each group agree in the sign of the change. On the average, the EH5OM
simulations exhibit a more intense warming over the Saharan region and the ECHAM5-
MPIOM5 tropical Atlantic Ocean shows a cold anomaly north of 20°N which is not present
in the HadCM3 global simulation. In spite of the different warming signal over the Sahara,
which is an important driver of rainfall regimes in west Africa, drier conditions are always
projected in the most western areas of the continent in the regional downscaling. It is worth
noting that this is a rather different signal in the rainfall pattern than those produced in the
corresponding global drivers (Figure 9). In particular, the regional downscalings seem to
increase the consensus on the drier condition over the Sahel
In terms of changes of DTR. as for the case of rainfall, the two groups have similar response
in the Sahel (5-15N) where the diurnal range is larger than in the reference period. Over the
Sahel region (10N-20N) the two subsets of simulations agree on the decreasing in summer
precipitation, while they differ in the description of changes in precipitation over the Guinean
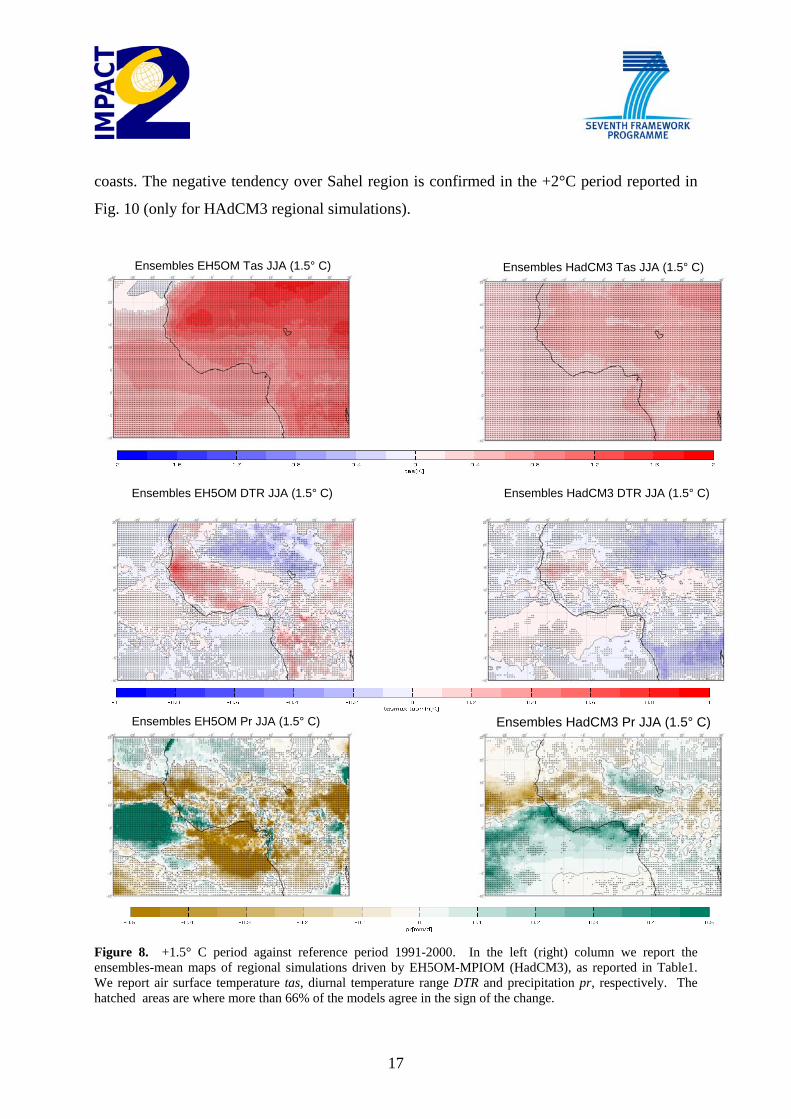
17
coasts. The negative tendency over Sahel region is confirmed in the +2°C period reported in
Fig. 10 (only for HAdCM3 regional simulations).
Figure 8. +1.5° C period against reference period 1991-2000. In the left (right) column we report the ensembles-mean maps of regional simulations driven by EH5OM-MPIOM (HadCM3), as reported in Table1. We report air surface temperature tas, diurnal temperature range DTR and precipitation pr, respectively. The hatched areas are where more than 66% of the models agree in the sign of the change.
Ensembles EH5OM Tas JJA (1.5° C) Ensembles HadCM3 Tas JJA (1.5° C)
Ensembles EH5OM DTR JJA (1.5° C)
Ensembles EH5OM Pr JJA (1.5° C) Ensembles HadCM3 Pr JJA (1.5° C)
Ensembles HadCM3 DTR JJA (1.5° C)
18
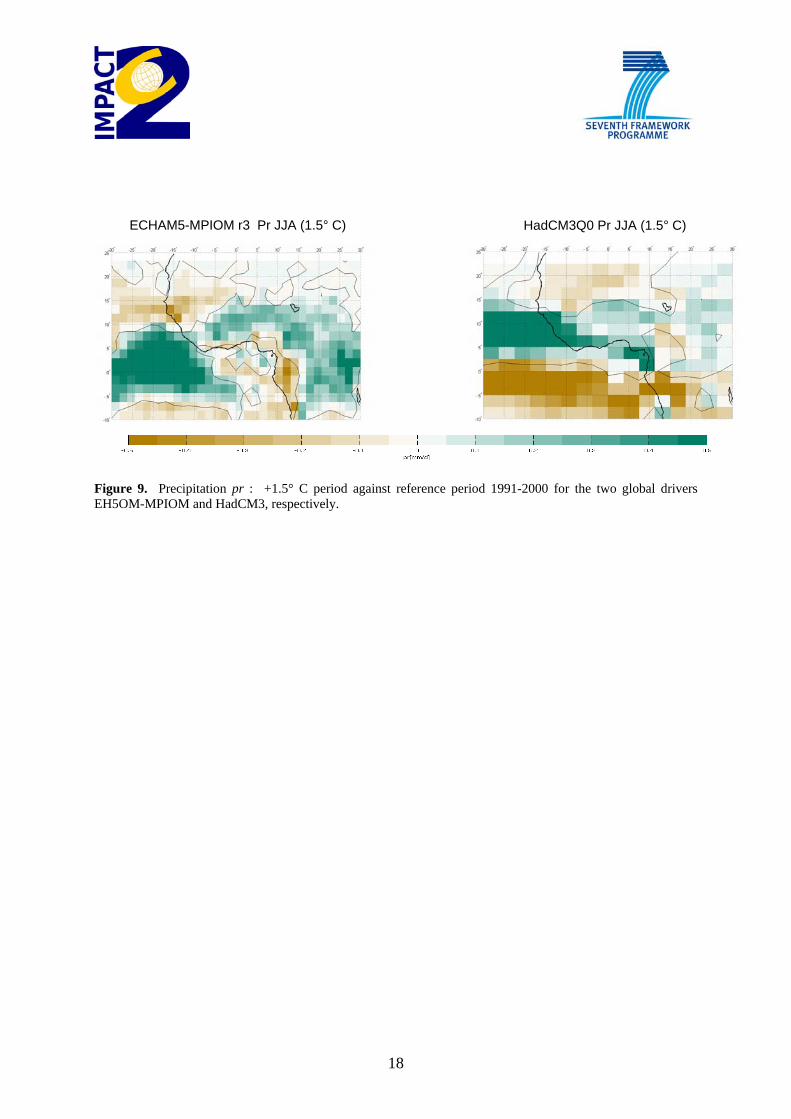
Figure 9. Precipitation pr : +1.5° C period against reference period 1991-2000 for the two global drivers EH5OM-MPIOM and HadCM3, respectively.
HadCM3Q0 Pr JJA (1.5° C) ECHAM5-MPIOM r3 Pr JJA (1.5° C)
19
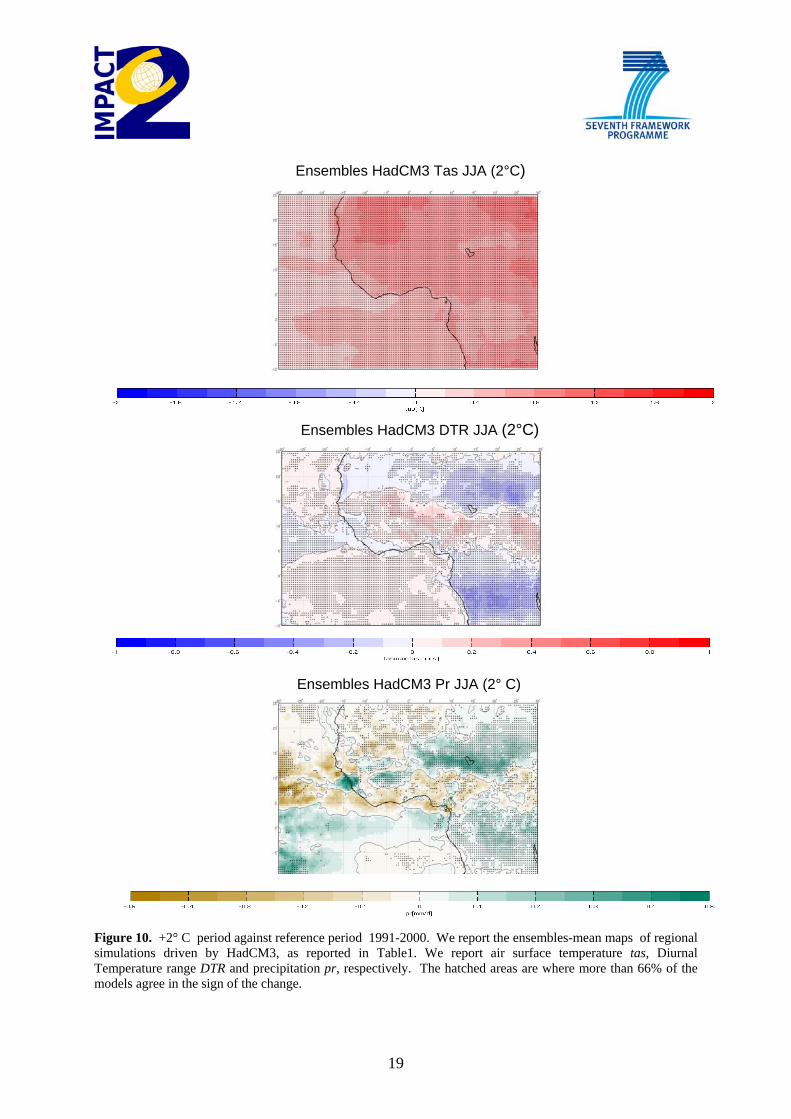
Figure 10. +2° C period against reference period 1991-2000. We report the ensembles-mean maps of regional simulations driven by HadCM3, as reported in Table1. We report air surface temperature tas, Diurnal Temperature range DTR and precipitation pr, respectively. The hatched areas are where more than 66% of the models agree in the sign of the change.
Ensembles HadCM3 Pr JJA (2° C)
Ensembles HadCM3 DTR JJA (2°C)
Ensembles HadCM3 Tas JJA (2°C)
20
3. Sea Level Rise The key climate parameter for the impact studies that will be conducted under IMPACT2C
for Bangladesh and Small Islands in the Indian ocean is sea-level rise.
Severe limitations to the possibility of evaluating the uncertainties of the impact of climate
change exist also for the case of sea level rise. Global warming has, as a direct consequence, a
dilatation of water, and thus a rise of the sea-level. Since the dilation is proportional to ocean
depth and since the ocean surface is reasonably flat, this dilatation cannot be calculated
locally, but on global average, unless the ocean model involved in the scenario experiment
uses the so-called free-surface approach, which is the case of the most recent models, but was
not a rule in AR4.
According to AR4 this thermal expansion explains about three quarters of the total sea level
rise.
A second factor of sea-level rise (or sink) is the modification of the oceanic circulation which
introduces a slope on the sea surface. This phenomenon is taken into account in the latest
generation of OGCM, but the global average is zero and the local rise or sink is of second
order compared to the thermal expansion.
A third factor to sea level rise is glaciers, the Antarctic ice cap, and the Greenland ice-sheet
melting. Sea ice melting effect is not exactly zero (because of salt) but is negligible. This third
factor is hard to estimate, because one cannot use a fully interactive modelling approach as for
atmosphere, ocean and sea-ice. The time scale for equilibrating an ice sheet model for
Antarctica is thousands of years. A fully coupled simulation starting from 1850 would be
dominated by the drift of the system toward its equilibrium state. Various alternative
strategies have been proposed based on parameterizations of the iceberg calving and glacier
melting. Chapter 10 of IPCC(2007) provides confidence intervals for the total rise at the end
of the 21st century. From the lowest to the highest scenario, the intervals are 0.18m to 0.38m
for B1, 0.21m to 0.48m for A1B, 0.26m to 0.59m for A1FI. But one should keep in mind that
the deep ocean which contributes to the thermal expansion.

21
As IMPACT2C is focussed on the period which is 2°C over preindustrial global mean
temperature, we detail below global sea level rise as a function of time, together with global
temperature elevation. No information is given here about horizontal distribution, because in
CMIP3 provides no reliable information on the spatial distribution, due to the model
limitation mentioned above. Therefore, providing a geographical map at this stage would be
misleading for impact studies. Instead we illustrate the type of information that was available
prior to the starting of IMPACT2C by showing the results derived from two of the models
that participated to CMIP3 and which the IPCC-4AR was based upon. The next generation of
climate models contributing to CMIP5 will contain more detailed spatial patterns and it is
hoped that CMIP5 simulations will propose a minimum consensus so that the analysis that
will be conducted under IMPACT2C can be useful for decisors and policy makers..
3.1 CNRM-CM3
Météo-France has participated to CMIP3 with the CNRM-CM3 model. This model used the
rigid lid approximation, so the thermal dilatation has been calculated off-line. The ice melting
is not taken into account. The model drift has been calculated from a preindustrial simulation
and subtracted from the sea level rise data. Figure 11 shows the 5-year averages of the sea
level and temperature differences with respect to the 1971-2000 averages for the A1B
scenario.
In the framework of the FP6-ENSEMBLES project a new scenario, named E1 has been
defined. This greenhouse gas concentration scenario is softer than A1B and assumed to
stabilize in the middle of the 21st century. Figure 12 shows a similar picture for this scenario.
One can see that although temperature stabilizes by 2050, the sea level continue to rise during
the second half of the century. However, the final value (0.1 m) is smaller than the CMIP3
projection (here the ice melting is not taken into account).

22
Figure 11 : Sea level rise (solid line, m) and global surface warming (dotted line, °C) with CNRM-CM3 model for the A1B scenario
Figure 12 : As Fig. 11 for the E1 scenario
23
3.2 HADGEM
The Met Office has also participated in CMIP3 with the HADGEM model. Similar results are
obtained with the previous version HADCM3, as far as sea level rise are concerned. This
model uses the free surface approach for the ocean, and the ice melting has been taken into
account. However, as the fresh water release due to ice melting is, contrary to river run-off, a
parameterized process, different hypotheses have been done and a 90% confidence interval is
provided for global averages (see Pardaens et al., 2011). The Met Office has also produced an
E1 scenario for the FP6-ENSEMBLES project. Figures 13 and 14 show surface temperature
and sea level increase during the 21st century. The reference period is here 1980-1999. The
model sea level drift has been evaluated from a control simulation and subtracted. Indeed the
deepest part of the ocean, which contributes to the thermal expansion is not equilibrated after
a few centuries of simulation. This effect is independent on greenhouse gas warming.
Figure 13 shows that the warming is similar to CNRM-CM3 and the 5th percentile of sea level
rise is above the CNRM-CM3 value (which includes only the thermal dilatation). The E1
scenario, on the contrary, is 0.5° warmer than CNRM-CM3 by the end of the century.

24
Figure 13 : As Fig. 11 for the HADGEM model under A1B scenario. The shaded area correspond to the 5% and 95% quantiles of the distribution
Figure 14 : As Fig. 13 for the E1 scenario.
25
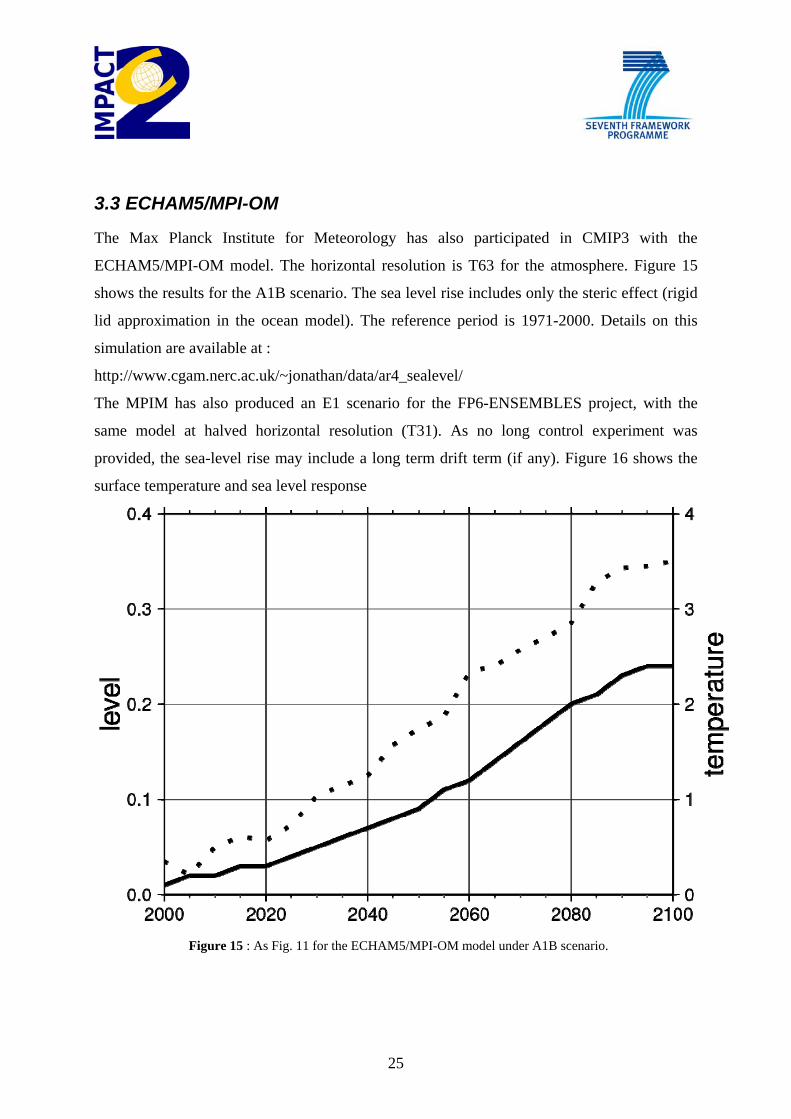
3.3 ECHAM5/MPI-OM
The Max Planck Institute for Meteorology has also participated in CMIP3 with the
ECHAM5/MPI-OM model. The horizontal resolution is T63 for the atmosphere. Figure 15
shows the results for the A1B scenario. The sea level rise includes only the steric effect (rigid
lid approximation in the ocean model). The reference period is 1971-2000. Details on this
simulation are available at :
http://www.cgam.nerc.ac.uk/~jonathan/data/ar4_sealevel/
The MPIM has also produced an E1 scenario for the FP6-ENSEMBLES project, with the
same model at halved horizontal resolution (T31). As no long control experiment was
provided, the sea-level rise may include a long term drift term (if any). Figure 16 shows the
surface temperature and sea level response
Figure 15 : As Fig. 11 for the ECHAM5/MPI-OM model under A1B scenario.

26
Figure 16 : As Fig. 15 for the E1 scenario.
4. Discussion In this report we discuss some of the criticalities of climate simulation performed prior to
IMPACT2C and the corresponding limitations and potentials in the quantification of the
regional impact of a +2°C global warming.
Concerning the African case studies, existing regional downscalings are generally too short to
derive robust statistics using a strict definitions of +2°C (or 1.5° C) global warming. On the
other hand, the analysis of available projections show that the projected changes in rainfall
pattern do not depend critically on the exact definition of the baseline period. It will be
important however that an effort is made by the modelling groups in IMPACT2C to ensure
that a sufficiently long time window is available to analyse the target changes.
27
Furthermore, regional models seem to increase the degree of consensus of future projections
on a drier Sahel with respect to what is simulated by global models. Given the limited
number of simulation considered for the analysis described in this report, this cannot be
considered a robust result but might be a useful indication of the potential added value of
regional climate models in this area.
An important limitation of existing simulation is the model domain of the African
downscalings. The African domains (Fig. 1) are generally limited to West Africa and do not
cover vulnerable areas in Eastern Africa. In the ENSEMBLES archive, only ICTP-RegCM3
covers the entire African continent. Furthermore for some simulations, variables that are
potentially important in impact studies are missing.
We conclude that the ENSEMBLES archive alone provides a poor basis for the evaluation of
the impact of 2°C global warming over Africa, not only in terms of model domain, but also in
terms of dimension of the model ensemble and on the possibility of discussing the
uncertainties of the projected changes.
Concerning sea-level rise, one important factor contributing to the regional patterns of sea-
level changes is missing in the CMIP3 models as it was not common practice to use free
surface condition for the ocean. Therefore, the information on sea-level rise that can be
extracted from the CMPI3 models is limited to the steric effect (expansion of sea water due to
warming and dilution) and to the cumulated effect of glacier melting.
It is expected that the next generation of climate models that will be considered in
IMPACT2C will increase the capabilities of predicting regional patterns of sea-level rise and
therefore increase the accuracy of impact studies.

28
References
Baron, C., B. Sultan, M. balme, B. Sarr, T. Lebel, S. Janicot, and M. Dingkuhn, 2005: From
GCM grid cell to agricultural plot: Scale issues affecting modeling of climate impact.
Philos. Trans. Roy. Soc. London, 360B (1463), 2095-2108.
Barret, B., Yang, X., Mari, C. and Traore, A. K. (2011), The West African climate system: a
review of the AMMA model inter-comparison initiatives. Atmospheric Science Letters, 12:
116–122. doi: 10.1002/asl.305
Cook KH, Vizy EK. 2006. Coupled model simulations of the West African monsoon system:
twentieth- and twenty-first-century simulations. Journal of Climate 19: 3681–3703.
J.H. Christensen, M. Rummukainen, G. Lenderink, 2009. Formulation of very-high-resolution
regional climate model ensembles for Europe. In: van der Linden P., and J.F.B. Mitchell
(eds.). ENSEMBLES: Climate Change and its Impacts: Summary of research and results from
the ENSEMBLES project. Met Office Hadley Centre, FitzRoy Road, Exeter EX1 3PB, UK.
160pp.
Ismaila Diallo, Mouhamadou Bamba Sylla, Filippo Giorgi, Amadou Thierno Gaye, and
Moctar Camara 2012 Multi-model GCM-RCM ensemble based projections of temperature
and precipitation over West Africa for the early 21st century, Intern. Journal Geophysics, in
press.
Huntingford C., Lambert F. H., Gash J. C. H., Taylor C. M., Challinor A. J., 2005: Aspects of
climate change prediction relevant to crop productivity. Phylos. T. Roy. Soc. B,360, 1999-
2009.
Ines A. M. V., Hansen J. W., 2006. Bias correction of daily GCM rainfall for crop simulation
studies. Agricultural and Forest Meteorology, 138, 44-53.
29
Jones P. G., Thornton, 2003: The potential impacts of climate change on maize production in
Africa and Latin America in 2055. Global Environ. Chang., 13, 51-59.
Pardaens, A. K., J. A. Lowe, S. Brown, R. J. Nicholls, and D. de Gusmão (2011), Sea-level
rise and impacts projections under a future scenario with large greenhouse gas emission
reductions, Geophys. Res. Lett., 38, L12604, doi:10.1029/2011GL047678.
Redelsperger, J.-L., C. Thorncroft, A. Diedhiou, T. Lebel, D. Parker, J. Polcher, 2006. African
Monsoon, Multidisciplinary Analysis (AMMA): An International Research Project and Field
Campaign. Bulletin of the American Meteorological Society, 87(12), 1739-1746.
Ruti, P. M., Williams, J. E., Hourdin, F., Guichard, F., Boone, A., Van Velthoven, P., Favot,
F., Musat, I., Rummukainen, M., Domínguez, M., Gaertner, M. Á., Lafore, J. P., Losada, T.,
Rodriguez de Fonseca, M. B., Polcher, J., Giorgi, F., Xue, Y., Bouarar, I., Law, K., Josse, B.,
Tadross M., Jack C., Hewitson B., 2005: On RCM based projections of change in southern
African summer climate. Geophys. Res. Lett., 32, L23713, doi:10.1029/2005GL024460.
Thornton, P.K., P.G. Jones, T.M. Owiyo, R.L. Kruska, M. Herero, P. Kristjanson, A.
Notenbaert, N. Bekele and Co-authors, 2006: Mapping Climate Vulnerability and Poverty in
Africa. Report to the Department for International Development, ILRI, Nairobi, 200 pp.


![Climate Change & Disasters. Climate Change and Disasters “The report [Impacts, Adaptation & Vulnerability, IPCC 2007] confirms our worst fears – vulnerable](https://img.pdfslide.us/doc/110x75/56649e6b5503460f94b69049/climate-change-disasters-climate-change-and-disasters-the-report-impacts.jpg)