Embed Size (px)
Citation preview
Deicer Scaling Resistance of Concrete Pavements, Bridge Decks, and Other Structures Containing Slag Cement
Phase 1: Site Selection and Analysis of Field Cores
Final ReportSeptember 2008
Sponsored throughPooled Fund Project TPF-5(100):
Connecticut Department of TransportationIowa Department of Transportation (lead state)Kansas Department of TransportationNew York State Department of TransportationOhio Department of Transportation
Slag Cement Association
Federal Highway Administration
Iowa State University’s Center for Transportation Research and Education is the umbrella organization for the following centers and programs: Bridge Engineering Center • Center for Weather Impacts on Mobility
and Safety • Construction Management & Technology • Iowa Local Technical Assistance Program • Iowa Traffi c Safety Data Service • Midwest Transportation Consortium • National Concrete Pavement
Technology Center • Partnership for Geotechnical Advancement • Roadway Infrastructure Management and Operations Systems • Statewide Urban Design and Specifications • Traffic Safety and Operations
About the National Concrete Pavement Technology Center
The mission of the National Concrete Pavement Technology Center is to unite key transportation stakeholders around the central goal of advancing concrete pavement technology through research, tech transfer, and technology implementation.
Disclaimer Notice
The contents of this report refl ect the views of the authors, who are responsible for the facts and the accuracy of the information presented herein. The opinions, fi ndings and conclusions expressed in this publication are those of the authors and not necessarily those of the sponsors.
The sponsors assume no liability for the contents or use of the information contained in this document. This report does not constitute a standard, specifi cation, or regulation.
The sponsors do not endorse products or manufacturers. Trademarks or manufacturers’ names appear in this report only because they are considered essential to the objective of the document.
Nondiscrimination Statement
Iowa State University does not discriminate on the basis of race, color, age, religion, national origin, sexual orientation, gender identity, sex, marital status, disability, or status as a U.S. veteran. Inquiries can be directed to the Director of Equal Opportunity and Diversity, (515) 294-7612.
Technical Report Documentation Page
1. Report No. CTRE Project 05-202 Pooled Fund Project TPF-5(100)
2. Government Accession No.
3. Recipient’s Catalog No.
4. Title and Subtitle Deicer Scaling Resistance of Concrete Pavements, Bridge Decks, and Other Structures Containing Slag Cement, Phase 1: Site Selection and Analysis of Field Cores
5. Report Date September 2008 6. Performing Organization Code
7. Author(s) Scott Schlorholtz, R. Doug Hooton
8. Performing Organization Report No.
9. Performing Organization Name and Address National Concrete Pavement Technology Center Iowa State University 2711 South Loop Drive, Suite 4700 Ames, IA 50010-8664
10. Work Unit No. (TRAIS) 11. Contract or Grant No.
12. Sponsoring Organization Name and Address Federal Highway Administration 1200 New Jersey Ave., SE Washington, DC 20590
13. Type of Report and Period Covered Final Report 14. Sponsoring Agency Code
15. Supplementary Notes Visit www.cptechcenter.org for color PDF files of this and other research reports. 16. Abstract The initial phase of this project was conducted to determine whether adding slag cement to concrete mixtures increases the surface scaling caused by the routine application of deicer salt. A total of 28 field sites that included portland cement concrete pavements and bridge decks containing slag cement were evaluated. Laboratory testing was conducted on 6 in. diameter core samples extracted from 12 field sites and 3 subsites, including 6 pavement sites and 6 bridge decks. The laboratory testing program consisted of scaling tests, rapid chloride permeability tests, surface chloride profile tests, and petrographic examination. The results of this study suggest that construction-related issues played a bigger role in the observed scaling performance than did the amount of slag in the concrete mixture.
• For the scaling tests, only cores extracted from one site exhibited scaling mass loss values that exceeded 1.5 lbs/yd2. It was also noted that the bridge deck cores tended to lose more mass during the scaling tests than the pavement cores.
• For the rapid chloride permeability tests, the amount of charge passed did not appear to be directly related to the amount of slag in the mixtures. However, the different ages of the concrete at the various sites tended to complicate the interpretation of the test results.
• For the surface chloride profile tests, the diffusion coefficients estimated for the various samples ranged from about 5.6E-12 m2/s to 1.4E-13 m2/s.
• Petrographic examinations indicated that four of the seven sites that exhibited scaling showed evidence of retempering. In addition, two of the scaling sites tended to have significantly higher water-cementitious material ratios than was expected from the nominal mixture design information that was provided.
17. Key Words bridge decks—concrete pavements—deicer scaling resistance—slag cement
18. Distribution Statement No restrictions.
19. Security Classification (of this report) Unclassified.
20. Security Classification (of this page) Unclassified.
21. No. of Pages
122
22. Price
NA
Form DOT F 1700.7 (8-72) Reproduction of completed page authorized

DEICER SCALING RESISTANCE OF CONCRETE PAVEMENTS, BRIDGE DECKS, AND OTHER STRUCTURES
CONTAINING SLAG CEMENT, PHASE I: SITE SELECTION AND ANALYSIS OF
FIELD CORES
Final Report September 2008
Principal Investigators Scott Schlorholtz
Scientist Department of Materials Science and Engineering, Iowa State University
R. Doug Hooton
Professor of Civil Engineering Department of Civil Engineering, University of Toronto
Sponsored through Pooled Fund Project TPF 5(100):
Connecticut Department of Transportation, Iowa Department of Transportation (lead state, CTRE Project 05-202),
Kansas Department of Transportation, Ohio Department of Transportation,
New York State Department of Transportation, Federal Highway Administration, and
Slag Cement Association
A report from National Concrete Pavement Technology Center
Iowa State University 2711 South Loop Drive, Suite 4700
Ames, IA 50010-8664 Phone: 515-294-8103 Fax: 515-294-0467
www.cptechcenter.org

v
TABLE OF CONTENTS
ACKNOWLEDGMENTS ............................................................................................................ IX
EXECUTIVE SUMMARY .......................................................................................................... XI
INTRODUCTION ...........................................................................................................................1 Problem Statement ...............................................................................................................2 Research Approach ..............................................................................................................2 Project Goals (Phase 1 Field Study) ....................................................................................3
DESCRIPTION OF FIELD SITES .................................................................................................4 Iowa......................................................................................................................................4 Connecticut ........................................................................................................................12 Delaware ............................................................................................................................14 Kansas ................................................................................................................................18 Michigan ............................................................................................................................21 New York...........................................................................................................................25 Summary for Field Sites Selected for Coring....................................................................32
EQUIPMENT AND PROCEDURES............................................................................................35 Iowa State University.........................................................................................................35 University of Toronto ........................................................................................................35 American Petrographic Services........................................................................................36
RESULTS AND DISCUSSION ....................................................................................................38 Scaling Tests ......................................................................................................................38 Rapid Chloride Permeability and Surface Chloride Profiles .............................................40 Petrographic Examinations ................................................................................................43
SUMMARY...................................................................................................................................47
RECOMMENDATIONS FOR PHASE 2......................................................................................48
REFERENCES ..............................................................................................................................49
APPENDIX A. POTENTIAL PAVEMENT AND BRIDGE DECK EVALUATION SITES .. A-1
APPENDIX B. PROJECT INFORMATION FORMS................................................................B-1
APPENDIX C. SCALING TEST DATA ....................................................................................C-1
APPENDIX D. PETROGRAPHIC EXAMINATION DATA AND CORE LOGS................... D-1

LIST OF FIGURES
Figure 1. Highway 520 eastbound at mile post 156.45 (note features parallel to joint)..................5 Figure 2. Highway 520 eastbound at mile post 157.20 (note poor surface finish in driving lane) .6 Figure 3. Highway 520 eastbound at mile post 157.85 ...................................................................6 Figure 4. I-35 northbound at mile post 143.45 (note snow plow abrasion on crown).....................7 Figure 5. Highway 151 southbound at mile post 45.75 (note transverse cracking through panel) .8 Figure 6. Euclid bridge, eastbound ................................................................................................10 Figure 7. Euclid bridge, westbound ...............................................................................................10 Figure 8. Euclid bridge, eastbound gutter driving lane (note scaling in the tined deck) ...............11 Figure 9. Euclid bridge, westbound driving lane...........................................................................11 Figure 10. Barrier wall adjacent to exit 29A, Hartford, Connecticut ............................................12 Figure 11. Scaling noted on bridge deck #1863, ramp to Whitehead Highway, SR 598 ..............13 Figure 12. Bridge deck #1863, ramp to Whitehead Highway, SR 598 .........................................13 Figure 13. Delaware SR 1, northbound (between Christiana Road and I-95) ...............................14 Figure 14. I-495 (between 9th Street and 12th Street, Wilmington, Delaware) ............................15 Figure 15. Delaware SR 896 southbound (between I-95 and US 40)............................................16 Figure 16. Delaware SR 896 southbound (between US 40 and Highway 71)
(note faint cracking)...........................................................................................................16 Figure 17. Delaware SR 896 southbound (between US 40 and Highway 71)...............................17 Figure 18. Delaware SR1, southbound (between Smyma and Dover, north of MP 73)................18 Figure 19. 100th Street and Lamar Roundabout in Overland Park ...............................................19 Figure 20. Close-up view of Figure 19 showing faint random cracking in the slab......................19 Figure 21. Nall Avenue, south of W 119th Street, Leawood, Kansas ...........................................20 Figure 22. Close-up view of Figure 21 showing exposed fine aggregate particles in the slab .....20 Figure 23. Entrance and main yard of the Michigan Caterpillar Company...................................21 Figure 24. Close-up view of Figure 23 showing abrasion and joint breakage in the slab.............22 Figure 25. Overview of the short bridge on M-45 over Sand Creek .............................................23 Figure 26. Close-up view of Figure 25 showing the varied tine depth across the deck ................23 Figure 27. Long bridges on M-45 over the Grand River (looking east)........................................24 Figure 28. M 45 westbound bridge deck (note snow plow abrasion on shoulder) ........................25 Figure 29. Overview of the Route 397 bridge over the Bozenkill.................................................26 Figure 30. Close-up view of Figure 29 showing wheel abrasion on the slab ................................26 Figure 31. Closeup view of durability issues on the deck .............................................................27 Figure 32. Overview of the Route 378 bridge over the D&H Railroad.........................................28 Figure 33. Close-up of exposed aggregate on the Route 378 deck................................................28 Figure 34. Overview of Route 351 bridge over the Quackenkill...................................................29 Figure 35. Close-up of exposed aggregate and random cracking on the Route 351 deck.............30 Figure 36. Overview of the Taconic St. Parkway bridges over Angel Hill Road .........................31 Figure 37. Overview of Taconic St. Parkway bridge, southbound deck (looking north)..............31 Figure 38. Close-up of scaling on Taconic St. Parkway bridge, southbound deck .......................32 Figure 39. Photographs of the three scaling specimens from Site 13 (before and after test) ........39 Figure 40. Example of chloride profile test results (before and after scaling tests) ......................42 Figure 41. Example of depth-of-carbonation determinations........................................................45 Figure 42. Example of retempering noted via petrographic examination .....................................46
vii
viii
LIST OF TABLES
Table 1. Impact of slag cement on various properties of concrete (TRB 1990)..............................1 Table 2. Properties monitored at the various Des Moines metro area bridge decks .......................9 Table 3. Field sites selected for coring ..........................................................................................33 Table 4. Summary of scaling test results .......................................................................................38 Table 5. Summary of RCP and surface chloride profile test results (before scaling test) .............40 Table 6. Summary of surface chloride profile test results (after scaling test) ...............................41 Table 7. Summary of petrographic exams at Iowa State University .............................................43 Table 8. Summary of petrographic exams at American Petrographic Services ............................43 Table A.1. State of Iowa, original list of sites ............................................................................ A-1 Table A.2. State of New York, original list of sites.................................................................... A-2 Table C.1. Visual ratings .............................................................................................................C-1 Table C.2. Scaling loss (cumulative mass loss, results for individual test specimens) ...............C-2
ACKNOWLEDGMENTS
The authors would like to thank the pooled fund states (Connecticut, Iowa, Kansas, New York and Ohio), the Slag Cement Association, and the Federal Highway Administration for sponsoring this research.
The researchers are indebted to the various agencies who participated in this research by providing traffic control and cores for this research project. Very special thanks to
• Todd Hanson, John Hart, Danny Zeimen, Jason Omundson, and James Berger of the Iowa Department of Transportation
• John Henault and James Sime of the Connecticut Department of Transportation • David Graves, Tom Izykowski, and Don Streeter of the New York Department of
Transportation • Todd LaTorella of the American Concrete Paving Association (Missouri-Kansas
Chapter) and Dave Meggers of the Kansas Department of Transportation • James Pappas of the Delaware Department of Transportation • John Staton and Tim Stallard of the Michigan Department of Transportation
Without the help of those mentioned above, plus the help of field personnel from each participating state, this project could not have been completed. In addition, special thanks to Scott Wolter of American Petrographic Services for allowing the use of figures and text from the petrographic reports.
ix

xi
EXECUTIVE SUMMARY
The initial phase of this project consisted of field surveys of portland cement concrete pavements and bridge decks containing slag cement. This was done to evaluate whether the addition of slag cement to the concrete mixtures increased the surface scaling caused by the routine application of deicer salt. Laboratory testing was conducted on core samples extracted from selected field sites. The laboratory testing program consisted of scaling tests, rapid chloride permeability tests, surface chloride profile tests, and petrographic examination.
A total of 28 field sites were evaluated during this project. After reviewing the field sites, 13 sites and 3 subsites were selected for coring. Of the 13 sites selected, 12 provided cores, including 6 pavement sites and 6 bridge decks. Cores were also obtained from all 3 subsites (all subsites were pavements).
Scaling tests were conducted on 6 in. diameter cores extracted from four different pavements and three different bridge decks. The tests were conducted in general accordance with ASTM C 672/C 672M. Only cores extracted from Site 13 exhibited scaling mass loss values that exceeded 1.5 lbs/yd2. The cementitious component of this concrete mixture was composed of portland cement, 20% slag, and 6% silica fume It was also noted that the bridge deck cores tended to lose more mass during the scaling tests than the pavement cores. Rapid chloride permeability tests were conducted on all of the sites that were cored. The tests were conducted in accordance with ASTM C 1202. Test results ranged from a high value of 1,580 coulombs passed to a low value of 590 coulombs passed. The amount of charge passed did not appear to be directly related to the amount of slag in the mixtures. However, the different ages of the concrete at the various sites tended to complicate the interpretation of the test results. Surface chloride profile tests were also conducted on core specimens from the different sites. The diffusion coefficients estimated for the various samples ranged from about 5.6E-12 m2/s to 1.4E-13 m2/s. Petrographic examinations of the cores specimens from the different sites indicated that four of the seven sites that exhibited scaling showed evidence of retempering. In addition, two of the scaling sites tended to have significantly higher water-cementitious material ratios than was expected from the nominal mixture design information that was provided. Hence, for this study it appeared that construction-related issues played a bigger role in the observed scaling performance than did the amount of slag in the concrete mixture.

INTRODUCTION
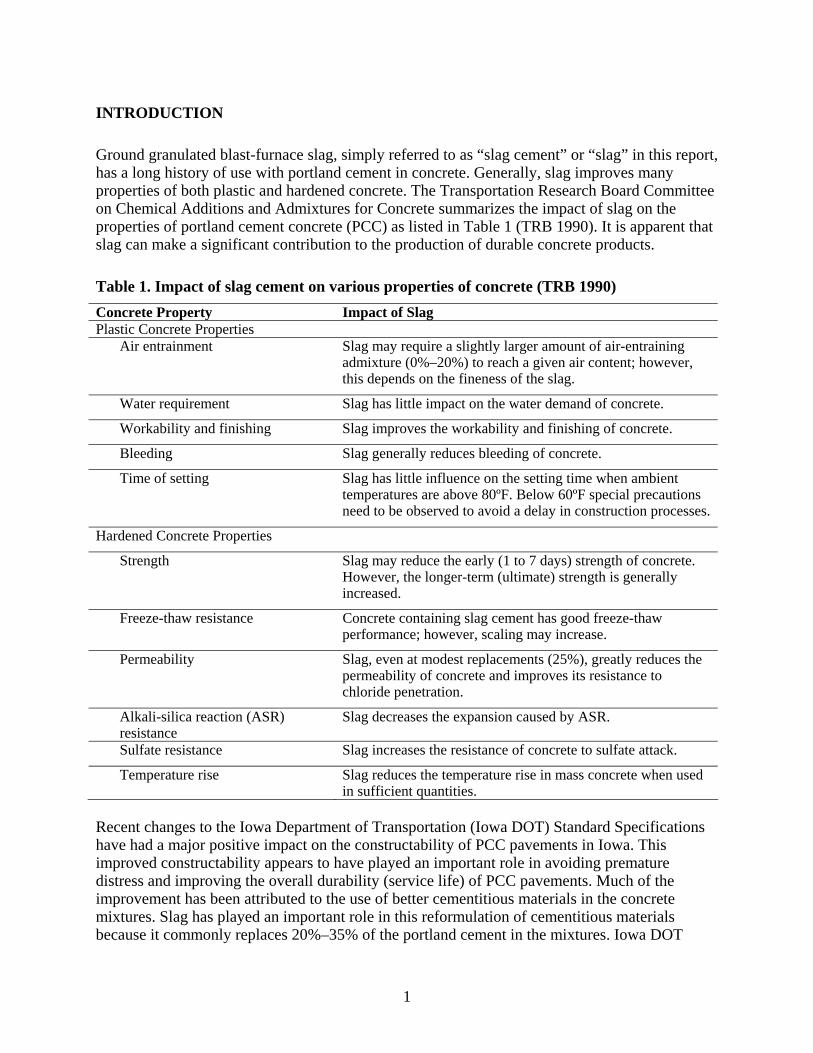
Ground granulated blast-furnace slag, simply referred to as “slag cement” or “slag” in this report, has a long history of use with portland cement in concrete. Generally, slag improves many properties of both plastic and hardened concrete. The Transportation Research Board Committee on Chemical Additions and Admixtures for Concrete summarizes the impact of slag on the properties of portland cement concrete (PCC) as listed in Table 1 (TRB 1990). It is apparent that slag can make a significant contribution to the production of durable concrete products.
Table 1. Impact of slag cement on various properties of concrete (TRB 1990) Concrete Property Impact of Slag Plastic Concrete Properties Air entrainment Slag may require a slightly larger amount of air-entraining
admixture (0%–20%) to reach a given air content; however, this depends on the fineness of the slag.
Water requirement Slag has little impact on the water demand of concrete.
Workability and finishing Slag improves the workability and finishing of concrete.
Bleeding Slag generally reduces bleeding of concrete.
Time of setting Slag has little influence on the setting time when ambient temperatures are above 80ºF. Below 60ºF special precautions need to be observed to avoid a delay in construction processes.
Hardened Concrete Properties
Strength Slag may reduce the early (1 to 7 days) strength of concrete. However, the longer-term (ultimate) strength is generally increased.
Freeze-thaw resistance Concrete containing slag cement has good freeze-thaw performance; however, scaling may increase.
Permeability Slag, even at modest replacements (25%), greatly reduces the permeability of concrete and improves its resistance to chloride penetration.
Alkali-silica reaction (ASR) resistance
Slag decreases the expansion caused by ASR.
Sulfate resistance Slag increases the resistance of concrete to sulfate attack.
Temperature rise Slag reduces the temperature rise in mass concrete when used in sufficient quantities.
Recent changes to the Iowa Department of Transportation (Iowa DOT) Standard Specifications have had a major positive impact on the constructability of PCC pavements in Iowa. This improved constructability appears to have played an important role in avoiding premature distress and improving the overall durability (service life) of PCC pavements. Much of the improvement has been attributed to the use of better cementitious materials in the concrete mixtures. Slag has played an important role in this reformulation of cementitious materials because it commonly replaces 20%–35% of the portland cement in the mixtures. Iowa DOT
1
engineers have had great success in the field with binary (slag and portland cement) and ternary (slag, portland cement, and Class C fly ash) mixtures containing slag. However, little effort has been focused on assessing the potential for surface scaling in these mixtures containing slag (or ternary mixtures containing slag). That assessment is the thrust of this research project.
Problem Statement
Concrete containing slag generally exhibits excellent long-term strength and durability. However, several authors have expressed concern about the scaling resistance of concrete containing slag, especially when the dosage of slag exceeds 50% of the total cementitious material in the mixture (TRB 1990; Klieger and Isberner 1967; Marchand, Sellevold, and Pigeon 1994; Luther et al. 1994; Marchand, Pleau, and Gagne 1995; ACI 1996). Much of the concern appears to be based on the results of laboratory scaling tests (most commonly ASTM C672) (2006), which tend to be in poor agreement with field observations (Klieger and Isberner 1967; Marchand, Sellevold, and Pigeon 1994; Luther et al. 1994; Marchand, Pleau, and Gagne 1995; ACI 1996; Hooton and Boyd 1997; Hooton 1997; Bleszynski et al. 2002; Boyd and Hooton 2007). Others indicate that the test performs adequately for evaluating the relative scaling resistance of concrete specimens (Newlon and Mitchell 1994). A systematic study is needed to determine why this anomalous relationship exists between the scaling of field and laboratory concrete specimens containing slag.
Research Approach
Phase 1 of this project focuses on the inspection and testing of selected, well-documented concrete pavements and bridge decks containing slag cement. Field sites containing ternary mixtures (portland cement with the addition of two supplementary cementitious materials) were the most commonly investigated sites. The scope of the field study was limited to sites in wet-freeze climates that commonly use deicer chemicals during the winter months.
The initial objective of the sampling plan was to obtain a series of approximately 15 sites that were as statistically valid as possible. However, due to the limited number of participants in the pool (five states participated but only three provided cores) this objective could not be realized. Moreover, due to the financial burden of extracting cores, only the lead state was asked to provide cores from more than two individual sites. All efforts were still made to obtain representative sites, as will be described later in this report. However, the researchers typically were constrained to choose a scaling and a nonscaling site from each state.
List of tasks for the field study:
1. Contact states in wet-freeze regions that have a history of using slag cement in pavement and bridge deck construction. Build a list of potential sites that range in age from about 2 to 40 years.
2. Select 15 pavement sites that have a good range of scaling performance (i.e., ranging from those not exhibiting any deterioration characteristics to those that have significant scaling). Conduct a field condition survey on the selected pavement sites.
2
3. Collect mix details, construction details, traffic details, and environmental details. 4. Extract sections and/or cores from pavement and bridge deck sites. 5. Perform testing on specimens extracted from good, medium, and poor performance sites:
• Petrographic analysis, including depth of carbonation and water-cementitious materials (w/cm) ratio
• Evaluation of air void parameters and chemistry of near-surface region • Chloride profile measurement of the near-surface region of the specimen • Measurement of the rapid chloride permeability of the cores • Scaling tests (ASTM C672) on specific sites (repeating petrographic work after
testing) 6. Document the results of testing and create a database of site information and physical
properties that can be correlated to the results of the laboratory study. Prepare an interim report that documents pavement/bridge deck surveys and site selection.
Project Goals (Phase 1 Field Study)
• Document the field performance of existing concrete pavements, bridge decks, and other structures made with slag cement that have been exposed to freeze-thaw cycles in the presence of deicing chemicals.
• Determine from the field study and construction/design records which mixtures and construction parameters have produced scale-resistant concrete containing slag.
3
DESCRIPTION OF FIELD SITES
A total of 28 field sites were visited over the course of this study. The purpose of this section is to provide an overview of the sites and then tabulate the sites that were selected to be cored for subsequent evaluation. For simplicity of presentation, the specific details are given by state, starting with the lead state.
When the project started, it seemed relevant to use the data collection procedures described in a recent FHWA publication on materials-related distress (Van Dam et al. 2002). This was done because of the detailed guidance provided by the publication. Hence, all attempts were made to evaluate at least 500 ft of each pavement site during the shoulder survey. Often much longer surveys were conducted that included several days of paving at a single site. This was done when inconsistencies were noted in adjacent pavement sections. Sometimes shorter shoulder surveys were conducted, but all pavement sites were walked for at least 15 to 20 panels (about 300 to 400 ft). Bridge deck surveys, not specifically covered by Van Dam et al. (2002), were normally conducted over the entire bridge deck when the bridge was short (100 to 300 ft). Staged (or phased) deck construction practices often made two individual sites available for each bridge. However, the surveys were often constrained to a single stage due to traffic control constraints. This constraint was most severe on high–traffic volume urban decks. Initial attempts were made to use the forms provided in the FHWA publication. However, the loose pages were a nuisance in the field, and hence the sites were documented in a bound notebook (sketch book). Photographs were also used to document specific details from each site. Since most of the pavements and bridge decks were less than 10 years old, the visual inspections tended to provide little information about distress. In fact, all of the sites that were surveyed were in good to excellent shape. Keep in mind that the thrust of this research pertained to scaling. Hence, cracking and other distress features that were observed will not be described in detail.
Iowa
Iowa provided a list of 37 potential pavement and bridge deck sites. The majority of the sites were pavements that had been constructed from 1994 through 2004. The list also contained five bridge decks that were constructed in 2002 and 2003 during the I-235 reconstruction project in Des Moines. Discussion with Iowa DOT personnel indicated that they did not believe that scaling was a problem for their pavements. They did indicate that scaling had been observed on one of the bridge decks during I-235 reconstruction. However, they thought that the scaling on the deck was an isolated incident that could have been related to construction and weather issues.
After discussion with Iowa DOT personnel, the list of 37 sites was reduced to seven (the whole list is given in Appendix A). This list of seven consisted of three pavement sites and four bridge deck sites. The pavements included Highway 520 eastbound in Hamilton County, I-35 northbound in Hamilton County, and Highway 151 southbound in Linn County. The bridge deck sites were all in the Des Moines metro area (Polk County) and passed over I-235. The sites included the Euclid Avenue bridge, the 19th Street bridge, the 28th Street bridge, and the East 6th Street bridge.
4
Highway 520
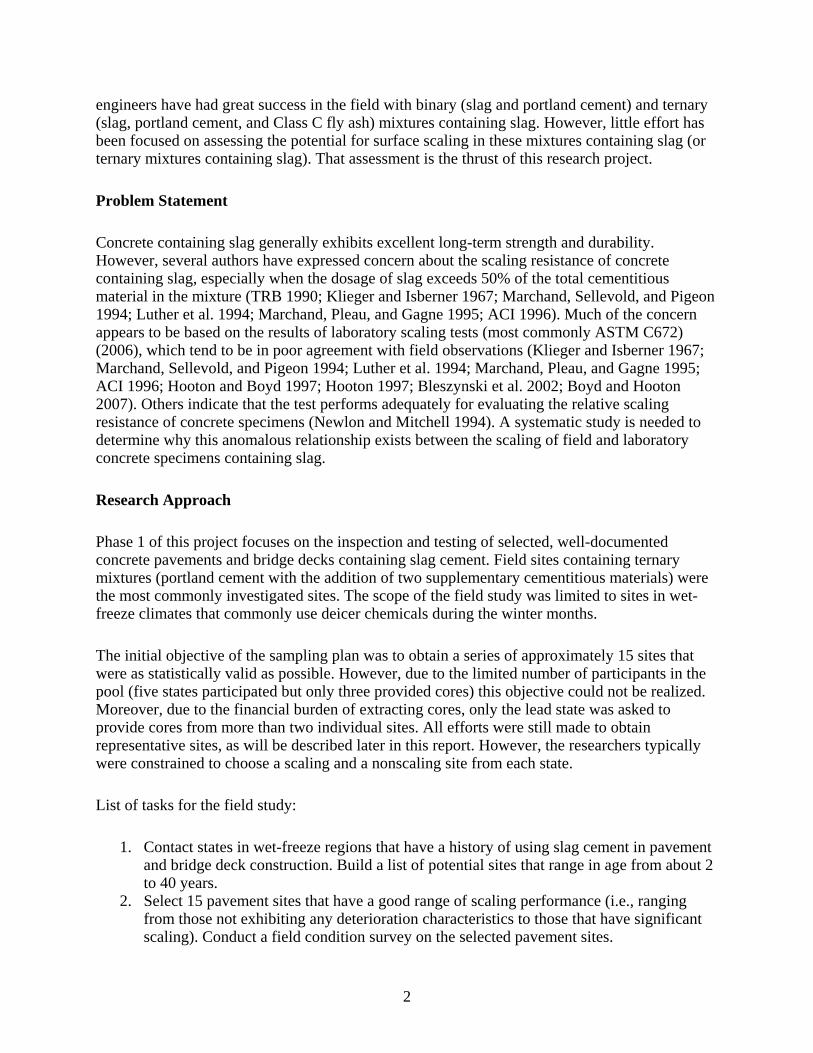
Highway 520 is a four-lane rural highway that passes through Hamilton County. The eastbound roadway was inspected from milepost 156.25 through 158.5. This stretch of pavement was placed from October 12 through October 15, 1999. The cementitious materials used consisted of a blended cement (Type IS) plus an additional 15% of Class C fly ash. This pavement was in excellent shape. No evidence of surface scaling was observed. However, three different surface features were noted on different days of paving.
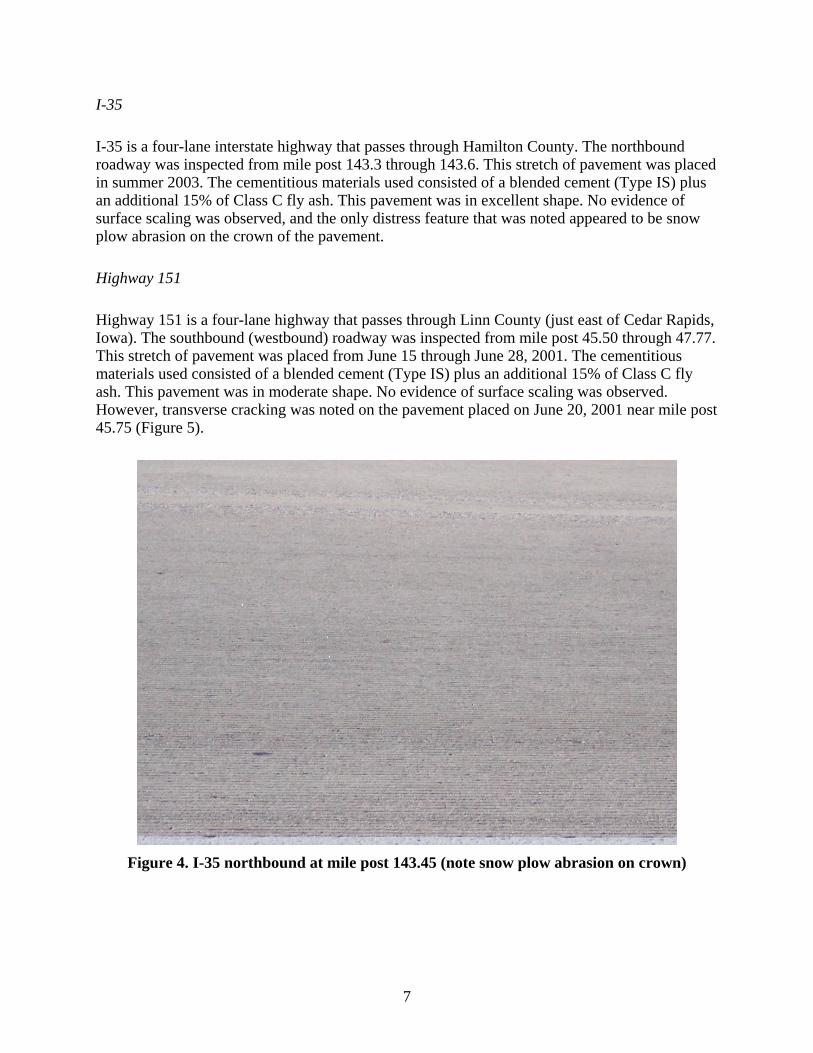
The joint region of a section of the pavement from mile post 156.45 is shown in Figure 1. This section of pavement was paved on October 12, 1999. Subtle features near the joint (roughly parallel to the joint) suggested some paving problems. Likewise, poorly finished areas were evident on the pavement placed on October 14, 1999 (mile post 157.20), shown in Figure 2. However, these discrepancies disappeared later in the paving process, evident in the pavement placed on October 15, 1999, at mile post 157.85 (Figure 3).
Figure 1. Highway 520 eastbound at mile post 156.45 (note features parallel to joint)
5
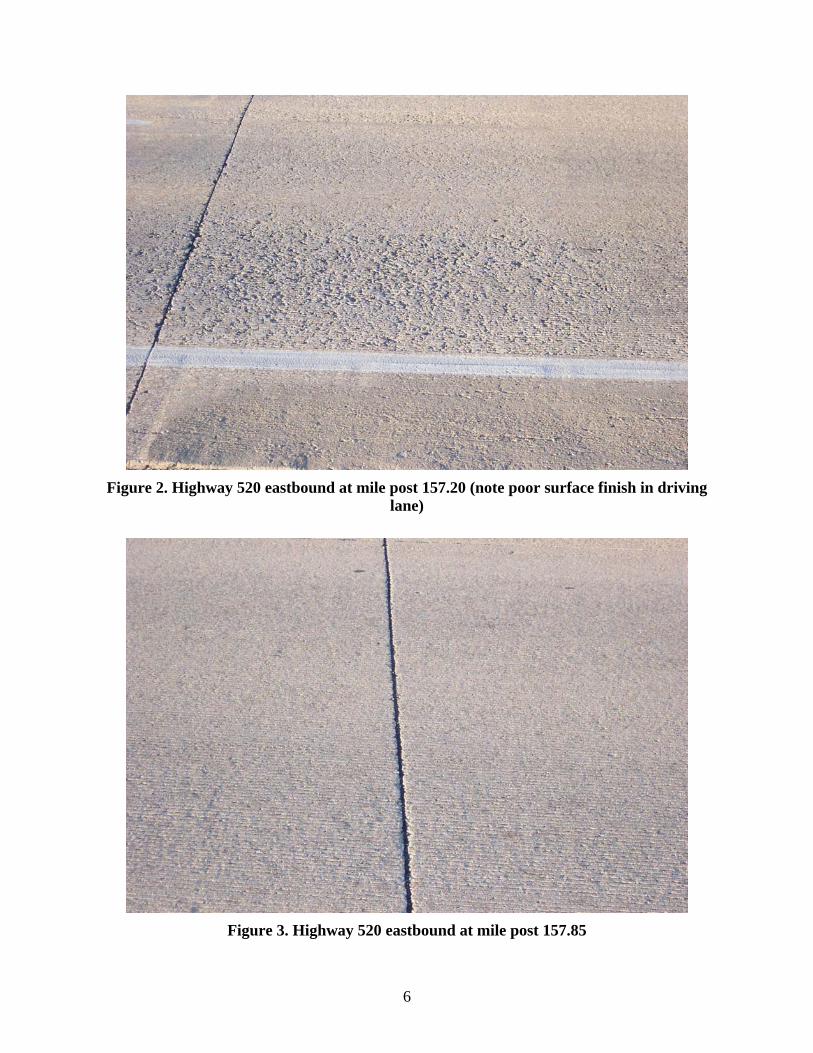
Figure 2. Highway 520 eastbound at mile post 157.20 (note poor surface finish in driving
lane)
Figure 3. Highway 520 eastbound at mile post 157.85
6
I-35
I-35 is a four-lane interstate highway that passes through Hamilton County. The northbound roadway was inspected from mile post 143.3 through 143.6. This stretch of pavement was placed in summer 2003. The cementitious materials used consisted of a blended cement (Type IS) plus an additional 15% of Class C fly ash. This pavement was in excellent shape. No evidence of surface scaling was observed, and the only distress feature that was noted appeared to be snow plow abrasion on the crown of the pavement.
Highway 151
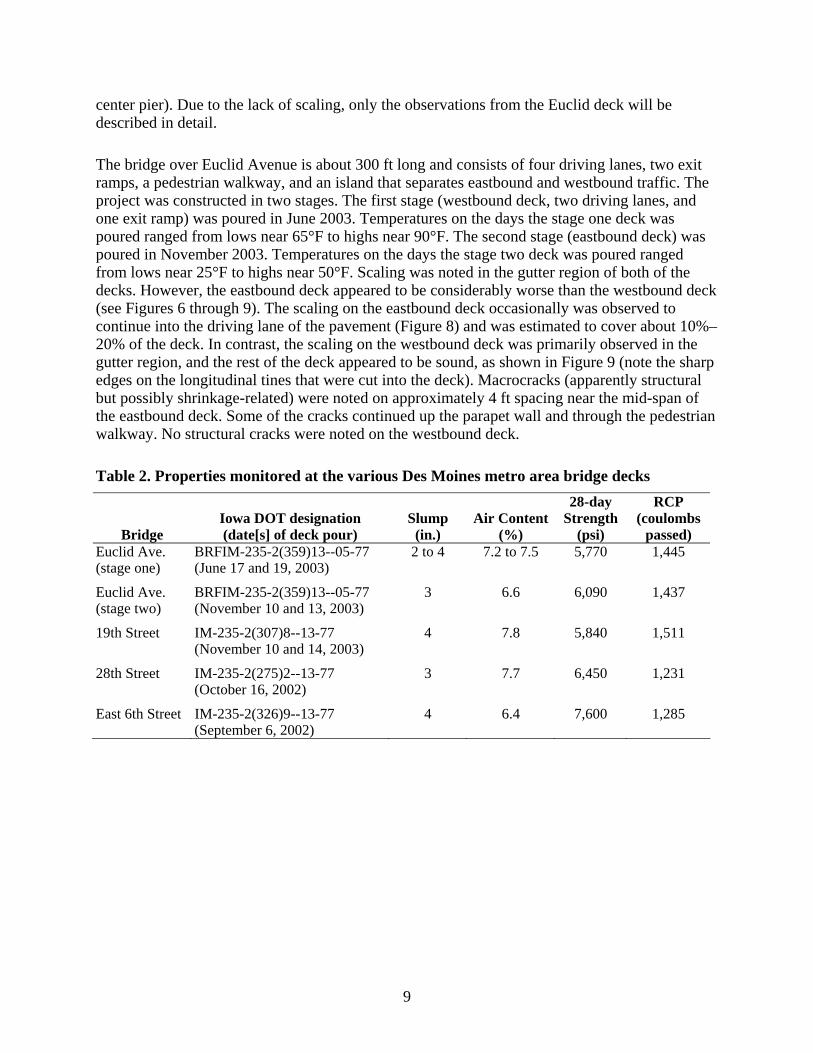
Highway 151 is a four-lane highway that passes through Linn County (just east of Cedar Rapids, Iowa). The southbound (westbound) roadway was inspected from mile post 45.50 through 47.77. This stretch of pavement was placed from June 15 through June 28, 2001. The cementitious materials used consisted of a blended cement (Type IS) plus an additional 15% of Class C fly ash. This pavement was in moderate shape. No evidence of surface scaling was observed. However, transverse cracking was noted on the pavement placed on June 20, 2001 near mile post 45.75 (Figure 5).
Figure 4. I-35 northbound at mile post 143.45 (note snow plow abrasion on crown)
7
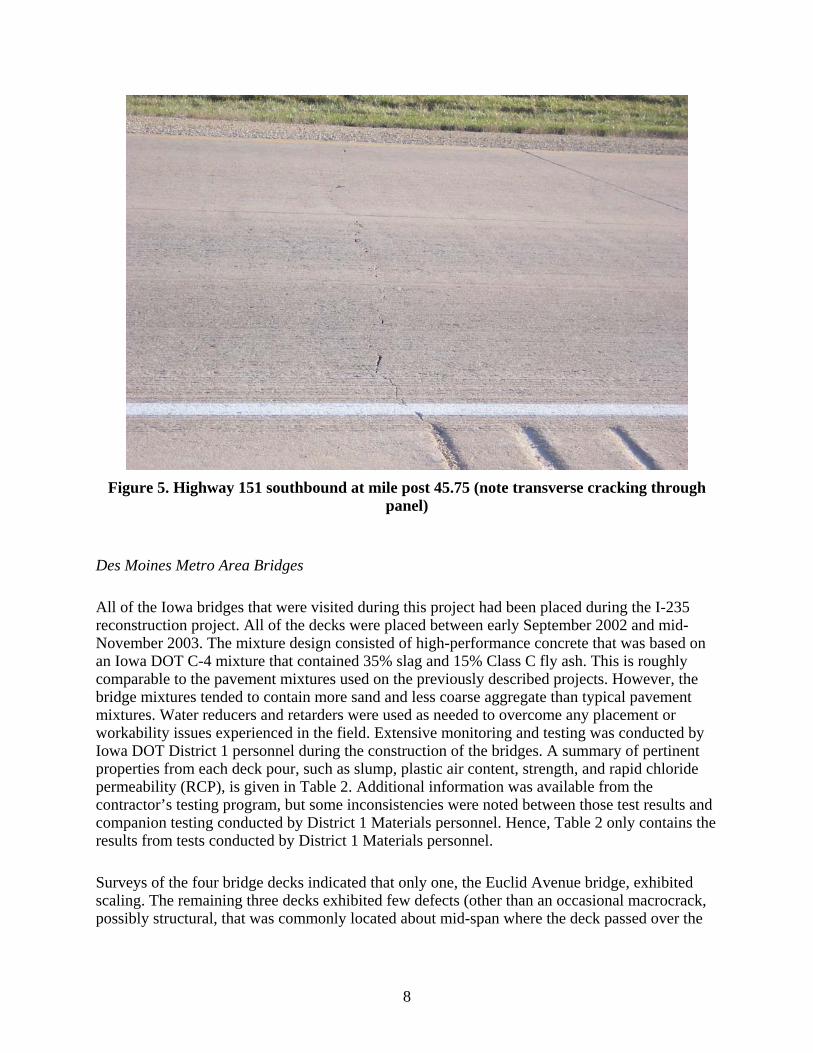
Figure 5. Highway 151 southbound at mile post 45.75 (note transverse cracking through
panel)
Des Moines Metro Area Bridges
All of the Iowa bridges that were visited during this project had been placed during the I-235 reconstruction project. All of the decks were placed between early September 2002 and mid-November 2003. The mixture design consisted of high-performance concrete that was based on an Iowa DOT C-4 mixture that contained 35% slag and 15% Class C fly ash. This is roughly comparable to the pavement mixtures used on the previously described projects. However, the bridge mixtures tended to contain more sand and less coarse aggregate than typical pavement mixtures. Water reducers and retarders were used as needed to overcome any placement or workability issues experienced in the field. Extensive monitoring and testing was conducted by Iowa DOT District 1 personnel during the construction of the bridges. A summary of pertinent properties from each deck pour, such as slump, plastic air content, strength, and rapid chloride permeability (RCP), is given in Table 2. Additional information was available from the contractor’s testing program, but some inconsistencies were noted between those test results and companion testing conducted by District 1 Materials personnel. Hence, Table 2 only contains the results from tests conducted by District 1 Materials personnel.
Surveys of the four bridge decks indicated that only one, the Euclid Avenue bridge, exhibited scaling. The remaining three decks exhibited few defects (other than an occasional macrocrack, possibly structural, that was commonly located about mid-span where the deck passed over the
8
center pier). Due to the lack of scaling, only the observations from the Euclid deck will be described in detail.
The bridge over Euclid Avenue is about 300 ft long and consists of four driving lanes, two exit ramps, a pedestrian walkway, and an island that separates eastbound and westbound traffic. The project was constructed in two stages. The first stage (westbound deck, two driving lanes, and one exit ramp) was poured in June 2003. Temperatures on the days the stage one deck was poured ranged from lows near 65°F to highs near 90°F. The second stage (eastbound deck) was poured in November 2003. Temperatures on the days the stage two deck was poured ranged from lows near 25°F to highs near 50°F. Scaling was noted in the gutter region of both of the decks. However, the eastbound deck appeared to be considerably worse than the westbound deck (see Figures 6 through 9). The scaling on the eastbound deck occasionally was observed to continue into the driving lane of the pavement (Figure 8) and was estimated to cover about 10%–20% of the deck. In contrast, the scaling on the westbound deck was primarily observed in the gutter region, and the rest of the deck appeared to be sound, as shown in Figure 9 (note the sharp edges on the longitudinal tines that were cut into the deck). Macrocracks (apparently structural but possibly shrinkage-related) were noted on approximately 4 ft spacing near the mid-span of the eastbound deck. Some of the cracks continued up the parapet wall and through the pedestrian walkway. No structural cracks were noted on the westbound deck.
Table 2. Properties monitored at the various Des Moines metro area bridge decks
Bridge Iowa DOT designation (date[s] of deck pour)
Slump (in.)
Air Content (%)
28-day Strength
(psi)
RCP (coulombs
passed) Euclid Ave. (stage one)
BRFIM-235-2(359)13--05-77 (June 17 and 19, 2003)
2 to 4 7.2 to 7.5 5,770 1,445
Euclid Ave. (stage two)
BRFIM-235-2(359)13--05-77 (November 10 and 13, 2003)
3 6.6 6,090 1,437
19th Street IM-235-2(307)8--13-77 (November 10 and 14, 2003)
4 7.8 5,840 1,511
28th Street IM-235-2(275)2--13-77 (October 16, 2002)
3 7.7 6,450 1,231
East 6th Street IM-235-2(326)9--13-77 (September 6, 2002)
4 6.4 7,600 1,285
9
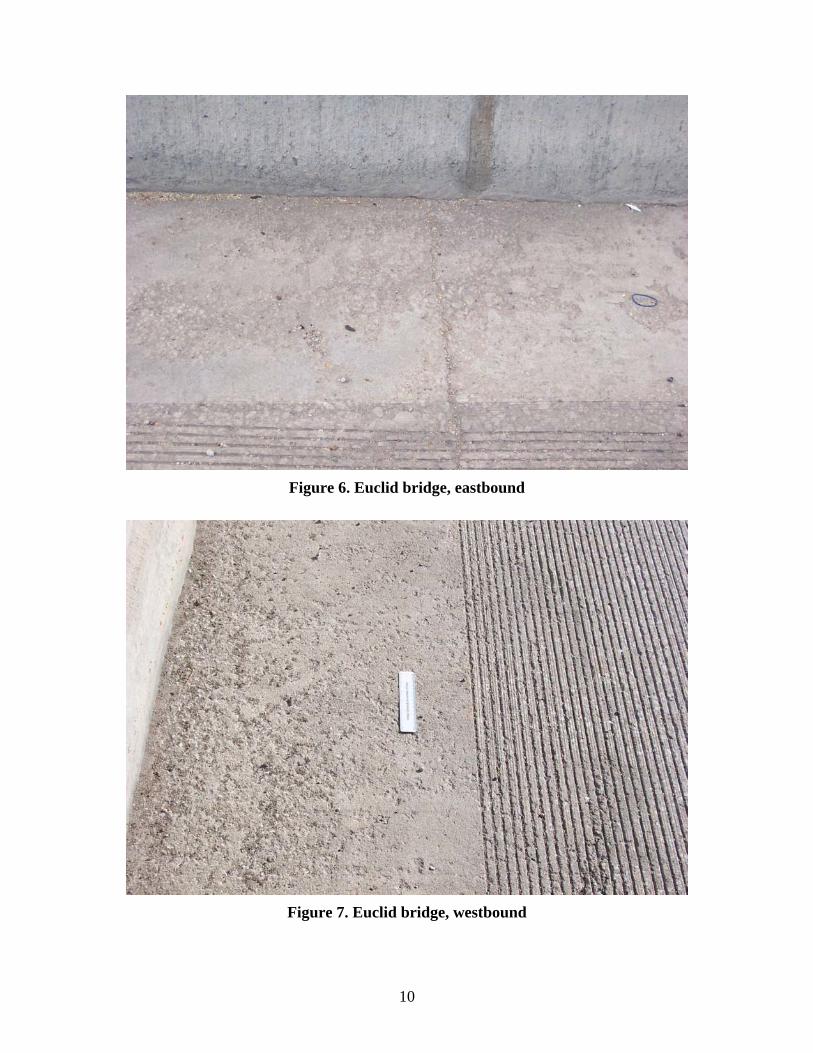
Figure 6. Euclid bridge, eastbound
Figure 7. Euclid bridge, westbound
10
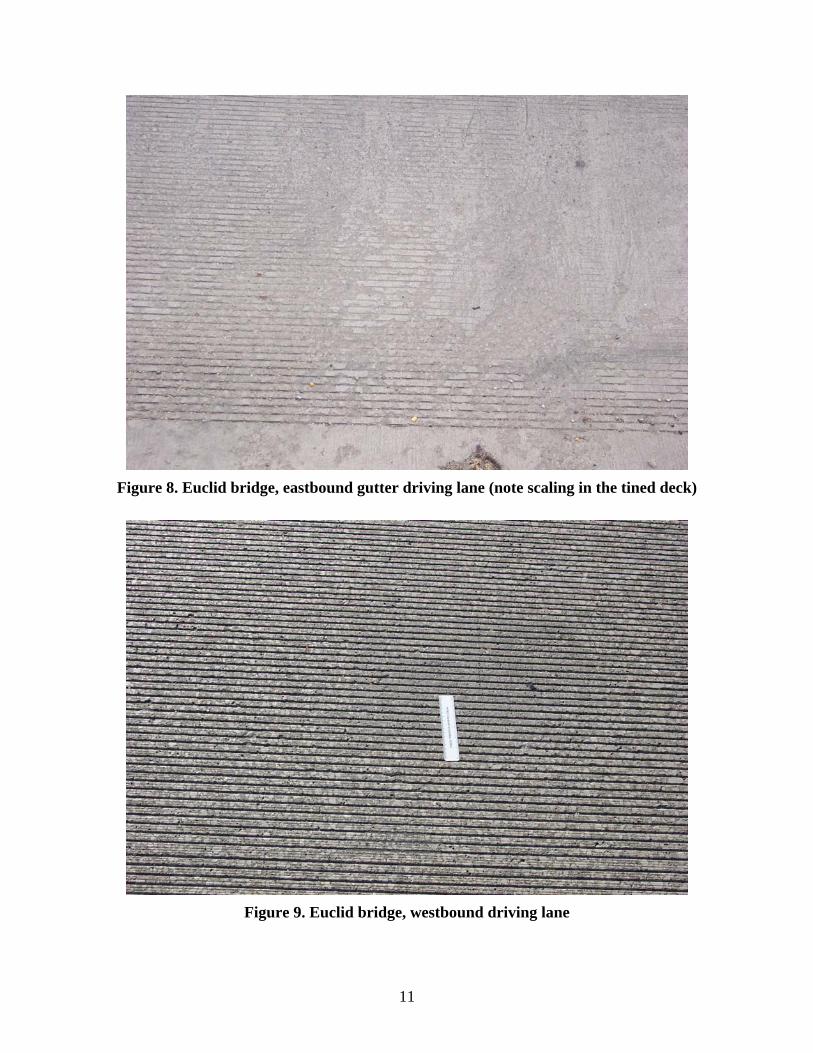
Figure 8. Euclid bridge, eastbound gutter driving lane (note scaling in the tined deck)
Figure 9. Euclid bridge, westbound driving lane
11
Connecticut
Connecticut had two sites that were surveyed for the deicer scaling project. One of the sites was a barrier wall located adjacent to exit 29A in downtown Hartford. The second site was an entrance/exit ramp (bridge deck #1863) on Whitehead Highway, SR 598.
Barrier Wall
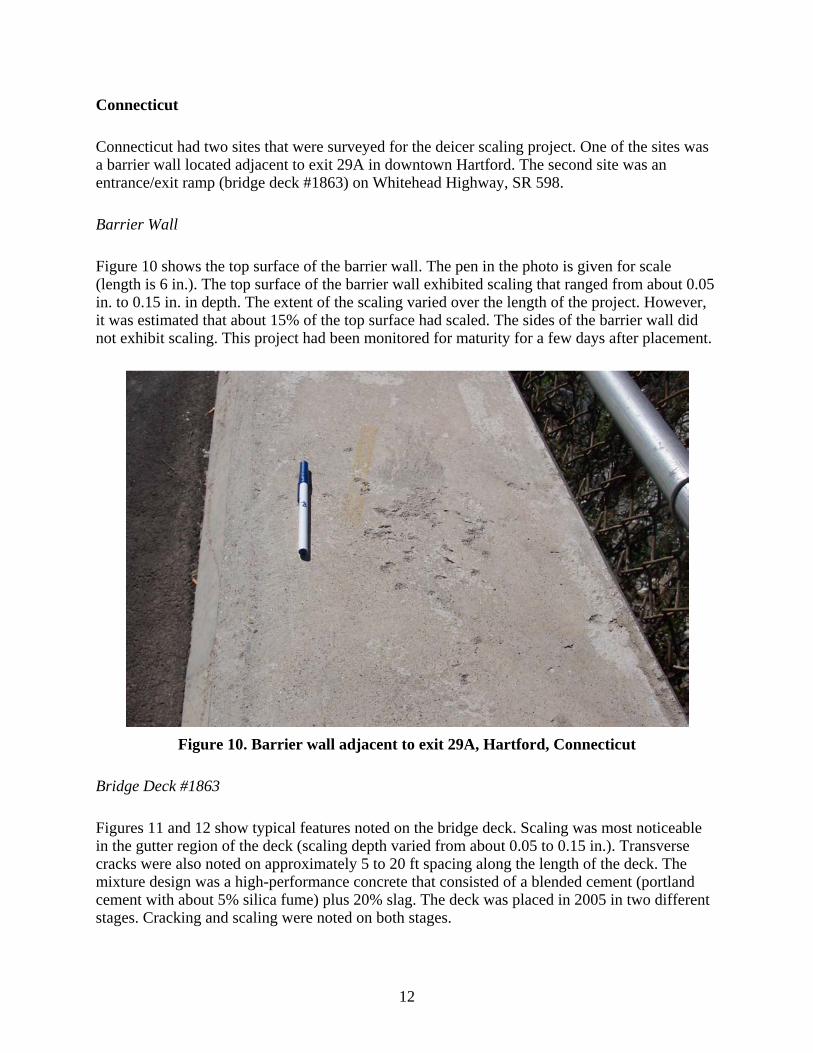
Figure 10 shows the top surface of the barrier wall. The pen in the photo is given for scale (length is 6 in.). The top surface of the barrier wall exhibited scaling that ranged from about 0.05 in. to 0.15 in. in depth. The extent of the scaling varied over the length of the project. However, it was estimated that about 15% of the top surface had scaled. The sides of the barrier wall did not exhibit scaling. This project had been monitored for maturity for a few days after placement.
Figure 10. Barrier wall adjacent to exit 29A, Hartford, Connecticut
Bridge Deck #1863
Figures 11 and 12 show typical features noted on the bridge deck. Scaling was most noticeable in the gutter region of the deck (scaling depth varied from about 0.05 to 0.15 in.). Transverse cracks were also noted on approximately 5 to 20 ft spacing along the length of the deck. The mixture design was a high-performance concrete that consisted of a blended cement (portland cement with about 5% silica fume) plus 20% slag. The deck was placed in 2005 in two different stages. Cracking and scaling were noted on both stages.
12
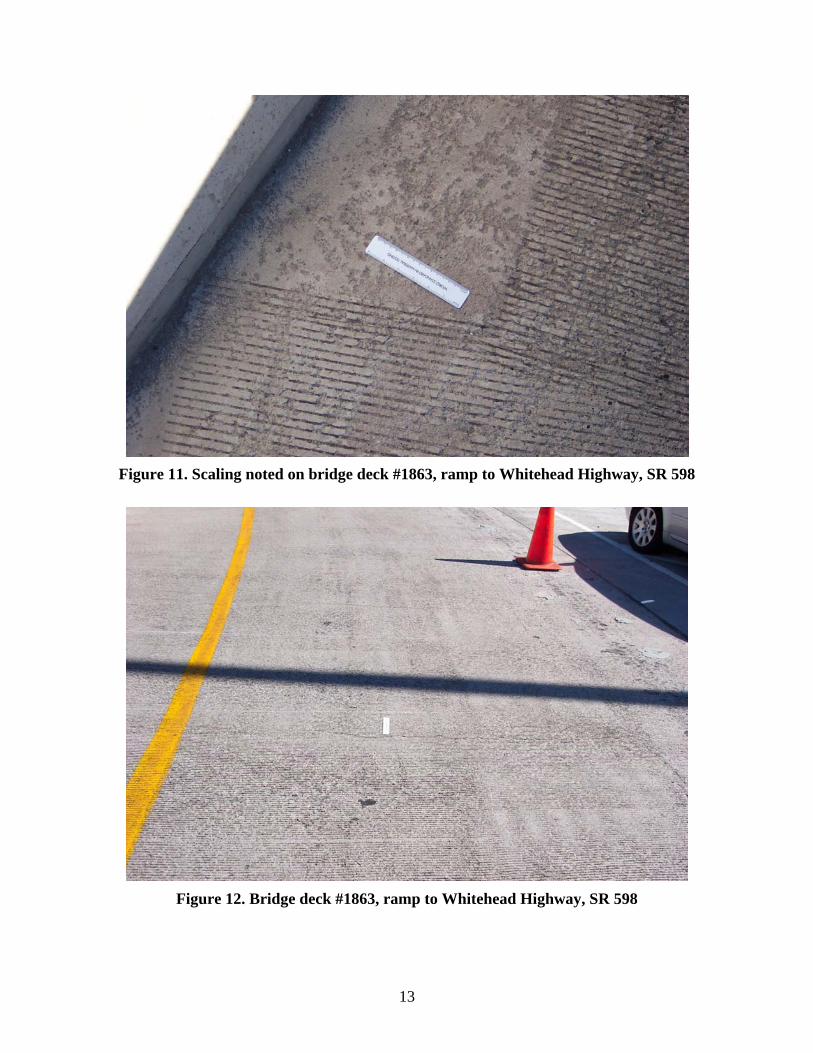
Figure 11. Scaling noted on bridge deck #1863, ramp to Whitehead Highway, SR 598
Figure 12. Bridge deck #1863, ramp to Whitehead Highway, SR 598
13
Delaware
Delaware had five sites that were evaluated for the deicer scaling project. The roadways included Delaware SR 1 (two separate sections, one northbound and one southbound), I-495, and Delaware SR 896 southbound (two separate sections with different ages). All of the roadways contain 25% to 50% slag, and all of the roads are heavily salted during the winter months.
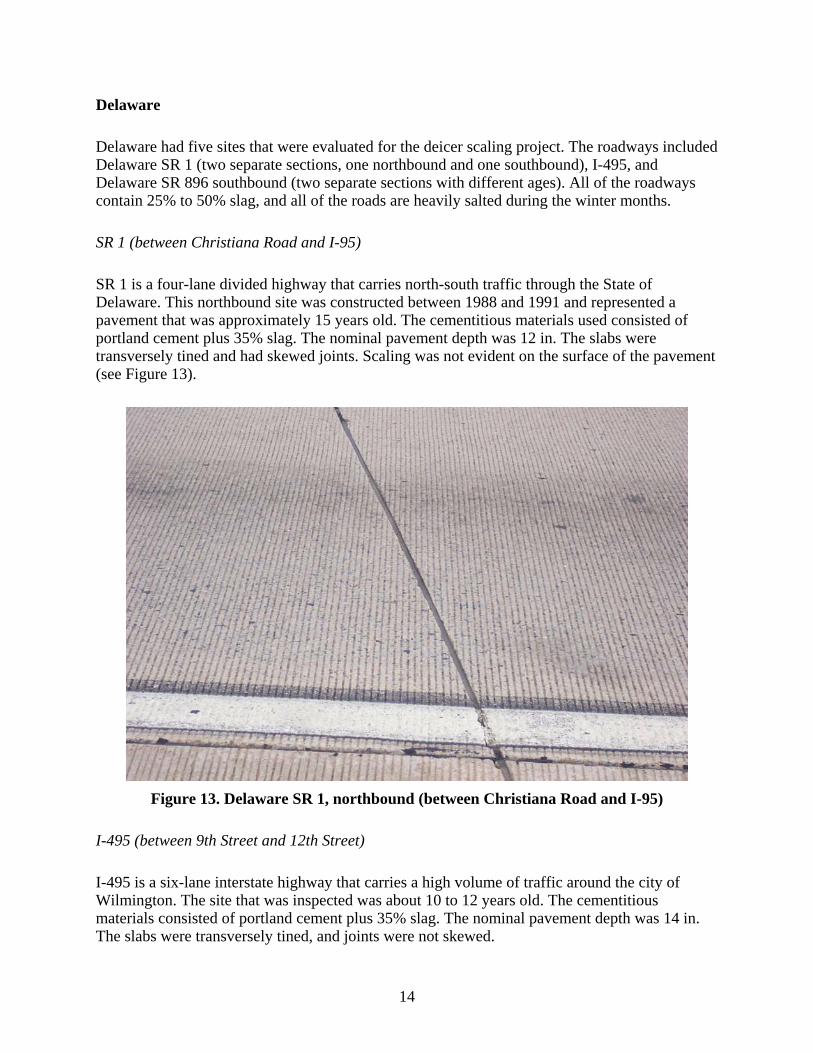
SR 1 (between Christiana Road and I-95)
SR 1 is a four-lane divided highway that carries north-south traffic through the State of Delaware. This northbound site was constructed between 1988 and 1991 and represented a pavement that was approximately 15 years old. The cementitious materials used consisted of portland cement plus 35% slag. The nominal pavement depth was 12 in. The slabs were transversely tined and had skewed joints. Scaling was not evident on the surface of the pavement (see Figure 13).
Figure 13. Delaware SR 1, northbound (between Christiana Road and I-95)
I-495 (between 9th Street and 12th Street)
I-495 is a six-lane interstate highway that carries a high volume of traffic around the city of Wilmington. The site that was inspected was about 10 to 12 years old. The cementitious materials consisted of portland cement plus 35% slag. The nominal pavement depth was 14 in. The slabs were transversely tined, and joints were not skewed.
14
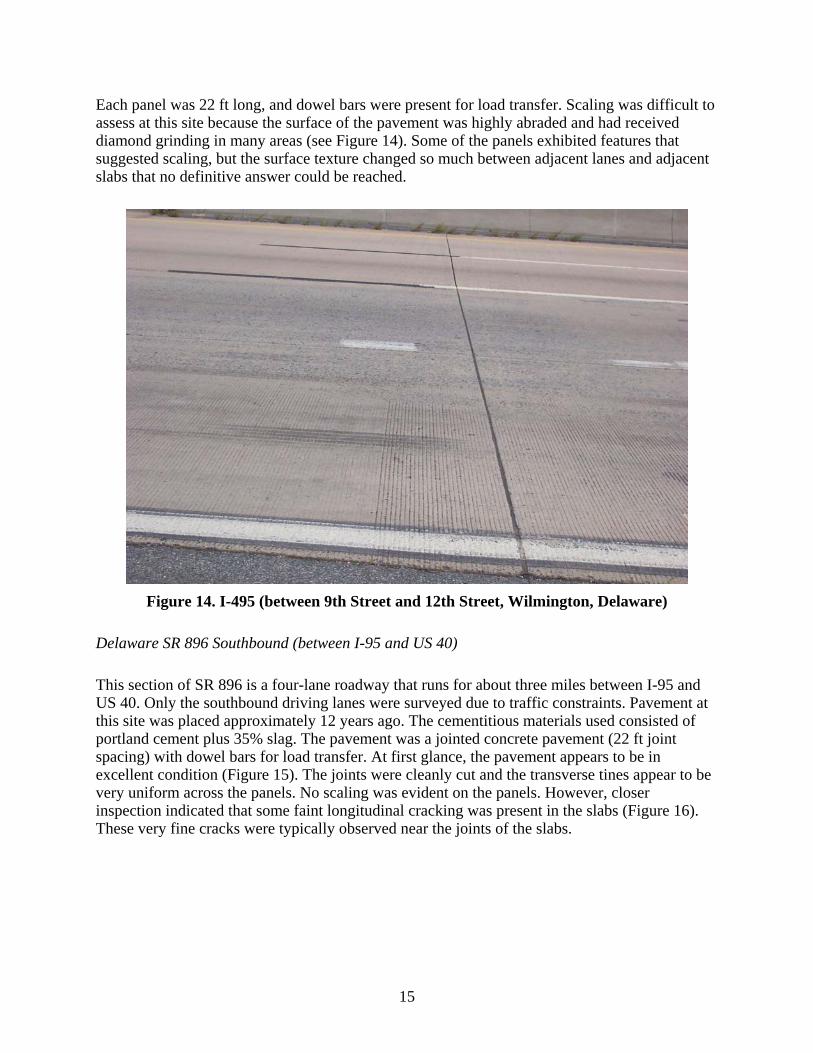
Each panel was 22 ft long, and dowel bars were present for load transfer. Scaling was difficult to assess at this site because the surface of the pavement was highly abraded and had received diamond grinding in many areas (see Figure 14). Some of the panels exhibited features that suggested scaling, but the surface texture changed so much between adjacent lanes and adjacent slabs that no definitive answer could be reached.
Figure 14. I-495 (between 9th Street and 12th Street, Wilmington, Delaware)
Delaware SR 896 Southbound (between I-95 and US 40)
This section of SR 896 is a four-lane roadway that runs for about three miles between I-95 and US 40. Only the southbound driving lanes were surveyed due to traffic constraints. Pavement at this site was placed approximately 12 years ago. The cementitious materials used consisted of portland cement plus 35% slag. The pavement was a jointed concrete pavement (22 ft joint spacing) with dowel bars for load transfer. At first glance, the pavement appears to be in excellent condition (Figure 15). The joints were cleanly cut and the transverse tines appear to be very uniform across the panels. No scaling was evident on the panels. However, closer inspection indicated that some faint longitudinal cracking was present in the slabs (Figure 16). These very fine cracks were typically observed near the joints of the slabs.
15
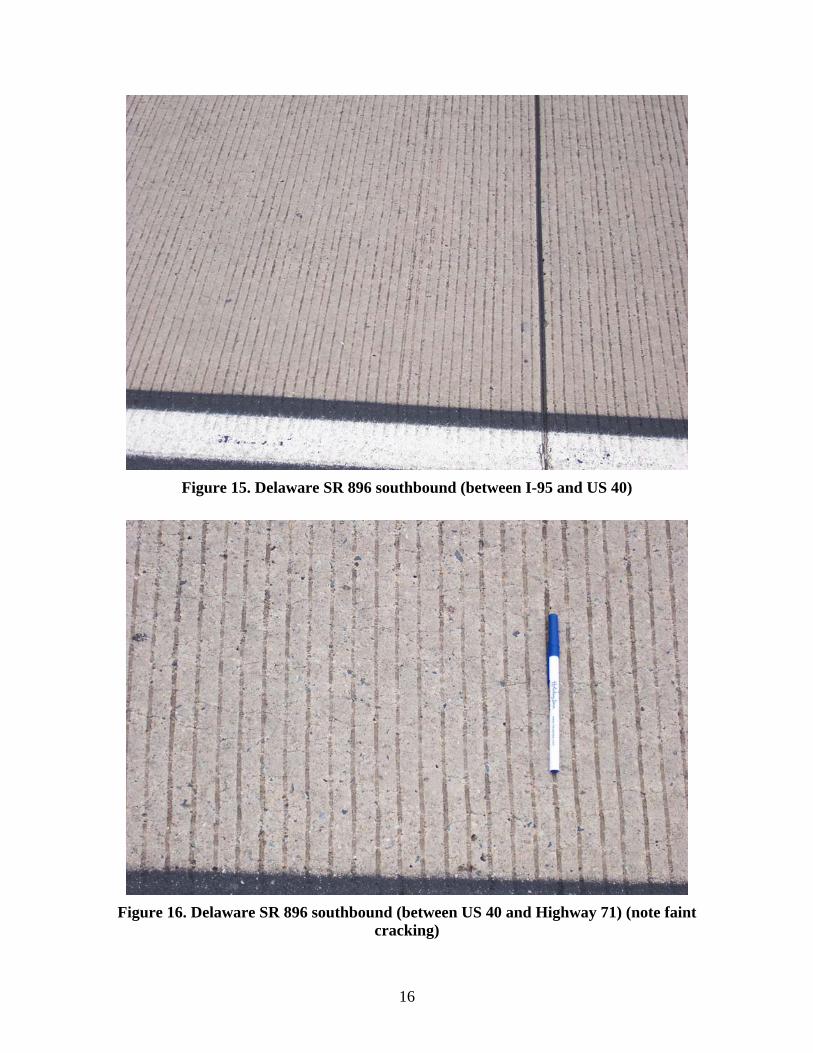
Figure 15. Delaware SR 896 southbound (between I-95 and US 40)
Figure 16. Delaware SR 896 southbound (between US 40 and Highway 71) (note faint
cracking)
16
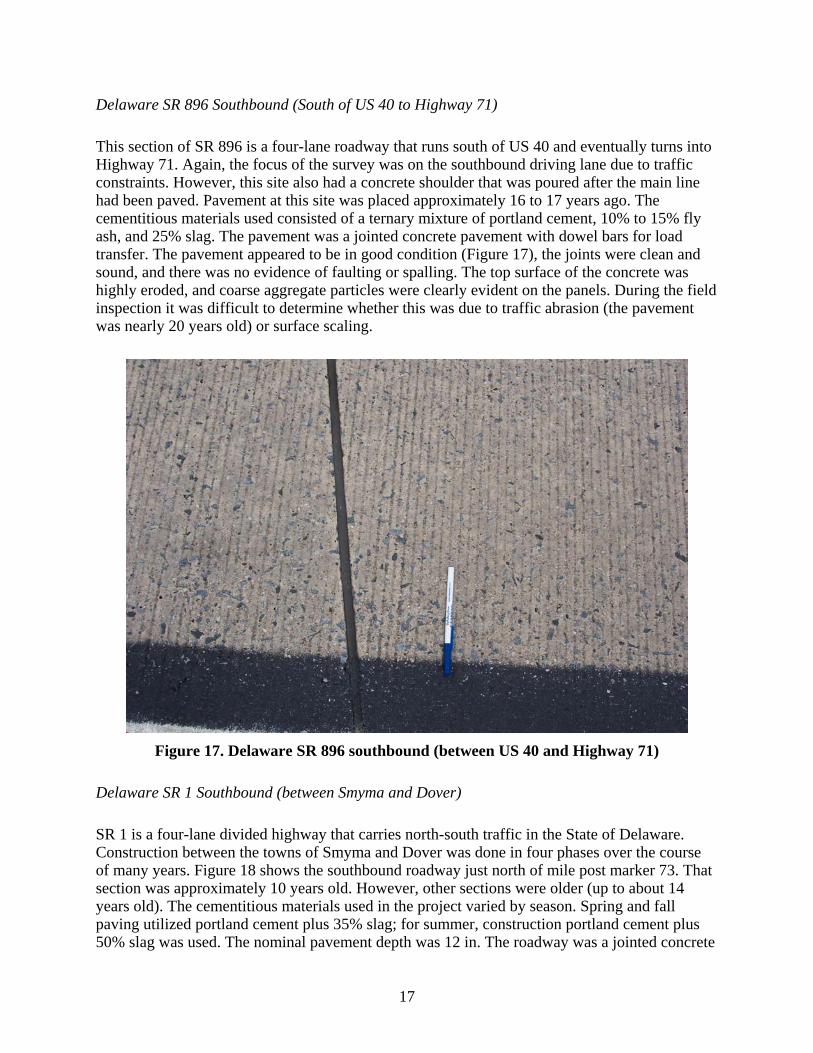
Delaware SR 896 Southbound (South of US 40 to Highway 71)
This section of SR 896 is a four-lane roadway that runs south of US 40 and eventually turns into Highway 71. Again, the focus of the survey was on the southbound driving lane due to traffic constraints. However, this site also had a concrete shoulder that was poured after the main line had been paved. Pavement at this site was placed approximately 16 to 17 years ago. The cementitious materials used consisted of a ternary mixture of portland cement, 10% to 15% fly ash, and 25% slag. The pavement was a jointed concrete pavement with dowel bars for load transfer. The pavement appeared to be in good condition (Figure 17), the joints were clean and sound, and there was no evidence of faulting or spalling. The top surface of the concrete was highly eroded, and coarse aggregate particles were clearly evident on the panels. During the field inspection it was difficult to determine whether this was due to traffic abrasion (the pavement was nearly 20 years old) or surface scaling.
Figure 17. Delaware SR 896 southbound (between US 40 and Highway 71)
Delaware SR 1 Southbound (between Smyma and Dover)
SR 1 is a four-lane divided highway that carries north-south traffic in the State of Delaware. Construction between the towns of Smyma and Dover was done in four phases over the course of many years. Figure 18 shows the southbound roadway just north of mile post marker 73. That section was approximately 10 years old. However, other sections were older (up to about 14 years old). The cementitious materials used in the project varied by season. Spring and fall paving utilized portland cement plus 35% slag; for summer, construction portland cement plus 50% slag was used. The nominal pavement depth was 12 in. The roadway was a jointed concrete
17
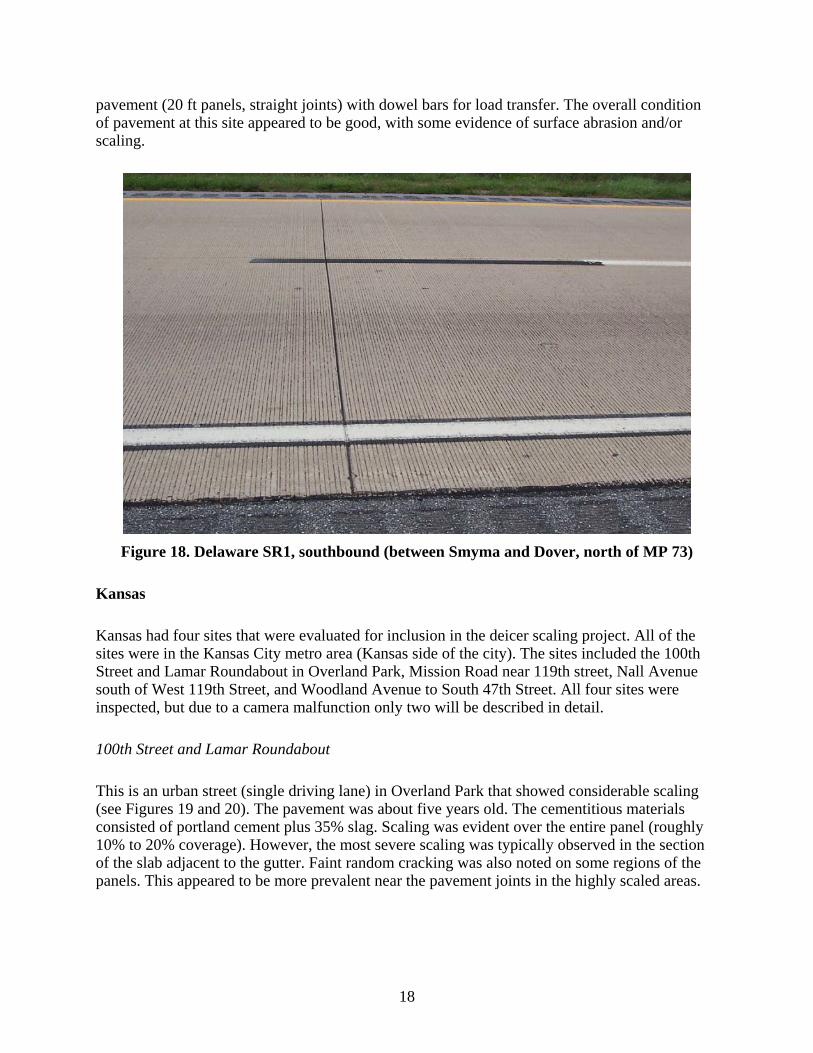
pavement (20 ft panels, straight joints) with dowel bars for load transfer. The overall condition of pavement at this site appeared to be good, with some evidence of surface abrasion and/or scaling.
Figure 18. Delaware SR1, southbound (between Smyma and Dover, north of MP 73)
Kansas
Kansas had four sites that were evaluated for inclusion in the deicer scaling project. All of the sites were in the Kansas City metro area (Kansas side of the city). The sites included the 100th Street and Lamar Roundabout in Overland Park, Mission Road near 119th street, Nall Avenue south of West 119th Street, and Woodland Avenue to South 47th Street. All four sites were inspected, but due to a camera malfunction only two will be described in detail.
100th Street and Lamar Roundabout
This is an urban street (single driving lane) in Overland Park that showed considerable scaling (see Figures 19 and 20). The pavement was about five years old. The cementitious materials consisted of portland cement plus 35% slag. Scaling was evident over the entire panel (roughly 10% to 20% coverage). However, the most severe scaling was typically observed in the section of the slab adjacent to the gutter. Faint random cracking was also noted on some regions of the panels. This appeared to be more prevalent near the pavement joints in the highly scaled areas.
18
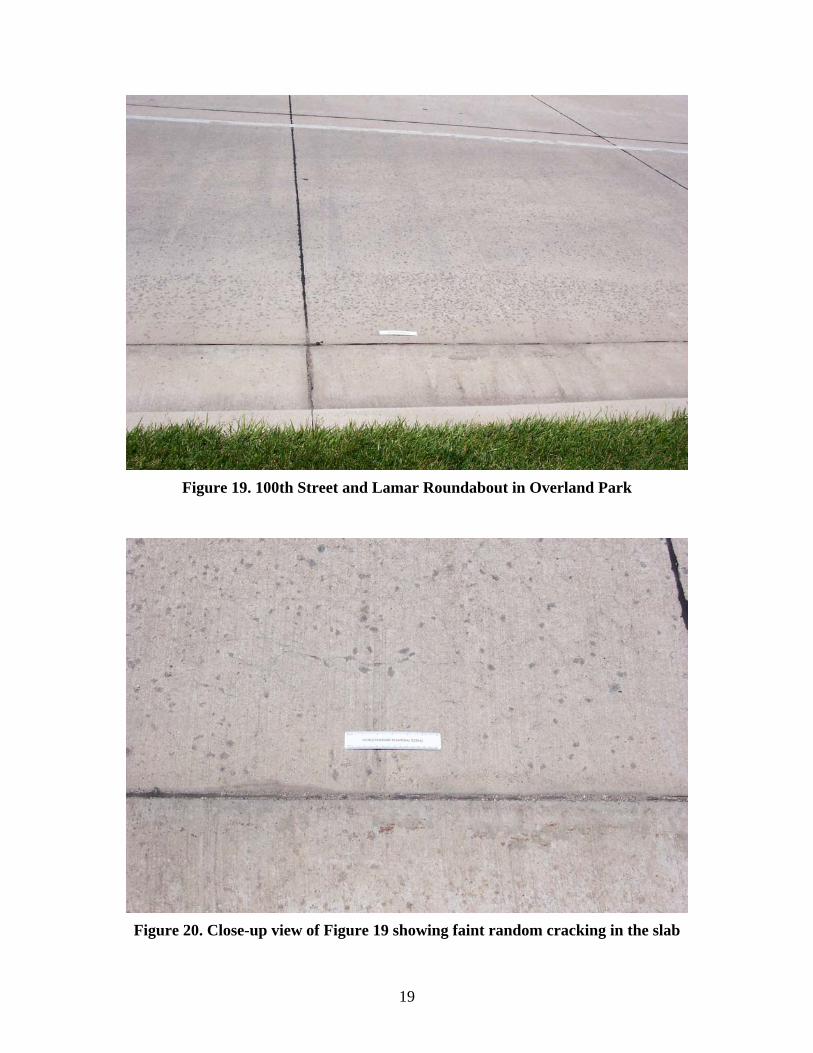
Figure 19. 100th Street and Lamar Roundabout in Overland Park
Figure 20. Close-up view of Figure 19 showing faint random cracking in the slab
19
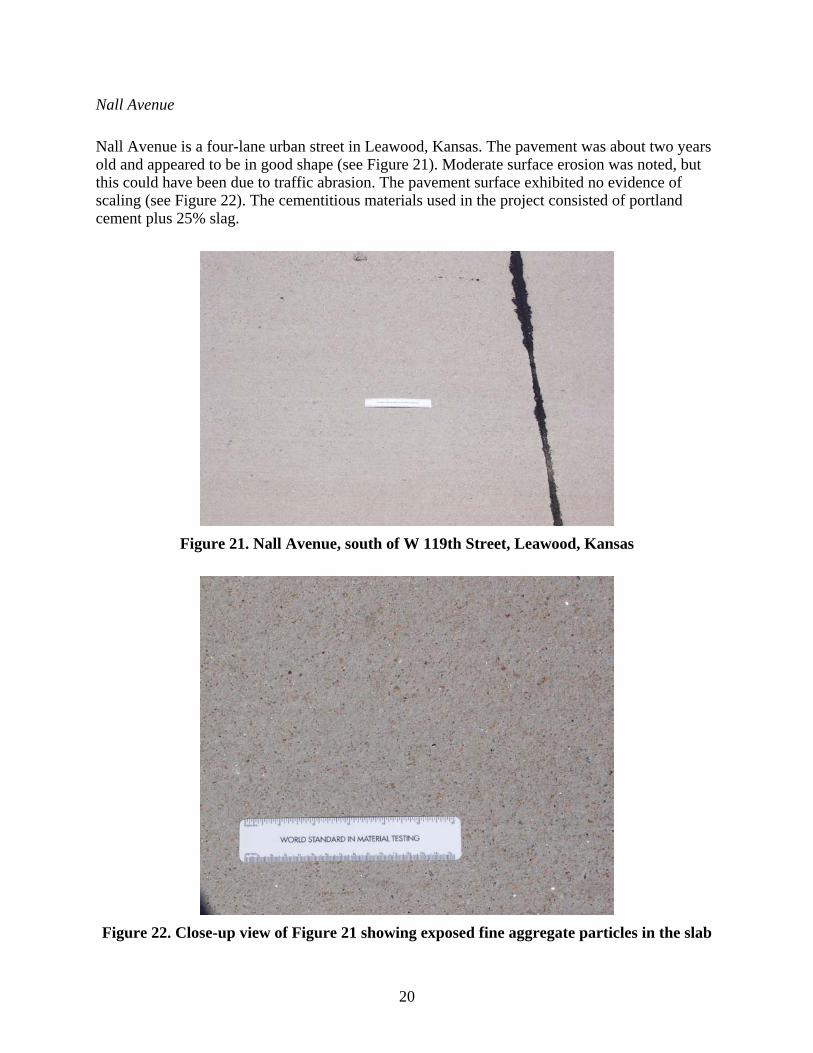
Nall Avenue
Nall Avenue is a four-lane urban street in Leawood, Kansas. The pavement was about two years old and appeared to be in good shape (see Figure 21). Moderate surface erosion was noted, but this could have been due to traffic abrasion. The pavement surface exhibited no evidence of scaling (see Figure 22). The cementitious materials used in the project consisted of portland cement plus 25% slag.
Figure 21. Nall Avenue, south of W 119th Street, Leawood, Kansas
Figure 22. Close-up view of Figure 21 showing exposed fine aggregate particles in the slab
20
Michigan
Michigan had four sites that were evaluated for inclusion in the deicer scaling project. All four of the sites were in (or near) Grand Rapids, Michigan. One site was a parking lot at the Michigan Caterpillar Company, one site was a short bridge on M 45 over Sand Creek, and the other two sites were eastbound and westbound bridges on M 45 over the Grand River.
Michigan Caterpillar Company
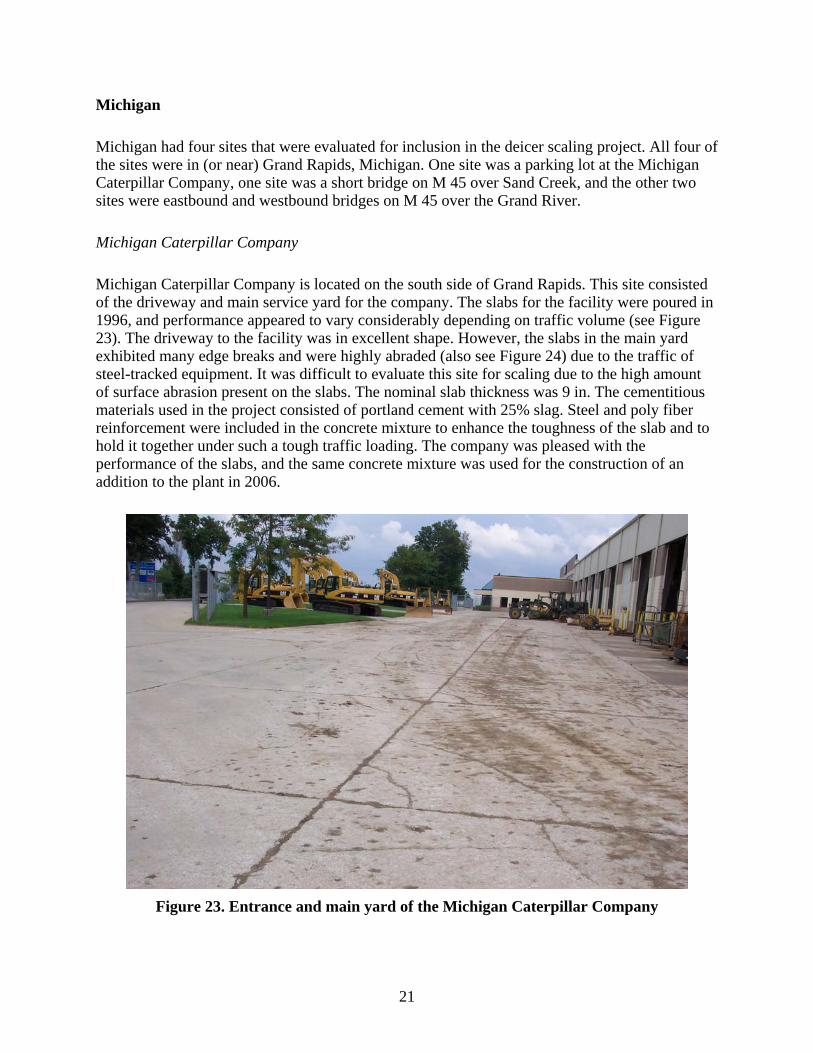
Michigan Caterpillar Company is located on the south side of Grand Rapids. This site consisted of the driveway and main service yard for the company. The slabs for the facility were poured in 1996, and performance appeared to vary considerably depending on traffic volume (see Figure 23). The driveway to the facility was in excellent shape. However, the slabs in the main yard exhibited many edge breaks and were highly abraded (also see Figure 24) due to the traffic of steel-tracked equipment. It was difficult to evaluate this site for scaling due to the high amount of surface abrasion present on the slabs. The nominal slab thickness was 9 in. The cementitious materials used in the project consisted of portland cement with 25% slag. Steel and poly fiber reinforcement were included in the concrete mixture to enhance the toughness of the slab and to hold it together under such a tough traffic loading. The company was pleased with the performance of the slabs, and the same concrete mixture was used for the construction of an addition to the plant in 2006.
Figure 23. Entrance and main yard of the Michigan Caterpillar Company
21
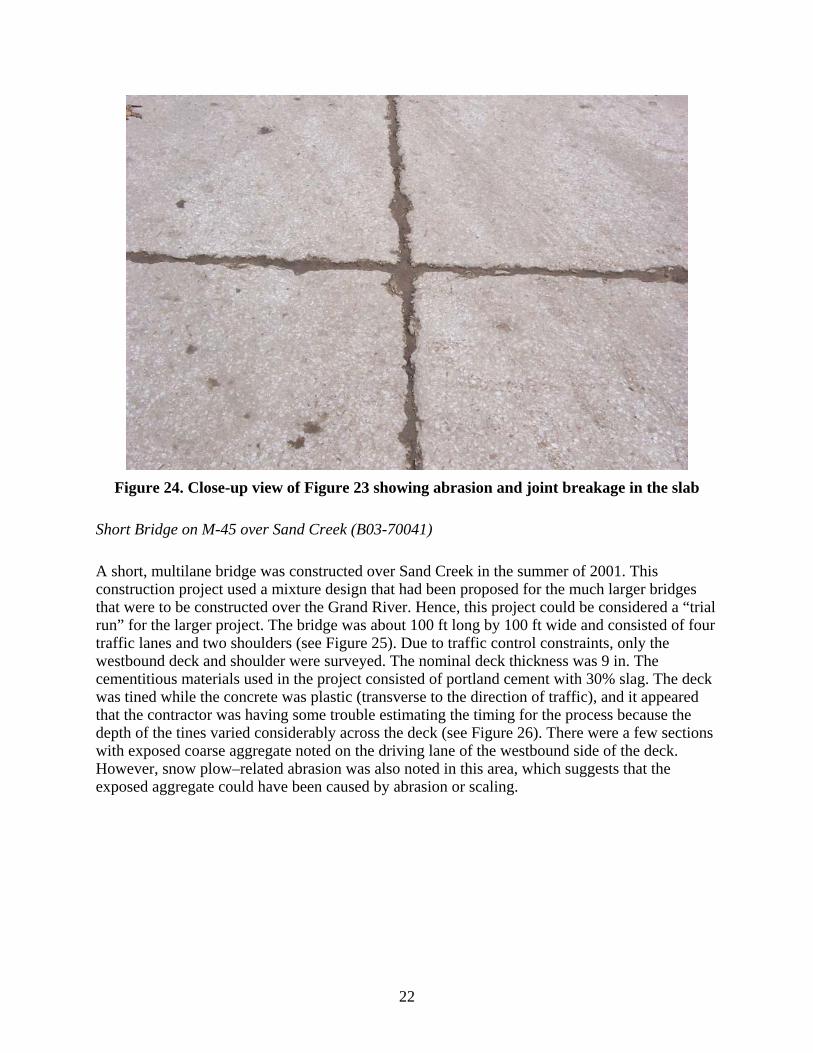
Figure 24. Close-up view of Figure 23 showing abrasion and joint breakage in the slab
Short Bridge on M-45 over Sand Creek (B03-70041)
A short, multilane bridge was constructed over Sand Creek in the summer of 2001. This construction project used a mixture design that had been proposed for the much larger bridges that were to be constructed over the Grand River. Hence, this project could be considered a “trial run” for the larger project. The bridge was about 100 ft long by 100 ft wide and consisted of four traffic lanes and two shoulders (see Figure 25). Due to traffic control constraints, only the westbound deck and shoulder were surveyed. The nominal deck thickness was 9 in. The cementitious materials used in the project consisted of portland cement with 30% slag. The deck was tined while the concrete was plastic (transverse to the direction of traffic), and it appeared that the contractor was having some trouble estimating the timing for the process because the depth of the tines varied considerably across the deck (see Figure 26). There were a few sections with exposed coarse aggregate noted on the driving lane of the westbound side of the deck. However, snow plow–related abrasion was also noted in this area, which suggests that the exposed aggregate could have been caused by abrasion or scaling.
22
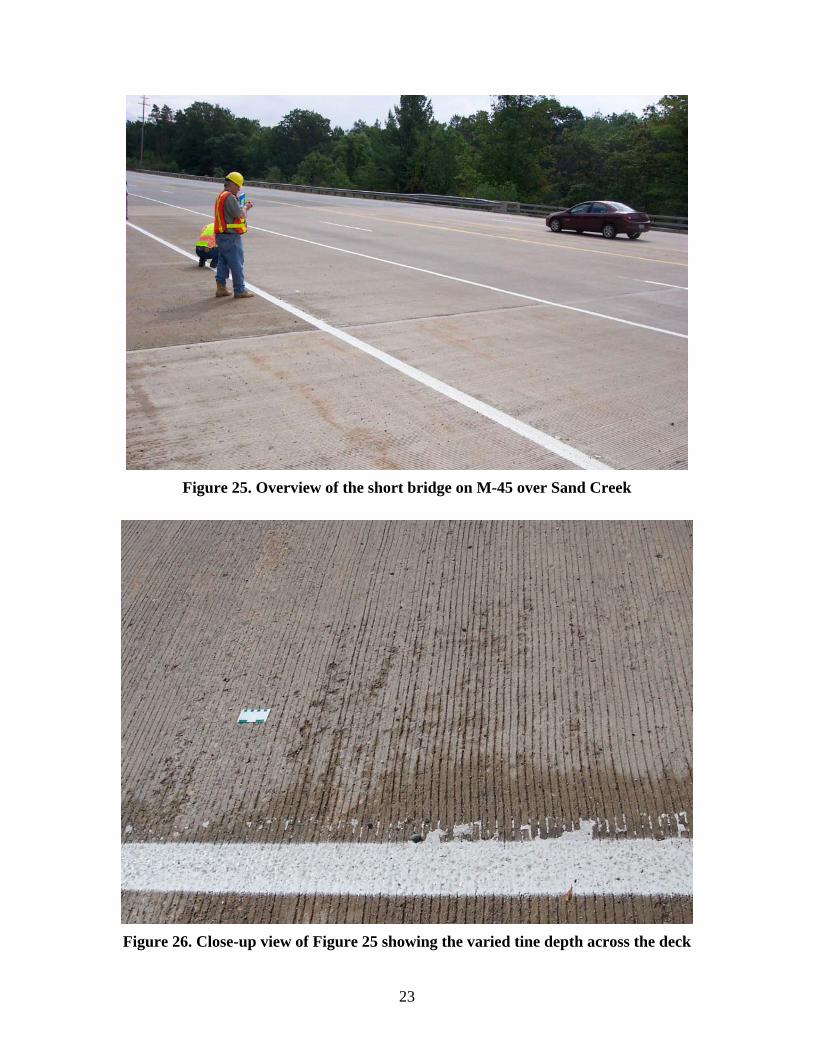
Figure 25. Overview of the short bridge on M-45 over Sand Creek
Figure 26. Close-up view of Figure 25 showing the varied tine depth across the deck
23
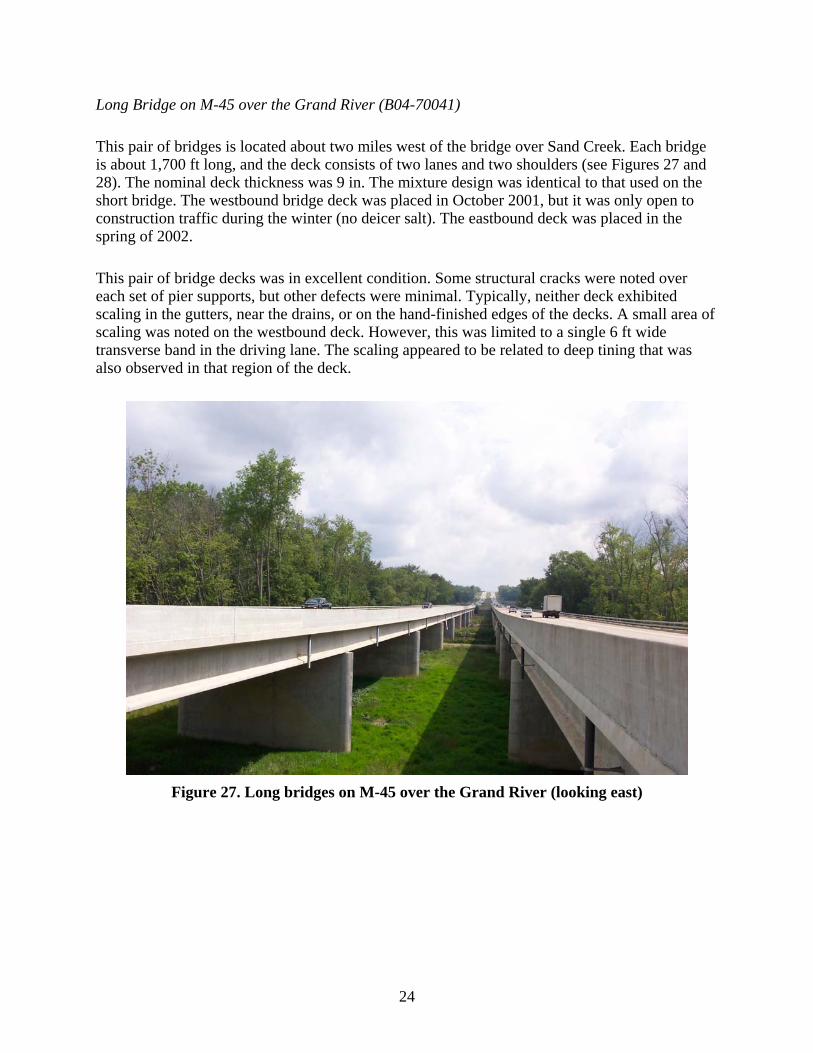
Long Bridge on M-45 over the Grand River (B04-70041)
This pair of bridges is located about two miles west of the bridge over Sand Creek. Each bridge is about 1,700 ft long, and the deck consists of two lanes and two shoulders (see Figures 27 and 28). The nominal deck thickness was 9 in. The mixture design was identical to that used on the short bridge. The westbound bridge deck was placed in October 2001, but it was only open to construction traffic during the winter (no deicer salt). The eastbound deck was placed in the spring of 2002.
This pair of bridge decks was in excellent condition. Some structural cracks were noted over each set of pier supports, but other defects were minimal. Typically, neither deck exhibited scaling in the gutters, near the drains, or on the hand-finished edges of the decks. A small area of scaling was noted on the westbound deck. However, this was limited to a single 6 ft wide transverse band in the driving lane. The scaling appeared to be related to deep tining that was also observed in that region of the deck.
Figure 27. Long bridges on M-45 over the Grand River (looking east)
24
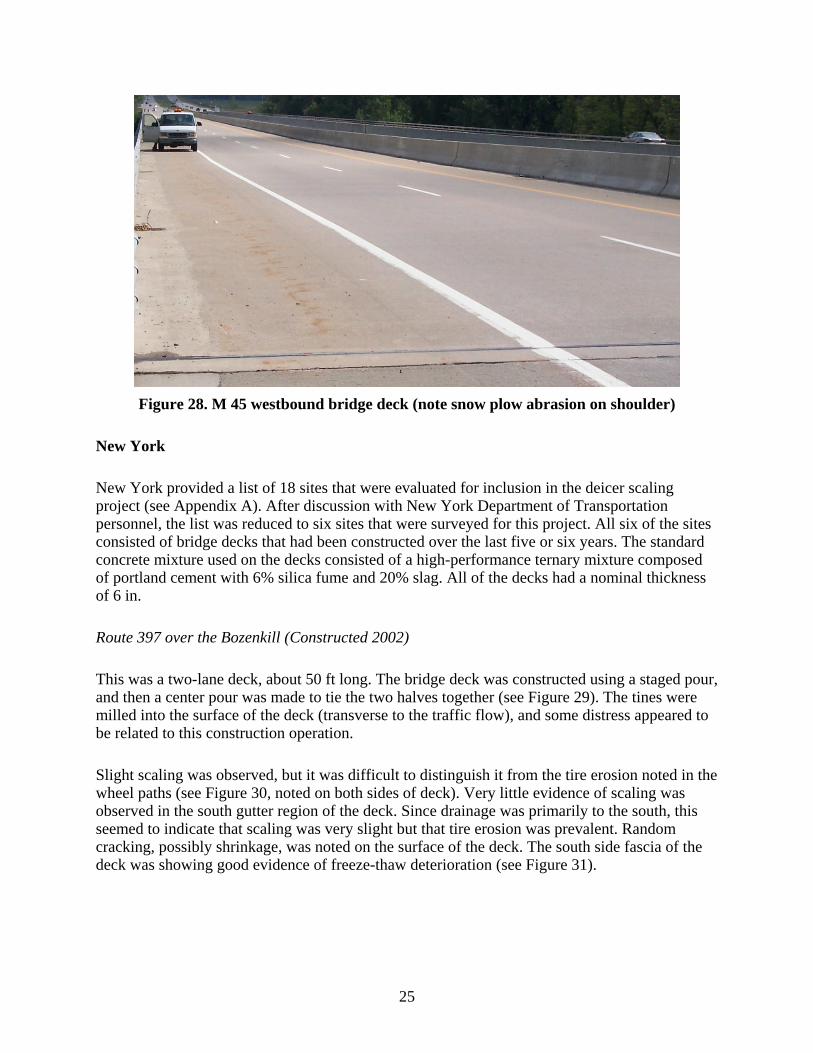
Figure 28. M 45 westbound bridge deck (note snow plow abrasion on shoulder)
New York
New York provided a list of 18 sites that were evaluated for inclusion in the deicer scaling project (see Appendix A). After discussion with New York Department of Transportation personnel, the list was reduced to six sites that were surveyed for this project. All six of the sites consisted of bridge decks that had been constructed over the last five or six years. The standard concrete mixture used on the decks consisted of a high-performance ternary mixture composed of portland cement with 6% silica fume and 20% slag. All of the decks had a nominal thickness of 6 in.
Route 397 over the Bozenkill (Constructed 2002)
This was a two-lane deck, about 50 ft long. The bridge deck was constructed using a staged pour, and then a center pour was made to tie the two halves together (see Figure 29). The tines were milled into the surface of the deck (transverse to the traffic flow), and some distress appeared to be related to this construction operation.
Slight scaling was observed, but it was difficult to distinguish it from the tire erosion noted in the wheel paths (see Figure 30, noted on both sides of deck). Very little evidence of scaling was observed in the south gutter region of the deck. Since drainage was primarily to the south, this seemed to indicate that scaling was very slight but that tire erosion was prevalent. Random cracking, possibly shrinkage, was noted on the surface of the deck. The south side fascia of the deck was showing good evidence of freeze-thaw deterioration (see Figure 31).
25
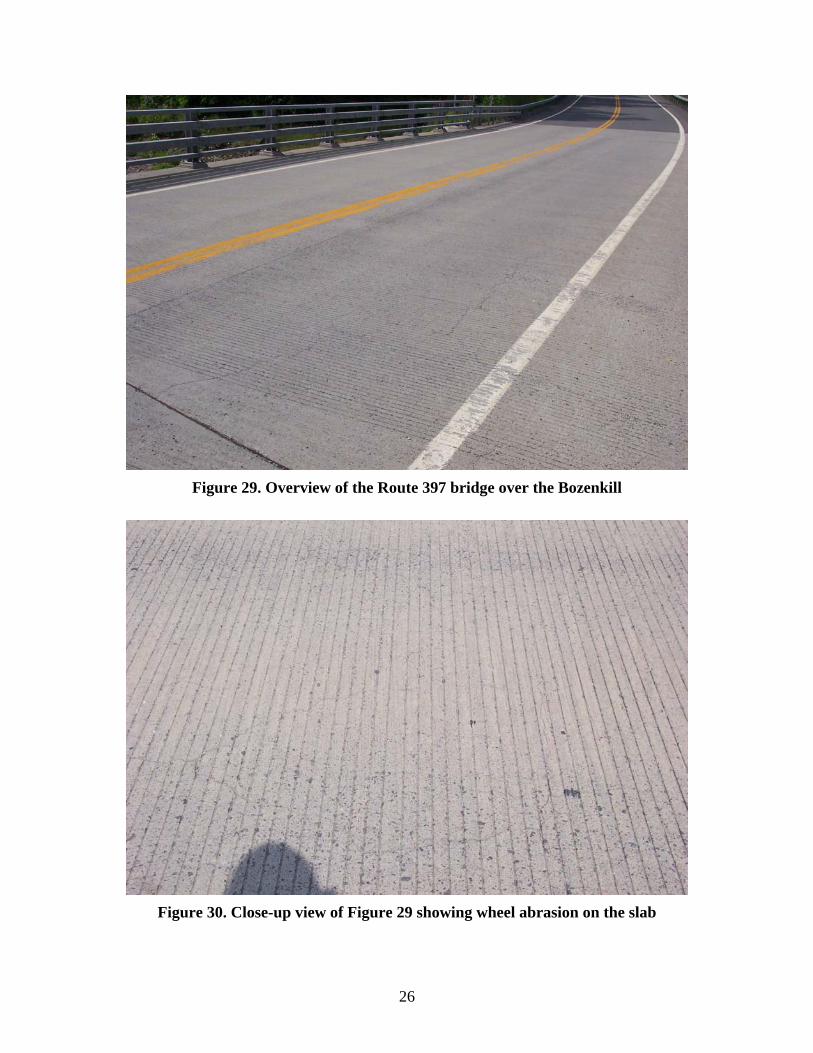
Figure 29. Overview of the Route 397 bridge over the Bozenkill
Figure 30. Close-up view of Figure 29 showing wheel abrasion on the slab
26
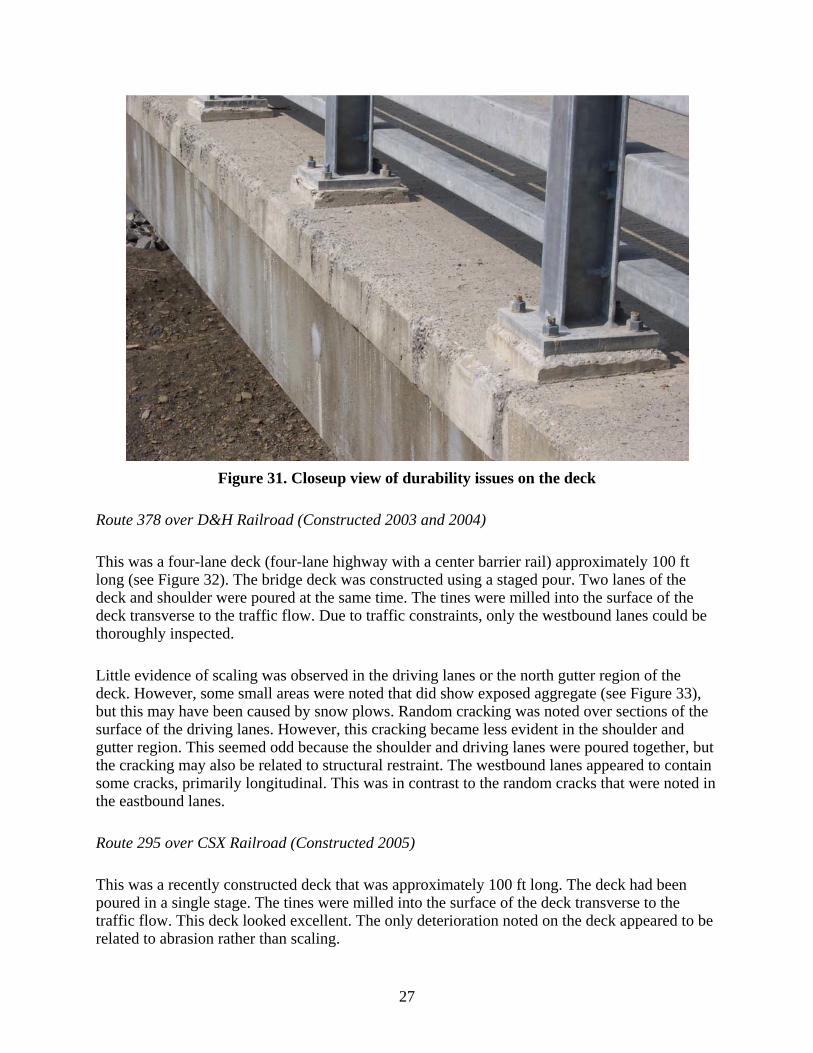
Figure 31. Closeup view of durability issues on the deck
Route 378 over D&H Railroad (Constructed 2003 and 2004)
This was a four-lane deck (four-lane highway with a center barrier rail) approximately 100 ft long (see Figure 32). The bridge deck was constructed using a staged pour. Two lanes of the deck and shoulder were poured at the same time. The tines were milled into the surface of the deck transverse to the traffic flow. Due to traffic constraints, only the westbound lanes could be thoroughly inspected.
Little evidence of scaling was observed in the driving lanes or the north gutter region of the deck. However, some small areas were noted that did show exposed aggregate (see Figure 33), but this may have been caused by snow plows. Random cracking was noted over sections of the surface of the driving lanes. However, this cracking became less evident in the shoulder and gutter region. This seemed odd because the shoulder and driving lanes were poured together, but the cracking may also be related to structural restraint. The westbound lanes appeared to contain some cracks, primarily longitudinal. This was in contrast to the random cracks that were noted in the eastbound lanes.
Route 295 over CSX Railroad (Constructed 2005)
This was a recently constructed deck that was approximately 100 ft long. The deck had been poured in a single stage. The tines were milled into the surface of the deck transverse to the traffic flow. This deck looked excellent. The only deterioration noted on the deck appeared to be related to abrasion rather than scaling.
27
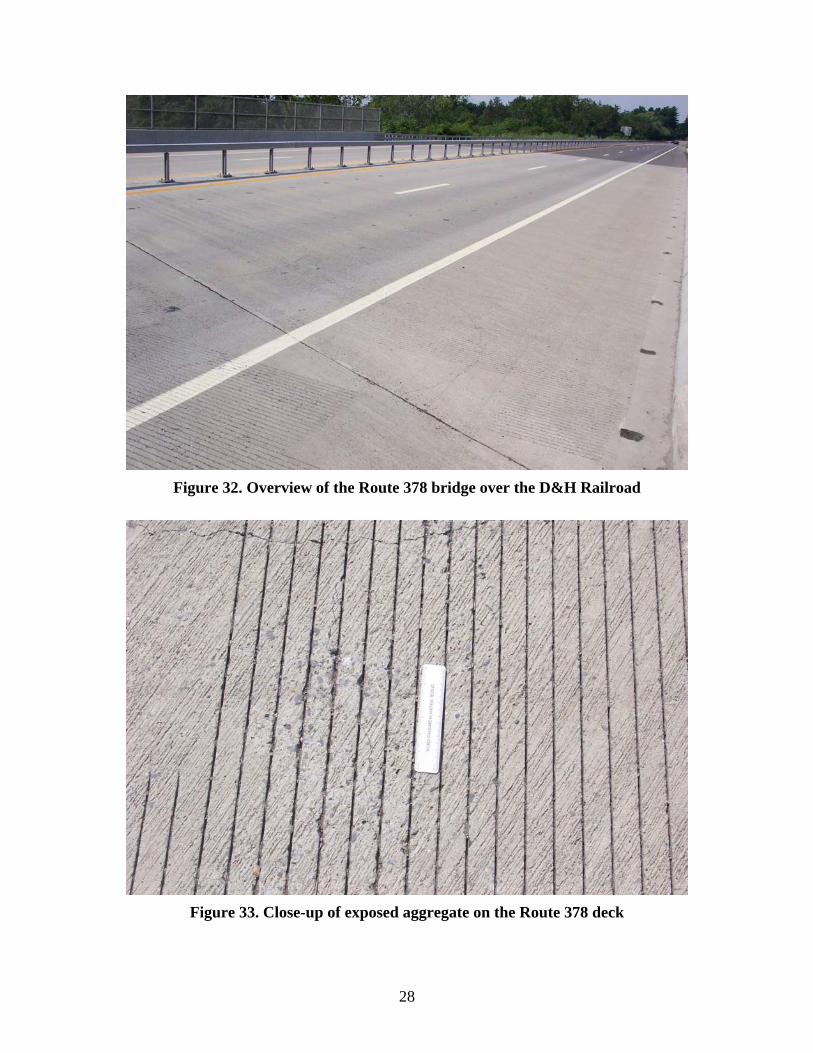
Figure 32. Overview of the Route 378 bridge over the D&H Railroad
Figure 33. Close-up of exposed aggregate on the Route 378 deck
28
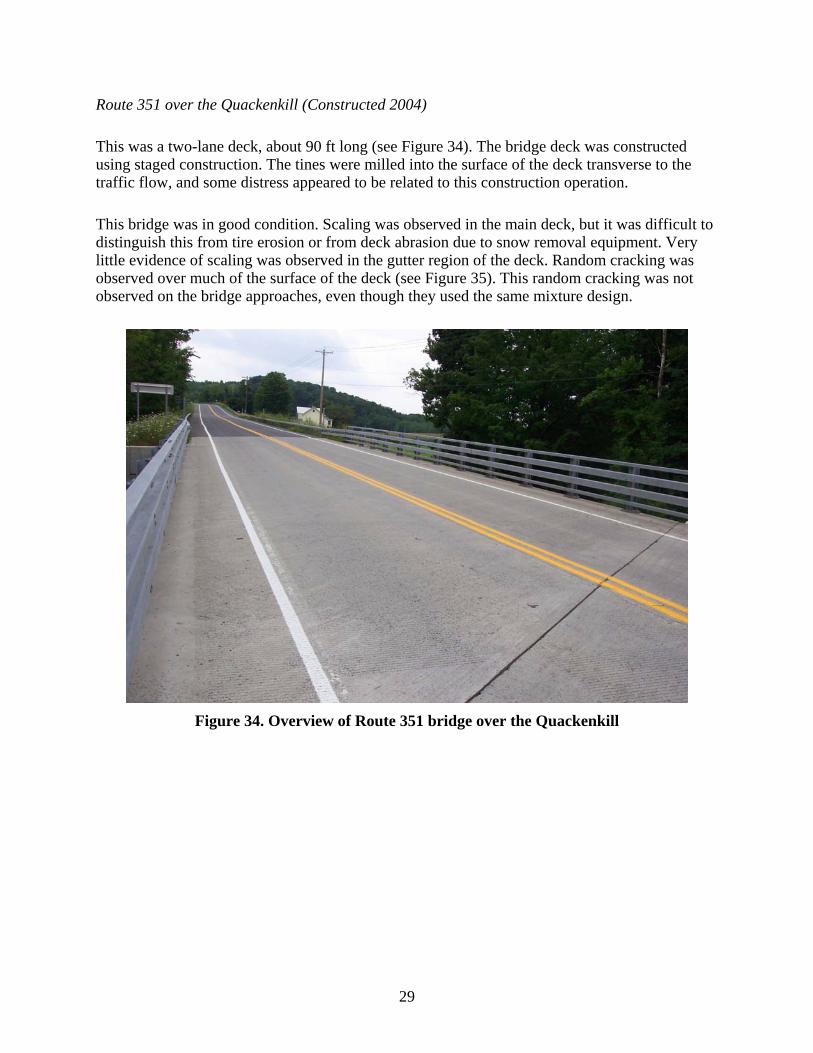
Route 351 over the Quackenkill (Constructed 2004)
This was a two-lane deck, about 90 ft long (see Figure 34). The bridge deck was constructed using staged construction. The tines were milled into the surface of the deck transverse to the traffic flow, and some distress appeared to be related to this construction operation.
This bridge was in good condition. Scaling was observed in the main deck, but it was difficult to distinguish this from tire erosion or from deck abrasion due to snow removal equipment. Very little evidence of scaling was observed in the gutter region of the deck. Random cracking was observed over much of the surface of the deck (see Figure 35). This random cracking was not observed on the bridge approaches, even though they used the same mixture design.
Figure 34. Overview of Route 351 bridge over the Quackenkill
29
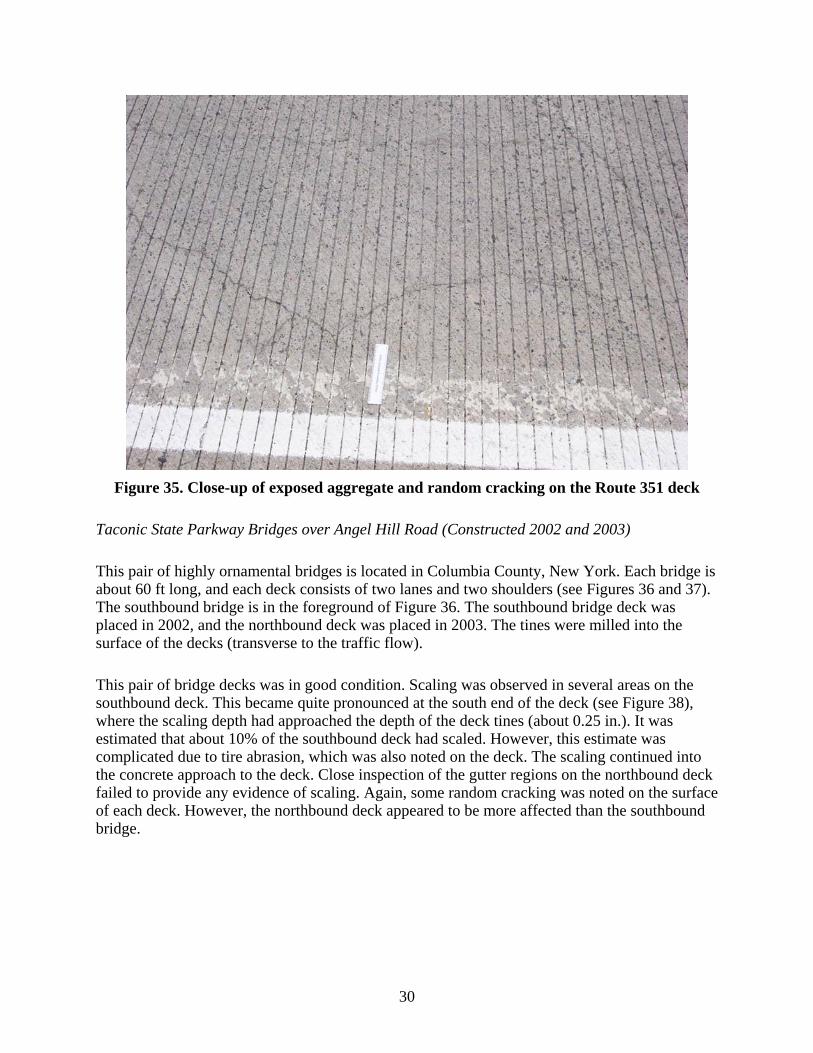
Figure 35. Close-up of exposed aggregate and random cracking on the Route 351 deck
Taconic State Parkway Bridges over Angel Hill Road (Constructed 2002 and 2003)
This pair of highly ornamental bridges is located in Columbia County, New York. Each bridge is about 60 ft long, and each deck consists of two lanes and two shoulders (see Figures 36 and 37). The southbound bridge is in the foreground of Figure 36. The southbound bridge deck was placed in 2002, and the northbound deck was placed in 2003. The tines were milled into the surface of the decks (transverse to the traffic flow).
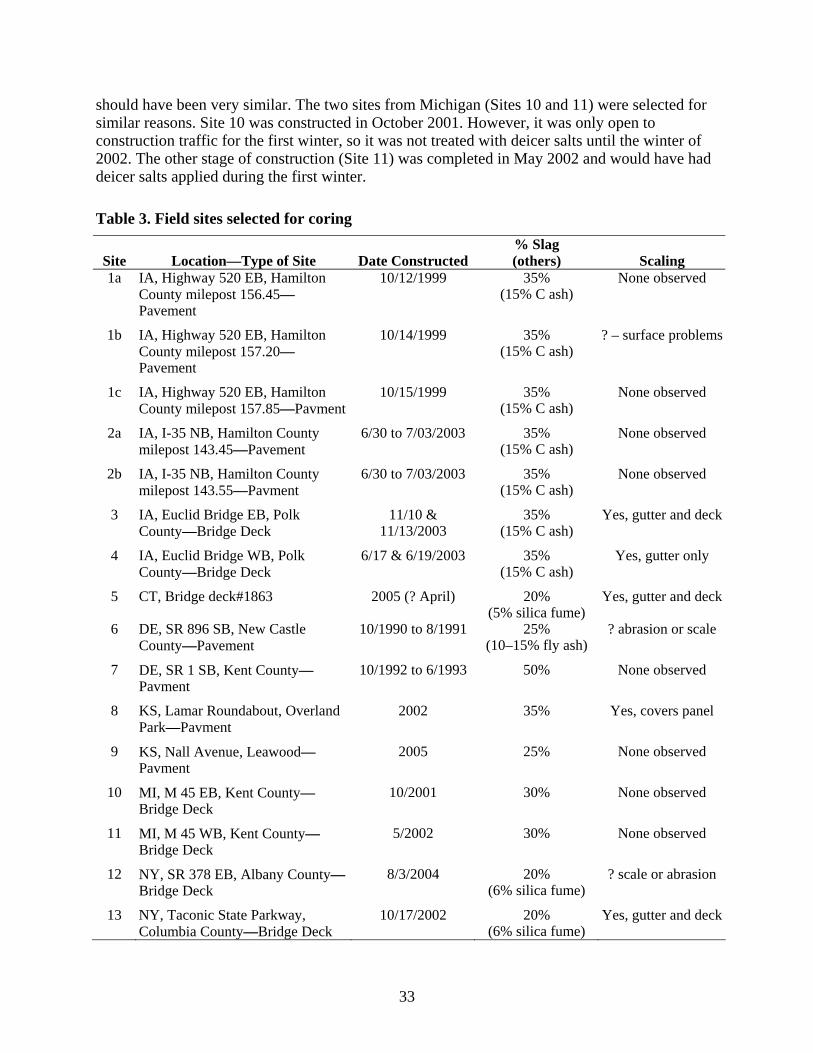
This pair of bridge decks was in good condition. Scaling was observed in several areas on the southbound deck. This became quite pronounced at the south end of the deck (see Figure 38), where the scaling depth had approached the depth of the deck tines (about 0.25 in.). It was estimated that about 10% of the southbound deck had scaled. However, this estimate was complicated due to tire abrasion, which was also noted on the deck. The scaling continued into the concrete approach to the deck. Close inspection of the gutter regions on the northbound deck failed to provide any evidence of scaling. Again, some random cracking was noted on the surface of each deck. However, the northbound deck appeared to be more affected than the southbound bridge.
30
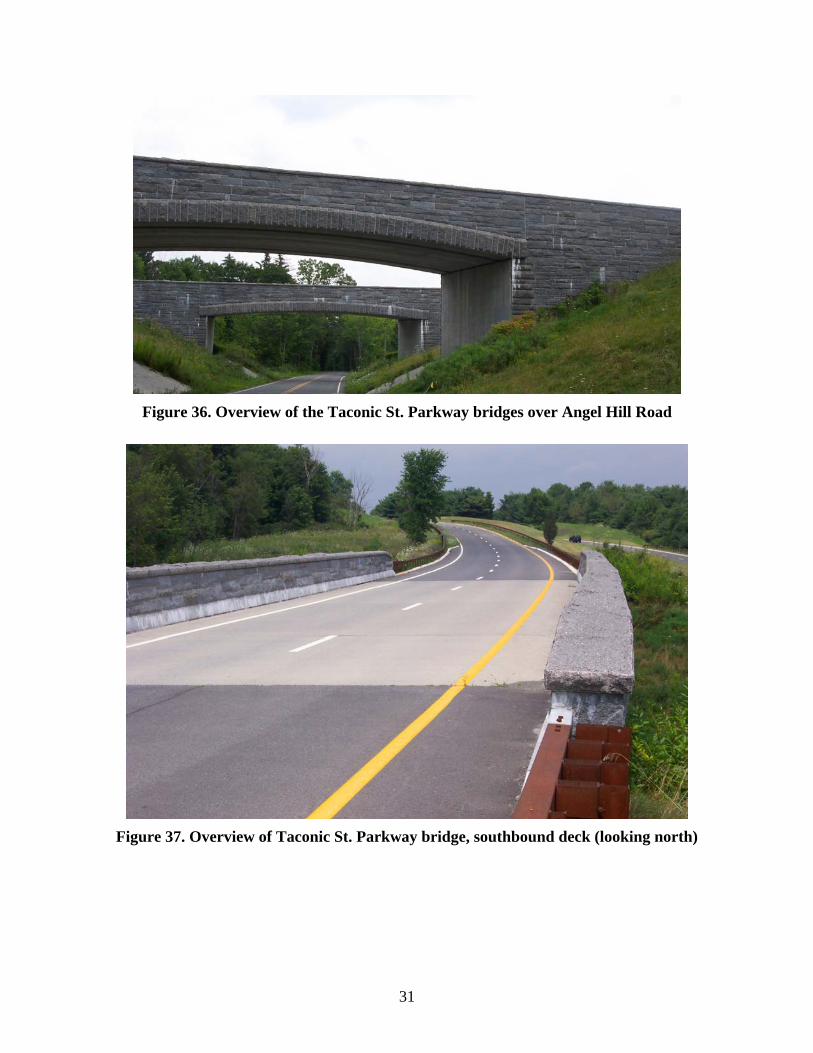
Figure 36. Overview of the Taconic St. Parkway bridges over Angel Hill Road
Figure 37. Overview of Taconic St. Parkway bridge, southbound deck (looking north)
31
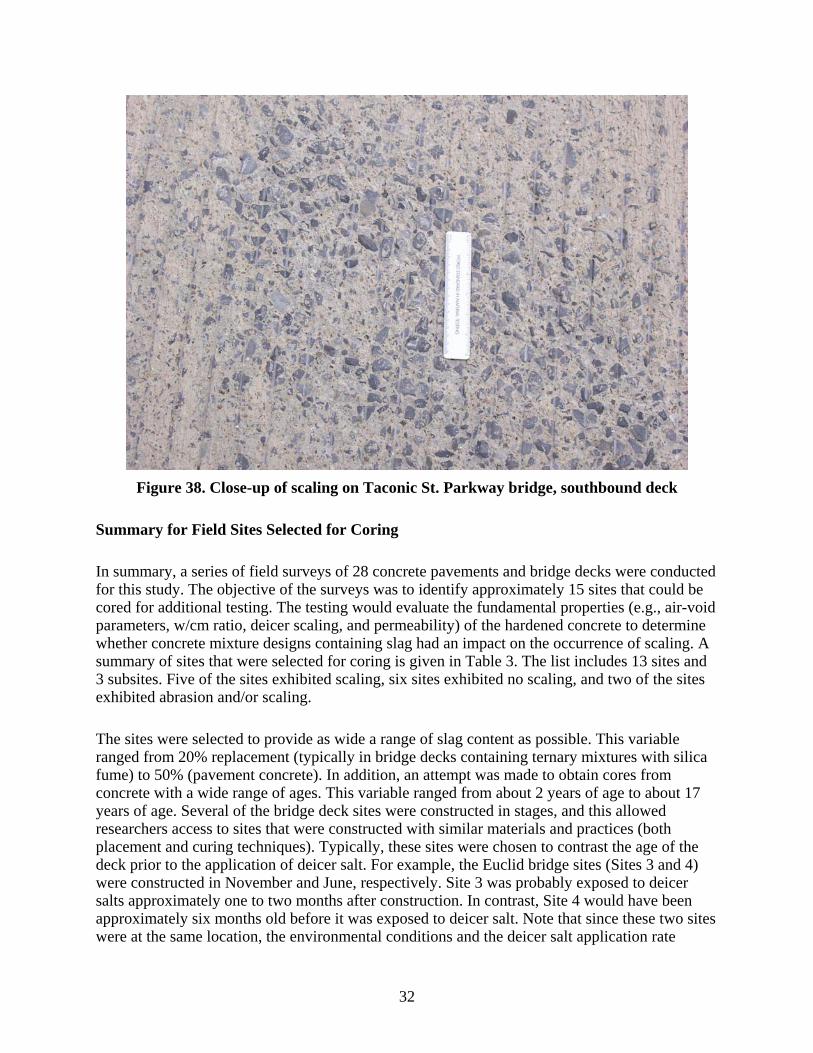
Figure 38. Close-up of scaling on Taconic St. Parkway bridge, southbound deck
Summary for Field Sites Selected for Coring
In summary, a series of field surveys of 28 concrete pavements and bridge decks were conducted for this study. The objective of the surveys was to identify approximately 15 sites that could be cored for additional testing. The testing would evaluate the fundamental properties (e.g., air-void parameters, w/cm ratio, deicer scaling, and permeability) of the hardened concrete to determine whether concrete mixture designs containing slag had an impact on the occurrence of scaling. A summary of sites that were selected for coring is given in Table 3. The list includes 13 sites and 3 subsites. Five of the sites exhibited scaling, six sites exhibited no scaling, and two of the sites exhibited abrasion and/or scaling.
The sites were selected to provide as wide a range of slag content as possible. This variable ranged from 20% replacement (typically in bridge decks containing ternary mixtures with silica fume) to 50% (pavement concrete). In addition, an attempt was made to obtain cores from concrete with a wide range of ages. This variable ranged from about 2 years of age to about 17 years of age. Several of the bridge deck sites were constructed in stages, and this allowed researchers access to sites that were constructed with similar materials and practices (both placement and curing techniques). Typically, these sites were chosen to contrast the age of the deck prior to the application of deicer salt. For example, the Euclid bridge sites (Sites 3 and 4) were constructed in November and June, respectively. Site 3 was probably exposed to deicer salts approximately one to two months after construction. In contrast, Site 4 would have been approximately six months old before it was exposed to deicer salt. Note that since these two sites were at the same location, the environmental conditions and the deicer salt application rate
32
should have been very similar. The two sites from Michigan (Sites 10 and 11) were selected for similar reasons. Site 10 was constructed in October 2001. However, it was only open to construction traffic for the first winter, so it was not treated with deicer salts until the winter of 2002. The other stage of construction (Site 11) was completed in May 2002 and would have had deicer salts applied during the first winter.
Table 3. Field sites selected for coring
Site Location—Type of Site Date Constructed% Slag (others) Scaling
1a IA, Highway 520 EB, Hamilton County milepost 156.45—Pavement
10/12/1999 35% (15% C ash)
None observed
1b IA, Highway 520 EB, Hamilton County milepost 157.20—Pavement
10/14/1999 35% (15% C ash)
? – surface problems
1c IA, Highway 520 EB, Hamilton County milepost 157.85—Pavment
10/15/1999 35% (15% C ash)
None observed
2a IA, I-35 NB, Hamilton County milepost 143.45—Pavement
6/30 to 7/03/2003 35% (15% C ash)
None observed
2b IA, I-35 NB, Hamilton County milepost 143.55—Pavment
6/30 to 7/03/2003 35% (15% C ash)
None observed
3 IA, Euclid Bridge EB, Polk County—Bridge Deck
11/10 & 11/13/2003
35% (15% C ash)
Yes, gutter and deck
4 IA, Euclid Bridge WB, Polk County—Bridge Deck
6/17 & 6/19/2003 35% (15% C ash)
Yes, gutter only
5 CT, Bridge deck#1863 2005 (? April) 20% (5% silica fume)
Yes, gutter and deck
6 DE, SR 896 SB, New Castle County—Pavement
10/1990 to 8/1991 25% (10–15% fly ash)
? abrasion or scale
7 DE, SR 1 SB, Kent County—Pavment
10/1992 to 6/1993 50% None observed
8 KS, Lamar Roundabout, Overland Park—Pavment
2002 35% Yes, covers panel
9 KS, Nall Avenue, Leawood—Pavment
2005 25% None observed
10 MI, M 45 EB, Kent County—Bridge Deck
10/2001 30% None observed
11 MI, M 45 WB, Kent County—Bridge Deck
5/2002 30% None observed
12 NY, SR 378 EB, Albany County—Bridge Deck
8/3/2004 20% (6% silica fume)
? scale or abrasion
13 NY, Taconic State Parkway, Columbia County—Bridge Deck
10/17/2002 20% (6% silica fume)
Yes, gutter and deck
33
Since this was the investigators’ first attempt at conducting scaling tests on cores extracted from the field, some additional sites were selected to evaluate the repeatability of the tests. This is the reason that duplicate and triplicate samples were extracted from I-35 northbound (Iowa) and Iowa Highway 520, respectively. Note that these sites were not truly identical because they had been paved on different days. Hence, that is why they are given 1a, 1b, etc. designations in the table. However, these additional test specimens also give an idea of how scaling properties change over the duration of a given project.
Initially, it was desired to obtain a statistically representative set of sites. However, this was not achieved due to the very limited pool of states that were able to participate in this project. Also, since the available sites only consisted of pavements and bridge decks, the concrete mixture proportions tended to be constrained to two different formulations: relatively rich concrete mixtures for bridge decks (roughly seven-sack mixes) and slightly less rich concrete mixtures for pavement concrete (roughly six-sack mixes).
The technical contacts from each state or agency were sent a letter or an email requesting cores. Typically, specific pictures were included with the request that illustrated the regions of the slab from which the cores should be extracted. The letter also suggested that three to five cores should be extracted from each site. However, each agency was allowed to provide as many or as few cores as they deemed necessary. Cores were received from all sites except for Site 5. Project information forms were also circulated to the various agencies. These forms were used to obtain site details, project design details, concrete mixture details, construction details, and deicer application rate. The completed forms are summarized in Appendix B.
34
EQUIPMENT AND PROCEDURES
Iowa State University
Personnel at Iowa State University (ISU) were responsible for logging the cores that had been extracted from the various sites. They were also responsible for sectioning and distributing subsamples to the other participants of the project. In addition, they prepared the core sections for petrographic analysis. The purpose of this section is to summarize the general methods and the equipment that were used to perform these tasks.
The basic core logging, sectioning, and specimen preparation procedure used in this study was nearly identical to that used in prior research projects (Schlorholtz 1996; Schlorholtz 2000). Cores were logged by measuring their mass, measuring their diameter and length, and then noting any additional details via a quick visual inspection (e.g., location of steel, cracks, etc.). Each series of cores was then photographed. All cores were sectioned using a Buehler LAPRO slab saw. The saw was equipped with an 18 in. notched-rim diamond blade, and reagent-grade propylene glycol was used as a cutting lubricant. Scaling specimens were prepared by cutting transversely through the core (3 in. nominal thickness). Sections for petrographic examination were produced by cutting longitudinally through the core specimen and then trimming the sections to 3 in. depths. This produced a specimen with nominal dimensions of 4 in. by 3 in. (4 in. diameter core, effective area = 12 in.2) or of 6 in. by 3 in. (6 in. diameter core, effective area = 18 in.2). The sections for petrographic examination were then prepared by using an Allied High Tech Products, Inc. variable speed grinder/polisher equipped with a 12 in. diameter wheel. Fixed grit diamond grinding disks (Diagrid, nominal grit sizes of 260, 70, 15, and 6 microns) were used throughout this study to produce highly polished test specimens.
Peterographic examinations were performed using both light microscopy and scanning electron microscopy (SEM). An Olympus SZH stereo microscope was used for evaluations conducted at low magnification (7x to 60x). For example, the SZH microscope was used to measure the depth of carbonation in the various samples after they had been stained with phenolphthalein. An Olympus BH stereo microscope was used for evaluations conducted at moderate magnification (50x to 400x). This microscope was commonly used to check the samples for the presence of fly ash. Image analysis was used to measure the volume of air voids present in the test specimens. It was also used to estimate the air-void parameters of the concrete. (The apparent specific surface and the apparent spacing factor has been described in earlier reports [Schlorholtz 1996; Schlorholtz 2000].) A Hitachi S-2400N low-vacuum SEM was used to generate the digital images that were used for image analysis or general investigations. This SEM was equipped with an Oxford Instruments LINK TETRA backscattered-electron detector for imaging and a LINK ISIS X-ray system (with a light-element detector) for elemental measurements or X-ray mapping.
University of Toronto
Personnel at the University of Toronto were responsible for performing the scaling tests, the rapid chloride permeability tests, and the surface chloride profiling tests. They were also
35
responsible for sectioning the test specimens that had been subjected to the scaling tests for return to ISU for subsequent petrographic examination.
Scaling tests were conducted in general accordance with ASTM C 672/C 672M-03 (ASTM 2006). Test specimens used for the scaling tests consisted of the top sections of concrete cores that been extracted from various sites. The specimens had nominal dimensions of 6 in. in diameter by 3 in. thick. All core samples subjected to scaling tests had grooved (tined) surfaces. In order to pond the deicer on the top surface of the cores, it was necessary to seal the sides of the cores with a bituminous membrane. Then, a 3.3 in. section cut from a 6 in. diameter plastic cylinder mold was slipped on to create a berm about 1.8 in. above the exposed concrete surface. Finally, silicone sealant was applied around the edges at the top (between the plastic surface and the concrete) and at the bottom (between the membrane and the plastic mold). As per ASTM C 672/C 672M-03, the surface of each specimen was covered with approximately 0.25 in. of a solution containing 4% calcium chloride. The specimens were exposed to this solution under a single cycle of freezing (for approximately 16 hours) and thawing (approximately 8 hours) per day. Every five cycles the solution was changed, the surface of each test specimen was visually evaluated, and the surface mass loss was measured. This process was continued for 50 freeze-thaw cycles. Two or three test specimens from each site were subjected to the scaling tests in an effort to estimate the repeatability that could be expected from this nonstandard testing. After the testing had been completed, a section of the test specimen (or the entire test specimen) from a site was returned to ISU for petrographic examination.
RCP tests were conducted in accordance with ASTM C 1202-05 (ASTM 2006). Nominal 4 in. diameter cores were sectioned to 2 in. thick (nominal) and then placed in the permeability cells (Germann Instruments PROOVE’it system). All tests were run for 6 hours. Test results were corrected for specimen diameter and thickness.
Surface chloride profiles were determined to estimate the apparent chloride diffusion rate through the cores. The tests were conducted on untreated pavement cores and on specific samples after the completion of the scaling tests. Briefly, the procedure uses a Van Norman milling machine to grind off layers of concrete at specific depths below the top of the core. The concrete powder obtained from each depth was carefully collected and then dried in an oven (110°C for 24 hours). The dry samples were then digested with a solution containing nitric acid and hydrogen peroxide. After filtering, the chloride concentration per layer was obtained by potentiometric titration using 0.01 mole/liter silver nitrate and a silver-silver electrode. After titration, different parameters were calculated based on the best fit of the experimental data to Fick’s second law (as per ASTM C 1556-04 [ASTM 2006]) using an exposure time estimated for each field site. Days of exposure were calculated based on the age of each concrete and the number of winter days on which deicers would have been applied to the concrete.
American Petrographic Services
Personnel at American Petrographic Services (APS) performed the w/cm ratio determinations that were conducted for this project. They also performed general petrographic examinations on all of the concrete specimens. Basically, they provided a second opinion on all of the different concrete specimens that were evaluated during this study.
36
Petrographic analysis was performed in accordance with APS Standard Operating Procedure 00 LAB 001. This standard operating procedure is based on the most recent version of ASTM C 856, “Petrographic Examination of Hardened Concrete.” Thin section analysis was performed in accordance with APS Standard Operating Procedure 00 LAB 013, “Determining the Water/Cement of Portland Cement Concete, APS Method.” Air content testing was performed in accordance with APS Standard Operating Procedure 00 LAB 003. This standard operating procedure is based on the most recent version of ASTM C 457, “Microscopical Determination of Air Void Content and Parameters of the Air Void System in Hardened Concrete.” The linear traverse method was used for all air-void parameter determinations. The concrete cores were sectioned perpendicular to the horizontal plane of the concrete as placed and then polished prior to testing.
37
RESULTS AND DISCUSSION
Scaling Tests
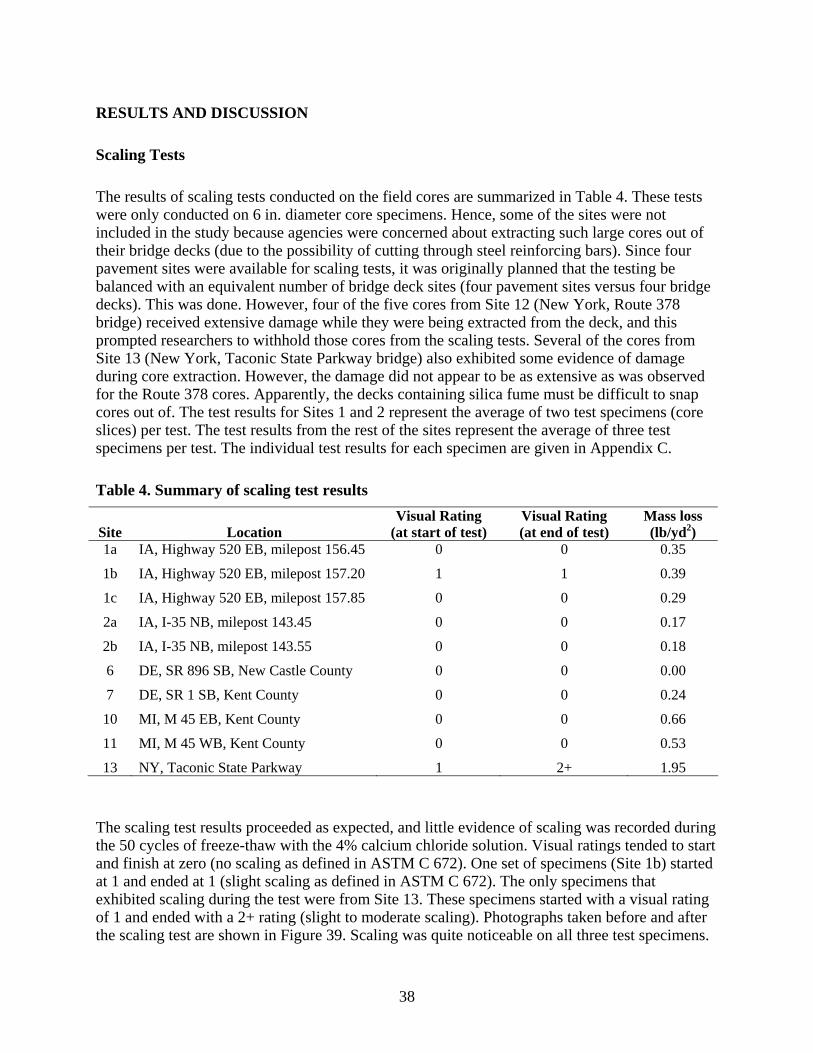
The results of scaling tests conducted on the field cores are summarized in Table 4. These tests were only conducted on 6 in. diameter core specimens. Hence, some of the sites were not included in the study because agencies were concerned about extracting such large cores out of their bridge decks (due to the possibility of cutting through steel reinforcing bars). Since four pavement sites were available for scaling tests, it was originally planned that the testing be balanced with an equivalent number of bridge deck sites (four pavement sites versus four bridge decks). This was done. However, four of the five cores from Site 12 (New York, Route 378 bridge) received extensive damage while they were being extracted from the deck, and this prompted researchers to withhold those cores from the scaling tests. Several of the cores from Site 13 (New York, Taconic State Parkway bridge) also exhibited some evidence of damage during core extraction. However, the damage did not appear to be as extensive as was observed for the Route 378 cores. Apparently, the decks containing silica fume must be difficult to snap cores out of. The test results for Sites 1 and 2 represent the average of two test specimens (core slices) per test. The test results from the rest of the sites represent the average of three test specimens per test. The individual test results for each specimen are given in Appendix C.
Table 4. Summary of scaling test results
Site Location Visual Rating
(at start of test) Visual Rating (at end of test)
Mass loss (lb/yd2)
1a IA, Highway 520 EB, milepost 156.45 0 0 0.35
1b IA, Highway 520 EB, milepost 157.20 1 1 0.39
1c IA, Highway 520 EB, milepost 157.85 0 0 0.29
2a IA, I-35 NB, milepost 143.45 0 0 0.17
2b IA, I-35 NB, milepost 143.55 0 0 0.18
6 DE, SR 896 SB, New Castle County 0 0 0.00
7 DE, SR 1 SB, Kent County 0 0 0.24
10 MI, M 45 EB, Kent County 0 0 0.66
11 MI, M 45 WB, Kent County 0 0 0.53
13 NY, Taconic State Parkway 1 2+ 1.95
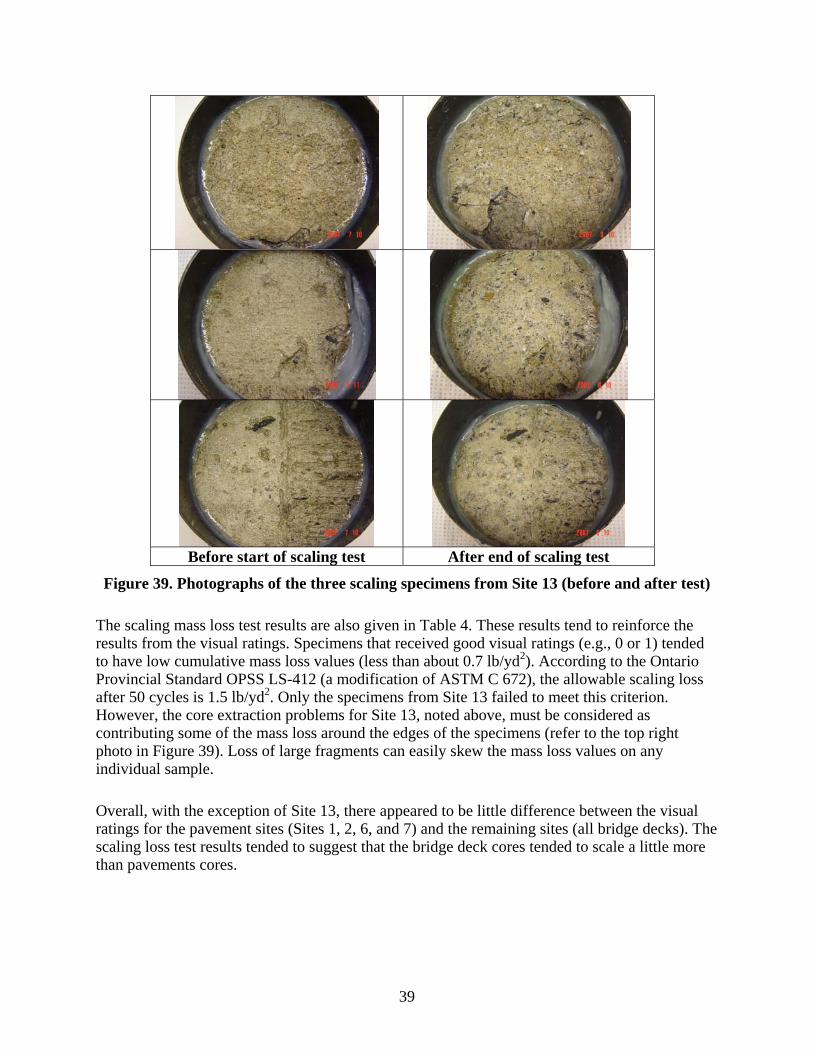
The scaling test results proceeded as expected, and little evidence of scaling was recorded during the 50 cycles of freeze-thaw with the 4% calcium chloride solution. Visual ratings tended to start and finish at zero (no scaling as defined in ASTM C 672). One set of specimens (Site 1b) started at 1 and ended at 1 (slight scaling as defined in ASTM C 672). The only specimens that exhibited scaling during the test were from Site 13. These specimens started with a visual rating of 1 and ended with a 2+ rating (slight to moderate scaling). Photographs taken before and after the scaling test are shown in Figure 39. Scaling was quite noticeable on all three test specimens.
38
Before start of scaling test After end of scaling test
Figure 39. Photographs of the three scaling specimens from Site 13 (before and after test)
The scaling mass loss test results are also given in Table 4. These results tend to reinforce the results from the visual ratings. Specimens that received good visual ratings (e.g., 0 or 1) tended to have low cumulative mass loss values (less than about 0.7 lb/yd2). According to the Ontario Provincial Standard OPSS LS-412 (a modification of ASTM C 672), the allowable scaling loss after 50 cycles is 1.5 lb/yd2. Only the specimens from Site 13 failed to meet this criterion. However, the core extraction problems for Site 13, noted above, must be considered as contributing some of the mass loss around the edges of the specimens (refer to the top right photo in Figure 39). Loss of large fragments can easily skew the mass loss values on any individual sample.
Overall, with the exception of Site 13, there appeared to be little difference between the visual ratings for the pavement sites (Sites 1, 2, 6, and 7) and the remaining sites (all bridge decks). The scaling loss test results tended to suggest that the bridge deck cores tended to scale a little more than pavements cores.
39
Rapid Chloride Permeability and Surface Chloride Profiles
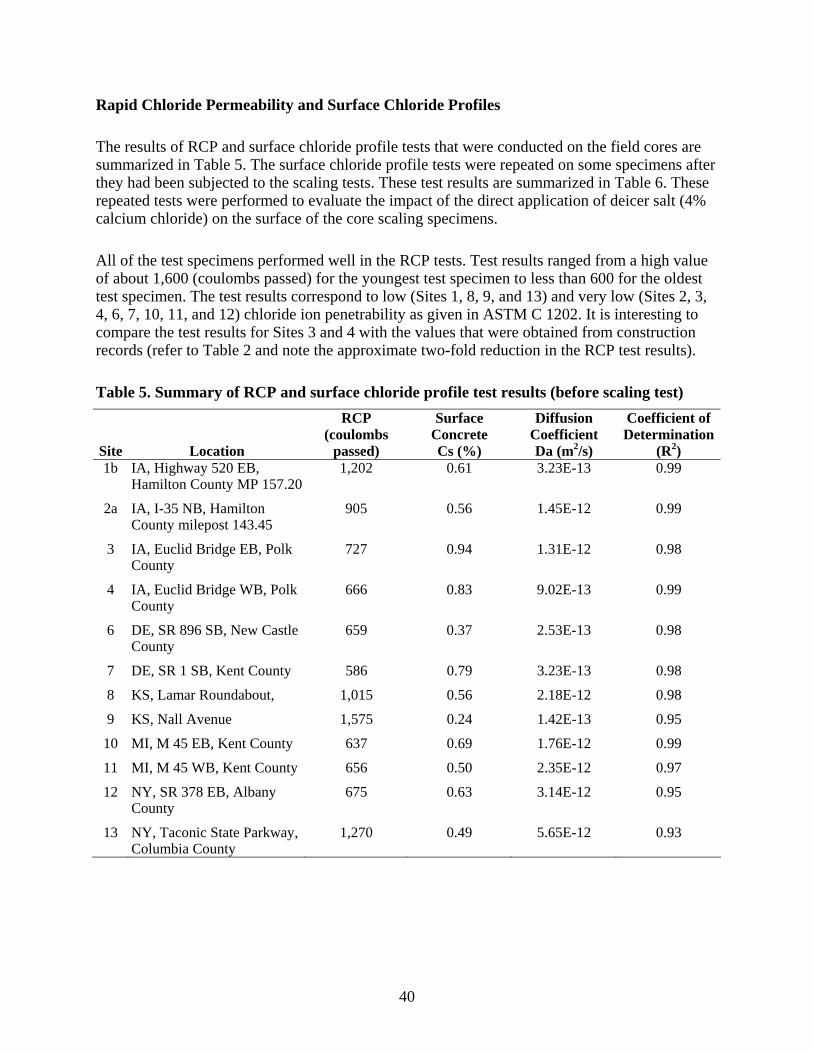
The results of RCP and surface chloride profile tests that were conducted on the field cores are summarized in Table 5. The surface chloride profile tests were repeated on some specimens after they had been subjected to the scaling tests. These test results are summarized in Table 6. These repeated tests were performed to evaluate the impact of the direct application of deicer salt (4% calcium chloride) on the surface of the core scaling specimens.
All of the test specimens performed well in the RCP tests. Test results ranged from a high value of about 1,600 (coulombs passed) for the youngest test specimen to less than 600 for the oldest test specimen. The test results correspond to low (Sites 1, 8, 9, and 13) and very low (Sites 2, 3, 4, 6, 7, 10, 11, and 12) chloride ion penetrability as given in ASTM C 1202. It is interesting to compare the test results for Sites 3 and 4 with the values that were obtained from construction records (refer to Table 2 and note the approximate two-fold reduction in the RCP test results).
Table 5. Summary of RCP and surface chloride profile test results (before scaling test)
Site Location
RCP (coulombs
passed)
Surface Concrete Cs (%)
Diffusion Coefficient Da (m2/s)
Coefficient of Determination
(R2) 1b IA, Highway 520 EB,
Hamilton County MP 157.20 1,202 0.61 3.23E-13 0.99
2a IA, I-35 NB, Hamilton County milepost 143.45
905 0.56 1.45E-12 0.99
3 IA, Euclid Bridge EB, Polk County
727 0.94 1.31E-12 0.98
4 IA, Euclid Bridge WB, Polk County
666 0.83 9.02E-13 0.99
6 DE, SR 896 SB, New Castle County
659 0.37 2.53E-13 0.98
7 DE, SR 1 SB, Kent County 586 0.79 3.23E-13 0.98
8 KS, Lamar Roundabout, 1,015 0.56 2.18E-12 0.98
9 KS, Nall Avenue 1,575 0.24 1.42E-13 0.95
10 MI, M 45 EB, Kent County 637 0.69 1.76E-12 0.99
11 MI, M 45 WB, Kent County 656 0.50 2.35E-12 0.97
12 NY, SR 378 EB, Albany County
675 0.63 3.14E-12 0.95
13 NY, Taconic State Parkway, Columbia County
1,270 0.49 5.65E-12 0.93
40
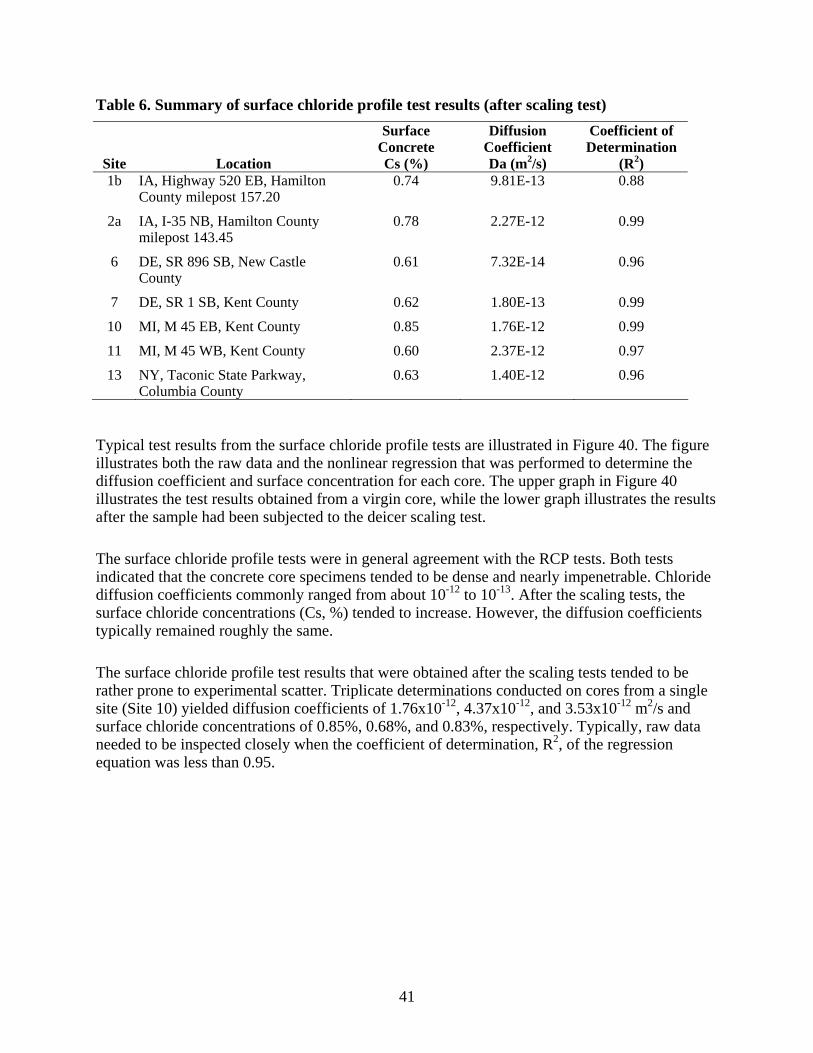
Table 6. Summary of surface chloride profile test results (after scaling test)
Site Location
Surface Concrete Cs (%)
Diffusion Coefficient Da (m2/s)
Coefficient of Determination
(R2) 1b IA, Highway 520 EB, Hamilton
County milepost 157.20 0.74 9.81E-13 0.88
2a IA, I-35 NB, Hamilton County milepost 143.45
0.78 2.27E-12 0.99
6 DE, SR 896 SB, New Castle County
0.61 7.32E-14 0.96
7 DE, SR 1 SB, Kent County 0.62 1.80E-13 0.99
10 MI, M 45 EB, Kent County 0.85 1.76E-12 0.99
11 MI, M 45 WB, Kent County 0.60 2.37E-12 0.97
13 NY, Taconic State Parkway, Columbia County
0.63 1.40E-12 0.96
Typical test results from the surface chloride profile tests are illustrated in Figure 40. The figure illustrates both the raw data and the nonlinear regression that was performed to determine the diffusion coefficient and surface concentration for each core. The upper graph in Figure 40 illustrates the test results obtained from a virgin core, while the lower graph illustrates the results after the sample had been subjected to the deicer scaling test.
The surface chloride profile tests were in general agreement with the RCP tests. Both tests indicated that the concrete core specimens tended to be dense and nearly impenetrable. Chloride diffusion coefficients commonly ranged from about 10-12 to 10-13. After the scaling tests, the surface chloride concentrations (Cs, %) tended to increase. However, the diffusion coefficients typically remained roughly the same.
The surface chloride profile test results that were obtained after the scaling tests tended to be rather prone to experimental scatter. Triplicate determinations conducted on cores from a single site (Site 10) yielded diffusion coefficients of 1.76x10⁻¹², 4.37x10⁻¹², and 3.53x10⁻¹² m2/s and surface chloride concentrations of 0.85%, 0.68%, and 0.83%, respectively. Typically, raw data needed to be inspected closely when the coefficient of determination, R2, of the regression equation was less than 0.95.
41
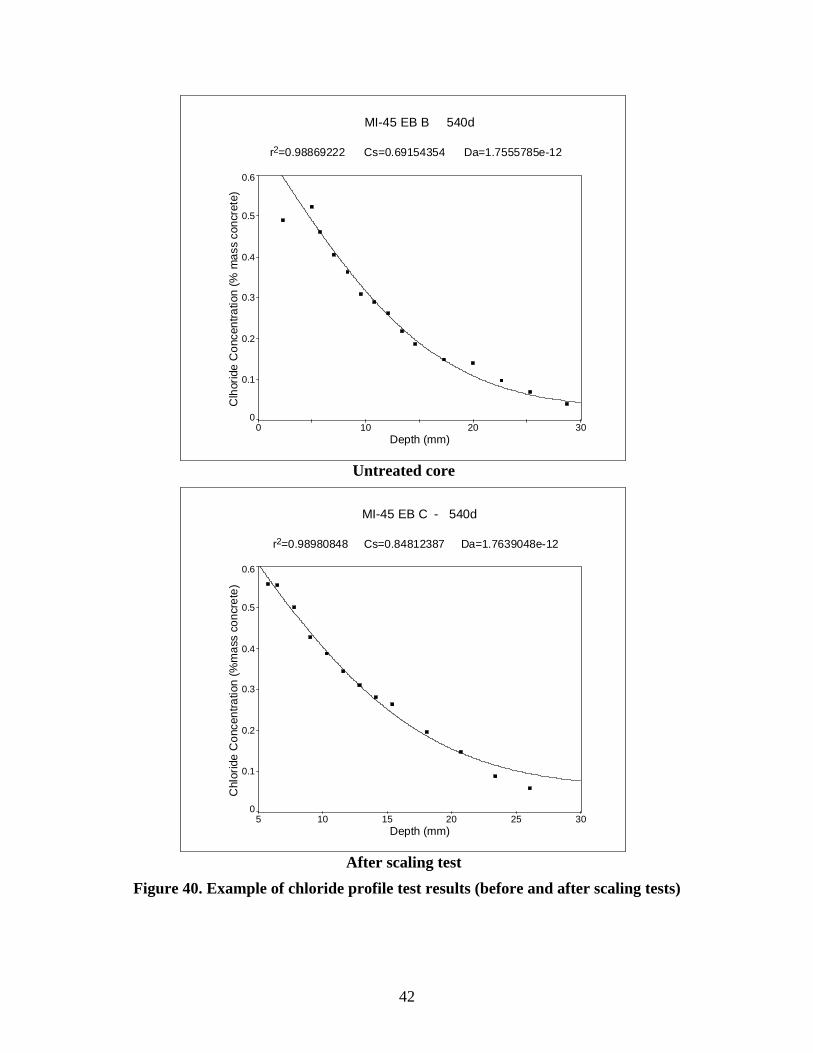
MI-45 EB B 540d
r2=0.98869222 Cs=0.69154354 Da=1.7555785e-12
0 10 20 30Depth (mm)
0
0.1
0.2
0.3
0.4
0.5
0.6
Clh
orid
e C
once
ntra
tion
(% m
ass
conc
rete
)
Untreated core
MI-45 EB C - 540d
r2=0.98980848 Cs=0.84812387 Da=1.7639048e-12
5 10 15 20 25 30Depth (mm)
0
0.1
0.2
0.3
0.4
0.5
0.6
Chl
orid
e C
once
ntra
tion
(%m
ass
conc
rete
)
After scaling test
Figure 40. Example of chloride profile test results (before and after scaling tests)
42
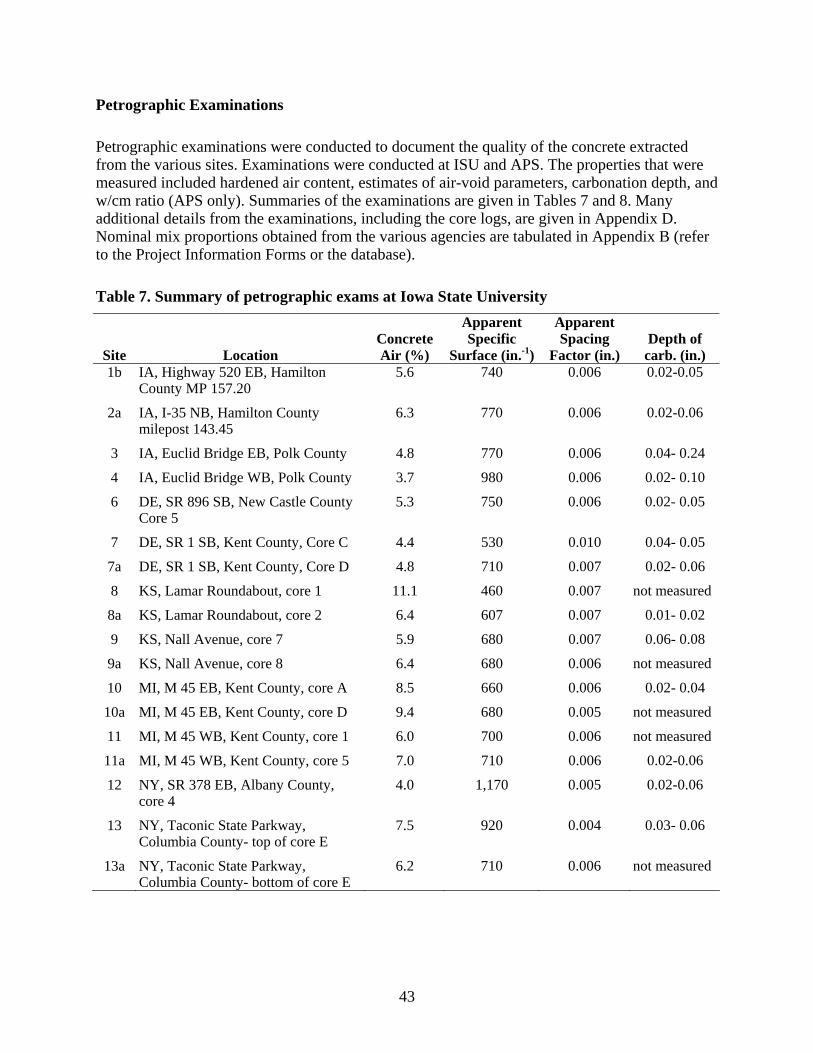
43
Petrographic Examinations
Petrographic examinations were conducted to document the quality of the concrete extracted from the various sites. Examinations were conducted at ISU and APS. The properties that were measured included hardened air content, estimates of air-void parameters, carbonation depth, and w/cm ratio (APS only). Summaries of the examinations are given in Tables 7 and 8. Many additional details from the examinations, including the core logs, are given in Appendix D. Nominal mix proportions obtained from the various agencies are tabulated in Appendix B (refer to the Project Information Forms or the database).
Table 7. Summary of petrographic exams at Iowa State University
Site Location Concrete Air (%)
Apparent Specific
Surface (in.-1)
Apparent Spacing
Factor (in.) Depth of
carb. (in.) 1b
2a
3
4
6
7
7a
8
8a
9
9a
10
10a
11
11a
12
13
13a
IA, Highway 520 EB, Hamilton County MP 157.20
IA, I-35 NB, Hamilton County milepost 143.45
IA, Euclid Bridge EB, Polk County
IA, Euclid Bridge WB, Polk County
DE, SR 896 SB, New Castle County Core 5
DE, SR 1 SB, Kent County, Core C
DE, SR 1 SB, Kent County, Core D
KS, Lamar Roundabout, core 1
KS, Lamar Roundabout, core 2
KS, Nall Avenue, core 7
KS, Nall Avenue, core 8
MI, M 45 EB, Kent County, core A
MI, M 45 EB, Kent County, core D
MI, M 45 WB, Kent County, core 1
MI, M 45 WB, Kent County, core 5
NY, SR 378 EB, Albany County, core 4
NY, Taconic State Parkway, Columbia County- top of core E
NY, Taconic State Parkway, Columbia County- bottom of core E
5.6
6.3
4.8
3.7
5.3
4.4
4.8
11.1
6.4
5.9
6.4
8.5
9.4
6.0
7.0
4.0
7.5
6.2
740
770
770
980
750
530
710
460
607
680
680
660
680
700
710
1,170
920
710
0.006
0.006
0.006
0.006
0.006
0.010
0.007
0.007
0.007
0.007
0.006
0.006
0.005
0.006
0.006
0.005
0.004
0.006
0.02-0.05
0.02-0.06
0.04- 0.24
0.02- 0.10
0.02- 0.05
0.04- 0.05
0.02- 0.06
not measured
0.01- 0.02
0.06- 0.08
not measured
0.02- 0.04
not measured
not measured
0.02-0.06
0.02-0.06
0.03- 0.06
not measured
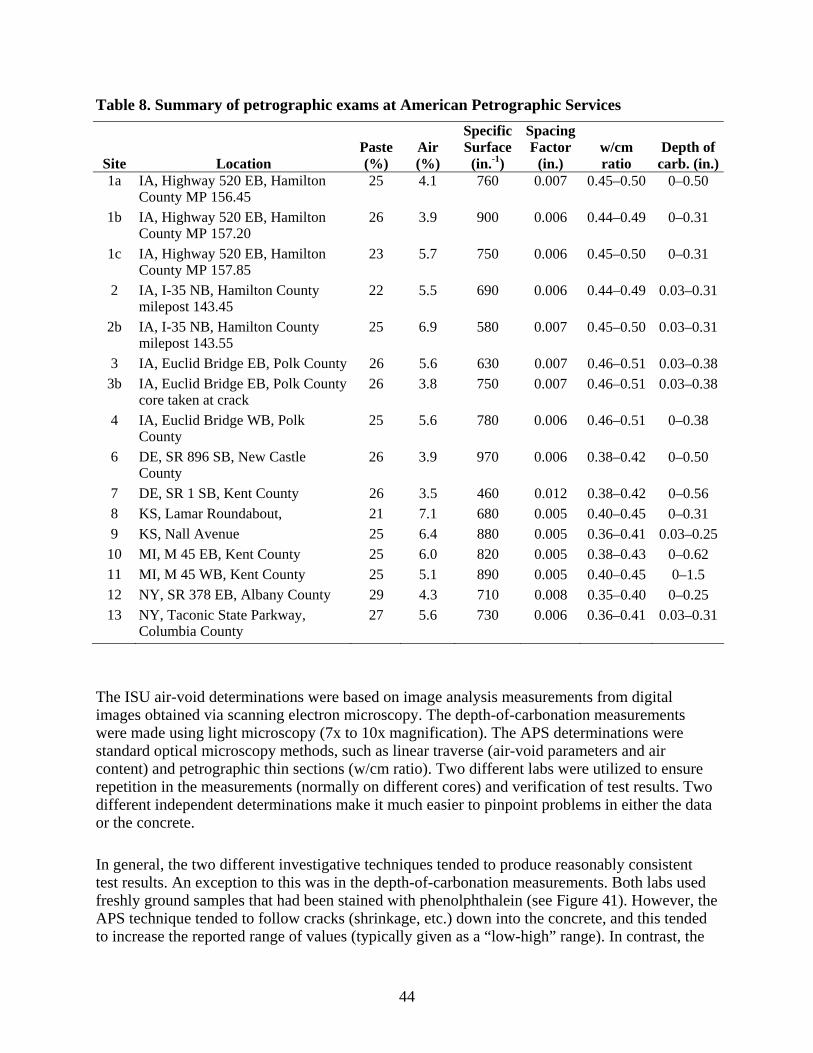
44
Table 8. Summary of petrographic exams at American Petrographic Services
Site Location Paste (%)
Air (%)
Specific Surface (in.-1)
Spacing Factor
(in.) w/cm ratio
Depth of carb. (in.)
1a
1b
1c
2
2b
3 3b
4
6
7 8 9
10 11 12 13
IA, Highway 520 EB, Hamilton County MP 156.45 IA, Highway 520 EB, Hamilton County MP 157.20 IA, Highway 520 EB, Hamilton County MP 157.85 IA, I-35 NB, Hamilton County milepost 143.45 IA, I-35 NB, Hamilton County milepost 143.55 IA, Euclid Bridge EB, Polk CountyIA, Euclid Bridge EB, Polk County core taken at crack IA, Euclid Bridge WB, Polk County DE, SR 896 SB, New Castle County DE, SR 1 SB, Kent County KS, Lamar Roundabout, KS, Nall Avenue MI, M 45 EB, Kent County MI, M 45 WB, Kent County NY, SR 378 EB, Albany County NY, Taconic State Parkway, Columbia County
25
26
23
22
25
26 26
25
26
26 21 25 25 25 29 27
4.1
3.9
5.7
5.5
6.9
5.6 3.8
5.6
3.9
3.5 7.1 6.4 6.0 5.1 4.3 5.6
760
900
750
690
580
630 750
780
970
460 680 880 820 890 710 730
0.007
0.006
0.006
0.006
0.007
0.007 0.007
0.006
0.006
0.012 0.005 0.005 0.005 0.005 0.008 0.006
0.45–0.50
0.44–0.49
0.45–0.50
0.44–0.49
0.45–0.50
0.46–0.51 0.46–0.51
0.46–0.51
0.38–0.42
0.38–0.42 0.40–0.45 0.36–0.41 0.38–0.43 0.40–0.45 0.35–0.40 0.36–0.41
0–0.50
0–0.31
0–0.31
0.03–0.31
0.03–0.31
0.03–0.380.03–0.38
0–0.38
0–0.50
0–0.56 0–0.31
0.03–0.250–0.62 0–1.5 0–0.25
0.03–0.31
The ISU air-void determinations were based on image analysis measurements from digital images obtained via scanning electron microscopy. The depth-of-carbonation measurements were made using light microscopy (7x to 10x magnification). The APS determinations were standard optical microscopy methods, such as linear traverse (air-void parameters and air content) and petrographic thin sections (w/cm ratio). Two different labs were utilized to ensure repetition in the measurements (normally on different cores) and verification of test results. Two different independent determinations make it much easier to pinpoint problems in either the data or the concrete.
In general, the two different investigative techniques tended to produce reasonably consistent test results. An exception to this was in the depth-of-carbonation measurements. Both labs used freshly ground samples that had been stained with phenolphthalein (see Figure 41). However, the APS technique tended to follow cracks (shrinkage, etc.) down into the concrete, and this tended to increase the reported range of values (typically given as a “low-high” range). In contrast, the
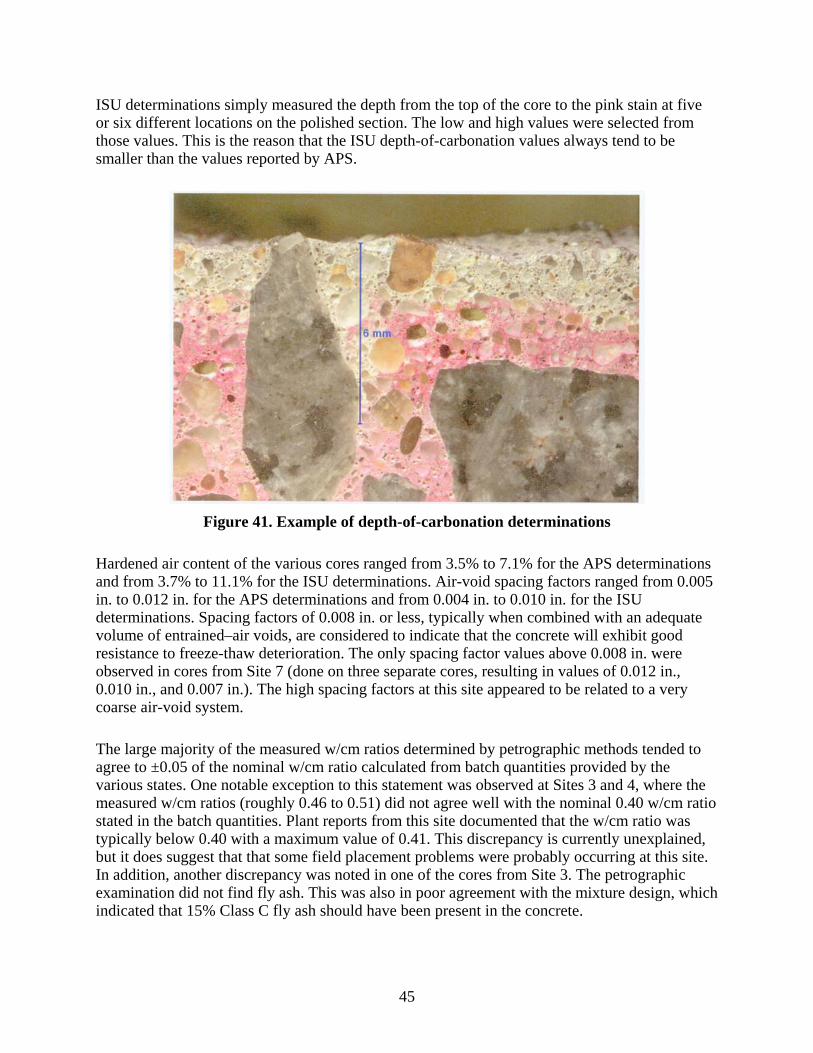
ISU determinations simply measured the depth from the top of the core to the pink stain at five or six different locations on the polished section. The low and high values were selected from those values. This is the reason that the ISU depth-of-carbonation values always tend to be smaller than the values reported by APS.
Figure 41. Example of depth-of-carbonation determinations
Hardened air content of the various cores ranged from 3.5% to 7.1% for the APS determinations and from 3.7% to 11.1% for the ISU determinations. Air-void spacing factors ranged from 0.005 in. to 0.012 in. for the APS determinations and from 0.004 in. to 0.010 in. for the ISU determinations. Spacing factors of 0.008 in. or less, typically when combined with an adequate volume of entrained–air voids, are considered to indicate that the concrete will exhibit good resistance to freeze-thaw deterioration. The only spacing factor values above 0.008 in. were observed in cores from Site 7 (done on three separate cores, resulting in values of 0.012 in., 0.010 in., and 0.007 in.). The high spacing factors at this site appeared to be related to a very coarse air-void system.
The large majority of the measured w/cm ratios determined by petrographic methods tended to agree to ±0.05 of the nominal w/cm ratio calculated from batch quantities provided by the various states. One notable exception to this statement was observed at Sites 3 and 4, where the measured w/cm ratios (roughly 0.46 to 0.51) did not agree well with the nominal 0.40 w/cm ratio stated in the batch quantities. Plant reports from this site documented that the w/cm ratio was typically below 0.40 with a maximum value of 0.41. This discrepancy is currently unexplained, but it does suggest that that some field placement problems were probably occurring at this site. In addition, another discrepancy was noted in one of the cores from Site 3. The petrographic examination did not find fly ash. This was also in poor agreement with the mixture design, which indicated that 15% Class C fly ash should have been present in the concrete.
45
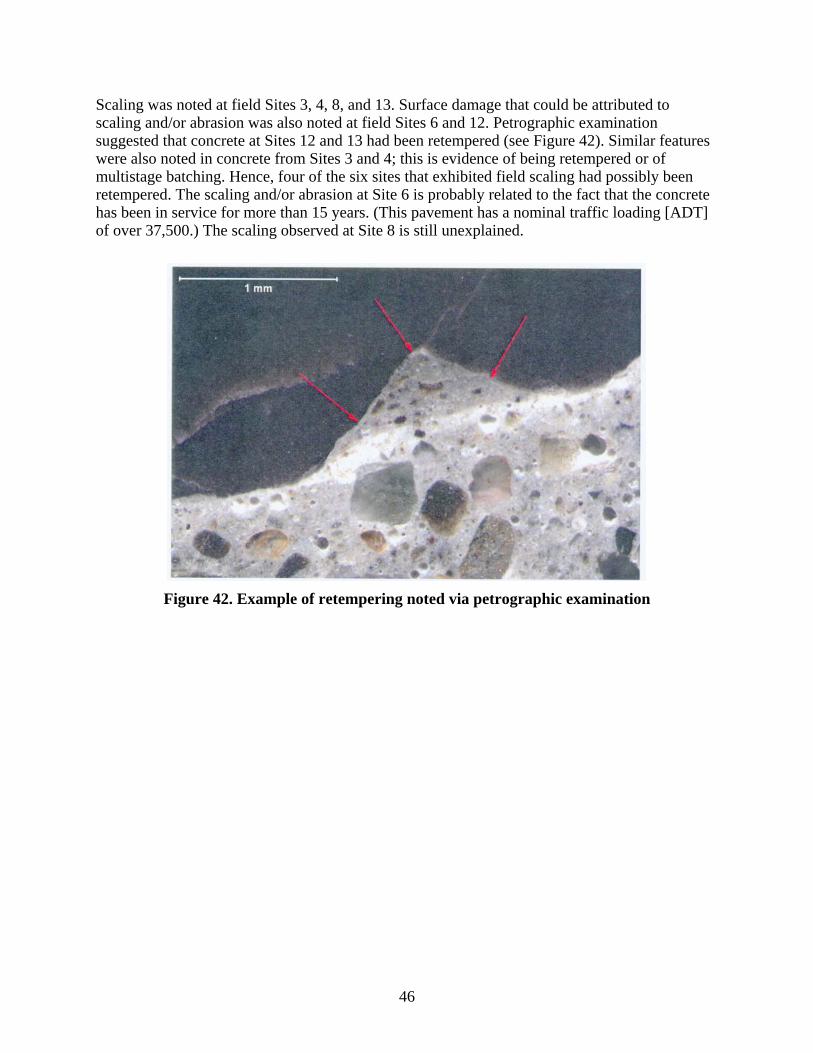
Scaling was noted at field Sites 3, 4, 8, and 13. Surface damage that could be attributed to scaling and/or abrasion was also noted at field Sites 6 and 12. Petrographic examination suggested that concrete at Sites 12 and 13 had been retempered (see Figure 42). Similar features were also noted in concrete from Sites 3 and 4; this is evidence of being retempered or of multistage batching. Hence, four of the six sites that exhibited field scaling had possibly been retempered. The scaling and/or abrasion at Site 6 is probably related to the fact that the concrete has been in service for more than 15 years. (This pavement has a nominal traffic loading [ADT] of over 37,500.) The scaling observed at Site 8 is still unexplained.
Figure 42. Example of retempering noted via petrographic examination
46
SUMMARY
In summary, the initial phase of this project consisted of field surveys of portland cement concrete pavements and bridge decks containing slag cement. This was done to determine whether the addition of slag cement to the concrete mixtures increased the surface scaling caused by the routine application of deicer salt. Laboratory testing was conducted on core samples extracted from selected field sites. The laboratory testing program consisted of scaling tests, rapid chloride permeability tests, surface chloride profile tests, and petrographic examination.
A total of 28 field sites were evaluated during this project. After reviewing the field sites, 13 sites and 3 subsites were selected for coring. Of the 13 sites selected, 12 provided cores, including 6 pavement sites and 6 bridge decks. Cores were also obtained from all 3 subsites (all pavements).
Scaling tests were conducted on 6 in. diameter cores extracted from four different pavements and three different bridge decks. The tests were conducted in general accordance with ASTM C 672/C 672M. Only cores extracted from Site 13 exhibited scaling mass loss values that exceeded 1.5 lbs/yd2. The cementitious component of this concrete mixture was composed of portland cement, 20% slag, and 6% silica fume. It was also noted that the bridge deck cores tended to lose more mass during the scaling tests than the pavement cores.
Rapid chloride permeability tests were conducted on all of the sites that were cored. The tests were conducted in accordance with ASTM C 1202. Test results ranged from a high value of 1,580 coulombs passed to a low value of 590 coulombs passed. The amount of charge passed did not appear to be directly related to the amount of slag in the mixtures. However, the different ages of the concrete at the various sites tended to complicate the interpretation of the test results. Surface chloride profile tests were also conducted on core specimens from the different sites. The diffusion coefficients estimated for the various samples ranged about 5.6E-12 m2/s to 1.4E-13 m2/s.
Petrographic examinations of the core specimens from the different sites indicated that four of the seven sites that exhibited scaling showed evidence of retempering. In addition, two of the scaling sites tended to have significantly higher w/cm ratios than was expected from the nominal mixture design information that was provided. Therefore, for this study it appeared that construction-related issues played a bigger role in the observed scaling performance than did the amount of slag in the concrete mixture. Hence, additional laboratory work, primarily scaling tests, is recommended to remove these construction-related issues so that firm conclusions can be formulated.
47
RECOMMENDATIONS FOR PHASE 2
Phase 1 of this research project indicated that scaling was occasionally observed on field concrete pavements and bridge decks that contain slag cement. Typically, the field scaling that was observed was slight and appeared to have little impact on the long-term durability of the structure. However, the field study described in this report was constrained by construction-related issues that tended to confound the variables that need to be carefully controlled in a proper scientific investigation.
The field concrete mixture information provided by the various states indicated that ternary mixtures are widely used. In fact, 8 of the 13 sites surveyed for this project contained ternary mixtures. This suggests that the laboratory experimentation needs to include some ternary mixtures in addition to binary mixtures of slag and portland cement. The amount of cementitious materials used in any given project was approximately a six-sack mix (pavements) or a seven-sack mix (bridge decks). Hence, the following brief list of important variables needs to be included in the laboratory work for Phase 2:
• Study cementitious mixtures with total cementitious materials contents of about 560 pcy (pavement mixes) and about 660 pcy (bridge deck mixtures).
• Study three slag replacement percentages (20%, 35%, and 50%). • Include ternary mixtures (Class C fly ash and silica fume were most commonly used with
slag in this project). • Use a single aggregate source (Michigan aggregates would be a good choice). • Use a minimum of two different curing strategies (white pigment to represent common
pavement curing practices and perhaps 7- or 14-day moist curing to represent common bridge deck practices).
48
49
REFERENCES
ACI. 1996. Ground Granulated Blast-Furnace Slag as a Cementitious Constituent in Concrete. In Manual of Concrete Practice. ACI 233R-95. Farmington Hill, MI: American Concrete Institute, 1–18.
ASTM. 2006. Concrete and Aggregates. In Annual Book of ASTM Standards. Volume 4.02. ASTM C672. West Conshohocken, PA: American Society of Testing and Materials.
Bleszynski, R.F., R.D. Hooton, M.D.A. Thomas, and C.A. Rogers. 2002. Durability of Ternary Blend Concretes with Silica Fume and Blast Furnace Slag: Laboratory and Outdoor Exposure Site Studies. ACI Materials Journal 99(5): 499–508.
Boyd, A.J. and R.D. Hooton. 2007. Long-Term Scaling Performance of Concretes Containing Supplementary Cementing Materials. Journal of Materials in Civil Engineering 16(10): 820–825.
Hooton, R.D. 2000. Canadian Use of Ground Granulated Blast Furnace Slag as a Supplementary Cementing Material for Enhanced Performance of Concrete. Canadian Journal of Civil Engineering 27: 754–760.
Hooton, R.D., and A.J. Boyd. 1997. Effect of Finishing, Forming and Curing on Deicer Salt Scaling Performance of Concretes. In Frost Resistance of Concrete, Proceedings of the International RILEM Workshop September 22-23. Essen, Germany: E&FN Spon, 174–183.
Klieger, P., and A.W. Isberner. 1967. Laboratory Studies of Blended Cements: Portland Blast Furnace Slag Cements. Journal of the PCA Research and Development Laboratories 9(3): 2–22.
Luther, M.D., W.J. Mikols, A.J. DeMaio, and J.E. Whitlinger. 1994. Scaling Resistance of Ground Granulated Blast Furnace Slag Concretes. In ACI SP-145. Ed. V.M. Malhotra. Detroit, MI: American Concrete Institute, 47–59.
Marchand, J., R. Pleau, and R. Gagne. 1995. Deterioration of Concrete Due to Freezing and Thawing. In Materials Science of Concrete IV. Ed. J. Skalny and S. Mindess. Westerville, OH: American Ceramic Society, 283–354.
Marchand, J., E.J. Sellevold, and M. Pigeon. 1994. The Deicer Scaling Deterioration of Concrete: An Overview. In ACI SP-145. Ed. V.M. Malhotra. Detroit, MI: American Concrete Institute, 1–46.
Newlon, H., and T.M. Mitchell. Freezing and Thawing. In ASTM STP 169C. Ed. P. Klieger and J.F. Lamond. West Conshohocken, PA: American Society of Testing and Materials, 153–163.
Schlorholtz, S. 1996. Image Analysis for Evaluating the Air Void Parameters of Concrete. Final Report HR-396. Ames, IA: Iowa State University.
Schlorholtz, S. 2000. Determine Initial Cause for Current Premature Portland Cement Concrete Pavement Deterioration. Final Report TR-406. Ames, IA: Center for Transportation Research and Education.
TRB. 1990. Admixtures and Ground Slag for Concrete. Transportation Research Circular 365. Van Dam, T.J., L.L. Sutter, K.D. Smith, M.J. Wade, and K.R. Peterson. 2002. Guidelines for
Detection, Analysis, and Treatment of Materials-Related Distress in Concrete Pavements, Volume 2: Guidelines Description and Use. FHWA-RD-01-164. Washington, DC: FHWA.

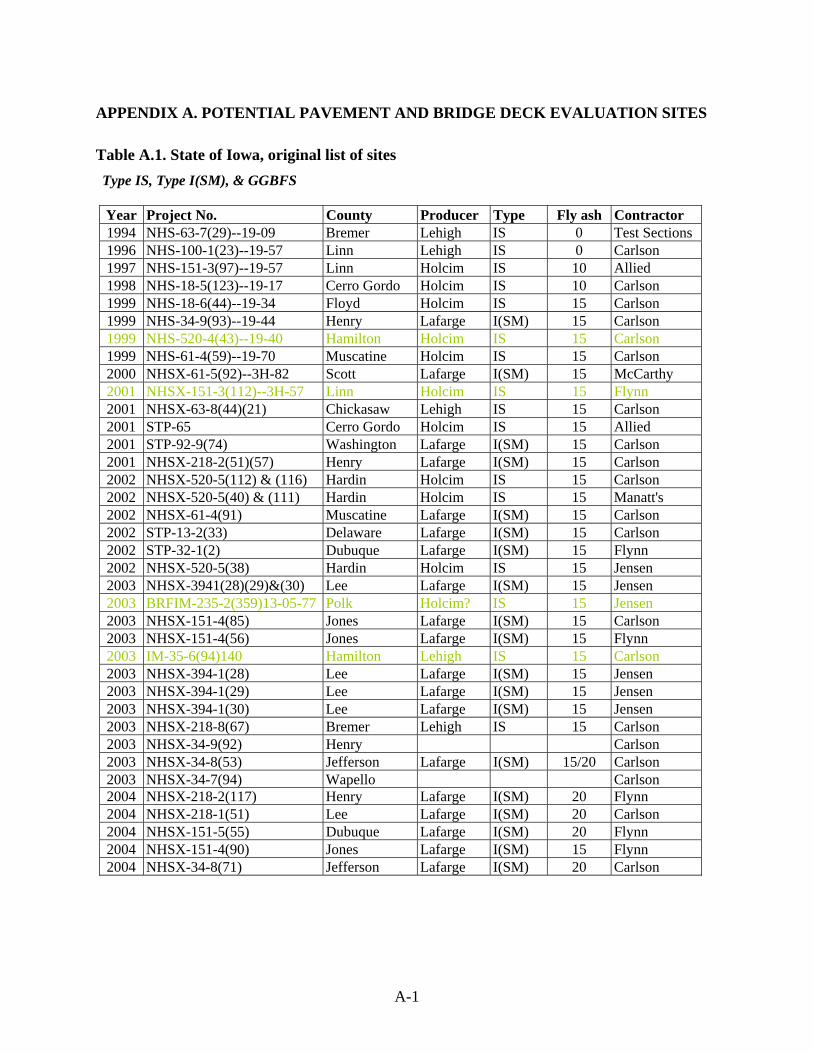
APPENDIX A. POTENTIAL PAVEMENT AND BRIDGE DECK EVALUATION SITES
Table A.1. State of Iowa, original list of sites Type IS, Type I(SM), & GGBFS
Year Project No. County Producer Type Fly ash Contractor 1994 NHS-63-7(29)--19-09 Bremer Lehigh IS 0 Test Sections 1996 NHS-100-1(23)--19-57 Linn Lehigh IS 0 Carlson 1997 NHS-151-3(97)--19-57 Linn Holcim IS 10 Allied 1998 NHS-18-5(123)--19-17 Cerro Gordo Holcim IS 10 Carlson 1999 NHS-18-6(44)--19-34 Floyd Holcim IS 15 Carlson 1999 NHS-34-9(93)--19-44 Henry Lafarge I(SM) 15 Carlson 1999 NHS-520-4(43)--19-40 Hamilton Holcim IS 15 Carlson 1999 NHS-61-4(59)--19-70 Muscatine Holcim IS 15 Carlson 2000 NHSX-61-5(92)--3H-82 Scott Lafarge I(SM) 15 McCarthy 2001 NHSX-151-3(112)--3H-57 Linn Holcim IS 15 Flynn 2001 NHSX-63-8(44)(21) Chickasaw Lehigh IS 15 Carlson 2001 STP-65 Cerro Gordo Holcim IS 15 Allied 2001 STP-92-9(74) Washington Lafarge I(SM) 15 Carlson 2001 NHSX-218-2(51)(57) Henry Lafarge I(SM) 15 Carlson 2002 NHSX-520-5(112) & (116) Hardin Holcim IS 15 Carlson 2002 NHSX-520-5(40) & (111) Hardin Holcim IS 15 Manatt's 2002 NHSX-61-4(91) Muscatine Lafarge I(SM) 15 Carlson 2002 STP-13-2(33) Delaware Lafarge I(SM) 15 Carlson 2002 STP-32-1(2) Dubuque Lafarge I(SM) 15 Flynn 2002 NHSX-520-5(38) Hardin Holcim IS 15 Jensen 2003 NHSX-3941(28)(29)&(30) Lee Lafarge I(SM) 15 Jensen 2003 BRFIM-235-2(359)13-05-77 Polk Holcim? IS 15 Jensen 2003 NHSX-151-4(85) Jones Lafarge I(SM) 15 Carlson 2003 NHSX-151-4(56) Jones Lafarge I(SM) 15 Flynn 2003 IM-35-6(94)140 Hamilton Lehigh IS 15 Carlson 2003 NHSX-394-1(28) Lee Lafarge I(SM) 15 Jensen 2003 NHSX-394-1(29) Lee Lafarge I(SM) 15 Jensen 2003 NHSX-394-1(30) Lee Lafarge I(SM) 15 Jensen 2003 NHSX-218-8(67) Bremer Lehigh IS 15 Carlson 2003 NHSX-34-9(92) Henry Carlson 2003 NHSX-34-8(53) Jefferson Lafarge I(SM) 15/20 Carlson 2003 NHSX-34-7(94) Wapello Carlson 2004 NHSX-218-2(117) Henry Lafarge I(SM) 20 Flynn 2004 NHSX-218-1(51) Lee Lafarge I(SM) 20 Carlson 2004 NHSX-151-5(55) Dubuque Lafarge I(SM) 20 Flynn 2004 NHSX-151-4(90) Jones Lafarge I(SM) 15 Flynn 2004 NHSX-34-8(71) Jefferson Lafarge I(SM) 20 Carlson
A-1
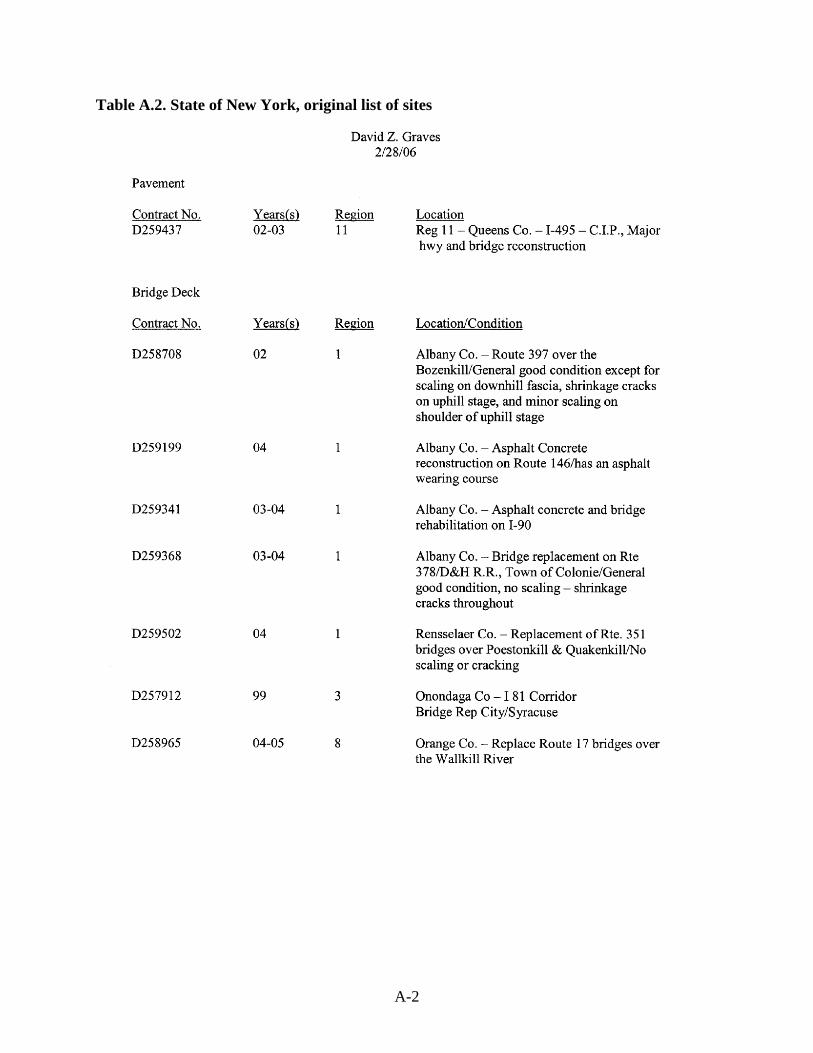
Table A.2. State of New York, original list of sites
A-2
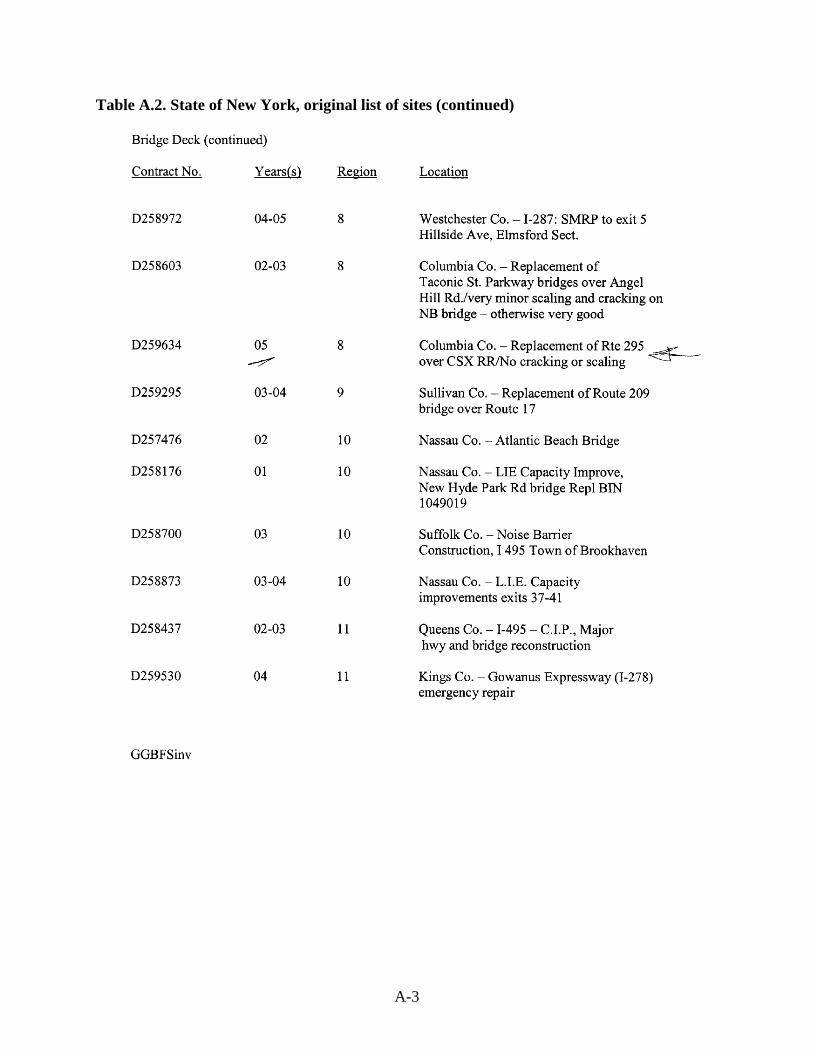
Table A.2. State of New York, original list of sites (continued)
A-3

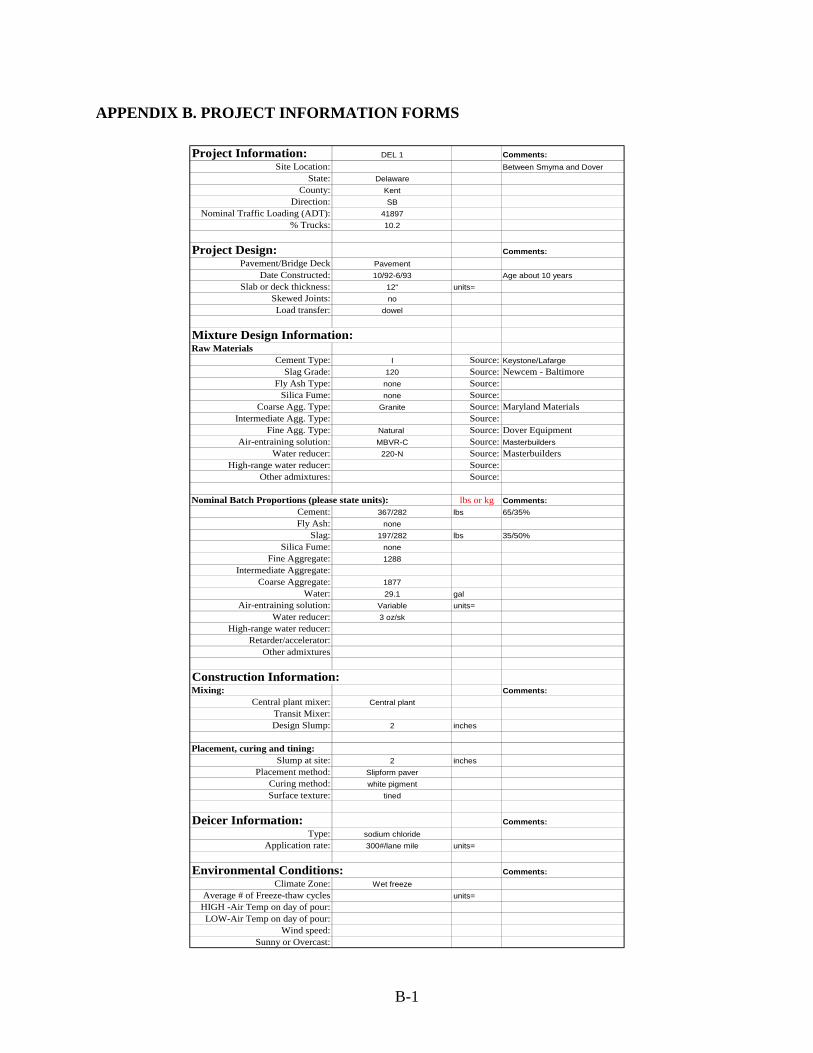
APPENDIX B. PROJECT INFORMATION FORMS
Project Information: DEL 1 Comments:Site Location: Between Smyma and Dover
State: DelawareCounty: Kent
Direction: SBNominal Traffic Loading (ADT): 41897
% Trucks: 10.2
Project Design: Comments:Pavement/Bridge Deck Pavement
Date Constructed: 10/92-6/93 Age about 10 yearsSlab or deck thickness: 12" units=
Skewed Joints: noLoad transfer: dowel
Mixture Design Information:Raw Materials
Cement Type: I Source: Keystone/LafargeSlag Grade: 120 Source: Newcem - Baltimore
Fly Ash Type: none Source:Silica Fume: none Source:
Coarse Agg. Type: Granite Source: Maryland MaterialsIntermediate Agg. Type: Source:
Fine Agg. Type: Natural Source: Dover EquipmentAir-entraining solution: MBVR-C Source: Masterbuilders
Water reducer: 220-N Source: MasterbuildersHigh-range water reducer: Source:
Other admixtures: Source:
Nominal Batch Proportions (please state units): Comments:Cement: 367/282 lbs 65/35%Fly Ash: none
Slag: 197/282 lbs 35/50%Silica Fume: none
Fine Aggregate: 1288Intermediate Aggregate:
Coarse Aggregate: 1877Water: 29.1 gal
Air-entraining solution: Variable units=Water reducer: 3 oz/sk
High-range water reducer:Retarder/accelerator:
Other admixtures
Construction Information:Mixing: Comments:
Central plant mixer: Central plantTransit Mixer:Design Slump: 2 inches
Placement, curing and tining:Slump at site: 2 inches
Placement method: Slipform paverCuring method: white pigmentSurface texture: tined
Deicer Information: Comments:Type: sodium chloride
Application rate: 300#/lane mile units=
Environmental Conditions: Comments:Climate Zone: Wet freeze
Average # of Freeze-thaw cycles units=HIGH -Air Temp on day of pour:LOW-Air Temp on day of pour:
Wind speed:Sunny or Overcast:
lbs or kg
B-1
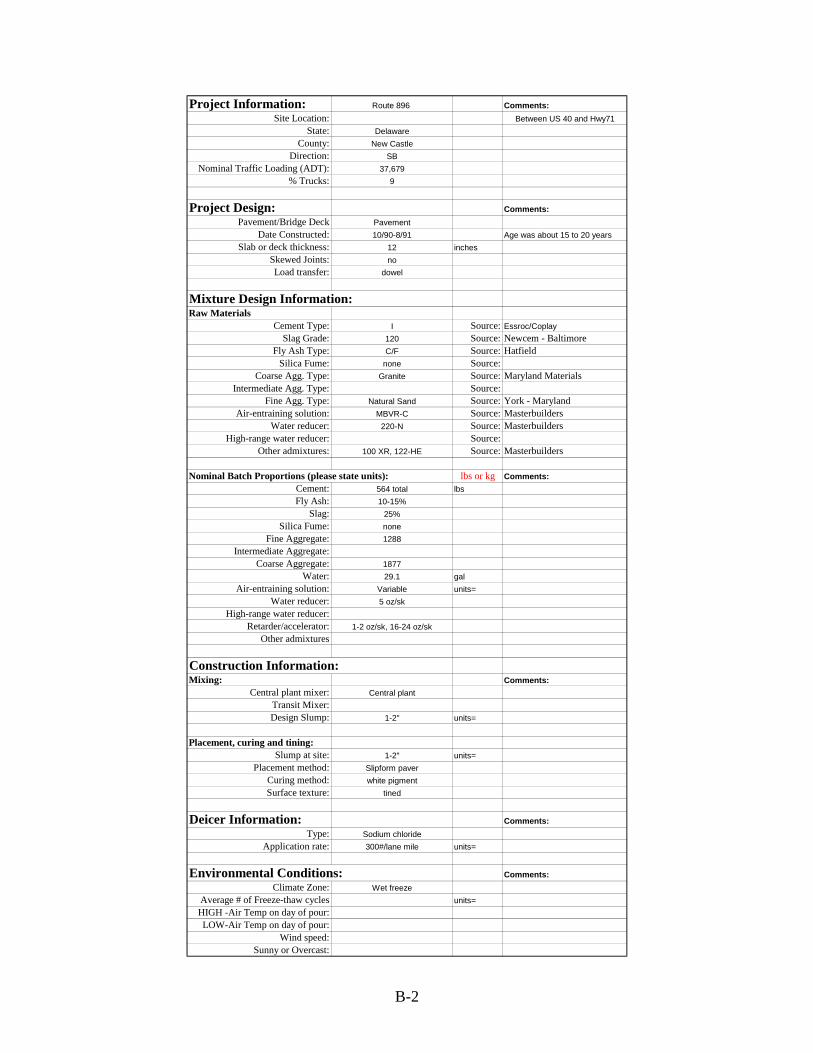
Project Information: Route 896 Comments:Site Location: Between US 40 and Hwy71
State: DelawareCounty: New Castle
Direction: SBNominal Traffic Loading (ADT): 37,679
% Trucks: 9
Project Design: Comments:Pavement/Bridge Deck Pavement
Date Constructed: 10/90-8/91 Age was about 15 to 20 yearsSlab or deck thickness: 12 inches
Skewed Joints: noLoad transfer: dowel
Mixture Design Information:Raw Materials
Cement Type: I Source: Essroc/CoplaySlag Grade: 120 Source: Newcem - Baltimore
Fly Ash Type: C/F Source: HatfieldSilica Fume: none Source:
Coarse Agg. Type: Granite Source: Maryland MaterialsIntermediate Agg. Type: Source:
Fine Agg. Type: Natural Sand Source: York - MarylandAir-entraining solution: MBVR-C Source: Masterbuilders
Water reducer: 220-N Source: MasterbuildersHigh-range water reducer: Source:
Other admixtures: 100 XR, 122-HE Source: Masterbuilders
Nominal Batch Proportions (please state units): Comments:Cement: 564 total lbs Fly Ash: 10-15%
Slag: 25%Silica Fume: none
Fine Aggregate: 1288Intermediate Aggregate:
Coarse Aggregate: 1877Water: 29.1 gal
Air-entraining solution: Variable units=Water reducer: 5 oz/sk
High-range water reducer:Retarder/accelerator: 1-2 oz/sk, 16-24 oz/sk
Other admixtures
Construction Information:Mixing: Comments:
Central plant mixer: Central plantTransit Mixer:Design Slump: 1-2" units=
Placement, curing and tining:Slump at site: 1-2" units=
Placement method: Slipform paverCuring method: white pigmentSurface texture: tined
Deicer Information: Comments:Type: Sodium chloride
Application rate: 300#/lane mile units=
Environmental Conditions: Comments:Climate Zone: Wet freeze
Average # of Freeze-thaw cycles units=HIGH -Air Temp on day of pour:LOW-Air Temp on day of pour:
Wind speed:Sunny or Overcast:
lbs or kg
B-2
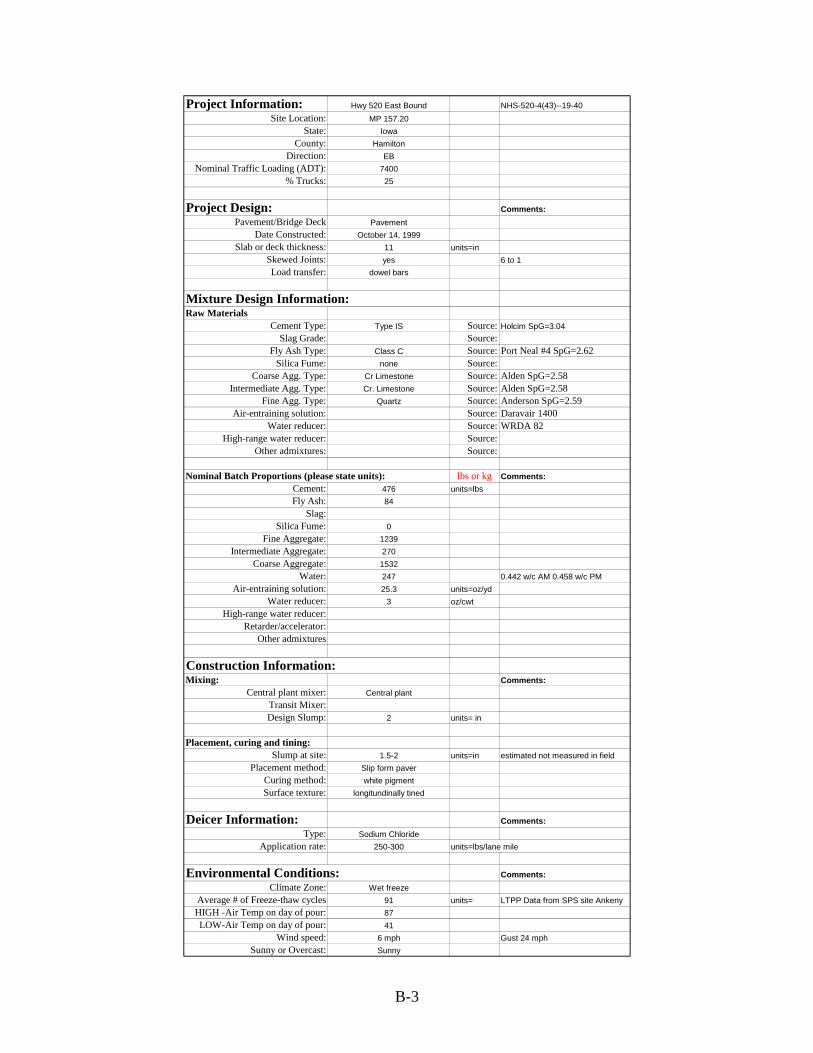
Project Information: Hwy 520 East Bound NHS-520-4(43)--19-40Site Location: MP 157.20
State: IowaCounty: Hamilton
Direction: EBNominal Traffic Loading (ADT): 7400
% Trucks: 25
Project Design: Comments:Pavement/Bridge Deck Pavement
Date Constructed: October 14, 1999Slab or deck thickness: 11 units=in
Skewed Joints: yes 6 to 1Load transfer: dowel bars
Mixture Design Information:Raw Materials
Cement Type: Type IS Source: Holcim SpG=3.04Slag Grade: Source:
Fly Ash Type: Class C Source: Port Neal #4 SpG=2.62Silica Fume: none Source:
Coarse Agg. Type: Cr Limestone Source: Alden SpG=2.58Intermediate Agg. Type: Cr. Limestone Source: Alden SpG=2.58
Fine Agg. Type: Quartz Source: Anderson SpG=2.59Air-entraining solution: Source: Daravair 1400
Water reducer: Source: WRDA 82High-range water reducer: Source:
Other admixtures: Source:
Nominal Batch Proportions (please state units): Comments:Cement: 476 units=lbsFly Ash: 84
Slag:Silica Fume: 0
Fine Aggregate: 1239Intermediate Aggregate: 270
Coarse Aggregate: 1532Water: 247 0.442 w/c AM 0.458 w/c PM
Air-entraining solution: 25.3 units=oz/ydWater reducer: 3 oz/cwt
High-range water reducer:Retarder/accelerator:
Other admixtures
Construction Information:Mixing: Comments:
Central plant mixer: Central plantTransit Mixer:Design Slump: 2 units= in
Placement, curing and tining:Slump at site: 1.5-2 units=in estimated not measured in field
Placement method: Slip form paverCuring method: white pigmentSurface texture: longitundinally tined
Deicer Information: Comments:Type: Sodium Chloride
Application rate: 250-300 units=lbs/lane mile
Environmental Conditions: Comments:Climate Zone: Wet freeze
Average # of Freeze-thaw cycles 91 units= LTPP Data from SPS site Ankeny HIGH -Air Temp on day of pour: 87LOW-Air Temp on day of pour: 41
Wind speed: 6 mph Gust 24 mph Sunny or Overcast: Sunny
lbs or kg
B-3
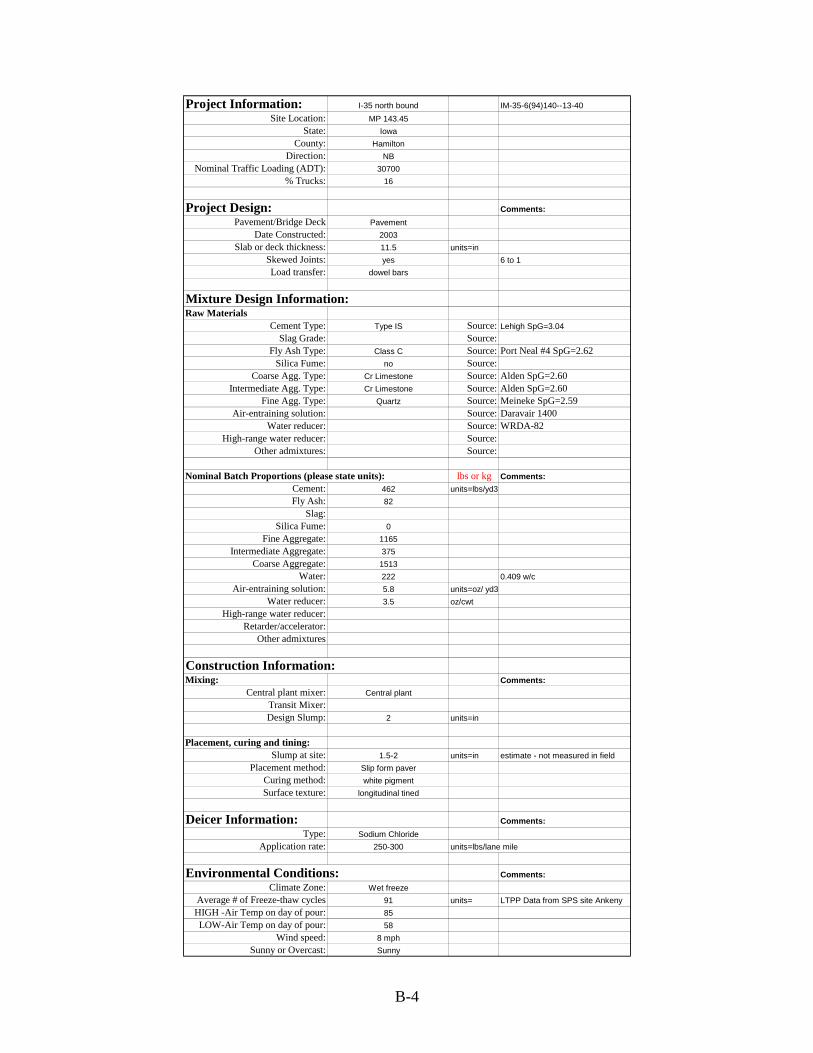
Project Information: I-35 north bound IM-35-6(94)140--13-40Site Location: MP 143.45
State: IowaCounty: Hamilton
Direction: NBNominal Traffic Loading (ADT): 30700
% Trucks: 16
Project Design: Comments:Pavement/Bridge Deck Pavement
Date Constructed: 2003Slab or deck thickness: 11.5 units=in
Skewed Joints: yes 6 to 1Load transfer: dowel bars
Mixture Design Information:Raw Materials
Cement Type: Type IS Source: Lehigh SpG=3.04Slag Grade: Source:
Fly Ash Type: Class C Source: Port Neal #4 SpG=2.62Silica Fume: no Source:
Coarse Agg. Type: Cr Limestone Source: Alden SpG=2.60Intermediate Agg. Type: Cr Limestone Source: Alden SpG=2.60
Fine Agg. Type: Quartz Source: Meineke SpG=2.59Air-entraining solution: Source: Daravair 1400
Water reducer: Source: WRDA-82High-range water reducer: Source:
Other admixtures: Source:
Nominal Batch Proportions (please state units): Comments:Cement: 462 units=lbs/yd3Fly Ash: 82
Slag:Silica Fume: 0
Fine Aggregate: 1165Intermediate Aggregate: 375
Coarse Aggregate: 1513Water: 222 0.409 w/c
Air-entraining solution: 5.8 units=oz/ yd3Water reducer: 3.5 oz/cwt
High-range water reducer:Retarder/accelerator:
Other admixtures
Construction Information:Mixing: Comments:
Central plant mixer: Central plantTransit Mixer:Design Slump: 2 units=in
Placement, curing and tining:Slump at site: 1.5-2 units=in estimate - not measured in field
Placement method: Slip form paverCuring method: white pigmentSurface texture: longitudinal tined
Deicer Information: Comments:Type: Sodium Chloride
Application rate: 250-300 units=lbs/lane mile
Environmental Conditions: Comments:Climate Zone: Wet freeze
Average # of Freeze-thaw cycles 91 units= LTPP Data from SPS site Ankeny HIGH -Air Temp on day of pour: 85LOW-Air Temp on day of pour: 58
Wind speed: 8 mphSunny or Overcast: Sunny
lbs or kg
B-4
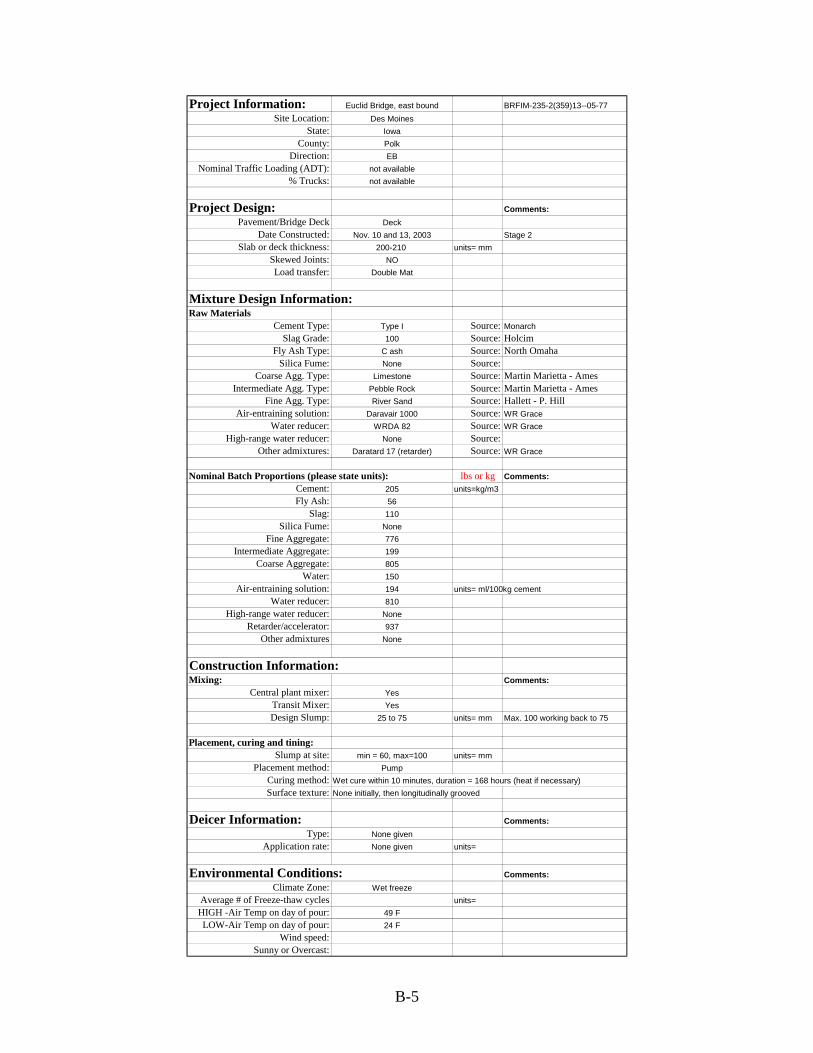
Project Information: Euclid Bridge, east bound BRFIM-235-2(359)13--05-77Site Location: Des Moines
State: IowaCounty: Polk
Direction: EBNominal Traffic Loading (ADT): not available
% Trucks: not available
Project Design: Comments:Pavement/Bridge Deck Deck
Date Constructed: Nov. 10 and 13, 2003 Stage 2Slab or deck thickness: 200-210 units= mm
Skewed Joints: NOLoad transfer: Double Mat
Mixture Design Information:Raw Materials
Cement Type: Type I Source: MonarchSlag Grade: 100 Source: Holcim
Fly Ash Type: C ash Source: North OmahaSilica Fume: None Source:
Coarse Agg. Type: Limestone Source: Martin Marietta - AmesIntermediate Agg. Type: Pebble Rock Source: Martin Marietta - Ames
Fine Agg. Type: River Sand Source: Hallett - P. HillAir-entraining solution: Daravair 1000 Source: WR Grace
Water reducer: WRDA 82 Source: WR GraceHigh-range water reducer: None Source:
Other admixtures: Daratard 17 (retarder) Source: WR Grace
Nominal Batch Proportions (please state units): Comments:Cement: 205 units=kg/m3Fly Ash: 56
Slag: 110Silica Fume: None
Fine Aggregate: 776Intermediate Aggregate: 199
Coarse Aggregate: 805Water: 150
Air-entraining solution: 194 units= ml/100kg cementWater reducer: 810
High-range water reducer: NoneRetarder/accelerator: 937
Other admixtures None
Construction Information:Mixing: Comments:
Central plant mixer: YesTransit Mixer: YesDesign Slump: 25 to 75 units= mm Max. 100 working back to 75
Placement, curing and tining:Slump at site: min = 60, max=100 units= mm
Placement method: PumpCuring method: Wet cure within 10 minutes, duration = 168 hours (heat if necessary)Surface texture: None initially, then longitudinally grooved
Deicer Information: Comments:Type: None given
Application rate: None given units=
Environmental Conditions: Comments:Climate Zone: Wet freeze
Average # of Freeze-thaw cycles units=HIGH -Air Temp on day of pour: 49 FLOW-Air Temp on day of pour: 24 F
Wind speed:Sunny or Overcast:
lbs or kg
B-5

Project Information: Euclid Bridge, west bound BRFIM-235-2(359)13--05-77Site Location: Des Moines
State: IowaCounty: Polk
Direction: WBNominal Traffic Loading (ADT): not available
% Trucks: not available
Project Design: Comments:Pavement/Bridge Deck Deck
Date Constructed: June 17 and 19, 2003 Stage 1Slab or deck thickness: 200-210 units= mm
Skewed Joints: NOLoad transfer: Double Mat
Mixture Design Information:Raw Materials
Cement Type: Type I Source: MonarchSlag Grade: 100 Source: Holcim
Fly Ash Type: C ash Source: North OmahaSilica Fume: None Source:
Coarse Agg. Type: Limestone Source: Martin Marietta - AmesIntermediate Agg. Type: Pebble Rock Source: Martin Marietta - Ames
Fine Agg. Type: River Sand Source: Hallett - P. HillAir-entraining solution: Daravair 1000 Source: WR Grace
Water reducer: WRDA 82 Source: WR GraceHigh-range water reducer: None Source:
Other admixtures: Daratard 17 (retarder) Source: WR Grace
Nominal Batch Proportions (please state units): Comments:Cement: 205 units=kg/m3Fly Ash: 56
Slag: 110Silica Fume: None
Fine Aggregate: 776Intermediate Aggregate: 199
Coarse Aggregate: 805Water: 150
Air-entraining solution: 194 units= ml/100kg cementWater reducer: 810
High-range water reducer: NoneRetarder/accelerator: 937
Other admixtures None
Construction Information:Mixing: Comments:
Central plant mixer: YesTransit Mixer: YesDesign Slump: 25 to 75 units= mm Max. 100 working back to 75
Placement, curing and tining:Slump at site: min = 70, max=120 units= mm
Placement method: PumpCuring method: Wet cure within 10 minutes, duration = 168 hours (heat if necessary)Surface texture: None initially, then longitudinally grooved
Deicer Information: Comments:Type: None given
Application rate: None given units=
Environmental Conditions: Comments:Climate Zone: Wet freeze
Average # of Freeze-thaw cycles units=HIGH -Air Temp on day of pour: 89 FLOW-Air Temp on day of pour: 64 F
Wind speed:Sunny or Overcast:
lbs or kg
B-6
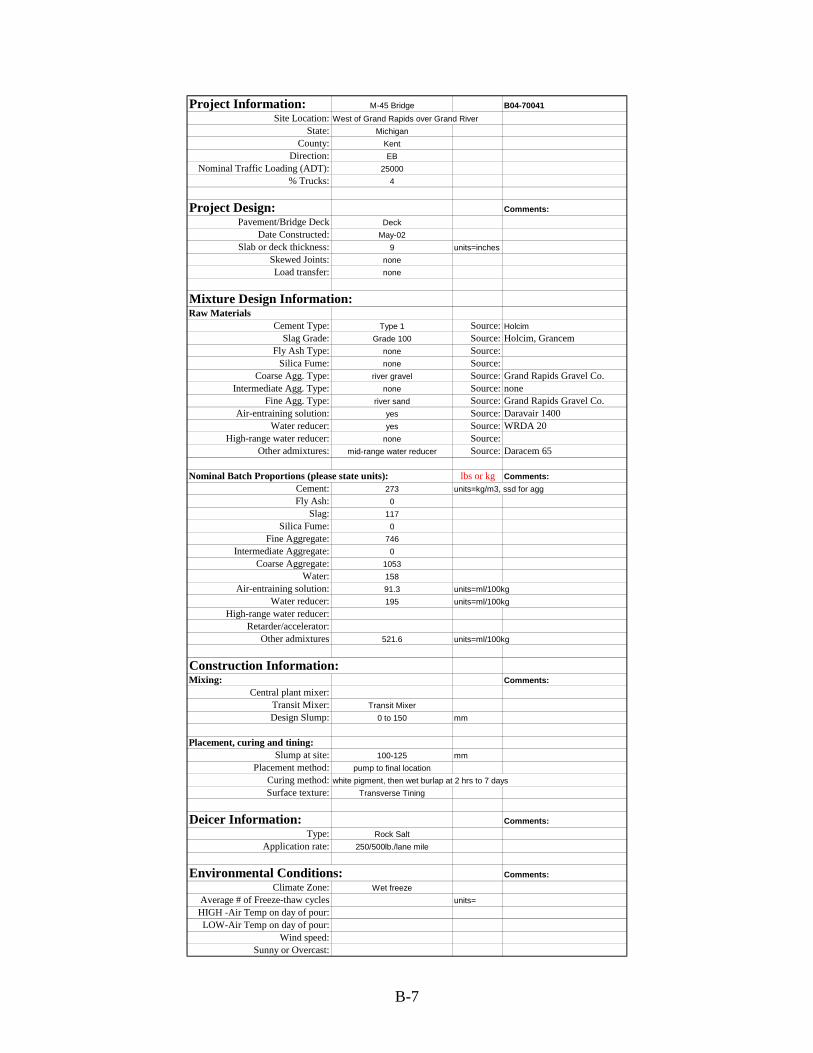
Project Information: M-45 Bridge B04-70041Site Location: West of Grand Rapids over Grand River
State: MichiganCounty: Kent
Direction: EBNominal Traffic Loading (ADT): 25000
% Trucks: 4
Project Design: Comments:Pavement/Bridge Deck Deck
Date Constructed: May-02Slab or deck thickness: 9 units=inches
Skewed Joints: noneLoad transfer: none
Mixture Design Information:Raw Materials
Cement Type: Type 1 Source: HolcimSlag Grade: Grade 100 Source: Holcim, Grancem
Fly Ash Type: none Source:Silica Fume: none Source:
Coarse Agg. Type: river gravel Source: Grand Rapids Gravel Co.Intermediate Agg. Type: none Source: none
Fine Agg. Type: river sand Source: Grand Rapids Gravel Co.Air-entraining solution: yes Source: Daravair 1400
Water reducer: yes Source: WRDA 20High-range water reducer: none Source:
Other admixtures: mid-range water reducer Source: Daracem 65
Nominal Batch Proportions (please state units): Comments:Cement: 273 units=kg/m3, ssd for aggFly Ash: 0
Slag: 117Silica Fume: 0
Fine Aggregate: 746Intermediate Aggregate: 0
Coarse Aggregate: 1053Water: 158
Air-entraining solution: 91.3 units=ml/100kgWater reducer: 195 units=ml/100kg
High-range water reducer:Retarder/accelerator:
Other admixtures 521.6 units=ml/100kg
Construction Information:Mixing: Comments:
Central plant mixer:Transit Mixer: Transit MixerDesign Slump: 0 to 150 mm
Placement, curing and tining:Slump at site: 100-125 mm
Placement method: pump to final locationCuring method: white pigment, then wet burlap at 2 hrs to 7 daysSurface texture: Transverse Tining
Deicer Information: Comments:Type: Rock Salt
Application rate: 250/500lb./lane mile
Environmental Conditions: Comments:Climate Zone: Wet freeze
Average # of Freeze-thaw cycles units=HIGH -Air Temp on day of pour:LOW-Air Temp on day of pour:
Wind speed:Sunny or Overcast:
lbs or kg
B-7

Project Information: M-45 Bridge B04-70041Site Location: West of Grand Rapids over Grand River
State: MichiganCounty: Kent
Direction: WBNominal Traffic Loading (ADT): 25000
% Trucks: 4
Project Design: Comments:Pavement/Bridge Deck Deck
Date Constructed: Oct. - 2001Slab or deck thickness: 9 units=inches
Skewed Joints: noneLoad transfer: none
Mixture Design Information:Raw Materials
Cement Type: Type 1 Source: HolcimSlag Grade: Grade 100 Source: Holcim, Grancem
Fly Ash Type: none Source:Silica Fume: none Source:
Coarse Agg. Type: river gravel Source: Grand Rapids Gravel Co.Intermediate Agg. Type: none Source: none
Fine Agg. Type: river sand Source: Grand Rapids Gravel Co.Air-entraining solution: yes Source: Daravair 1400
Water reducer: yes Source: WRDA 20High-range water reducer: none Source:
Other admixtures: mid-range water reducer Source: Daracem 65
Nominal Batch Proportions (please state units): Comments:Cement: 273 units=kg/m3, ssd for aggFly Ash: 0
Slag: 117Silica Fume: 0
Fine Aggregate: 746Intermediate Aggregate: 0
Coarse Aggregate: 1053Water: 158
Air-entraining solution: 91.3 units=ml/100kgWater reducer: 195 units=ml/100kg
High-range water reducer:Retarder/accelerator:
Other admixtures 521.6 units=ml/100kg
Construction Information:Mixing: Comments:
Central plant mixer:Transit Mixer: Transit MixerDesign Slump: 0 to 150 mm
Placement, curing and tining:Slump at site: 100-125 mm
Placement method: pump to final locationCuring method: white pigment, then wet burlap at 2 hrs to 7 daysSurface texture: Transverse Tining
Deicer Information: Comments:Type: Rock Salt
Application rate: 250/500 lb./lane mile
Environmental Conditions: Comments:Climate Zone: Wet freeze
Average # of Freeze-thaw cycles units=HIGH -Air Temp on day of pour:LOW-Air Temp on day of pour:
Wind speed:Sunny or Overcast:
lbs or kg
B-8
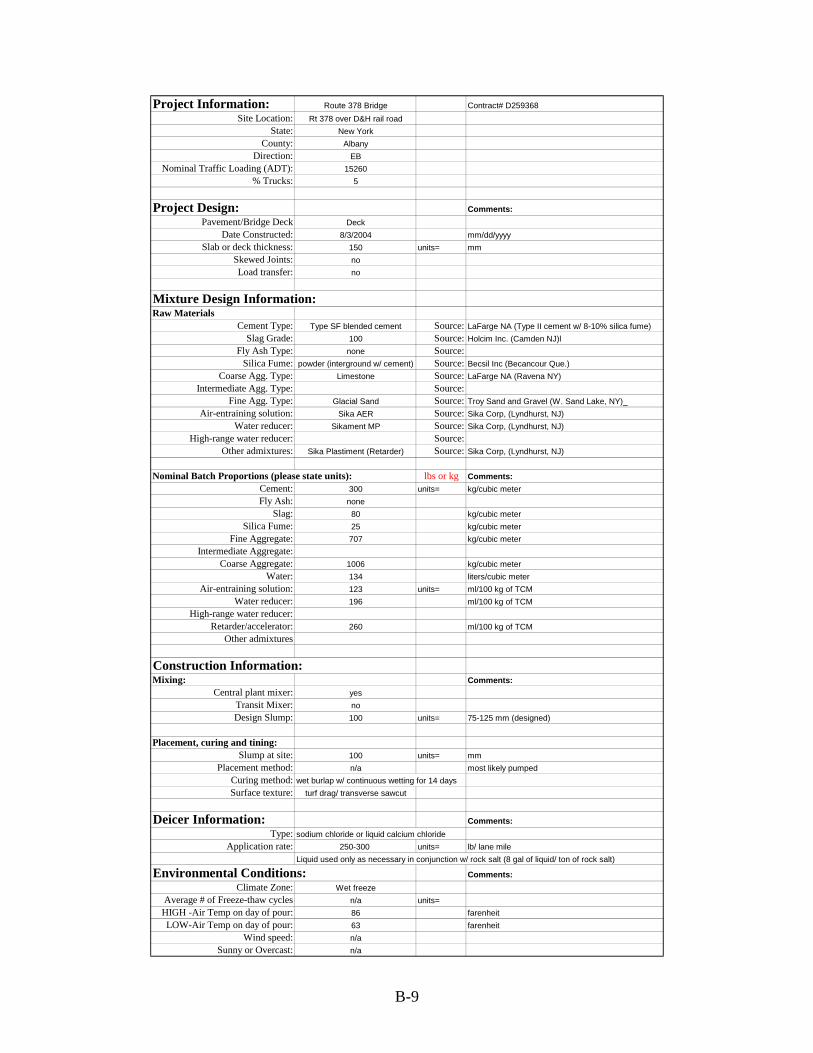
Project Information: Route 378 Bridge Contract# D259368Site Location: Rt 378 over D&H rail road
State: New YorkCounty: Albany
Direction: EBNominal Traffic Loading (ADT): 15260
% Trucks: 5
Project Design: Comments:Pavement/Bridge Deck Deck
Date Constructed: 8/3/2004 mm/dd/yyyySlab or deck thickness: 150 units= mm
Skewed Joints: noLoad transfer: no
Mixture Design Information:Raw Materials
Cement Type: Type SF blended cement Source: LaFarge NA (Type II cement w/ 8-10% silica fume)Slag Grade: 100 Source: Holcim Inc. (Camden NJ)l
Fly Ash Type: none Source:Silica Fume: powder (interground w/ cement) Source: Becsil Inc (Becancour Que.)
Coarse Agg. Type: Limestone Source: LaFarge NA (Ravena NY)Intermediate Agg. Type: Source:
Fine Agg. Type: Glacial Sand Source: Troy Sand and Gravel (W. Sand Lake, NY)_Air-entraining solution: Sika AER Source: Sika Corp, (Lyndhurst, NJ)
Water reducer: Sikament MP Source: Sika Corp, (Lyndhurst, NJ)High-range water reducer: Source:
Other admixtures: Sika Plastiment (Retarder) Source: Sika Corp, (Lyndhurst, NJ)
Nominal Batch Proportions (please state units): Comments:Cement: 300 units= kg/cubic meterFly Ash: none
Slag: 80 kg/cubic meterSilica Fume: 25 kg/cubic meter
Fine Aggregate: 707 kg/cubic meterIntermediate Aggregate:
Coarse Aggregate: 1006 kg/cubic meterWater: 134 liters/cubic meter
Air-entraining solution: 123 units= ml/100 kg of TCMWater reducer: 196 ml/100 kg of TCM
High-range water reducer:Retarder/accelerator: 260 ml/100 kg of TCM
Other admixtures
Construction Information:Mixing: Comments:
Central plant mixer: yesTransit Mixer: noDesign Slump: 100 units= 75-125 mm (designed)
Placement, curing and tining:Slump at site: 100 units= mm
Placement method: n/a most likely pumpedCuring method: wet burlap w/ continuous wetting for 14 days Surface texture: turf drag/ transverse sawcut
Deicer Information: Comments:Type: sodium chloride or liquid calcium chloride
Application rate: 250-300 units= lb/ lane mile Liquid used only as necessary in conjunction w/ rock salt (8 gal of liquid/ ton of rock salt)
Environmental Conditions: Comments:Climate Zone: Wet freeze
Average # of Freeze-thaw cycles n/a units=HIGH -Air Temp on day of pour: 86 farenheitLOW-Air Temp on day of pour: 63 farenheit
Wind speed: n/aSunny or Overcast: n/a
lbs or kg
B-9
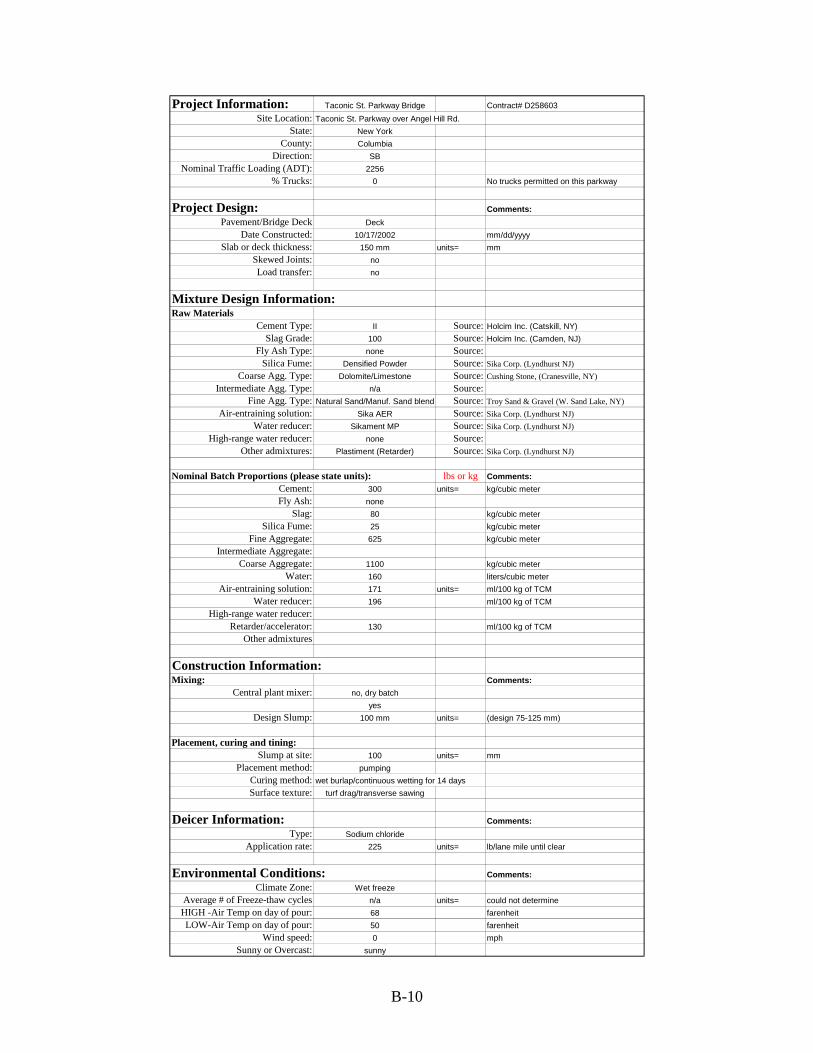
Project Information: Taconic St. Parkway Bridge Contract# D258603Site Location: Taconic St. Parkway over Angel Hill Rd.
State: New YorkCounty: Columbia
Direction: SBNominal Traffic Loading (ADT): 2256
% Trucks: 0 No trucks permitted on this parkway
Project Design: Comments:Pavement/Bridge Deck Deck
Date Constructed: 10/17/2002 mm/dd/yyyySlab or deck thickness: 150 mm units= mm
Skewed Joints: noLoad transfer: no
Mixture Design Information:Raw Materials
Cement Type: II Source: Holcim Inc. (Catskill, NY)Slag Grade: 100 Source: Holcim Inc. (Camden, NJ)
Fly Ash Type: none Source:Silica Fume: Densified Powder Source: Sika Corp. (Lyndhurst NJ)
Coarse Agg. Type: Dolomite/Limestone Source: Cushing Stone, (Cranesville, NY)Intermediate Agg. Type: n/a Source:
Fine Agg. Type: Natural Sand/Manuf. Sand blend Source: Troy Sand & Gravel (W. Sand Lake, NY)Air-entraining solution: Sika AER Source: Sika Corp. (Lyndhurst NJ)
Water reducer: Sikament MP Source: Sika Corp. (Lyndhurst NJ)High-range water reducer: none Source:
Other admixtures: Plastiment (Retarder) Source: Sika Corp. (Lyndhurst NJ)
Nominal Batch Proportions (please state units): Comments:Cement: 300 units= kg/cubic meterFly Ash: none
Slag: 80 kg/cubic meterSilica Fume: 25 kg/cubic meter
Fine Aggregate: 625 kg/cubic meterIntermediate Aggregate:
Coarse Aggregate: 1100 kg/cubic meterWater: 160 liters/cubic meter
Air-entraining solution: 171 units= ml/100 kg of TCMWater reducer: 196 ml/100 kg of TCM
High-range water reducer:Retarder/accelerator: 130 ml/100 kg of TCM
Other admixtures
Construction Information:Mixing: Comments:
Central plant mixer: no, dry batchyes
Design Slump: 100 mm units= (design 75-125 mm)
Placement, curing and tining:Slump at site: 100 units= mm
Placement method: pumpingCuring method: wet burlap/continuous wetting for 14 daysSurface texture: turf drag/transverse sawing
Deicer Information: Comments:Type: Sodium chloride
Application rate: 225 units= lb/lane mile until clear
Environmental Conditions: Comments:Climate Zone: Wet freeze
Average # of Freeze-thaw cycles n/a units= could not determineHIGH -Air Temp on day of pour: 68 farenheitLOW-Air Temp on day of pour: 50 farenheit
Wind speed: 0 mphSunny or Overcast: sunny
lbs or kg
B-10
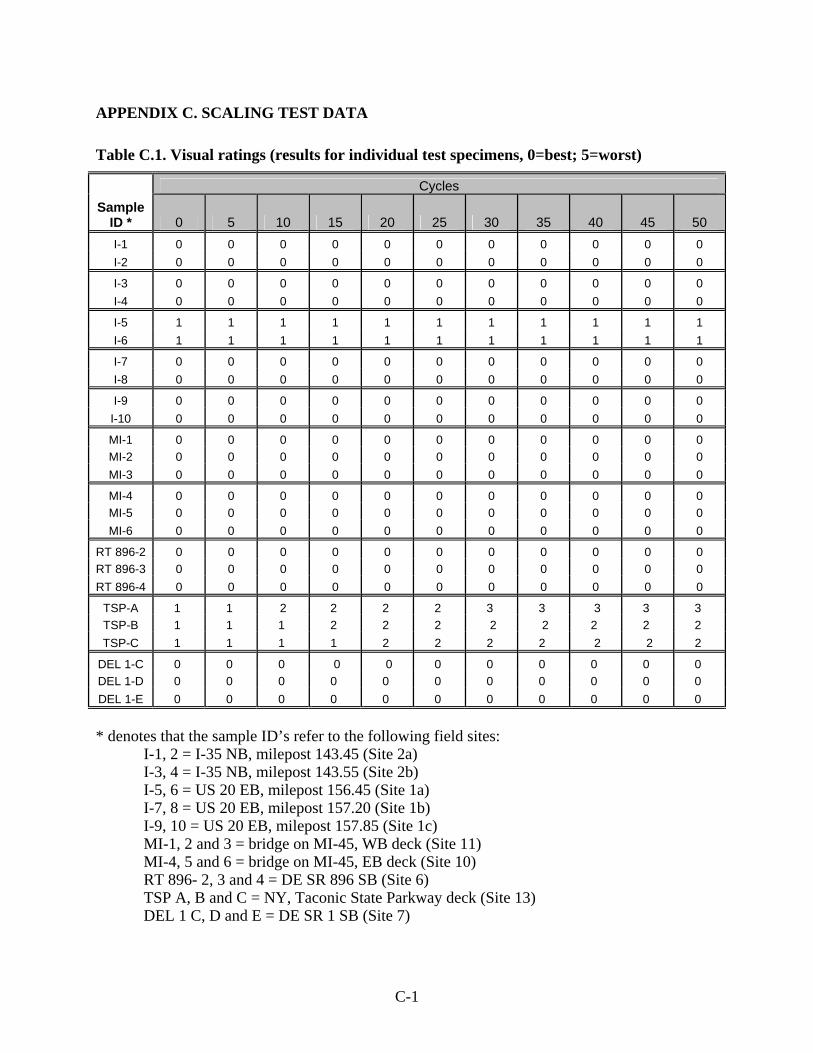
APPENDIX C. SCALING TEST DATA
Table C.1. Visual ratings (results for individual test specimens, 0=best; 5=worst)
Cycles Sample
ID * 0 5 10 15 20 25 30 35 40 45 50 I-1 0 0 0 0 0 0 0 0 0 0 0 I-2 0 0 0 0 0 0 0 0 0 0 0
I-3 0 0 0 0 0 0 0 0 0 0 0 I-4 0 0 0 0 0 0 0 0 0 0 0
I-5 1 1 1 1 1 1 1 1 1 1 1 I-6 1 1 1 1 1 1 1 1 1 1 1
I-7 0 0 0 0 0 0 0 0 0 0 0 I-8 0 0 0 0 0 0 0 0 0 0 0
I-9 0 0 0 0 0 0 0 0 0 0 0 I-10 0 0 0 0 0 0 0 0 0 0 0
MI-1 0 0 0 0 0 0 0 0 0 0 0 MI-2 0 0 0 0 0 0 0 0 0 0 0 MI-3 0 0 0 0 0 0 0 0 0 0 0
MI-4 0 0 0 0 0 0 0 0 0 0 0 MI-5 0 0 0 0 0 0 0 0 0 0 0 MI-6 0 0 0 0 0 0 0 0 0 0 0
RT 896-2 0 0 0 0 0 0 0 0 0 0 0 RT 896-3 0 0 0 0 0 0 0 0 0 0 0 RT 896-4 0 0 0 0 0 0 0 0 0 0 0
TSP-A 1 1 2 2 2 2 3 3 3 3 3 TSP-B 1 1 1 2 2 2 2 2 2 2 2 TSP-C 1 1 1 1 2 2 2 2 2 2 2
DEL 1-C 0 0 0 0 0 0 0 0 0 0 0 DEL 1-D 0 0 0 0 0 0 0 0 0 0 0 DEL 1-E 0 0 0 0 0 0 0 0 0 0 0
* denotes that the sample ID’s refer to the following field sites: I-1, 2 = I-35 NB, milepost 143.45 (Site 2a) I-3, 4 = I-35 NB, milepost 143.55 (Site 2b) I-5, 6 = US 20 EB, milepost 156.45 (Site 1a) I-7, 8 = US 20 EB, milepost 157.20 (Site 1b) I-9, 10 = US 20 EB, milepost 157.85 (Site 1c) MI-1, 2 and 3 = bridge on MI-45, WB deck (Site 11) MI-4, 5 and 6 = bridge on MI-45, EB deck (Site 10) RT 896- 2, 3 and 4 = DE SR 896 SB (Site 6) TSP A, B and C = NY, Taconic State Parkway deck (Site 13) DEL 1 C, D and E = DE SR 1 SB (Site 7)
C-1
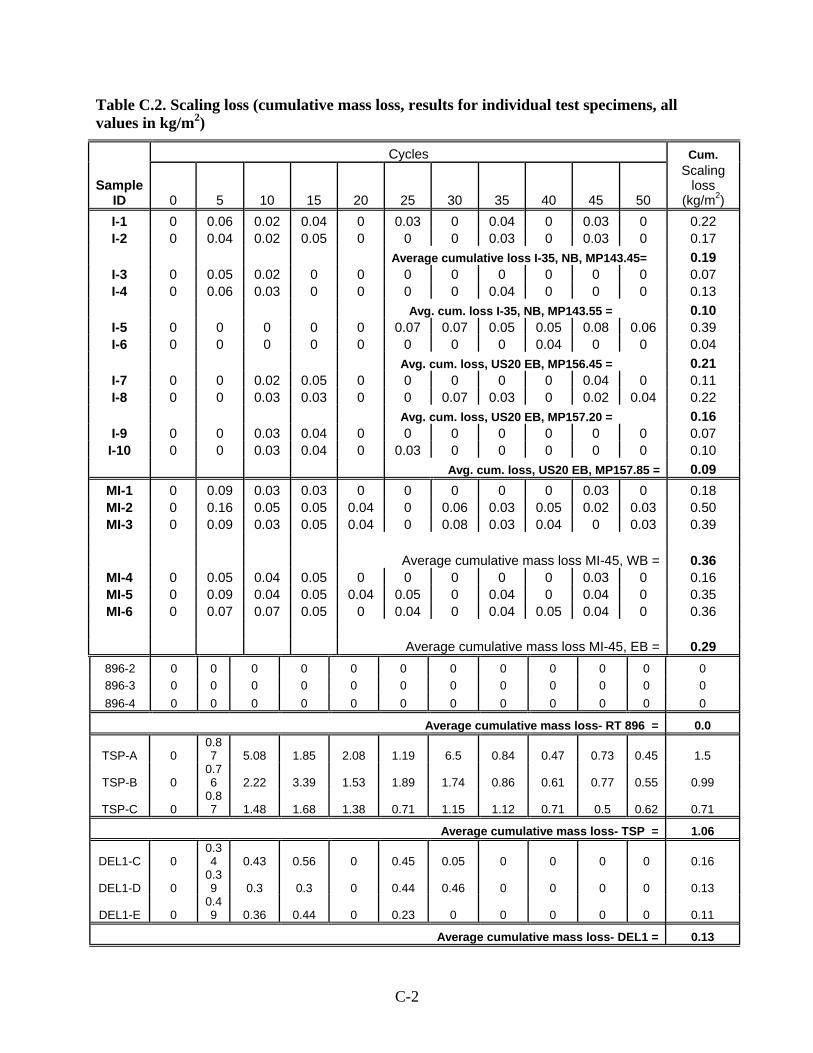
C-2
Table C.2. Scaling loss (cumulative mass loss, results for individual test specimens, all values in kg/m2)
Cycles Cum.
Sample ID 0 5 10 15 20 25 30 35 40 45 50
Scaling loss
(kg/m2) I-1 0 0.06 0.02 0.04 0 0.03 0 0.04 0 0.03 0 0.22 I-2 0 0.04 0.02 0.05 0 0 0 0.03 0 0.03 0 0.17
Average cumulative loss I-35, NB, MP143.45= 0.19 I-3 0 0.05 0.02 0 0 0 0 0 0 0 0 0.07 I-4 0 0.06 0.03 0 0 0 0 0.04 0 0 0 0.13
Avg. cum. loss I-35, NB, MP143.55 = 0.10 I-5 0 0 0 0 0 0.07 0.07 0.05 0.05 0.08 0.06 0.39 I-6 0 0 0 0 0 0 0 0 0.04 0 0 0.04
Avg. cum. loss, US20 EB, MP156.45 = 0.21 I-7 0 0 0.02 0.05 0 0 0 0 0 0.04 0 0.11 I-8 0 0 0.03 0.03 0 0 0.07 0.03 0 0.02 0.04 0.22
Avg. cum. loss, US20 EB, MP157.20 = 0.16 I-9 0 0 0.03 0.04 0 0 0 0 0 0 0 0.07 I-10 0 0 0.03 0.04 0 0.03 0 0 0 0 0 0.10
Avg. cum. loss, US20 EB, MP157.85 = 0.09 MI-1 0 0.09 0.03 0.03 0 0 0 0 0 0.03 0 0.18 MI-2 0 0.16 0.05 0.05 0.04 0 0.06 0.03 0.05 0.02 0.03 0.50 MI-3 0 0.09 0.03 0.05 0.04 0 0.08 0.03 0.04 0 0.03 0.39
Average cumulative mass loss MI-45, WB = 0.36
MI-4 0 0.05 0.04 0.05 0 0 0 0 0 0.03 0 0.16 MI-5 0 0.09 0.04 0.05 0.04 0.05 0 0.04 0 0.04 0 0.35 MI-6 0 0.07 0.07 0.05 0 0.04 0 0.04 0.05 0.04 0 0.36
Average cumulative mass loss MI-45, EB = 0.29
896-2 0 0 0 0 0 0 0 0 0 0 0 0 896-3 0 0 0 0 0 0 0 0 0 0 0 0 896-4 0 0 0 0 0 0 0 0 0 0 0 0
Average cumulative mass loss- RT 896 = 0.0
TSP-A 0 0.87 5.08 1.85 2.08 1.19 6.5 0.84 0.47 0.73 0.45 1.5
TSP-B 0 0.76 2.22 3.39 1.53 1.89 1.74 0.86 0.61 0.77 0.55 0.99
TSP-C 0 0.87 1.48 1.68 1.38 0.71 1.15 1.12 0.71 0.5 0.62 0.71
Average cumulative mass loss- TSP = 1.06
DEL1-C 0 0.34 0.43 0.56 0 0.45 0.05 0 0 0 0 0.16
DEL1-D 0 0.39 0.3 0.3 0 0.44 0.46 0 0 0 0 0.13
DEL1-E 0 0.49 0.36 0.44 0 0.23 0 0 0 0 0 0.11
Average cumulative mass loss- DEL1 = 0.13
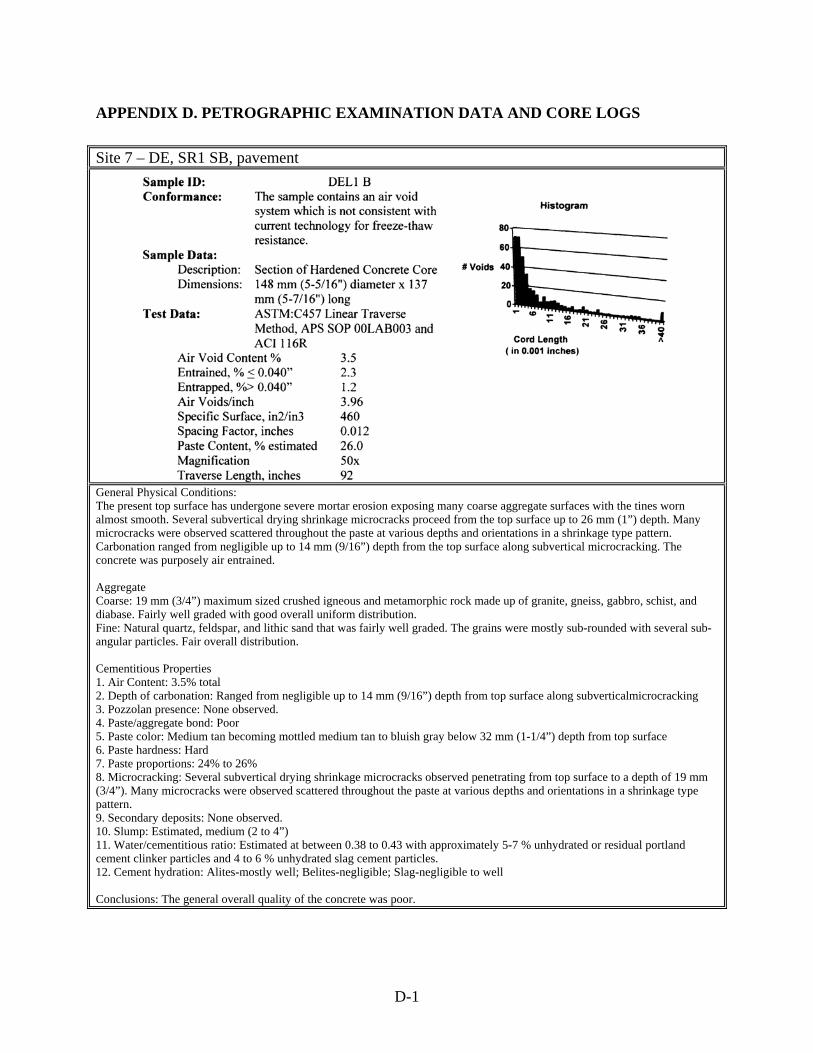
APPENDIX D. PETROGRAPHIC EXAMINATION DATA AND CORE LOGS
Site 7 – DE, SR1 SB, pavement
General Physical Conditions: The present top surface has undergone severe mortar erosion exposing many coarse aggregate surfaces with the tines worn almost smooth. Several subvertical drying shrinkage microcracks proceed from the top surface up to 26 mm (1”) depth. Many microcracks were observed scattered throughout the paste at various depths and orientations in a shrinkage type pattern. Carbonation ranged from negligible up to 14 mm (9/16”) depth from the top surface along subvertical microcracking. The concrete was purposely air entrained. Aggregate Coarse: 19 mm (3/4”) maximum sized crushed igneous and metamorphic rock made up of granite, gneiss, gabbro, schist, and diabase. Fairly well graded with good overall uniform distribution. Fine: Natural quartz, feldspar, and lithic sand that was fairly well graded. The grains were mostly sub-rounded with several sub-angular particles. Fair overall distribution. Cementitious Properties 1. Air Content: 3.5% total 2. Depth of carbonation: Ranged from negligible up to 14 mm (9/16”) depth from top surface along subverticalmicrocracking 3. Pozzolan presence: None observed. 4. Paste/aggregate bond: Poor 5. Paste color: Medium tan becoming mottled medium tan to bluish gray below 32 mm (1-1/4”) depth from top surface 6. Paste hardness: Hard 7. Paste proportions: 24% to 26% 8. Microcracking: Several subvertical drying shrinkage microcracks observed penetrating from top surface to a depth of 19 mm (3/4”). Many microcracks were observed scattered throughout the paste at various depths and orientations in a shrinkage type pattern. 9. Secondary deposits: None observed. 10. Slump: Estimated, medium (2 to 4”) 11. Water/cementitious ratio: Estimated at between 0.38 to 0.43 with approximately 5-7 % unhydrated or residual portland cement clinker particles and 4 to 6 % unhydrated slag cement particles. 12. Cement hydration: Alites-mostly well; Belites-negligible; Slag-negligible to well Conclusions: The general overall quality of the concrete was poor.
D-1
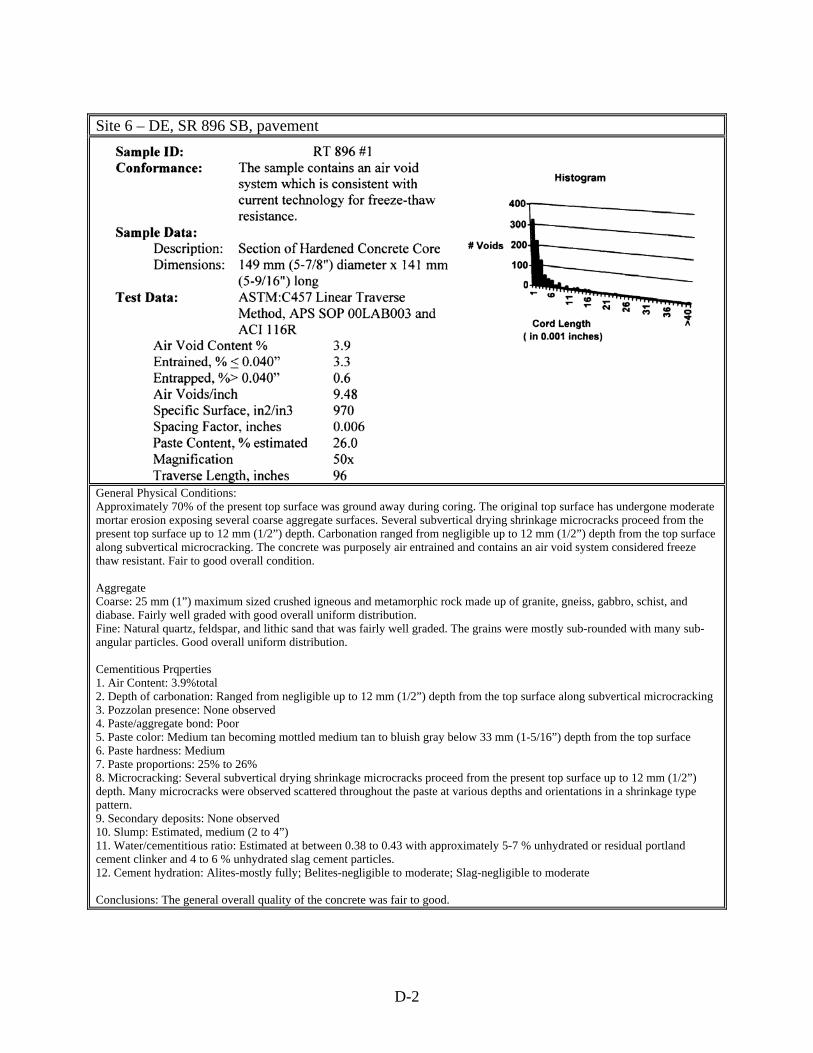
Site 6 – DE, SR 896 SB, pavement
General Physical Conditions: Approximately 70% of the present top surface was ground away during coring. The original top surface has undergone moderate mortar erosion exposing several coarse aggregate surfaces. Several subvertical drying shrinkage microcracks proceed from the present top surface up to 12 mm (1/2”) depth. Carbonation ranged from negligible up to 12 mm (1/2”) depth from the top surface along subvertical microcracking. The concrete was purposely air entrained and contains an air void system considered freeze thaw resistant. Fair to good overall condition. Aggregate Coarse: 25 mm (1”) maximum sized crushed igneous and metamorphic rock made up of granite, gneiss, gabbro, schist, and diabase. Fairly well graded with good overall uniform distribution. Fine: Natural quartz, feldspar, and lithic sand that was fairly well graded. The grains were mostly sub-rounded with many sub-angular particles. Good overall uniform distribution. Cementitious Prqperties 1. Air Content: 3.9%total 2. Depth of carbonation: Ranged from negligible up to 12 mm (1/2”) depth from the top surface along subvertical microcracking 3. Pozzolan presence: None observed 4. Paste/aggregate bond: Poor 5. Paste color: Medium tan becoming mottled medium tan to bluish gray below 33 mm (1-5/16”) depth from the top surface 6. Paste hardness: Medium 7. Paste proportions: 25% to 26% 8. Microcracking: Several subvertical drying shrinkage microcracks proceed from the present top surface up to 12 mm (1/2”) depth. Many microcracks were observed scattered throughout the paste at various depths and orientations in a shrinkage type pattern. 9. Secondary deposits: None observed 10. Slump: Estimated, medium (2 to 4”) 11. Water/cementitious ratio: Estimated at between 0.38 to 0.43 with approximately 5-7 % unhydrated or residual portland cement clinker and 4 to 6 % unhydrated slag cement particles. 12. Cement hydration: Alites-mostly fully; Belites-negligible to moderate; Slag-negligible to moderate Conclusions: The general overall quality of the concrete was fair to good.
D-2
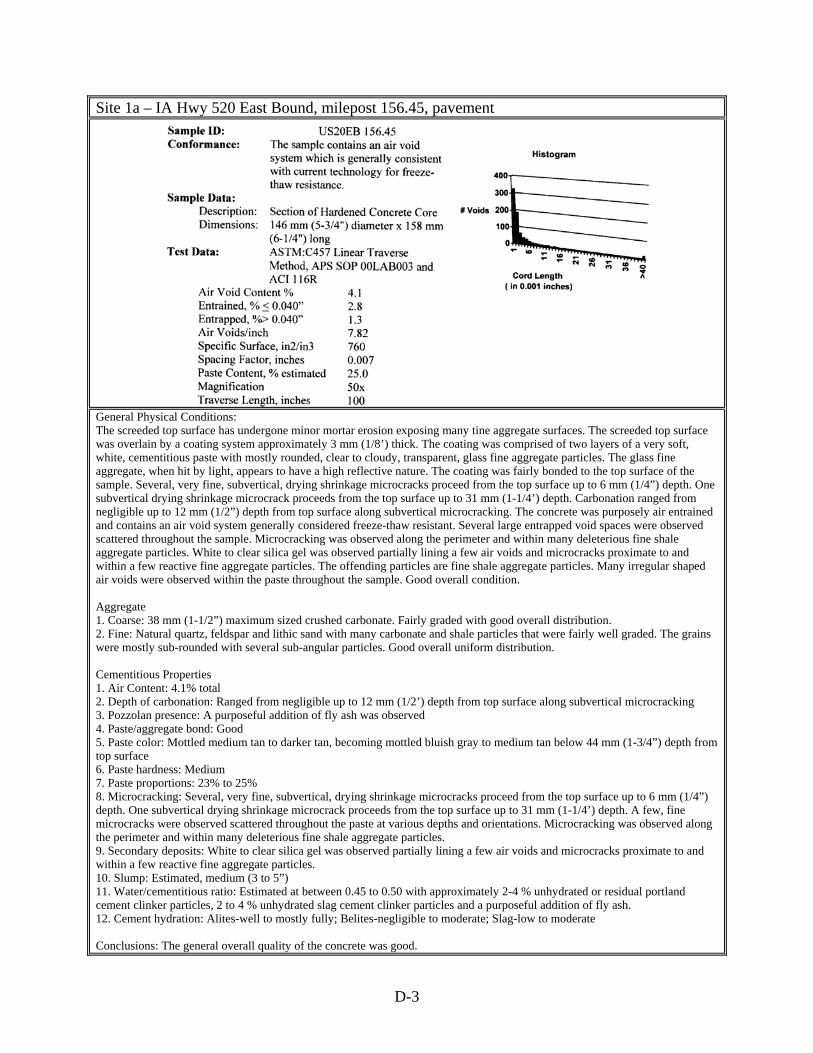
Site 1a – IA Hwy 520 East Bound, milepost 156.45, pavement
General Physical Conditions: The screeded top surface has undergone minor mortar erosion exposing many tine aggregate surfaces. The screeded top surface was overlain by a coating system approximately 3 mm (1/8’) thick. The coating was comprised of two layers of a very soft, white, cementitious paste with mostly rounded, clear to cloudy, transparent, glass fine aggregate particles. The glass fine aggregate, when hit by light, appears to have a high reflective nature. The coating was fairly bonded to the top surface of the sample. Several, very fine, subvertical, drying shrinkage microcracks proceed from the top surface up to 6 mm (1/4”) depth. One subvertical drying shrinkage microcrack proceeds from the top surface up to 31 mm (1-1/4’) depth. Carbonation ranged from negligible up to 12 mm (1/2”) depth from top surface along subvertical microcracking. The concrete was purposely air entrained and contains an air void system generally considered freeze-thaw resistant. Several large entrapped void spaces were observed scattered throughout the sample. Microcracking was observed along the perimeter and within many deleterious fine shale aggregate particles. White to clear silica gel was observed partially lining a few air voids and microcracks proximate to and within a few reactive fine aggregate particles. The offending particles are fine shale aggregate particles. Many irregular shaped air voids were observed within the paste throughout the sample. Good overall condition. Aggregate 1. Coarse: 38 mm (1-1/2”) maximum sized crushed carbonate. Fairly graded with good overall distribution. 2. Fine: Natural quartz, feldspar and lithic sand with many carbonate and shale particles that were fairly well graded. The grains were mostly sub-rounded with several sub-angular particles. Good overall uniform distribution. Cementitious Properties 1. Air Content: 4.1% total 2. Depth of carbonation: Ranged from negligible up to 12 mm (1/2’) depth from top surface along subvertical microcracking 3. Pozzolan presence: A purposeful addition of fly ash was observed 4. Paste/aggregate bond: Good 5. Paste color: Mottled medium tan to darker tan, becoming mottled bluish gray to medium tan below 44 mm (1-3/4”) depth from top surface 6. Paste hardness: Medium 7. Paste proportions: 23% to 25% 8. Microcracking: Several, very fine, subvertical, drying shrinkage microcracks proceed from the top surface up to 6 mm (1/4”) depth. One subvertical drying shrinkage microcrack proceeds from the top surface up to 31 mm (1-1/4’) depth. A few, fine microcracks were observed scattered throughout the paste at various depths and orientations. Microcracking was observed along the perimeter and within many deleterious fine shale aggregate particles. 9. Secondary deposits: White to clear silica gel was observed partially lining a few air voids and microcracks proximate to and within a few reactive fine aggregate particles. 10. Slump: Estimated, medium (3 to 5”) 11. Water/cementitious ratio: Estimated at between 0.45 to 0.50 with approximately 2-4 % unhydrated or residual portland cement clinker particles, 2 to 4 % unhydrated slag cement clinker particles and a purposeful addition of fly ash. 12. Cement hydration: Alites-well to mostly fully; Belites-negligible to moderate; Slag-low to moderate Conclusions: The general overall quality of the concrete was good.
D-3
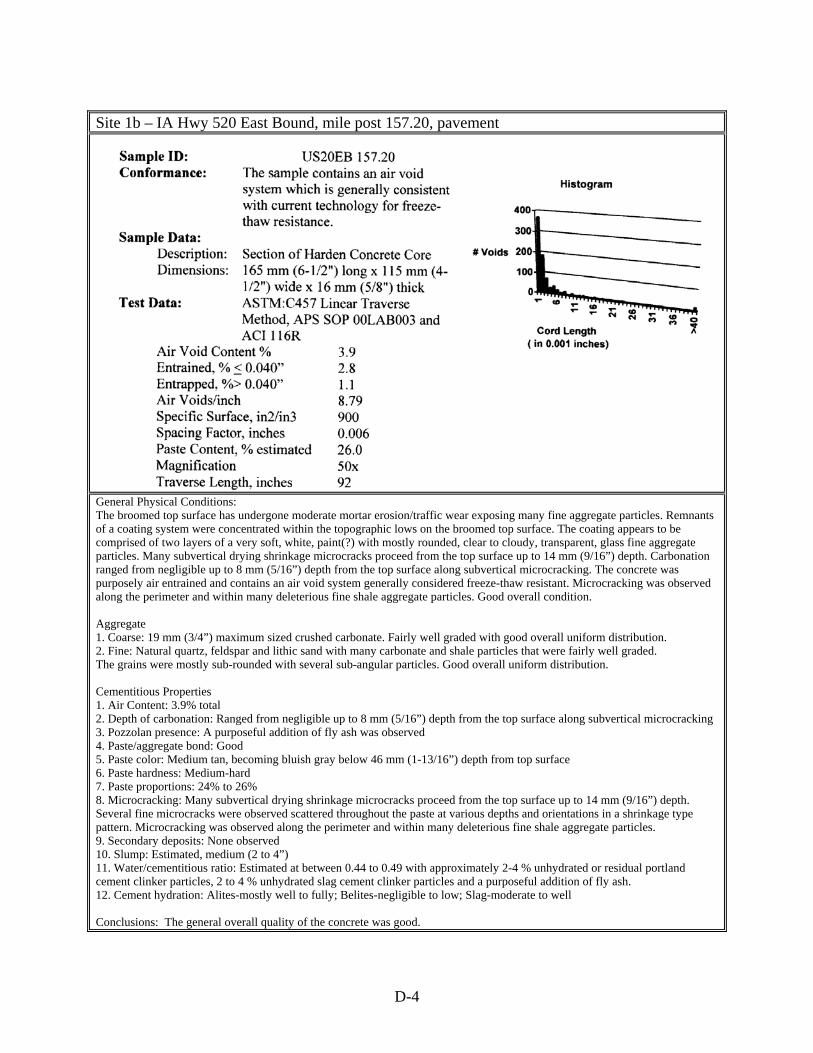
Site 1b – IA Hwy 520 East Bound, mile post 157.20, pavement
General Physical Conditions: The broomed top surface has undergone moderate mortar erosion/traffic wear exposing many fine aggregate particles. Remnants of a coating system were concentrated within the topographic lows on the broomed top surface. The coating appears to be comprised of two layers of a very soft, white, paint(?) with mostly rounded, clear to cloudy, transparent, glass fine aggregate particles. Many subvertical drying shrinkage microcracks proceed from the top surface up to 14 mm (9/16”) depth. Carbonation ranged from negligible up to 8 mm (5/16”) depth from the top surface along subvertical microcracking. The concrete was purposely air entrained and contains an air void system generally considered freeze-thaw resistant. Microcracking was observed along the perimeter and within many deleterious fine shale aggregate particles. Good overall condition. Aggregate 1. Coarse: 19 mm (3/4”) maximum sized crushed carbonate. Fairly well graded with good overall uniform distribution. 2. Fine: Natural quartz, feldspar and lithic sand with many carbonate and shale particles that were fairly well graded. The grains were mostly sub-rounded with several sub-angular particles. Good overall uniform distribution. Cementitious Properties 1. Air Content: 3.9% total 2. Depth of carbonation: Ranged from negligible up to 8 mm (5/16”) depth from the top surface along subvertical microcracking 3. Pozzolan presence: A purposeful addition of fly ash was observed 4. Paste/aggregate bond: Good 5. Paste color: Medium tan, becoming bluish gray below 46 mm (1-13/16”) depth from top surface 6. Paste hardness: Medium-hard 7. Paste proportions: 24% to 26% 8. Microcracking: Many subvertical drying shrinkage microcracks proceed from the top surface up to 14 mm (9/16”) depth. Several fine microcracks were observed scattered throughout the paste at various depths and orientations in a shrinkage type pattern. Microcracking was observed along the perimeter and within many deleterious fine shale aggregate particles. 9. Secondary deposits: None observed 10. Slump: Estimated, medium (2 to 4”) 11. Water/cementitious ratio: Estimated at between 0.44 to 0.49 with approximately 2-4 % unhydrated or residual portland cement clinker particles, 2 to 4 % unhydrated slag cement clinker particles and a purposeful addition of fly ash. 12. Cement hydration: Alites-mostly well to fully; Belites-negligible to low; Slag-moderate to well Conclusions: The general overall quality of the concrete was good.
D-4
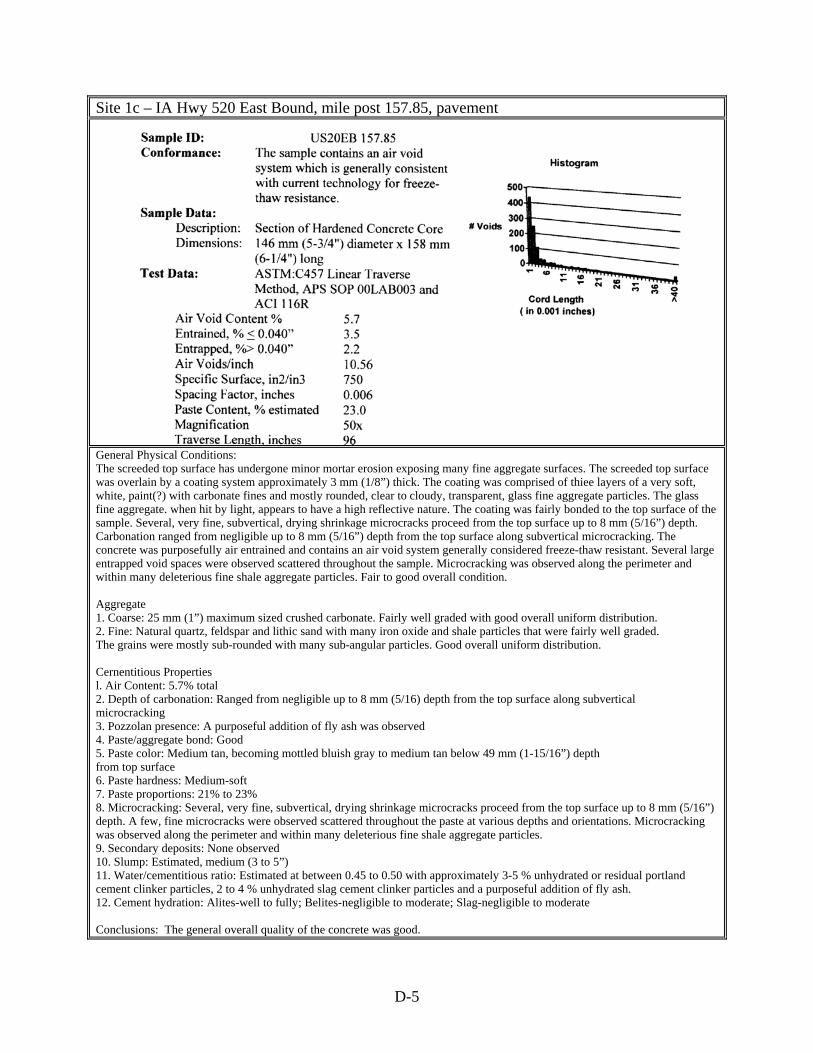
Site 1c – IA Hwy 520 East Bound, mile post 157.85, pavement
General Physical Conditions: The screeded top surface has undergone minor mortar erosion exposing many fine aggregate surfaces. The screeded top surface was overlain by a coating system approximately 3 mm (1/8”) thick. The coating was comprised of thiee layers of a very soft, white, paint(?) with carbonate fines and mostly rounded, clear to cloudy, transparent, glass fine aggregate particles. The glass fine aggregate. when hit by light, appears to have a high reflective nature. The coating was fairly bonded to the top surface of the sample. Several, very fine, subvertical, drying shrinkage microcracks proceed from the top surface up to 8 mm (5/16”) depth. Carbonation ranged from negligible up to 8 mm (5/16”) depth from the top surface along subvertical microcracking. The concrete was purposefully air entrained and contains an air void system generally considered freeze-thaw resistant. Several large entrapped void spaces were observed scattered throughout the sample. Microcracking was observed along the perimeter and within many deleterious fine shale aggregate particles. Fair to good overall condition. Aggregate 1. Coarse: 25 mm (1”) maximum sized crushed carbonate. Fairly well graded with good overall uniform distribution. 2. Fine: Natural quartz, feldspar and lithic sand with many iron oxide and shale particles that were fairly well graded. The grains were mostly sub-rounded with many sub-angular particles. Good overall uniform distribution. Cernentitious Properties l. Air Content: 5.7% total 2. Depth of carbonation: Ranged from negligible up to 8 mm (5/16) depth from the top surface along subvertical microcracking 3. Pozzolan presence: A purposeful addition of fly ash was observed 4. Paste/aggregate bond: Good 5. Paste color: Medium tan, becoming mottled bluish gray to medium tan below 49 mm (1-15/16”) depth from top surface 6. Paste hardness: Medium-soft 7. Paste proportions: 21% to 23% 8. Microcracking: Several, very fine, subvertical, drying shrinkage microcracks proceed from the top surface up to 8 mm (5/16”) depth. A few, fine microcracks were observed scattered throughout the paste at various depths and orientations. Microcracking was observed along the perimeter and within many deleterious fine shale aggregate particles. 9. Secondary deposits: None observed 10. Slump: Estimated, medium (3 to 5”) 11. Water/cementitious ratio: Estimated at between 0.45 to 0.50 with approximately 3-5 % unhydrated or residual portland cement clinker particles, 2 to 4 % unhydrated slag cement clinker particles and a purposeful addition of fly ash. 12. Cement hydration: Alites-well to fully; Belites-negligible to moderate; Slag-negligible to moderate Conclusions: The general overall quality of the concrete was good.
D-5
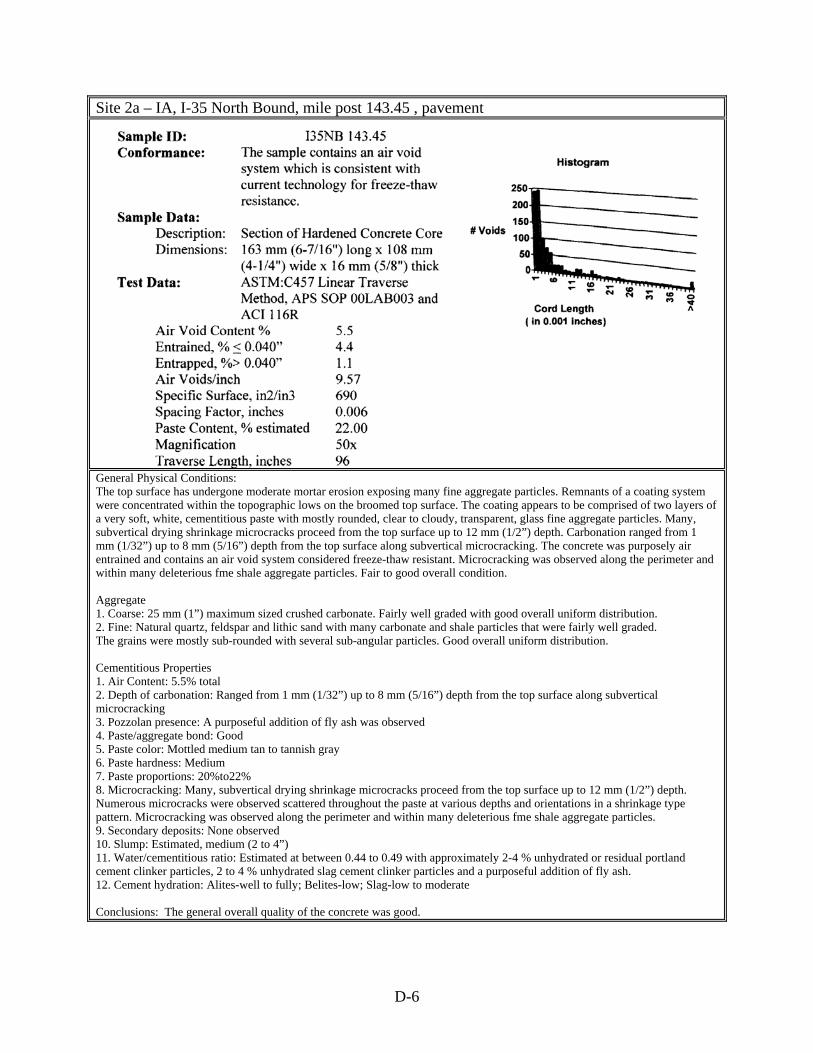
Site 2a – IA, I-35 North Bound, mile post 143.45 , pavement
General Physical Conditions: The top surface has undergone moderate mortar erosion exposing many fine aggregate particles. Remnants of a coating system were concentrated within the topographic lows on the broomed top surface. The coating appears to be comprised of two layers of a very soft, white, cementitious paste with mostly rounded, clear to cloudy, transparent, glass fine aggregate particles. Many, subvertical drying shrinkage microcracks proceed from the top surface up to 12 mm (1/2”) depth. Carbonation ranged from 1 mm (1/32”) up to 8 mm (5/16”) depth from the top surface along subvertical microcracking. The concrete was purposely air entrained and contains an air void system considered freeze-thaw resistant. Microcracking was observed along the perimeter and within many deleterious fme shale aggregate particles. Fair to good overall condition. Aggregate 1. Coarse: 25 mm (1”) maximum sized crushed carbonate. Fairly well graded with good overall uniform distribution. 2. Fine: Natural quartz, feldspar and lithic sand with many carbonate and shale particles that were fairly well graded. The grains were mostly sub-rounded with several sub-angular particles. Good overall uniform distribution. Cementitious Properties 1. Air Content: 5.5% total 2. Depth of carbonation: Ranged from 1 mm (1/32”) up to 8 mm (5/16”) depth from the top surface along subvertical microcracking 3. Pozzolan presence: A purposeful addition of fly ash was observed 4. Paste/aggregate bond: Good 5. Paste color: Mottled medium tan to tannish gray 6. Paste hardness: Medium 7. Paste proportions: 20%to22% 8. Microcracking: Many, subvertical drying shrinkage microcracks proceed from the top surface up to 12 mm (1/2”) depth. Numerous microcracks were observed scattered throughout the paste at various depths and orientations in a shrinkage type pattern. Microcracking was observed along the perimeter and within many deleterious fme shale aggregate particles. 9. Secondary deposits: None observed 10. Slump: Estimated, medium (2 to 4”) 11. Water/cementitious ratio: Estimated at between 0.44 to 0.49 with approximately 2-4 % unhydrated or residual portland cement clinker particles, 2 to 4 % unhydrated slag cement clinker particles and a purposeful addition of fly ash. 12. Cement hydration: Alites-well to fully; Belites-low; Slag-low to moderate Conclusions: The general overall quality of the concrete was good.
D-6
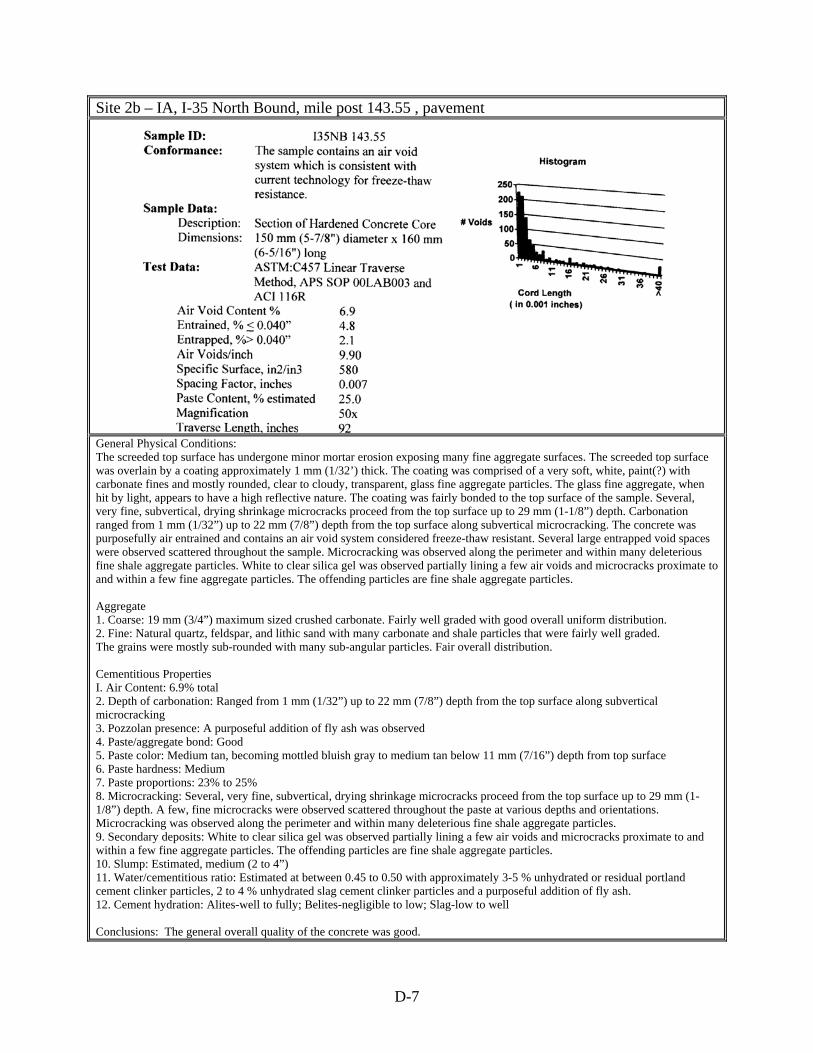
Site 2b – IA, I-35 North Bound, mile post 143.55 , pavement
General Physical Conditions: The screeded top surface has undergone minor mortar erosion exposing many fine aggregate surfaces. The screeded top surface was overlain by a coating approximately 1 mm (1/32’) thick. The coating was comprised of a very soft, white, paint(?) with carbonate fines and mostly rounded, clear to cloudy, transparent, glass fine aggregate particles. The glass fine aggregate, when hit by light, appears to have a high reflective nature. The coating was fairly bonded to the top surface of the sample. Several, very fine, subvertical, drying shrinkage microcracks proceed from the top surface up to 29 mm (1-1/8”) depth. Carbonation ranged from 1 mm (1/32”) up to 22 mm (7/8”) depth from the top surface along subvertical microcracking. The concrete was purposefully air entrained and contains an air void system considered freeze-thaw resistant. Several large entrapped void spaces were observed scattered throughout the sample. Microcracking was observed along the perimeter and within many deleterious fine shale aggregate particles. White to clear silica gel was observed partially lining a few air voids and microcracks proximate to and within a few fine aggregate particles. The offending particles are fine shale aggregate particles. Aggregate 1. Coarse: 19 mm (3/4”) maximum sized crushed carbonate. Fairly well graded with good overall uniform distribution. 2. Fine: Natural quartz, feldspar, and lithic sand with many carbonate and shale particles that were fairly well graded. The grains were mostly sub-rounded with many sub-angular particles. Fair overall distribution. Cementitious Properties I. Air Content: 6.9% total 2. Depth of carbonation: Ranged from 1 mm (1/32”) up to 22 mm (7/8”) depth from the top surface along subvertical microcracking 3. Pozzolan presence: A purposeful addition of fly ash was observed 4. Paste/aggregate bond: Good 5. Paste color: Medium tan, becoming mottled bluish gray to medium tan below 11 mm (7/16”) depth from top surface 6. Paste hardness: Medium 7. Paste proportions: 23% to 25% 8. Microcracking: Several, very fine, subvertical, drying shrinkage microcracks proceed from the top surface up to 29 mm (1-1/8”) depth. A few, fine microcracks were observed scattered throughout the paste at various depths and orientations. Microcracking was observed along the perimeter and within many deleterious fine shale aggregate particles. 9. Secondary deposits: White to clear silica gel was observed partially lining a few air voids and microcracks proximate to and within a few fine aggregate particles. The offending particles are fine shale aggregate particles. 10. Slump: Estimated, medium (2 to 4”) 11. Water/cementitious ratio: Estimated at between 0.45 to 0.50 with approximately 3-5 % unhydrated or residual portland cement clinker particles, 2 to 4 % unhydrated slag cement clinker particles and a purposeful addition of fly ash. 12. Cement hydration: Alites-well to fully; Belites-negligible to low; Slag-low to well Conclusions: The general overall quality of the concrete was good.
D-7
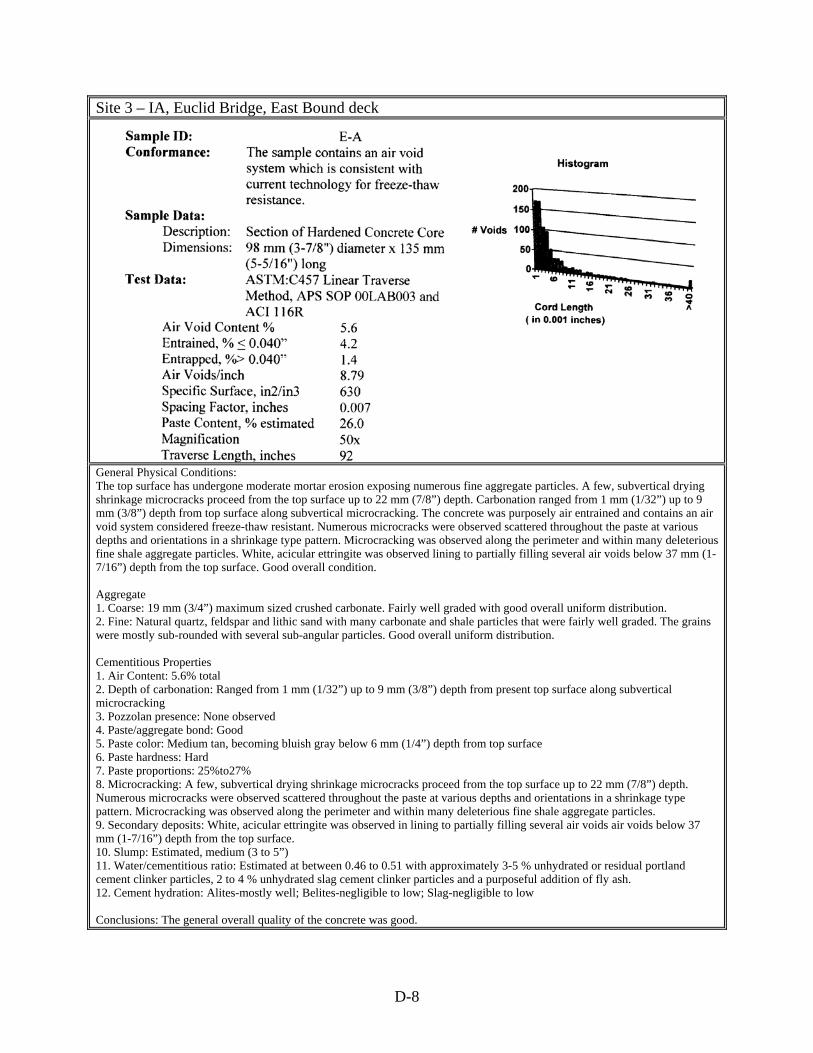
Site 3 – IA, Euclid Bridge, East Bound deck
General Physical Conditions: The top surface has undergone moderate mortar erosion exposing numerous fine aggregate particles. A few, subvertical drying shrinkage microcracks proceed from the top surface up to 22 mm (7/8”) depth. Carbonation ranged from 1 mm (1/32”) up to 9 mm (3/8”) depth from top surface along subvertical microcracking. The concrete was purposely air entrained and contains an air void system considered freeze-thaw resistant. Numerous microcracks were observed scattered throughout the paste at various depths and orientations in a shrinkage type pattern. Microcracking was observed along the perimeter and within many deleterious fine shale aggregate particles. White, acicular ettringite was observed lining to partially filling several air voids below 37 mm (1- 7/16”) depth from the top surface. Good overall condition. Aggregate 1. Coarse: 19 mm (3/4”) maximum sized crushed carbonate. Fairly well graded with good overall uniform distribution. 2. Fine: Natural quartz, feldspar and lithic sand with many carbonate and shale particles that were fairly well graded. The grains were mostly sub-rounded with several sub-angular particles. Good overall uniform distribution. Cementitious Properties 1. Air Content: 5.6% total 2. Depth of carbonation: Ranged from 1 mm (1/32”) up to 9 mm (3/8”) depth from present top surface along subvertical microcracking 3. Pozzolan presence: None observed 4. Paste/aggregate bond: Good 5. Paste color: Medium tan, becoming bluish gray below 6 mm (1/4”) depth from top surface 6. Paste hardness: Hard 7. Paste proportions: 25%to27% 8. Microcracking: A few, subvertical drying shrinkage microcracks proceed from the top surface up to 22 mm (7/8”) depth. Numerous microcracks were observed scattered throughout the paste at various depths and orientations in a shrinkage type pattern. Microcracking was observed along the perimeter and within many deleterious fine shale aggregate particles. 9. Secondary deposits: White, acicular ettringite was observed in lining to partially filling several air voids air voids below 37 mm (1-7/16”) depth from the top surface. 10. Slump: Estimated, medium (3 to 5”) 11. Water/cementitious ratio: Estimated at between 0.46 to 0.51 with approximately 3-5 % unhydrated or residual portland cement clinker particles, 2 to 4 % unhydrated slag cement clinker particles and a purposeful addition of fly ash. 12. Cement hydration: Alites-mostly well; Belites-negligible to low; Slag-negligible to low Conclusions: The general overall quality of the concrete was good.
D-8
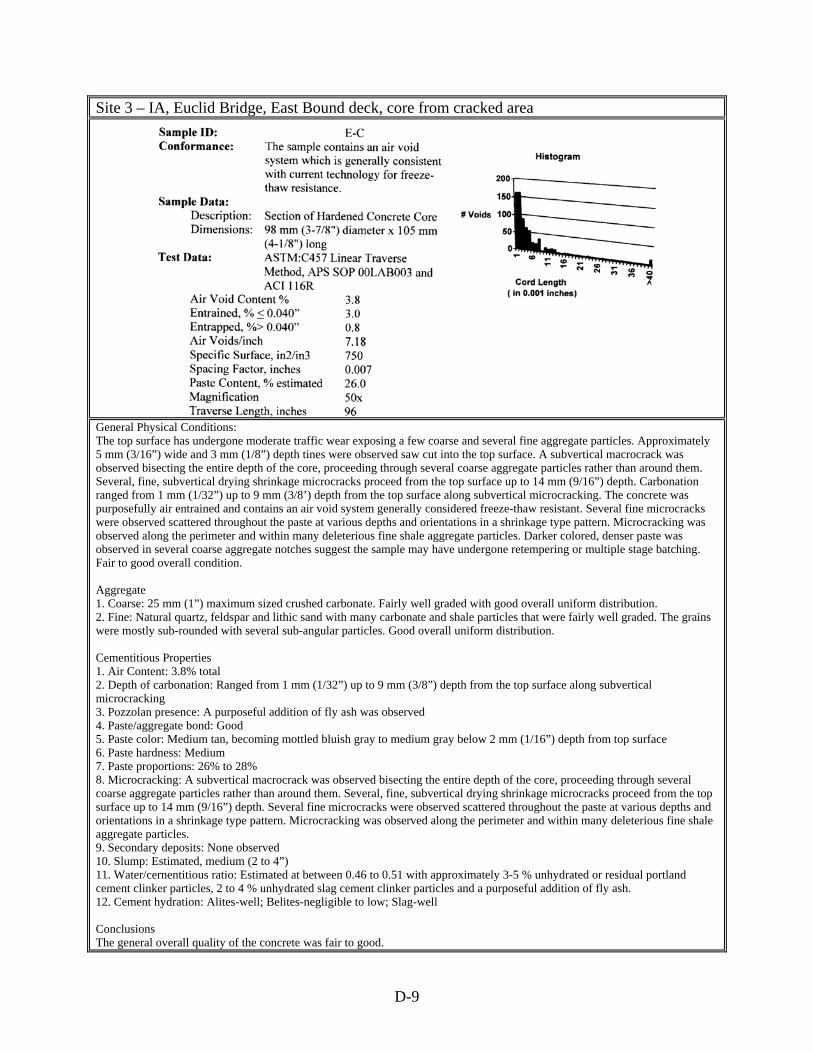
Site 3 – IA, Euclid Bridge, East Bound deck, core from cracked area
General Physical Conditions: The top surface has undergone moderate traffic wear exposing a few coarse and several fine aggregate particles. Approximately 5 mm (3/16”) wide and 3 mm (1/8”) depth tines were observed saw cut into the top surface. A subvertical macrocrack was observed bisecting the entire depth of the core, proceeding through several coarse aggregate particles rather than around them. Several, fine, subvertical drying shrinkage microcracks proceed from the top surface up to 14 mm (9/16”) depth. Carbonation ranged from 1 mm (1/32”) up to 9 mm (3/8’) depth from the top surface along subvertical microcracking. The concrete was purposefully air entrained and contains an air void system generally considered freeze-thaw resistant. Several fine microcracks were observed scattered throughout the paste at various depths and orientations in a shrinkage type pattern. Microcracking was observed along the perimeter and within many deleterious fine shale aggregate particles. Darker colored, denser paste was observed in several coarse aggregate notches suggest the sample may have undergone retempering or multiple stage batching. Fair to good overall condition. Aggregate 1. Coarse: 25 mm (1”) maximum sized crushed carbonate. Fairly well graded with good overall uniform distribution. 2. Fine: Natural quartz, feldspar and lithic sand with many carbonate and shale particles that were fairly well graded. The grains were mostly sub-rounded with several sub-angular particles. Good overall uniform distribution. Cementitious Properties 1. Air Content: 3.8% total 2. Depth of carbonation: Ranged from 1 mm (1/32”) up to 9 mm (3/8”) depth from the top surface along subvertical microcracking 3. Pozzolan presence: A purposeful addition of fly ash was observed 4. Paste/aggregate bond: Good 5. Paste color: Medium tan, becoming mottled bluish gray to medium gray below 2 mm (1/16”) depth from top surface 6. Paste hardness: Medium 7. Paste proportions: 26% to 28% 8. Microcracking: A subvertical macrocrack was observed bisecting the entire depth of the core, proceeding through several coarse aggregate particles rather than around them. Several, fine, subvertical drying shrinkage microcracks proceed from the top surface up to 14 mm (9/16”) depth. Several fine microcracks were observed scattered throughout the paste at various depths and orientations in a shrinkage type pattern. Microcracking was observed along the perimeter and within many deleterious fine shale aggregate particles. 9. Secondary deposits: None observed 10. Slump: Estimated, medium (2 to 4”) 11. Water/cernentitious ratio: Estimated at between 0.46 to 0.51 with approximately 3-5 % unhydrated or residual portland cement clinker particles, 2 to 4 % unhydrated slag cement clinker particles and a purposeful addition of fly ash. 12. Cement hydration: Alites-well; Belites-negligible to low; Slag-well Conclusions The general overall quality of the concrete was fair to good.
D-9
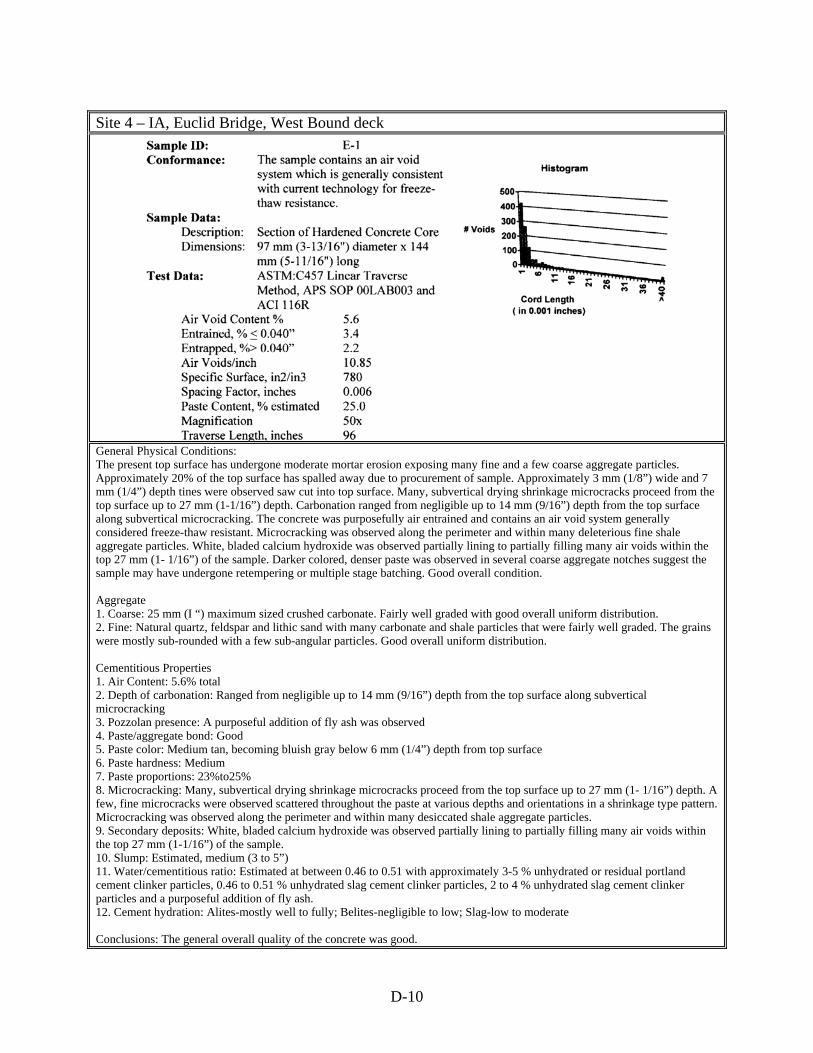
Site 4 – IA, Euclid Bridge, West Bound deck
General Physical Conditions: The present top surface has undergone moderate mortar erosion exposing many fine and a few coarse aggregate particles. Approximately 20% of the top surface has spalled away due to procurement of sample. Approximately 3 mm (1/8”) wide and 7 mm (1/4”) depth tines were observed saw cut into top surface. Many, subvertical drying shrinkage microcracks proceed from the top surface up to 27 mm (1-1/16”) depth. Carbonation ranged from negligible up to 14 mm (9/16”) depth from the top surface along subvertical microcracking. The concrete was purposefully air entrained and contains an air void system generally considered freeze-thaw resistant. Microcracking was observed along the perimeter and within many deleterious fine shale aggregate particles. White, bladed calcium hydroxide was observed partially lining to partially filling many air voids within the top 27 mm (1- 1/16”) of the sample. Darker colored, denser paste was observed in several coarse aggregate notches suggest the sample may have undergone retempering or multiple stage batching. Good overall condition. Aggregate 1. Coarse: 25 mm (I “) maximum sized crushed carbonate. Fairly well graded with good overall uniform distribution. 2. Fine: Natural quartz, feldspar and lithic sand with many carbonate and shale particles that were fairly well graded. The grains were mostly sub-rounded with a few sub-angular particles. Good overall uniform distribution. Cementitious Properties 1. Air Content: 5.6% total 2. Depth of carbonation: Ranged from negligible up to 14 mm (9/16”) depth from the top surface along subvertical microcracking 3. Pozzolan presence: A purposeful addition of fly ash was observed 4. Paste/aggregate bond: Good 5. Paste color: Medium tan, becoming bluish gray below 6 mm (1/4”) depth from top surface 6. Paste hardness: Medium 7. Paste proportions: 23%to25% 8. Microcracking: Many, subvertical drying shrinkage microcracks proceed from the top surface up to 27 mm (1- 1/16”) depth. A few, fine microcracks were observed scattered throughout the paste at various depths and orientations in a shrinkage type pattern. Microcracking was observed along the perimeter and within many desiccated shale aggregate particles. 9. Secondary deposits: White, bladed calcium hydroxide was observed partially lining to partially filling many air voids within the top 27 mm (1-1/16”) of the sample. 10. Slump: Estimated, medium (3 to 5”) 11. Water/cementitious ratio: Estimated at between 0.46 to 0.51 with approximately 3-5 % unhydrated or residual portland cement clinker particles, 0.46 to 0.51 % unhydrated slag cement clinker particles, 2 to 4 % unhydrated slag cement clinker particles and a purposeful addition of fly ash. 12. Cement hydration: Alites-mostly well to fully; Belites-negligible to low; Slag-low to moderate Conclusions: The general overall quality of the concrete was good.
D-10
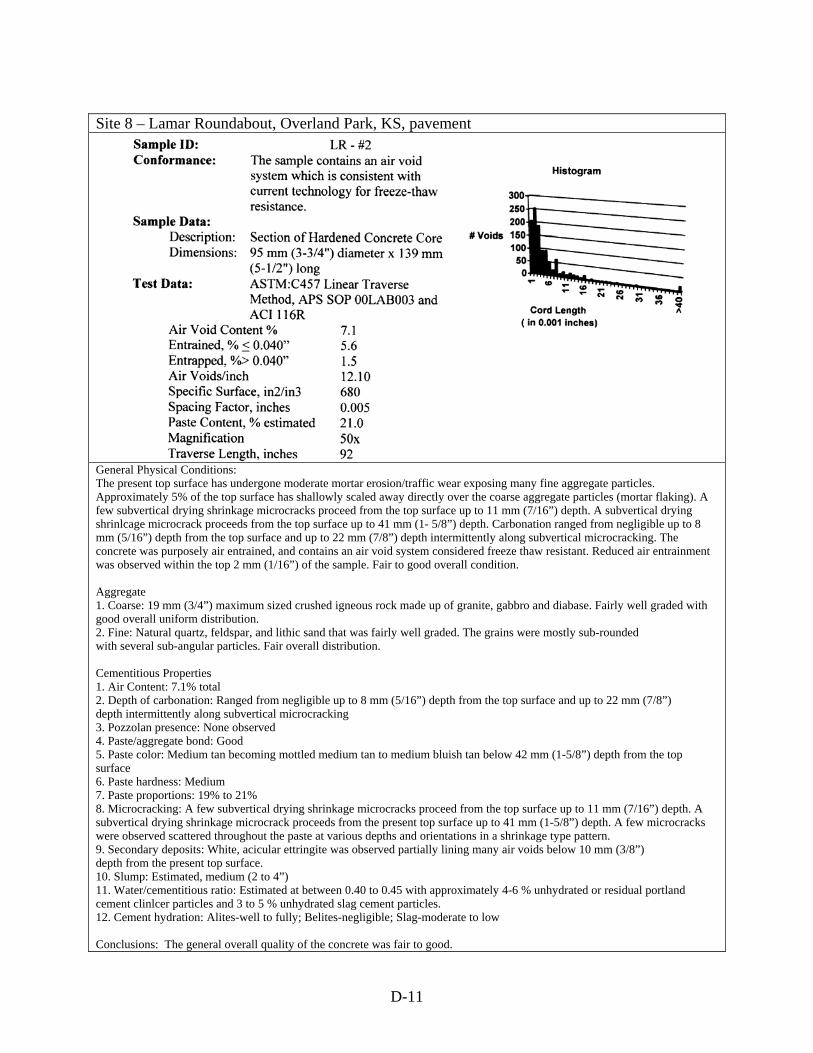
Site 8 – Lamar Roundabout, Overland Park, KS, pavement
General Physical Conditions: The present top surface has undergone moderate mortar erosion/traffic wear exposing many fine aggregate particles. Approximately 5% of the top surface has shallowly scaled away directly over the coarse aggregate particles (mortar flaking). A few subvertical drying shrinkage microcracks proceed from the top surface up to 11 mm (7/16”) depth. A subvertical drying shrinlcage microcrack proceeds from the top surface up to 41 mm (1- 5/8”) depth. Carbonation ranged from negligible up to 8 mm (5/16”) depth from the top surface and up to 22 mm (7/8”) depth intermittently along subvertical microcracking. The concrete was purposely air entrained, and contains an air void system considered freeze thaw resistant. Reduced air entrainment was observed within the top 2 mm (1/16”) of the sample. Fair to good overall condition. Aggregate 1. Coarse: 19 mm (3/4”) maximum sized crushed igneous rock made up of granite, gabbro and diabase. Fairly well graded with good overall uniform distribution. 2. Fine: Natural quartz, feldspar, and lithic sand that was fairly well graded. The grains were mostly sub-rounded with several sub-angular particles. Fair overall distribution. Cementitious Properties 1. Air Content: 7.1% total 2. Depth of carbonation: Ranged from negligible up to 8 mm (5/16”) depth from the top surface and up to 22 mm (7/8”) depth intermittently along subvertical microcracking 3. Pozzolan presence: None observed 4. Paste/aggregate bond: Good 5. Paste color: Medium tan becoming mottled medium tan to medium bluish tan below 42 mm (1-5/8”) depth from the top surface 6. Paste hardness: Medium 7. Paste proportions: 19% to 21% 8. Microcracking: A few subvertical drying shrinkage microcracks proceed from the top surface up to 11 mm (7/16”) depth. A subvertical drying shrinkage microcrack proceeds from the present top surface up to 41 mm (1-5/8”) depth. A few microcracks were observed scattered throughout the paste at various depths and orientations in a shrinkage type pattern. 9. Secondary deposits: White, acicular ettringite was observed partially lining many air voids below 10 mm (3/8”) depth from the present top surface. 10. Slump: Estimated, medium (2 to 4”) 11. Water/cementitious ratio: Estimated at between 0.40 to 0.45 with approximately 4-6 % unhydrated or residual portland cement clinlcer particles and 3 to 5 % unhydrated slag cement particles. 12. Cement hydration: Alites-well to fully; Belites-negligible; Slag-moderate to low Conclusions: The general overall quality of the concrete was fair to good.
D-11
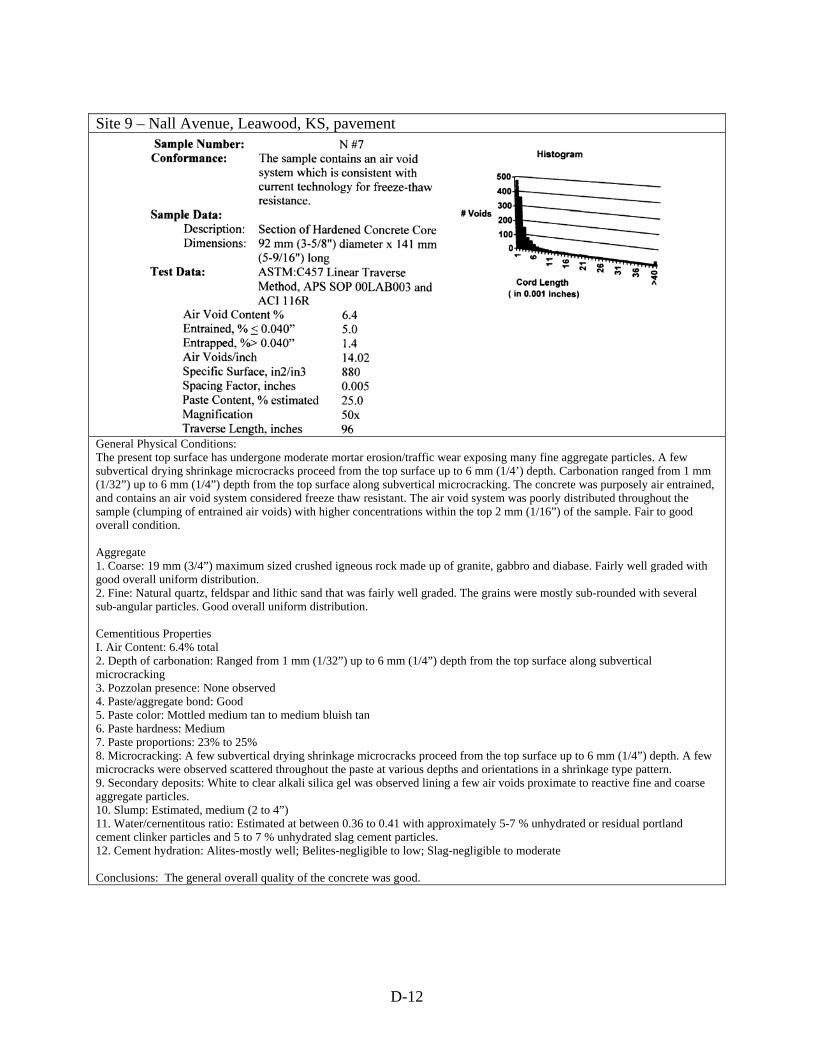
Site 9 – Nall Avenue, Leawood, KS, pavement
General Physical Conditions: The present top surface has undergone moderate mortar erosion/traffic wear exposing many fine aggregate particles. A few subvertical drying shrinkage microcracks proceed from the top surface up to 6 mm (1/4’) depth. Carbonation ranged from 1 mm (1/32”) up to 6 mm (1/4”) depth from the top surface along subvertical microcracking. The concrete was purposely air entrained, and contains an air void system considered freeze thaw resistant. The air void system was poorly distributed throughout the sample (clumping of entrained air voids) with higher concentrations within the top 2 mm (1/16”) of the sample. Fair to good overall condition. Aggregate 1. Coarse: 19 mm (3/4”) maximum sized crushed igneous rock made up of granite, gabbro and diabase. Fairly well graded with good overall uniform distribution. 2. Fine: Natural quartz, feldspar and lithic sand that was fairly well graded. The grains were mostly sub-rounded with several sub-angular particles. Good overall uniform distribution. Cementitious Properties I. Air Content: 6.4% total 2. Depth of carbonation: Ranged from 1 mm (1/32”) up to 6 mm (1/4”) depth from the top surface along subvertical microcracking 3. Pozzolan presence: None observed 4. Paste/aggregate bond: Good 5. Paste color: Mottled medium tan to medium bluish tan 6. Paste hardness: Medium 7. Paste proportions: 23% to 25% 8. Microcracking: A few subvertical drying shrinkage microcracks proceed from the top surface up to 6 mm (1/4”) depth. A few microcracks were observed scattered throughout the paste at various depths and orientations in a shrinkage type pattern. 9. Secondary deposits: White to clear alkali silica gel was observed lining a few air voids proximate to reactive fine and coarse aggregate particles. 10. Slump: Estimated, medium (2 to 4”) 11. Water/cernentitous ratio: Estimated at between 0.36 to 0.41 with approximately 5-7 % unhydrated or residual portland cement clinker particles and 5 to 7 % unhydrated slag cement particles. 12. Cement hydration: Alites-mostly well; Belites-negligible to low; Slag-negligible to moderate Conclusions: The general overall quality of the concrete was good.
D-12
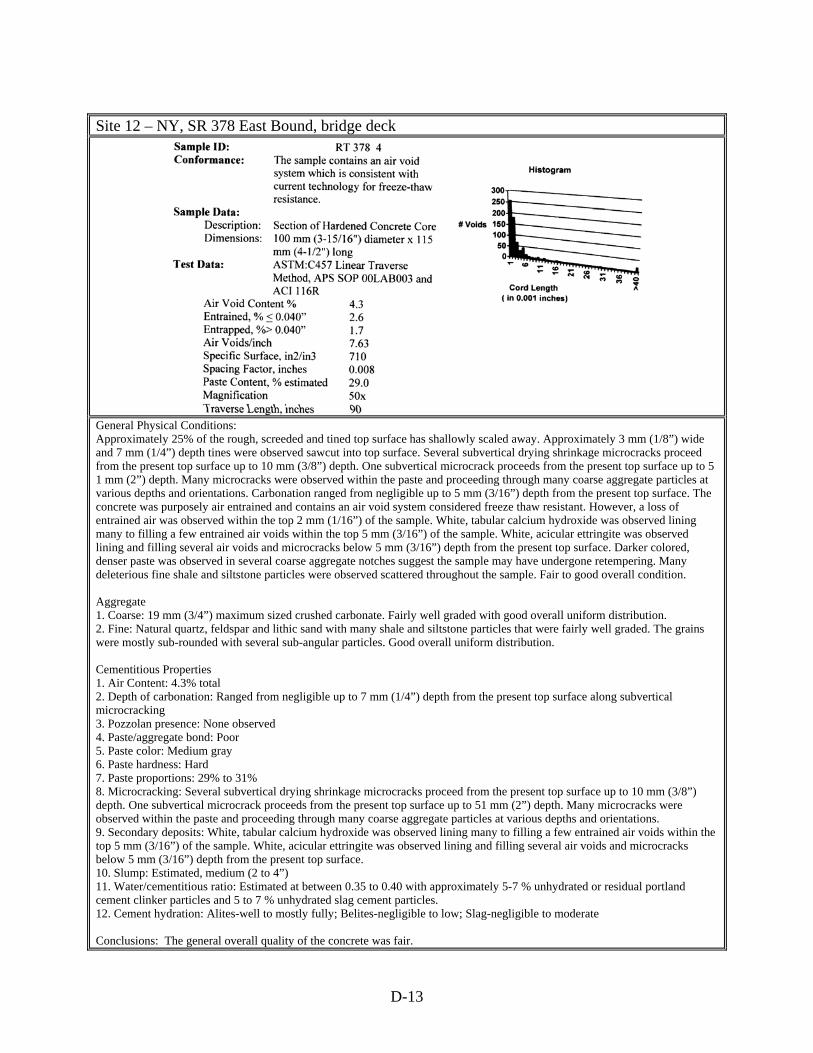
Site 12 – NY, SR 378 East Bound, bridge deck
General Physical Conditions: Approximately 25% of the rough, screeded and tined top surface has shallowly scaled away. Approximately 3 mm (1/8”) wide and 7 mm (1/4”) depth tines were observed sawcut into top surface. Several subvertical drying shrinkage microcracks proceed from the present top surface up to 10 mm (3/8”) depth. One subvertical microcrack proceeds from the present top surface up to 5 1 mm (2”) depth. Many microcracks were observed within the paste and proceeding through many coarse aggregate particles at various depths and orientations. Carbonation ranged from negligible up to 5 mm (3/16”) depth from the present top surface. The concrete was purposely air entrained and contains an air void system considered freeze thaw resistant. However, a loss of entrained air was observed within the top 2 mm (1/16”) of the sample. White, tabular calcium hydroxide was observed lining many to filling a few entrained air voids within the top 5 mm (3/16”) of the sample. White, acicular ettringite was observed lining and filling several air voids and microcracks below 5 mm (3/16”) depth from the present top surface. Darker colored, denser paste was observed in several coarse aggregate notches suggest the sample may have undergone retempering. Many deleterious fine shale and siltstone particles were observed scattered throughout the sample. Fair to good overall condition. Aggregate 1. Coarse: 19 mm (3/4”) maximum sized crushed carbonate. Fairly well graded with good overall uniform distribution. 2. Fine: Natural quartz, feldspar and lithic sand with many shale and siltstone particles that were fairly well graded. The grains were mostly sub-rounded with several sub-angular particles. Good overall uniform distribution. Cementitious Properties 1. Air Content: 4.3% total 2. Depth of carbonation: Ranged from negligible up to 7 mm (1/4”) depth from the present top surface along subvertical microcracking 3. Pozzolan presence: None observed 4. Paste/aggregate bond: Poor 5. Paste color: Medium gray 6. Paste hardness: Hard 7. Paste proportions: 29% to 31% 8. Microcracking: Several subvertical drying shrinkage microcracks proceed from the present top surface up to 10 mm (3/8”) depth. One subvertical microcrack proceeds from the present top surface up to 51 mm (2”) depth. Many microcracks were observed within the paste and proceeding through many coarse aggregate particles at various depths and orientations. 9. Secondary deposits: White, tabular calcium hydroxide was observed lining many to filling a few entrained air voids within the top 5 mm (3/16”) of the sample. White, acicular ettringite was observed lining and filling several air voids and microcracks below 5 mm (3/16”) depth from the present top surface. 10. Slump: Estimated, medium (2 to 4”) 11. Water/cementitious ratio: Estimated at between 0.35 to 0.40 with approximately 5-7 % unhydrated or residual portland cement clinker particles and 5 to 7 % unhydrated slag cement particles. 12. Cement hydration: Alites-well to mostly fully; Belites-negligible to low; Slag-negligible to moderate Conclusions: The general overall quality of the concrete was fair.
D-13
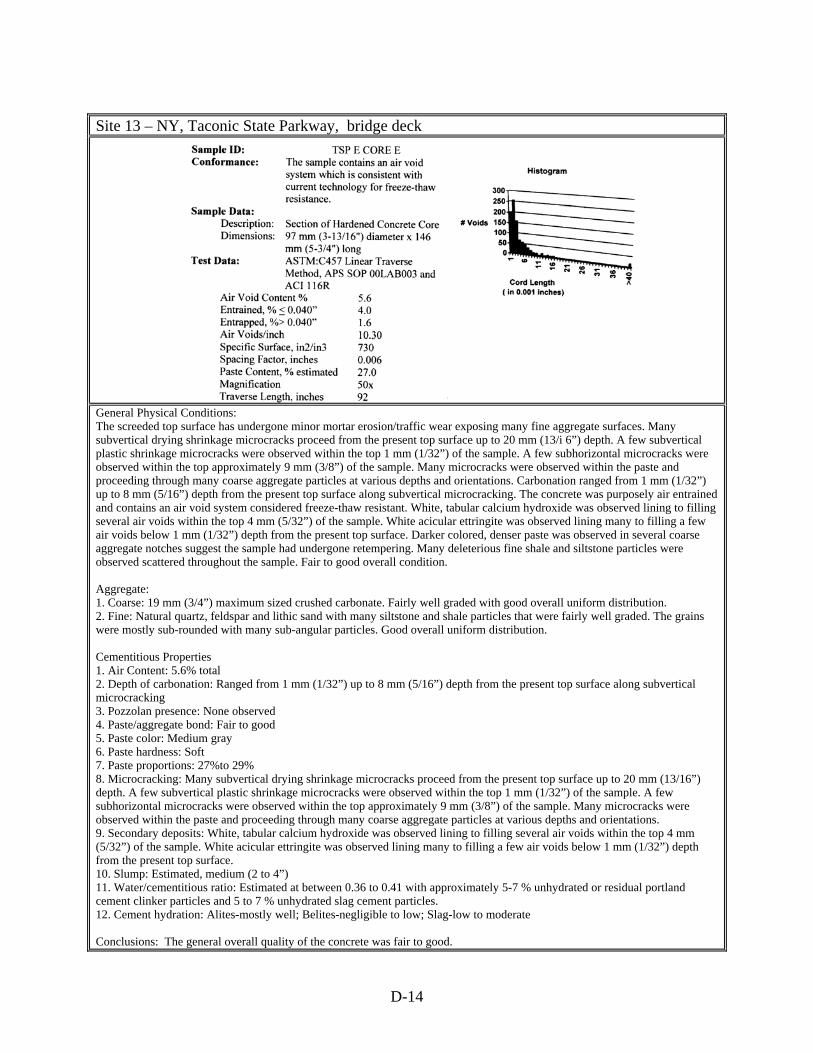
Site 13 – NY, Taconic State Parkway, bridge deck
General Physical Conditions: The screeded top surface has undergone minor mortar erosion/traffic wear exposing many fine aggregate surfaces. Many subvertical drying shrinkage microcracks proceed from the present top surface up to 20 mm (13/i 6”) depth. A few subvertical plastic shrinkage microcracks were observed within the top 1 mm (1/32”) of the sample. A few subhorizontal microcracks were observed within the top approximately 9 mm (3/8”) of the sample. Many microcracks were observed within the paste and proceeding through many coarse aggregate particles at various depths and orientations. Carbonation ranged from 1 mm (1/32”) up to 8 mm (5/16”) depth from the present top surface along subvertical microcracking. The concrete was purposely air entrained and contains an air void system considered freeze-thaw resistant. White, tabular calcium hydroxide was observed lining to filling several air voids within the top 4 mm (5/32”) of the sample. White acicular ettringite was observed lining many to filling a few air voids below 1 mm (1/32”) depth from the present top surface. Darker colored, denser paste was observed in several coarse aggregate notches suggest the sample had undergone retempering. Many deleterious fine shale and siltstone particles were observed scattered throughout the sample. Fair to good overall condition. Aggregate: 1. Coarse: 19 mm (3/4”) maximum sized crushed carbonate. Fairly well graded with good overall uniform distribution. 2. Fine: Natural quartz, feldspar and lithic sand with many siltstone and shale particles that were fairly well graded. The grains were mostly sub-rounded with many sub-angular particles. Good overall uniform distribution. Cementitious Properties 1. Air Content: 5.6% total 2. Depth of carbonation: Ranged from 1 mm (1/32”) up to 8 mm (5/16”) depth from the present top surface along subvertical microcracking 3. Pozzolan presence: None observed 4. Paste/aggregate bond: Fair to good 5. Paste color: Medium gray 6. Paste hardness: Soft 7. Paste proportions: 27%to 29% 8. Microcracking: Many subvertical drying shrinkage microcracks proceed from the present top surface up to 20 mm (13/16”) depth. A few subvertical plastic shrinkage microcracks were observed within the top 1 mm (1/32”) of the sample. A few subhorizontal microcracks were observed within the top approximately 9 mm (3/8”) of the sample. Many microcracks were observed within the paste and proceeding through many coarse aggregate particles at various depths and orientations. 9. Secondary deposits: White, tabular calcium hydroxide was observed lining to filling several air voids within the top 4 mm (5/32”) of the sample. White acicular ettringite was observed lining many to filling a few air voids below 1 mm (1/32”) depth from the present top surface. 10. Slump: Estimated, medium (2 to 4”) 11. Water/cementitious ratio: Estimated at between 0.36 to 0.41 with approximately 5-7 % unhydrated or residual portland cement clinker particles and 5 to 7 % unhydrated slag cement particles. 12. Cement hydration: Alites-mostly well; Belites-negligible to low; Slag-low to moderate Conclusions: The general overall quality of the concrete was fair to good.
D-14
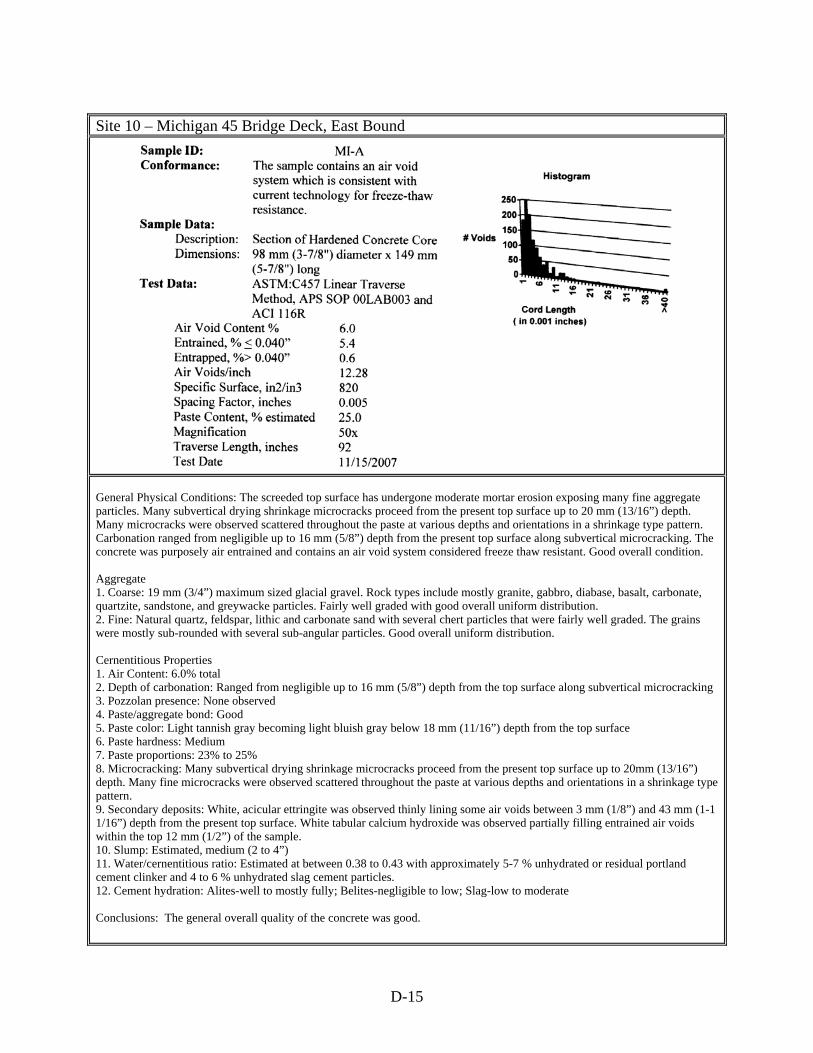
Site 10 – Michigan 45 Bridge Deck, East Bound
General Physical Conditions: The screeded top surface has undergone moderate mortar erosion exposing many fine aggregate particles. Many subvertical drying shrinkage microcracks proceed from the present top surface up to 20 mm (13/16”) depth. Many microcracks were observed scattered throughout the paste at various depths and orientations in a shrinkage type pattern. Carbonation ranged from negligible up to 16 mm (5/8”) depth from the present top surface along subvertical microcracking. The concrete was purposely air entrained and contains an air void system considered freeze thaw resistant. Good overall condition. Aggregate 1. Coarse: 19 mm (3/4”) maximum sized glacial gravel. Rock types include mostly granite, gabbro, diabase, basalt, carbonate, quartzite, sandstone, and greywacke particles. Fairly well graded with good overall uniform distribution. 2. Fine: Natural quartz, feldspar, lithic and carbonate sand with several chert particles that were fairly well graded. The grains were mostly sub-rounded with several sub-angular particles. Good overall uniform distribution. Cernentitious Properties 1. Air Content: 6.0% total 2. Depth of carbonation: Ranged from negligible up to 16 mm (5/8”) depth from the top surface along subvertical microcracking 3. Pozzolan presence: None observed 4. Paste/aggregate bond: Good 5. Paste color: Light tannish gray becoming light bluish gray below 18 mm (11/16”) depth from the top surface 6. Paste hardness: Medium 7. Paste proportions: 23% to 25% 8. Microcracking: Many subvertical drying shrinkage microcracks proceed from the present top surface up to 20mm (13/16”) depth. Many fine microcracks were observed scattered throughout the paste at various depths and orientations in a shrinkage type pattern. 9. Secondary deposits: White, acicular ettringite was observed thinly lining some air voids between 3 mm (1/8”) and 43 mm (1-1 1/16”) depth from the present top surface. White tabular calcium hydroxide was observed partially filling entrained air voids within the top 12 mm (1/2”) of the sample. 10. Slump: Estimated, medium (2 to 4”) 11. Water/cernentitious ratio: Estimated at between 0.38 to 0.43 with approximately 5-7 % unhydrated or residual portland cement clinker and 4 to 6 % unhydrated slag cement particles. 12. Cement hydration: Alites-well to mostly fully; Belites-negligible to low; Slag-low to moderate Conclusions: The general overall quality of the concrete was good.
D-15
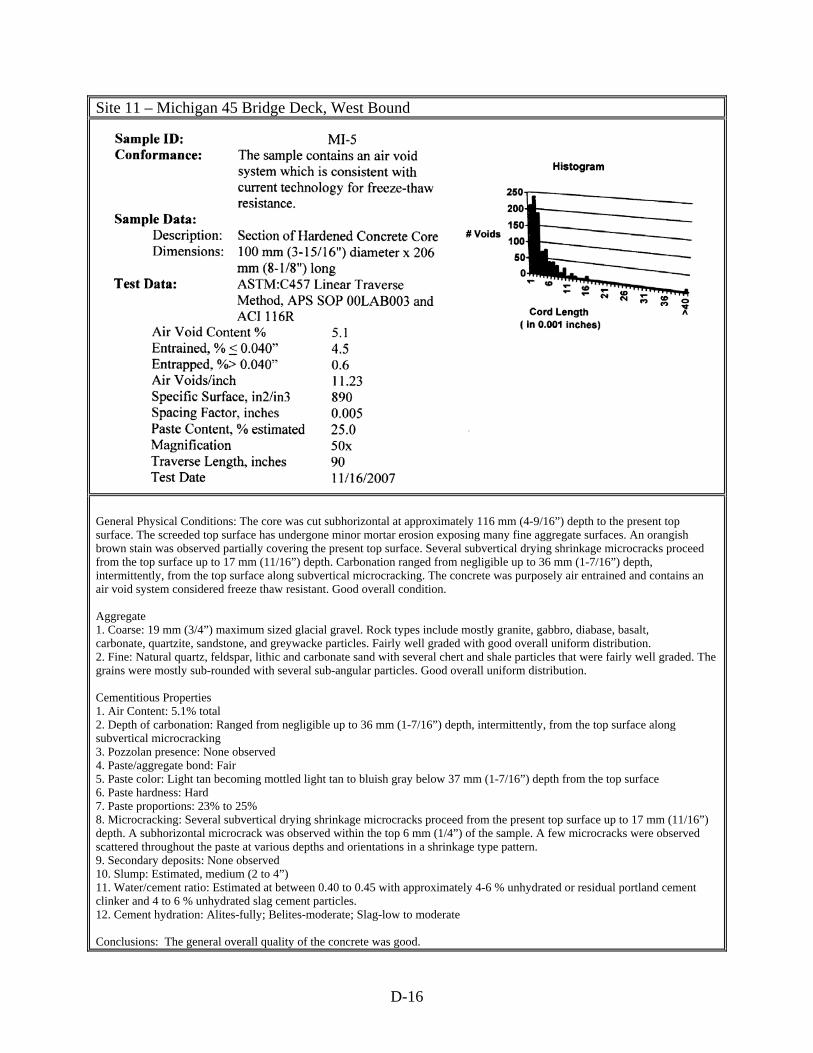
Site 11 – Michigan 45 Bridge Deck, West Bound
General Physical Conditions: The core was cut subhorizontal at approximately 116 mm (4-9/16”) depth to the present top surface. The screeded top surface has undergone minor mortar erosion exposing many fine aggregate surfaces. An orangish brown stain was observed partially covering the present top surface. Several subvertical drying shrinkage microcracks proceed from the top surface up to 17 mm (11/16”) depth. Carbonation ranged from negligible up to 36 mm (1-7/16”) depth, intermittently, from the top surface along subvertical microcracking. The concrete was purposely air entrained and contains an air void system considered freeze thaw resistant. Good overall condition. Aggregate 1. Coarse: 19 mm (3/4”) maximum sized glacial gravel. Rock types include mostly granite, gabbro, diabase, basalt, carbonate, quartzite, sandstone, and greywacke particles. Fairly well graded with good overall uniform distribution. 2. Fine: Natural quartz, feldspar, lithic and carbonate sand with several chert and shale particles that were fairly well graded. The grains were mostly sub-rounded with several sub-angular particles. Good overall uniform distribution. Cementitious Properties 1. Air Content: 5.1% total 2. Depth of carbonation: Ranged from negligible up to 36 mm (1-7/16”) depth, intermittently, from the top surface along subvertical microcracking 3. Pozzolan presence: None observed 4. Paste/aggregate bond: Fair 5. Paste color: Light tan becoming mottled light tan to bluish gray below 37 mm (1-7/16”) depth from the top surface 6. Paste hardness: Hard 7. Paste proportions: 23% to 25% 8. Microcracking: Several subvertical drying shrinkage microcracks proceed from the present top surface up to 17 mm (11/16”) depth. A subhorizontal microcrack was observed within the top 6 mm (1/4”) of the sample. A few microcracks were observed scattered throughout the paste at various depths and orientations in a shrinkage type pattern. 9. Secondary deposits: None observed 10. Slump: Estimated, medium (2 to 4”) 11. Water/cement ratio: Estimated at between 0.40 to 0.45 with approximately 4-6 % unhydrated or residual portland cement clinker and 4 to 6 % unhydrated slag cement particles. 12. Cement hydration: Alites-fully; Belites-moderate; Slag-low to moderate Conclusions: The general overall quality of the concrete was good.
D-16
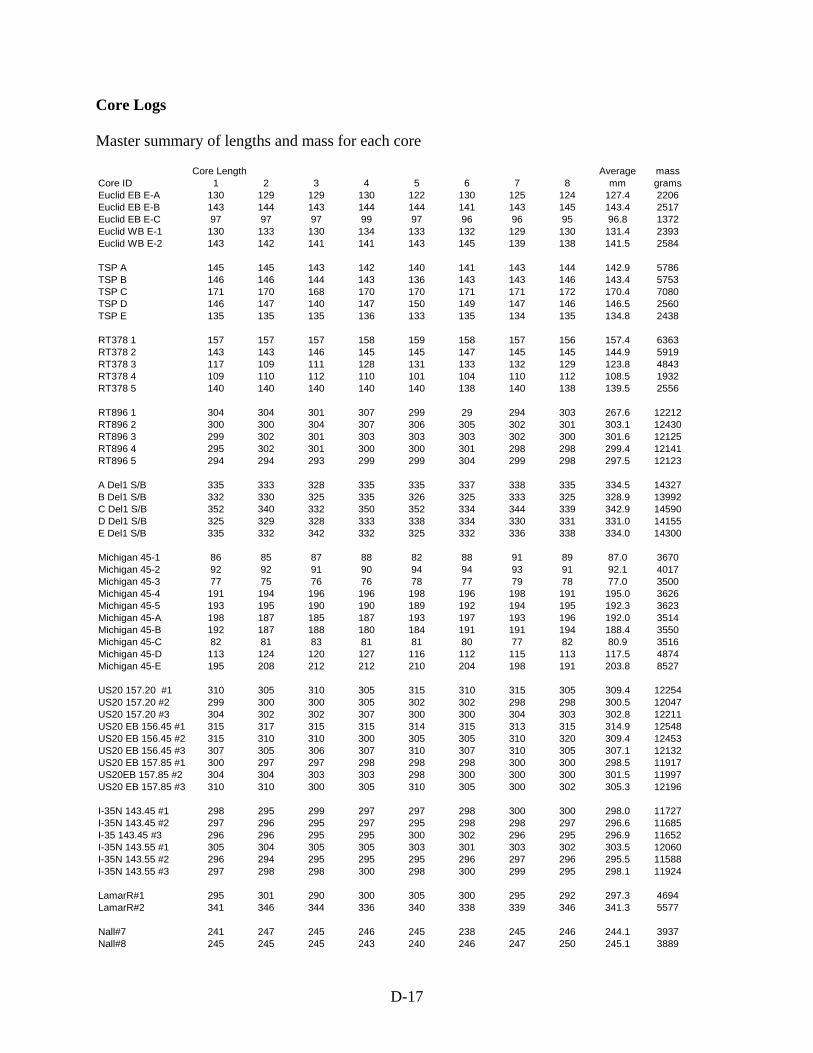
Core Logs Master summary of lengths and mass for each core
Core Length Average massCore ID 1 2 3 4 5 6 7 8 mm gramEuclid EB E-A 130 129 129 130 122 130 125 124 127.4 2206Euclid EB E-B 143 144 143 144 144 141 143 145 143.4 2517Euclid EB E-C 97 97 97 99 97 96 96 95 96.8 1372Euclid WB E-1 130 133 130 134 133 132 129 130 131.4 2393Euclid WB E-2 143 142 141 141 143 145 139 138 141.5 2584
TSP A 145 145 143 142 140 141 143 144 142.9 5786TSP B 146 146 144 143 136 143 143 146 143.4 5753TSP C 171 170 168 170 170 171 171 172 170.4 7080TSP D 146 147 140 147 150 149 147 146 146.5 2560TSP E 135 135 135 136 133 135 134 135 134.8 2438
RT378 1 157 157 157 158 159 158 157 156 157.4 6363RT378 2 143 143 146 145 145 147 145 145 144.9 5919RT378 3 117 109 111 128 131 133 132 129 123.8 4843RT378 4 109 110 112 110 101 104 110 112 108.5 1932RT378 5 140 140 140 140 140 138 140 138 139.5 2556
RT896 1 304 304 301 307 299 29 294 303 267.6 12212RT896 2 300 300 304 307 306 305 302 301 303.1 12430RT896 3 299 302 301 303 303 303 302 300 301.6 12125RT896 4 295 302 301 300 300 301 298 298 299.4 12141RT896 5 294 294 293 299 299 304 299 298 297.5 12123
A Del1 S/B 335 333 328 335 335 337 338 335 334.5 14327B Del1 S/B 332 330 325 335 326 325 333 325 328.9 13992C Del1 S/B 352 340 332 350 352 334 344 339 342.9 14590D Del1 S/B 325 329 328 333 338 334 330 331 331.0 14155E Del1 S/B 335 332 342 332 325 332 336 338 334.0 14300
Michigan 45-1 86 85 87 88 82 88 91 89 87.0 3670Michigan 45-2 92 92 91 90 94 94 93 91 92.1 4017Michigan 45-3 77 75 76 76 78 77 79 78 77.0 3500Michigan 45-4 191 194 196 196 198 196 198 191 195.0 3626Michigan 45-5 193 195 190 190 189 192 194 195 192.3 3623Michigan 45-A 198 187 185 187 193 197 193 196 192.0 3514Michigan 45-B 192 187 188 180 184 191 191 194 188.4 3550Michigan 45-C 82 81 83 81 81 80 77 82 80.9 3516Michigan 45-D 113 124 120 127 116 112 115 113 117.5 4874Michigan 45-E 195 208 212 212 210 204 198 191 203.8 8527
US20 157.20 #1 310 305 310 305 315 310 315 305 309.4 12254US20 157.20 #2 299 300 300 305 302 302 298 298 300.5 12047US20 157.20 #3 304 302 302 307 300 300 304 303 302.8 12211US20 EB 156.45 #1 315 317 315 315 314 315 313 315 314.9 12548US20 EB 156.45 #2 315 310 310 300 305 305 310 320 309.4 12453US20 EB 156.45 #3 307 305 306 307 310 307 310 305 307.1 12132US20 EB 157.85 #1 300 297 297 298 298 298 300 300 298.5 11917US20EB 157.85 #2 304 304 303 303 298 300 300 300 301.5 11997US20 EB 157.85 #3 310 310 300 305 310 305 300 302 305.3 12196
I-35N 143.45 #1 298 295 299 297 297 298 300 300 298.0 11727I-35N 143.45 #2 297 296 295 297 295 298 298 297 296.6 11685I-35 143.45 #3 296 296 295 295 300 302 296 295 296.9 11652I-35N 143.55 #1 305 304 305 305 303 301 303 302 303.5 12060I-35N 143.55 #2 296 294 295 295 295 296 297 296 295.5 11588I-35N 143.55 #3 297 298 298 300 298 300 299 295 298.1 11924
LamarR#1 295 301 290 300 305 300 295 292 297.3 4694LamarR#2 341 346 344 336 340 338 339 346 341.3 5577
Nall#7 241 247 245 246 245 238 245 246 244.1 3937Nall#8 245 245 245 243 240 246 247 250 245.1 3889
s
D-17
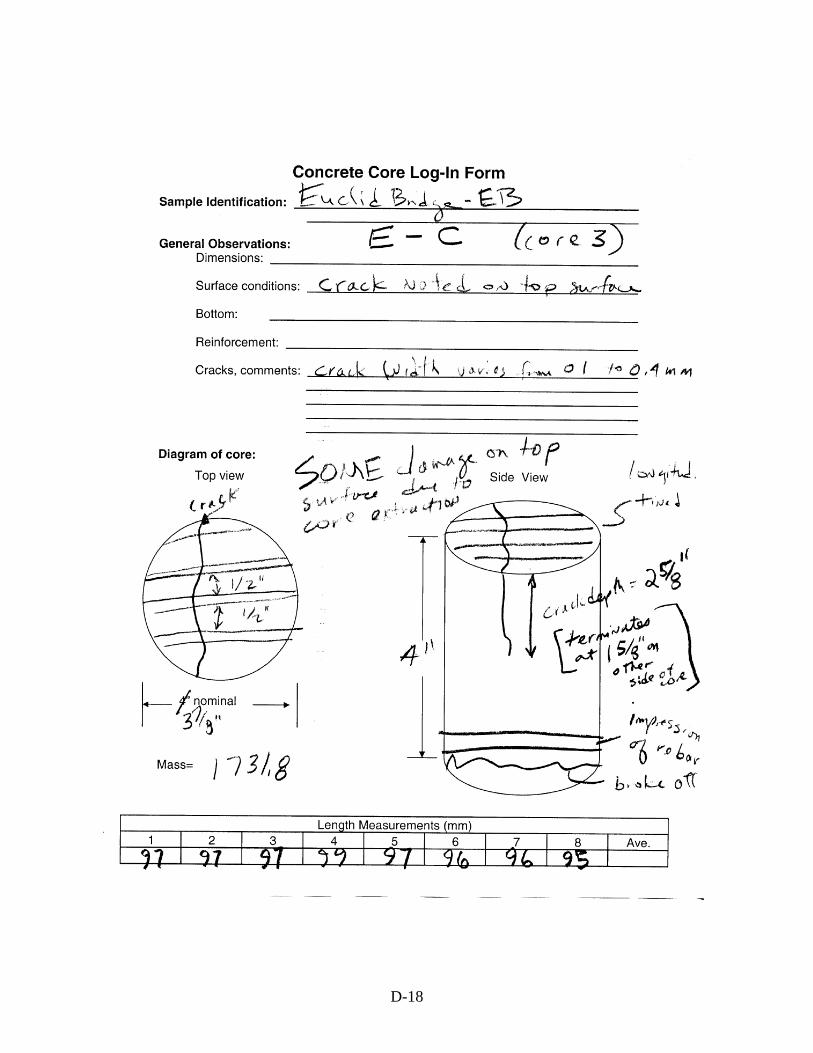
D-18
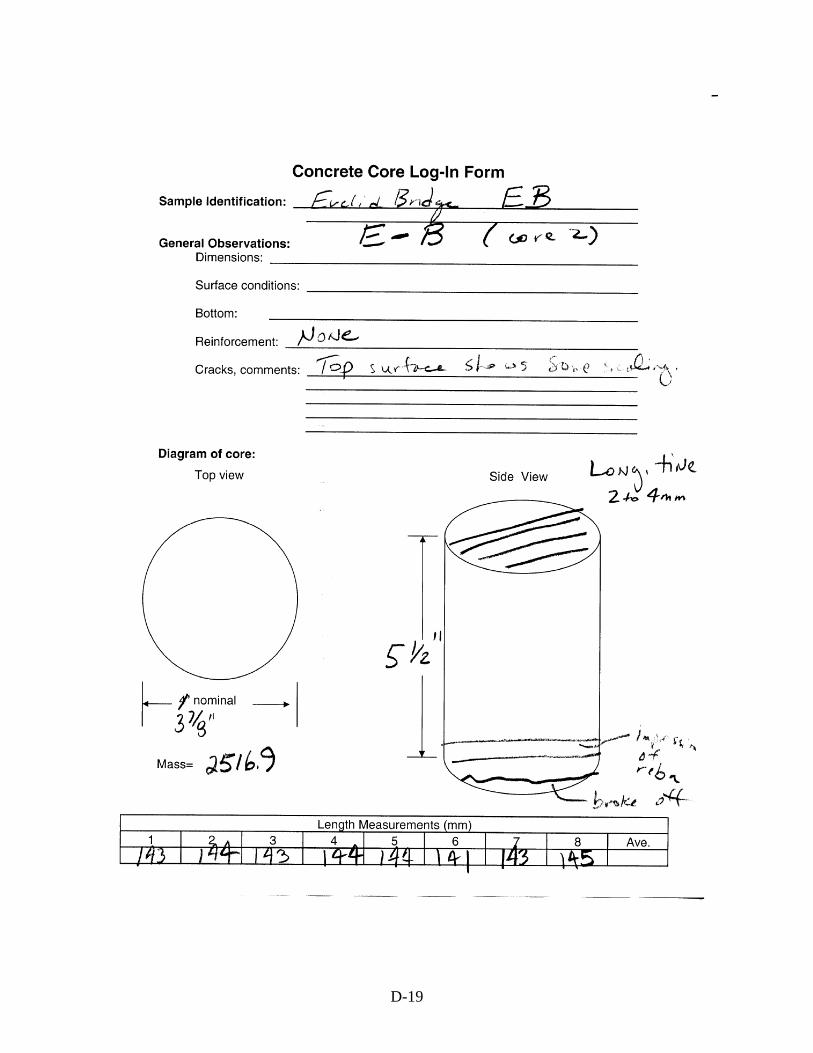
D-19
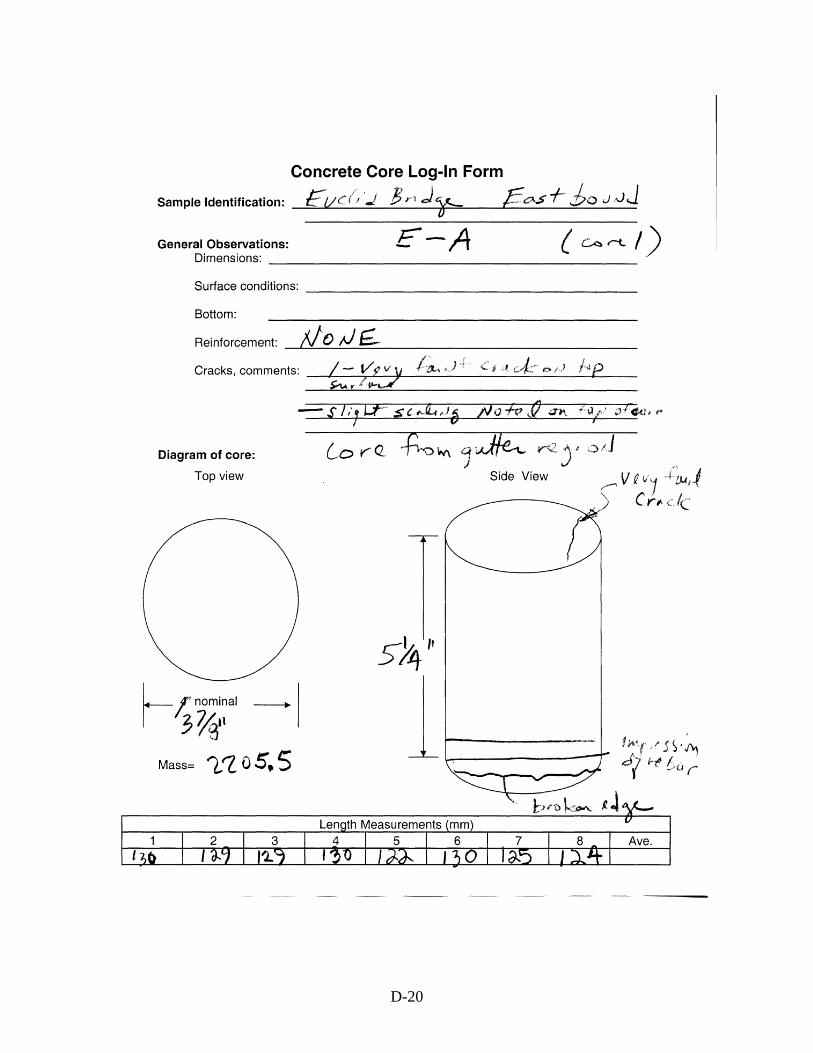
D-20
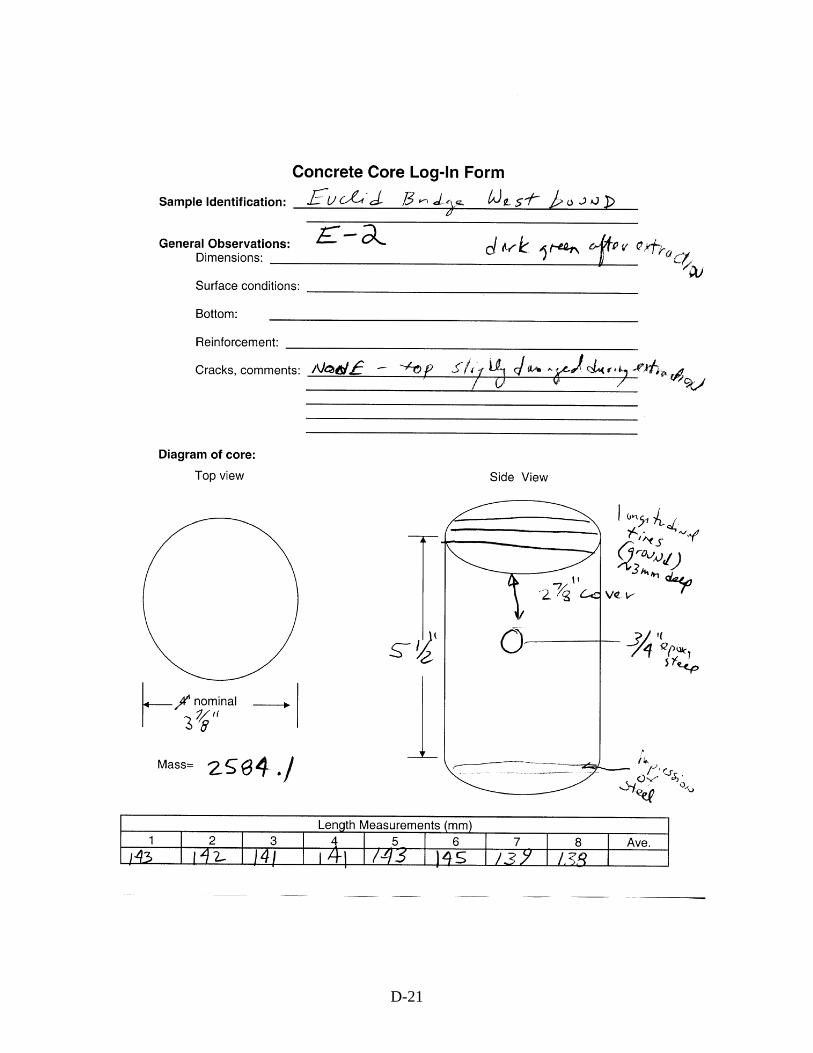
D-21
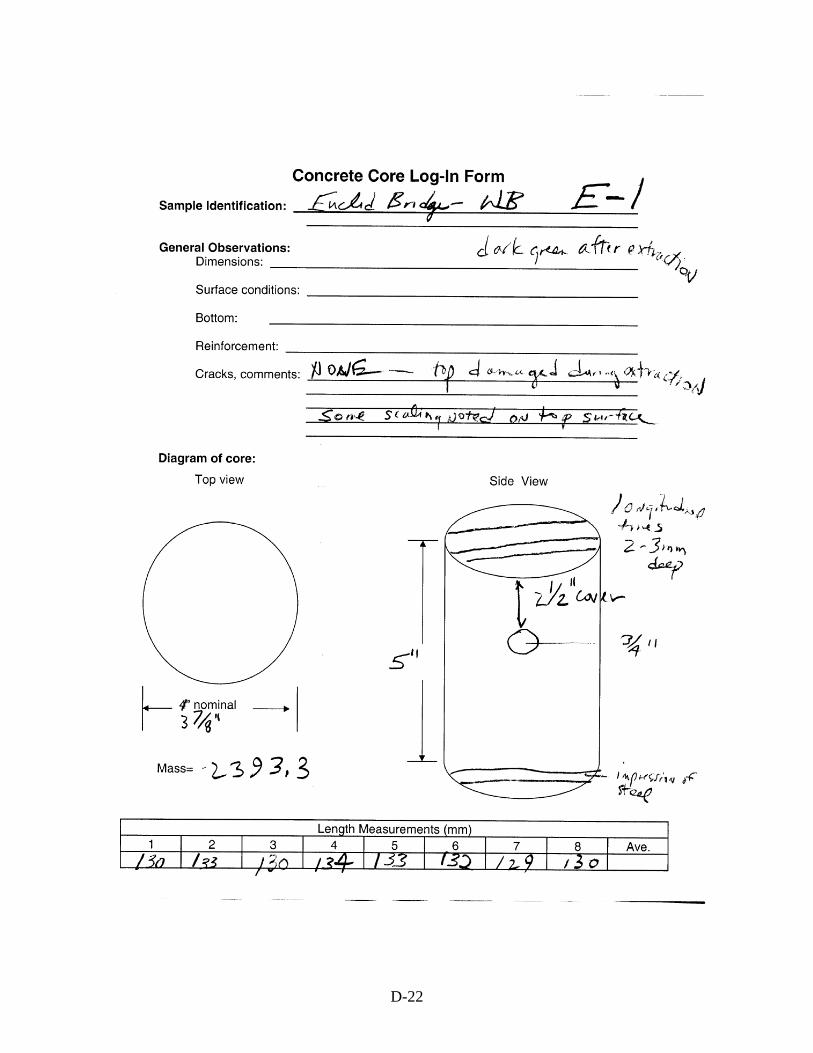
D-22

D-23
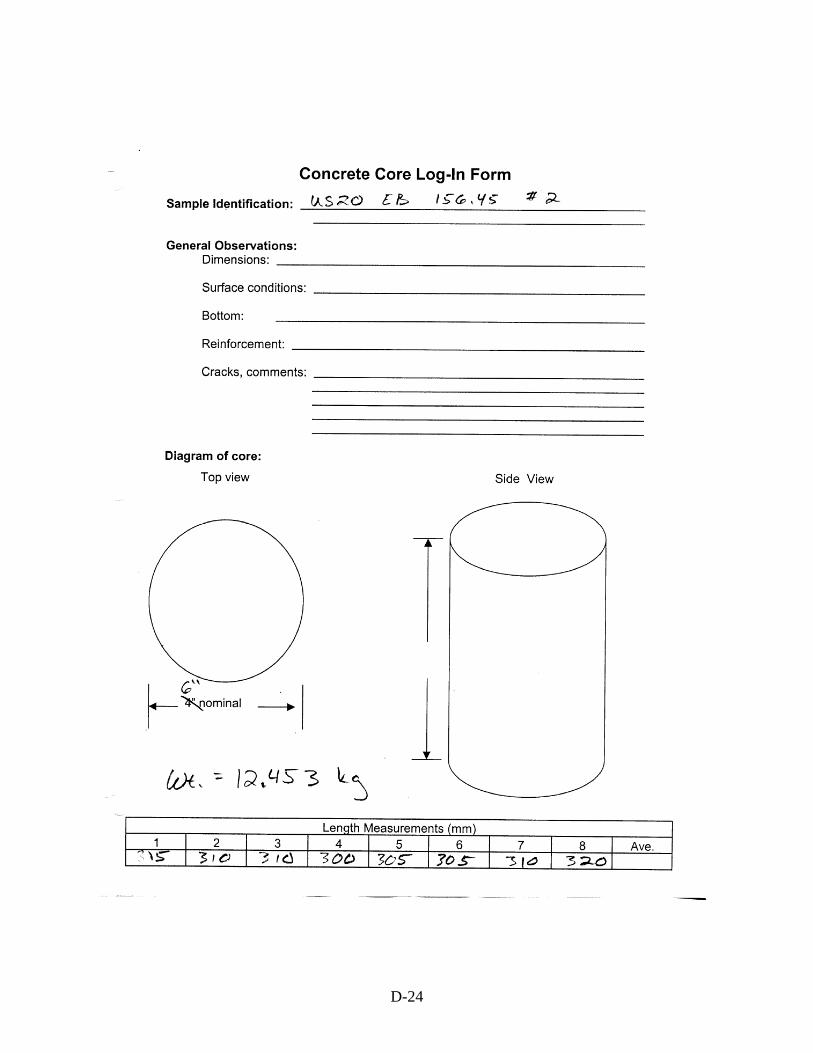
D-24

D-25
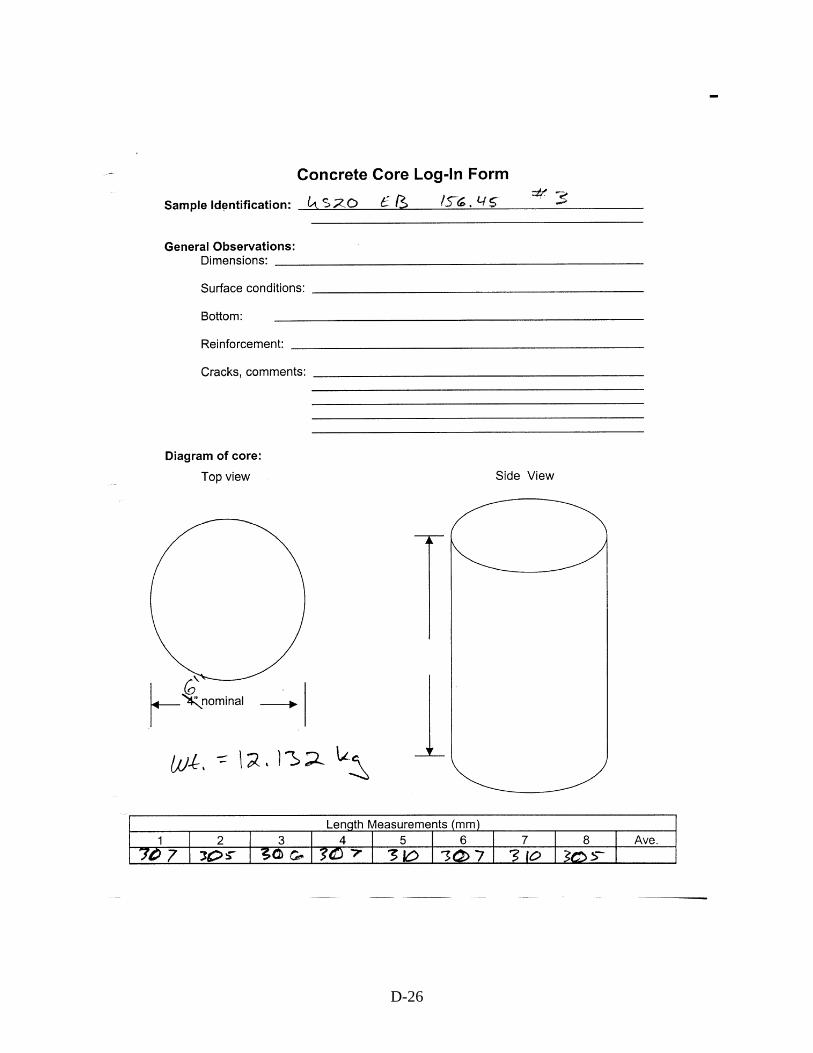
D-26
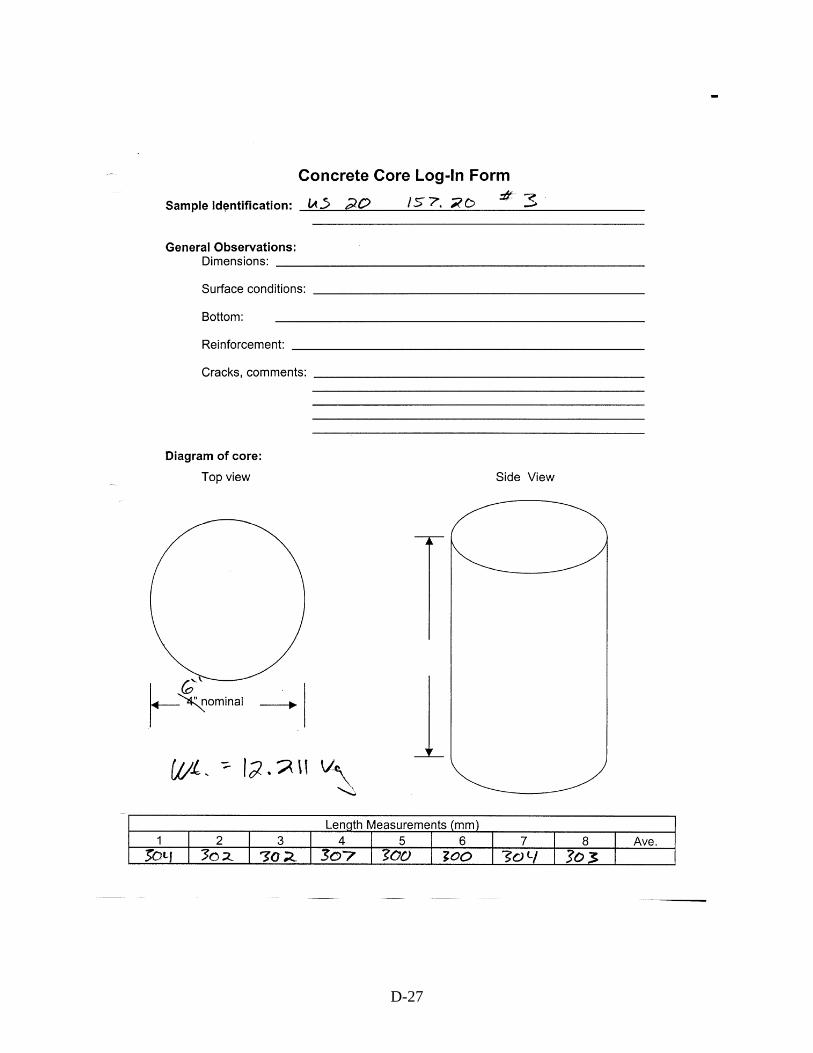
D-27
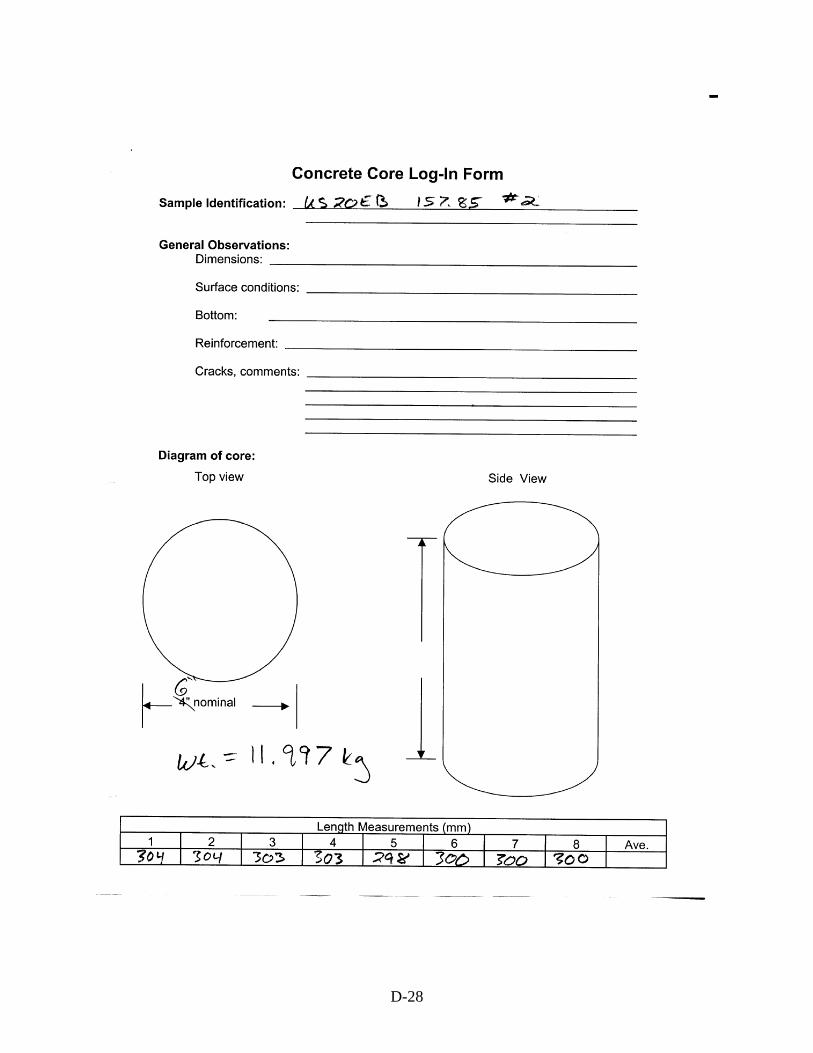
D-28
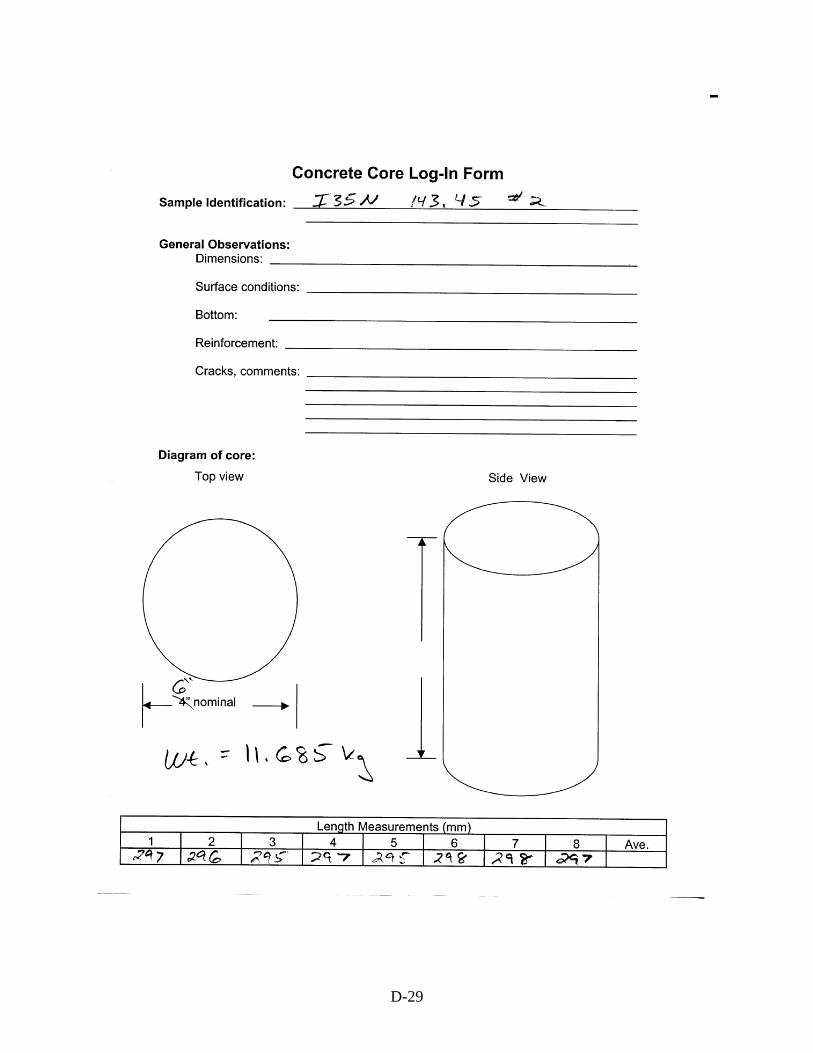
D-29

D-30
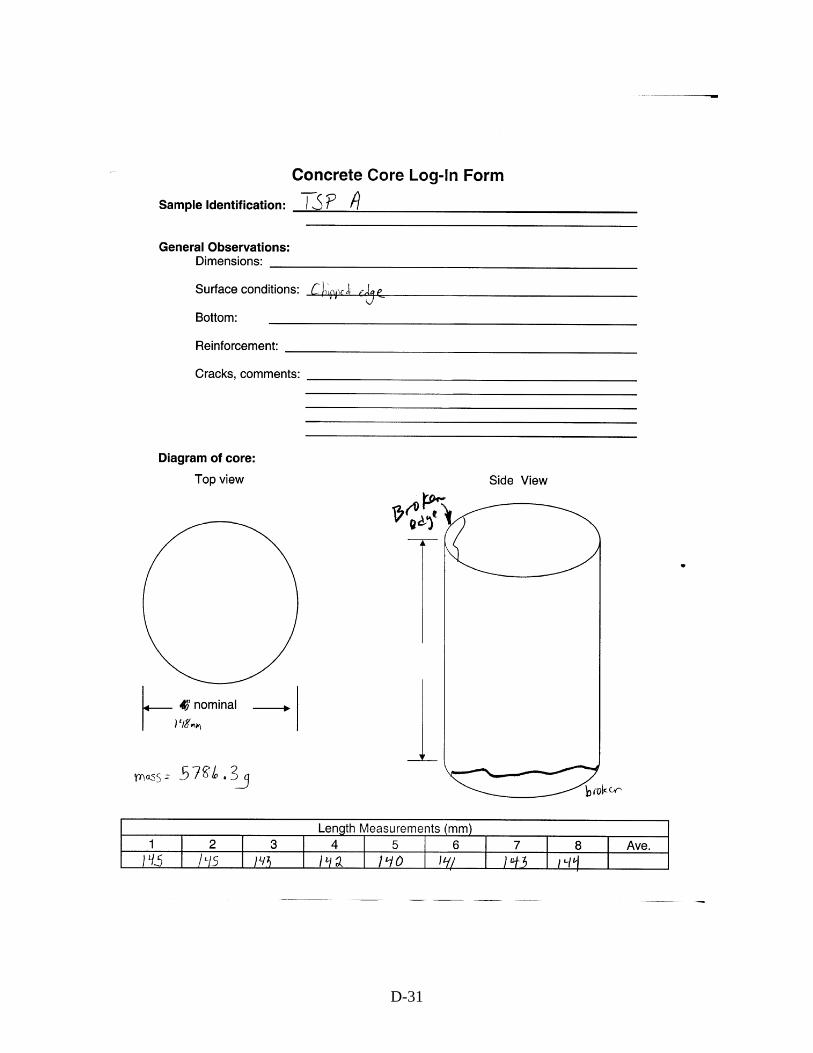
D-31
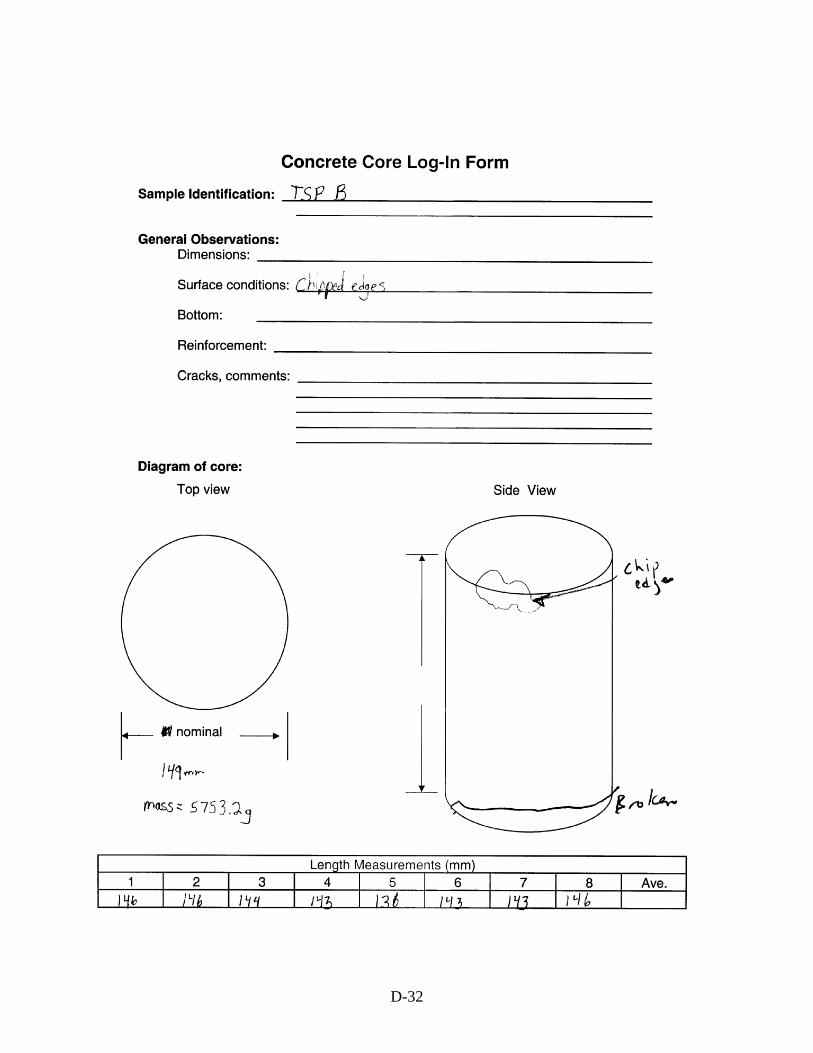
D-32
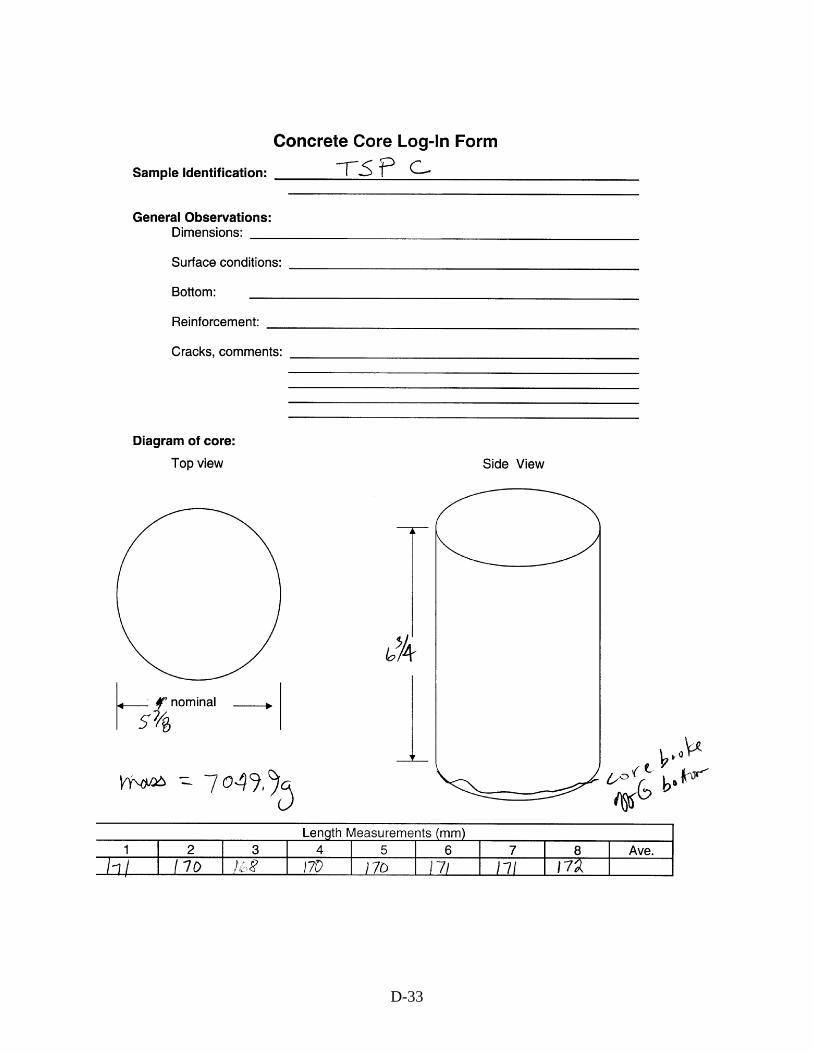
D-33
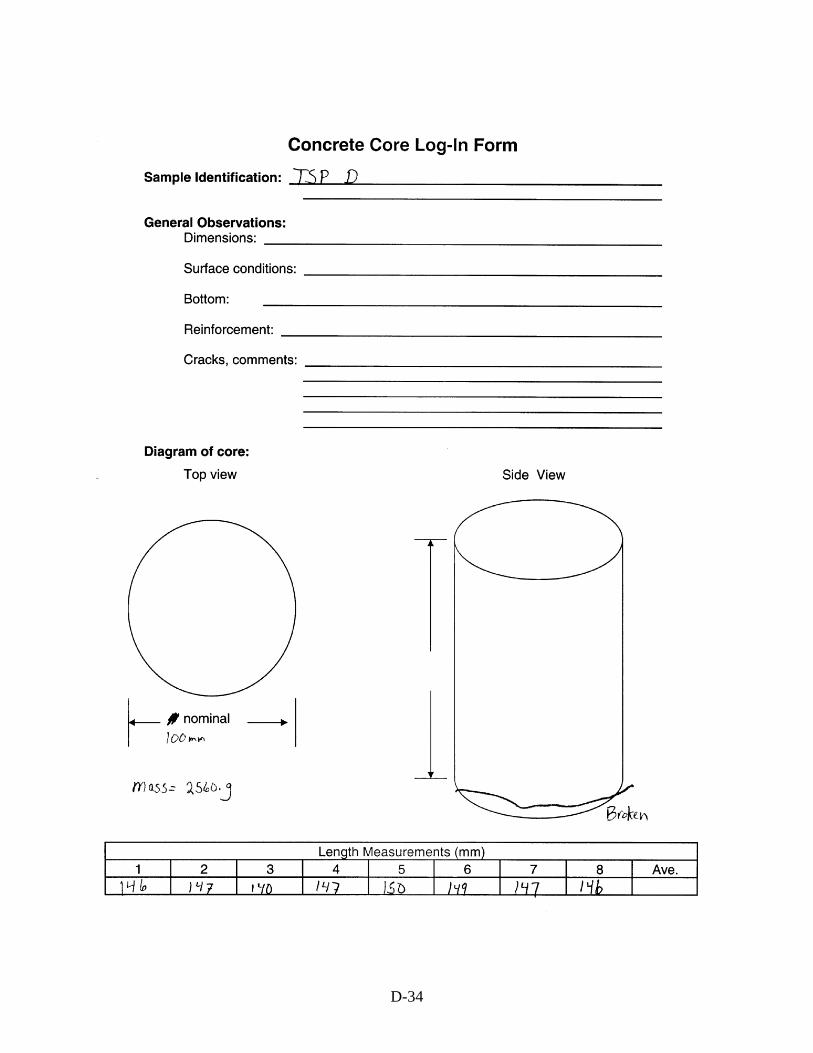
D-34
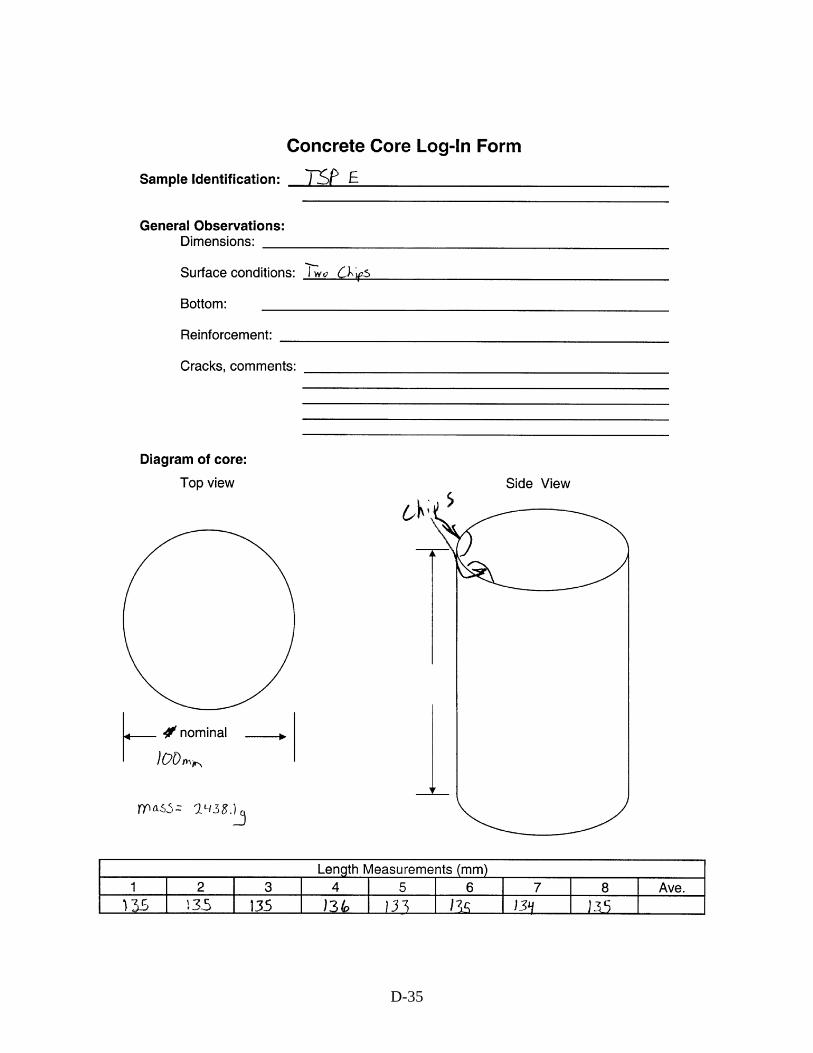
D-35
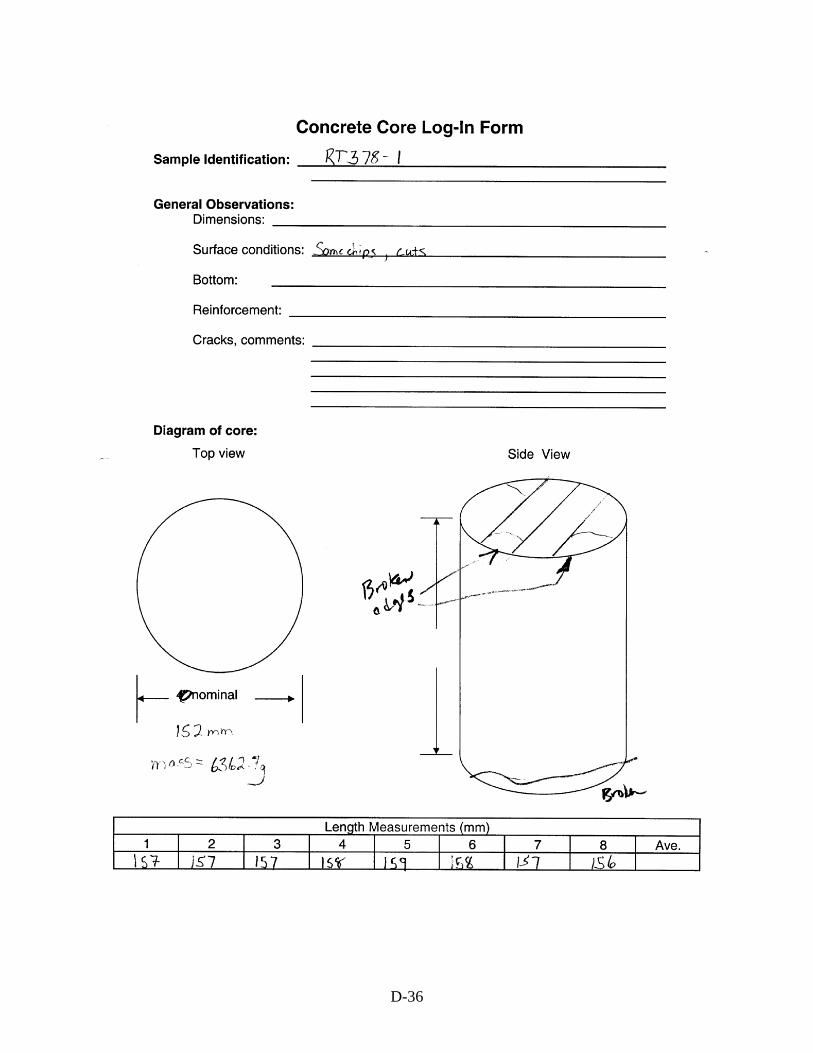
D-36
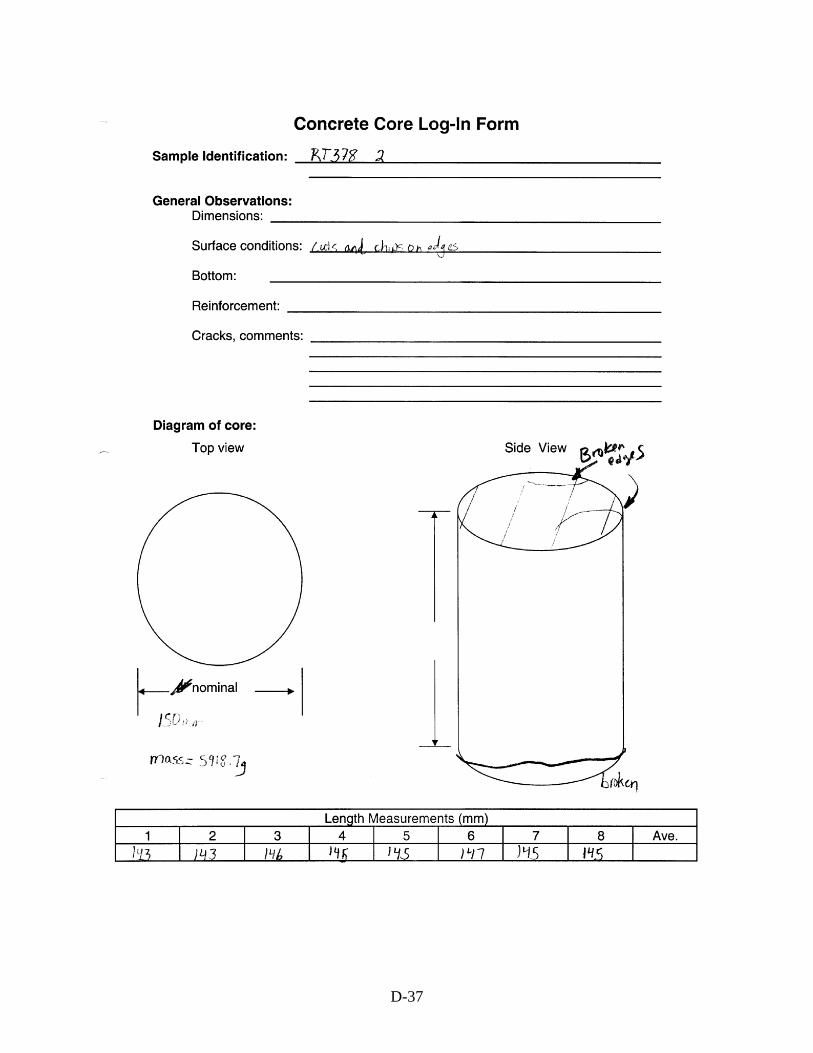
D-37
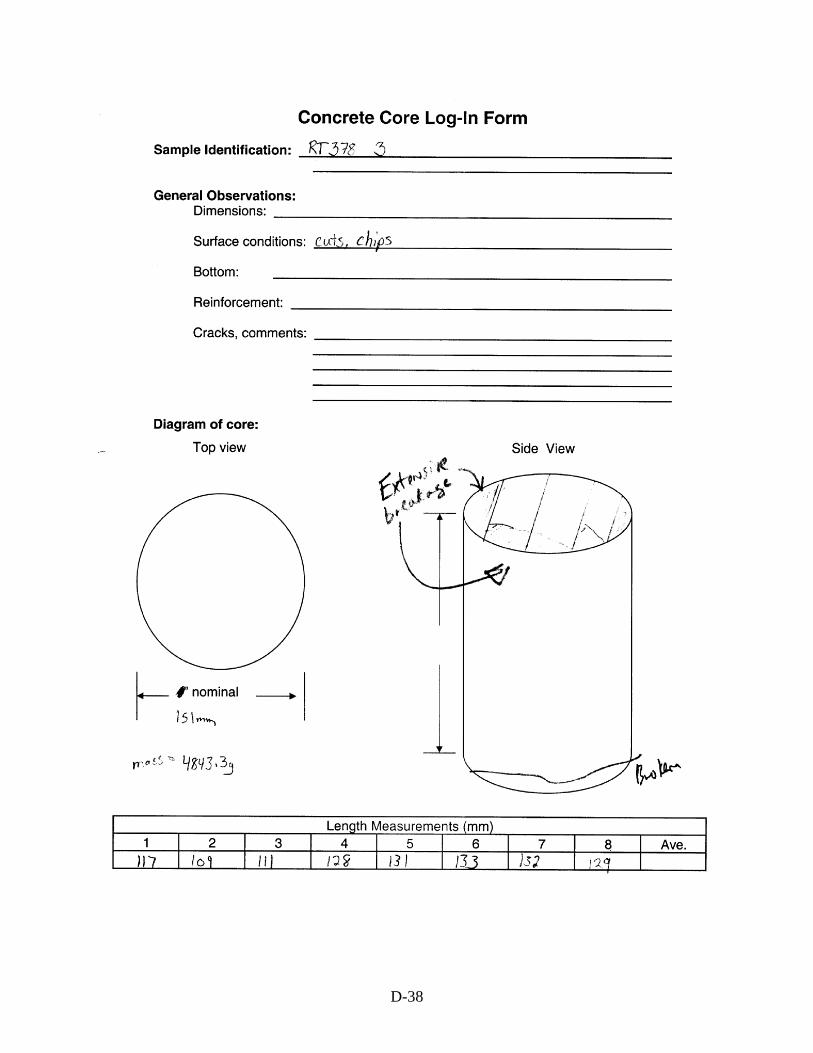
D-38
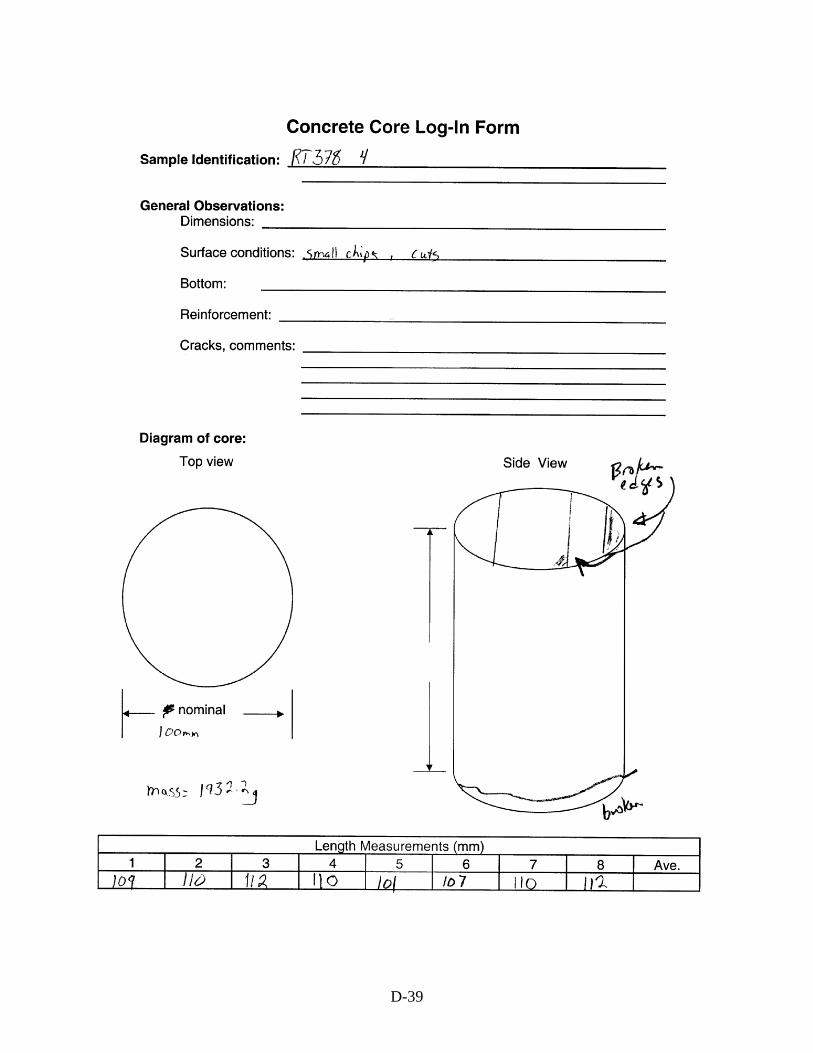
D-39
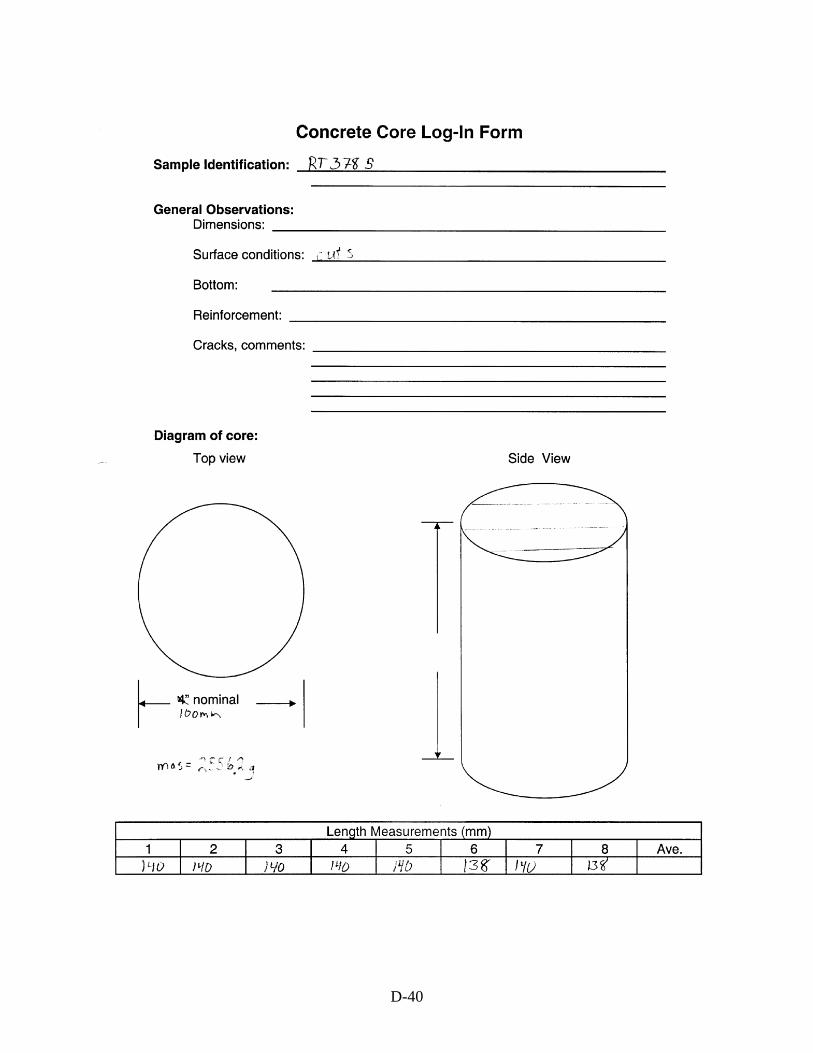
D-40
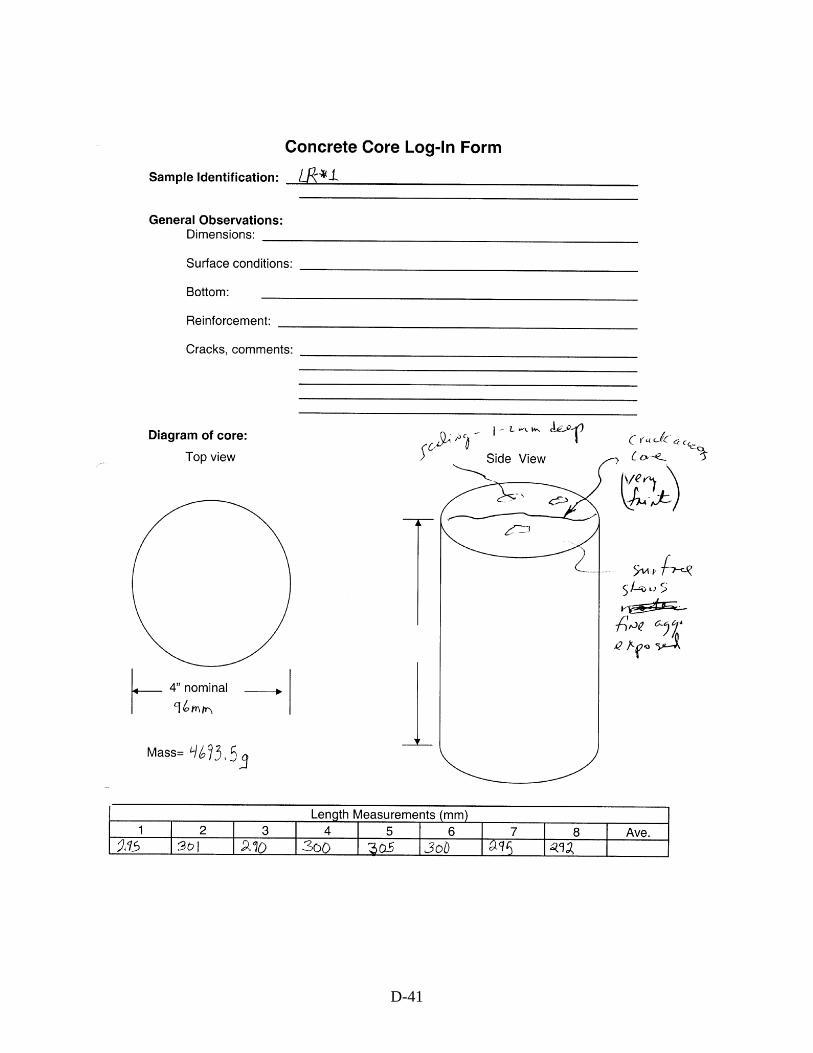
D-41
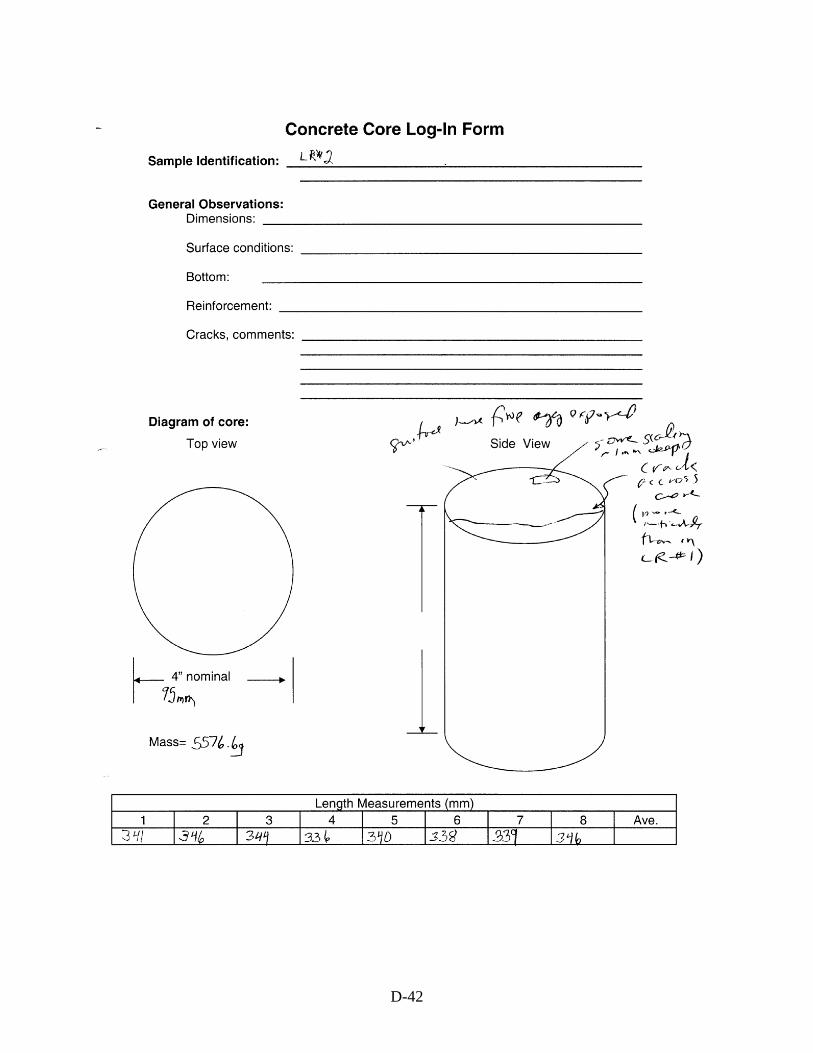
D-42
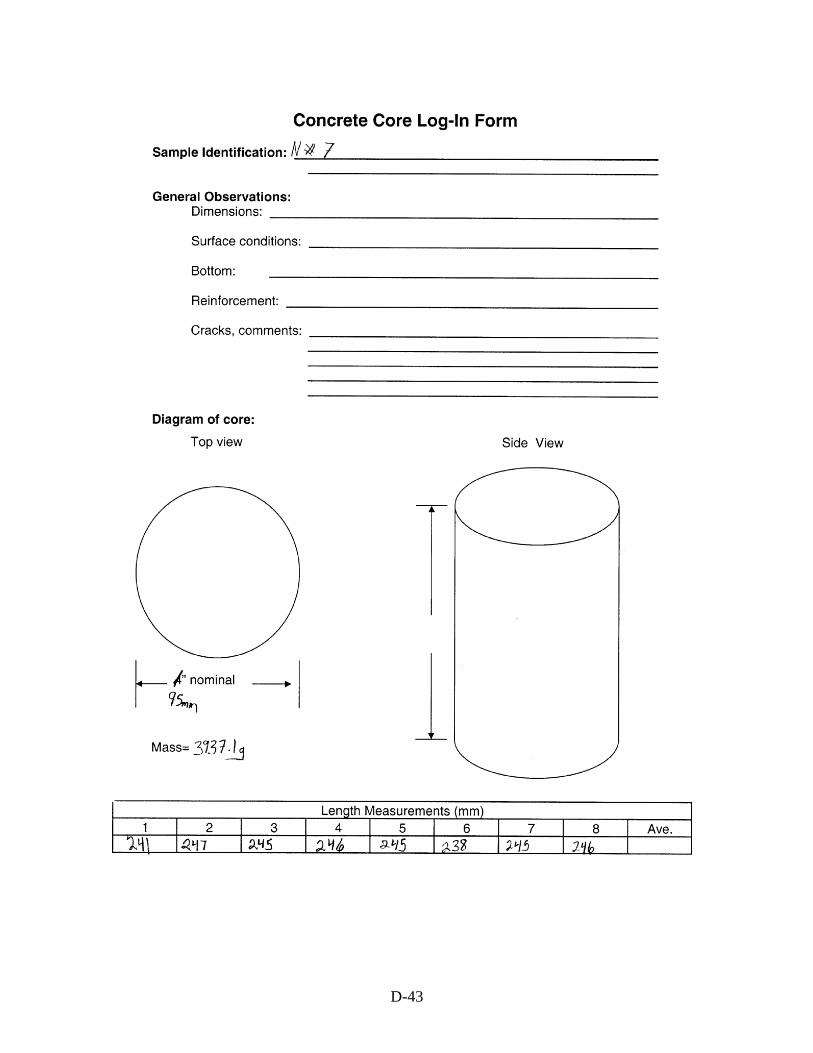
D-43
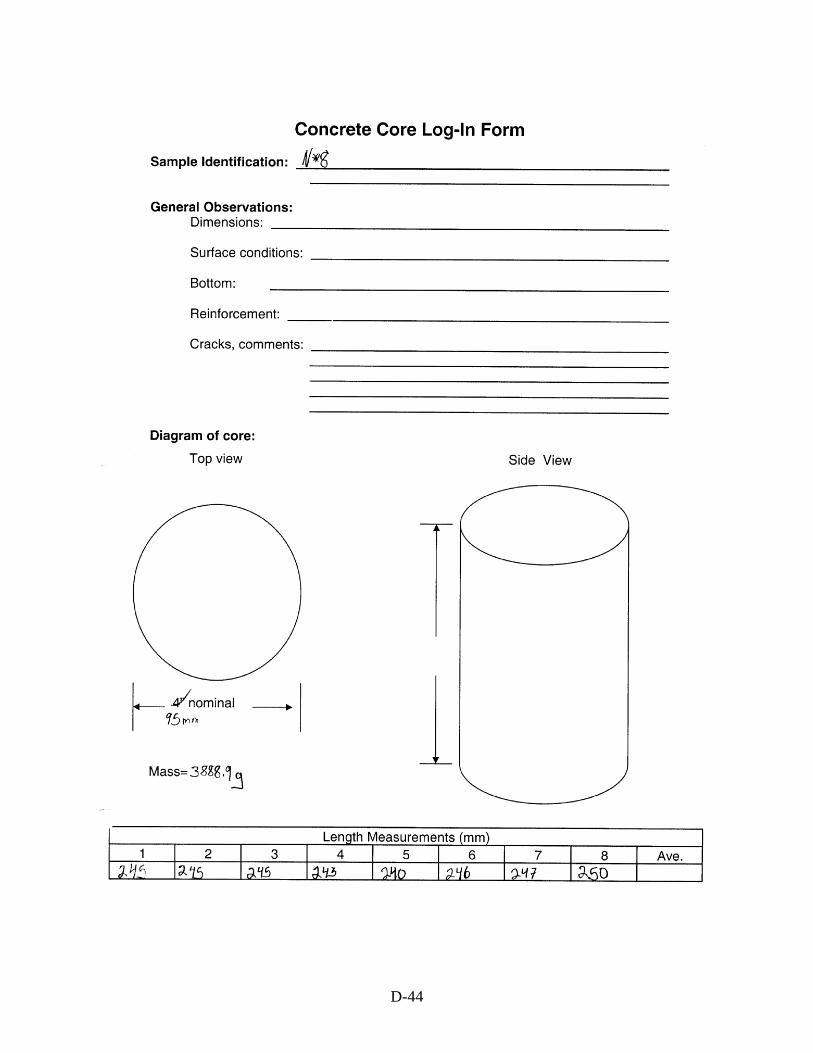
D-44