Embed Size (px)
Citation preview

D E G R E E SA N DM A J O R S 2 0 1 6 - 1 7

Academic and Student Affairs Committee Meeting November 2, 2017
Item #3D EXECUTIVE SUMMARY Page 1 of 13
Contact Information: Dan Anderson (602) 229-2544 [email protected] Ryan Tucker (602) 229-2520 [email protected]
Item Name: 2016-17 Degrees and Majors Report
Action Item Committee Recommendation to Full Board First Read of Proposed Policy Change Information or Discussion Item
Enterprise Strategic Plan
Empower Student Success and Learning Advance Educational Attainment within Arizona Create New Knowledge Impact Arizona Compliance Real property purchase/sale/lease Other:
Statutory/Policy Requirements ABOR Policy 2-201 Awarding of Degrees. Background/History of Previous Board Action The report documents the number of majors awarded by each university by level from 1980-81 to 2016-17. In addition, detailed data on degrees awarded by major for 2016-17 using the Classification of Instructional Program (CIP) code is provided. The report is intended to document the economic contribution of Arizona’s public universities to improving the skills of the local workforce and expanding the educational attainment of the population.
Discussion
In 2016-17, the Arizona university system awarded 29,298 bachelor’s degrees and 11,183 graduate degrees. This is an increase of 1,826 (6.6 percent) in bachelor’s degrees and an increase of 188 (1.7 percent) in graduate degrees
Issue: The committee is provided with an annual report on the number of Bachelor’s and Graduate (Master’s and Doctoral) degrees awarded by university in 2016-17. This is presented for the committee’s information and review. No action is required by the board. This was amended November 3, 2017 for corrections from Northern Arizona University.

Academic and Student Affairs Committee Meeting November 2, 2017
Item #3D EXECUTIVE SUMMARY Page 2 of 13
compared to the prior academic year.
Compared to ten years ago, the universities have increased the number of bachelor degrees awarded by 10,640 (57.0 percent) and the number of graduate degrees by 3,628 (48.0 percent).
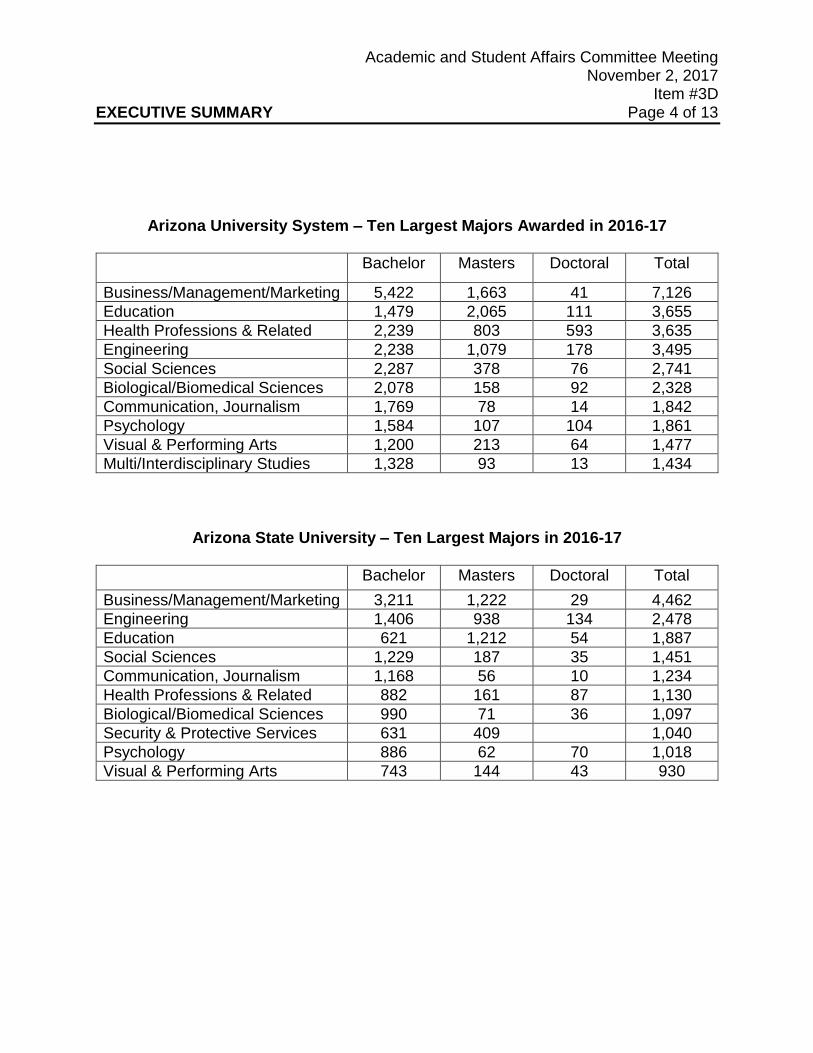
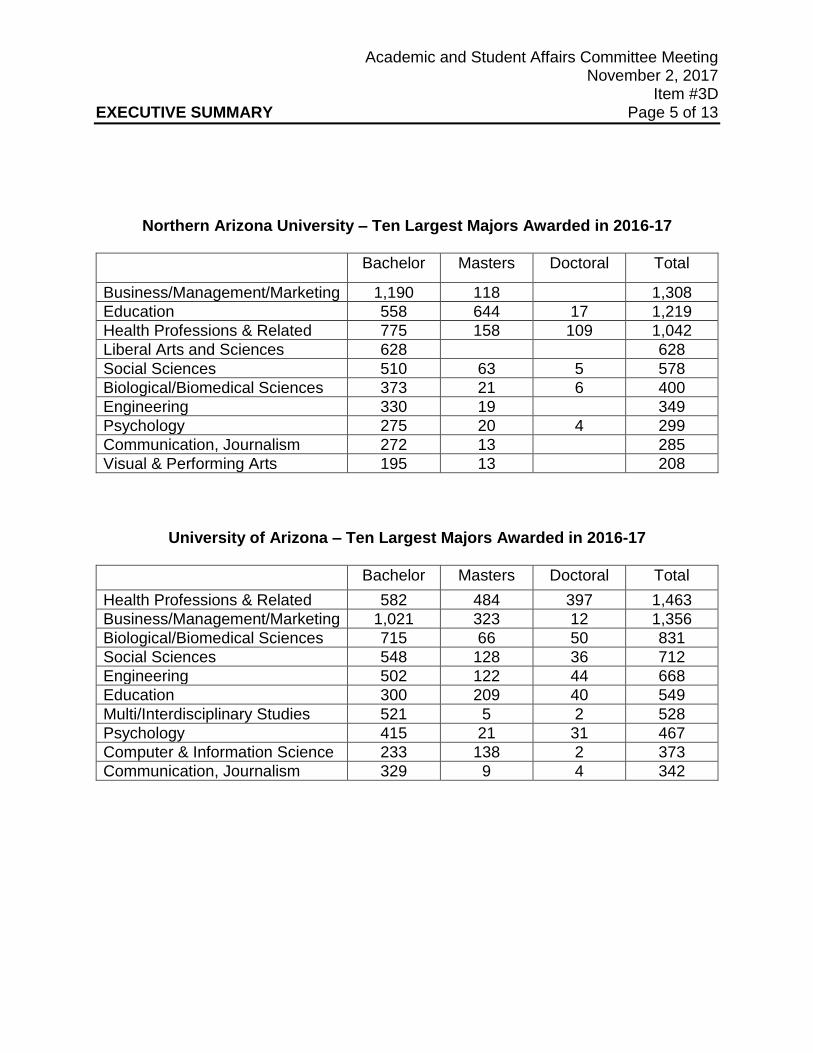
In 2016-17, Arizona State University awarded the largest number of bachelor’s degrees at 16,450 (56.1 percent), followed by the University of Arizona at 6,947 (23.7 percent), and Northern Arizona University at 5,901 (20.1 percent).
For graduate degrees awarded in 2016-17, Arizona State University conferred 6,884 (61.6 percent), Northern Arizona University conferred 1,366 (12.2 percent), and the University of Arizona conferred 2,933 (26.2 percent).
In the 2016-17 academic year, Arizona’s universities awarded a total of 40,481 degrees, with 23,334 (57.6 percent) being awarded by Arizona State University, 7,267 (18.0 percent) being awarded by Northern Arizona University, and 9,880 (24.4 percent) being awarded by the University of Arizona.
From 2007-08 to 2016-17, the number of undergraduate majors increased from 19,894 to 29,526. The greatest increases were:
Undergraduate Majors
2007-08 2016-17 Change
Business, Management & Marketing
3,381 5,422 2,041
Health Professions & Related Clinical Services
926 2,239 1,313
Engineering 1,027 2,238 1,211
Biological & Biomedical Sciences
1,130 2,078 948
Social Sciences 1,620 2,287 667
The largest declines in undergraduate majors from 2007-08 to 2016-17 were recorded in Education (down 634), Foreign Languages (down 82), Architecture (down 69) and History (down 66).
Academic and Student Affairs Committee Meeting November 2, 2017
Item #3D EXECUTIVE SUMMARY Page 3 of 13
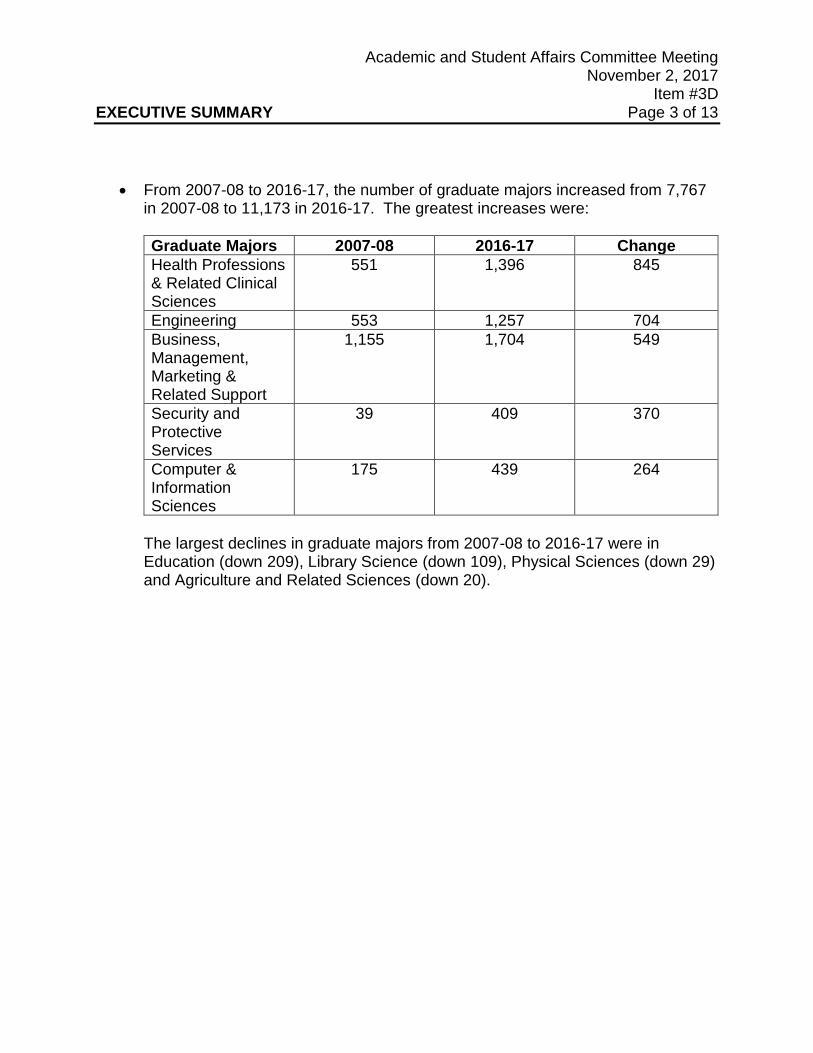
From 2007-08 to 2016-17, the number of graduate majors increased from 7,767 in 2007-08 to 11,173 in 2016-17. The greatest increases were:
Graduate Majors 2007-08 2016-17 Change
Health Professions & Related Clinical Sciences
551 1,396 845
Engineering 553 1,257 704
Business, Management, Marketing & Related Support
1,155 1,704 549
Security and Protective Services
39 409 370
Computer & Information Sciences
175 439 264
The largest declines in graduate majors from 2007-08 to 2016-17 were in Education (down 209), Library Science (down 109), Physical Sciences (down 29) and Agriculture and Related Sciences (down 20).
Academic and Student Affairs Committee Meeting November 2, 2017
Item #3D EXECUTIVE SUMMARY Page 4 of 13
Arizona University System – Ten Largest Majors Awarded in 2016-17
Bachelor Masters Doctoral Total
Business/Management/Marketing 5,422 1,663 41 7,126
Education 1,479 2,065 111 3,655
Health Professions & Related 2,239 803 593 3,635
Engineering 2,238 1,079 178 3,495
Social Sciences 2,287 378 76 2,741
Biological/Biomedical Sciences 2,078 158 92 2,328
Communication, Journalism 1,769 78 14 1,842
Psychology 1,584 107 104 1,861
Visual & Performing Arts 1,200 213 64 1,477
Multi/Interdisciplinary Studies 1,328 93 13 1,434
Arizona State University – Ten Largest Majors in 2016-17
Bachelor Masters Doctoral Total
Business/Management/Marketing 3,211 1,222 29 4,462
Engineering 1,406 938 134 2,478
Education 621 1,212 54 1,887
Social Sciences 1,229 187 35 1,451
Communication, Journalism 1,168 56 10 1,234
Health Professions & Related 882 161 87 1,130
Biological/Biomedical Sciences 990 71 36 1,097
Security & Protective Services 631 409 1,040
Psychology 886 62 70 1,018
Visual & Performing Arts 743 144 43 930
Academic and Student Affairs Committee Meeting November 2, 2017
Item #3D EXECUTIVE SUMMARY Page 5 of 13
Northern Arizona University – Ten Largest Majors Awarded in 2016-17
Bachelor Masters Doctoral Total
Business/Management/Marketing 1,190 118 1,308
Education 558 644 17 1,219
Health Professions & Related 775 158 109 1,042
Liberal Arts and Sciences 628 628
Social Sciences 510 63 5 578
Biological/Biomedical Sciences 373 21 6 400
Engineering 330 19 349
Psychology 275 20 4 299
Communication, Journalism 272 13 285
Visual & Performing Arts 195 13 208
University of Arizona – Ten Largest Majors Awarded in 2016-17
Bachelor Masters Doctoral Total
Health Professions & Related 582 484 397 1,463
Business/Management/Marketing 1,021 323 12 1,356
Biological/Biomedical Sciences 715 66 50 831
Social Sciences 548 128 36 712
Engineering 502 122 44 668
Education 300 209 40 549
Multi/Interdisciplinary Studies 521 5 2 528
Psychology 415 21 31 467
Computer & Information Science 233 138 2 373
Communication, Journalism 329 9 4 342

Academic and Student Affairs Committee Meeting November 2, 2017
Item #3D EXECUTIVE SUMMARY Page 6 of 13
Academic
Year Undergraduate Graduate Total Undergraduate Graduate Total Undergraduate Graduate Total Undergraduate Graduate Total
1980-81 10,134 3,830 13,964 5,032 1,495 6,527 1,551 439 1,990 3,551 1,896 5,447
1981-82 10,325 3,839 14,164 4,894 1,487 6,381 1,681 439 2,120 3,750 1,913 5,663
1982-83 10,507 3,886 14,393 4,935 1,468 6,403 1,684 484 2,168 3,888 1,934 5,822
1983-84 10,409 3,697 14,106 4,985 1,449 6,434 1,656 463 2,119 3,768 1,785 5,553
1984-85 10,678 3,737 14,415 5,250 1,499 6,749 1,708 475 2,183 3,720 1,763 5,483
1985-86 10,168 3,661 13,829 5,151 1,438 6,589 1,536 480 2,016 3,481 1,743 5,224
1986-87 10,618 3,679 14,297 5,445 1,413 6,858 1,521 548 2,069 3,652 1,718 5,370
1987-88 10,620 3,971 14,591 5,360 1,577 6,937 1,600 533 2,133 3,660 1,861 5,521
1988-89 11,255 4,156 15,411 5,579 1,760 7,339 1,657 622 2,279 4,019 1,774 5,793
1989-90 11,582 4,399 15,981 5,558 1,879 7,437 1,906 702 2,608 4,118 1,818 5,936
1990-91 12,244 4,731 16,975 5,912 2,027 7,939 2,106 820 2,926 4,226 1,884 6,110
1991-92 12,921 4,823 17,744 6,012 1,892 7,904 2,322 1,005 3,327 4,587 1,926 6,513
1992-93 13,871 5,181 19,052 6,431 2,207 8,638 2,592 1,036 3,628 4,848 1,938 6,786
1993-94 13,749 5,635 19,384 6,307 2,325 8,632 2,693 1,203 3,896 4,749 2,107 6,856
1994-95 13,880 6,089 19,969 6,519 2,587 9,106 2,554 1,457 4,011 4,807 2,045 6,852
1995-96 14,062 6,082 20,144 6,545 2,520 9,065 2,905 1,476 4,381 4,612 2,086 6,698
1996-97 14,489 6,340 20,829 6,880 2,676 9,556 2,832 1,554 4,386 4,777 2,110 6,887
1997-98 15,335 6,532 21,867 7,312 2,781 10,093 2,751 1,744 4,495 5,272 2,007 7,279
1998-99 15,402 6,672 22,074 7,507 2,938 10,445 3,041 1,737 4,778 4,854 1,997 6,851
1999-00 15,811 6,814 22,625 7,940 2,923 10,863 2,939 1,917 4,856 4,932 1,974 6,906
2000-01 15,531 6,761 22,292 7,742 2,870 10,612 2,867 1,947 4,814 4,922 1,944 6,866
2001-02 16,005 7,093 23,098 8,190 3,088 11,278 2,834 2,039 4,873 4,981 1,966 6,947
2002-03 16,977 7,280 24,257 8,566 3,237 11,803 3,059 2,009 5,068 5,352 2,034 7,386
2003-04 17,358 7,723 25,081 9,116 3,410 12,526 2,939 2,125 5,064 5,303 2,188 7,491
2004-05 18,420 7,277 25,697 9,729 3,092 12,821 2,942 2,008 4,950 5,749 2,177 7,926
2005-06 18,396 7,358 25,754 9,855 3,200 13,055 2,928 2,014 4,942 5,613 2,144 7,757
2006-07 18,658 7,555 26,213 10,137 3,492 13,629 2,953 1,849 4,802 5,568 2,214 7,782
2007-08 19,281 7,783 27,064 10,706 3,738 14,444 2,963 1,850 4,813 5,612 2,195 7,807
2008-09 20,346 8,529 28,875 11,229 4,381 15,610 3,203 1,822 5,025 5,914 2,326 8,240
2009-10 21,110 8,521 29,631 11,810 4,570 16,380 3,473 1,790 5,263 5,827 2,161 7,988
2010-11 22,212 9,080 31,292 12,194 4,896 17,090 3,825 1,802 5,627 6,193 2,382 8,575
2011-12 23,842 8,914 32,756 13,210 4,835 18,045 4,281 1,655 5,936 6,351 2,424 8,775
2012-13 24,920 9,048 33,968 13,913 5,003 18,916 4,513 1,524 6,037 6,494 2,521 9,015
2013-14 25,785 9,417 35,202 14,381 5,380 19,761 5,034 1,461 6,495 6,370 2,576 8,946
2014-15 26,634 10,222 36,856 14,842 6,178 21,020 5,047 1,349 6,396 6,745 2,695 9,440
2015-16 27,472 10,995 38,467 15,264 6,689 21,953 5,119 1,422 6,541 7,089 2,884 9,973
2016-17 29,298 11,183 40,481 16,450 6,884 23,334 5,901 1,366 7,267 6,947 2,933 9,880
Degrees Awarded in the Arizona University System
Arizona University System Arizona State University Northern Arizona University University of Arizona

Academic and Student Affairs Committee Meeting November 2, 2017
Item #3D EXECUTIVE SUMMARY Page 7 of 13
0
5,000
10,000
15,000
20,000
25,000
30,000
35,000
40,000
45,000
Degrees Awarded 1980-81 through 2016-17
Arizona State University Northern Arizona University
University of Arizona Arizona University System
0
5,000
10,000
15,000
20,000
25,000
30,000
35,000
Undergraduate Degrees Awarded 1980-81 through 2016-17
Arizona State University Northern Arizona University
University of Arizona Arizona University System

Academic and Student Affairs Committee Meeting November 2, 2017
Item #3D EXECUTIVE SUMMARY Page 8 of 13
0
2,000
4,000
6,000
8,000
10,000
12,000
Graduate Degrees Awarded from 1980-81 through 2016-17
Arizona State University Northern Arizona University
University of Arizona Arizona University System

Academic and Student Affairs Committee Meeting November 2, 2017
Item #3D EXECUTIVE SUMMARY Page 9 of 13
Bachelor
Majors
Awarded
Master
Majors
Awarded
Doctoral -
Professional
Practice
Doctoral -
Research /
Scholarship
CIP Code Description
Agriculture, and Related Sciences 131 42 2
Natural Resources and Conservation 318 125 19
Architecture and Related Services 284 158 2
Area, Ethnic, Cultural, and Gender Studies 118 37 19
Communication, Journalism, and Related Programs 1,769 78 14
Communications Technologies/Technicians & Support 88
Computer and Information Sciences & Support Services 807 410 29
Personal and Culinary Services
Education 1,479 2,065 111
Engineering 2,238 1,079 178
Engineering Technologies/Technicians 99 90
Foreign Languages, Literatures, and Linguistics 333 47 33
Family and Consumer Sciences/Human Sciences 684 185 5
Legal Professions and Studies 182 150 329 10
English Language and Literatures/Letters 595 118 20
Liberal Arts and Sciences, General Studies & Humanities 911 67
Library Science 44
Biological and Biomedical Sciences 2,078 158 92
Mathematics and Statistics 272 54 33
ROTC
Military Technologies
Multi/Interdisciplinary Studies 1,328 93 13
Parks, Recreation, Leisure and Fitness Studies 628 9 9
Philosophy and Religious Studies 171 20 4
Theology and Religious Vocations
Physical Sciences 401 118 124
Science Technologies and Technicians 258
Psychology 1,576 103 105
Security and Protective Services 768 409
Public Administration and Social Service Professions 496 430 17
Social Sciences 2,287 378 76
Construction Trades
Mechanic and Repair Technologies/Technicians
Precision Production
Transportation and Materials Moving 59
Visual and Performing Arts 1,200 213 64
Health Professions and Related Clinical Sciences 2,239 803 385 208
Business, Management, Marketing, and Related Support 5,422 1,663 41
History 307 68 17
TOTAL 29,526 9,214 714 1,245
Arizona University System Majors Awarded in 2016-17

Academic and Student Affairs Committee Meeting November 2, 2017
Item #3D EXECUTIVE SUMMARY Page 10 of 13
Bachelor
Majors
Awarded
Master
Majors
Awarded
Doctoral -
Professional
Practice
Doctoral -
Research /
Scholarship
CIP Code Description
Agriculture, and Related Sciences 2 17
Natural Resources and Conservation 82 63 5
Architecture and Related Services 157 102 2
Area, Ethnic, Cultural, and Gender Studies 49 13 4
Communication, Journalism, and Related Programs 1,168 56 10
Communications Technologies/Technicians & Support 88
Computer and Information Sciences & Support Services 513 271 27
Personal and Culinary Services
Education 621 1,212 54
Engineering 1,406 938 134
Engineering Technologies/Technicians 72 77
Foreign Languages, Literatures, and Linguistics 105 9 15
Family and Consumer Sciences/Human Sciences 558 184
Legal Professions and Studies 133 119 199 5
English Language and Literatures/Letters 390 38 14
Liberal Arts and Sciences, General Studies & Humanities 282 67
Library Science
Biological and Biomedical Sciences 990 71 36
Mathematics and Statistics 156 26 16
ROTC
Military Technologies
Multi/Interdisciplinary Studies 747 80 11
Parks, Recreation, Leisure and Fitness Studies 437 9 9
Philosophy and Religious Studies 90 11 1
Theology and Religious Vocations
Physical Sciences 146 12 43
Science Technologies and Technicians 115
Psychology 886 62 70
Security and Protective Services 631 409
Public Administration and Social Service Professions 331 393 17
Social Sciences 1,229 187 35
Construction Trades
Mechanic and Repair Technologies/Technicians
Precision Production
Transportation and Materials Moving 59
Visual and Performing Arts 743 144 43
Health Professions and Related Clinical Sciences 882 161 87
Business, Management, Marketing, and Related Support 3,211 1,222 29
History 205 55 10
TOTAL 16,484 6,008 199 677
Arizona State University Majors Awarded in 2016-17

Academic and Student Affairs Committee Meeting November 2, 2017
Item #3D EXECUTIVE SUMMARY Page 11 of 13
Bachelor
Majors
Awarded
Master
Majors
Awarded
Doctoral -
Professional
Practice
Doctoral -
Research /
Scholarship
CIP Code Description
Agriculture, and Related Sciences
Natural Resources and Conservation 138 29 1
Architecture and Related Services
Area, Ethnic, Cultural, and Gender Studies 13
Communication, Journalism, and Related Programs 272 13
Communications Technologies/Technicians & Support
Computer and Information Sciences & Support Services 61 1
Personal and Culinary Services
Education 558 644 17
Engineering 330 19
Engineering Technologies/Technicians
Foreign Languages, Literatures, and Linguistics 58 5
Family and Consumer Sciences/Human Sciences
Legal Professions and Studies 7
English Language and Literatures/Letters 67 63
Liberal Arts and Sciences, General Studies & Humanities 628
Library Science
Biological and Biomedical Sciences 373 21 6
Mathematics and Statistics 33 14
ROTC
Military Technologies
Multi/Interdisciplinary Studies 60 8
Parks, Recreation, Leisure and Fitness Studies 191
Philosophy and Religious Studies 15
Theology and Religious Vocations
Physical Sciences 112 19
Science Technologies and Technicians 93
Psychology 275 20 4
Security and Protective Services
Public Administration and Social Service Professions 106 7
Social Sciences 510 63 5
Construction Trades
Mechanic and Repair Technologies/Technicians
Precision Production
Transportation and Materials Moving
Visual and Performing Arts 195 13
Health Professions and Related Clinical Sciences 775 158 109
Business, Management, Marketing, and Related Support 1,190 118
History 35 9
TOTAL 6,095 1,219 109 38
Northern Arizona University Majors Awarded in 2016-17
Academic and Student Affairs Committee Meeting November 2, 2017
Item #3D EXECUTIVE SUMMARY Page 12 of 13
Bachelor
Majors
Awarded
Master
Majors
Awarded
Doctoral -
Professional
Practice
Doctoral -
Research /
Scholarship
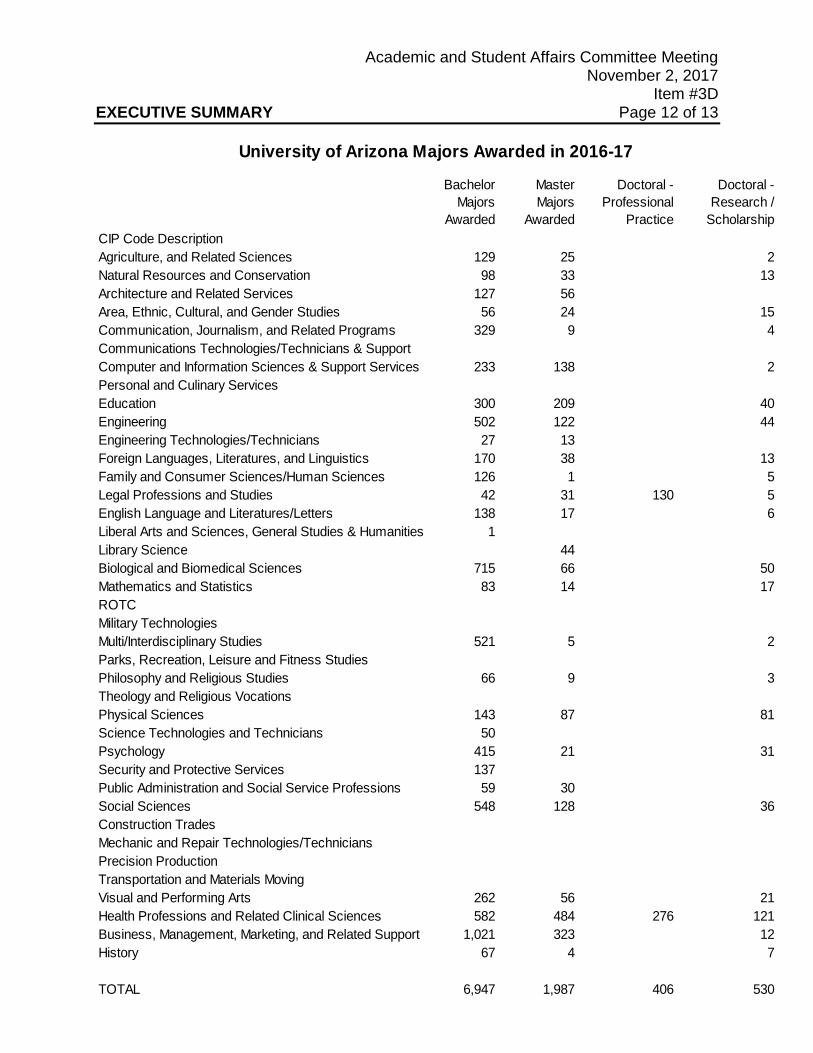
CIP Code Description
Agriculture, and Related Sciences 129 25 2
Natural Resources and Conservation 98 33 13
Architecture and Related Services 127 56
Area, Ethnic, Cultural, and Gender Studies 56 24 15
Communication, Journalism, and Related Programs 329 9 4
Communications Technologies/Technicians & Support
Computer and Information Sciences & Support Services 233 138 2
Personal and Culinary Services
Education 300 209 40
Engineering 502 122 44
Engineering Technologies/Technicians 27 13
Foreign Languages, Literatures, and Linguistics 170 38 13
Family and Consumer Sciences/Human Sciences 126 1 5
Legal Professions and Studies 42 31 130 5
English Language and Literatures/Letters 138 17 6
Liberal Arts and Sciences, General Studies & Humanities 1
Library Science 44
Biological and Biomedical Sciences 715 66 50
Mathematics and Statistics 83 14 17
ROTC
Military Technologies
Multi/Interdisciplinary Studies 521 5 2
Parks, Recreation, Leisure and Fitness Studies
Philosophy and Religious Studies 66 9 3
Theology and Religious Vocations
Physical Sciences 143 87 81
Science Technologies and Technicians 50
Psychology 415 21 31
Security and Protective Services 137
Public Administration and Social Service Professions 59 30
Social Sciences 548 128 36
Construction Trades
Mechanic and Repair Technologies/Technicians
Precision Production
Transportation and Materials Moving
Visual and Performing Arts 262 56 21
Health Professions and Related Clinical Sciences 582 484 276 121
Business, Management, Marketing, and Related Support 1,021 323 12
History 67 4 7
TOTAL 6,947 1,987 406 530
University of Arizona Majors Awarded in 2016-17

Academic and Student Affairs Committee Meeting November 2, 2017
Item #3D EXECUTIVE SUMMARY Page 13 of 13
Requested Action This updated 2016-17 Degrees and Majors Report is presented for the committee’s information and review. No action is required by the board.
![Ordinance No. 19-92 Attachment - Zanesville, Ohio...2019/08/12 · o degrees [d] 30 degrees 45 degrees 60 degrees 90 degrees [e] Dnveway width [f] m feet: Residential Districts Minimum](https://img.pdfslide.us/doc/110x75/5f40e8cf15dd5c29445849f0/ordinance-no-19-92-attachment-zanesville-20190812-o-degrees-d-30.jpg)