Embed Size (px)
Citation preview
SASEC2015
Third Southern African Solar Energy Conference
11 – 13 May 2015
Kruger National Park, South Africa
Degree Days and Building Energy Demand
Ciulla G.*, Lo Brano V. and Moreci E.
*Author for correspondence
Dipartimento di Energia, ingegneria dell’Informazione e Modelli matematici
University of Palermo,
Palermo, 90128,
Italy,
E-mail: [email protected]
ABSTRACT
Degree-days (DD) are a climatic indicator that can be used in
the assessment and analysis of weather related to energy
consumption of buildings. Essentially, degree-days are a
summation of the differences between the outdoor temperature
and some reference (or base) temperature over a specific time
period. In literature, different method can be used for
determining the DD value and generally the choice depends on
the availability of climatic data of each location. In this paper,
after a review and comparison of the most common approaches
used to determine DD, the Italian procedure was deeply
analyzed. The application of Italian technical rules is based on
weather data calculated on a monthly time series monitored
before 1994. The obsolescence of the used weather data leads to
an incorrect assessment of energy performances. Taking into
account the climatic change that in the last years has affected
Italy land, the aim of the paper is to assess the impact of new DD
values in calculating energy demand of buildings.
For these reasons, in this paper the authors recalculated DD
of some Italian cities, considering the average monthly
temperatures of the last decade. Data were extracted from
Meteonorm 7, one of the most popular software for the statistical
processing of climate data. Furthermore, other datasets were
generated considering future scenarios defined by IPCC
(Intergovernmental Panel on Climate Change). A comparison
with the official DD issued by current legislation and new DD
recalculated with more recent data highlighted how climate
change have affected the calculation of this parameter.
INTRODUCTION The adverse effects on the earth climate due to the global
increasing demands of energy, have become the matter of
concern for people of over the world. The rise of atmospheric
temperatures due to climate change may mean that historic 20-
year averages used for energy planning will not be appropriate,
and the rate of temperature rise in the near future will dictate how
reliable these values will be for setting energy budgets [1].
The outdoor temperature variations directly affects water
resources, power generation, agriculture, construction and in
particular the energy consumption for cooling and heating of
buildings [2]. Indeed, several case studies [3-8] have indicated
considerable impacts of temperature changes on energy
consumption in buildings. Since 1934, one the simplest ways to
estimate the energy consumptions in building is the Degree-Days
(DD) [9].
Usually, the DD calculation is accepted as an index of energy
consumption for heating and cooling of the buildings and
represents a simplest method used in Heating, Ventilating and
Air-Conditioning industries to estimate heating and cooling
energy requirements. Essentially, it is the summation of
temperature differences over time and hence it capture both
extremity and duration of outdoor temperatures; the temperature
difference is calculated between a reference temperature and the
outdoor air temperature. The reference temperature for buildings
is a known variable (base temperature); a possible definition for
base temperature could be: the outdoor temperature at which the
heating/cooling systems do not need to run in order to maintain
comfort conditions. The base temperature is central to the
successful understanding and use of DD [1]. In an heated
building, during cold season, heat is lost toward the external
environment; some of this heat is replaced by casual indoor heat
gains, by people, lights, machines and solar gains, while the other
part of the heat is supplied by the heating system.
In addition to the base temperature, it is very important the
outdoor temperature value. A variation of this value could lead
to an incorrect estimation of DD and subsequently an error in the
evaluation of building energy demand.
NOMENCLATURE
DD [-] Degree Days
EPi,c [kWh/m2year] Energy performance index for cooling period
EPi,DWH
[kWh/m2year] Energy performance index for the production of
domestic hot water
EPi,gl [kWh/m2year] Overall Energy performance index
65
EPi,h [kWh/m2year] Energy performance index for heating period EPi,l [kWh/m2year] Energy performance index for artificial lighting
S [m2] Surface which delimits the heated volume to the
outside Ti [°C] Reference indoor thermal comfort temperature
Tr [°C] reference outdoor thermal comfort temperature
Ts [°C] Second reference outdoor temperature (12°C) V [m3] Heated indoor volume
For example, in London and Edinburgh from 1976 to 1995
the degree days value felt by around 10% [10]. Consequently, it
is possible that heating degree days could fall by 30%-40% in
the UK by the 2080s, due to a constant increment of outdoor
temperature. In this contest, it will be important to evaluate the
impact of the climate change on the estimation of DD and
building energy consumption. More recent works have been
carried out for different countries: Romania [4], Turkey [11,
12,13], Australia [14], Greece [15], China [16,17], Spain[18] ,
Switzerland [8], Saudi Arabia [19, 20], Morocco [21]. Indeed the
correct estimation and prediction of the building energy demand
represents a crucial point in order to perform scenario analyses
able to determine the best policy to comply the requirements for
new and existent buildings ruled by European Union (EU,
91/2002 Energy Performance of Building Directive – EPBD)
[22] and others countries.
DEGREE DAYS: DIFFERENT DEFINITIONS Degree days for a location is defined as the sum, extended to
all days of a conventional twelve-month period, of only the
positive differences between the daily temperature and the daily
average temperature. In the case of Heating Degree Days (HDD)
are computed only the differences between outside and base
temperature whenever the outside temperature falls below the
base temperature, during heating period. On the contrary, the
Cooling Degree Days (CDD) are computed only the differences
between outside and base temperature whenever the outside
temperature exceeds the base temperature, during the cooling
period.
There are several ways to determine DD [1,18]:
mean degree-hours: calculated from the hourly
temperature records (as the Italian calculation method);
daily maximum and minimum temperatures: e.g. the
Meteorological Office equations that uses mean daily
temperatures;
mean daily temperature DD, is used in some country
such as in USA, as defined by ASHRAE [23] and
Germany [24]
direct calculation of monthly DD from mean monthly
temperature and the monthly standard deviation; e.g.
Hitchin’s formula [25-30].
OTHER METHODS In literature, it is possible to find other methods. For example,
ASHRAE recommends the method by Erbs [29], similar to
Hitchin, for estimating monthly degree-days. There are also
reports of individual energy managers adopting their own
techniques based on the kind of weather data that is available to
them. However, it should be noted that Equation (1) should
always be the preferred option if suitable hourly data and
adequate data processing tools are available.
THE ORIGIN OF ITALIAN DD The determination of the DD is fundamental in the correct
evaluation of the energy needs of a building-system in relation
with meteorological conditions. The attention to energy saving
and the subsequent release of the first relevant standards born in
1974 after the first energy crisis.
Italy reacted to this problem by amending a law [31] and
then updating by art. 37 of law [32], which for the first time
stated the principle of modern energy saving concepts in terms
of plant design and thermal insulation of buildings. The [31] was
implemented with the decrees [33-36]. For the first time, in the
DM [34] are tabulated the Italian DD. According to the definition
of DD, for a given location, fixed a reference indoor thermal
comfort temperature Tr (20°C), DD are calculated according to
the following formula:
r i
i
DD T T (1)
where the sum is extended to all days of the year in which the
average daily temperature Ti is lower than a second reference
temperature Ts (≥ Tr) conventionally fixed.
ITALIAN CLIMATE CONTEXT The Italian region is between the 47th and the 36th parallel
north, located almost in the centre of the temperate zone of the
northern hemisphere.
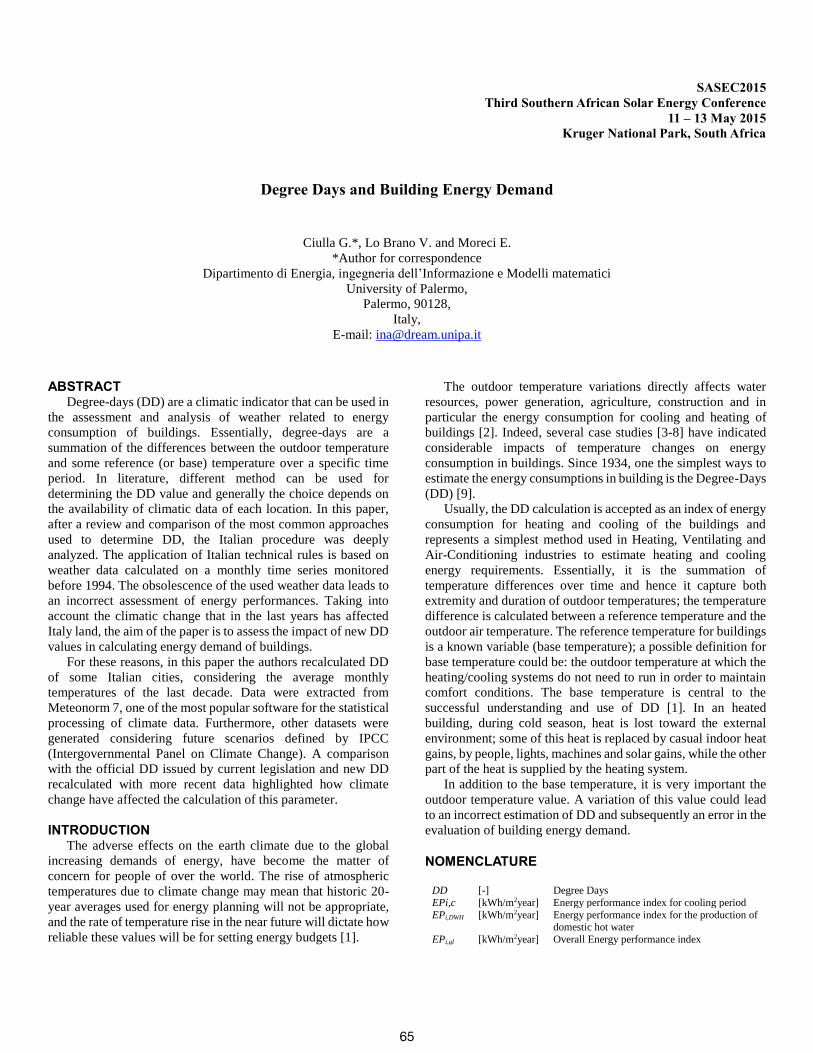
From a general perspective Italian climate is also favoured
by the large body of water of the Mediterranean Sea that
surrounds almost every side. Mediterranean Sea can be
considered as a beneficial reservoir of heat and humidity that
determines a particular zone often called “temperate
Mediterranean” (Figure 1).
Figure 1 Climate map of Italy according to M. Pinna
The climate varies considerably from the north to the south
of Italy. In the north of the country, the climate is harsh, with
very cold winters and very hot and particularly humid summers,
due to the presence of Alps and Apennines. The Alps, not only
are a sort of barrier for cold currents coming from the Arctic
regions of northern Europe, but also for the temperate but wet air
masses from the North Atlantic. In addition, the Alps surround
(along with facing the Northern Apennines), a closed basin,
subject to atmospheric subsidence, with stagnant air in the lower
Temperate Climate (type C of Koppen)
Subtropical
Hot temperate
Sub littoral
Sub continental
Cool temperate
Temperate Climate (type D of Koppen)
Cold temperate
Temperate Climate (type E of Koppen)
Cold
Glacial
66
layers. This basin area called “Po-Venetian”, have an
independent climate, different from that of the surrounding areas
of south-eastern France, Switzerland and Austria. Also in this
context, the presence of the Adriatic Sea, long and shallow
(especially near the coast) and sandwiched between two
peninsulas (the Italian and Balkan) gives a limited beneficial
effect: its influence is much less important than that exercised by
the wider and deeper Tyrrhenian Sea, on the western side of the
Italian peninsula [37]. In central Italy, the climate is milder, with
a smaller difference in temperature between summer and winter
and a shorter and less intense cold season than in the north;
summers are longer, but the sultriness of the northern cities is
mitigated by the sea. In southern Italy and the islands, winters
are never particularly harsh, and spring and autumn temperatures
are similar to those reached in the summer in other areas of Italy
[38]. Temperatures vary widely in Italy, in the north, centre or
south of the country. The summer can be quite hot, mainly in the
south of the peninsula, with high nocturnal temperatures of
usually 28-33°C, but sometimes-even 40°C. Thunderstorms are
quite common especially in the northern areas. Hot air rising
from the sea can cause heavy thunderstorms especially in early
fall, but these bring often the only summer rain that rapidly
evaporates. In spring and fall, the Scirocco, a warm wind from
Africa, raises the temperature of the peninsula. In the summer
these winds can bring very hot, unpleasant weather, sometimes
even up to the northern districts of Italy [39].
PRIMARY ENERGY DEMAND AND DD According to the “National guidelines for energy
certification of buildings”[40] , the Italian buildings
classification is based on an index of overall energy performance
(EPgl) defined as follows:
, ., , , .,i gl i h i DHW i c i lEP EP EP EP EP (2)
where:
EPi,h = energy performance index for heating period;
EPDHW= energy performance index for the production of
domestic hot water;
EPc = energy performance index for cooling period;
EPi,l = energy performance index for artificial lighting.
The determination of Egl permits to identify the energy class of a
building, each identified by a letter from A, the best class, to G,
the worst class. The class of a building should be included in the
energy performance certificate. The energy certification is
applied to buildings of all the categories laid down in Art. 3 of
[36] depending on use. In the case of residential buildings,
category E.1(1): residential building with permanent
occupation, all the above indexes are expressed in kWh / (m2 •
year); in the other cases in kWh / (m3 • year).
Nowadays, in Italy among the indexes of Equation (2), are
required only the calculation of EPi,h and EPi,DHW;, therefore it is
assumed:
, ., ,i gl i h i DHWEP EP EP (3)
The annual consumption of primary energy for heating and
production of domestic hot water should be less than the
prescribed limit (Annex C of [41]):
, ,limi gl i itEP EP (4)
The limits of building energy demand, for heating period,
applicable from January 1, 2010, in the following tables (Table
1 and Table 2) are shown:
Table 1 Values of EPi,limit for space heating applicable from
January 1, 2010 for residential buildings in kWh/m2year
S/V Climatic Zone
A B C D E F
Up to
600 DD
from 601 DD
To 900 DD
from 901 DD
To 1400 DD
from 1401 DD
To 2100 DD
from 2101 DD
To 3000 DD
Over 3000 DD
< 0.2
8.5 8.5 12.8 12.8 21.3 21.3 34 34 46.8 46.8
≥ 0.9
36 36 48 48 68 68 88 88 116 116
Table 2 Values of EPi,limit for space heating applicable from
January 1, 2010 for other buildings in kWh/m3year S/V Climatic Zone
A B C D E F
Up to
600 DD
from 601 DD
To 900 DD
from 901 DD
To 1400 DD
from 1401 DD
To 2100 DD
from 2101 DD
To 3000 DD
Over 3000 DD
< 0.2
2 2 3.6 3.6 6 6 9.6 9.6 12.7 12.7
≥ 0.9
8.2 8.2 12.8 12.8 17.3 17.3 22.5 22.5 31 31
The limit values given in the tables are expressed as a
function of Climatic Zone, as identified in Article 2 of [36], and
the ratio index of the building S/V, where:
a) S, expressed in square meters, is the surface which delimits
the heated volume V to the outside;
b) V is the gross volume, measured in cubic meters, of the
heated building, delimited by surfaces that surround it.
For values of S/V in the range from 0.2 to 0.9 and/or for
intermediate DD, the limits of energy demand could be
calculated applying a linear interpolation process.
For specific locations characterized by DD exceeding 3001,
the limit of energy demand is determined by linear extrapolation,
based on the values set for the E Climatic Zone, with reference
to the number of the DD of the location of interest.
In this work have been considered four Italian cities (Table
3) representative of the entire peninsula and of different Climatic
Zones: Milano (northern Italy, E Climatic Zone), Roma (Central
Italy, D Climatic Zone), Napoli (Southern Italy, C Climatic
Zone) and Messina (Southern Italy, B Climatic Zone);
Table 3 Four Italian cities and their climatic characteristics Italian cities
Climatic Zone
DD Heating Period
Milano E 2404 15 October - 15 April
Roma D 1415 1 November- 15 April
Napoli C 1034 15 November - 31 March
Messina B 707 1 December - 31 March
CLIMATIC DATA: METEONORM SOFTWARE Meteonorm [42] makes possible to generate climatic data
where measurements are not available. Originally, it was
developed for the particular case of Switzerland but now is
available for the whole world. It is based on well validated
models and many databases of several tens of years. To generate
the various climatic parameters, the software uses as input
internal radiation values or real monthly mean values
downloaded from the Internet. It also offers the possibility to
67
import personal hourly or monthly data. In addition, it is also
possible to specify the environment, such as for example, “open
site”, “urban conditions”, etc.
Meteonorm permits to access a catalogue of meteorological
data for solar applications and system design at any desiderated
locations in the world. The database consists by a climatological
dataset of 8.300 weather stations. Principal measured parameters
are: monthly means of global radiation, temperature, humidity,
precipitation, days with precipitation, wind speed and direction,
sunshine duration. To generate a yearly time series it is possible
to select different empirical data: data recorded between 1961–
90 or between 2000–2009; for areas with low density of stations
it is possible to use satellite data. From the monthly values
(station data, interpolated data or imported data), Meteonorm
calculates hourly values of all parameters using a stochastic
model. The resulting time series correspond to “typical years”.
Usually, measurement data can only be used for locations
close to the weather station; elsewhere, the data has to be
interpolated among different stations. The sophisticated
interpolation models inside Meteonorm allow a reliable
calculation of solar radiation, temperature and additional
parameters at any site in the world, selecting the weather stations
and site. Furthermore, Meteonorm allows accessing to climate
change forecasts by using the IPCC (Intergovernmental Panel on
Climate Change) scenarios.
Meteonorm is widely internationally used; indeed in
literature are used and are validated the databases of ASHRAE
Fundamental Handbook, of NREL (National Renewable Energy
Laboratory), of NOAA (National Oceanic Atmospheric
Administration) and of Meteonorm [43]. To calculate the DD it
is necessary to know the hourly trend of temperature of several
years of the site that permits to generate the typical year. In this
work, three different typical year were generated, based on:
• 1961-1990 time period
• 2000-2009 time period
• IPCC scenario.
The IPCC was established by the World Meteorological
Organization (WMO) and by the United Nations Environment
Programme (UNEP), to assess the scientific, technical and socio-
economic information relevant for the understanding of the risk
of human-induced climate change [44]. A set of scenarios was
developed to represent the range of driving forces and emissions
in the scenario literature to reflect current understanding and
knowledge about underlying uncertainties. The scenarios cover
a wide range of the main demographic, economic, and
technological driving forces of GHG (Greenhouses Gases),
sulphur emissions. Each scenario represents a specific
quantitative interpretation of one of four storylines. All the
scenarios based on the same storyline constitute a scenario
“family. The set of scenarios consists of six scenario groups
drawn from the four families: one group each in A2, B1, B2, and
three groups within the A1 family, characterizing alternative
developments of energy technologies: A1FI (fossil fuel
intensive), A1B (balanced), and A1T (predominantly non-fossil
fuel).
In this work, it was considered the B1 scenario at 2100. The
IPCC B1 storyline and scenario family describes a convergent
world with the same global population that peaks in mid-century
and declines thereafter, with rapid changes in economic
structures toward a service and information economy, with
reductions in material intensity, and the introduction of clean and
resource-efficient technologies [44].
THE TYPICAL YEAR GENERATION To better understand how the DD value is strongly dependent
on the time series of yearly outdoor temperatures that are
calculated by using monitored empirical values (or forecasted
values for future scenarios), the authors calculated HDD for 3
different datasets and for 4 Italian cities.
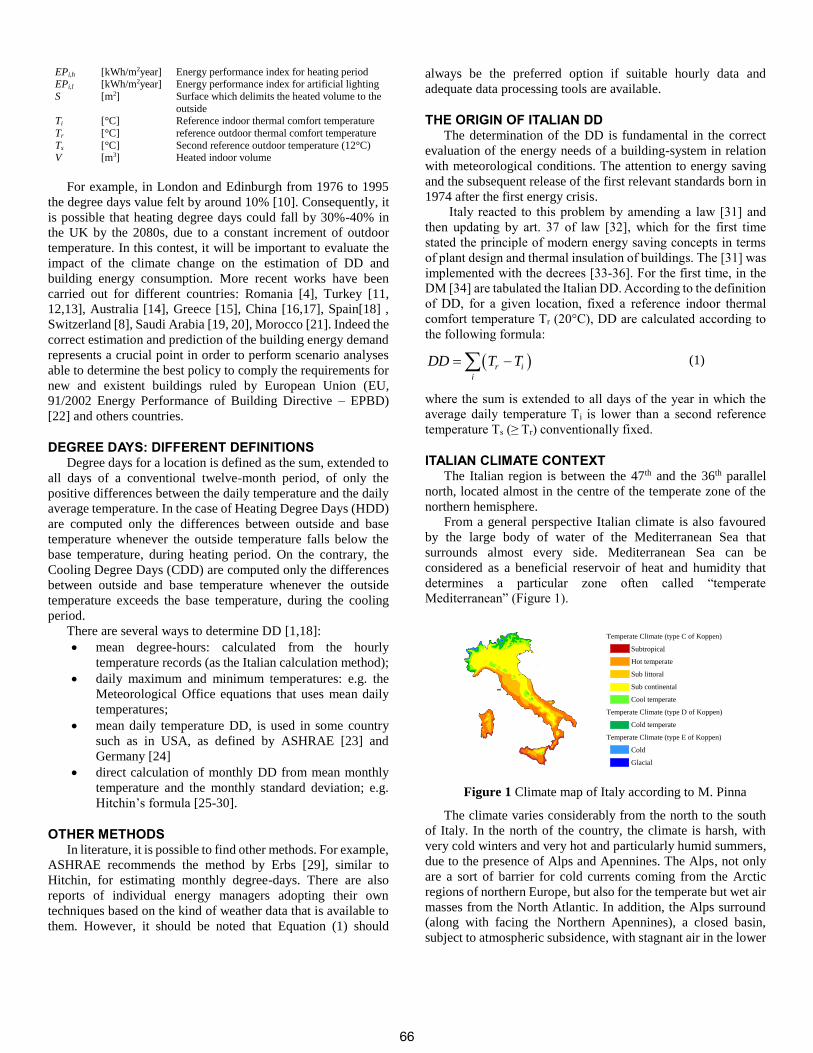
Meteonorm was used to generate 3 different typical years for
each cities (Milano, Roma, Napoli and Messina); the
temperature profiles for Napoli are plotted in Figure 2.
Figure 2 Temperature profile for each dataset in Napoli
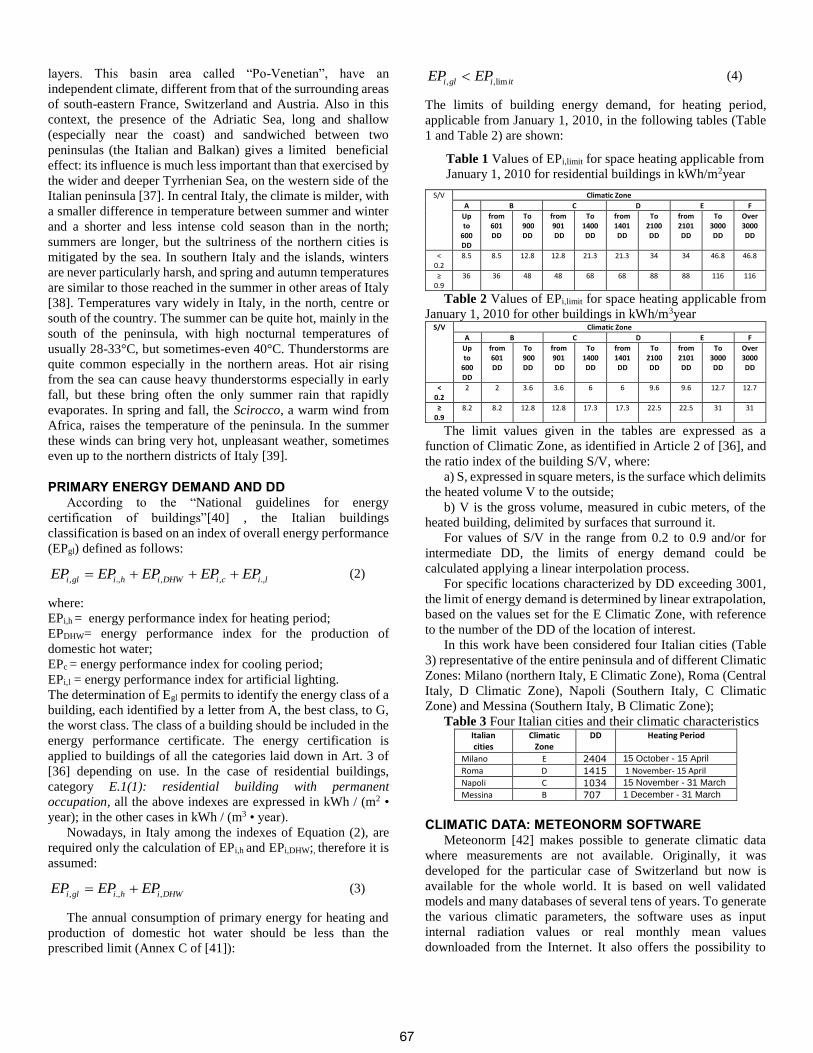
The respective DD in Napoli, for heating period, are:
Figure 3 Degree days for each profile in Napoli
Comparison and results
Generally, for each cities, is it possible to see a drop of the
DD value from 1°period (1961-1991) to 3° period (IPCC B1);
the drop is caused by the simultaneous increase of the outside air
temperature monitored firstly in 1961-1991 period, then in 2000-
2009 period. Even the IPCC B1scenario foresees a rise in the
outdoor temperatures due to the well-known phenomenon of
global warming linked to the GHG emissions.
The value of DD dictated by the [36], is always lower than
the value of extrapolated for the typical year based on the 1961-
1991 period of measurement. Only for the city of Milano, the DD
calculated with 2000-2009 measurement is lower than the value
dictated by the Italian law.
0
5
10
15
20
25
30
35
0 1000 2000 3000 4000 5000 6000 7000 8000Ex
tern
al T
em
pe
ratu
re [
°C]
time [h ]
Napoli
2000-2009 1961-1991 IPCC B1
heating period
heating period
1389
1322
917
1034
901
951
1001
1051
1101
1151
1201
1251
1301
1351
DEG
REE
DA
YS
Napoli
1961-1991 2000-2009 ipcc 2020 - b1 Decreto 412/93
Climatic Zone C
68
Finally, the DD calculated, taking into account the IPCC B1
scenario is always lower than the value dictated by the Italian
law. Table 4 collects, for each cities, a comparison among DD
law values and DD calculated in the future scenario IPCC B1.
Table 4 Evaluation of DD in each cities
As it is possible to see in Table 4 the reduction of DD values,
ranges from 9% to 28%, depending on latitude of the site.
Furthermore, for Roma and Messina, the reduction of DD value
leads to a variation of the Climatic Zone (toward a warmer zone).
Obviously, the change in Climatic Zone leads to different
energy ratings for building: the EPi,gl energy demand required for
heating will be lower. To better understand as the EPi,gl reference
values could change, the following figures collect the
comparison between the actual EPi,gl calculated with the DD law
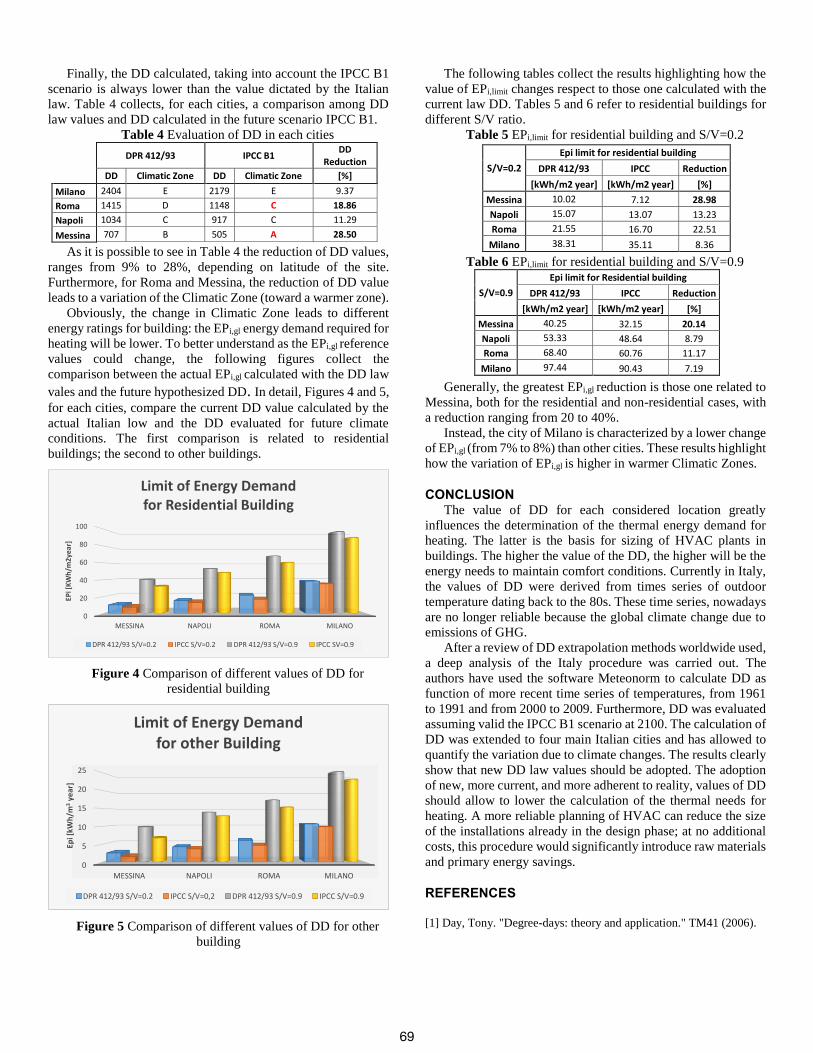
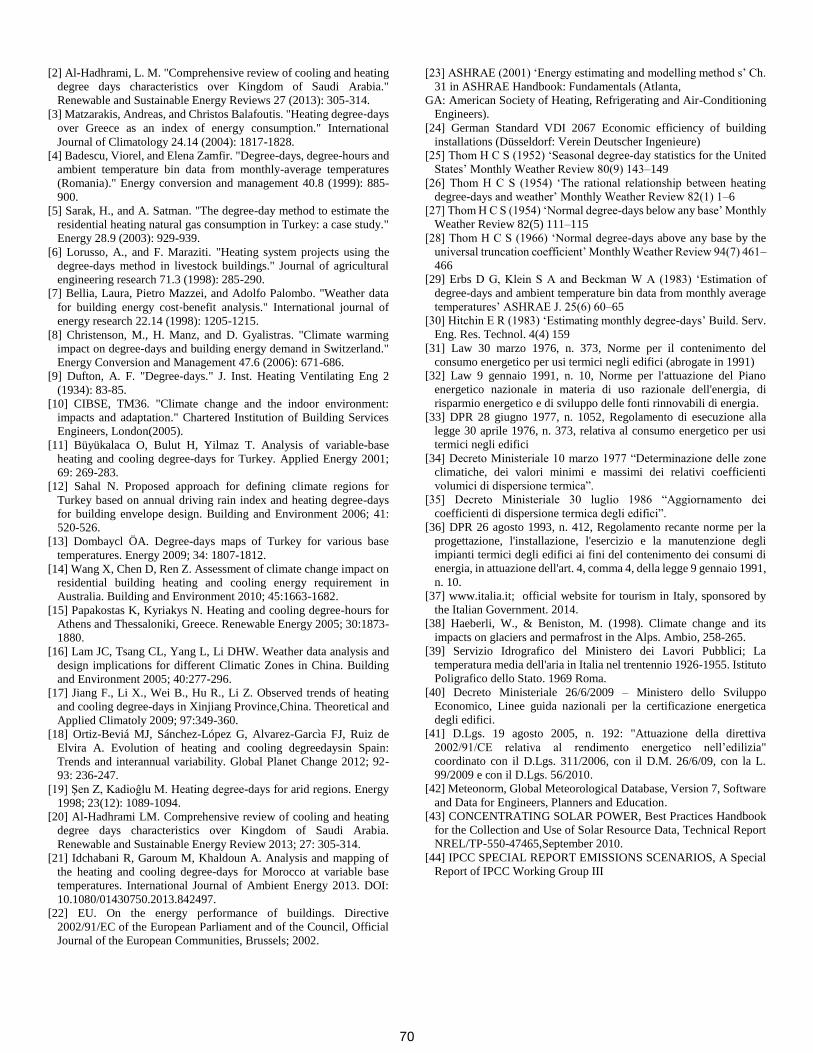
vales and the future hypothesized DD. In detail, Figures 4 and 5,
for each cities, compare the current DD value calculated by the
actual Italian low and the DD evaluated for future climate
conditions. The first comparison is related to residential
buildings; the second to other buildings.
Figure 4 Comparison of different values of DD for
residential building
Figure 5 Comparison of different values of DD for other
building
The following tables collect the results highlighting how the
value of EPi,limit changes respect to those one calculated with the
current law DD. Tables 5 and 6 refer to residential buildings for
different S/V ratio.
Table 5 EPi,limit for residential building and S/V=0.2
Table 6 EPi,limit for residential building and S/V=0.9
Generally, the greatest EPi,gl reduction is those one related to
Messina, both for the residential and non-residential cases, with
a reduction ranging from 20 to 40%.
Instead, the city of Milano is characterized by a lower change
of EPi,gl (from 7% to 8%) than other cities. These results highlight
how the variation of EPi,gl is higher in warmer Climatic Zones.
CONCLUSION The value of DD for each considered location greatly
influences the determination of the thermal energy demand for
heating. The latter is the basis for sizing of HVAC plants in
buildings. The higher the value of the DD, the higher will be the
energy needs to maintain comfort conditions. Currently in Italy,
the values of DD were derived from times series of outdoor
temperature dating back to the 80s. These time series, nowadays
are no longer reliable because the global climate change due to
emissions of GHG.
After a review of DD extrapolation methods worldwide used,
a deep analysis of the Italy procedure was carried out. The
authors have used the software Meteonorm to calculate DD as
function of more recent time series of temperatures, from 1961
to 1991 and from 2000 to 2009. Furthermore, DD was evaluated
assuming valid the IPCC B1 scenario at 2100. The calculation of
DD was extended to four main Italian cities and has allowed to
quantify the variation due to climate changes. The results clearly
show that new DD law values should be adopted. The adoption
of new, more current, and more adherent to reality, values of DD
should allow to lower the calculation of the thermal needs for
heating. A more reliable planning of HVAC can reduce the size
of the installations already in the design phase; at no additional
costs, this procedure would significantly introduce raw materials
and primary energy savings.
REFERENCES [1] Day, Tony. "Degree-days: theory and application." TM41 (2006).
DPR 412/93 IPCC B1
DD Reduction
DD Climatic Zone DD Climatic Zone [%]
Milano 2404 E 2179 E 9.37
Roma 1415 D 1148 C 18.86
Napoli 1034 C 917 C 11.29
Messina 707 B 505 A 28.50
0
20
40
60
80
100
MESSINA NAPOLI ROMA MILANO
EPi [
KW
h/m
2ye
ar]
Limit of Energy Demandfor Residential Building
DPR 412/93 S/V=0.2 IPCC S/V=0.2 DPR 412/93 S/V=0.9 IPCC SV=0.9
0
5
10
15
20
25
MESSINA NAPOLI ROMA MILANO
Epi [
kWh
/m3
year
]
Limit of Energy Demandfor other Building
DPR 412/93 S/V=0.2 IPCC S/V=0,2 DPR 412/93 S/V=0.9 IPCC S/V=0.9
S/V=0.2
Epi limit for residential building
DPR 412/93 IPCC Reduction
[kWh/m2 year] [kWh/m2 year] [%]
Messina 10.02 7.12 28.98
Napoli 15.07 13.07 13.23
Roma 21.55 16.70 22.51
Milano 38.31 35.11 8.36
S/V=0.9
Epi limit for Residential building
DPR 412/93 IPCC Reduction
[kWh/m2 year] [kWh/m2 year] [%]
Messina 40.25 32.15 20.14
Napoli 53.33 48.64 8.79
Roma 68.40 60.76 11.17
Milano 97.44 90.43 7.19
69
[2] Al-Hadhrami, L. M. "Comprehensive review of cooling and heating
degree days characteristics over Kingdom of Saudi Arabia."
Renewable and Sustainable Energy Reviews 27 (2013): 305-314.
[3] Matzarakis, Andreas, and Christos Balafoutis. "Heating degree‐days
over Greece as an index of energy consumption." International
Journal of Climatology 24.14 (2004): 1817-1828.
[4] Badescu, Viorel, and Elena Zamfir. "Degree-days, degree-hours and
ambient temperature bin data from monthly-average temperatures
(Romania)." Energy conversion and management 40.8 (1999): 885-
900.
[5] Sarak, H., and A. Satman. "The degree-day method to estimate the
residential heating natural gas consumption in Turkey: a case study."
Energy 28.9 (2003): 929-939.
[6] Lorusso, A., and F. Maraziti. "Heating system projects using the
degree-days method in livestock buildings." Journal of agricultural
engineering research 71.3 (1998): 285-290.
[7] Bellia, Laura, Pietro Mazzei, and Adolfo Palombo. "Weather data
for building energy cost‐benefit analysis." International journal of
energy research 22.14 (1998): 1205-1215.
[8] Christenson, M., H. Manz, and D. Gyalistras. "Climate warming
impact on degree-days and building energy demand in Switzerland."
Energy Conversion and Management 47.6 (2006): 671-686.
[9] Dufton, A. F. "Degree-days." J. Inst. Heating Ventilating Eng 2
(1934): 83-85.
[10] CIBSE, TM36. "Climate change and the indoor environment:
impacts and adaptation." Chartered Institution of Building Services
Engineers, London(2005).
[11] Büyükalaca O, Bulut H, Yilmaz T. Analysis of variable-base
heating and cooling degree-days for Turkey. Applied Energy 2001;
69: 269-283.
[12] Sahal N. Proposed approach for defining climate regions for
Turkey based on annual driving rain index and heating degree-days
for building envelope design. Building and Environment 2006; 41:
520-526.
[13] Dombaycl ÖA. Degree-days maps of Turkey for various base
temperatures. Energy 2009; 34: 1807-1812.
[14] Wang X, Chen D, Ren Z. Assessment of climate change impact on
residential building heating and cooling energy requirement in
Australia. Building and Environment 2010; 45:1663-1682.
[15] Papakostas K, Kyriakys N. Heating and cooling degree-hours for
Athens and Thessaloniki, Greece. Renewable Energy 2005; 30:1873-
1880.
[16] Lam JC, Tsang CL, Yang L, Li DHW. Weather data analysis and
design implications for different Climatic Zones in China. Building
and Environment 2005; 40:277-296.
[17] Jiang F., Li X., Wei B., Hu R., Li Z. Observed trends of heating
and cooling degree-days in Xinjiang Province,China. Theoretical and
Applied Climatoly 2009; 97:349-360.
[18] Ortiz-Beviá MJ, Sánchez-López G, Alvarez-Garcìa FJ, Ruiz de
Elvira A. Evolution of heating and cooling degreedaysin Spain:
Trends and interannual variability. Global Planet Change 2012; 92-
93: 236-247.
[19] Şen Z, Kadioĝlu M. Heating degree-days for arid regions. Energy
1998; 23(12): 1089-1094.
[20] Al-Hadhrami LM. Comprehensive review of cooling and heating
degree days characteristics over Kingdom of Saudi Arabia.
Renewable and Sustainable Energy Review 2013; 27: 305-314.
[21] Idchabani R, Garoum M, Khaldoun A. Analysis and mapping of
the heating and cooling degree-days for Morocco at variable base
temperatures. International Journal of Ambient Energy 2013. DOI:
10.1080/01430750.2013.842497.
[22] EU. On the energy performance of buildings. Directive
2002/91/EC of the European Parliament and of the Council, Official
Journal of the European Communities, Brussels; 2002.
[23] ASHRAE (2001) ‘Energy estimating and modelling method s’ Ch.
31 in ASHRAE Handbook: Fundamentals (Atlanta,
GA: American Society of Heating, Refrigerating and Air-Conditioning
Engineers).
[24] German Standard VDI 2067 Economic efficiency of building
installations (Düsseldorf: Verein Deutscher Ingenieure)
[25] Thom H C S (1952) ‘Seasonal degree-day statistics for the United
States’ Monthly Weather Review 80(9) 143–149
[26] Thom H C S (1954) ‘The rational relationship between heating
degree-days and weather’ Monthly Weather Review 82(1) 1–6
[27] Thom H C S (1954) ‘Normal degree-days below any base’ Monthly
Weather Review 82(5) 111–115
[28] Thom H C S (1966) ‘Normal degree-days above any base by the
universal truncation coefficient’ Monthly Weather Review 94(7) 461–
466
[29] Erbs D G, Klein S A and Beckman W A (1983) ‘Estimation of
degree-days and ambient temperature bin data from monthly average
temperatures’ ASHRAE J. 25(6) 60–65
[30] Hitchin E R (1983) ‘Estimating monthly degree-days’ Build. Serv.
Eng. Res. Technol. 4(4) 159
[31] Law 30 marzo 1976, n. 373, Norme per il contenimento del
consumo energetico per usi termici negli edifici (abrogate in 1991)
[32] Law 9 gennaio 1991, n. 10, Norme per l'attuazione del Piano
energetico nazionale in materia di uso razionale dell'energia, di
risparmio energetico e di sviluppo delle fonti rinnovabili di energia.
[33] DPR 28 giugno 1977, n. 1052, Regolamento di esecuzione alla
legge 30 aprile 1976, n. 373, relativa al consumo energetico per usi
termici negli edifici
[34] Decreto Ministeriale 10 marzo 1977 “Determinazione delle zone
climatiche, dei valori minimi e massimi dei relativi coefficienti
volumici di dispersione termica”.
[35] Decreto Ministeriale 30 luglio 1986 “Aggiornamento dei
coefficienti di dispersione termica degli edifici”.
[36] DPR 26 agosto 1993, n. 412, Regolamento recante norme per la
progettazione, l'installazione, l'esercizio e la manutenzione degli
impianti termici degli edifici ai fini del contenimento dei consumi di
energia, in attuazione dell'art. 4, comma 4, della legge 9 gennaio 1991,
n. 10.
[37] www.italia.it; official website for tourism in Italy, sponsored by
the Italian Government. 2014.
[38] Haeberli, W., & Beniston, M. (1998). Climate change and its
impacts on glaciers and permafrost in the Alps. Ambio, 258-265.
[39] Servizio Idrografico del Ministero dei Lavori Pubblici; La
temperatura media dell'aria in Italia nel trentennio 1926-1955. Istituto
Poligrafico dello Stato. 1969 Roma.
[40] Decreto Ministeriale 26/6/2009 – Ministero dello Sviluppo
Economico, Linee guida nazionali per la certificazione energetica
degli edifici.
[41] D.Lgs. 19 agosto 2005, n. 192: "Attuazione della direttiva
2002/91/CE relativa al rendimento energetico nell’edilizia"
coordinato con il D.Lgs. 311/2006, con il D.M. 26/6/09, con la L.
99/2009 e con il D.Lgs. 56/2010.
[42] Meteonorm, Global Meteorological Database, Version 7, Software
and Data for Engineers, Planners and Education.
[43] CONCENTRATING SOLAR POWER, Best Practices Handbook
for the Collection and Use of Solar Resource Data, Technical Report
NREL/TP-550-47465,September 2010.
[44] IPCC SPECIAL REPORT EMISSIONS SCENARIOS, A Special
Report of IPCC Working Group III
70


![Demand Planning II [Kompatibilitätsmodus] - WueCampus2 · • Know the difference between demand management, demand planning and ... • Mass Customization ... • Degree of globalization](https://img.pdfslide.us/doc/110x75/5b4dd2417f8b9a1f368b5af5/demand-planning-ii-kompatibilitaetsmodus-wuecampus2-know-the-difference.jpg)